You are currently viewing a new version of our website. To view the old version click .
Social Sciences
  • Article
  • Open Access

17 November 2025

Multilevel Intersectional Analysis to Identify Extreme Profiles in Italian Student Achievement Data

and
Department of Statistics, Computer Science, Applications “G. Parenti”, University of Florence, 50134 Florence, Italy
*
Author to whom correspondence should be addressed.
Soc. Sci.2025, 14(11), 672;https://doi.org/10.3390/socsci14110672 
(registering DOI)
This article belongs to the Special Issue Tackling Educational Inequality: Issues and Solutions

Abstract

Students have diverse identities and social characteristics. The different combinations of these factors create a stratification that affects the learning outcomes. This study aims to identify the student profiles associated with the highest and lowest academic performance. To this end, we analyse data from the 2022/23 INVALSI Mathematics test for fifth-grade students. The approach used is the Multilevel Analysis of Individual Heterogeneity and Discriminatory Accuracy (MAIHDA), which highlights the intersectional nature of social inequalities in shaping academic achievement. The strata are defined by the intersections of sex, origin, family environment, parental education, and parental occupation. Moreover, recognising the critical role of the school context, we fit a cross-classified multilevel model with random effects for both intersectional strata and schools. Indeed, model fitting reveals that the school-level variance is substantial, being about three-fourths of the variance due to the intersectional strata. The results show that the lowest-performing students are characterised by an unfavourable family environment, parents with compulsory or unknown education, and parents who are unemployed or in blue-collar jobs.

1. Introduction

Educational inequalities play a central role in the social sciences, particularly within the Italian context, where significant gaps persist between groups of students with different sociodemographic characteristics (). School disparities are commonly analysed through the results obtained by students in standardised tests, as academic learning represents a fundamental phase in the development of knowledge and soft skills associated with educational success (). However, some students fall behind within the school system due to structural factors, biases, or discrimination. Each individual carries a personal history influenced by the environment in which they grow up, the material resources available to them, and their family background, all elements that impact access to learning opportunities (; ). The characteristics of the school system itself also play an important role, as the heterogeneity of students and the policies implemented can either widen or narrow educational opportunities, favouring certain groups while disadvantaging others ().
In an effort to understand the dynamics underlying inequalities in educational outcomes, scientific research has long focused on the effects of sociodemographic variables, often analysing them separately and treating their effects as additive (). However, individual and social characteristics do not operate independently; instead, they interact, producing interdependence patterns that shape educational trajectories ().
The primary objective of this study is to assess the capacity of interconnected social positions to generate educational inequalities. We focus on academic success in terms of student learning as measured by test scores. The study has several specific aims: (i) quantifying the share of variance in the test scores attributable to the student sociodemographic characteristics; (ii) disentangling the additive and interactive effects of the student sociodemographic characteristics; (iii) quantifying the share of variance in the test scores attributable to the school context; and (iv) identifying the combinations of student sociodemographic characteristics associated with best and worst performances in the test scores. The ultimate goal is to offer insights for educational policies targeted at reducing inequalities.
The study’s aims are achieved by fitting a multilevel random-effects model to data from the 2022–2023 INVALSI Mathematics test administered to fifth-grade students. The analysis adopts the Intersectional Multilevel Analysis of Individual Heterogeneity and Discriminatory Accuracy (MAIHDA) approach, an innovative method that accounts for the intersectional nature of individuals ().

1.1. Determinants of Educational Inequalities

Educational differences refer to disparities in educational pathways, opportunities, and outcomes among students. A vast body of literature has addressed this issue, demonstrating significant sociodemographic differences in academic achievement concerning educational systems (). Academic success equips individuals with the skills necessary for life achievements, ultimately affecting their overall well-being (). However, it must be emphasised that student performance is influenced by a complex interplay of identity and social characteristics, leading to significant individual heterogeneity ().
But what are the factors that determine educational inequalities? Numerous studies have demonstrated that students’ gender has a significant impact on their school performance (; ). Recent research indicates that gender inequalities in education have undergone substantial changes over time. Historically, boys tended to outperform girls in overall educational outcomes, but over the past decades, girls have caught up and often surpassed boys in many areas, particularly in reading. These differences also vary significantly across countries, reflecting the influence of social and educational contexts ().
Beyond gender, another decisive factor is students’ migration background, which often interacts with socioeconomic status (; ; ). Over the years, research has increasingly focused on the disparities in living conditions between immigrants and natives. One of the primary factors contributing to the lower academic performance of first-generation immigrant students compared to native students is the initial difficulty in mastering the language of the host country (). While in Europe, there is a progressive reduction in disadvantage among second-generation immigrants, who are born and educated in the host country and thus better integrated into local social networks (), in the United States, the debate about racial discrimination in the school system is still vivid, despite the progress made by the end of the last century. These gaps are also explained by the different familial, educational, and social backgrounds characterising ethnic groups (). This phenomenon is referred to as the intergenerational continuity of educational disadvantage: students’ educational disparities reflect differences in their parents’ educational levels and occupational status (). Literature indicates that parents strive to maintain their social status through educational strategies, such as enrolling their children in schools with homogeneous student backgrounds () or investing in extracurricular activities (). In this way, they heavily influence choices such as university enrolment, guiding their children based on their own educational experiences. Parents with higher education levels are better equipped to support their children’s learning, helping with homework or providing access to books and educational materials (). Conversely, parents with lower education levels are less likely to encourage advanced studies.
Moreover, parents’ employment status, particularly unemployment () or type of occupation (), significantly affects children’s academic success. It has been observed that the mother’s occupational status has a strong and independent effect on children’s school performance, comparable to that of the father’s occupation (). In the past, when women’s labour market participation was more limited, greater relevance was attributed to the father’s occupation. A stable socioeconomic situation, characterised by secure and high-level employment, provides greater resources for studying, such as access to tutoring, advanced educational materials, and childcare services (). Having access to resources like books, dictionaries, electronic devices (PCs, tablets), a quiet place to study, and an internet connection greatly facilitates learning and achieving good academic results. However, these resources are often lacking among students from low-income families ().
In addition to individual characteristics, the school context plays a crucial role in shaping learning opportunities. Literature has emphasised how school environments influence educational outcomes through their structural characteristics and academic policies, such as curriculum differentiation (; ). Several studies suggest that curricular tracking leads to differentiated outcomes. This phenomenon is linked to dividing students into courses with different content, a practice that tends to mirror background inequalities (). Schools’ role in students’ learning is also indirect, operating through factors such as funding, teacher quality, school autonomy, privatisation, and class size (). Furthermore, residential segregation, or neighbourhood context, significantly affects educational opportunities (). In urban areas, for instance, neighbourhood segregation can create “ghettoised” schools, characterised by concentrations of disadvantaged students or minorities, thereby exacerbating disparities ().
All these factors significantly influence students’ academic success and inevitably amplify educational inequalities. Can we then affirm that all students start with the same opportunities? The answer is negative. An individual’s educational opportunities are profoundly tied to the circumstances into which they are born and raised, including gender, ethnicity, family background, parental education and employment, and the school context in which they are educated.

1.2. Intersectionality

The previous literature on educational inequalities tends to focus on individual sociodemographic characteristics, often neglecting the fact that systems of advantage and disadvantage are deeply interconnected and intertwined. Overlooking the intersectional nature of educational inequalities risks obscuring critical differences in how multiple social categories are experienced simultaneously (). Intersectionality is thus essential in highlighting student profiles with multiple social disadvantages, which can influence their educational opportunities ().
Intersectionality originally emerged from Black feminist critical research as a framework to identify and critique social structures that produce inequalities, such as racism, sexism, and classism, and to give voice to marginalised groups (). These systems of oppression are often interconnected and inseparable; hence, the intersectional approach addresses them collectively within a single analytical framework. This concept is crucial because it views individuals as shaped by the intersection of multiple variables, allowing the identification of compounded advantages or disadvantages through multiplicative effects. For example, examining opportunities (work, educational, social) through the joint lens of two marginalised positions, such as being both Black and a woman, reveals a level of disadvantage not simply resulting from the sum of the two oppressions, but from their interaction with multiplicative effects (). Indeed, an essential aspect of intersectionality is the analysis of interactions, the intertwining of social processes, and the comparison of their effects with additive effects ().
In the Italian context, qualitative intersectional research has demonstrated how the interplay of gender, migration background, class, and religion influences experiences of inclusion and marginalisation (). Similar intersectional dynamics have also been observed within educational settings, where the overlap of migration background and disability can generate unique challenges for school inclusion (). Although these studies do not directly focus on academic achievement, they provide valuable insights into how intersecting systems of power operate within Italian schools and society, offering important conceptual grounding for understanding educational inequalities. Building on these qualitative insights, it becomes clear that educational inequalities cannot be fully understood by merely summing the effects of individual sociodemographic variables, as these variables interact and mutually influence one another (). Intersectional knowledge can identify students who are most at risk of being left behind by the educational system, thereby promoting policies that reduce disparities. However, for educational policies to be effective, it is not enough to focus solely on the specific group averages; instead, the individual heterogeneity within each group must be explored. Only then is it possible to develop strategies tailored to the specific needs of each group ().

1.3. MAIHDA

In recent years, the Multilevel Analysis of Individual Heterogeneity and Discriminatory Accuracy (MAIHDA) has been introduced as an advanced tool that integrates multilevel analysis with intersectionality theory. This approach enables the study of sociodemographic inequalities in individual outcomes by focusing on how individual characteristics interact to create advantages or disadvantages across different social groups.
MAIHDA was first proposed in social epidemiology to study health inequalities () and has since been applied to various health outcomes. For example, (); (); () used MAIHDA to examine population-level health disparities. Beyond health, MAIHDA has proven useful in broader social contexts. () applied the framework to study engagement in early childhood interventions in the United Kingdom, illustrating its value for analysing participation inequalities in social policy. Similarly, () explored intersectional inequalities in family and social participation among older adults in China, highlighting their relevance for understanding disparities in ageing populations. In the educational domain, (); () demonstrated how MAIHDA can uncover intersectional disparities in students’ academic achievement. More recently, () applied the framework to physics education research, disaggregating ethnic disparities among Asian American student groups. Collectively, these studies illustrate MAIHDA’s versatility in capturing the multidimensional nature of social stratification across health, social policy, and educational contexts.
The basic structure of MAIHDA involves individuals (level 1) nested within intersectional strata (level 2), formed by the combinations of sociodemographic characteristics relevant to the analysis. Formally, the model is expressed as:
y i j =   α   +   u j s t r a t u m +   e i j ,
where y i j represents the outcome of individual i in stratum j, α is the overall mean, u j s t r a t u m N 0 ,   σ s t r a t u m 2 is the random effect for stratum j and e i j N 0 ,   σ r e s i d u a l 2 is the residual error. The random effect u j s t r a t u m captures the joint contribution of the features of stratum j in terms of deviation from the overall mean. Being a random variable, it is not directly observed, but its value can be predicted by the empirical Bayes method.
The MAIHDA approach considers intersectional strata as distinct contexts within a multilevel framework, based on the assumption that individuals sharing the same intersectional position may experience similar conditions, such as forms of discrimination or privilege, that influence their life opportunities (). In this study, as will be discussed in more detail later, a stratum may represent, for instance, a male student who is a first-generation immigrant from a disadvantaged family, with unemployed parents holding a high school diploma.
The aim of MAIHDA, therefore, is to assess the importance of strata in predicting and classifying average outcomes, and to determine the extent to which this variation is attributable to additive main effects or to complex interactions among stratum characteristics (). This approach enables the identification of disadvantaged subgroups that might otherwise be overlooked and allows for the quantification of inequalities by comparing means across strata (). Moreover, it facilitates the decomposition of variance between and within strata to investigate the overall contribution of intersectionality and individual heterogeneity, assessing whether belonging to a particular stratum can significantly predict individual outcomes.
One of the main advantages of MAIHDA compared to traditional regression models is its ability to capture complex interactions between social categories without the need to explicitly specify interaction terms, as these are already modelled through the variance components between and within strata (). This reduces the number of parameters to be estimated, making the model more efficient and easier to interpret. In addition, the empirical Bayes method adopted in MAIHDA to estimate the intersectional effects operates a shrinkage inversely related to the stratum sample size, thereby reducing the risk of overemphasising extreme predictions due to random variation.
Nowadays, the MAIHDA intersectional approach is recognised as the “gold standard” for analysing social inequalities in epidemiology (). However, its application in education remains in its early stages despite its strong potential to provide a detailed and efficient framework for examining social disparities and their impact on student performance (). This study applies MAIHDA to the 2022/23 INVALSI mathematics test data for Italian fifth-grade students (typically aged 10–11 years, although a small proportion may be younger or older due to early or delayed school entry), with two main objectives: (i) to evaluate the validity of the model for analysing educational inequalities, and (ii) to identify the combinations of sociodemographic characteristics associated with the most extreme scores. The analysis is expected to provide valuable insights for informing educational policies that reduce learning gaps among students based on their social background.

2. Materials and Methods

2.1. Dataset

The analysis is based on data from the mathematics test administered to Italian fifth-grade students by INVALSI (Istituto Nazionale per la Valutazione del Sistema Educativo di Istruzione e Formazione) during the 2022/23 school year. At the end of each survey cycle, the Institute publishes a report addressed to schools, policymakers, families, and the media, with the aim of monitoring the learning outcomes of Italian students annually. INVALSI also participates, as the Italian representative, in European and international research projects, collaborating with organisations such as the IEA (International Organisation for the Evaluation of Educational Achievement) and the OECD (Organisation for Economic Cooperation and Development).
The data used in this study are anonymous, publicly available, and were downloaded from the official INVALSI website (see the Data Availability Statement).
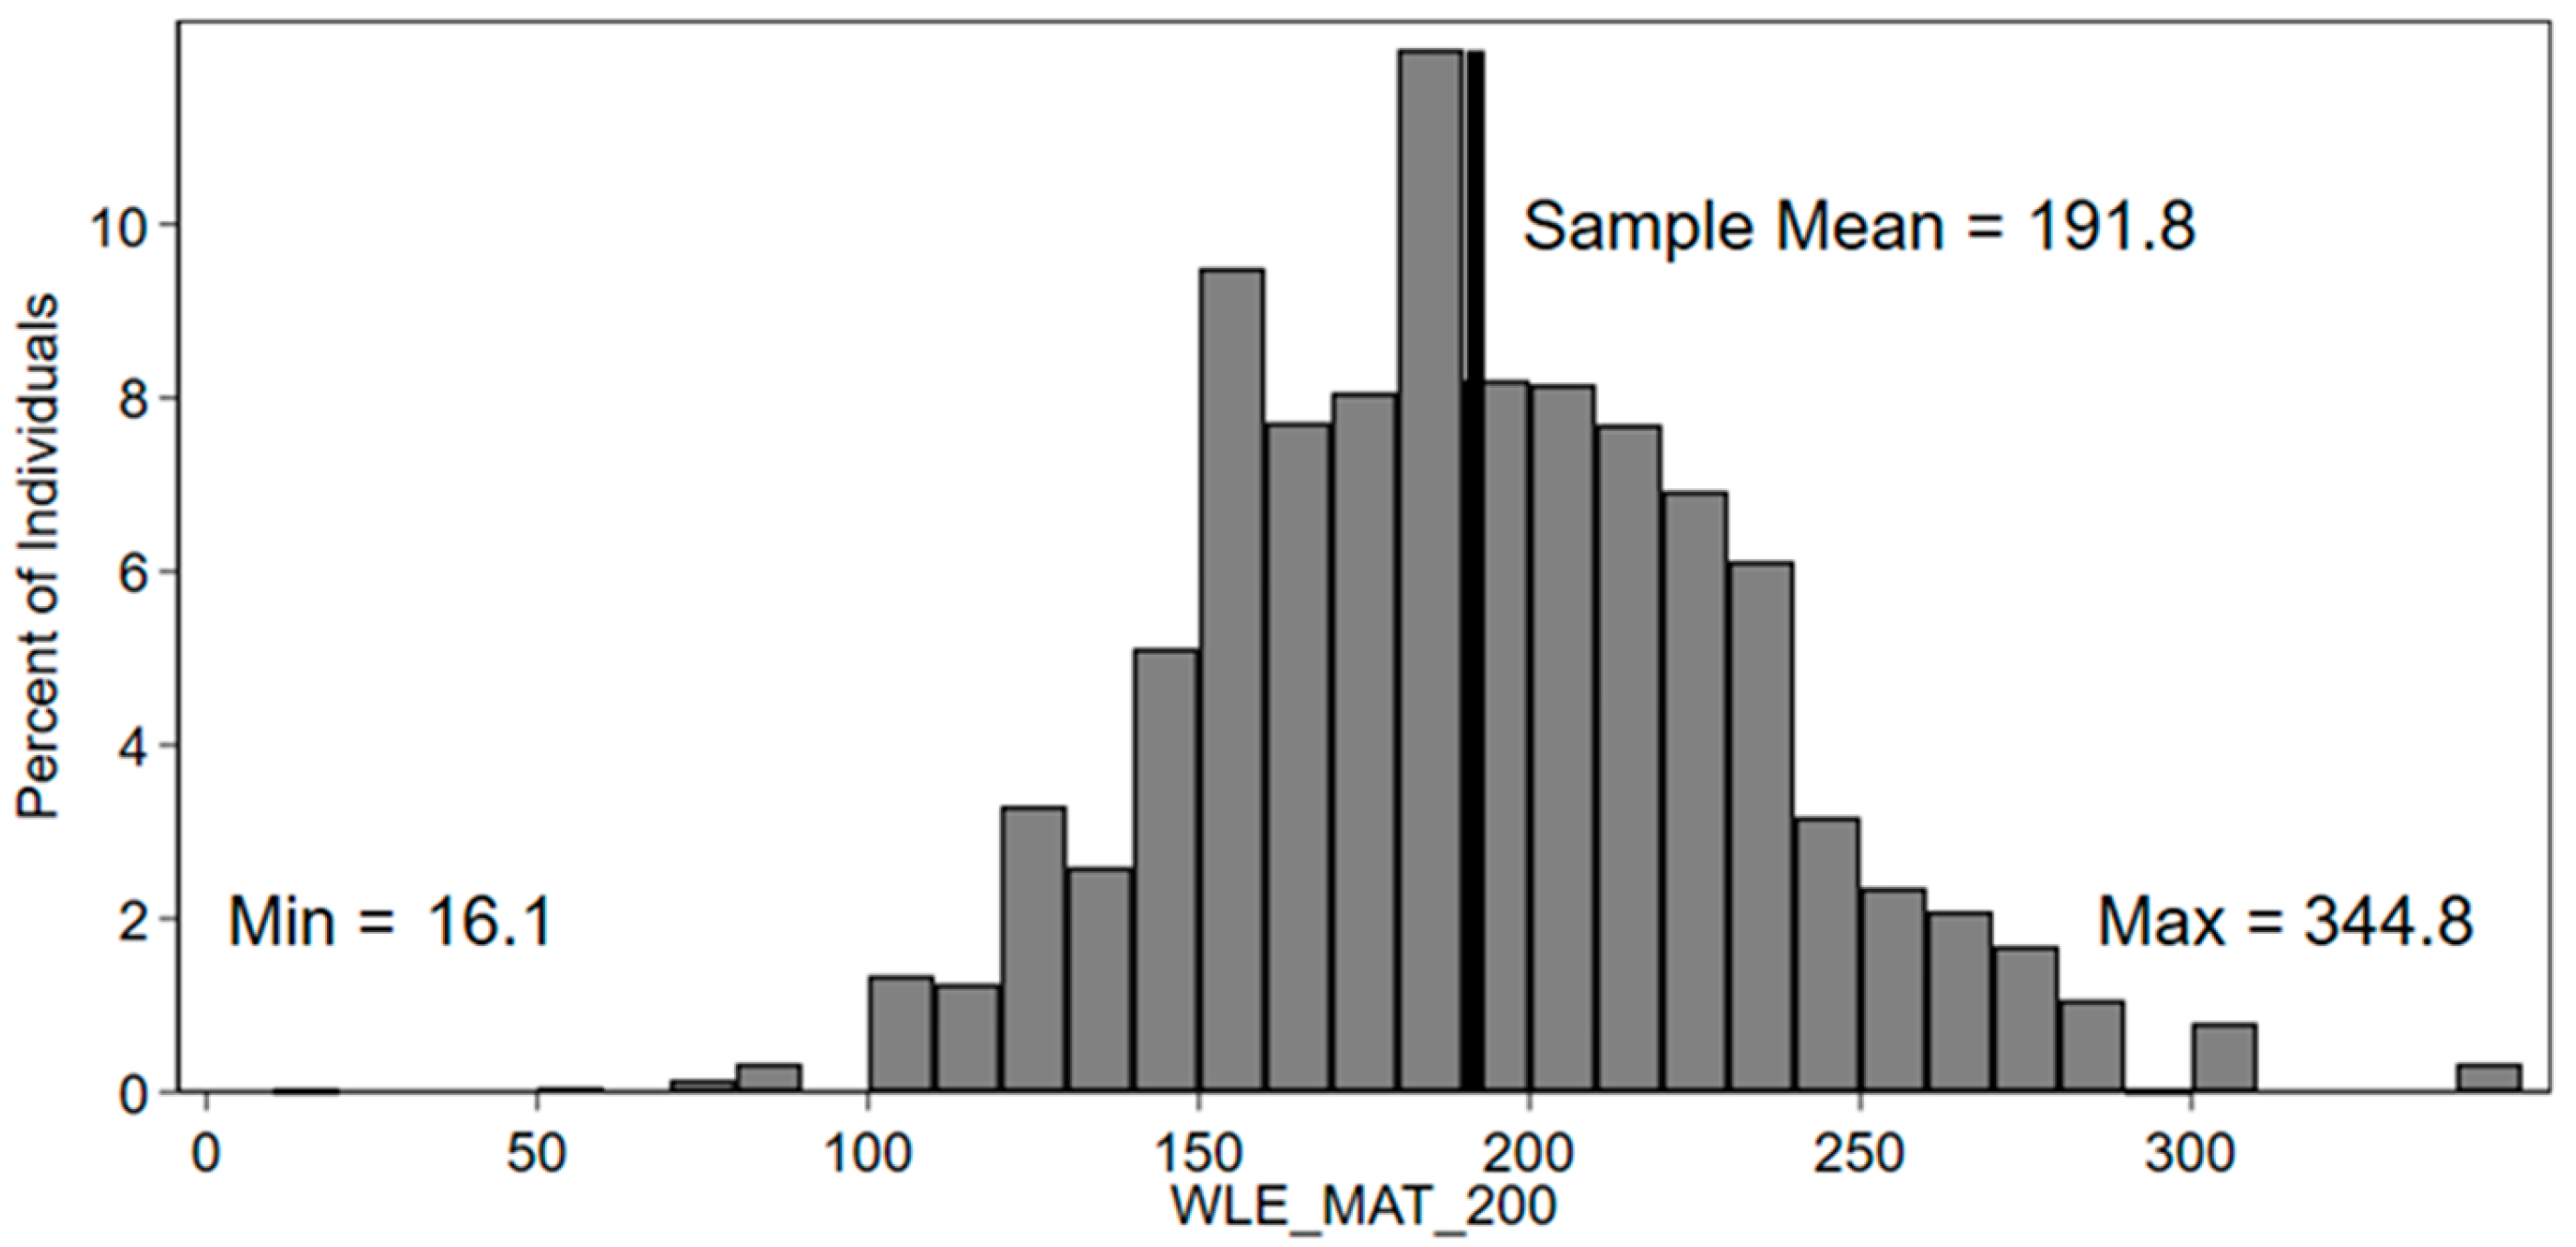
The initial dataset includes 501 schools, 973 classes, and 16,828 students, each described through socio-demographic and economic background variables. The outcome variable is the continuous WLE (Weighted Likelihood Estimate) score in mathematics, a measure of ability based on the Rasch model at the national level. The score has a mean of 191.82 and a standard deviation of 41.07. Figure 1 displays its sample distribution.
Figure 1. Sample distribution of the mathematics WLE score, the outcome variable for the MAIHDA models.
The seven variables used to define the intersectional strata represent socio-demographic characteristics considered fundamental for analysing individual heterogeneity and educational inequalities (see Section 1.1). Specifically, the considered variables are sex, origin (native, first-generation immigrant, second-generation immigrant), a summary of the family environment, father’s education, mother’s education, father’s occupation, and mother’s occupation.

2.2. Handling of Missing Values

Except for sex, all the considered variables are affected by missing values, posing a serious methodological challenge. We adopted different solutions for the variables, as outlined below.
The indicators of the family environment have missing values ranging from 1.69% to 5.31%. As we summarise those indicators by an IRT model, a score is produced also for students with partially missing items.
Parental education and occupation are collected by the schools with a questionnaire with separate sections for father and mother. The rate of missing values is approximately one-fourth (mother’s education 23.9%, father’s education 25.2%, mother’s occupation 23.4%, father’s occupation 25.5%), with a large overlap between cases with missing values. The missingness is likely to be informative thus, instead of excluding these observations, we added an extra category to each variable. Since family background information is collected directly by school offices, nonresponse may be due to specific reasons, such as parents’ perception of the questions as sensitive or a desire to avoid social judgement (). The addition of an extra category accounts for the peculiar family background of students with missing information on parental education and occupation, with no need for assumptions about the missing data mechanism. The drawback of this approach is the relevant increase in the number of potential intersectional strata (about 12,000).
Finally, the origin of the student has a low rate of missing values (4.86%): even if we could add an extra category for missing origin, in order to limit the number of strata and the inherent difficulties in interpretation, we drop students with unknown origin.

2.3. Descriptive Statistics

Following the treatment of missing values, the final dataset used for analysis comprises 16,011 students from 501 schools.
Descriptive statistics for the variables defining the intersectional strata are presented in Table 1 and Table 2. The sample is nearly equally split between male and female students. Students’ origin is classified into three categories: natives (87.85%), first-generation immigrants (3.00%), and second-generation immigrants (9.15%). Parental education and occupation are recorded separately for mothers and fathers. For educational level, five categories are defined: (1) compulsory education, (2) high school diploma, (3) bachelor’s degree, (4) master’s degree, postgraduate degree, or PhD, and (5) unknown. Parental occupation is classified into six categories: (1) unemployed or retired, (2) manager or office worker, (3) entrepreneur or self-employed, (4) blue-collar worker, (5) professional, (6) unknown. Note that categories with low frequency, such as “retired”, have been merged with other categories in order to limit the number of strata.
Table 1. Summary statistics of the variables defining the intersectional strata: Sex, Origin, Family Environment (FAMENV).
Table 2. Summary statistics of the variables defining the intersectional strata: parental education and occupation, separately for father and mother.
The variables related to the family environment have been summarised into the categorical variable FAMENV, obtained by dividing into quartiles the score estimated through an IRT (Item Response Theory), specifically a Graded Response Model (GRM) implemented in Stata 18 using the irt grm command (). The model considers students’ responses to a series of items included in the Student Questionnaire, which is completed at the end of the INVALSI test. Specifically, it uses information regarding the number of siblings, the number of books at home, and a set of binary variables related to the availability of educational resources at home (such as a quiet place to study, a dictionary, or a personal tablet). The possession of such resources is considered crucial for capturing the family’s asset stability and the student’s economic and cultural well-being.
The combination of these characteristics yields 21,600 intersectional strata, given by the product of the categories of sex (2) × origin (3) × father’s education level (5) × mother’s education level (5) × father’s occupation (6) × mother’s occupation (6) × FAMENV (4). Of these 21,600 potential strata, 3369 are populated (15.6%), while the remaining combinations are empty. Tables S1 and S2 in the Supplementary Materials show which characteristics are over- or underrepresented in the populated strata. In the populated strata, the number of students per stratum ranges from 1 to 260, with a median of 2 and an interquartile range of 1–4. The mean number of students per stratum is 4.75, reflecting the influence of a few large strata. About 49% of the strata contain only 1 student, 33% between 2 and 5 students, 8% between 6 and 10, and 10% more than 10 students, including a few extreme strata with up to 260 students.

2.4. Statistical Models

To identify the profiles of students with the worst and best outcomes, we estimate two cross-classified multilevel linear regression models with random effects for both the intersectional strata and the schools: in fact, students (level 1) are simultaneously nested into intersectional strata and schools (both at level 2).
The first model (Model 1) is a random intercept linear regression with no covariates. The main objective of the unadjusted model is to identify the strata with the most extreme scores. To this end, the strata are ranked based on their respective random effects, which represent the deviation of the stratum from the overall mean in the test score after controlling for variability between schools. A positive random effect indicates that students belonging to that stratum, on average, achieve scores above the overall mean. The random effects are predicted using the Empirical Bayes method, which involves a shrinkage inversely related to the sample size of the stratum; in this way, strata with a small number of students are less likely to be identified as extreme. Denoting by y i j k the outcome of interest for student i, belonging to stratum j and school k, Model 1 is formulated as follows:
y i j k =   α +   u j s t r a t u m +   v k s c h o o l + e i j k ,
where α represents the overall mean score, u j s t r a t u m and v k s c h o o l are the random effects for stratum j and school k, respectively, and e i j k is an individual-level error. All random components are assumed to be independent and identically distributed with a normal distribution with zero mean and variances σ s t r a t u m 2 , σ s c h o o l 2 and σ r e s i d u a l 2 , respectively.
Another key aspect of the analysis is the calculation of the variance partitioning coefficient (VPC), separately for strata and schools, in order to quantify the proportion of the total variance in average scores attributable to each level of the model. The VPC indicators are defined as follows:
V P C s t r a t u m = σ s t r a t u m 2 σ s t r a t u m 2 +   σ s c h o o l 2 +   σ r e s i d u a l 2 ,
V P C s c h o o l = σ s c h o o l 2 σ s t r a t u m 2 +   σ s c h o o l 2 +   σ r e s i d u a l 2 .
Specifically, V P C s t r a t u m provides a measure of the discriminatory accuracy of the model, namely, the ability of the intersectional strata to classify students based on their academic achievement. A V P C s t r a t u m value close to zero would suggest that intersectional strata play a marginal role in explaining educational inequalities.
In the second model (Model 2), we add the seven socio-demographic variables used to define the intersectional strata as covariates:
y i j k = α + x i j k β   +   u j s t r a t u m +   v k s c h o o l +   e i j k ,
where x i j k is a row vector of dummy variables. In fact, each categorical covariate has been coded using a set of dummy variables, one for each category except the baseline. β is a vector of regression coefficients, u j s t r a t u m and v k s c h o o l are the random effects for stratum j and school k, respectively, and e i j k is an individual-level error. The purpose of Model 2 is to disentangle the intersectional effects of Model 1 into main effects, summarised by the regression coefficients β, and interactive effects, captured by the strata random effects. The interactive effects arise when the relationship between the outcome and the covariates is not purely additive but depends on their joint values. For example, sex differences depend on the values of origin, family environment, and parents’ educational level and occupation. The role of interactive effects, which are at the core of the intersectional analysis, is summarised by the proportional change in variance (PCV) comparing the variance of the intersectional strata between Model 1 and Model 2:
P C V s t r a t u m = σ s t r a t u m 2 M 1   σ s t r a t u m 2 M 2 σ s t r a t u m 2 M 1   .
Therefore, Model 2 allows not only for the estimation of the main effects of the variables that define the intersectional strata but also for the comparison of the strata variance before and after adjusting for the main effects. This enables the determination of whether the overall intersectional variation is predominantly driven by interactive effects or additive effects. However, even in the latter case (high P C V s t r a t u m ), the intersectional perspective remains fully valid, merely suggesting that patterns of inequalities are consistent across social categories without significant variations due to their interactions.
In Model 2, the coefficient V P C s t r a t u m , calculated as previously described, quantifies the percentage of the total variance attributable solely to the interaction effects among the categories defining the strata, and therefore represents a global measure of intersectionality. A low or near-zero V P C s t r a t u m , indicates that the variability between strata is almost entirely explained by the main effects.
The analysis is conducted with the mixed command of Stata 18 (), using maximum likelihood estimation (MLE).

3. Results

3.1. Variance Partitioning from Model 1 and Model 2

Table 3 shows the variance estimates from the two models. In Model 1, the variance of the math score is disentangled into components between strata (12%), between schools (9%), and residual (79%). Although most of the variance is unexplained, it is notable that the socio-economic variables defining the strata account for a larger portion of the variance than the schools. Including covariates in Model 2 reduces the variance between strata by 96.94% (PCV), which is the share attributable to the main effects of the covariates, as opposed to the remaining 3.06% due to interactions. This result is supported by the Variance Partitioning Coefficient (VPC) for strata, which is very low (0.41%), aligning with previous studies. This finding does not invalidate the intersectional framework, but rather suggests that the socio-demographic characteristics defining the strata predominantly shape student performance through additive rather than interaction effects.
Table 3. Variance estimates from Model 1 and Model 2.

3.2. Regression Coefficient Estimates from Model 2

Table 4 shows selected estimates from the adjusted model (Model 2) for the 2022–2023 INVALSI Mathematics test score. The intercept corresponds to the expected score for a reference student: a native girl from a highly disadvantaged family background (FAMENV = 1), whose parents completed only compulsory education and were unemployed or retired at the time of the survey. The regression coefficients of a variable defining the strata are additive effects to be interpreted as differences in the expected math score with respect to the reference category, holding the other variables constant. The estimates from Model 2 indicate that, controlling for other covariates, male students score 8.5 points higher than females on average. First-generation immigrant students score 14.53 points lower than native students, while second-generation students, as highlighted in previous studies, are less disadvantaged, with an average score 5 points lower than native students. Furthermore, the family environment is positively associated with math scores. All estimated coefficients in Table 4 are statistically significant at the 5% level, as their 95% confidence intervals do not include zero.
Table 4. Estimated regression coefficients with 95% confidence intervals from Model 2: Sex, Origin, Family Environment (FAMENV).
Table 5 reports the coefficient estimates for parental education and employment, separately for father and mother. A higher level of parental education is positively associated with test performance, controlling for other variables. Moreover, Model 2 reveals that the coefficients for fathers are consistently higher across all occupational categories than those for mothers. This suggests that, after accounting for the other covariates, paternal employment has a greater impact on student test scores than maternal employment. It is worth noting the estimates for the unknown categories, which represent about a quarter of the observations: for parental occupation, there is no statistically significant difference in the math score when comparing unknown occupation with unemployed or retired, whereas students whose parents have unknown education perform higher than those with parents having compulsory education (statistically significant at 5%). The latter finding underscores the importance of handling missing values with an additional category.
Table 5. Estimated regression coefficients with 95% confidence intervals from Model 2: Parental education and occupation, separately for father and mother.

3.3. Most and Least Advantaged Student Profiles from Model 1

Table 6 reports the five best- and worst-performing strata based on their predicted random effects from Model 1, estimated using the Empirical Bayes method (penultimate column).
Table 6. Top 5 and bottom 5 strata by predicted random effects using Model 1.
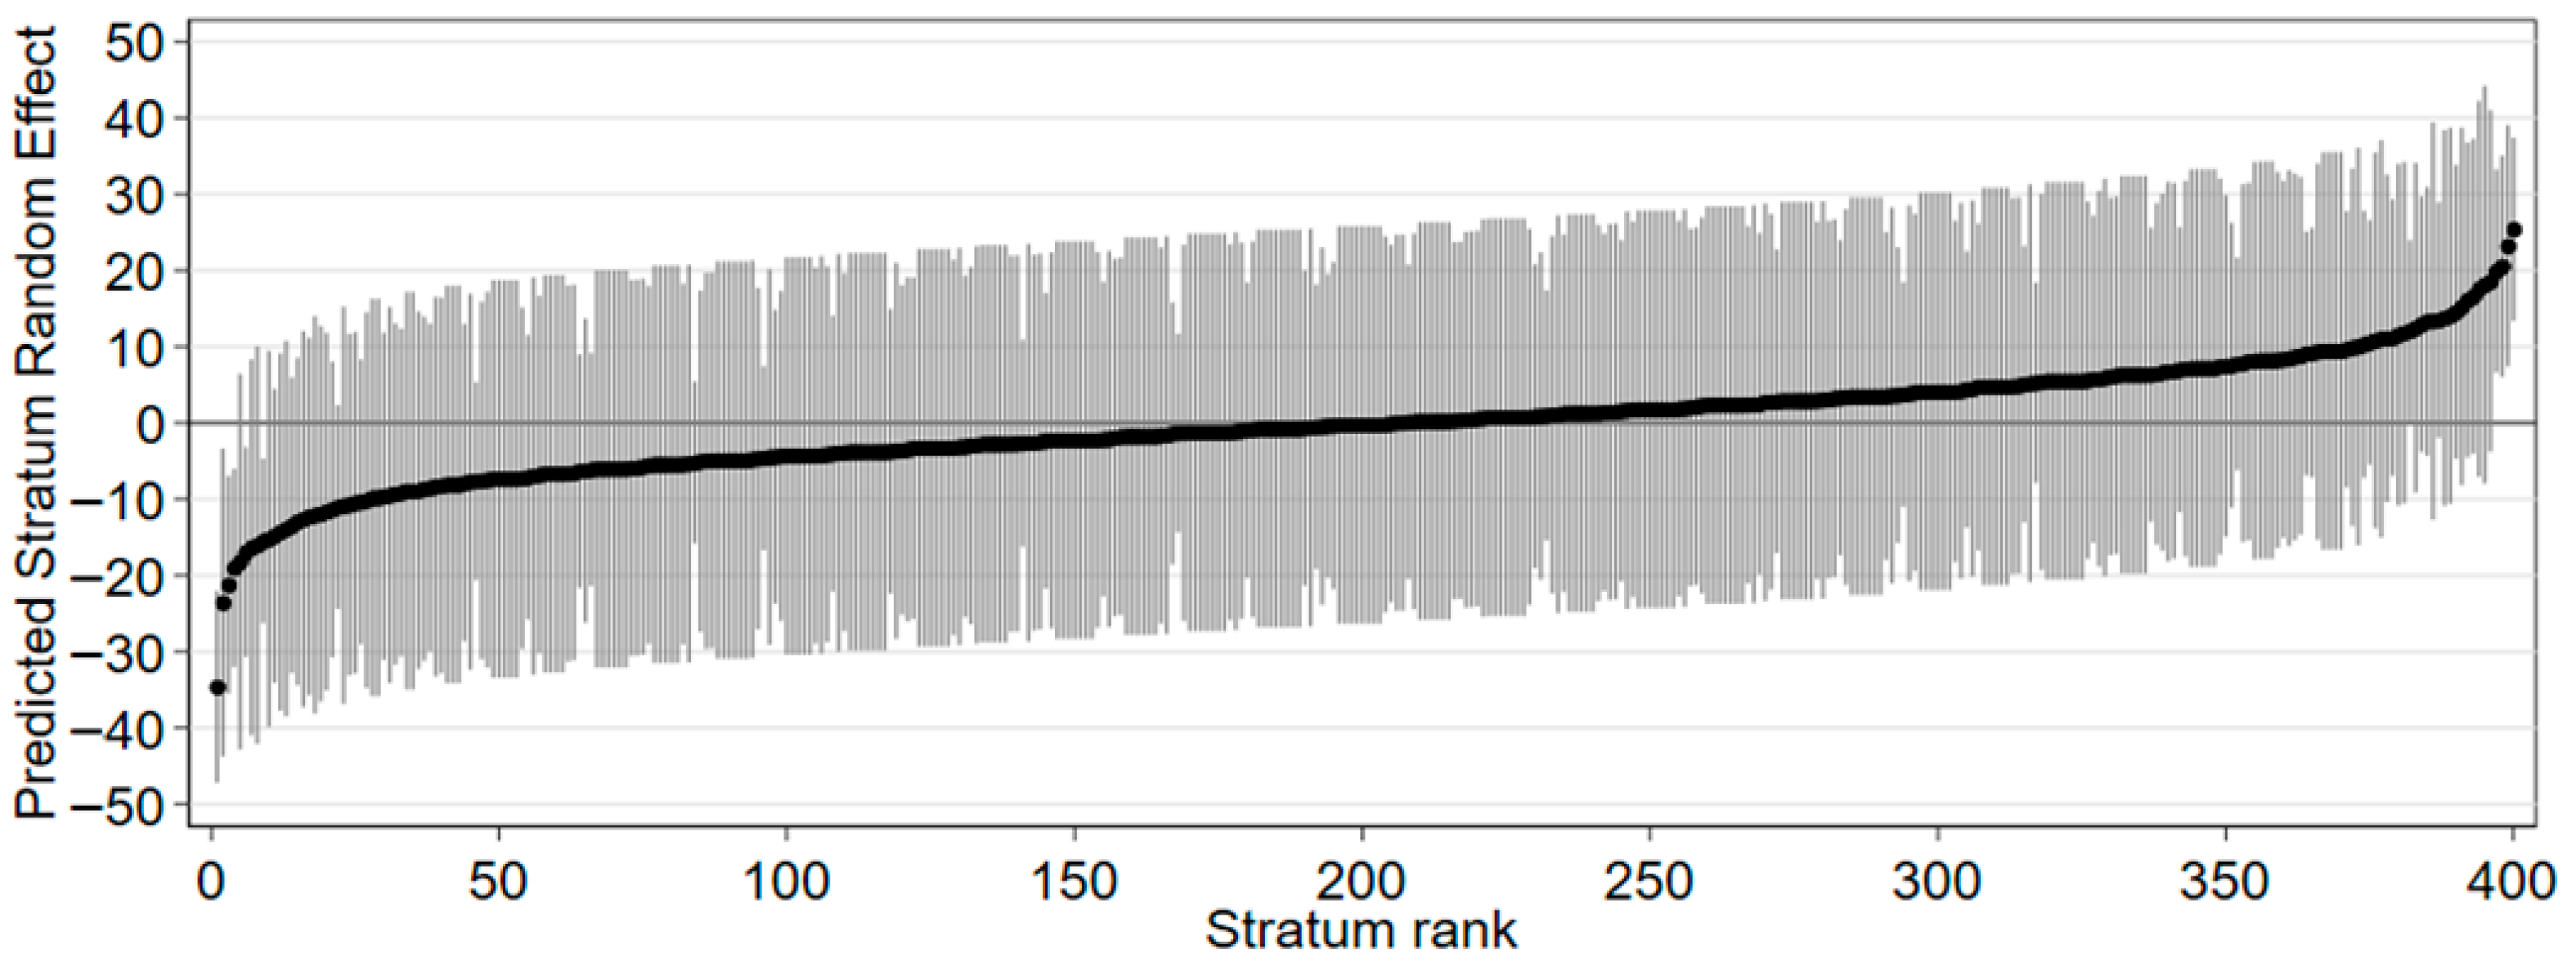
To help visualise the differences between strata and the overall variation in the predicted math score, Figure 2 shows a caterpillar plot of the predicted stratum random effects. Displaying all 3369 strata would make the plot unreadable, so a subset of 400 strata was selected to cover the entire range.
Figure 2. Caterpillar plot of predicted stratum random effects from Model 1 (subset of 400 strata).
The objective is to highlight the socio-demographic characteristics of the intersectional strata associated with the most extreme scores on the INVALSI mathematics test, in order to better understand the mechanisms that generate educational inequalities. The last column shows the average math score in the stratum. Note that the ordering of strata based on the predicted random effect differs from that based on the average math score, as the Empirical Bayes method applies shrinkage toward zero, which is inversely related to the stratum sample size.
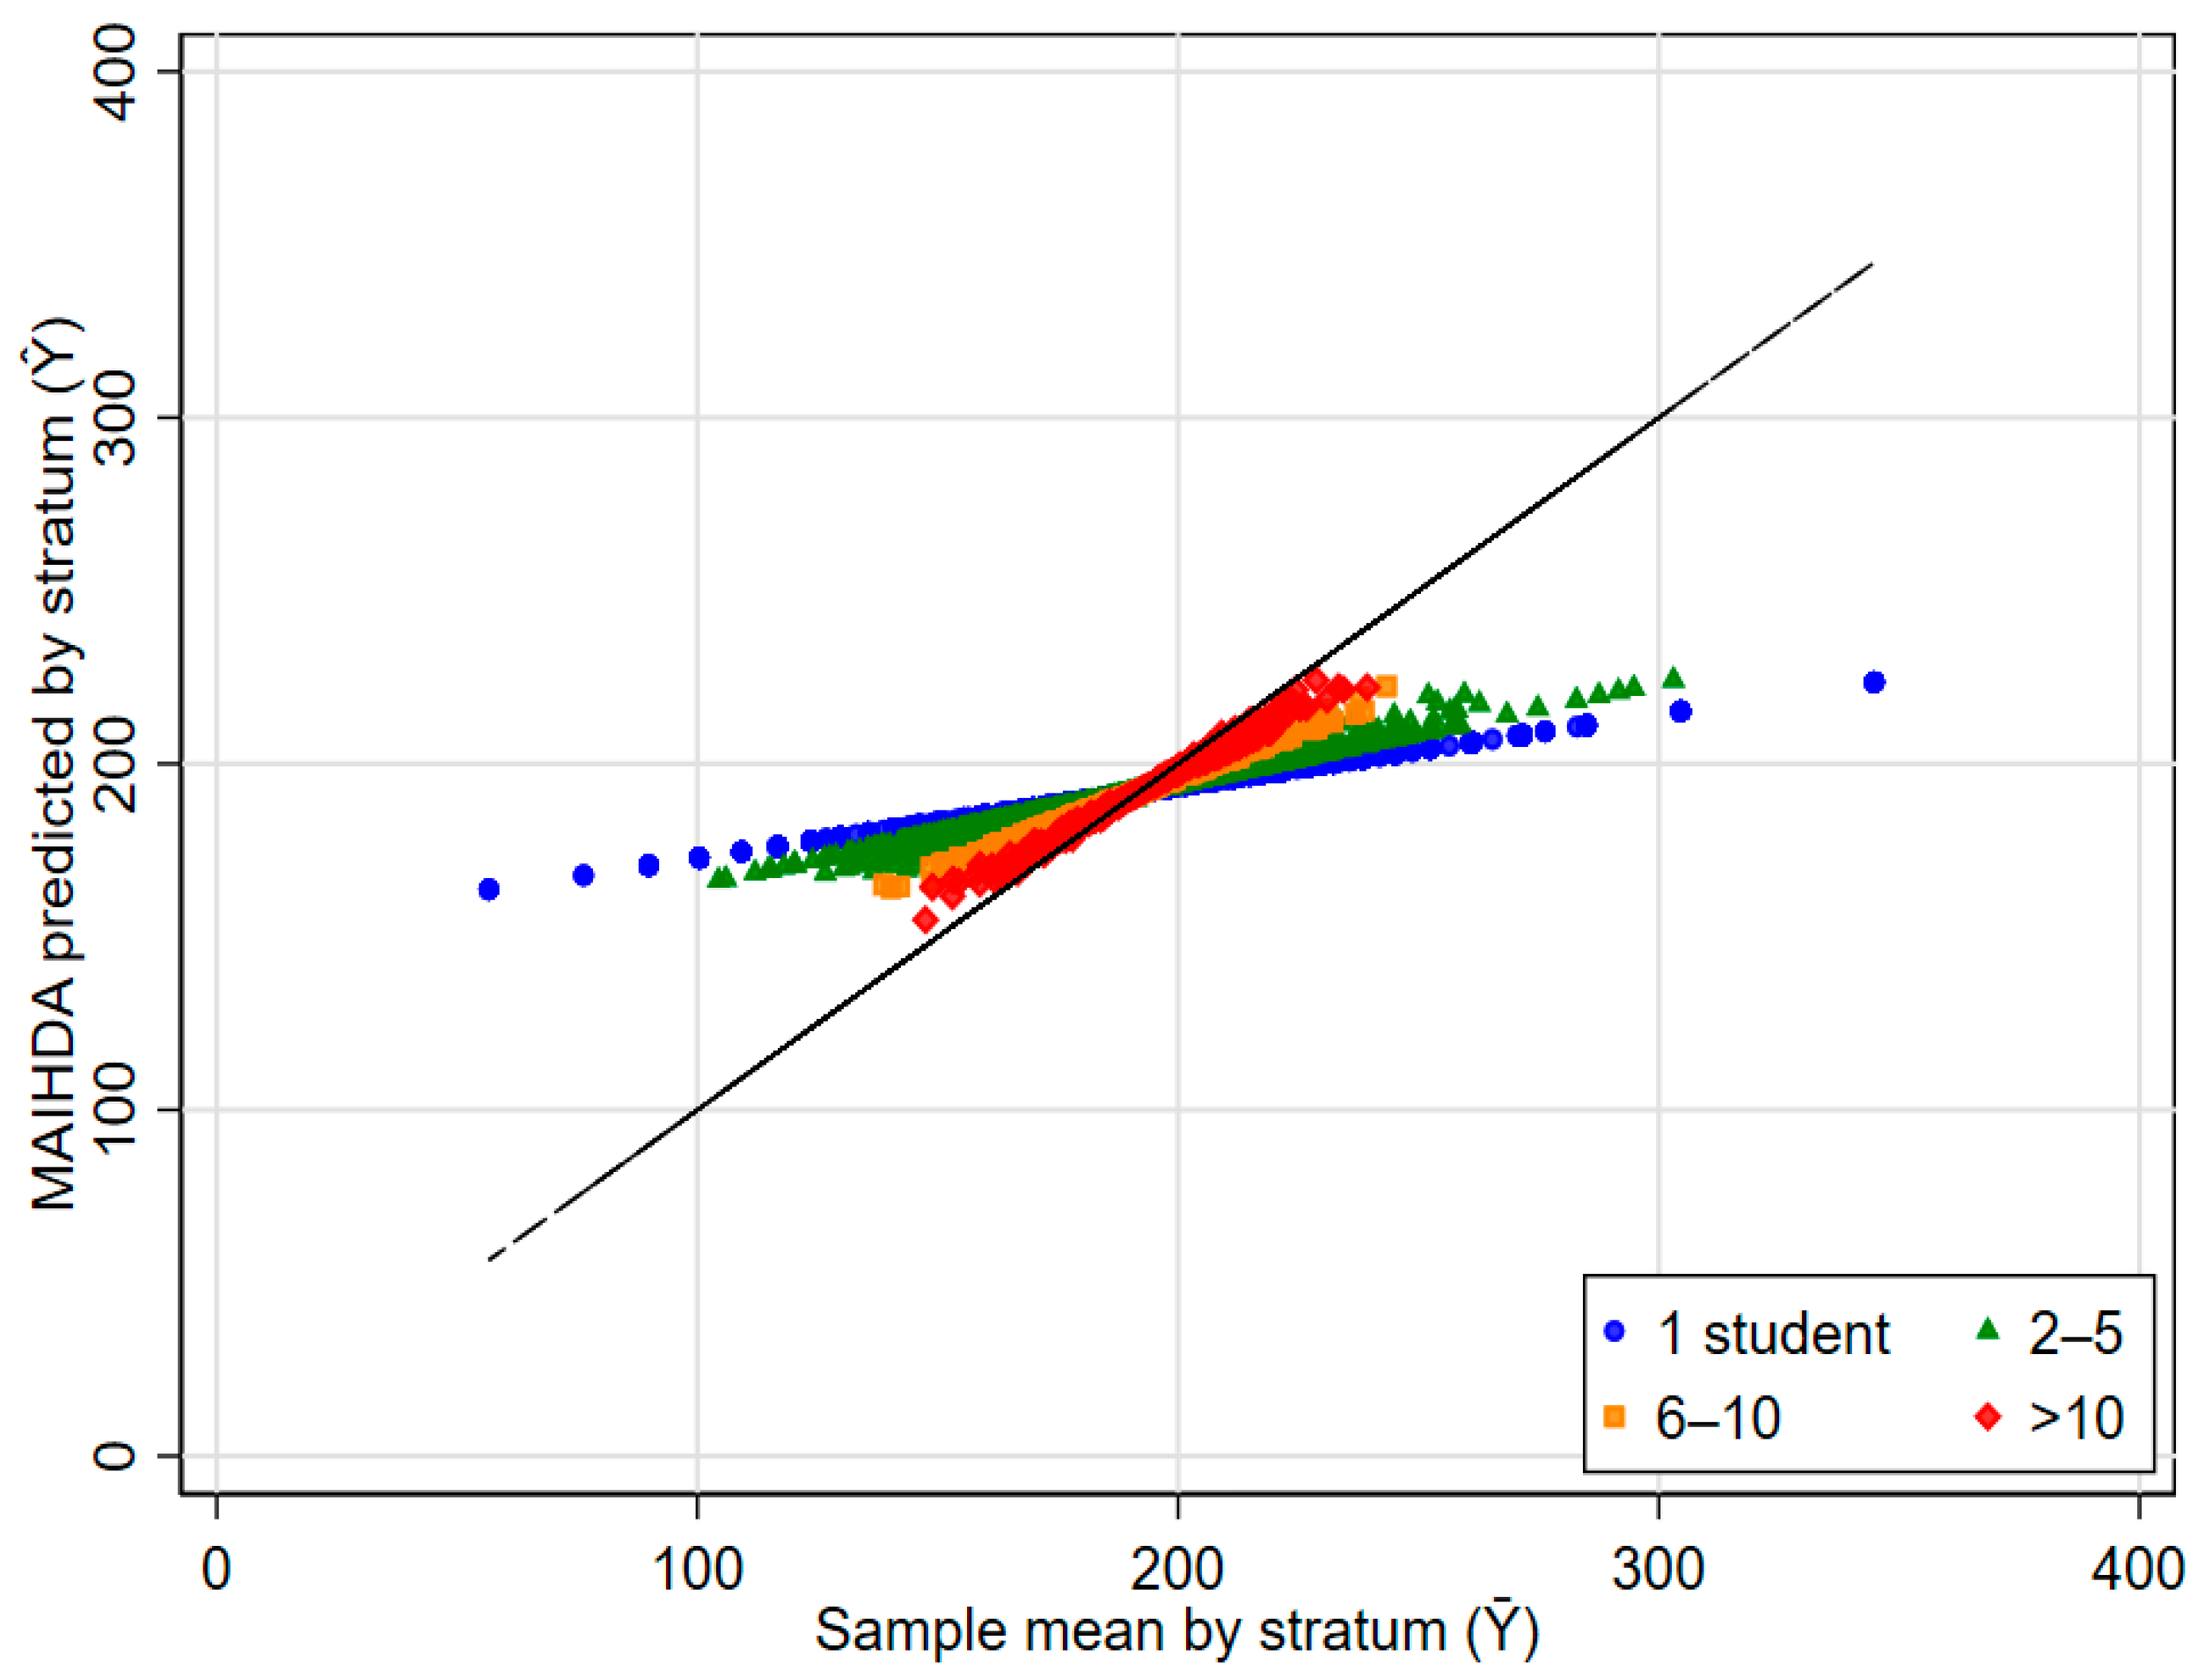
The shrinkage effect of the Empirical Bayes method is illustrated in Figure 3, which compares the MAIHDA-predicted stratum means from Model 1, namely α ^ + u ^ j s t r a t u m , with the sample stratum averages. Strata with very few students show strong shrinkage towards the overall mean, whereas strata with larger sample sizes lie closer to the bisector line, indicating minimal shrinkage. This pattern highlights how MAIHDA stabilises estimates for small strata while preserving information from larger ones, demonstrating the benefit of partial pooling over simple stratum averages.
Figure 3. Shrinkage of the stratum means of the math score operated by MAIHDA (Model 1). The solid line is the bisector (no shrinkage).
The analysis reveals that the highest-performing students are predominantly male, of Italian nationality, and from a highly favourable family environment. Their parents typically hold a university degree or, in some cases, a high school diploma, and occupy prestigious or high-responsibility job positions. Conversely, the most disadvantaged students relative to the overall average are mostly female, either native or of foreign origin, and come from an unfavourable family context. Their parents generally have low education levels, often limited to compulsory schooling, and work primarily in manual jobs, are unemployed, retired, or have an unreported occupational status.

4. Discussion

This study has demonstrated the validity of the intersectional MAIHDA approach in analysing educational inequalities, examining the impact of sociodemographic characteristics on educational outcomes within the Italian context. From a theoretical perspective, this contribution aligns with the broader field of research that applies intersectional approaches to the quantitative analysis of social inequalities. Indeed, this study, based on INVALSI mathematics test results for fifth-grade students, represents one of the very first applications of MAIHDA in the educational field and contributes to evaluating its potential and expanding the academic debate. The use of MAIHDA has enabled the precise measurement of how combinations of sex, origin, family environment, parental education level, and occupational status affect students’ performance in mathematics.
In the model without covariates, approximately 12% of the variance in math scores is attributable to the intersectional strata, a proportion that exceeds the variance explained by differences between schools (9%). These findings underscore the substantial contribution of intersectionality to overall variability in student achievement, aligning with prior research by () in their MAIHDA analysis of academic performance in Germany, where the VPC value stands at 15.9%. Moreover, these results suggest that, at least in the early stages of education, students’ sociodemographic characteristics weigh more heavily than the school context itself. This underlines the need for early interventions before the effects of inequality accumulate throughout subsequent educational stages.
The introduction of the covariate in the model reveals that the association between individual and social characteristics and the performance in mathematics is predominantly additive, with only 3.06% of variance attributable to interaction effects. This result aligns with findings from (), who applied MAIHDA to student assessment data in London. Although interaction effects are not statistically predominant, they still play a crucial role in understanding and interpreting complex and overlapping systems of educational disadvantage. The MAIHDA approach allows researchers to identify specific groups of students within the school population who are particularly disadvantaged and at risk of being overlooked by conventional regression models.
The intersection of unfavourable characteristics contributes to widening the gap between fragile students and the best-performing students. In Italy, the highest scores are typically found among native male students who come from a good family environment, with parents who have higher education levels and stable employment. In contrast, the lowest-performing strata predominantly consist of female students, whether native or foreign-born, who come from a poor family environment and have parents with limited education. Although the novelty of applying MAIHDA to educational research limits direct comparisons, these findings confirm the structural nature of educational inequalities and reinforce existing evidence on the impact of social origin on academic outcomes (). In the Italian context, where educational inequalities are strongly influenced by territorial, generational, and ethnic divides, the adoption of MAIHDA represents a methodological innovation with the potential to inform policy decisions ().
The findings of this study suggest two main implications for policy action. First, the results highlight the need for educational policies to move beyond a one-dimensional approach to disadvantage by adopting tools for intersectional profiling. Broad, generalist interventions, while intended to be equitable, risk failing to reach the most vulnerable and least visible groups. The evidence presented here supports revising resource allocation criteria, shifting from isolated variables, such as citizenship, to intersectional indicators that can capture layered inequalities. Second, the results reinforce the need for early, evidence-based interventions such as those demonstrated in this study. The persistence of disparities at the primary school level underscores the urgency of targeted preventive strategies, in line with the measures outlined in Italy’s National Recovery and Resilience Plan (PNRR) for reducing educational and territorial disparities. Three priority actions can be identified in this regard: (i) extending school time, which has been shown to mitigate the effects of family background (); (ii) improving teacher training on managing diverse classrooms; and (iii) promoting personalised tutoring.

5. Limitations and Final Remarks

From a methodological standpoint, the main advantage of MAIHDA is the capacity to handle complex interaction effects without the need to explicitly model them by a multitude of parameters. A limitation of any intersectional analysis lies in the sample size of the intersectional strata, some of which may be underrepresented or absent, so that reliable estimation of the effect is unfeasible for several strata. In this regard, a merit of MAIHDA is to prevent unsupported claims about strata with few observations, thanks to the differential shrinkage of predicted random effects.
A further methodological issue concerns the missing data, which have been handled by introducing an extra category: while practical and effective, this approach has the drawback of increasing the number of strata. Future studies might consider multiple imputation techniques as an alternative.
The school context has been incorporated into the analysis by including school random effects that are crossed with stratum random effects. This approach enabled us to account for the unobserved heterogeneity induced by school factors, yielding more reliable inferences on the stratum effects. Nevertheless, school random effects are insufficient to study the interplay between contexts and intersectional strata. This would require adding the key characteristics of the contexts as further stratification variables () and possibly specifying random slopes for individual-level variables ().
The analysed dataset refers to fifth-grade students (aged 10–11). The findings cannot be generalised to other school levels since educational inequalities vary across school cycles, with a tendency to widen as students move from primary to secondary school. Despite this limitation, the results are valid for providing a detailed description of educational inequalities in Italian primary schools, a critical phase in the development of students’ cognitive and motivational foundations. Future research could build on these results by analysing test data from secondary-school students, in order to evaluate the evolution of educational inequalities over time and address the needs of social psychology.
In light of the findings, the added value of the MAIHDA approach is confirmed as an advanced analytical tool for identifying, measuring, and interpreting educational inequalities through an intersectional lens. Its capacity to uncover multidimensional disadvantage profiles, often undetected by traditional models, reinforces the relevance of this method in guiding school policies toward greater equity.

Supplementary Materials

The following supporting information can be downloaded at: https://www.mdpi.com/article/10.3390/socsci14110672/s1, Table S1. Percentage distribution of socio-demographic variables across populated intersectional strata and empty strata: Gender, Origin, Family Environment (FAMENV). Table S2. Percentage distribution of socio-demographic variables across populated intersectional strata and empty strata: Parental education and occupation, separately for father and mother.

Author Contributions

Conceptualization, L.G.; methodology, L.G.; software, E.C.; formal analysis, E.C.; writing—original draft, E.C.; writing—review and editing, L.G. All authors have read and agreed to the published version of the manuscript.

Funding

This research was funded by the Italian Ministry of University and Research (MUR), PRIN 2022 Call (D.D. 104/2022), Project “Latent variable models and dimensionality reduction methods for complex data” (No. 20224CRB9E, CUP B53C24006320006).

Institutional Review Board Statement

Not applicable.

Data Availability Statement

The data used in this study have been downloaded from the INVALSI repository at https://serviziostatistico.invalsi.it/invalsi_ss_data/microdati-campione-g05-2022-23 (accessed on 11 November 2025).

Conflicts of Interest

The authors declare no conflicts of interest.

References

  1. Aparicio Fenoll, Ainhoa. 2017. English Proficiency and Test Scores of Immigrant Children in the US. (No. 10848). IZA Discussion Papers. Bonn: Institute for the Study of Labor (IZA). [Google Scholar]
  2. Álvarez, Ana Suárez, and Ana Jesús López Menéndez. 2023. The role of family background and education in shaping inequalities. Evidence from the Spanish regions. Social Policy and Society 24: 355–72. [Google Scholar] [CrossRef]
  3. Bauer, Greta R., Siobhan M. Churchill, Mayuri Mahendran, Chantel Walwyn, Daniel Lizotte, and Alma Angelica Villa-Rueda. 2021. Intersectionality in quantitative research: A systematic review of its emergence and applications of theory and methods. SSM-Population Health 14: 100798. [Google Scholar] [CrossRef]
  4. Bell, Andrew, Clare R. Evans, Dan Holman, and George Leckie. 2024. Extending intersectional multilevel analysis of individual heterogeneity and discriminatory accuracy (MAIHDA) to study individual longitudinal trajectories, with application to mental health in the UK. Social Science & Medicine 351: 116955. [Google Scholar] [CrossRef] [PubMed]
  5. Buchmann, Claudia, Thomas A. DiPrete, and Anne McDaniel. 2008. Gender inequalities in education. Annual Review of Sociology 34: 319–37. [Google Scholar] [CrossRef]
  6. Burgess, Simon, Ellen Greaves, Anna Vignoles, and Deborah Wilson. 2015. What parents want: School preferences and school choice. The Economic Journal 125: 1262–89. [Google Scholar] [CrossRef]
  7. Chetty, Raj, Nathaniel Hendren, Patrick Kline, and Emmanuel Saez. 2014. Where is the land of opportunity? The geography of intergenerational mobility in the United States. The Quarterly Journal of Economics 129: 1553–623. [Google Scholar] [CrossRef]
  8. Collins, Patricia Hill, Elaini Cristina Gonzaga da Silva, Emek Ergun, Inger Furseth, Kanisha D. Bond, and Jone Martínez-Palacios. 2021. Intersectionality as critical social theory: Intersectionality as critical social theory. Contemporary Political Theory 20: 690. [Google Scholar] [CrossRef]
  9. Dupriez, Vincent, Xavier Dumay, and Anne Vause. 2008. How do school systems manage pupils’ heterogeneity? Comparative Education Review 52: 245–73. [Google Scholar] [CrossRef]
  10. Evans, Clare R. 2019. Reintegrating contexts into quantitative intersectional analyses of health inequalities. Health and Place 60: 102214. [Google Scholar] [CrossRef] [PubMed]
  11. Evans, Clare R., David R. Williams, Jukka-Pekka Onnela, and Sankaran Venkata Subramanian. 2018. A multilevel approach to modelling health inequalities at the intersection of multiple social identities. Social Science & Medicine 203: 64–73. [Google Scholar] [CrossRef]
  12. Evans, Clare R., George Leckie, Sankaran Venkata Subramanian, Andrew Bell, and Juan Merlo. 2024. A tutorial for conducting intersectional multilevel analysis of individual heterogeneity and discriminatory accuracy (MAIHDA). SSM-Population Health 26: 101664. [Google Scholar] [CrossRef] [PubMed]
  13. Ferreira, Francisco H., and Jérémie Gignoux. 2014. The measurement of educational inequality: Achievement and opportunity. The World Bank Economic Review 28: 210–46. [Google Scholar] [CrossRef]
  14. Ferri, Valentina, Giovanna Di Castro, and Salvatore Marsiglia. 2023. Does the immigrant background affect student achievement? Cross-country comparisons of PISA scores. Rivista Italiana di Economia Demografia e Statistica 77: 91–102. [Google Scholar] [CrossRef]
  15. Gamoran, Adam. 2001. American schooling and educational inequality: A forecast for the 21st century. Sociology of Education 74: 135–53. [Google Scholar] [CrossRef]
  16. Green, Mark A., Clare R. Evans, and Sankaran Venkata Subramanian. 2017. Can intersectionality theory enrich population health research? Social Science & Medicine 178: 214–16. [Google Scholar] [CrossRef]
  17. Groves, Robert M., Floyd J. Fowler, Jr., Mick P. Couper, James M. Lepkowski, Eleanor Singer, and Roger Tourangeau. 2011. Survey Methodology. Hoboken: John Wiley and Sons. [Google Scholar]
  18. Guez, Ava, Hugo Peyre, and Frank Ramus. 2020. Sex differences in academic achievement are modulated by evaluation type. Learning and Individual Differences 83: 101935. [Google Scholar] [CrossRef]
  19. Iannelli, Cristina. 2017. The role of the school curriculum in social mobility. In Education and Social Mobility. Abingdon: Routledge, pp. 289–310. [Google Scholar]
  20. Jensen, Simon Skovgaard, Michael Kühhirt, and Felix Weiss. 2024. Parental unemployment and children’s well-being at school: The role of duration, reemployment, and socioeconomic status. Acta Sociologica 68: 217–37. [Google Scholar] [CrossRef]
  21. Jæger, Mads Meier. 2022. Cultural capital and educational inequality: An assessment of the state of the art. In Handbook of Sociological Science. Cheltenham and Northampton: Edward Elgar Publishing, pp. 121–34. [Google Scholar] [CrossRef]
  22. Kalmijn, Matthijs. 1994. Mother’s occupational status and children’s schooling. American Sociological Review 59: 257–75. [Google Scholar] [CrossRef]
  23. Keller, Lena, Elisa Oppermann, and Camilla Rjosk. 2024. Intersectionality in Educational Contexts. Zeitschrift für Entwicklungspsychologie und Pädagogische Psychologie 56: 1–6. [Google Scholar] [CrossRef]
  24. Keller, Lena, Oliver Lüdtke, Franzis Preckel, and Martin Brunner. 2023. Educational inequalities at the intersection of multiple social categories: An introduction and systematic review of the Multilevel Analysis of Individual Heterogeneity and Discriminatory Accuracy (MAIHDA) approach. Educational Psychology Review 35: 1–37. [Google Scholar] [CrossRef]
  25. King, Deborah K. 1988. Multiple jeopardy, multiple consciousness: The context of a Black feminist ideology. Signs: Journal of Women in Culture and Society 14: 42–72. [Google Scholar] [CrossRef]
  26. Kristen, Cornelia, and Nadia Granato. 2007. The educational attainment of the second generation in Germany: Social origins and ethnic inequality. Ethnicities 7: 343–66. [Google Scholar] [CrossRef]
  27. Lareau, Annette. 2018. Unequal childhoods: Class, race, and family life. In Inequality in the 21st Century. Abingdon: Routledge, pp. 444–51. [Google Scholar]
  28. Le, Vy, Grace Angell, Jayson Nissen, and Ben Van Dusen. 2025. Challenging the Model Minority Myth: A MAIHDA Study of Asian Student Outcomes in Introductory Physics. arXiv arXiv:2509.19049. [Google Scholar] [CrossRef]
  29. Lindemann, Kristina, and Ellu Saar. 2011. Ethnic inequalities in education. In The Russian Second Generation in Tallinn and Kohtla-Järve: The TIES Study in Estonia. Edited by Raivo Vetik and Jelena Helemäe. Amsterdam: Taylor & Francis, pp. 59–92. [Google Scholar]
  30. Lister, Jennie, Catherine Hewitt, and Josie Dickerson. 2024. Using I-MAIHDA to extend understanding of engagement in early years interventions: An example using the Born in Bradford’s Better Start (BiBBS) birth cohort data. Social Sciences & Humanities Open 10: 100935. [Google Scholar] [CrossRef]
  31. Liu, Yan. 2024. The relationship and heterogeneity of family participation and social participation among older adults: From an intersectionality perspective. BMC Geriatrics 24: 949. [Google Scholar] [CrossRef] [PubMed]
  32. Ljungman, Hanna, Maria Wemrell, Raquel Perez-Vicente, Kani Khalaf, Juan Merlo, and George Leckie. 2021. Antidepressant use in Sweden: An intersectional multilevel analysis of individual heterogeneity and discriminatory accuracy (MAIHDA). Scandinavian Journal of Public Health 50: 395–403. [Google Scholar] [CrossRef]
  33. Machin, Stephen, and Anna Vignoles. 2004. Educational inequality: The widening socio-economic gap. Fiscal Studies 25: 107–28. [Google Scholar] [CrossRef]
  34. Mahendran, Mayuri, Daniel Lizotte, and Greta R. Bauer. 2022. Describing intersectional health outcomes: An evaluation of data analysis methods. Epidemiology 33: 395–405. [Google Scholar] [CrossRef]
  35. Marone, Francesca, and Francesca Buccini. 2020. Disability and migration: New alliances for inclusion. Educazione Interculturale 18: 97–111. [Google Scholar] [CrossRef]
  36. Merlo, Juan. 2018. Multilevel analysis of individual heterogeneity and discriminatory accuracy (MAIHDA) within an intersectional framework. Social Science & Medicine 203: 74–80. [Google Scholar] [CrossRef]
  37. Nieves, Christina I., Luisa N. Borrell, Clare R. Evans, Heidi E. Jones, and Mary Huynh. 2023. The application of intersectional multilevel analysis of individual heterogeneity and discriminatory accuracy (MAIHDA) to examine birthweight inequities in New York City. Health & Place 81: 103029. [Google Scholar] [CrossRef] [PubMed]
  38. OECD. 2018. Equity in Education: Breaking Down Barriers to Social Mobility. Paris: OECD Publishing. [Google Scholar] [CrossRef]
  39. OECD. 2019. PISA 2018 Results (Volume I): What Students Know and Can Do. Paris: OECD Publishing. [Google Scholar] [CrossRef]
  40. OECD. 2023. PISA 2022 Results (Volume I): The State of Learning and Equity in Education. Paris: OECD Publishing. [Google Scholar] [CrossRef]
  41. Patall, Erika A., Harris Cooper, and Ashley Batts Allen. 2010. Extending the school day or school year: A systematic review of research (1985–2009). Review of Educational Research 80: 401–36. [Google Scholar] [CrossRef]
  42. Pensiero, Nicola, Orazio Giancola, and Carlo Barone. 2019. Socioeconomic inequality and student outcomes in Italy. In Socioeconomic Inequality and Student Outcomes: Cross-National Trends, Policies, and Practices. Singapore: Springer, pp. 81–94. [Google Scholar] [CrossRef]
  43. Pfeffer, Fabian T. 2008. Persistent inequality in educational attainment and its institutional context. European Sociological Review 24: 543–65. [Google Scholar] [CrossRef]
  44. Prior, Lucy, and George Leckie. 2024. Student intersectional sociodemographic and school variation in GCSE final grades in England following COVID-19 examination cancellations. Oxford Review of Education 51: 763–84. [Google Scholar] [CrossRef]
  45. Prior, Lucy, Clare R. Evans, Juan Merlo, and George Leckie. 2024. Socio-demographic Inequalities in Student Achievement: An Intersectional Multilevel Analysis of Individual Heterogeneity and Discriminatory Accuracy (MAIHDA). Sociology of Race and Ethnicity 11: 351–69. [Google Scholar] [CrossRef]
  46. Rosen, Maya L., Margaret A. Sheridan, Kelly A. Sambrook, Andrew N. Meltzoff, and Katie A. McLaughlin. 2018. Socioeconomic disparities in academic achievement: A multi-modal investigation of neural mechanisms in children and adolescents. NeuroImage 173: 298–310. [Google Scholar] [CrossRef]
  47. Rossetti, Sara. 2022. Intersezionalità e decolonialità: Nuove lenti sugli studi delle migrazioni femminili attraverso il caso studio delle donne originarie del Subcontinente indiano in Italia. Culture e Studi del Sociale 7: 152–64. [Google Scholar]
  48. Rothstein, Richard. 2015. The racial achievement gap, segregated schools, and segregated neighborhoods: A constitutional insult. Race and Social Problems 7: 21–30. [Google Scholar] [CrossRef]
  49. Schildberg-Hörisch, Hannah. 2016. Parental Employment and Children’s Academic Achievement. Bonn: IZA World of Labor. [Google Scholar] [CrossRef]
  50. Schmidt, William H., Nathan A. Burroughs, Pablo Zoido, and Richard T. Houang. 2015. The role of schooling in perpetuating educational inequality: An international perspective. Educational Researcher 44: 371–86. [Google Scholar] [CrossRef]
  51. StataCorp. 2023. Stata Statistical Software: Release 18. College Station: StataCorp LLC. [Google Scholar]
  52. Terrin, Éder, and Moris Triventi. 2023. The effect of school tracking on student achievement and inequality: A meta-analysis. Review of Educational Research 93: 236–74. [Google Scholar] [CrossRef]
  53. Triventi, Moris, Elisa Vlach, and Elisa Pini. 2022. Understanding why immigrant children underperform: Evidence from Italian compulsory education. Journal of Ethnic and Migration Studies 48: 2324–46. [Google Scholar] [CrossRef]
  54. Voyer, Daniel, and Susan D. Voyer. 2014. Gender differences in scholastic achievement: A meta-analysis. Psychological Bulletin 140: 1174. [Google Scholar] [CrossRef]
  55. Willms, J. Douglas. 2010. School composition and contextual effects on student outcomes. Teachers College Record 112: 1008–37. [Google Scholar] [CrossRef]
Disclaimer/Publisher’s Note: The statements, opinions and data contained in all publications are solely those of the individual author(s) and contributor(s) and not of MDPI and/or the editor(s). MDPI and/or the editor(s) disclaim responsibility for any injury to people or property resulting from any ideas, methods, instructions or products referred to in the content.

Article Metrics

Citations

Article Access Statistics

Article metric data becomes available approximately 24 hours after publication online.