Abstract
The formation of hard/brittle layers (HBLs) forming in proximity to the transition-layer interface during the welding process of stainless steel clad plates constitutes a pivotal element in determining the limitations on joint homogeneity and toughness. In order to elucidate their formation mechanisms and develop viable suppression routes, S31603/Q420qENH clad plates were utilised to fabricate five butt joints. This was achieved by varying the carbon content of the welding consumables and the heat input in the transition layer. A programme was conducted that combined microstructural and microhardness characterisation, mechanical testing, and numerical welding simulations. The findings indicate that base-layer consumables with comparatively elevated carbon content (w(C) ≥ 0.06%) expeditiously engender a constricted, localised hardened band in close proximity to the transition-layer interface. This is characterised by the predominance of martensite and Cr-rich compounds of the MxCry type, which function as the principal genesis of bending cracks. Conversely, the utilisation of low-carbon welding consumables has been shown to markedly reduce interfacial carbon activity and C-Cr segregation, thereby suppressing the precipitation of MxCry phases and effectively decreasing the overall thickness of the HBLs. Further numerical analysis shows that moderately increasing the transition-layer heat input lowers the T8/5 cooling rate and shifts the cooling path away from the martensite region. This transforms the interfacial microstructure from a localised hardened band into a more uniform, graded structure. These findings provide an engineerable process-control strategy for enhancing both microstructural uniformity and toughness in stainless steel clad joints.
1. Introduction
Weathering steel–stainless steel clad plates consist of a thin stainless steel cladding layer metallurgically bonded to a thick weathering steel substrate. They are typically manufactured by explosive rolling or vacuum hot-rolling processes. In comparison with conventional carbon steel–stainless steel clad systems, the S31603 austenitic stainless steel/Q420qENH weathering steel combination has been shown to retain the high strength and toughness of Q420qENH whilst markedly improving the overall corrosion resistance of the plate [1,2]. Benefiting from the synergy between mechanical performance and corrosion resistance, weathering-steel–stainless-steel clad plates exhibit great application potential in critical structures operating in highly corrosive environments, such as railway steel bridge track zones, chemical pressure vessels and industrial chimneys.
Welding is a pivotal process in the fabrication and installation of stainless steel-clad structures. The judicious selection of welding processes and filler metals facilitates the creation of clad joints that satisfy a range of service requirements. The following commonly used methods are employed: shielded metal arc welding (SMAW), submerged arc welding (SAW), tungsten inert gas welding (TIG), and laser welding (LW). When executed with optimal parameter configuration and alignment of welding consumables, these processes can yield the desired mechanical properties and corrosion performance. In the context of stainless steel clad plates, the selection of filler materials and welding procedures exerts a decisive influence on the quality of welds and the combined mechanical performance of the joints, including strength, stiffness and toughness. In accordance with the welding procedure specification for stainless steel-clad steels in the petrochemical industry [3], the use of stainless filler metals compatible with the stainless cladding layer is recommended to ensure corrosion resistance. Conversely, in building steel structures, engineering welding of stainless steel clad plates is generally carried out using multi-layer deposition in accordance with Chinese Standard GB/T 13148 [4]. Owing to the pronounced chemical composition mismatch among the base layer, transition layer and stainless steel cladding welds, the joint region develops highly non-uniform and complex microstructural and mechanical characteristics.
Irrespective of the SMAW, SAW, or TIG employed, the microstructures in different regions of welded joints are found to be contingent on the type and alloy chemistry of the consumables. When stainless filler metals are used, the weld metal typically exhibits an austenite + δ-ferrite duplex structure; conversely, when carbon steel welding consumables are adopted, ferrite + pearlite structures are commonly observed. Of greater significance are the pronounced gradients of carbon and alloying elements that have been observed in the vicinity of the clad interface during welding thermal cycles. The solidification transition zone between the stainless weld metal and the carbon/low-alloy weld metal is susceptible to the formation of M23C6 carbides and hard martensite [5,6,7]. Li G.F. et al. [8] reported that the transition region in A508–309L/308L dissimilar welded joints can be further divided into three sub-zones: coarse grains with extensive carbide precipitation along grain boundaries on the austenitic stainless steel side, and a decarburised layer together with a martensite-like interfacial zone on the low-alloy steel side. The martensitic interfacial zone has been referred to as the “Type II boundary” [9,10,11], and the region between the Type II boundary and the fusion boundary is commonly termed the “solidification transition zone”. This zone, which is typically composed of fine lath martensite, a small amount of twinned martensite, and bainite, has been widely regarded as a characteristic weak region and a primary failure source in dissimilar metal welded joints.
A substantial body of research has yielded consistent findings pertaining to the genesis and deleterious consequences of interfacial complex structures. Li et al. [6] reported that, for 321SS/Q345 bimetallic clad plates welded with mixed consumables, utilising carbon steel consumables for the initial layer resulted in the promotion of martensite-related hard and brittle microstructures, leading to the formation of a localised hard zone (LHZ) with a maximum hardness of 425 HV1. Wang et al. [12] showed that once martensite forms in the transition layer, this region exhibits hardness levels consistently higher than those of both the cladding- and base-metal-side weld metals, with maximum values exceeding 400 HV10. Ban et al. [13] demonstrated that higher heat input aggravates decarburisation and martensite formation near the dissimilar interface in S31603/Q355 B stainless steel clad plates. Li et al. [14] observed a hard martensitic layer of approximately 0.6–0.8 mm in the transition-layer weld metal of L415/316L joints. This layer served as the crack-initiation region in bending tests. Zhu et al. [15] further highlighted that martensite formation in the vicinity of the boundary between the transition layer and the substrate is virtually inevitable when mixed consumables are utilised, underscoring the pressing need to develop more suitable welding procedures to reduce or mitigate the formation of such complicated structures. Despite the paucity of systematic studies on the long-term service implications of the interfacial martensitic layer, the presence of a continuous hard/brittle layers at the transition interface is expected to markedly increase failure risk under coupled mechanical loading and environmental exposure [16,17].
To mitigate the excessive formation of interfacial martensite bands, Górnikowska et al. [18] reported that the cold metal transfer (CMT) process effectively reduces heat input and thus decreases the martensite band width. Improved arc welding processes, including TIP TIG [13,19], hot-wire TIG (HW TIG) [20], and pulsed TIG (P-TIG) [21], have been shown to reduce heat input to both the substrate and the cladding, thereby alleviating elemental dilution near the clad interface. This, in turn, can mitigate interfacial hardening and embrittlement to a certain extent. However, systematic comparisons between these advanced processes and conventional welding methods regarding microstructural evolution and service performance of stainless steel clad joints remain limited. In particular, the quantitative relationships among welding consumable combinations, heat input, microstructural evolution in the solidification transition zone, hardness gradients, and macroscopic mechanical behaviour in the S31603/Q420qENH weathering steel–stainless steel system are not yet fully understood.
In light of the aforementioned background, the present study focuses on S31603/Q420qENH stainless steel clad plates and systematically investigates the formation mechanism of hard/brittle layers in the vicinity of the clad interface in welded joints, and their influence on joint performance. The fabrication of butt joints was undertaken using base-layer consumables with varying carbon contents and a range of heat inputs for the transition layer. A combination of microstructural observation, microhardness measurements and macro-scale mechanical testing was employed to comparatively examine the evolution of the weld metal, solidification transition zone and clad interface, together with the associated hardness gradients. Furthermore, utilising the CCT diagram of Q420qENH steel as a basis, welding thermal cycles were subjected to numerical simulation and validation against experimental findings, thereby facilitating a quantitative correlation between heat input, cooling histories and phase transformation behaviour in the transition layer. On this basis, a combination of low-carbon consumables and a transition-layer heat-input window is proposed to balance the suppression of hard/brittle layers with the overall mechanical performance of the joints. This study has successfully elucidated the correlation between the properties of the transition-interface hard/brittle layers and the fracture modes of the welded joints. This provides a metallurgical basis and practical guidance for the optimisation of welding procedures and the assessment of the structural integrity of weathering steel–stainless steel clad plates.
2. Experimental Methods and Procedures
2.1. Materials Preparation and Welding Process
In this study, stainless steel clad plates of S31603/Q420qENH with a total thickness of 19 mm were utilised, comprising a 3 mm S31603 stainless steel cladding and a 16 mm Q420qENH weathering steel substrate. The welding consumables were selected in accordance with the recommendations of Chinese standard GB/T 13148 [4] for clad plate welding, and followed a layer-wise matching strategy. In the Q420qENH base layer, low-alloy high-strength consumables with graded carbon contents (JWT60NHQ, J557NHQ and JWT60NHQ-1) were utilised to customise the weld microstructure and mechanical response. The transition layer was welded using 309LMo-type stainless consumables (JWER309LMo/JWE309LMo) to ensure a smooth compositional transition and metallurgical compatibility, while the S31603 cladding was welded with 316L-type stainless consumables (JWER316L/JWE316L) to maintain corrosion resistance. The welding operations were performed using two gas metal arc welding (GMAW) power sources: a Panasonic KRII500 and an NB-500 welding machine (Panasonic Connect Co., Ltd., Osaka, Japan), to accommodate different process requirements and ensure consistent weld quality. The chemical compositions of the clad plate base materials and deposited weld metals are listed in Table 1. The relatively high contents of chromium and nickel in the 309LMo consumables help to suppress interfacial carbon migration and mitigate alloy depletion in the stainless steel cladding.

Table 1.
Chemical compositions and mechanical properties of the S31603/Q420qENH clad plate and welding consumables.
Two welding processes, metal active gas (MAG) welding and shielded metal arc welding (SMAW), were adopted for the fabrication of five butt-welded clad joints, denoted as WBC1–WBC5. Preparation of all joints was undertaken with a single-sided 40° V-groove and a root gap of approximately 6.0 mm, as illustrated in Figure 1. The measured welding parameters are summarised in Table 2. The welding heat input was calculated using an arc efficiency factor of 0.75, as supported by both literature data and engineering practice [13]. It is evident that WBC1 and WBC2, in addition to WBC3 and WBC4, are MAG-welded butt joints in the flat and vertical positions, respectively. JWT60NHQ was utilised as the base-layer consumable in WBC1 and WBC3, whereas the lower-carbon JWT60NHQ-1 was employed in WBC2 and WBC4. For these four joints, JWER309LMo and JWER316L wires were utilised in the transition and cladding layers. WBC5 is a flat-position butt joint fabricated by SMAW, in which JWJ557NHQ, JWE309LMo, and JWE316L electrodes were employed for the base layer, transition layer, and cladding layer, respectively. The joint matrix was designed to facilitate a comparative evaluation of the combined effects of welding process, welding heat input, and base-layer carbon content on the microstructure and mechanical performance of S31603/Q420qENH clad joints.
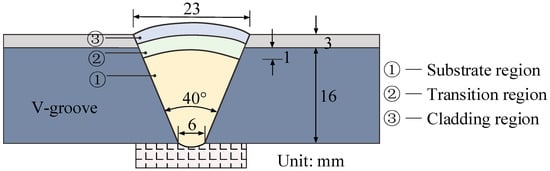
Figure 1.
Schematic of weld groove geometry.
Table 2.
Welding parameters for S31603/Q420qENH clad joints.
2.2. Microstructures and Microhardness Analyses
Metallographic and microhardness specimens of joints WBC1–WBC5 were prepared in accordance with the provisions of GB/T 13298 [22]. The locations and regions of microstructural observation are illustrated in Figure 2a. The microhardness measurements were conducted in accordance with ISO 6507-1 [23] using a Vickers microhardness tester (Shanghai Hualong Test Instruments Corporation, Shanghai, China). The applied load was 300 g (2.942 N), and the dwell time was 15 s. For each joint, indentations were arranged along four predetermined paths in the weld cross-section, as illustrated in Figure 2b. It was established that paths A and B were oriented normal to the fusion lines of the weathering steel base-layer weld and the transition-layer weld, extending upward and downward, respectively. It was observed that the paths C and D were oriented tangentially to the fusion line between the base-layer weld and the substrate, extending to the left and right, respectively. Indentations were spaced at 0.5 mm intervals along each path, covering the base-layer weld metal, the transition-layer weld metal, and the adjacent base metals, so as to obtain representative hardness distributions and local hardening features near the clad interface.
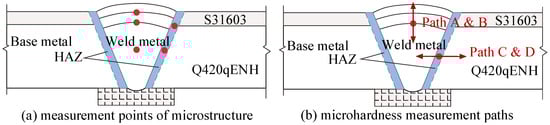
Figure 2.
Layout of microhardness indents in S31603/Q420qENH clad joints.
2.3. Testing Mechanical Properties
In order to facilitate a comparison of the quality of the welds and the static mechanical performance of joints WBC1–WBC5, uniaxial tensile and bend tests were conducted on specimens with geometries as shown in Figure 3a,b. Tensile tests were conducted at ambient temperature in accordance with GB/T 228.1 [24] and ISO 6892-1 [25], employing a universal testing machine with a maximum load capacity of ±300 kN. Samples were obtained from the plate along its entire length, with the weld situated at the centre of the gauge length and the loading direction perpendicular to the weld. A clip-on extensometer was attached across the weld region in order to record longitudinal strain within the specified gauge length. The applied strain rate was 0.025%·s−1, and the yield strength, ultimate tensile strength, and elongation after fracture were determined for each joint. Bend tests were conducted in face-bend, root-bend and side-bend configurations, with two parallel specimens for each mode. In accordance with Chinese standard GB/T 16957 [26] and ISO 5173 [27], bending loads were applied to the stainless cladding weld surface, the weathering steel weld surface and the joint cross-section, and all specimens were bent to 180°. The tension surfaces were then subjected to rigorous examination to ascertain the presence of any visible cracking, with the objective of assessing the bending deformability of the welded joints.
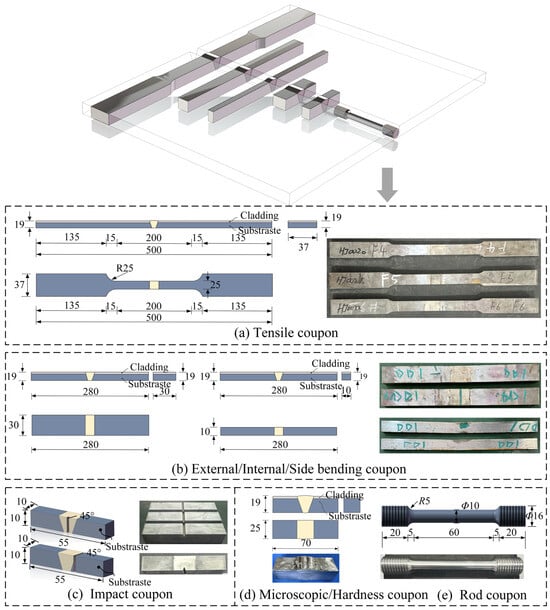
Figure 3.
Dimensions of specimens for mechanical property testing.
Impact toughness was evaluated using standard Charpy V-notch tests. The specimens, with dimensions of 55 mm × 10 mm × 10 mm and a two mm-deep, 45° V-notch, were machined, with notches located at the centre of the weathering steel base-layer weld metal and at the centre of its HAZ, as illustrated in Figure 3c. Tests were conducted at a temperature of −40 °C, with three parallel specimens being evaluated for each condition. Prior to testing, the specimens were equilibrated at the designated test temperature for a sufficient period. In addition, the influence of the welding procedure on joint performance was further assessed, and the results were correlated with those of the microstructural and hardness tests. To this end, longitudinal tensile specimens were prepared from joints WBC1–WBC5 (see Figure 3d,e) and tested under the same loading conditions as the transverse tensile specimens. This was done to evaluate the mechanical uniformity of the weld metal along the weld direction.
3. Experimental Results and Analyses
3.1. Microstructures and Microhardness Analyses
3.1.1. Microstructures
Macroscopically, all five welded joints (WBC1–WBC5) in the stainless steel clad plates exhibited a smooth weld profile, continuous fusion lines, and no visible porosity, cracking, lack of fusion, or slag inclusions. As a consequence of the utilisation of discrete etchants for the weathering-steel and stainless-steel welds, slight local over-etching transpired at their interface, most conspicuously in region III of WBC1. Notwithstanding this, the interfacial microstructural features remained distinctly identifiable. In the S31603/Q420qENH clad plate, the weathering-steel substrate consists primarily of ferrite and pearlite, while the stainless-steel cladding exhibits lath austenite with a minor presence of ferrite. In joints WBC1–WBC5, the phase constituents of the weathering-steel and stainless-steel weld metals are essentially consistent with those of their respective base metals. For the purposes of clarity, the joint is divided into five characteristic regions. The regions are defined as follows: Region I is stainless-steel weld metal; Region II is transition-layer weld metal; Region III is the zone immediately beneath the weathering-steel/transition-layer weld interface; Region IV is the mid-thickness of the weathering-steel weld metal; and Region V is the heat-affected zone of the weathering-steel weld, as indicated in Figure 4, Figure 5, Figure 6, Figure 7 and Figure 8.
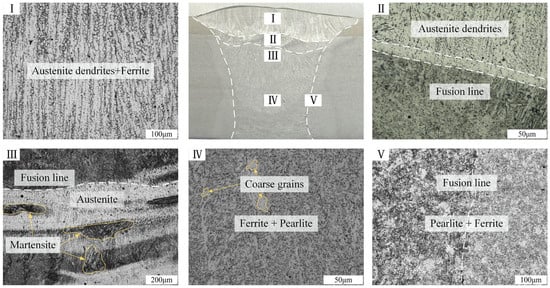
Figure 4.
Optical microstructures of WBC1.
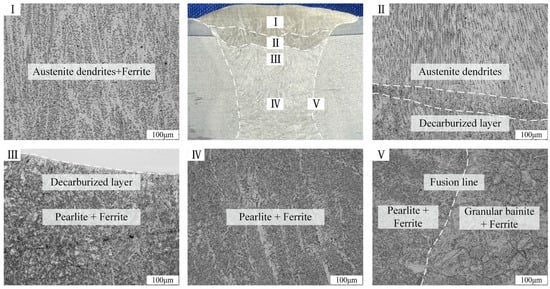
Figure 5.
Optical microstructures of WBC2.
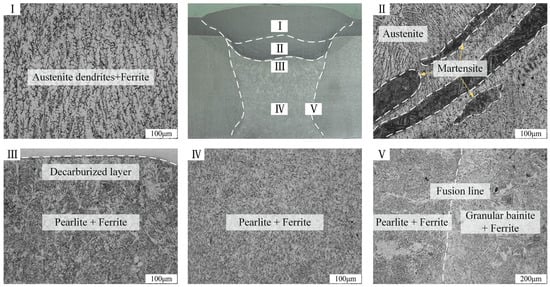
Figure 6.
Optical microstructures of WBC3.
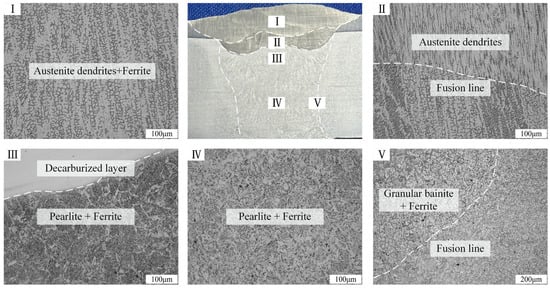
Figure 7.
Optical microstructures of WBC4.
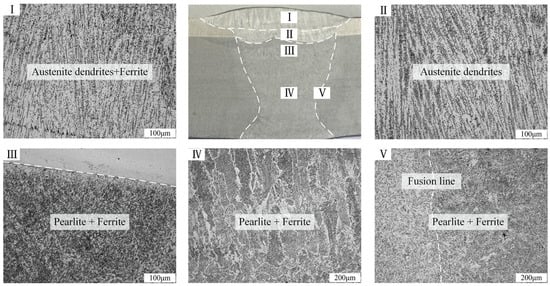
Figure 8.
Optical microstructures of WBC5.
Region I features an austenitic matrix with columnar or dendritic δ-ferrite, some of which appears vermicular within austenite grains. Rapid solidification at high cooling rates results in a dendritic morphology. The δ-ferrite forms early in solidification but transforms incompletely into austenite, resulting in a duplex microstructure of austenite + δ-ferrite. Columnar grains align with the fusion line, confirming typical solidification behaviour. Region II consists of austenite with blocky and lath ferrite. 309LMo-type consumables, rich in chromium (Cr) and nickel (Ni), are used in this region. Multiple thermal cycles from multi-pass welding also contribute to grain coarsening. In contrast to Region I, where the initial skeletal ferrite maintains a uniform morphology, in Region II, this ferrite undergoes fragmentation, resulting in the formation of lath or irregular blocky ferrite.
Region III, beneath the weathering steel/transition-layer interface, primarily consists of pearlite and acicular ferrite. Due to lower heat input and higher cooling rates beneath the transition-layer weld, acicular ferrite forms. Acicular ferrite is beneficial for low-temperature impact toughness in the interface, as will be discussed further with reference to the impact test results. Region IV mainly consists of blocky ferrite, grain boundary ferrite, and pearlite. Secondary heating from multi-pass welding leads to grain coarsening and limited lath ferrite formation. No Widmanstätten structures or other harmful morphologies were observed. Region V contains ferrite, pearlite, and granular bainite, indicating a ferritic-ferritic transformation. Elevated cooling rates near the fusion line promote fine granular bainite and some grain refinement, suggesting an intense welding thermal cycle.
In addition to these standard features, the selection of welding consumables and the magnitude of heat input give rise to marked microstructural variations in the proximity of the interface. The base-layer welds of WBC1 and WBC3 employ JWT60NHQ consumables with a higher carbon content than JWT60NHQ-1 used in WBC2 and WBC4, and WBC3 and WBC4 are vertical-position welds whose heat input in the transition and base layers is approximately 50% higher than that of the corresponding flat-position welds (see Table 2). In this configuration, there is an enhancement of both elemental diffusion and the presence of microstructural discontinuities in regions II and III. In region II of WBC1, a distinct decarburised layer is observed, and region III exhibits a band of mixed microstructure in which the stainless and weathering steel weld microstructures interpenetrate. In WBC3, region II similarly displays a relatively extensive intermixing zone with a pronounced banded morphology.
Within these mixed microstructural regions, a fine acicular morphology is observed on the weathering steel side, while the stainless side exhibits enrichment of lath- or network-like brittle phases. In conjunction with the hardness profiles presented later, these features suggest the presence of martensitic-like complicated microstructures, which are likely locations of localised interfacial complex layers. In contrast, for WBC2 and WBC4, which utilise a lower-carbon base-layer consumable, the presence of grain coarsening and local hard/brittle phases is also evident under higher heat input conditions. However, the decarburised layer and intermixing band are conspicuously narrower. In WBC5, fabricated by SMAW with average line energy in the transition and base layers approximately 20% lower than that of WBC1–WBC2, the microstructural distribution from region I to region V is more uniform. In regions II and III, no continuous decarburised layer or large-scale mixing band is observed; only limited hard microstructures are detected in localised areas, and the interfacial transition is comparatively smooth. It has been established that the combination of high-carbon base-layer consumables and high heat input tends to promote the formation of decarburised zones and banded hard/brittle microstructures in the dissimilar fusion region. Conversely, a moderate reduction in heat input combined with low-carbon consumables has been shown to favour a more stable and gradually graded interfacial microstructure, providing a more favourable basis for toughness and failure behaviour.
3.1.2. Microhardness Distribution
In accordance with the aforementioned microstructural observations, the Vickers microhardness profiles of clad joints WBC1–WBC5 along different paths are presented in Figure 9. The indentations were meticulously positioned at 0.5 mm intervals across the weld cross-sections. As demonstrated in Figure 9a, the variations in hardness are evident along the longitudinal paths A and B, oriented perpendicular to the interface. The reference point of 0 mm is demarcated by the junction between the weathering steel weld metal and the transition-layer weld metal/base metal. As demonstrated in Figure 9b, the hardness distributions along transverse paths C and D, oriented tangential to the fusion line, are presented.
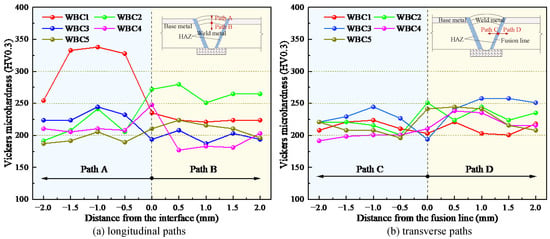
Figure 9.
Microhardness profiles across S31603/Q420qENH clad joints.
Along transverse paths C and D, the hardness of all joints fluctuates mildly within the 180–260 HV0.3 range, with no sharp peaks. In conjunction with the microstructures exhibited in Figure 4, Figure 5, Figure 6, Figure 7 and Figure 8, these paths predominantly sample the mid-thickness and heat-affected zone (HAZ) of the weathering steel weld metal. The microstructure of the area under consideration consists of ferrite, pearlite, and a small amount of granular bainite. The absence of continuous hard/brittle layers in these regions can be attributed to the relatively smooth variations in hardness along the weld length. Conversely, the hardness profiles along the longitudinal paths A and B exhibit a heightened sensitivity to the selection of welding consumables and the magnitude of heat input. For joints WBC3–WBC5, the majority of hardness values are observed to remain within the range of 170–250 HV0.3, with only minor fluctuations being evident in the vicinity of the interface. Joint WBC2 exhibits a modest increase in hardness along path B, with a peak of approximately 276 HV0.3, indicative of local strengthening but not a distinct hard band. In comparison, WBC1 displays a distinct hardness peak along path A. In the vicinity of the junction between the weathering steel base-layer weld and the transition-layer weld, the hardness increases abruptly from approximately 250 HV0.3 to nearly 350 HV0.3, thereby exposing a narrow, band-like local hard zone.
Given the 0.5 mm spacing between adjacent indentations, such line scans may not fully capture the extreme values associated with very narrow hard regions. In order to enhance the resolution of the interfacial hardness gradient, a combined hardness–microstructure mapping procedure was conducted at specific locations along the transition interface (see Figure 10 and Figure 11). In joints WBC1 and WBC3, discontinuous narrow bands of elevated hardness, with local widths exceeding 0.5 mm, are observed near the transition interface; the local hardness exceeds 320 HV0.3 and reaches up to about 377 HV0.3. These high-hardness zones have been observed to coincide with the presence of mixed-microstructure bands and regions of brittle phase enrichment. On the weathering steel side, a fine acicular or lath-like morphology is present, whereas on the stainless steel side, lath- or network-like brittle phases are enriched. In conjunction with earlier reports on analogous dissimilar-steel welds [6,13], these observations suggest the presence of martensitic-like hard layers comprising martensite and other brittle constituents. In comparison with the surrounding weld and base metal, the interfacial hardness is increased by approximately 30–50%, exhibiting a characteristic local hardening behaviour that is analogous to the local hardening zone (LHZ) defined in Reference [6]. For joints WBC2 and WBC4, which employ the lower-carbon base-layer consumable JWT60NHQ-1, the thickness of the narrow high-hardness band at the transition interface is reduced to approximately 0.2 mm, and the degree of local hardening is alleviated. In the joint WBC5, fabricated by SMAW with an average line energy in the transition and base layers approximately 20% lower than that of WBC1–WBC2, only a few isolated high-hardness points (approximately 330 HV0.3) are detected near regions II and III. It was observed that no continuous hard band was formed, and the interfacial hardness gradient was clearly smaller than in high-heat-input joints WBC1 and WBC3. This is consistent with the absence of large-scale decarburised layers, brittle-phase enrichment zones, or pronounced mixed-microstructure bands in the corresponding microstructures.
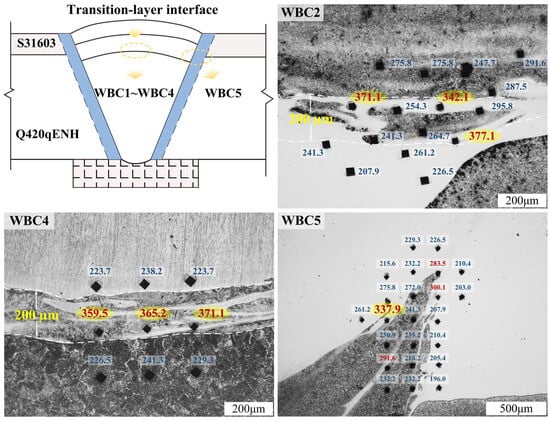
Figure 10.
Microstructure and local microhardness near the transition-layer interface in WBC2, WBC4 and WBC5 clad joints.
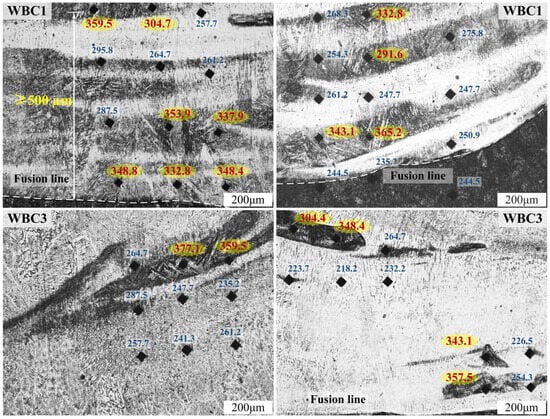
Figure 11.
Microstructure and local microhardness near the transition-layer interface in WBC1 and WBC3 clad joints.
The presence of a dissimilar fusion region is evidenced by elevated levels of hardness when compared to the surrounding weld metal and base metal. The utilisation of high-carbon base-layer consumables (w(C) ≥ 0.06%) in conjunction with a relatively high heat input has been observed to promote the formation of a “narrow but hard” local hard layer in proximity to the weathering steel–stainless steel interface. Despite the deployment of Cr–Ni-rich stainless consumable JWER309LMo in the transition layer, the interfacial hardening tendency continues to be observed. Conversely, the utilisation of low-carbon welding consumables (w(C) < 0.06%) in conjunction with the judicious modulation of heat input within the transition layer has been demonstrated to efficaciously diminish the thickness and intensity of the hard/brittle band. This, in turn, serves to mitigate its deleterious effect on the ductility and toughness of the clad joints.
3.2. Mechanical Properties
3.2.1. Tensile Coupon Test Results
In order to compare the tensile performance of the base material of the clad plate and of the welded joints produced by different procedures, uniaxial tensile tests were conducted on the clad plate, the weathering steel substrate, the stainless steel cladding, and clad joints WBC1–WBC5 using a Wance electromechanical universal testing machine (Wance Testing Machine Co., Ltd., Shenzhen, China). The corresponding failure modes and engineering stress–strain curves are shown in Figure 12. The joints WBC1 and WBC4 fractured in the base metal region, indicating that the weld metal and clad interface did not act as preferential failure sites. In contrast, joints WBC2, WBC3, and WBC5 fractured within the welded region, suggesting that the ductility of the weld metal and its adjacent zones is slightly lower than that of the base material under these conditions.
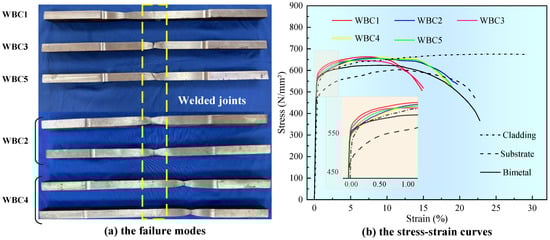
Figure 12.
The tensile test result.
The tensile parameters of the clad plate, the constituent base materials, and the five welded joints are outlined in Table 3. In this study, (Eo) denotes the initial elastic modulus, (f0.2) the 0.2% proof strength, (fu) the ultimate tensile strength, (A) the elongation after fracture, and (cf) and (Af) represent the relative changes in ultimate strength and elongation of the joints with respect to the clad plate, respectively. As demonstrated in Figure 12b, the tensile strengths of the WBC1–WBC5 joints are observed to range from 648.5 to 658.3 N/mm2. The strength difference compared to the composite steel plate base material is controlled within approximately 2.2–3.6%, thereby achieving strength matching between the joint and base material. This satisfies the requirement that the static load-bearing capacity of the welded joint should not be lower than that of the corresponding base material. In comparison with base weathering steel, welded joints demonstrate significantly higher yield strength and yield plateau; however, the strain hardening capacity after yielding is slightly reduced.
Table 3.
Tensile properties of S31603/Q420qENH clad plate and welded joints.
Conversely, the decline in weld joint ductility is more pronounced. The range of elongation after fracture of joints WBC1–WBC5 is from 20.5% to 24.6%, all lower than the 26.5% measured for the clad plate, corresponding to a reduction of approximately 7.2–22.6%. Among them, joint WBC3, a vertical-position weld with relatively high heat input, shows the lowest elongation and fails within the welded region, while joints WBC1, WBC2 (flat-position MAG welds with somewhat lower line energy), and WBC5 (SMAW joint) retain comparatively higher ductility. This finding is in alignment with the previously discussed microstructural and hardness results: the combination of elevated heat input and high-carbon base-layer consumables promotes the formation of coarse columnar grains, compositional segregation, and martensitic/brittle phase enrichment in the proximity of the weld and clad interface, accompanied by steep hardness gradients and abrupt property changes in the transition layer. During tensile loading, such regions of local degradation act as sites of strain concentration and preferential crack initiation, thereby reducing the overall plastic deformation capacity of the joints and leading to systematically lower elongation compared with the base material of the clad plate.
3.2.2. Bending Test Results
Figure 13 illustrates the fracture modes observed in the bending tests of clad joints WBC1–WBC5. Furthermore, the joints WBC2, WBC4, and WBC5 were found to be capable of being bent to 180° without any visible surface cracking, indicating that they possess adequate bending deformability. In contrast, joint WBC1 exhibited both transverse and longitudinal cracks at the junction between the weathering steel and the transition-layer weld, while joint WBC3 fractured during bending, with in-plane cracks observed at both the weathering steel–transition weld interface and the transition-layer–stainless weld interface. In order to elucidate the provenance of the bending failure in WBC1 and WBC3, the fracture surfaces from the WBC3 bend specimen were examined by SEM, and EDS point analyses were performed at representative crack locations, as demonstrated in Figure 14, Figure 15 and Figure 16.
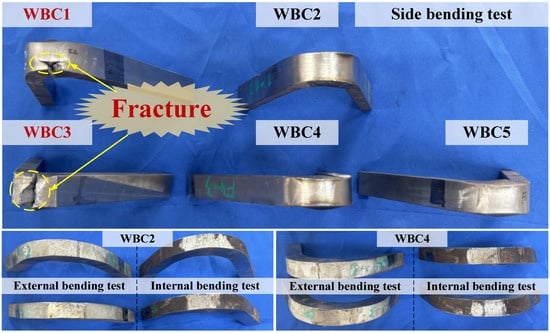
Figure 13.
Typical failure modes of the bending tests.
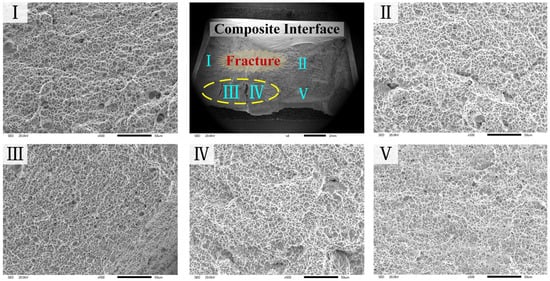
Figure 14.
SEM fractographs from different regions of the WBC3 bend specimen.
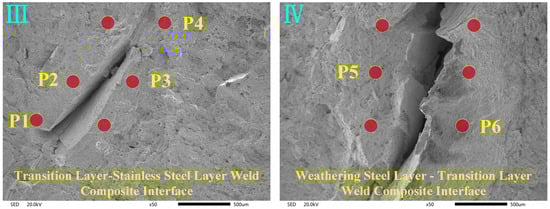
Figure 15.
SEM fractographs of fracture surfaces at the stainless steel/weathering steel clad interface.
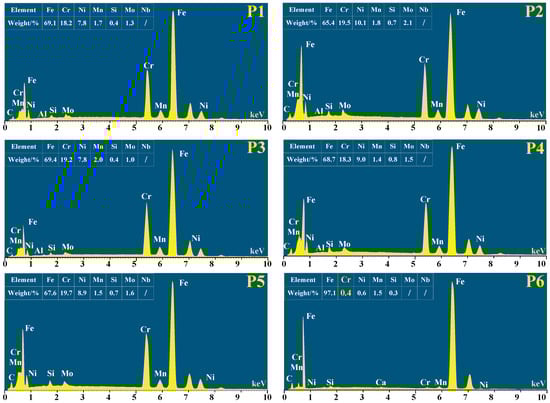
Figure 16.
EDS point analyses near cracks adjacent to the stainless steel layer in the WBC3 bend specimen.
When considered in conjunction with the Schaeffler diagram (Figure 17), it becomes apparent that the occurrence of bending failure in the joints is closely associated with the formation of martensite in the transition-layer weld metal. As demonstrated in Figure 16, the EDS results are compiled in Table 4, which lists the chromium equivalent (Creq) and nickel equivalent (Nieq) values for five representative positions (P1–P5) on the WBC3 fracture surface [28]. These values are then plotted on the Schaeffler diagram in order to evaluate the local austenite/ferrite phase balance in the transition-layer weld. The results demonstrate that regions exhibiting elevated (Creq/Nieq) ratios correspond to augmented ferrite volume fractions, thereby providing quantitative evidence for local ferritisation and ferrite/martensite composite microstructures within the interfacial region.
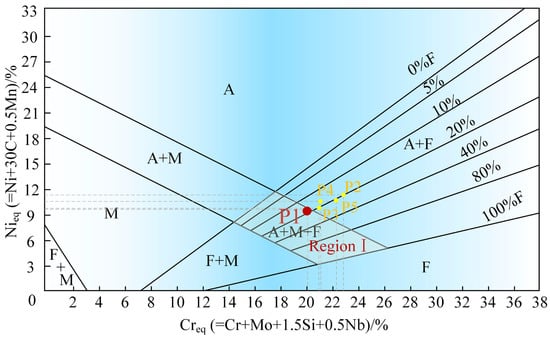
Figure 17.
Schaeffler diagram [28] with points P1–P5 near the transition-layer weld.
Table 4.
Calculated chromium and nickel equivalents (Creq, Nieq) at measurement points P1–P5.
As demonstrated in Figure 15 and Figure 16, the welding thermal cycles facilitate carbon migration from the weathering steel weld towards the transition layer, while chromium and nickel in the transition-layer weld diffuse towards the vicinity of the interface. This process gives rise to the formation of a decarburised zone and Cr/Ni-depleted regions in the proximity of the interface. These regions result in a local reduction in (C_(eq)) and (N_(eq)), accompanied by a shift in the shift points P1–P5 towards the lower-left region I on the Schaeffler diagram. Such alloy redistribution has been shown to drive the transformation of austenite into ferrite/martensite mixtures, whilst also modifying the local CCT behaviour by lowering the critical cooling rate required for martensite formation. Consequently, a martensite-enriched hard/brittle band is induced in the transition-layer weld near the interface, providing a microstructural basis for preferential crack initiation and propagation under bending loads.
During the process of bending, the initial deformation is accommodated by the relatively soft weathering steel region. However, locations exhibiting steep hardness gradients and interfacial hard layers subsequently become sites of strain concentration. The preferential nucleation of microcracks within these hard bands, and their subsequent propagation along the weathering steel–transition weld and transition-layer–stainless weld interfaces, are of particular significance. As the crack enters the surrounding ductile matrix, the fracture mechanism undergoes a progressive shift to ductile failure, governed by void nucleation and growth. This process gives rise to dimpled fracture features on the final fracture surface (Figure 14). This phenomenon, characterised by “interfacial brittle initiation followed by ductile fracture in the matrix”, serves to mask the underlying interfacial embrittlement at the macroscopic scale partially. However, it is important to note that this phenomenon is fully consistent with the previously identified local hardening zones and microstructural discontinuities.
The EDS analyses further confirm the critical role of carbide precipitation and element diffusion in interfacial embrittlement. As the base-layer consumables utilised in WBC2 and WBC4 possess a reduced carbon content (approximately 0.05 wt.% lower than in WBC1 and WBC3), the driving force for interfacial carbon migration and the propensity to form embrittled zones are substantially diminished. Consequently, no cracking or fracture was observed in these joints during the bending process. The collective influence of welding heat input, consumable chemistry, and process parameters on the martensite fraction and local hardening in the transition layer and interfacial region of the clad joints has been demonstrated to govern their bending deformability and failure modes.
3.2.3. Impact Test Results
As illustrated in Figure 18a, the absorbed impact energy of the weld metal region for joints WBC1–WBC5 is presented. The weld impact energies of WBC1 and WBC2 are in the range of approximately 80–110 J, whereas those of WBC3, WBC4, and WBC5 are significantly reduced to about 60 J, indicating a marked deterioration of low-temperature toughness in the weld region for the vertical-position and SMAW conditions. In the case of WBC3 and WBC4, this behaviour is principally ascribed to the reduced welding speed and elevated line energy inherent to vertical-position welding. These factors serve to augment the welding heat input, decelerate cooling in the weld region, encourage grain coarsening and the formation of brittle microstructures, and consequently diminish the impact energy absorption. As illustrated in Figure 18b, the impact performance of the heat-affected zone (HAZ) is demonstrated. The HAZ impact energies of WBC1 and WBC2 are relatively stable, with values falling within the range of 60–80 J. In contrast, the energies of WBC3, WBC4, and WBC5 exhibit a greater degree of variation, with values ranging from 120 to 180 J. This pronounced variation can be attributed to the influence of welding heat input and process parameters on the local cooling conditions and microstructural heterogeneity in the HAZ. Consequently, differences in toughness are observed.
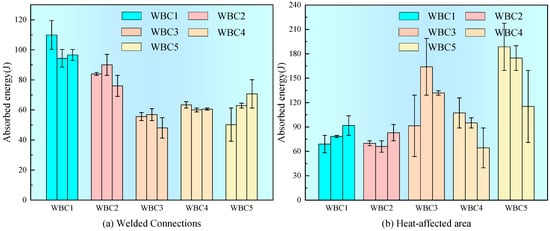
Figure 18.
Charpy impact energy of welded joints and heat-affected zones.
4. Numerical Simulations
4.1. Calculation of Continuous Cooling Transformation (CCT) Curves
Based on the aforementioned microstructure, hardness, and mechanical property test results, this section constructs a numerical model of welding thermal cycles based on the material’s CCT curve. This model aims to quantitatively explain the formation and evolution of hard/brittle layers (HBLs) at the composite interface from a thermo-metallurgical perspective and provide a basis for optimising process parameters. It analyses the microstructural evolution at the composite interface of stainless steel composite plates under different welding heat inputs and filler metal conditions. In accordance with the thermodynamic principles of the calculated phase diagram method, it is hypothesised that each stage of the welding transformation will satisfy two equilibrium conditions. It is predicted that the total Gibbs free energy (G) of the system will attain a minimum value (Gmin), and it is hypothesised that the chemical potential of any component (i) will be identical in all coexisting phases. During the heating stage of the welding process, the initial microstructure of Q420qENH steel undergoes progressive transformation into austenite. In the subsequent cooling stage, the undercooled austenite undergoes decomposition into a range of transformation products. Consequently, the microstructural calculations are divided into two stages: austenitisation during heating and decomposition during cooling. The austenite start and finish temperatures, (A1) and (A3), are evaluated using the empirical relations given in Equations (1) and (2) [29], where (w(M)) denotes the mass fraction (wt.%) of element (M).
As demonstrated in Figure 19 and Figure 20, the CCT diagrams of Q420qENH steel and three base-layer consumables (J557NHQ, JWT60NHQ, and JWT60NHQ-1) were obtained using the methods reported in [30,31], based on the calculated phase diagram and the transformation theory. The results indicate that Q420qENH steel and its weld metals exhibit distinct post-weld microstructures as a function of cooling rate. When the cooling rate is below 1 °C/s, the microstructure consists primarily of ferrite, pearlite, and bainite; for intermediate cooling rates of 1–10 °C/s, ferrite–bainite mixtures are predominant. As the cooling rate is increased further to approximately 20 °C/s, the higher-carbon consumable JWT60NHQ (w(C) = 0.06%) is the first to form martensite, as illustrated in Figure 20b. In contrast, the lower-carbon consumables J557NHQ and JWT60NHQ-1 (w(C) < 0.06%) do not begin to form martensite until cooling rates reach approximately 90 °C/s. For the more highly alloyed Q420qENH base steel, the onset of martensitic transformation requires cooling rates of the order of 100 °C/s, highlighting its greater resistance to martensite formation during welding thermal cycles.
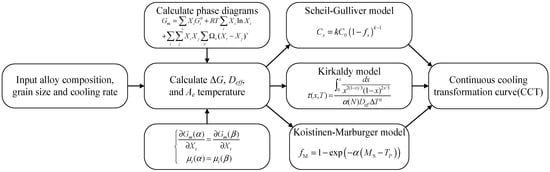
Figure 19.
Procedure for continuous cooling transformation (CCT) curve calculation.
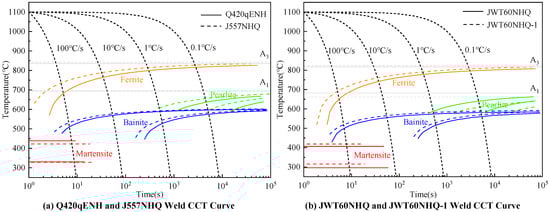
Figure 20.
Continuous cooling transformation (CCT) diagrams for Q420qENH steel and base-layer weld metals.
4.2. Numerical Simulation Analysis of Composite Interface Welding
4.2.1. Governing Equations and Modelling Assumptions
The numerical simulations of the welding process at the stainless steel–weathering steel clad interface were conducted on the basis of the CCT diagrams in Figure 20. The aim of the study was to clarify the evolution of the interfacial hard/brittle layers under different heat inputs and welding consumable conditions. In the process of welding, the temperature field undergoes a progression in accordance with the movement of the heat source, manifesting a markedly nonlinear distribution within the joint region. This phenomenon can be delineated by the transient heat conduction equation given below:
In this equation, ρ is the material density, c represents the specific heat capacity, λ is the thermal conductivity, T is the temperature, and Qc is the volumetric internal heat source.
The welding heat input is modelled using the well-established double-ellipsoidal heat source proposed by Goldak et al. [32], as illustrated in Figure 21. In the welding direction, the double ellipsoid is divided into front and rear zones, with corresponding heat source power densities (Q1) and (Q2). The instantaneous heat flux density at any point within the volume of the heat source can be expressed as:
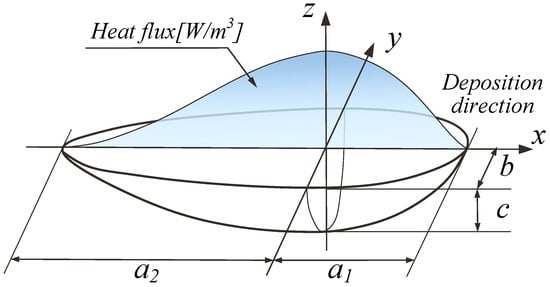
Figure 21.
Schematic of the double-ellipsoidal heat source model.
In this model, Q1 and Q2 denote the volumetric heat flux densities in the front and rear ellipsoids, respectively, while a1, a2, b, and c are the characteristic dimensions governing the heat source distribution in the travel, width, and depth directions. Q is defined as the effective heat input, whilst eta is defined as the arc efficiency. In the context of the CO2 gas metal arc welding process under consideration, the arc efficiency is assumed to be equivalent to 0.75 times the theoretical value, as indicated by the equation in the Reference. The parameters (U) and (I) represent the arc voltage and current, respectively. The parameters f1 and f2 represent the power fractions assigned to the front and rear ellipsoids, and are both set to 1.0 in this study.
The phenomenon of convective heat transfer at the surface of the workpiece is described by Newton’s law of cooling [33], which can be expressed as follows:
In this equation, qe denotes the convective heat flux between the weld and the surrounding environment, ha is the convective heat transfer coefficient, Ta is the weld surface temperature, and Tb is the ambient temperature.
The transfer of radiative heat between the weld surface and its environment is described using the Stefan–Boltzmann law [33], which can be expressed as:
In this equation, qf denotes the radiative heat loss from the workpiece, σ is the Stefan–Boltzmann constant (σ = 5.67 × 10⁻⁸ W∙m−2∙°C−4), and ε is the surface emissivity.
In the finite element simulation of the welding temperature field, the nonlinear thermal properties of the materials have a significant influence on the accuracy of the results. In this study, a material property database/software was utilised to obtain the temperature-dependent specific heat capacity and thermal conductivity of austenite, ferrite, pearlite, bainite, and martensite in both the base metal and weld metal. The latent heat of fusion for the base and weld metals was set to 256.4 J·g−1, and the solidus and liquidus temperatures were taken as 1450 °C and 1500 °C, respectively. Through a process of trial and error, the convective heat transfer coefficient was determined to be 6.5 W·m−2·K−1, and the surface emissivity was set to 0.7 by fitting simulated temperature–time cooling curves to experimental measurements.
In the welding simulations, the microstructural evolution of the base metal and weld metal was divided into two stages: heating and cooling. In the context of the heating process, a simplified austenitisation model was employed, predicated on the assumption that complete transformation to austenite would occur once the temperature attained the designated level (A3). In the course of the cooling process, consideration was given to both diffusional and diffusionless transformations. The isothermal diffusional transformation of undercooled austenite was described using the Johnson–Mehl–Avrami–Kolmogorov (JMAK) equation [34]:
In the equation, f represents the phase volume fraction; l indicates ferrite (F) or bainite (B); t represents the time during which the phase transformation occurs; K and n are material parameters in the kinetic equation, which depend on temperature, austenite grain size, and chemical composition.
In the absence of atomic diffusion, the undercooled austenite undergoes a transformation into martensite through a process of lattice rearrangement, as opposed to atomic diffusion. The diffusionless martensitic transformation was characterised using the Koistinen–Marburger model. The volume fraction of the resulting martensite (fM) is typically calculated using the K-M equation, as demonstrated in Equation (10):
In the equation, Ms is the temperature at which martensite begins to transform, Tp is the temperature during the phase transformation, and α is the material constant.
4.2.2. Heat Source Parameter Calibration
In order to ensure that the heat input prescribed in the welding simulations is consistent with the actual melt-pool geometry, and thereby improve the reliability of the thermal cycles and subsequent CCT-based mapping at the clad interface, eight MAG welding trials (H1–H8) were designed using test plates (procedure shown in Figure 22). The filler metal employed in this instance was JWER309LMo stainless steel wire, with the substrate being the Q420qENH weathering steel of the stainless steel–weathering steel clad plate. The welding current, voltage, travel speed, preheating temperature, line energy, and the measured weld pool width (w) and penetration depth (d) for each condition are summarised in Table 5. The welding speed was maintained within a narrow range of 6.1–6.8 mm/s, while the heat input spanned 390.8–995.9 J/mm. This enabled the molten pool size to vary across a broad range, thereby providing ample data support for subsequent heat source parameter calibration and sensitivity analysis. A decrease in heat input resulted in a reduction in pool width and penetration, while an increase in heat input led to a substantial enlargement of the pool. This observation confirms the significant sensitivity of melt-pool geometry to energy input per unit length.
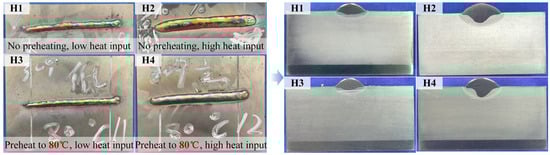
Figure 22.
Welding procedure and specimen configuration for H1–H4 test plates.
Table 5.
Welding parameters and melt pool geometry for H1–H8 tests.
For the purposes of heat-source calibration, the weld pool width (w) and penetration depth (d) were identified as the primary observable target quantities. The experimental data presented in Table 5 were then utilised to establish a quantitative mapping between pool geometry and process parameters. Specifically, a multivariate regression of (w) and (d) against welding heat input (E) and travel speed (v) yielded the empirical correlations given in Equation (11), with the coefficients determined by least-squares fitting. In this study, (w) and (d) represent the weld pool width and penetration depth (mm), respectively. The symbol (E) is used to denote the welding heat input (J/mm), and (v) is used to denote the welding speed (mm/s). These relations enable rapid prediction of the target pool geometry for prescribed (E) and (v) in the numerical simulations, and iterative adjustment of the double-ellipsoidal heat-source parameters until the simulated pool profile agrees with the experimental measurements. It is on this basis that a simplified numerical model is employed for the systematic evaluation of the temperature field and (T8/5) cooling histories over a range of heat inputs. This provides reliable heat-source inputs and boundary conditions for the finite-element model development and thermo-metallurgical analysis of the clad interface in Section 4.3.
4.2.3. Numerical Simulation Results
In order to ensure accurate evaluation of the (T8/5) cooling rate in the welding simulations, a simplified numerical model (Figure 23) was constructed by incorporating the variation in weld pool dimensions with heat input based on Equation (11). The model was employed to illustrate the characteristic thermal cycles and phase transformations in the vicinity of the clad interface. The numerical results demonstrate a pronounced influence of heat input on the thermal history and microstructural evolution. As demonstrated in Figure 24 and Figure 25, an increase in heat input from 431.25 J/mm to 669.38 J/mm results in a substantial decrease in the (T8/5) cooling rate, from 151.0 °C/s to 88.3 °C/s. Concurrently, the martensite fraction is reduced from approximately 49% to around 25%, while the apparent width of the martensitic layer increases from 1.01 mm to 2.19 mm.
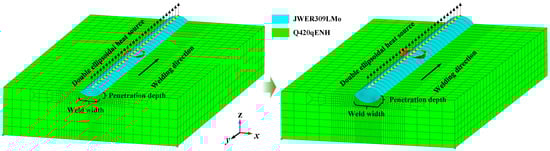
Figure 23.
Finite element model of the transition layer in clad joints.
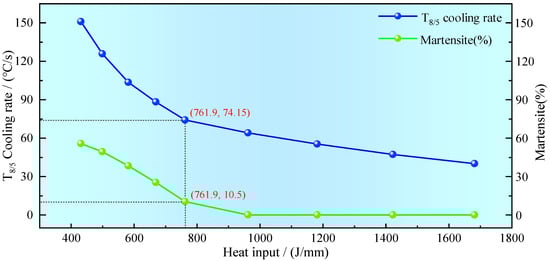
Figure 24.
Effect of welding heat input on T8/5 cooling rate and martensite fraction near the clad interface.
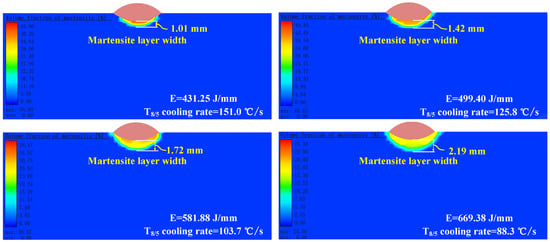
Figure 25.
Welding heat input versus martensite fraction and hard/brittle layers width in the interfacial HAZ.
This “wider but softer” evolution is indicative of a dual effect of heat input on the transformation domain. It has been demonstrated that an increase in the input of heat results in an enlargement of the fully austenitised region above (A3). Concurrently, the cooling rates decrease below the critical rate for martensitic transformation over the majority of this volume. This results in a shift in the transformation pathway towards ferrite/bainite, with only a limited contribution from martensite—consequently, a broadened graded layer comprising martensite and ferrite/bainite forms adjacent to the interface. In comparison with the narrow, highly hard martensitic band produced under low heat input, this wider and more gradual gradient layer serves to mitigate hardness jumps and stress concentration, thereby reducing the risk of cold cracking while maintaining a more favourable balance between strength and toughness in the clad joint.
In the process of welding austenitic stainless steel, harmful precipitation phases are typically suppressed through the implementation of high cooling rates. The present study demonstrates that moderately increasing heat input can effectively reduce cooling rates, inhibit martensite formation, and promote the generation of bainite and ferrite with higher toughness. This, in turn, improves the toughness of welded joints. However, it is important to note that excessively high heat input or overly slow cooling may result in brittle phase precipitation or excessive soft phase formation, thereby compromising the weld joint’s strength. Consequently, the setting of the heat input for the transition layer is not merely a matter of selecting process parameters; it is a critical step in controlling interfacial microstructure and service performance, requiring a precise balance between “suppressing martensite” and “avoiding detrimental microstructures.” In order to achieve this objective, it is necessary to employ both CCT curve analysis and numerical simulation of welding thermal cycles. This will allow the prediction of phase transformation pathways and microstructural distribution under varying heat inputs. This enables the identification of an optimal heat input window within the process space that maximises the strength–toughness balance.
The findings of the investigation, as presented in Table 2 and Figure 24, indicate that the recommended heat input range for this study is 761.9–990.0 J/mm. This range corresponds to an intermediate (T8/5) cooling rate that markedly reduces the martensite fraction, mitigates interfacial brittleness and cold-cracking susceptibility, and promotes the development of a sufficiently wide, smoothly graded transition layer that relaxes local stress concentrations. Concurrently, it circumvents the undesirable consequence of excessive deceleration of the cooling process, which may otherwise promote Cr-rich brittle precipitates and adversely affect the local metallurgical stability on the stainless-steel side. This optimised heat-input window thus provides a process guideline with practical application for balancing strength and toughness performance in stainless steel–weathering steel clad joints.
4.3. Regulatory Mechanism of Hard/Brittle Layers
As demonstrated in Figure 26, the mechanism by which welding heat input and low-carbon welding consumables regulate HBLs is revealed based on the combined results of experimental and numerical validation studies. In conventional welding conditions, the transition-layer weld is characterised by high carbon activity and relatively rapid cooling. This results in carbon atoms migrating towards the fusion boundary and becoming enriched on the transition-layer side. This process is accompanied by cross-interface diffusion of chromium and iron. This chemical redistribution has been shown to promote the martensitic transformation in the adjacent heat-affected zone and the precipitation of Cr-enriched carbides. These processes result in the formation of relatively thick and quasi-continuous hard/brittle layers in the proximity of the clad interface. Such a layer has been shown to induce pronounced hardness mismatch and degrade interfacial toughness. Furthermore, the consumption of chromium by carbide precipitation generates locally Cr-depleted regions, which may compromise the local chemical homogeneity and interfacial stability of the clad joint.
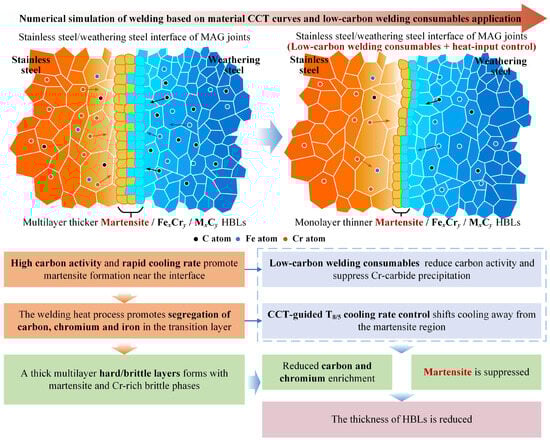
Figure 26.
Mechanism for regulating HBLs via heat input and low-carbon filler metals.
In the context of austenitic stainless steel consumables utilised within the transition layer, exposure to temperatures within the sensitisation temperature range of approximately 500 to 750 °C has been demonstrated to promote the precipitation of Cr-rich M23C6 carbides along grain boundaries [35,36,37]. This process has been shown to result in the formation of chromium-depleted zones in their vicinity. It is therefore imperative to regulate both the carbon supply to the interface and the residence time within this sensitisation window in order to preserve microstructural stability and mechanical integrity.
Conversely, the utilisation of low-carbon base welding consumables in conjunction with precise heat input control has been demonstrated to effectively reduce carbon activity at the interface. Concurrently, by modifying the thermal cycle, the cooling trajectory is diverted from the martensitic transformation zone. Consequently, the processes of C-Cr enrichment and M23C6 precipitation are suppressed, whilst excessive martensite formation is markedly alleviated. The interface evolves into thinner, more discontinuous hard/brittle layers, with a smoother microstructural gradient across the transition zone. The efficacy of this graded structure in mitigating local stress concentration and crack-initiation sensitivity has been demonstrated, thereby providing a clear metallurgical basis for improving interfacial toughness in stainless steel–weathering steel clad joints.
5. Conclusions
The present study investigates welded joints of S31603/Q420qENH stainless steel clad plates. The formation mechanism of the hard/brittle interfacial layer and its process-control strategies have been elucidated by combining welding experiments, microstructural characterisation, mechanical testing, and CCT-based numerical simulations. By integrating CCT-informed phase transformation pathways with experimentally validated interfacial microstructure and failure mapping, the work establishes a mechanistic and quantitative process window for suppressing hard or brittle layers while maintaining joint performance. The primary conclusions that can be drawn from this analysis are as follows:
(1) Within the investigated welding conditions and joint matrix, the carbon content of the base-layer filler metal exhibits the strongest correlation with the tendency for interfacial hard/brittle layers to form and the resulting hardness gradient. High-carbon welding consumables (w(C) ≥ 0.06%) readily promote the accumulation of martensite and Cr-enriched, carbide-related hard phases near the interface, creating a distinct localised hard band. In contrast, low-carbon welding consumables (w(C) < 0.06%) reduce interfacial carbon activity, suppressing C–Cr segregation and M23C6 precipitation. It should be noted that the interfacial microstructure is also influenced by the combined effects of the welding process and position, which impact heat input, thermal cycles and local dilution or mixing. Thus, the above statement reflects the evidence observed under the present experimental design, rather than claiming universal dominance. Accordingly, the base-layer carbon level can be regarded as a practical lever for compositionally regulating the chemical driving force for interfacial enrichment and the resulting hard-phase topology, when considered alongside the associated thermal-cycle conditions.
(2) It has been demonstrated that the heat input of the transition layer exerts a significant influence on the interfacial transformation mode, with the T8/5 cooling path being a crucial factor in this process. Increasing the heat input results in a decrease in the T8/5 cooling rate and a reduction in the martensite fraction. Concurrently, the interface evolves from a narrow, hard band to a smoother, graded transition layer. This process serves to alleviate hardness mismatch and reduce crack sensitivity. Mechanistically, the thermal cycle shifts the transformation trajectory away from the martensitic domain predicted by the CCT analysis, thereby favouring a more gradual microstructural gradient near the interface.
(3) The hard/brittle layers (HBLs) at the transition interface are the main weak zone that causes bending failure in composite steel plates. Bending tests reveal that cracks primarily initiate and propagate along localised hardening zones near the ‘weathering steel–transition layer’ and ‘transition layer–stainless steel layer’ interfaces. The macroscopic fracture pattern is highly consistent with the spatial distribution of HBLs at these interfaces. This consistency provides direct evidence linking the HBLs’ morphology and hardness discontinuity to damage localisation and crack path selection in service-relevant bending.
(4) Based on the results of microstructural evolution, hardness distribution, mechanical properties and numerical simulations, it is recommended that low-carbon welding consumables (w(C) < 0.06%) are used for the base layer of composite steel plates. Additionally, the heat input during transition-layer welding should be controlled within the process window of 761.9–990.0 J/mm. Under the investigated welding conditions, this combined approach is associated with a reduced tendency for HBL formation and moderated hardness mismatch across the interface. This contributes to an improved strength–toughness balance in the welded joints of stainless steel composite plates. However, it should be noted that the welding process and position may alter the thermal cycle and local dilution or mixing behaviour. Therefore, the recommended window should be interpreted in conjunction with the corresponding process route and thermal-cycle characteristics.
Author Contributions
F.F.: Writing—original draft, Methodology, Investigation. Y.F.: Writing—review and editing, Visualisation, Validation, Supervision, Resources, Methodology, Funding acquisition, Conceptualisation. J.J.: Writing—original draft, Methodology. All authors have read and agreed to the published version of the manuscript.
Funding
This study was supported by the National Key R&D Program of the 14th Five-Year Plan (Project No. 2022YFB3706400) and MCC Group’s Major Non-Steel R&D Projects (Project No. YZJ2024181-1-RZ). The authors would like to express their gratitude for the support.
Data Availability Statement
Data will be made available on request.
Conflicts of Interest
Authors Fei Feng and Yanqing Fu were employed by the company Central Research Institute of Building and Construction Co., Ltd., MCC Group. The remaining authors declare that the research was conducted in the absence of any commercial or financial relationships that could be construed as a potential conflict of interest.
References
- Tang, K.; Zhang, Q.; Cui, C. Corrosion Morphology Evolution and Numerical Modeling of Q500qENH Weathering Steel Welds under Salt-Spray Exposure. Corros. Sci. 2025, 251, 112908. [Google Scholar] [CrossRef]
- Tang, K.; Cui, C.; Li, Y.; Yang, Y. Investigation of Fatigue Damage Evolution Mechanism in Q500qENH Weathering Steel Welded Joints with Corroded Surface Morphology. Int. J. Fatigue 2025, 200, 109116. [Google Scholar] [CrossRef]
- SH/T 3527-2009; Specification for Welding of Stainless Clad Steel in the Petrochemical Industry. China Petrochemical Press: Beijing, China, 2009.
- GB/T 13148-2008; Technical Requirements for Welding of Stainless Clad Steel Plates. Standards Press of China: Beijing, China, 2008. (In Chinese)
- Ul-Hamid, A.; Tawancy, H.M.; Abbas, N.M. Failure of Weld Joints between Carbon Steel Pipe and 304 Stainless Steel Elbows. Eng. Fail. Anal. 2005, 12, 181–191. [Google Scholar] [CrossRef]
- Li, C.; Qin, G.; Tang, Y. Microstructures and Mechanical Properties of Stainless Steel Clad Plate Joint with Diverse Filler Metals. J. Mater. Res. Technol. 2020, 9, 2522–2534. [Google Scholar] [CrossRef]
- Wang, S.-G.; Dong, G.-P.; Ma, Q.-H. Welding of Duplex Stainless Steel Composite Plate: Influence on Microstructural Development. Mater. Manuf. Process. 2009, 24, 1383–1388. [Google Scholar] [CrossRef]
- Li, G.F.; Congleton, J. Stress Corrosion Cracking of a Low Alloy Steel to Stainless Steel Transition Weld in PWR Primary Waters at 292 °C. Corros. Sci. 2000, 42, 1005–1021. [Google Scholar] [CrossRef]
- Srinivasan, P.B.; Muthupandi, V.; Dietzel, W. Microstructure and Corrosion Behavior of Shielded Metal Arc-Welded Dissimilar Joints Comprising Duplex Stainless Steel and Low Alloy Steel. J. Mater. Eng. Perform. 2006, 15, 758–764. [Google Scholar] [CrossRef]
- Pan, C.; Hu, L.; Li, Z. Microstructural Features of Dissimilar MMC/AISI 304 Stainless Steel Friction Joints. J. Mater. Sci. 1996, 31, 3667–3674. [Google Scholar] [CrossRef]
- Li, G.F.; Charles, E.A.; Congleton, J. Effect of Post Weld Heat Treatment on Stress Corrosion Cracking of a Low Alloy Steel to Stainless Steel Transition Weld. Corros. Sci. 2001, 43, 1963–1983. [Google Scholar] [CrossRef]
- Wang, Q. Application of CO2 Are Welding with Flux Cored Wire to Stainless Clad Steel Pressure Vessel. Weld. Join. 2002, 6, 24–26. [Google Scholar]
- Ban, H.; Yang, X.; Shi, Y. Micro-Macro Properties of Stainless-Clad Bimetallic Steel Welded Connections with Different Configurations. J. Constr. Steel Res. 2024, 217, 108637. [Google Scholar] [CrossRef]
- Li, L.; Xiao, J.; Han, B.; Wang, X. Microstructure and Mechanical Properties of Welded Joints of L415/316L Bimetal Composite Pipe Using Post Internal-Welding Process. Int. J. Press. Vessel. Pip. 2020, 179, 104026. [Google Scholar] [CrossRef]
- Zhu, M.; Wu, W.; Qian, W. A Brief Review on Welding of Stainless Steel Clad Plates: Issues and Future Perspectives. Int. J. Adv. Manuf. Technol. 2021, 115, 49–59. [Google Scholar] [CrossRef]
- Rathod, D.W.; Singh, R.K.R.; Pandey, S. Influence of Graded Compositions and Carbon Diffusivities in Buttering on Structural Integrity of Dissimilar Metal Welds. Mater. Ence Eng. A 2017, 702, 289–300. [Google Scholar] [CrossRef]
- Wu, Q.; Xu, Q.; Jiang, Y. Effect of Carbon Migration on Mechanical Properties of Dissimilar Weld Joint. Eng. Fail. Anal. 2020, 117, 104935. [Google Scholar] [CrossRef]
- Rozmus-Górnikowska, M.; Blicharski, M. TEM Microstructure and Chemical Composition of Transition Zone Between Steel Tube and An Inconel 625 Weld Overlay Coating Produced by CMT Method. Arch. Metall. Mater. 2017, 62, 787–793. [Google Scholar] [CrossRef]
- Wang, L.; Zhao, P.; Pan, J. Investigation on Microstructure and Mechanical Properties of Double-Sided Synchronous TIP TIG Arc Butt Welded Duplex Stainless Steel. Int. J. Adv. Manuf. Technol. 2021, 112, 303–312. [Google Scholar] [CrossRef]
- Di, X.; Zhong, Z.; Deng, C. Microstructural Evolution of Transition Zone of Clad X70 with Duplex Stainless Steel. Mater. Des. 2016, 95, 231–236. [Google Scholar] [CrossRef]
- Eghlimi, A.; Shamanian, M.; Raeissi, K. Effect of Current Type on Microstructure and Corrosion Resistance of Super Duplex Stainless Steel Claddings Produced by the Gas Tungsten Arc Welding Process. Surf. Coat. Technol. 2014, 244, 45–51. [Google Scholar] [CrossRef]
- GB/T 13298-2015; Inspection Methods of Metallic Microstructure. Standards Press of China: Beijing, China, 2015. (In Chinese)
- ISO 6507-1:2018; Metallic Materials—Vickers Hardness Test—Part 1: Test Method. ISO: Geneva, Switzerland, 2018.
- GB/T 228.1-2021; Metallic Materials—Tensile Testing—Part 1: Method of Test at Ambient Temperature. China Standards Press: Beijing, China, 2021. (In Chinese)
- ISO 6892-1:2019; Metallic Materials—Tensile Testing—Part 1: Method of Test at Room Temperature. ISO: Geneva, Switzerland, 2019.
- GB/T 16957-2012; Clad Steel Plates—Mechanical Technical Tests on Welded Joints. China Standards Press: Beijing, China, 2012. (In Chinese)
- ISO 5173:2009; Destructive Tests on Welds in Metallic Materials—Bend Tests. ISO: Geneva, Switzerland, 2009.
- Schaeffler, A.L. Constitution Diagram for Stainless Steel Weld Metal. Met. Prog. 1949, 56, 680. [Google Scholar]
- Watt, D.F.; Coon, L.; Bibby, M. An Algorithm for Modelling Microstructural Development in Weld Heat-Affected Zones (Part a) Reaction Kinetics. Acta Metall. 1988, 36, 3029–3035. [Google Scholar] [CrossRef]
- Saunders, N.; Guo, Z.; Li, X. The Calculation of TTT and CCT Diagrams for General Steels; JMatPro Sente Software Ltd.: Surrey, UK, 2004. [Google Scholar]
- Schillé, J.-P.; Guo, Z.; Saunders, N. Modeling Phase Transformations and Material Properties Critical to Processing Simulation of Steels. Mater. Manuf. Process. 2011, 26, 137–143. [Google Scholar] [CrossRef]
- Goldak, J.A.; Akhlaghi, M. Computational Welding Mechanics; Springer: New York, NY, USA, 2014. [Google Scholar]
- Long, H.; Xi-Feng, Y.; Suo, L. Study on Computational Prediction about Microstructure and Hardness of Q345 Steel Welded Joint Based on SH-CCT Diagram. Acta Metall. Sin. 2021, 57, 1073–1086. [Google Scholar]
- Shahriari, B.; Vafaei, R.; Sharifi, E.M. Continuous Cooling Transformation Behavior and the Kinetics of Bainite Formation in a Bainitic–Martensitic Steel. Int. J. Mater. Res. 2017, 108, 715–724. [Google Scholar] [CrossRef]
- Irena, V.; Petr, J.; Zdeněk, J. Corrosion Fatigue of Austenitic Stainless Steels for Nuclear Power Engineering. Metals 2016, 6, 319. [Google Scholar] [CrossRef]
- Lin, S.X.; Bao, W.K.; Gao, J. Intergranular Corrosion of Austenitic Stainless Steel. Appl. Mech. Mater. 2012, 229–231, 14–17. [Google Scholar] [CrossRef]
- Shimada, M.; Kokawa, H.; Wang, Z.J. Optimization of Grain Boundary Character Distribution for Intergranular Corrosion Resistant 304 Stainless Steel by Twin-Induced Grain Boundary Engineering. Acta Mater. 2002, 50, 2331–2341. [Google Scholar] [CrossRef]


Disclaimer/Publisher’s Note: The statements, opinions and data contained in all publications are solely those of the individual author(s) and contributor(s) and not of MDPI and/or the editor(s). MDPI and/or the editor(s) disclaim responsibility for any injury to people or property resulting from any ideas, methods, instructions or products referred to in the content. |
© 2026 by the authors. Licensee MDPI, Basel, Switzerland. This article is an open access article distributed under the terms and conditions of the Creative Commons Attribution (CC BY) license.