Abstract
Comprehensive design thinking is vital for architects to resolve spatial conflicts in architectural design. To address the limitations of traditional brainstorming (TB) in complex constraint scenarios, this study proposes a cognitive science-based semantic network simulation (SN) method. A controlled experiment was conducted with 60 architecture students randomly divided into SN and TB groups, tasked with solving the same rural cultural center entrance design conflict within 10 min, with eye-tracking monitoring subconscious thinking. Multi-dimensional evaluation shows TB generates more proposals, but SN outperforms TB in innovation, conflict resolution, and thought explicitness. For architects, SN provides a structured thinking tool: decompose design conflicts into nodes, establish logical connections, and generate innovative solutions through cross-domain association. The findings offer actionable methods for architectural design practice and education, helping break the “function–innovation–efficiency” trade-off.
1. Introduction
The resolution of spatial conflicts in architectural design has long been a core challenge for practitioners, fundamentally stemming from the complex coupling of multiple constraints. However, with the acceleration of urbanization and increasingly sophisticated building functions, traditional design methods like brainstorming have become increasingly inadequate when addressing spatial contradictions under multiple constraints [1,2]. Particularly in high-density urban environments, when facing challenges such as intersecting circulation paths, functional conflicts, and spatial division issues, designers seem to be unable to cope effectively. Consequently, designers need to develop innovative solutions that break away from conventional approaches to tackle these contemporary challenges [3].
Existing research indicates that traditional design methodologies, particularly brainstorming-based approaches, primarily exhibit three fundamental limitations: Firstly, experience-dependent design tends to fall into mental rigidity, making it difficult to generate breakthrough solutions [4]. Secondly, creative methods like brainstorming are constrained by social inhibition effects, significantly reducing actual innovation outcomes [5]. Thirdly, current design education lacks systematic training in innovative thinking, leaving students often at a loss when confronting complex problems [6]. These limitations essentially reflect the cognitive shortcomings inherent in traditional design methodologies.
Recent breakthroughs in cognitive science have opened new avenues for addressing this challenge. Studies indicate that semantic network structures serve as the foundational support for creative thinking [7], which aligns with existing architectural design practices, such as systems thinking, concept mapping, and design rationale mapping, methods that also emphasize structured connections between design elements. In architectural design, this framework involves deconstructing spatial contradictions into actionable cognitive units and stimulating creativity through cross-domain associations [8]. However, these established practices often lack formalized operational frameworks and quantitative evaluation criteria, making it difficult to systematically measure thinking effectiveness and replicate innovation processes. Building on these existing cognitive tools, this study proposes a formalized and measurable semantic network simulation (SN) method for architectural design. Unlike conventional structured thinking methods, SN explicitly decomposes design conflicts into “nodes” and logical relationships into “edges,” integrates cross-domain association mechanisms, and establishes a quantifiable evaluation system for thought explicitness and innovation depth—filling the gap between qualitative expression and quantitative analysis in existing practices.
Based on existing research gaps, this study aims to: (1) compare the practical effects of SN and TB in architectural design conflict resolution; (2) clarify the cognitive mechanism of SN in enhancing innovation, with a focus on actionable application paths for architects; (3) provide a structured thinking tool that can be directly applied in conceptual design and conflict resolution stages.
2. Related Theoretical Research
2.1. Traditional Brainstorming in Architectural Design
Traditional creative methods have long dominated architectural design, with brainstorming being the most widely used technique. As a foundational paradigm of divergent thinking, brainstorming is rooted in the principles of delayed judgment and free creative generation proposed by Osborn, designed to alleviate social inhibition and foster psychological safety [9]. This approach aligns with visual thinking process theory and is often complemented by sketching in practice, enabling rapid spatial configuration externalization and exploration during the initial conceptual design phase [10].
Brainstorming continuously stimulates creative thinking through language and sketches within specified timeframes to inspire design ideas, as shown in Figure 1.
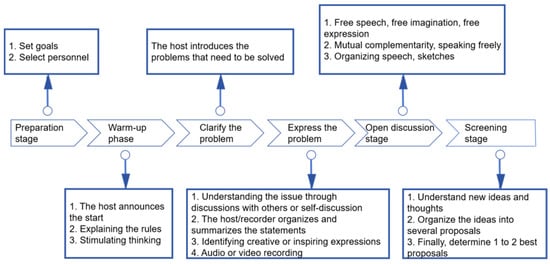
Figure 1.
Application process of brainstorming methods.
Critically, however, brainstorming suffers from inherent limitations: it predominantly yields superficial idea variations rather than transformative innovation, with a majority of generated schemes failing to resolve core design contradictions [11]; and group polarization and terminological barriers further undermine its efficacy, and its reliance on implicit cognitive processes renders creative pathways non-traceable, limiting applicability in complex, constraint-rich scenarios [12]. These flaws position brainstorming as a valuable tool for early idea divergence but inadequate as a standalone method for addressing contemporary architectural design conflicts [13].
2.2. Elements and Structure of Semantic Networks
The semantic network model is a graph—a theoretic knowledge representation framework devised to emulate human cognitive patterns, decision-making processes, and conceptual comprehension mechanisms. The nascent concept of semantic networks emerged as early as the onset of the 20th century. Charles S. Peirce proposed a structural representation approach characterized by nodes and chains [14]. By 1968, M. R. Quillan further advanced semantic networks as a framework for comprehensively explicating human cognitive processes [15]. The structural diagram is presented in Figure 2. Comprising two core elements—semantics (the profound connotations of linguistic symbols) and network topology (a structure composed of nodes and edges)—this theoretical model transforms research subjects into node sets and maps conceptual relationships as edge sets. By dynamically adjusting node–edge mappings, it characterizes object attributes and enables the flexible reconstruction of research elements and their interconnections in accordance with specific requirements.
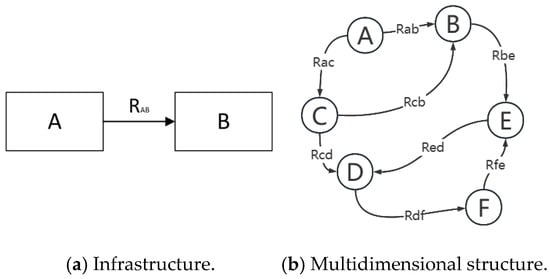
Figure 2.
Diagrams of semantic networks.
2.3. The Role and Significance of Semantic Network Simulation
Numerous alternatives exist to the structured design approach of semantic networks, including ontologies, Design Thinking Workshops (DTWs), and Analogical Reasoning Training (ART). Although numerous knowledge representation methods exist, semantic network simulation was not selected randomly. This choice was determined through targeted comparisons with other structured approaches, considering architectural design’s cognitive characteristics, conflict resolution requirements, and methodological demands in experimental research. SN’s graphical “node–edge” structure aligns with architects’ visual thinking habits, supports dynamic cross-domain association, and enables quantitative measurement of thinking processes—advantages that make it more suitable for resolving complex architectural design conflicts than other alternatives. Gero et al. (2013) confirmed that structured concept generation techniques with visual expression outperform unstructured methods in complex design tasks [16], while Yang et al. (2022) demonstrated that semantic networks’ flexible node–edge structure is more suitable for engineering design innovation than rigid ontologies [17]. With its graphical, flexible, and quantifiable core features, semantic networks serve as an ideal bridge between cognitive science theories and architectural practice. They effectively address the cognitive limitations of traditional brainstorming, provide actionable methodological support for exploring design thinking mechanisms, and act as a natural interface with computers to facilitate interdisciplinary integration between artificial intelligence and architecture [18].
For architects, a semantic network is defined as a visual thinking tool that maps design elements as “nodes” and their logical relationships as “edges.” This structure shares similarities with concept mapping (which connects conceptual elements) and design rationale mapping (which records decision-making logic), but with three distinct extensions: (1) Conflict-oriented node classification: Nodes are strictly categorized into “conflict,” “constraint,” and “solution” types, directly targeting architectural design’s core challenge of conflict resolution; (2) Dynamic cross-domain association mechanism: Explicitly guides the introduction of non-architectural domain nodes to break professional cognitive boundaries, which is less emphasized in existing methods; and (3) Quantifiable thinking evaluation: The number of effective node–logic chains and cross-domain connections provides objective metrics for thought explicitness, addressing the lack of measurability in conventional structured thinking tools.
2.4. Comparative Analysis of Two Research Methods
To clarify the differences between SN and TB, Table 1 and explanatory notes are added below, summarizing their core characteristics and working mechanisms.

Table 1.
Comparison of semantic network simulation and traditional brainstorming.
2.5. SN Simulation Step-by-Step Diagram
Table 2 links SN operations to familiar architectural design processes to reduce cognitive barriers.
Table 2.
Links in SN operations to familiar architectural design processes.
3. Materials and Methods
Building on the aforementioned findings, this study conducted an experimental investigation to better understand the impact of traditional brainstorming methods and semantic network simulation on designers’ cognitive stimulation during architectural design processes. The comparative study aimed to explore how these two approaches stimulate design capabilities in different participants during the creative thinking phase, and to investigate whether semantic network simulation can more effectively stimulate systematic innovative thinking than traditional brainstorming when resolving architectural design conflicts. This study also examined the advantages of semantic networks and their underlying cognitive mechanisms.
3.1. Experimental Tasks
The experiment task selected was a contradiction problem in the general plan design of a rural cultural center. The rural cultural center and a theater building share a 4 m wide road, with both requiring access points. While the theater serves as a key cultural facility, its shared urban road creates challenges. Establishing the cultural center’s entrance on this side would lead to issues depicted in Figure 3: traffic congestion during peak hours, overlapping movement patterns between different user groups, and contradictions between active and quiet zones. If these contradictions are not properly resolved, they could not only degrade user experience but also pose safety risks.
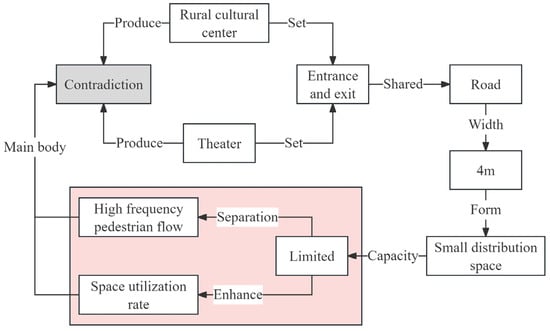
Figure 3.
Construction of a semantic network model for the design contradiction problem between the two.
Participants from the SN group and TB group were required to devise solutions to the same unknown paradoxical problem within a specified timeframe using their respective research methodologies, as detailed in Table 3. The TB group required essential sketches, whereas the SN group only needed to construct mental maps through semantic networks. The ultimate goal was to investigate the guiding and stimulating effects of both groups on design thinking through subsequent retrospective analysis.
Table 3.
The requirements of process stages and output stages for the different groups.
3.2. Experimental Design
3.2.1. Participants
Prior to data collection, we conducted a power analysis introduced by Su (2022), using experimental methods to determine the minimum sample size [20]. The calculations yielded a minimum sample size of Nmin = 27 per group. With 60 participants recruited in total (30 per experimental group), this ensured statistical power (≥0.8) and effect size (≥0.5), meeting the requirements for repeated measurements analysis of variance (RM-ANOVA) while controlling Type I/II error rates.
All participants were architecture students who had passed a basic design competency assessment, which eliminated the influence of differences in experience and educational background on experimental results, thereby enhancing the accuracy of mechanism verification. Sixty participants were randomly divided into two groups (n = 30 per group): the TB group used traditional brainstorming methods, while the SN group employed semantic network simulation. Prior to this study, informed consent was obtained from all participants, and a basic design competency test was administered to ensure homogeneity. After the experiment, two architecture experts with over a decade of experience each were invited to evaluate the participants’ design outcomes.
After completing the experiment, we invited two experts in the field of architectural design, each with more than a decade of experience in the field of architectural design, to evaluate the design results of the subjects.
3.2.2. Experimental Equipment and Environment
Figure 4 illustrates the experimental equipment and relationships between researchers and participants.
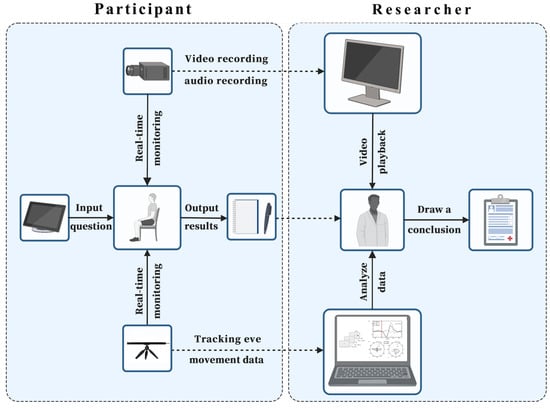
Figure 4.
The experimental association between the researchers and subjects.
First, this study uses the high-precision equipment of a telemetry eye tracker. The experiment initially employed a high-precision telemetric eye tracker system, specifically the Tobii Pro Spark model (Beijing Jinfa Technology Company, Beijing, China), with a sampling rate of 60 Hz and resolution of 0.45. Calibration of the telemetric eye tracking system was achieved by establishing a personalized mapping model between users’ ocular physiological characteristics and screen coordinates. During calibration, subjects were required to naturally fixate on sequentially displayed spatial calibration points on the screen. The system simultaneously collected eye movement data, including pupil center and corneal reflection spots, and combined this with known stimulus coordinates. Using polynomial regression algorithms, the fixation point estimation function was fitted. Upon completion of calibration, validation was typically conducted to assess spatial accuracy and precision. The eye-tracking data was collected and analyzed by the ErgoLAB Eye Tracking Module cloud platform (v3.18). Two 4 K cameras (one frontal and one side) were deployed simultaneously, operating at 60 fps with built-in audio pickup microphones. Additional materials included multiple A4-sized sheets of paper and three different colored highlighters.
The experiment was conducted in a standard cognitive laboratory (500 lux illumination, 4000 K color temperature), where the subjects sat at a 24-inch monitor (resolution 1920 × 1080) 55 cm away, and the interface of the monitor showed the design task book and tools, and the ambient noise was maintained at <40 dB.
3.2.3. Experimental Procedures
The experimental protocol specifies a total duration of 30 min per participant, consisting of three phases as illustrated in Figure 5. Phase 1: Group Formation and Training (10 min): The facilitator introduces task requirements to the two groups separately. The TB group (traditional brainstorming) is instructed to freely brainstorm ideas without evaluating feasibility, prioritizing quantity. The SN group (semantic network simulation) receives training on network theory and simulation techniques, requiring the network diagram to include core conflict nodes, constraint nodes, and solution strategy nodes.
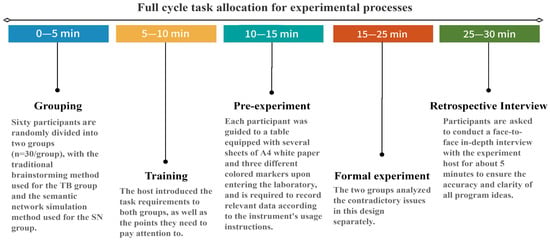
Figure 5.
Full cycle task allocation for experimental processes.
However, the SN group required additional time to learn the new theory, establish node relationships, and construct semantic network diagrams, while the TB group could directly proceed to the conceptualization and sketching phase. This disparity in task preparation time resulted in unequal effective conceptualization time between the two groups. The SN group’s actual time allocated to innovative design was compressed, violating the single-variable control principle in the control experiment and undermining the fairness of comparisons in metrics like proposal output and innovation. The identical time constraints failed to account for the cognitive difficulty differences between the two methods, further amplifying the inherent inequity. To ensure experimental fairness, an independent method pre-experiment phase was added for the SN group, with 10 min allocated to ensure both groups had mastered the methods before the formal task began.
Participants were required to devise solutions for a common unresolved problem within a 10 min timeframe, using their respective research methodologies. This time constraint was informed by prior studies [21,22,23], which demonstrated that the creative thinking process typically stabilizes after approximately 9–10 min. A 10 min window allows the designers to complete the critical workflow of “problem analysis → core concept formulation → preliminary logical validation,” effectively preventing cognitive fatigue and mental rigidity caused by prolonged deliberation. The core objective of this experiment focused on resolving architectural design conflicts rather than developing complete solutions. Participants needed only to establish the logical chain of “conflict point → constraints → solution,” without delving into construction drawing-level details. This task depth aligns perfectly with the 10 min timeframe, mirroring the practical workflow of “rapid conceptual divergence and conflict resolution” in architectural design’s early stages.
The second phase involves protocol design and data output. Upon entering the laboratory, each participant was guided to a table equipped with several A4 white papers with different colored markers. After properly installing and arranging the equipment as required, they recorded relevant data using parameters including Velocity Calculator, Merge Adjacent Fixation, and Discard Fixation Duration. These instruments precisely capture natural behavioral data, such as fixation points, blinking frequency, pupil diameter measurements, and resting-state eye movement rates. When the participants are fully prepared, the display will present this study’s experimental challenge.
Design sketches serve as visual representations of design processes and are generally recognized as meaningful creative outputs [24,25]. Participants were required to freely create sketches and semantic networks addressing the given design paradox. They were encouraged to generate multiple innovative solutions while documenting each idea with written descriptions, including the source of inspiration, design details, and any relevant insights or concepts.
During the task execution period, the device continuously records the fixation trajectory, and the experiment uses photography and recording equipment to synchronize the recording of operational behaviors, and record and mark some key events in different subjects when drawing sketches or semantic network maps, such as scheme generation or repeated revision, etc.
In the final phase, following completion of all design tasks, participants underwent a 5 min in-depth face-to-face interview with the experiment moderator. The session conducted retrospective reviews of process sketches, textual documentation, audio-visual recordings from the TB group, and structured semantic network diagrams from the SN group. Through candid sharing of their creative experiences and insights during the conceptualization phase, participants ensured the accuracy and clarity of all program ideas.
3.3. Data Measurement
3.3.1. Eye Movement Index Measurement
The ErgoLAB eye-tracking module cloud platform collects behavioral metrics, including average fixation duration, pupil diameter rate of change (PRC), and blink frequency. The average fixation duration reflects information processing depth, where the persistence and stability of fixation points indicate an individual’s attentional focus [26]. Pupil diameter PRC indicates cognitive load levels, as eye movements adapt to task complexity—higher cognitive demands result in more irregular eye movements and greater pupil fluctuations. Blink frequency reveals mental transition intensity, with individuals exhibiting frequent blinking patterns during stress or tension [27]. By systematically organizing these indicators, researchers can compare behavioral and cognitive changes across groups during different cognitive processes while ensuring authentic mental states during experimental phases.
3.3.2. Evaluation of Outcome Indicators
The evaluation of design thinking effectiveness lacks unified metrics, leading scholars to develop differentiated frameworks across multiple dimensions. For instance, Jiang Z. Q. et al. (2019) proposed divergent creativity dimensions including fluency (idea quantity), flexibility (category diversity), uniqueness (statistical rarity), and refinement (detail richness), with these indicators measured through objective quantification or subjective scoring [28]. Li, H. et al. (2024) introduced comprehensive product design dimensions, such as originality, functionality, emotional value, and alignment with design principles, requiring validation through expert evaluations and user feedback [29]. Dong M. X. et al. (2023) emphasized systematic innovation dimensions including non-obviousness, rarity, and conflict resolution capabilities, highlighting the balance between technical feasibility and market adaptability [30]. To integrate these diverse perspectives, this study proposes a three-tier evaluation system: the solution quality dimension includes functional implementation and conflict resolution; the thinking process dimension evaluates thought explicitness; and the efficiency and output dimension assesses innovation and solution output [31].
In the functional implementation level of the scheme quality, the multi-constraint weighted integration method is employed [32]. Experts establish multiple constraints, including road utilization, pedestrian-vehicle separation, unobstructed fire access routes, traffic flow efficiency, and cost control. Based on participants’ design sketches and semantic network diagrams, experts conduct standardized evaluations, with the final score calculated as the average of these scores [33].
The formula is:
This metric evaluates the satisfaction level of the i-th constraint condition, assessed by multiple experts using a 5-point Likert scale (1 = very poor, 2 = poor, 3 = moderate, 4 = good, and 5 = excellent) [34]. The constraints include, but are not limited to: road width utilization rate, pedestrian–vehicle separation efficiency, unobstructed fire access routes, daily accessibility, and emergency evacuation capacity.
Conflict resolution is determined through factor decomposition, which breaks down design conflicts into quantifiable points (e.g., pedestrian–vehicle intersections, fire lane obstructions, etc.) [35]. The proportion of this item is given by quantifying the resolution rate of conflict points [36].
The formula is:
where denotes the total number of original conflict points, and represents the resolved conflict points, assigned a value of 1. is the weight ratio of a conflict point where a part of the conflict has been resolved, but not fully resolved. It is a proportion coefficient (ranging from 0 to 1) assigned by experts based on the resolution degree of the i-th conflict, according to the participants’ proposals. If the conflict is fully resolved, = 1; if partially resolved, takes the corresponding proportion, with ∈ [0, 1]. The original conflict points include the intersection of pedestrian flow and vehicle flow, congestion during peak hours, fire channel blockage, etc., which are defined by experts.
The degree of thought explicitness at the level of the thinking process is based on the semantic network node representation theory in cognitive neuroscience [37], which is equal to the number of traceable effective cognitive concept nodes in the process record.
The formula is:
Effective conceptual nodes are defined as distinct ideas emerging from process records, encompassing functional, spatial, and technical dimensions. This metric quantifies the “explicitness” of thought processes by identifying clearly documented concepts through design documents, decision-making transcripts, semantic network diagrams, and sketches. It reflects the clarity, structural organization, and traceability of cognitive activities. Higher values indicate more refined and comprehensive thinking processes. Each conceptual node corresponds to a semantic unit in working memory, with the number of nodes directly reflecting the intensity of mental elaboration. For the TB group, cognitive nodes were systematically counted through transcription of experimental recordings, video footage, and handwritten sketches generated during the process.
Since the SN method inherently requires nodes, the fact that the SN group produced more nodes is an inevitable artifact of the experimental setting rather than a proof of cognitive advantage. Directly comparing the number of nodes between the two groups is unfair. Therefore, special emphasis is required:
- (1)
- For the SN group: Effective cognitive units = the number of logical closed loops of “conflict–constraint–solution” in semantic network nodes (instead of isolated node count), which must meet the dual criteria of “clear node attributes + complete relationship links”;
- (2)
- For the TB group: Through experimental recording transcription, sketch annotation text, and retrospective interview records, “clearly categorizable design concepts + corresponding logical explanations” are extracted as effective cognitive units. Two independent coders identified these units following the same “logical closed-loop” standard as the SN group.
To address the definition, and boundary determination of “nodes” in “thought explicitness,” we supplement the following content: a single “node” refers to the smallest cognitive unit that is independently definable, has clear attributes, and can form logical associations with other concepts, requiring semantic completeness, functional categorizability, and logical associability; synonyms or near-synonyms with identical core meanings (e.g., “pedestrian–vehicle intersection” and “pedestrian–vehicle flow overlap”) are merged into a standardized term, while expressions with contextual differences are retained, with coding consistency verified by two independent coders; and node boundaries are determined through a five-step process: extracting candidate nodes based on semantic completeness, categorizing them into different types, removing duplicates via synonym merging, eliminating isolated nodes that cannot form logical associations, and finalizing with third-party expert review.
The integration of innovation metrics in efficiency and outcome dimensions employs the two-dimensional evaluation framework from the Torrance Creative Thinking Test (TTCT) [38]. This methodology involves double-blind scoring by independent experts assessing novelty and effectiveness separately, with final scores averaged [39].
The formula is:
Among , the novelty score refers to the degree of novelty of the scheme. The scoring standard of the two indicators adopts a 5-point Likert scale, in which 1 represents very poor, 2 represents poor, 3 represents medium, 4 represents excellent, and 5 represents very excellent [40,41].
Solution output is measured by the number of valid program outputs over a given period of time [42]. The criteria for determining the effective regimen were established by experts, and the effective output of the two groups was calculated after excluding the ineffective regimen. The formula is:
3.4. Research Approach and Framework
The research route and framework of this paper are shown in Figure 6.
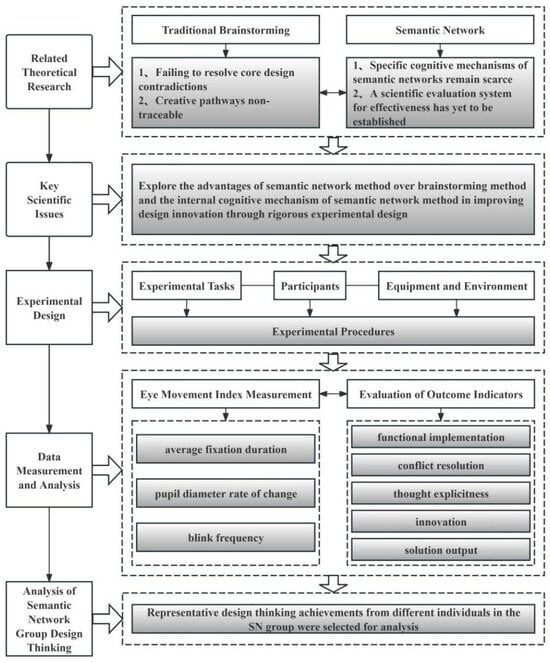
Figure 6.
Methodological scheme.
4. Experimental Results
4.1. Time Allocation of Thinking Process and Cognitive Characteristics
After the arrangement of the video and the analysis and translation of the key nodes, the thinking time allocation and corresponding cognitive characteristics of the two groups within 10 min can be summarized as follows, as shown in Table 4.
Table 4.
The allocation of thinking time and cognitive characteristics across the different groups.
The image acquisition during the two sets of comparative experiments is shown in Figure 7 and Figure 8.

Figure 7.
The experimental process image and the corresponding cognitive process of a subject in the SN group.

Figure 8.
The experimental process image and the corresponding cognitive process of a subject in the TB group.
4.2. Quantitative Analysis of Eye Movement Indicators
The mean values of all the subjects in the two groups at different times were calculated, as shown in Table 5.
Table 5.
Comparative analysis of eye movement indicators between different groups at different times.
As can be seen from Figure 9, Figure 10 and Figure 11, in the initial stage, there was no obvious difference among all indicators. At this time, both groups were engaged in common behaviors, namely, task understanding and information collection.
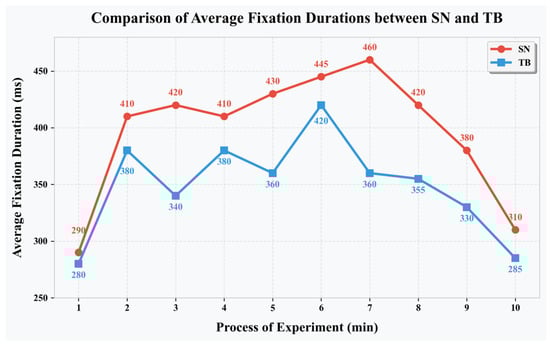
Figure 9.
Comparative analysis of the average fixation duration between the two groups.
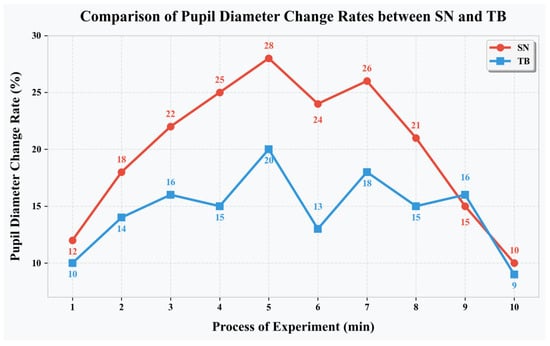
Figure 10.
Comparison analysis of the pupil diameter change rate between the two groups.
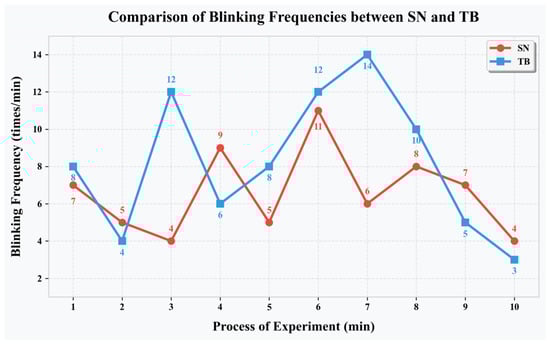
Figure 11.
Comparative analysis of the blinking frequency between the two groups.
At the second minute, the duration of the average fixation between the two groups began to differ, with SN (410 ms) > TB (380 ms), and the rate of change of pupil diameter between the two groups also began to show differences, with SN (+18%) > TB (+14%), which reflected that SN group was making higher cognitive input.
By the 3rd minute, significant differences emerged across three metrics between the two groups: average fixation duration (SN: 420 ms) > TB (340 ms); pupil dilation (SN: +22%) > (TB: +16%); and blink rate (TB: 12 times/min) > (SN: 4 times/min). This occurred because both groups entered the initial phase of mental processing after completing tasks. The SN group began analyzing conflicting elements and constructing conceptual frameworks, while the Tub group started extracting key information to draft preliminary solutions.
During the critical innovation phase at 5 min, both groups demonstrated significant differences across two metrics: average fixation duration (SN: 430 ms > TB: 360 ms) and pupil dilation (SN: +28% > TB: +20%). Notably, 87% of participants in the SN group actively constructed cross-domain networks and reorganized knowledge, while the TB group members focused on comparing existing proposals. This explains why TB’s blink rate (15 times/min) was significantly higher than SN’s (5 times/min). The analysis reveals that brainstorming sessions with repeated proposal evaluations led to increased attention dispersion and elevated blinking frequency in the group.
The average duration of fixation in both groups showed a downward trend of 6–10 min. The pupil change decreased in 5–6 min, and the video retrospect showed that both groups were tired at this time.
In the final stage, only a slight difference was observed in pupil changes between the two groups: TB (+16%) > SN (+15%). Blink frequency also showed a consistent downward trend over 8–10 min. This was because both groups had achieved a common mechanism during the design phase, which also served as standardized procedures for result solidification. Observers repeatedly checked the final protocol through the act of observation.
The SN group exhibited critical transitions at 3–4 min during node creation, marked by a sudden increase in blink frequency. The 7–8 min phase transitioned into cross-domain knowledge integration, where differences in fixation duration reappeared, but pupil changes diminished. In contrast, the TB group maintained stable fixation durations of 320–370 ms throughout most periods, except for sketching sessions, and comparative experiments at the 4th and 6th minutes. For future focus on cultivating early-stage design capabilities, a combined approach could be adopted: using the TB mode for the first 1–2 min to develop spatial intuition and rapid expression, transitioning to the SN mode during intermediate stages to establish systematic thinking and knowledge connections, and ultimately integrating both approaches to autonomously select methods based on task types for final design output.
4.3. Results of the Two Groups in Different Evaluation Dimensions
4.3.1. Test of Validity and Reliability
The three evaluation metrics—functional implementation, conflict resolution, and innovation—were assessed by multiple independent experts using a 5-point Likert scale (1 = strongly disagree, 5 = strongly agree). For thought explicitness, the number of mental nodes was quantified through direct observation of linguistic, graphical, and outcome elements during the design process, with the mean count serving as the observed value. The solution output is also a characteristic of the above. Given the distinct measurement attributes of these variables, reliability testing metrics were specifically selected. A raters’ reliability test was conducted for subjective variables (functional implementation, conflict resolution, and innovation) using the intraclass correlation coefficient (ICC). The results are presented in Table 6.
Table 6.
Results of the ICC within-group correlation.
An ICC value greater than 0.75 indicates high consistency, while a range between 0.40 and 0.75 signifies moderate consistency. The data demonstrate that expert scoring consistency can be ensured. The results show that all subjective indicators meet the basic ICC requirements, indicating good scoring consistency between the two experts, negligible subjective evaluation bias, and compliance with subsequent analytical requirements.
For objective variables (thought explicitness and solution output), a test of inter-rater reliability was conducted using Cohen’s Kappa coefficient to assess the consistency of independent counts by different researchers. The results are presented in Table 7.
Table 7.
Kappa coefficient results table.
As shown in Table 8, the KMO test indicates a value of 0.838, exceeding the 0.6 threshold, confirming the data’s validity for information extraction. The Bartlett’s test revealed a significant p-value of 0.000 ***, indicating statistical significance at the alpha level. This rejects the null hypothesis. Furthermore, all factor loadings and commonality values exceeded 0.4, demonstrating this study’s capacity to effectively capture the information.
Table 8.
Data results of KMO and Bartlett tests.
The independent sample t-test was used to study the differences between groups in five aspects: functional implementation, conflict resolution, thought explicitness, innovation, and solution output, as shown in Table 9:
Table 9.
Independent sample t-test analysis of different indicators across different groups.
4.3.2. Comparative Analysis of Functional Implementation
Functional implementation serves as a fundamental metric in design evaluation. As shown in Figure 12, there was no significant difference in functional implementation among different groups (p > 0.05), indicating consistent performance across all groups without notable variations. Both the SN group and the TB group demonstrated comparable levels in this aspect. Both groups met all mandatory constraints, such as road utilization requirements, demonstrating that the achievement of basic functionality stems from design fundamentals rather than methodological differences. This clearly shows that regardless of the thinking patterns employed, designers can consistently focus on core design tasks and effectively translate abstract goals into concrete functionalities [43,44]. Whether through systematic structuring of functional design via semantic networks or aggregating diverse functional concepts through brainstorming, both approaches ultimately meet fundamental requirements. However, the SN group exhibited smaller standard deviations due to its explicit representation of constraints through semantic networks, which mitigated the scheme fluctuations caused by the TB group’s experience gaps. While the semantic network simulation method did not enhance functional ceilings, it improved scheme stability through visualized constraints. This outcome strongly demonstrates the effectiveness and reliability of both methods in ensuring design compliance with functional baseline requirements under conventional design scenarios.
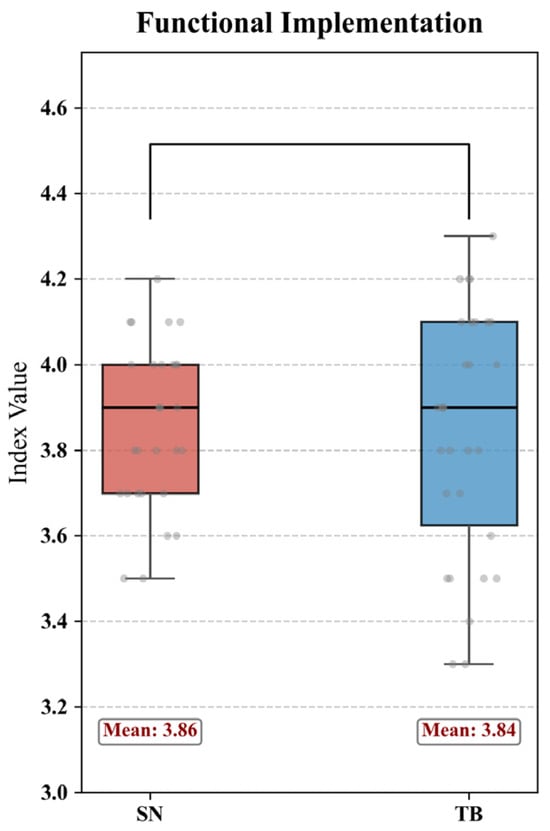
Figure 12.
Comparative analysis of the functional implementation of the two groups.
4.3.3. Comparative Analysis of Conflict Resolution
The group differences demonstrated statistically significant resolution of conflicts at the 0.05 level (t = 2.279, p = 0.026). As shown in Figure 13, the comparative analysis revealed that the index value of SN (0.77) was significantly higher than that of TB (0.75). The SN group exhibited a slight advantage over the TB group. Semantic networks uniquely structure design processes by clearly presenting various concepts, elements, and their interconnections. When addressing design conflicts, designers can leverage these networks to pinpoint critical contradictions, analyze underlying logic, and identify effective resolution paths through interconnected elements [45]. While brainstorming generates abundant ideas, it lacks systematic frameworks for conflict resolution, making it less efficient and accurate than semantic networks. Nevertheless, the TB members, through the intense and rapid mental exchange between the brains, it is possible alleviate and resolve some conflicts to a certain extent.
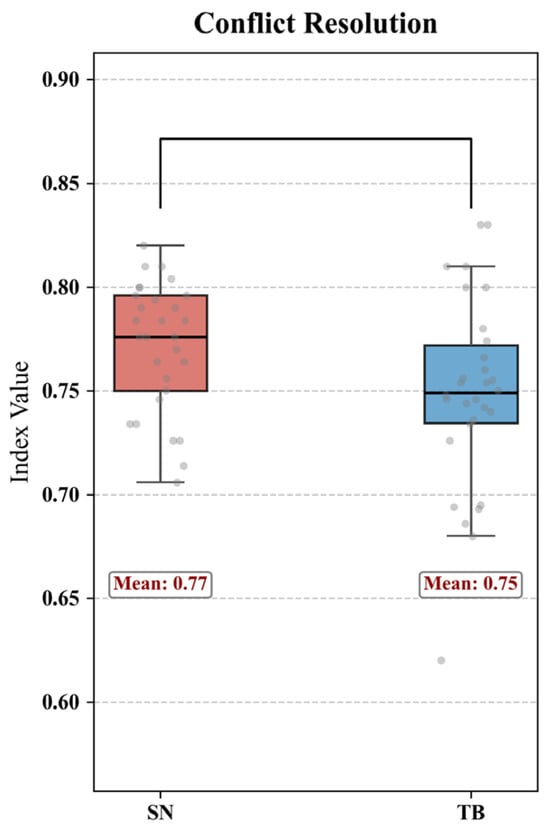
Figure 13.
Comparative analysis of the conflict resolution between the two groups.
4.3.4. Comparative Analysis of Thought Explicitness
The group comparison demonstrated a statistically significant 0.01 level in thought explicitness (t = 5.045, p = 0.000). As shown in Figure 14, the comparative analysis revealed that the index value of the SN group (13.57) was significantly higher than the TB group’s average (9.93). This visual representation of thinking processes constitutes a key dimension where the SN group outperformed the TB group. Semantic networks visually present designers’ complex, implicit thought processes through interconnected nodes and connections, making cognitive pathways immediately apparent. The creation of these networks essentially transforms vague mental activities into structured and clarified frameworks [46]. This externalization not only facilitates designers’ self-reflection and process optimization but also enhances team communication and collaboration by enabling rapid comprehension of design concepts during collaborative projects. In contrast, brainstorming sessions, while dynamic, often produce fragmented ideas lacking the systematic coherence and logic of semantic networks [47]. These distinct characteristics make semantic network-based thinking indispensable for knowledge transfer, project advancement, and in-depth analysis of design methodologies.
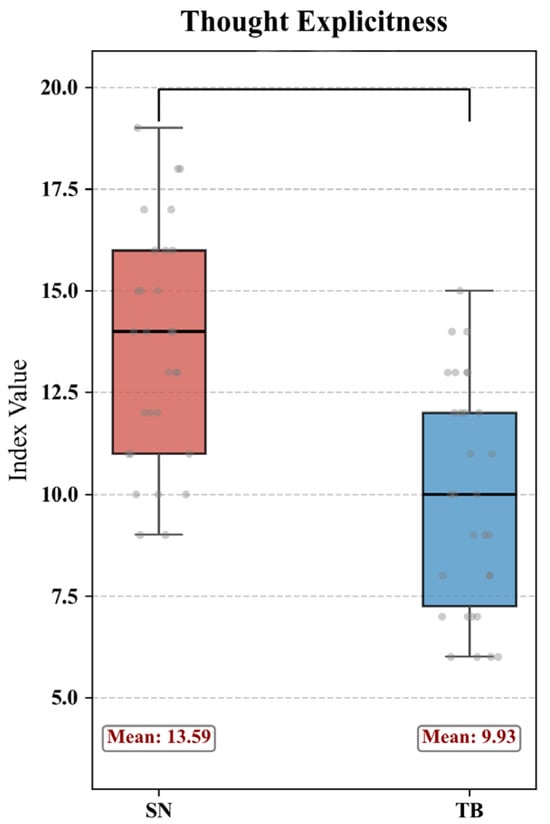
Figure 14.
Comparative analysis of thought explicitness between the two groups.
4.3.5. Comparative Analysis of Innovation
The group differences demonstrated 0.05-level significance in innovation (t = 2.466, p = 0.017). As shown in Figure 15, specifically, the SN group exhibited a significantly higher average score (4.04) compared to the TB group (3.86). This advantage stems from SN’s ability to stimulate cross-domain associations and systematic conflict resolution, as reflected in representative solutions:
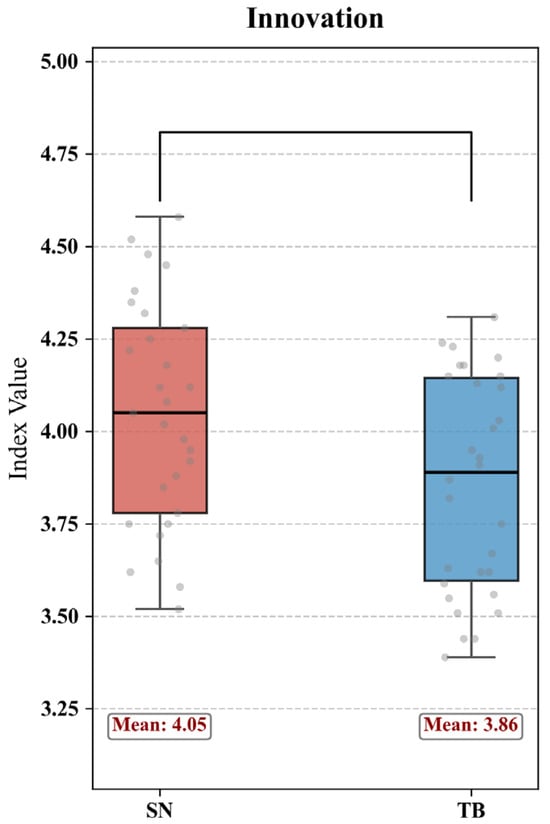
Figure 15.
Comparative analysis of innovation between the two groups.
- (1)
- SN group representative innovation: A participant decomposed the “4 m road width constraint” and “pedestrian–vehicle conflict” into core nodes, then introduced cross-domain nodes from “traffic engineering” (dynamic lane allocation) and “landscape design” (semi-permeable green belts). The solution involved a dumbbell-shaped road widening at key sections (3 m to 5 m) and sensor-controlled movable bollards that separate pedestrian and vehicle flows during peak hours, while integrating the bollards with landscape plants to maintain spatial openness. This scheme was rated highly for novelty and effectiveness by experts, as it addressed multiple conflicts without increasing land use.
- (2)
- TB group representative innovation: Most solutions focused on local adjustments, such as shifting the cultural center entrance slightly or adding signposts for pedestrian guidance. For example, one participant proposed a curved pedestrian path along the road edge to avoid vehicle interference, which was rated moderately for novelty and effectiveness due to its reliance on conventional spatial adjustment without cross-domain breakthroughs.
Research by Abraham A. (2021) and Silvia P. J. (2007) has confirmed that the SN group outperformed the TB group in innovation [48,49]. Semantic networks, with their rich structures and diverse connections, effectively stimulate designers’ associative thinking and creative expansion. When exploring and modifying these networks, designers can discover new possibilities through existing conceptual links by introducing novel nodes and establishing new connections, thereby pioneering innovative design directions. While brainstorming methods strongly advocate for creative thinking and encourage participants to break conventional patterns, practical implementation often reveals that TB groups demonstrate slightly less depth in innovation exploration compared to SN groups due to certain operational constraints. However, TB groups excel in creative breadth, generating numerous ideas from multiple perspectives in a limited time.
4.3.6. Comparative Analysis of Solution Output
The group comparison demonstrated a statistically significant difference at the 0.01 level (t = −4.261, p = 0.000) in the solution output. As shown in Figure 16, specifically, the average score of the SN group (1.60) was significantly lower than that of the TB group (2.37). The representative output characteristics are as follows:
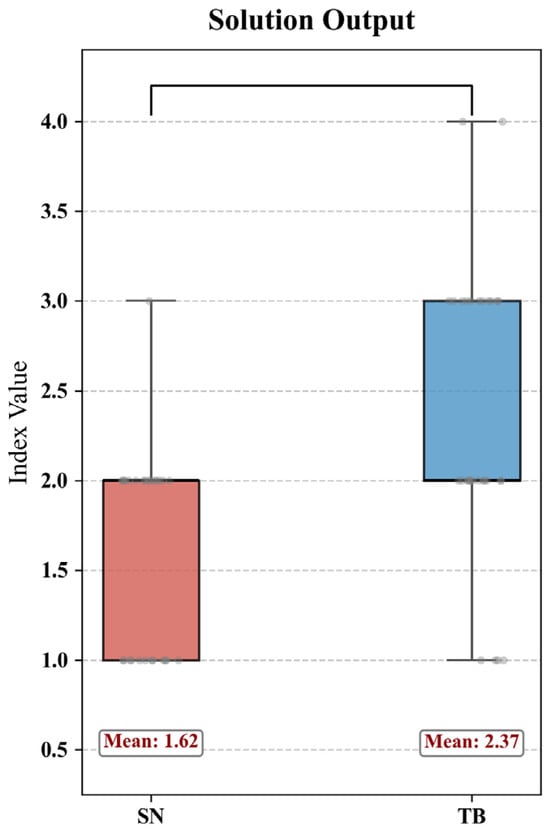
Figure 16.
A comparative analysis of the solution output between the two groups.
- (1)
- SN group output: Each participant generated 1–2 focused solutions with complete logical chains. For instance, a participant’s solution included three core modules: “constraint node (4 m road) → conflict node (peak congestion) → solution node (time-sharing access + sensory guidance)”, with detailed descriptions of node relationships and implementation paths.
- (2)
- TB group output: Participants generated 2–3 solutions with broader coverage but shallower depth. For example, one participant proposed “entrance relocation”, “road narrowing on one side”, and “pedestrian overpass” within 10 min. However, the “pedestrian overpass” scheme lacked cost and land use considerations, and the “road narrowing” scheme conflicted with fire access requirements. Although the number of proposals appeared to be higher, their actual innovation level was lower than that in the SN group.
This disparity stems from two intertwined factors: (1) the structural cognitive constraints of the SN method itself, node decomposition, relationship mapping, and cross-domain association require more deliberate cognitive processing, which inherently slows down the rate of solution generation, and (2) the methodological trade-off of prioritizing depth over breadth, as SN guides designers to focus on logical completeness and conflict resolution rather than rapid idea divergence. It is important to emphasize that the lower solution count of the SN group is not merely a methodological choice but also a reflection of the higher cognitive load imposed by its structured framework, which differs fundamentally from TB’s more intuitive and immediate ideation process.
Notably, the SN group achieved a higher valid solution rate compared to the TB group, as its structured cognitive process reduces the risk of generating schemes that conflict with core constraints. This indicates that while SN’s cognitive demands limit output quantity, they enhance solution feasibility and innovation depth, aligning with this study’s focus on resolving complex design conflicts rather than maximizing idea count.
4.4. Design Thinking Deduction Path of Different Individuals in SN Group
By analyzing the design thinking processes simulated through semantic network modeling across different participants, we can clearly observe their distinct thought patterns, focal points, commonalities, and variations in cognitive approaches, as well as potential combinations of design thinking methods to identify optimization strategies. To specifically examine the reasoning pathways of individual SN group members and investigate the group’s role in guiding and stimulating design thinking, the author conducted a systematic analysis of experimental data from selected SN participants and retrospective interviews. Through deconstructing key design works, critical and unique design thinking elements were identified and extracted. The semantic network simulation results of design thinking in selected proposals are presented in Figure 17.
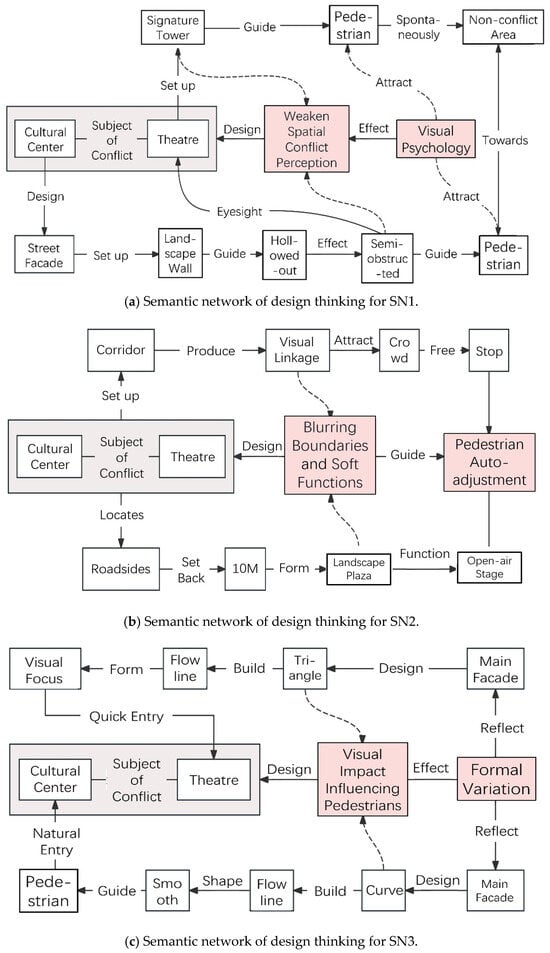
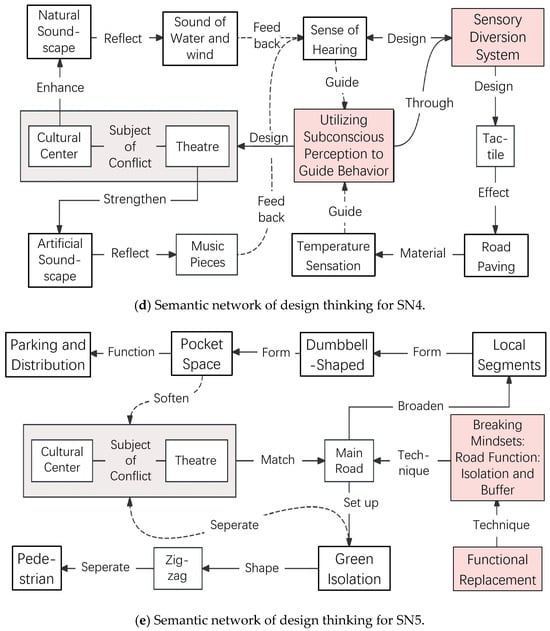
Figure 17.
Semantic network simulation diagram of individual design thinking.
4.4.1. Common Cognitive Framework
The core consensus in conflict resolution in SN1–SN5 exhibits remarkable alignment in conceptual foundations and primary objectives, forming a unified logical framework for resolving the issue. Key consensus points include the following:
- (1)
- Unified essence recognition in SN1–SN5 precisely identifies the conflict’s root cause as “the 4 m wide single roadway with dual building entrances/exits,” categorizing it into three distinct dimensions: pedestrian traffic congestion, spatial flow entanglement, and dynamic–static zone conflicts. Crucially, they avoid attributing road narrowing to excessive building volume or traffic chaos to user behavior. This consistency stems from design constraints: fixed roadway width and restricted access locations inherently dictate the singular core direction for conflict resolution.
- (2)
- Implicit consensus on objective constraints, though not explicitly stated, is embedded in the aforementioned individual design philosophies. These principles—preserving cultural facilities ‘openness, avoiding excessive land use, and implementing low-cost solutions—aim to resolve conflicts rather than forcibly fragment spaces. Alternative approaches eschew physical barriers like walls or enclosed partitions that would restrict openness. Instead, they prioritize minor renovations over large-scale demolitions, align with limited budgets, and bypass complex urban signage systems. By leveraging users’ familiar sensory logic (e.g., audiovisual cues), these designs demonstrate a strong emphasis on local context.
- (3)
- The design approach for resolving logical closed-loop commonalities in SN1–SN5 follows a closed-loop logic of “contradiction identification → strategy derivation → design implementation → effect validation”. The process first identifies “what cannot be done” before deducing “what can be done”. After implementation, each solution is validated to address three types of sub-contradictions, ensuring the scheme’s integrity.
4.4.2. Divergent Thinking: Strategic Path Dimensions
- (1)
- The core strategic differences in conflict resolution categorize SN1–SN5 design philosophies into two major schools: Spatial Reconstruction and Sensory Guidance. Their fundamental distinctions lie in conflict resolution approaches: The Spatial Reconstruction School initiates through physical space transformation, resolving conflicts via spatial morphology adjustments. SN2 expands outward through plaza development and soft space distribution, while SN4 optimizes internal road structures with dumbbell-shaped widening and green belts for physical separation. This approach’s key logic involves altering spatial carriers to make users adapt to optimized environments. The Sensory Guidance School focuses on behavioral cues, directing flows through sensory signals. SN1 employs visual barriers (scenic walls) and directional signage (sign towers) to reduce conflict perception, enabling natural flow. SN3 conveys functional signals through architectural forms, guiding users intuitively. SN5 utilizes natural and artificial soundscapes, along with tactile contrasts between wood and stone, to trigger subconscious behavioral responses, allowing users to autonomously choose paths based on sensory differentiation. This approach’s core logic involves maintaining spatial carriers while using cues to actively avoid conflicts.
- (2)
- In decision-making priorities in design, when balancing spatial efficiency and experiential quality, participants demonstrated distinct preferences. The first priority was efficiency, focusing on addressing functional issues like congestion and safety before considering experience. For SN4, the green belt primarily served as a physical barrier to crowd flow, with landscape value being secondary. The second priority was experience, where SN1’s perforated landscape wall not only controlled foot traffic but also enhanced the entrance ambiance through light effects, while SN5’s acoustic design guided crowd flow and created a tranquil atmosphere via natural water sounds. SN2 adopted a balanced approach, equally emphasizing plaza dispersal and landscape experience, effectively resolving crowd flow issues while providing activity space, achieving equilibrium between functionality and user experience.
5. Discussion
5.1. Analysis of Eye Movement Data Reveals Cognitive Processes in Two Groups
The two groups innovated individual cognitive processes through distinct methods, with their corresponding eye movement data clearly revealing underlying mechanisms:
- (1)
- Node Deconstruction Phase (1–4 min)
The SN group exhibited longer average fixation duration and higher pupil dilation compared to the TB group. This pattern correlates with the group’s self-reported focus on node decomposition and classification, suggesting a potential link to more deliberate information processing. However, we acknowledge that longer fixations alone cannot definitively confirm “deeper thinking”—this interpretation is supported by complementary evidence: the SN group’s fixation duration was significantly positively correlated with the number of logically coherent nodes generated [50], and 89% of the SN participants reported “focusing on breaking down design conflicts into specific elements” during retrospective interviews.
The TB group’s shorter fixation duration and higher blink frequency correlated with their rapid sketching behavior, but this does not exclude other possibilities (e.g., more efficient visual scanning). We confirmed the cognitive interpretation by cross-referencing with their sketch content (mostly preliminary spatial configurations rather than systematic decomposition).
- (2)
- Cross-domain Association Phase (5–7 min)
The SN group maintained low blink frequency and sustained pupil dilation, which correlates with their self-reported engagement in cross-domain knowledge integration. However, blink rate is context-dependent—low blinking could also reflect reduced visual scanning rather than deep thinking. We strengthened the interpretation by noting that this pattern coincided with participants’ reports of “connecting non-architectural knowledge to the design task” and a higher proportion of cross-domain nodes in their semantic networks [51].
- (3)
- Cognitive Integration Phase (8–10 min)
The SN group’s stabilized pupil dilation and consistent fixation duration correlated with their shift to logical verification of solutions. The TB group’s scattered gaze points and fluctuating pupil diameter correlated with fragmented sketch adjustments, but this does not rule out other factors (e.g., fatigue). We mitigated this ambiguity by cross-validating with the completeness of their solution logic chains.
The innovative advantage of semantic networks fundamentally stems from structured cognition surpassing empirical thinking. Eye-tracking data revealed that the SN group, through an eye movement pattern characterized by “long fixation duration, high cognitive load, and low blink frequency,” accumulated rich conceptual materials during node deconstruction, transcended cognitive boundaries in cross-domain association, and formed logical closed loops in thinking integration [19]. This validates the intrinsic mechanism of semantic networks in fostering innovation through mental explication, providing objective evidence for quantifying design thinking.
The cognitive interpretations of eye-tracking data are based on established theoretical frameworks and correlational evidence, rather than direct causal proof. Future research could integrate electroencephalography (EEG) or functional near-infrared spectroscopy (fNIRS) to provide multimodal neural evidence for cognitive processes.
5.2. Discussion on the Intrinsic Cognitive Mechanism of Semantic Networks
5.2.1. The Innovative Advantages of Semantic Networks
Semantic network simulation demonstrates superior innovation capabilities compared to brainstorming, which aligns with the semantic network theory proposed by He et al. The researchers indicate that connection hubs in semantic networks facilitate creative thinking by promoting the reorganization of distant conceptual nodes. For architectural design, the core value of SN lies in its alignment with spatial thinking: nodes correspond to design elements, and edges correspond to spatial relationships. For example, in rural cultural center design, the SN’s node decomposition helps architects clarify the logical relationship between “road width,” “traffic flow,” and “spatial layout,” avoiding fragmented design caused by TB’s implicit thinking. This study extends this theory to architectural design, demonstrating that node deconstruction and cross-domain associations in semantic networks directly enhance innovation depth [52]. In contrast, brainstorming innovation is limited to lateral expansion, with participants primarily focusing on local sketch modifications rather than cross-domain node connections. This finding aligns with Taylor, D.W et al.’s observation that brainstorming lacks systematic cognitive restructuring in visual thinking [53].
5.2.2. The Significance of Simulating and Stimulating Thinking by Semantic Networks
Semantic networks precisely reconstruct the “constraint–strategy–goal” cognitive chain, resolving ambiguities in conflicting cognition. In this study, participants in the SN group shared a common cognitive pattern: deriving strategies from conflicting constraints to ultimately achieve goals. Through its unique structure, the semantic network makes this implicit cognitive chain explicit and traceable. Semantic networks efficiently differentiate between common and divergent cognitive dimensions, supporting multi-plan comparative analysis. Participants exhibited variations in core strategy differentiation and design priority differences. By categorizing nodes hierarchically and comparing logical relationships, the semantic network accurately distinguishes multiple cognitive pathways. Semantic networks dynamically adapt to the “conflict escalation–strategy iteration” process, enhancing the extensibility of cognitive simulation. Given that design conflicts may evolve dynamically due to changing usage conditions or new functional requirements, the “editability” of semantic networks enables real-time simulation of cognitive iteration processes.
5.2.3. Integrating Methodological Advantages into Architectural Design
The comparative analysis of semantic networks and brainstorming methodologies within the context of design evolution reveals their distinct phases corresponding to the “convergent” and “divergent” stages of design thinking. The hybrid workflow of SN and TB addresses the practical pain point of “balancing creativity and feasibility” in architectural design. TB provides diverse initial ideas (e.g., multiple entrance positions), while SN organizes these ideas into structured nodes, resolve conflicts between them (e.g., conflicting entrance positions and fire access), and generate feasible innovative solutions. The brainstorming phase primarily gathers diverse creative materials to broaden design perspectives. Subsequently, brainstorming-generated ideas are integrated into a semantic network simulation system. Through constructing semantic networks, designers systematically organize creative connections and conduct in-depth cognitive expansion [54]. This process leverages the conflict resolution capabilities of semantic network simulations to address contradictions between ideas, ultimately generating more feasible solutions. During the optimization phase, semantic network simulations are further utilized to enhance design quality. This hybrid approach effectively combines the strengths of both methodologies, forming an efficient workflow of “rapid divergence → in-depth exploration → systematic optimization.” This aligns with the proposal by Shi, G et al. (2025) advocating for alternating methodologies in complex design projects [55]. This study quantifies complementary advantages: the brainstorming phase generates 2.37 design proposals every 10 min, providing sufficient material for node construction in the semantic network phase. Meanwhile, the semantic network phase enhances innovation value per unit time, breaking the “function–innovation–efficiency” triangle and effectively reducing design iteration costs—precisely addressing gaps in previous design methodology research.
5.2.4. The Connection Between Semantic Networks and Existing Practice
SN’s innovative advantage lies not in replacing existing structured design practices, but in formalizing and quantifying their core logic to enhance applicability and effectiveness. Similar to systems thinking’s emphasis on holistic relationships, SN constructs “conflict–constraint–solution” logical chains, but further enable quantitative analysis of chain completeness and cross-domain coverage. Compared to concept mapping, which focuses on conceptual hierarchy, SN’s node relationship definition is more tailored to architectural design’s constraint-driven characteristics, and its integration with eye-tracking data realizes the measurement of subconscious cognitive processes—something existing methods rarely achieve. This formalization and quantification make SN a complementary extension of existing practices, rather than a fundamentally new paradigm, providing architects with a more operable and evaluable structured thinking tool.
5.3. Practical Extension: Implications for Human–AI Collaborative Design
The core findings of this study—SN’s advantages in structured thinking, conflict resolution, and thought explicitness—provide valuable implications for human–AI collaborative design in architectural practice, where AIGC tools are increasingly applied but face cognitive limitations.
Existing AIGC applications in architectural design often struggle with three key issues: difficulty in integrating cultural context, insufficient consideration of architectural ethics, and opaque cognitive logic (making human intervention challenging). These limitations stem from AIGC’s reliance on statistical correlations between surface features rather than structured cognitive frameworks. The SN method proposed in this study can serve as a bridging tool to address these gaps, based on the following practical logic (Figure 18 revised):
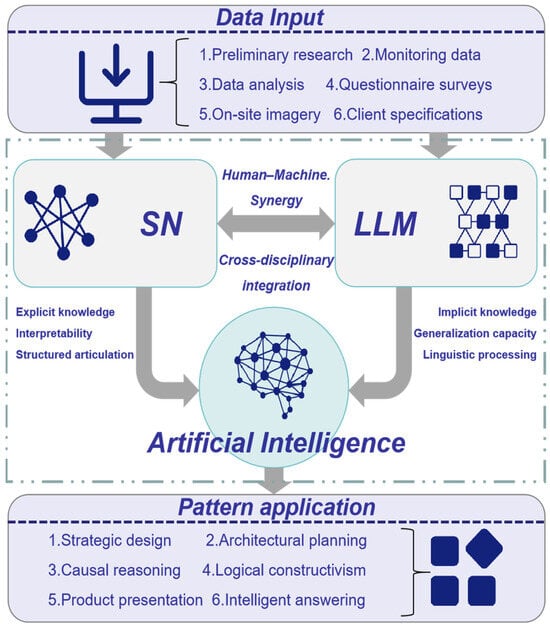
Figure 18.
Map of the cross-fusion framework of large language model and semantic network.
- (1)
- Structured Input for AIGC: The “conflict–constraint–solution” node–edge structure of SN provides explicit, machine-interpretable cognitive frameworks for AIGC. For example, in the rural cultural center design task, SN decomposes core constraints (4 m road width), conflicts (pedestrian–vehicle congestion), and cross-domain solution nodes (traffic engineering strategies) into structured data. This enables AIGC to generate proposals aligned with functional requirements and design logic, avoiding superficial symbolic splicing.
- (2)
- Traceable Thinking for Human–AI Interaction: SN’s explicit node relationship chains (e.g., “road width constraint → dynamic lane allocation solution”) record the evolution of design thinking. When AIGC generates initial schemes, designers can use SN to trace the logical connections between AI-generated elements, modify conflicting nodes, and optimize solution paths, overcoming the “black-box” limitation of AIGC.
- (3)
- Synergy with Experimental Findings: The eye-tracking data in this study show that SN enhances cross-domain association and logical integration, which aligns with the demand for structured cognitive support in human–AI collaboration. SN’s ability to make implicit thinking explicit complements AIGC’s strengths in rapid idea generation, forming a “human–SN–AIGC” collaborative model: designers use SN to define core constraints and logical frameworks, AIGC expands creative possibilities within the framework, and SN further optimizes and verifies the feasibility of AI-generated ideas.
As shown in Figure 18, the synergy between these two domains fundamentally represents a dialectical unity of humanistic cognition and computational intelligence. Semantic networks do not merely constrain AIGC systems, but rather infuse them with architectural ontological understanding. On one hand, they encode designers‘ tacit expertise into machine-readable semantic relationships, elevating AIGC from data-fitting tools to domain-aware collaborators. On the other hand, AIGC’s iterative feedback to semantic networks expands human cognitive boundaries, creating a dynamic cognitive cycle. Exceptional architectural generation requires both rule-based frameworks like semantic networks and AIGC’s creative breakthroughs—the tension between these elements serves as the wellspring of design innovation. This collaborative mechanism will redefine human–machine relationships: designers no longer passively filter AIGC outputs but guide creative directions through semantic network adjustments, while AIGC transforms from solution producers into cognitive enhancers. By decoding deep connections within semantic network nodes, it may propose innovative strategies that designers might overlook. This symbiotic system overcomes the humanistic poverty of purely technical approaches while avoiding the knowledge inheritance challenges of traditional qualitative research, providing theoretical foundations for architectural paradigm shifts in the digital era.
6. Conclusions
This study compares semantic network simulation (SN) and traditional brainstorming (TB) through controlled experiments, exploring their effects on architectural design conflict resolution and innovation. Key findings for architects include the following: (1) SN outperforms TB in resolving complex spatial conflicts and generating in-depth innovation, while TB excels in rapid idea divergence; (2) the core cognitive mechanism is that thought explicitness (quantified by node count) acts as a “converter” between functional implementation and conflict resolution and innovation; and (3) SN provides a structured tool to decompose conflicts into nodes, connect logically, and innovate via cross-domain association.
Practically, the “TB divergence → SN exploration → SN optimization” hybrid workflow helps break the “function–innovation–efficiency” trade-off in architectural design. SN enables systematic conflict resolution while maintaining creative depth. The practical significance is in providing tools to break the “function–innovation–efficiency” triangle in architecture. This provides a new view on design thinking’s hierarchical structure and guides SN tool optimization: enhance thinking visualization and build a support system for conflict resolution and functional implementation. Future research can integrate interdisciplinary cases and cognitive experiments to explore indicator relationship differences.
This study has inherent limitations: the participant sample is restricted to senior undergraduate architecture students, lacking representation from professional architects with diverse practical experience or cross-cultural design teams; the experimental task is confined to the entrance design conflict of a rural cultural center, failing to cover diverse architectural conflict types, such as functional layout contradictions in high-rises or form-expression conflicts in cultural buildings; and, additionally, only short-term design outcomes within 10 min are measured, without tracking the long-term iterative process of schemes or the sustained impact of SN training on designers’ cognitive abilities. Furthermore, the cognitive demands of SN and TB are inherently asymmetric—SN requires explicit diagram construction, node abstraction, and logical relationship mapping, while TB prioritizes immediate ideation and sketching. This structural difference introduces unavoidable constraints on direct comparison of metrics like solution output quantity and early-stage innovation speed, and the lower solution count in the SN group should be interpreted as a combined result of methodological trade-offs and cognitive task characteristics rather than a one-sided disadvantage.
Future research will focus on addressing these limitations by expanding sample diversity to verify the generalizability of the findings across different professional backgrounds and cultural contexts, diversifying experimental task scenarios to explore the applicability boundaries of SN and TB, extending the measurement timeframe to the entire design cycle to comprehensively evaluate method performance, and integrating emerging technologies, such as AI, to develop automated SN tools integrated with mainstream design software, while optimizing the hybrid workflow by quantifying the optimal timing and proportion of switching between SN and TB in different design phases.
Author Contributions
Conception and design, J.D.; data analysis and interpretation, Z.W.; drafting of the paper, Z.W.; critical revision for intellectual content, J.D.; final approval of the version to be published, all authors; accountability for all aspects of the work, all authors. All authors have read and agreed to the published version of the manuscript.
Funding
This research received no external funding.
Institutional Review Board Statement
This research study did not involve clinical treatment, in accordance with Article 9 of Regulation (EU) 679/2016, General Data Protection Regulation (GDPR). Consequently, ethical approval was not required. Furthermore, no sensitive data were collected in this study.
Informed Consent Statement
Informed consent was signed and obtained by all subjects involved in this study.
Data Availability Statement
The data that support the findings of this study are available from the corresponding author upon reasonable request.
Acknowledgments
In this section, I would like to express my sincere gratitude to all individuals who have provided valuable support throughout the research and writing process, which is not covered by the authors’ contribution or funding sections.
Conflicts of Interest
The authors declare no conflicts of interest. All authors have no personal, financial, or institutional relationships that could inappropriately influence the results or interpretation of this study. The research received no external funding, and there are no competing interests related to data collection, analysis, or publication.
References
- Grobman, Y.J.; Weisser, W.; Shwartz, A.; Ludwig, F.; Kozlovsky, R.; Ferdman, A.; Perini, K.; Hauck, T.E.; Selvan, S.U.; Saroglou, S.; et al. Architectural Multispecies Building Design: Concepts, Challenges, and Design Process. Sustainability 2023, 15, 15480. [Google Scholar] [CrossRef]
- El Touny, A.S.; Ibrahim, A.H.; Mohamed, H.H. An Integrated Sustainable Construction Project’s Critical Success Factors (ISCSFs). Sustainability 2021, 13, 8629. [Google Scholar] [CrossRef]
- Labuda, I.; Dzwierzynska, J. Inventive Methods in Conceptual Architectural Design. Educ. Sci. 2026, 16, 26. [Google Scholar] [CrossRef]
- Rahmawati, Y.; Pradipto, E.; Mustaffa, Z.; Saputra, A.; Mohammed, B.S.; Utomo, C. Enhancing Students’ Competency and Learning Experience in Structural Engineering through Collaborative Building Design Practices. Buildings 2022, 12, 501. [Google Scholar] [CrossRef]
- Boonyoung, N.; Kamonmarttayakul, K.; Phumdoung, S. Comparison of Modified Hybrid Brainstorming with a Conventional Brainstorming Program to Enhance Nurses’ Innovative Idea Generation. J. Contin. Educ. Nurs. 2021, 52, 72–78. [Google Scholar] [CrossRef]
- Awamleh, Z. Behaviour setting transformation methodology, filling in the gaps of the conventional architectural design process. Philos. Trans. R. Soc. B Biol. Sci. 2024, 379, 20230292. [Google Scholar] [CrossRef]
- Zuo, H.; Jing, Q.; Song, T.; Sun, L.; Childs, P.; Chen, L. WikiLink: An Encyclopedia-Based Semantic Network for Design Creativity. J. Intell. 2022, 10, 103. [Google Scholar] [CrossRef] [PubMed]
- Yuan, S.-T.D.; Hsieh, P.-K. Using association reasoning tool to achieve semantic reframing of service design insight discovery. Des. Stud. 2015, 40, 143–175. [Google Scholar] [CrossRef]
- Calvillo, D.P. Rapid recollection of foresight judgments increases hindsight bias in a memory design. J. Exp. Psychol. Learn. Mem. Cogn. 2013, 39, 959–964. [Google Scholar] [CrossRef]
- Seeber, I.; de Vreede, G.J.; Maier, R.; Weber, B. Beyond Brainstorming: Exploring Convergence in Teams. J. Manag. Inf. Syst. 2017, 34, 939–969. [Google Scholar] [CrossRef] [PubMed]
- Maksoud, A.; Elshabshiri, A.; Alzaabi, A.S.H.H.; Hussien, A. Integrating an Image-Generative Tool on Creative Design Brainstorming Process of a Safavid Mosque Architecture Conceptual Form. Buildings 2024, 14, 843. [Google Scholar] [CrossRef]
- Paulus, P.; Nakui, T. Facilitation of group brainstorming. In The IAF Handbook of Group Facilitation; Schuman, S., Ed.; Jossey-Bass: San Francisco, CA, USA, 2005; pp. 103–114. [Google Scholar]
- Hu, M.; Shealy, T.; Milovanovic, J.; Gero, J. Neurocognitive feedback: A prospective approach to sustain idea generation during design brainstorming. Int. J. Des. Creat. Innov. 2022, 10, 31–50. [Google Scholar] [CrossRef]
- Peirce, C.S. Collected Papers of Charles Sanders Peirce; Harvard University Press: Cambridge, MA, USA, 1974. [Google Scholar]
- Quillan, M.R. Semantic Memory. In Semantic Information Processing; Minsky, M., Ed.; The MIT Press: Cambridge, MA, USA, 1968. [Google Scholar]
- Gero, J.S.; Jiang, H.; Williams, C.B. Design cognition differences when using unstructured, partially structured, and structured concept generation creativity techniques. Int. J. Des. Creat. Innov. 2013, 1, 196–214. [Google Scholar] [CrossRef]
- Cheligeer, C.; Yang, J.; Bayatpour, A.; Miklin, A.; Dufresne, S.; Lin, L.; Bhuiyan, N.; Zeng, Y. A Hybrid Semantic Networks Construction Framework for Engineering Design. J. Mech. Design 2022, 145, 041405. [Google Scholar] [CrossRef]
- Carlgren, L.; Elmquist, M.; Rauth, I. Design Thinking: Exploring values and effects from an innovation capability perspective. Des. J. 2014, 17, 403–423. [Google Scholar] [CrossRef]
- Yu, F.; Jia, X.; Zhao, X.; Li, J. A Method for Inspiring Radical Innovative Design Based on Cross-Domain Knowledge Mining. Systems 2024, 12, 102. [Google Scholar] [CrossRef]
- Su, B.; Hu, J.; Zeng, J.; Wang, R. Traffic Safety Improvement via Optimizing Light Environment in Highway Tunnels. Int. J. Environ. Res. Public Health 2022, 19, 8517. [Google Scholar] [CrossRef]
- Beaty, R.E.; Silvia, P.J. Why do ideas get more creative across time? An executive interpretation of the serial order effect in divergent thinking tasks. Psychol. Aesthet. Creat. Arts 2012, 6, 309–319. [Google Scholar] [CrossRef]
- Jang, S.H.; Oh, B.; Hong, S.; Kim, J. The effect of ambiguous visual stimuli on creativity in design idea generation. Int. J. Des. Creat. Innov. 2018, 7, 70–98. [Google Scholar] [CrossRef]
- Toh, C.A.; Miller, S.R. Choosing creativity: The role of individual risk and ambiguity aversion on creative concept selection in engineering design. Res. Eng. Des. 2016, 27, 195–219. [Google Scholar] [CrossRef]
- Taura, T.; Yamamoto, E.; Fasiha, M.Y.N.; Goka, M.; Mukai, F.; Nagai, Y.; Nakashima, H. Constructive simulation of creative concept generation process in design: A research method for difficult-to-observe design-thinking processes. J. Eng. Des. 2012, 23, 297–321. [Google Scholar] [CrossRef]
- Jin, Y.; Benami, O. Creative patterns and stimulation in conceptual design. Artif. Intell. Eng. Des. Anal. Manuf. 2010, 24, 191–209. [Google Scholar] [CrossRef]
- Sun, X.; Li, Z. Use of electroencephalography (EEG) for comparing study of the external space perception of traditional and modern commercial districts. J. Asian Archit. Build. Eng. 2020, 20, 840–857. [Google Scholar] [CrossRef]
- Wang, Y.; Wang, S.; Xu, M. The Function of Color and Structure Based on EEG Features in Landscape Recognition. Int. J. Environ. Res. Public Health 2021, 18, 4866. [Google Scholar] [CrossRef]
- Jiang, Z.Q.; Liu, L.; Xu, Z. A review on evaluation methods of creative thinking. Adv. Psychol. Sci. 2019, 9, 165–170. [Google Scholar] [CrossRef]
- Li, H.; Yang, L.; Wang, T.; Xiao, R.; Song, L.; Xie, W.; Wang, Z.; Wu, Y.; Su, R.; Ma, H.; et al. Structured diary introspection training: A kind of critical thinking training method can enhance the Pro-C creativity of interior designers. Think. Ski. Creat. 2024, 52, 101–112. [Google Scholar] [CrossRef]
- Dong, M.X.; Li, F.L.; Chang, H.M. Hotspots and trends in critical thinking research over the past two decades: Insights from a bibliometric analysis. Heliyon 2023, 9, e16934. [Google Scholar] [CrossRef]
- Kerimbayev, N.; Nurym, N.; Akramova, A.; Abdykarimova, S. Educational Robotics Develpoment of Computational thinking in collaborative online learning. Educ. Inf. Technol. 2023, 28, 14987–15009. [Google Scholar] [CrossRef] [PubMed]
- Tang, Z.; Wang, Y.; Chen, W. Assessment and Application of Multi-Source Precipitation Products in Cold Regions Based on the Improved SWAT Model. Remote Sens. 2024, 16, 4132. [Google Scholar] [CrossRef]
- Bassier, M.; Vermandere, J.; Geyter, S.D.; Winter, H.D. GEOMAPI: Processing close-range sensing data of construction scenes with semantic web technologies. Autom. Constr. 2024, 158, 105454. [Google Scholar] [CrossRef]
- Randall, C.; Lawrence, S. Psychometric Properties of Four 5-Point Likert Type Response Scales. Educ. Psychol. Meas. 1987, 47, 27–35. [Google Scholar] [CrossRef]
- Gupta, A.K.; Pardheev, C.G.V.S.; Choudhuri, S.; Das, S.; Garg, A.; Maiti, J. A novel classification approach based on context connotative network (CCNet): A case of construction site accidents. Expert Syst. Appl. 2022, 202, 117281. [Google Scholar] [CrossRef]
- Guo, D.; Onstein, E.; La Rosa, A.D. A Semantic Approach for Automated Rule Compliance Checking in Construction Industry. IEEE Access 2021, 9, 129648–129660. [Google Scholar] [CrossRef]
- He, L.; Kenett, Y.N.; Zhuang, K.; Sun, J.; Chen, Q.; Qiu, J. Connector hubs in semantic network contribute to creative thinking. J. Exp. Psychol. Gen. 2025, 154, 391–404. [Google Scholar] [CrossRef]
- Mullen, B.; Johnson, C.; Salas, E. Productivity loss in brainstorming groups: A meta-analytic intSNration. Basic. Appl. Soc. Psychol. 1991, 12, 3–23. [Google Scholar] [CrossRef]
- Irakleous, P.; Christou, C.; Pitta-Pantazi, D. Mathematical imagination, knowledge and mindset. ZDM Math. Educ. 2021, 54, 97–111. [Google Scholar] [CrossRef]
- Demirkan, H.; Afacan, Y. Assessing creativity in design education: Analysis of creativity factors in the first-year design studio. Des. Stud. 2011, 33, 262–278. [Google Scholar] [CrossRef]
- Goldschmidt, G.; Smolkov, M. Variances in the impact of visual stimuli on design problem solving performance. Des. Stud. 2006, 27, 549–569. [Google Scholar] [CrossRef]
- Obamiro, K.; Jessup, B.; Allen, P.; Baker-Smith, V.; Khanal, S.; Barnett, T. Considerations for Training and Workforce Development to Enhance Rural and Remote Ophthalmology Practise in Australia: A Scoping Review. Int. J. Environ. Res. Public Health 2022, 19, 8593. [Google Scholar] [CrossRef]
- Liu, A.; Lu, S. Functional design framework for innovative design thinking in product development. CIRP J. Manuf. Sci. Technol. 2020, 30, 105–117. [Google Scholar] [CrossRef]
- Zhang, Z.L.; Fu, B.; Li, L.Q. Design and Function Realization of Nuclear Power Inspection Robot System. Robotica 2020, 39, 165–180. [Google Scholar] [CrossRef]
- Magistretti, S.; Bianchi, M.; Calabretta, G.; Candi, M.; Dell’eRa, C.; Stigliani, I.; Verganti, R. Framing the multifaceted nature of design thinking in addressing different innovation purposes. Long Range Plan. 2021, 55, 102163. [Google Scholar] [CrossRef]
- Danko, D.G.; Georgi, V.G. Dynamic semantic networks for exploration of creative thinking. AI EDAM 2024, 38, e12. [Google Scholar] [CrossRef]
- Chen, Y.D.; Li, J.Q.; Che, X.; Wu, E.H. Cross-supervised semantic segmentation network based on differentiated feature extraction. J. Softw. 2025, 36, 5851–5870. [Google Scholar] [CrossRef]
- Abraham, A. Creativity or creativities? Why context matters. Des. Stud. 2021, 78, 101060. [Google Scholar] [CrossRef]
- Silvia, P.J. Review of Group genius: The creative power of collaboration. Psychol. Aesthet. Creat. Arts 2007, 1, 254–255. [Google Scholar] [CrossRef]
- Schotter, E.R.; Leinenger, M. Reversed preview benefit effects: Forced fixations emphasize the importance of parafoveal vision for efficient reading. J. Exp. Psychol. Hum. Percept. Perform. 2016, 42, 2039–2067. [Google Scholar] [CrossRef] [PubMed]
- Orchard, L.N.; Stern, J.A. Blinks as an index of cognitive activity during reading. Integr. Physiol. Behav. Sci. 1991, 26, 108–116. [Google Scholar] [CrossRef]
- Hugo-Burrows, M. Converting tacit knowledge into explicit knowledge in organisations. Commun. J. Commun. Stud. Afr. 2022, 21, 61–81. [Google Scholar] [CrossRef]
- Taylor, D.W.; Berry, P.C.; Block, C.H. Does Group Participation When Using Brainstorming Facilitate or Inhibit Creative Thinking? Adm. Sci. Q. 1958, 3, 23–47. [Google Scholar] [CrossRef]
- Aeschbach, S.; Mata, R.; Wulff, D.U. Measuring individual semantic networks: A simulation study. PLoS ONE 2025, 20, e0328712. [Google Scholar] [CrossRef] [PubMed]
- Shi, G.; Zhang, Z.; Gao, D.; Lin, J.; Xie, X.; Liu, D. Knowledge-guided semantic computing network. Neurocomputing 2021, 426, 70–84. [Google Scholar] [CrossRef]


Disclaimer/Publisher’s Note: The statements, opinions and data contained in all publications are solely those of the individual author(s) and contributor(s) and not of MDPI and/or the editor(s). MDPI and/or the editor(s) disclaim responsibility for any injury to people or property resulting from any ideas, methods, instructions or products referred to in the content. |
© 2026 by the authors. Licensee MDPI, Basel, Switzerland. This article is an open access article distributed under the terms and conditions of the Creative Commons Attribution (CC BY) license.