Abstract
With accelerating urbanization and climate change, outdoor thermal comfort (OTC) in high-intensity urban blocks presents a critical challenge. While existing studies have established the general correlation between morphology and microclimate, most remain descriptive and lack a systematic framework to quantitatively integrate the non-linear coupled effects between multi-dimensional morphological variables and green infrastructure. To address this, this study proposes an automated performance-based design (PBD) framework for urban morphology optimization in Shenzhen. Unlike traditional simulation-based analysis, this framework serves as a generative tool for urban renewal planning. It integrates a multi-dimensional design element system with a genetic algorithm (GA) workflow. Analysis across four urban typologies demonstrated that the Full Enclosure layout is the most effective strategy for mitigating thermal stress, achieving a final optimized UTCI of 37.15 °C. Crucially, this study reveals a non-linear synergistic mechanism: the high street aspect ratios (H/W) of enclosed forms act as a “radiation shelter”, which amplifies the cooling efficiency of green infrastructure (contributing an additional 1.79 °C reduction). This research establishes a significant, strong negative correlation between UTCI and the combined factors of building density and green shading coverage. The results provide quantifiable guidelines for retrofitting existing high-density districts, suggesting that maximizing structural shading is prioritized over ventilation in ultra-high-density, low-wind climates.
1. Introduction
1.1. Research Background
This study addresses the heat stress challenge in high-intensity districts. Against the backdrop of intensifying global climate change [1] and rapid urbanization, outdoor thermal comfort (OTC) has emerged as a pivotal challenge for sustainable urban planning. The increasing frequency of extreme heat events, particularly in high-density urban areas, exacerbates the urban heat island (UHI) effect, leading to severe public health risks and increased building cooling energy consumption. Recent reports indicate that megacities in subtropical hot–humid climate zones, such as Shenzhen, experience UHI effects that significantly degrade the livability of public spaces [2].
High-intensity urban districts—products of intensive urban development—are characterized by high floor area ratios (FARs), high building density (BD), and complex land-use patterns. These features typically result in deep, narrow street canyons, poor ventilation, and maximized solar absorption by building surfaces [3], forming local microclimates that are highly sensitive to heat stress. Therefore, optimizing the spatial morphology of these high-intensity blocks is no longer merely an aesthetic consideration but an imperative, performance-based strategy aimed at mitigating heat-related risks and ensuring long-term urban resilience and sustainability. This study aims to provide systematic and efficient design strategies to enhance outdoor thermal comfort in these challenging urban environments.
1.2. Literature Review and Research Gaps
Extensive research has established the fundamental relationship between urban morphology and microclimate, identifying key influencing factors such as building density, canyon geometry [3], and green infrastructure configuration. Advances in environmental simulation (e.g., ENVI-met, CFD [4]) and comprehensive assessment indices (e.g., UTCI [5], PET) have enabled highly accurate district-scale thermal performance evaluations [6]. Furthermore, multi-objective, intelligent optimization algorithms, such as genetic algorithms (GAs) [7], have been successfully applied to efficiently explore vast design spaces [8].
Despite these advances, critical research gaps remain, particularly regarding the specific challenges of high-intensity districts in hot–humid climate zones:
- Lack of Systemic Integration of Multi-dimensional Elements: Most existing studies tend to isolate single design elements (e.g., street orientation [9], greening coverage [10]) to determine their impacts. Although some scholars have explored combinations of factors [11], they often fail to establish a unified, automated performance-based design (PBD) framework to systematically quantify the complex, non-linear synergistic effects between building layout, geometry, and greening systems. Consequently, the resulting strategies often remain qualitative, lacking the quantifiability and operability required for complex collaborative urban planning.
- Insufficient Focus on High-Intensity Districts in Hot–Humid Climates: Current research predominantly focuses on low-density residential areas or cities in cold/temperate zones [12,13]. The existing literature often generalizes “openness” as beneficial for ventilation; however, this assumption overlooks the distinct microclimate dynamics within Shenzhen’s high-FAR urban cores. In the ultra-high-density contexts of subtropical hot–humid climates, intense solar radiation load often supersedes wind speed as the dominant driver of thermal stress. Therefore, design strategies derived from lower-density or temperate contexts may prove ineffective or even misleading when applied to these specific high-solar-load environments.
- Lack of Automated PBD Translation: Although optimization tools are widely used [8], a systematic PBD framework remains incomplete. Such a framework should automatically link multi-dimensional morphological variables, execute rigorous simulation and GA optimization (e.g., Grasshopper–Galapagos), and quantitatively translate optimal solutions into clear, actionable design guidelines for high-intensity urban renewal or new construction projects [14]. The research focus often remains on simulation analysis rather than the automated process of generating and validating performance-based design alternatives.
This study aims to address these limitations by providing a robust, systematic, and automated approach for thermal comfort optimization in challenging high-density contexts.
Recent studies have further emphasized the complexity of microclimates in densifying cities. For instance, Middel et al. (2021) [15] highlighted the limitations of vegetation in extreme heat without adequate shading. More recently, Zhang et al. (2025) [16] investigated the carbon-neutral potential of urban block morphology by balancing thermal comfort and energy consumption, while Bian et al. (2025) [17] explored multi-scale quantitative methods using multi-source data. However, a gap remains in translating these analytical findings into automated, generative design tools applicable to the retrofitting of “already built” areas. Current research often lacks a closed-loop workflow that can navigate the trade-offs between density, geometry, and greenery in a computationally efficient manner.
1.3. Research Objectives and Contributions
To address these research gaps, this study aims to construct and thoroughly validate a performance-based design (PBD) framework for the systematic optimization of outdoor thermal comfort in high-intensity urban districts. Using Shenzhen as a representative case study in the hot–humid climate zone, the ultimate goal is to generate quantifiable, actionable design guidelines that are directly applicable to urban renewal and planning practices.
The main contributions of this study are as follows:
- Systematic Integration of Multi-Dimensional Design Elements: We established a comprehensive indicator system that quantitatively integrates spatial layout (typology), building morphology (FAR, density, geometry), and greening systems (fₗ). This transcends fragmented single-factor analysis, capturing the complex synergistic effects critical for achieving optimal thermal performance in dense urban cores (Figure 1).
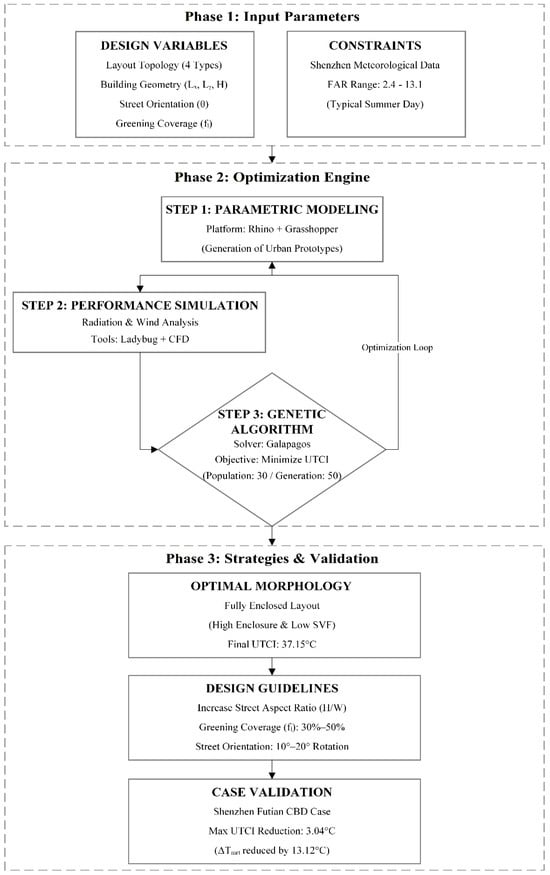 Figure 1. Framework of spatial design elements for high-density urban blocks under outdoor thermal comfort optimization.
 - Development of an Automated, Performance-Driven Workflow: We introduced an automated optimization workflow utilizing the Grasshopper–Galapagos platform. This workflow efficiently explores the vast parameter space defined by multi-dimensional indicators, identifying optimal morphological solutions specifically for minimizing the Universal Thermal Climate Index (UTCI).
- Scientific Validation and Climate Mechanism Revelation: The study provides quantitative evidence that in high hot–humid climate zones, high-enclosure urban morphology is the most effective heat mitigation strategy, scientifically challenging the common “open ventilation is better” viewpoint. This conclusion is rigorously validated through comparative simulation of a real-world case (Shenzhen Futian CBD).
- Actionable Design Guidelines: Complex optimization results are translated into clear, parameterized design constraints and strategies (e.g., optimal FAR ranges, preferred building orientations, and necessary greening coverage ratios), providing direct and quantifiable inputs for urban planners and architects.
2. Methodology
The overall research methodology follows a systematic performance-based design workflow, integrating parametric modeling, microclimate simulation, and multi-objective optimization, as illustrated in Figure 2.
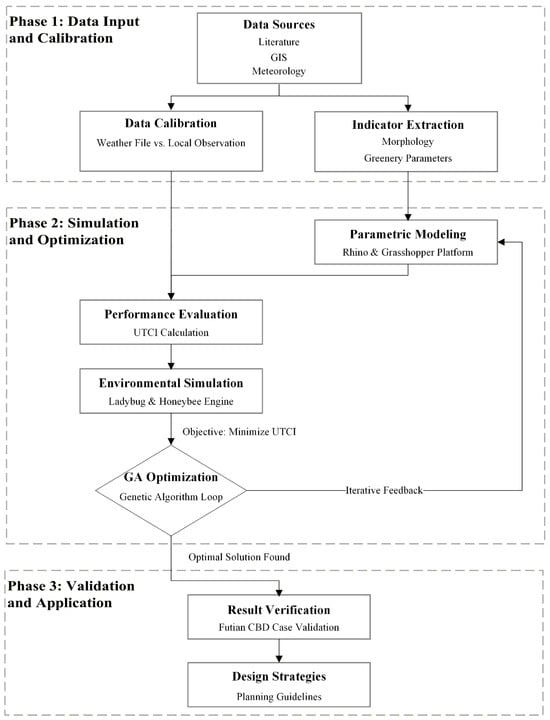
Figure 2.
Technical framework and simulation workflow for outdoor thermal comfort optimization in high-density urban blocks.
2.1. Study Area and Spatial Typologies
This study focuses on Shenzhen, China, a representative megacity characterized by a hot–humid subtropical monsoon climate and high-intensity global urban development [5]. The combination of extreme heat–humidity stress and dense high-rise urban morphology makes Shenzhen an ideal and critical case for performance-based thermal comfort optimization.
To ensure the obtained strategies are robust and broadly applicable to urban cores, this study focused on five typical high-intensity urban districts (e.g., Futian CBD, Luohu Commercial Center). From these areas, 47 representative urban blocks were extracted using standard 250 m × 250 m grid units (Figure 3 and Table 1). The screening criteria were strict, including a high floor area ratio (FAR), non-residential dominant functions, and the presence of super-high-rise building clusters (Table 2).
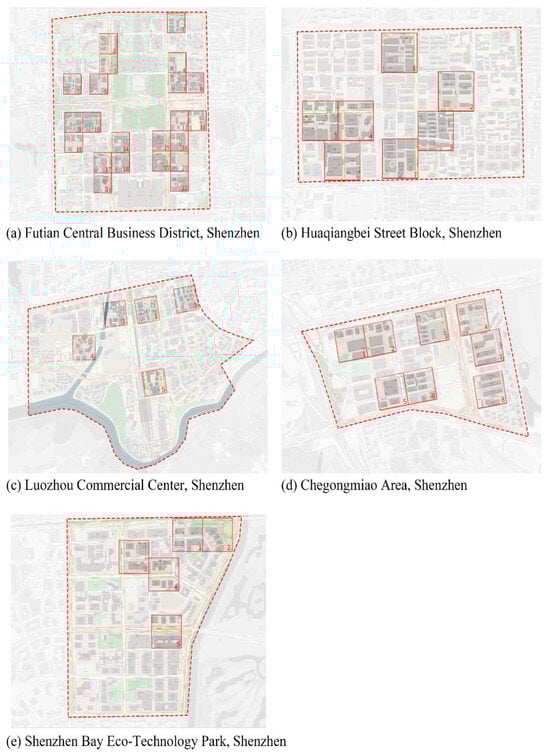
Figure 3.
Representative urban blocks selected for analysis in this study. Base map: OpenStreetMap and Google Satellite imagery; maps illustrated by the author in QGIS. (Note: The numbers (e.g., 1–22 in Futian) represent the unique identifiers of the 47 representative urban blocks, corresponding to the IDs listed in Table 1).

Table 1.
Representative neighborhood statistics.
Table 2.
Partial building unit statistics used in this study.
Subsequently, based on the degree of building enclosure and layout configuration, these 47 blocks were classified into four distinct spatial typologies to serve as the categorical optimization variable (T_layout):
- Point-Type: Characterized by isolated high-rise towers surrounded by open ground.
- Single-Sided Enclosure: Buildings arranged primarily along one main street boundary.
- Double-Sided Enclosure: Buildings forming an enclosed space along two adjacent sides.
Fully Enclosed: Buildings distributed along all four sides, forming the deepest urban canyons and maximum mutual shading (Figure 4).
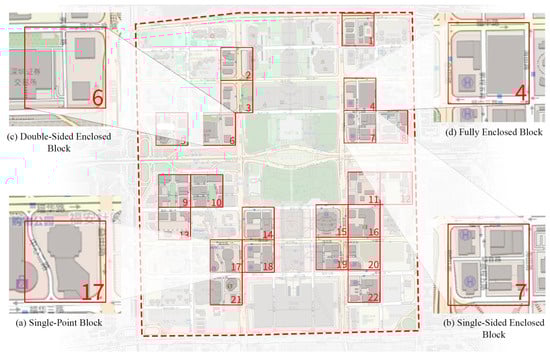
Figure 4.
Four block types used in this study: (a) single-point block; (b) single-sided enclosed block; (c) double-sided enclosed block; (d) fully enclosed block. Base map: OpenStreetMap and Google Satellite imagery; map illustrated by the author in QGIS. (Note: The numbers represent the unique identifiers of the selected urban blocks. Chinese characters in the background map indicate local road names in Futian District).
This typological approach allows the framework to generalize design principles across different high-density configurations, rather than modeling only specific, unique street blocks.
To facilitate systematic optimization and ensure that the generated designs meet high-intensity urban standards, we established a comprehensive, multi-scale design element system (Figure 5). These design elements act as “genes” (independent variables) in the optimization of the genetic algorithm (GA), enabling the framework to explore the complex relationship between urban morphology and thermal comfort.
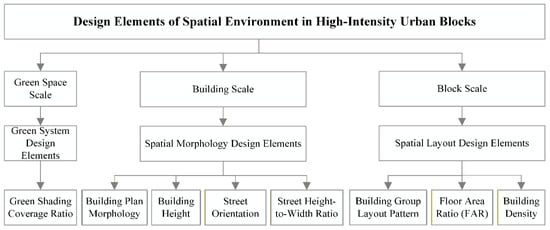
Figure 5.
Design elements of the spatial environment in high-intensity urban blocks.
2.1.1. Design Variables (Optimization Genes)
Key morphological and green infrastructure parameters were quantified across three scales and defined as optimization variables with specific value ranges (Table 3):
Table 3.
Design variables and parameter ranges used in the optimization framework.
Simulation Settings: To ensure reproducibility, the green infrastructure was modeled using generic broad-leaved trees suitable for Shenzhen’s climate. The Leaf Area Index (LAI) was set to 4.0, representing mature vegetation. The canopy reflectivity was set to 0.25.
2.1.2. Design Constraints and Quantitative Indicators
To maintain functional urban density throughout the optimization process, we tracked key constraints and resulting morphological indicators for the proposed typologies (Figure 6):
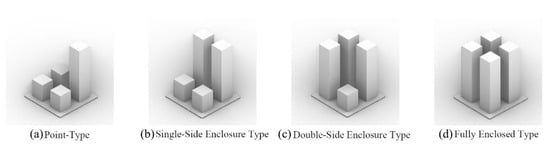
Figure 6.
Four types of building group layout patterns used in this study.
- FAR and Building Density (BD): These critical indicators are dynamically calculated for each generated design variant. A Python 2.7 script is integrated into the workflow to filter solutions, ensuring the final FAR remains within the realistic range of 2.4 to 13.1, reflecting standards in Shenzhen’s high-intensity core districts [18].
- Sky View Factor (SVF): This dimensionless parameter is dynamically calculated and is crucial for linking geometry to radiative exchange. A lower SVF (a direct result of a high street aspect ratio H/W) typically implies reduced solar radiation reaching the pedestrian level, which is vital in hot–humid climates [3].
- Mean Radiant Temperature (Tmrt): Although not the primary optimization objective, Tmrt is the most critical input component of UTCI; it is highly sensitive to shading from buildings and vegetation and serves as a key intermediate performance indicator.
2.2. Simulation Platform and UTCI-GA Optimization Workflow
2.2.1. Performance Indicators and Simulation Platform
The Universal Thermal Climate Index (UTCI) was selected as the core performance metric and the fitness function for the GA. UTCI is prioritized due to its dynamic responsiveness to all four components of the human heat balance, making it highly suitable for outdoor assessment in dynamic subtropical environments [5]. The simulation platform is built within the Rhino 7 and Grasshopper parametric environment, integrating Ladybug Tools (Version 1.6) (for radiation/UTCI calculation) and CFD modules (for wind field analysis) to capture comprehensive microclimate effects [4,19].
2.2.2. Meteorological Data Calibration
Raw weather data (EnergyPlus (Version 23.1) SWERA files) were rigorously calibrated against high-resolution (5-min interval) observation data from the Shenzhen Meteorological Bureau [2]. This step is crucial to ensuring that the simulated microclimate conditions (air temperature, humidity, and wind speed) accurately reflect local conditions in high-intensity urban cores, which often deviate significantly from standard suburban weather station records. The simulation period was set to 9 July, 9:00 to 17:00, representing a typical peak heat stress period in Shenzhen’s summer.
2.2.3. Automated Genetic Algorithm (GA) Optimization
Optimization was executed using the Galapagos solver in Grasshopper, which employs evolutionary algorithms to minimize the objective function (Figure 7).
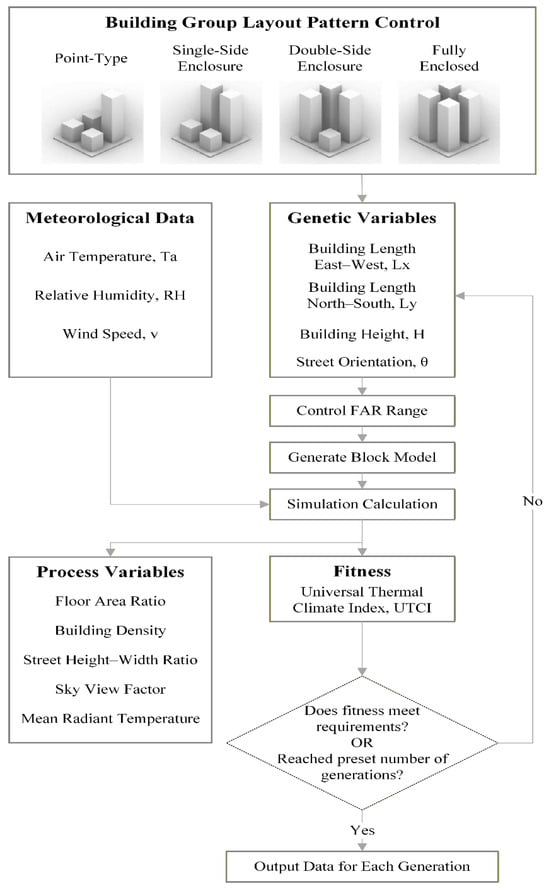
Figure 7.
Optimization workflow for outdoor thermal comfort simulation.
- Objective Function (Fitness): Minimize the average UTCI value (UTCI_avg) during peak hours (9:00–17:00).
- Optimization Phases: The process was structured into two distinct phases to analyze synergistic effects:
- o
- Phase I (Morphology-Only Optimization): GA optimizes only the variables of layout and building geometry (T_layout, Lx, Lγ, H, θ). This phase establishes the baseline cooling potential derived purely from passive shading and airflow control.
- o
- Phase II (Integrated Greening Optimization): It introduces the Green Shading Coverage Ratio (fₗ) as an additional parameter. This phase explores the maximum thermal benefits achievable when building morphology and green infrastructure are optimized synergistically.
- Implementation Details: The optimization ran for 50 generations with 30 individuals per generation. This setting (1500 iterations per run) was selected based on a convergence test, which showed that the fitness values stabilized after the 40th generation, ensuring a balance between computational efficiency and solution quality.
Optimization Strategy: While urban microclimate is a multi-objective problem, this study deliberately selected UTCI as the single objective function. UTCI is inherently a comprehensive index that integrates air temperature, humidity, wind speed, and mean radiant temperature. Therefore, minimizing UTCI effectively captures the combined effects of these variables without the high computational cost of multi-objective Pareto optimization, making the tool more viable for rapid iteration in practical urban planning.
2.2.4. Statistical Analysis
Upon completion of the GA optimization, statistical analysis was performed using IBM SPSS Statistics (Version 26.0):
- Pearson correlation analysis, used to quantify the linear relationship and significance between optimization genes (e.g., FAR, BD, fₗ) and thermal performance indicators (UTCI).
- Multiple linear regression, used to establish prediction models and demonstrate the relative contribution of each design parameter to the total variation in UTCI. High goodness-of-fit (R2 > 0.99) ensures that the model provides reliable design guidance.
2.3. Validation Protocol: Futian CBD Case Study
To confirm the practical applicability and effectiveness of the obtained optimization strategies, a comparative simulation experiment was conducted using a representative block within Shenzhen’s Futian Central Business District (CBD) as a real-world base model (Figure 8) [20]. The validation protocol involved comparing three simulation scenarios:
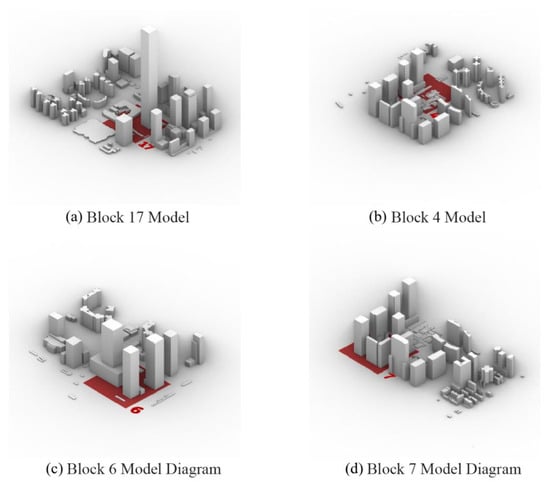
Figure 8.
Block model diagrams. (Note: Red areas indicate site boundaries; numbers represent block IDs).
- Baseline Group represents the current, existing spatial configuration of the Futian CBD block.
- Morphology-Only Optimization Group applies key optimal morphological parameters from GA Optimization Phase I (e.g., fully enclosed layout, high $H/W$ ratio) without adding greening.
- Integrated Greening Optimization Group applies comprehensive optimal parameters from GA Optimization Phase II, including the combination of optimal morphology and optimal green shading coverage (fₗ ≈ 44%).
Comparison of UTCI and Tₘᵣₜ results across these three groups quantifies the thermal comfort improvement derived from pure morphological changes and the additional synergistic benefits provided by the integrated greening system.
3. Results
3.1. Optimization Convergence and Layout Performance Comparison
The automated optimization process (GA) based on the multi-dimensional design parameter space demonstrated high efficiency and successful convergence in minimizing outdoor heat stress.
3.1.1. Convergence Trends
Optimization trajectories for all four spatial typologies (point, single-sided, double-sided, and fully enclosed) displayed clear, monotonic downward trends in Universal Thermal Climate Index (UTCI) and Mean Radiant Temperature (Tₘᵣₜ) as generations progressed (see Figure 9 and Figure 10). This rapid convergence confirms the robustness and efficiency of the parametric GA workflow in identifying superior design solutions under established constraints. UTCI values rapidly stabilized from initial unoptimized values near 40.5–41.0 °C, highlighting the framework’s ability to quickly transform low-performance designs into thermally optimized forms.
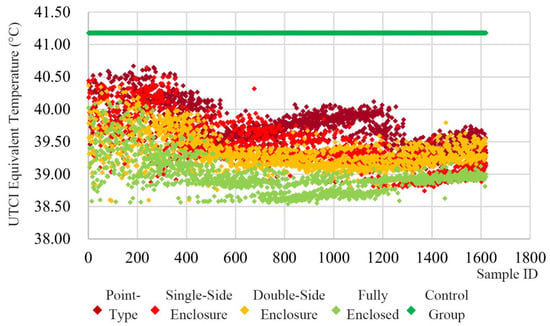
Figure 9.
UTCI variation across four building layout patterns.
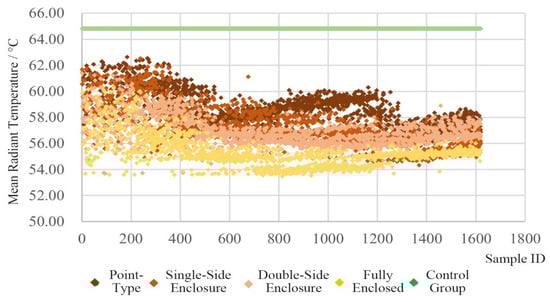
Figure 10.
Mean radiant temperature (Tmrt) variation across four building layout patterns.
3.1.2. Layout Performance Comparison (Phase I: Morphology Only)
The comparative analysis in Phase I (Morphology-Only) reveals a critical morphological rule: in Shenzhen’s hot–humid climate, the degree of enclosure is positively correlated with thermal stress mitigation. The results uncover a counter-intuitive finding: the “Fully Enclosed” layout, typically assumed to have the poorest ventilation, achieved the lowest UTCI.
- Optimal Performance: The fully enclosed layout consistently exhibited the best performance, achieving the most significant reduction in UTCI. The final optimized UTCI_avg for this typology dropped from an initial unoptimized value of 40.11 °C to 38.54 °C (a total reduction of ~1.57 °C).
- Enclosure Ranking: Thermal comfort performance showed a strong correlation with the degree of enclosure: fully enclosed (38.54 °C) < double-sided (38.59 °C) < single-sided (38.74 °C) < point-type (39.08 °C).
- Mechanism: The superior performance of enclosed layouts is primarily attributed to a significant reduction in Tmrt values. The mechanism analysis confirms that the superiority of the fully enclosed layout stems from the significant compression of the sky view factor (SVF) by deep canyons, which effectively blocks direct shortwave radiation. Given Shenzhen’s low wind speed context, the benefit of radiative cooling outweighs the negative impact of reduced wind speed. This explains why higher enclosure leads to more significant improvements in UTCI.
3.2. Quantitative Impact Analysis of Multi-Dimensional Parameters
To establish clear design guidance, we conducted rigorous statistical analysis on the large dataset generated by GA (over 6400 design variants) to quantify the impact of multi-dimensional design parameters on UTCI performance.
3.2.1. Correlation Analysis (Pearson Coefficient)
Pearson correlation analysis confirmed strong relationships between key morphological indicators and thermal comfort across all typologies (Table 4):
Table 4.
Correlation between UTCI and key morphological indicators.
- Urban Density Indicators: Floor Area Ratio (FAR) and Building Density (BD) showed strong negative correlations with UTCI (r(FAR) ≈ −0.95, r(BD) ≈ −0.91). This strong negative correlation powerfully challenges the traditional notion that “lower density is more comfortable.” The data indicate that, provided their geometry is optimized for shading, more compact and dense urban forms can actually deliver superior outdoor thermal comfort in this climate.
- Geometry and Greening Factors: The analysis further highlighted the critical roles of key geometric parameters (e.g., Street Aspect Ratio H/W) and Green Shading Coverage Ratio (fₗ). Greening coverage showed a robust negative correlation (r ≈ −0.75), confirming its significant impact on thermal mitigation through shading and evapotranspiration.
3.2.2. Multiple Linear Regression Model
We established a multiple linear regression model to predict UTCI based on optimized design parameters (Adjusted R2 = 0.992, confirming excellent model fit and explanatory power). The resulting standardized regression coefficients (Beta) reveal the relative importance of each design parameter (Table 5):
Table 5.
Regression coefficients.
The coefficients indicate the following:
- Dominant Factor (fl): The standardized coefficient (Beta ≈ −0.678) establishes the Green Shading Coverage Ratio (fl) as the single most determinant variable. This implies that, building upon passive morphological optimization, the active introduction of green infrastructure offers the highest marginal return on thermal comfort.
- Morphological Importance: Building dimensions (Lx and Ly) and average height (H) also showed significant, quantifiable impacts, supporting strategies that utilize high-rise, long-façade buildings to maximize mutual shading.
Mechanistically, the correlation and regression results jointly confirm that thermal environment control in hot–humid regions is dominated by radiation rather than wind speed. The highest-weighted green shading coverage (fl) achieves direct cooling by reducing MRT, while geometric parameters (Lx, Ly, H) create stable shading by increasing H/W, collectively pointing to “reducing radiation exposure” as the core mechanism. In contrast, ventilation improvement has a limited impact in a low-wind background, so the optimization path must center on radiation control.
3.3. Futian CBD Case Study Validation Results
To confirm the practical feasibility and effectiveness of the PBD framework, we conducted a comparative simulation experiment on a real-world block in Shenzhen Futian CBD.
3.3.1. Quantification of Performance Enhancement
The validation protocol compared three different experimental groups, with the results summarized in Table 6.
Table 6.
Thermal performance comparison across baseline, morphology-only optimization, and integrated greening optimization.
- Overall Improvement: The comprehensive performance assessment (Figure 11) shows that, compared to the baseline, the Integrated Greening Optimization scenario achieved a total UTCI reduction of 3.04 °C and a maximum Tmrt reduction of 13.12 °C. This confirms the remarkable potential of optimized morphology and greening systems in real-world, high-intensity contexts.
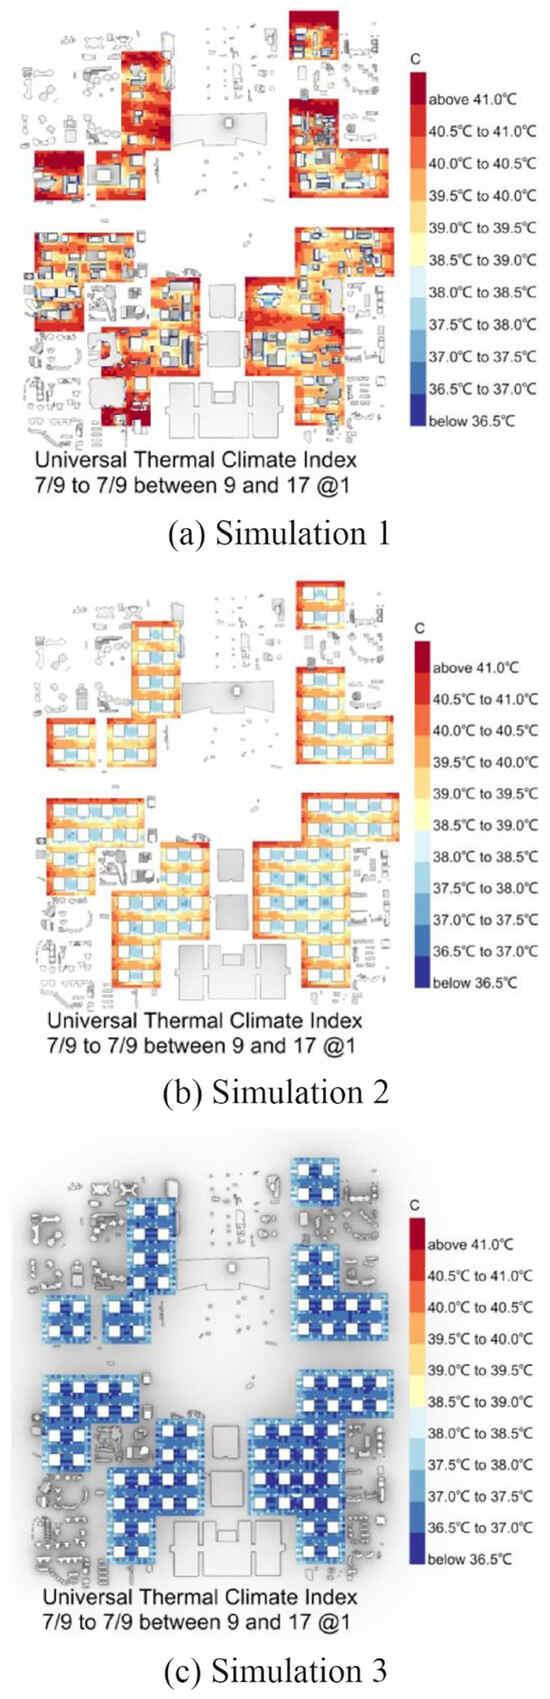 Figure 11. Heat maps of the UTCI equivalent temperature under three simulation scenarios.
3.3.2. Quantification of Synergistic Contributions
By comparing the Morphology-Only Optimization Group (optimized form, no greening) with the Integrated Greening Optimization Group (optimized form + optimal greening), we precisely quantified the synergistic effect of the greening system:
- Morphological Contribution: UTCI reduced by 1.25 °C (40.19–38.94 °C).
- Synergistic Greening Contribution: UTCI further reduced by 1.79 °C (38.94–37.15 °C).
Notably, while pure morphology optimization contributed a baseline cooling of 1.25 °C, the addition of the greening system contributed a further 1.79 °C reduction through non-linear synergistic effects. The real-world validation confirms that “Structural Shading + Biological Cooling” constitutes the most efficient composite cooling pathway in hot–humid climates. Morphological optimization first weakens the background radiation field by reducing SVF, thereby creating more favorable microclimatic conditions for efficient vegetation evapotranspiration.
4. Discussion
4.1. Scientific Debate: Establishing the “Structural Shading First” Design Principle
The optimization results reveal a core scientific discovery that establishes a “Structural Shading First” design principle. The fully enclosed layout proved to be the most effective morphology for mitigating thermal stress, achieving the lowest average UTCI. This conclusion powerfully challenges the existing paradigm in traditional planning that blindly prioritizes “openness for ventilation”.
In high-intensity urban districts, background wind speeds (Va) are already significantly suppressed by dense building clusters. Consequently, attempting to gain marginal ventilation benefits through open layouts is far less effective than directly intercepting solar radiation through compact morphology. This mechanism is confirmed by the drastic reduction in mean radiant temperature (Tmrt) within enclosed spaces. The high aspect ratio (H/W) and low sky view factor (SVF) of the full enclosure typology maximize mutual shading between buildings, thereby cutting off the primary heat source—shortwave radiation.
Therefore, this study corrects the assumption, favored in temperate or arid climate studies, that open blocks are superior. We propose a theoretical refinement: in the high-density, high-radiation context of hot–humid climates, the thermal benefit of maximizing structural shading outweighs the negative impact of sacrificing ventilation. It is worth noting that, while the optimized UTCI of 37.15 °C represents a significant improvement, it remains within the ‘strong heat stress’ category. This indicates that morphology optimization alone has limits and should be coupled with active adaptation measures (e.g., air-conditioned shelters) in extreme summer conditions.
4.2. Non-Linear Synergistic Effects of Morphology and Green Infrastructure
The two-stage PBD framework successfully quantified the non-linear synergistic relationship between passive morphology and active green infrastructure. While pure morphology optimization (Phase I) provided a baseline cooling of 1.25 °C (UTCI), the integrated greening system (Phase II) delivered a significant additional cooling effect of 1.79 °C.
This indicates that it is not merely an additive effect. The optimized high-enclosure morphology acts as a “radiation shelter.” By first reducing the background environmental temperature through building shadow, it protects street-level vegetation from extreme solar exposure, thereby amplifying the cooling efficiency of evapotranspiration and the comfort provided by tree canopies. This finding validates the comprehensive advantage of the PBD framework, proving that achieving optimal thermal comfort requires a coupled mechanism where “morphology protects greenery, and greenery feeds back to the environment,” rather than deploying compact forms or greenery in isolation.
4.3. Validity and Limitations of Statistical Models
Reviewer 3 raised a valid concern regarding the extremely high goodness-of-fit (R2 > 0.99) in our regression model. It is important to clarify that this regression is based on simulation-generated data from the GA process, not noisy field measurement data. Therefore, the high correlation reflects the internal consistency of the physics-based simulation engine (Ladybug/EnergyPlus) rather than overfitting. However, we acknowledge that high collinearity exists between variables such as SVF and H/W. The regression serves primarily to rank the relative impact of design parameters rather than to predict exact temperatures in unknown environments.
4.4. Trade-Offs: Summer Cooling vs. Other Factors
While this study identifies the “fully enclosed” layout as optimal for summer heat mitigation in Shenzhen, we must acknowledge the associated trade-offs. As noted in recent literature (e.g., [15,16]), high enclosure can reduce nocturnal cooling by trapping longwave radiation, and it may hinder the dispersion of air pollutants at street level. Additionally, in winter, excessive shading might reduce desirable solar gain. However, given Shenzhen’s subtropical climate, where cooling demand dominates for over seven months of the year, prioritizing summer shading remains a justifiable strategy for thermal safety, although designers should consider local wind corridors to mitigate pollution risks.
4.5. Actionable Design Strategies for High-Intensity Districts
Based on quantitative results from GA and statistical analysis, this study proposes specific quantitative design guidelines for urban renewal and new projects in hot–humid high-intensity districts:
- Layout Priority (Structural Shading): Designers should prioritize fully enclosed or double-sided enclosed layouts. In TOD development zones or high-density regulatory plans, street aspect ratios (H/W) should be increased by matching building height and density, shifting focus from promoting general airflow to maximizing mutual shading, which is the most robust heat defense mechanism in this climate.
- Morphological Control (Orientation and Dimensions): The regression analysis indicates that building dimensions should be optimized to maximize North–South façade length (Lγ). In street design, it is recommended to rotate street orientation 10–20° east or west to reduce direct solar exposure on main streets during noon hours, casting longer, more protective shadows on pedestrian paths.
- Greening Strategy (Target Coverage): To achieve effective cooling synergies, urban renewal projects must set green shading coverage (fₗ) targets between 30% and 50% along key pedestrian corridors. Strategically, tree canopy coverage should be prioritized over shrubbery to achieve the dual synergy of radiation interception and transpiration cooling.
- Microclimate Zoning Control: We recommend introducing SVF-based control thresholds (e.g., SVF ≤ 0.25) in planning practice to delineate thermal risk levels and implement targeted spatial interventions.
4.6. Discussion on Climate Zone Applicability
The design recommendations of this study have significant climate-specific applicability. The findings are primarily applicable to hot–humid climate zones characterized by “High Humidity + Low Wind + Strong Solar Radiation” (e.g., coastal Southern China, Southeast Asia). In contrast, in arid–hot zones, open blocks might still be advantageous due to strong evaporation potential and high background wind speeds; in temperate regions, optimal solutions need to balance shading with winter wind protection/solar access. Therefore, when generalizing the conclusions of this study, the dominant physical mechanisms of the local climate must be fully considered.
5. Conclusions
5.1. Research Conclusions
This study successfully constructed and validated a performance-based design (PBD) framework for systematically optimizing outdoor thermal comfort in high-intensity urban districts with hot–humid climates. By integrating a multi-dimensional design element system with an automated genetic algorithm (GA) workflow, the following key conclusions were drawn:
- Optimal Morphological Typology: Under Shenzhen’s climate conditions, a higher degree of urban enclosure is the most effective strategy for mitigating heat stress. The fully enclosed layout consistently demonstrated the best performance, with its optimized UTCI value dropping from 40.11 °C to 38.54 °C. This verifies the dominant role of structural shading in thermal comfort within high-solar-load regions.
- Synergistic Effectiveness of Integrated Systems: The integration of the greening system demonstrated significant synergistic effects. Compared to the morphology-only optimization scenario, the comprehensive optimization scenario achieved an additional 1.79 °C UTCI reduction, leading to a total maximum reduction of 3.04 °C.
- Framework Validation: Empirical validation based on the Futian CBD case confirmed the feasibility and effectiveness of the PBD framework in realistic high-density urban contexts.
5.2. Practical Application in Urban Renewal
This framework is not limited to new constructions. It offers significant value for urban renewal projects in high-density districts such as Futian CBD. Since building footprints in these areas are often fixed, the framework can be used to optimize “soft” interventions—specifically, identifying the optimal locations for increasing green shading coverage (fl) and modifying street canyons through façade retrofitting to reduce SVF. This shifts the focus from “demolish and rebuild” to “diagnose and retrofit,” providing a cost-effective pathway to climate resilience.
Theoretically, this study provides a highly quantitative and systematic methodology that transcends traditional single-factor analysis. It powerfully demonstrates that, in subtropical hot–humid climate zones, outdoor thermal comfort can be improved by leveraging high-density urban morphology for strategic shading, quantifying the non-linear synergistic effect of “Morphology + Greening.”
5.3. Limitations and Future Prospects
This study has some limitations. The current optimization mainly targets extreme summer thermal environments, lacking a balanced consideration of winter sunlight requirements throughout the year. Additionally, the greening system modeling was simplified to a shading coverage ratio without exhaustively considering physiological differences among plant species. Future research should focus on the following:
- Year-round Balanced Optimization—expanding to multi-objective optimization to balance summer cooling with winter solar access.
- Refined Vegetation Modeling—incorporating plant physiological models to accurately simulate the cooling benefits of different vegetation configurations.
- Universality Validation—applying the PBD framework to high-density cities in arid–hot or cold climates to verify its cross-climate universality.
Author Contributions
Conceptualization, J.Z.; Methodology, J.Z.; Software, W.L. and H.C.; Formal analysis, J.Z.; Investigation, J.Z., W.L. and H.C.; Data curation, H.C.; Writing―original draft, J.Z.; Writing―review and editing, J.Z. and J.G.; Visualization, J.Z. and W.L.; Supervision, J.G. All authors have read and agreed to the published version of the manuscript.
Funding
This research received no external funding.
Data Availability Statement
The datasets presented in this article are not readily available because the data are part of an ongoing study. Requests for accessing the datasets should be directed to the corresponding author.
Conflicts of Interest
The authors declare no conflicts of interest.
References
- Calvin, K.; Dasgupta, D.; Krinner, G.; Mukherji, A.; Thorne, P.W.; Trisos, C.; Romero, J.; Aldunce, P.; Barrett, K.; Blanco, G.; et al. IPCC, 2023: Climate Change 2023: Synthesis Report; Intergovernmental Panel on Climate Change (IPCC): Geneva, Switzerland, 2023. [Google Scholar] [CrossRef]
- Shenzhen National Climate Observatory. Bulletin of Urban Heat Island Monitoring in Shenzhen 2020; Shenzhen National Climate Observatory: Shenzhen, China, 2020; (In Chinese). Available online: https://weather.sz.gov.cn/ (accessed on 11 January 2026).
- Oke, T.R. Canyon geometry and the nocturnal urban heat island: Comparison of scale model and field observations. J. Climatol. 1981, 1, 237–254. [Google Scholar] [CrossRef]
- Chang, X. Evaluation of Outdoor Thermal Comfort and Spatial Morphology Optimization Strategies for Huaihe Road Pedestrian Block in Hefei Based on ENVI-Met. Master’s Thesis, Anhui Jianzhu University, Hefei, China, 2023. (In Chinese) [Google Scholar]
- Jendritzky, G.; de Dear, R.; Havenith, G. UTCI—Why another thermal index? Int. J. Biometeorol. 2012, 56, 421–428. [Google Scholar] [CrossRef] [PubMed]
- Acero, J.A.; Koh, E.J.; Ruefenacht, L.A.; Norford, L.K. Modelling the influence of high-rise urban geometry on outdoor thermal comfort in Singapore. Urban Clim. 2021, 36, 100775. [Google Scholar] [CrossRef]
- Holland, J.H. Adaptation in Natural and Artificial Systems: An Introductory Analysis with Applications to Biology, Control, and Artificial Intelligence; Society for Industrial and Applied Mathematics: Philadelphia, PA, USA, 1976. [Google Scholar]
- Contreras, R.F.; Moyano, J.; Rico, F. Genetic algorithm-based approach for optimizing the energy rating on existing buildings. Build. Serv. Eng. Res. Technol. 2016, 37, 664–681. [Google Scholar] [CrossRef]
- Yun, S.H.; Lee, D.K.; Piao, Z.G.; Park, C.Y.; Kim, S.H.; Kim, E.S. Developing a three-dimensional urban surface model for spatiotemporal analysis of thermal comfort with respect to street direction. Sustain. Cities Soc. 2023, 97, 104721. [Google Scholar] [CrossRef]
- Srivanit, M.; Jareemit, D. Modeling the influences of layouts of residential townhouses and tree-planting patterns on outdoor thermal comfort in Bangkok suburb. J. Build. Eng. 2020, 30, 101262. [Google Scholar] [CrossRef]
- He, Y.; Gu, C. A Study of the Impact of Spatial Design on the Outdoor Thermal Environment in High-density Cities in Southern China. Des. Community 2024, 6, 35–43. (In Chinese) [Google Scholar]
- Gao, Q.; Li, T.; Liu, X.; Wang, Y.; Wang, S.; Jia, Y. Outdoor thermal comfort of high-rise and multi-storey residential areas: Comparison and optimisation. Sustain. Cities Soc. 2025, 131, 106707. [Google Scholar] [CrossRef]
- Sundus, S.; Bassam, A.H. The effect of building height diversity on outdoor microclimate conditions in hot climate: A case study of Dubai-UAE. Urban Clim. 2020, 32, 100611. [Google Scholar] [CrossRef]
- Nazarian, N.; Acero, J.A.; Norford, L. Outdoor thermal comfort autonomy: Performance metrics for climate-conscious urban design. Build. Environ. 2019, 155, 145–160. [Google Scholar] [CrossRef]
- Middel, A.; AlKhaled, S.; Schneider, F.A.; Hagen, B.; Coseo, P. 50 Grades of Shade: Understanding the Cooling Effects of Natural and Nonnatural Urban Shading. Bull. Am. Meteorol. Soc. 2021, 102, E1805–E1820. [Google Scholar] [CrossRef]
- Zhang, L.; Wei, D.; Jim, C.Y. Carbon-neutral potential of urban block morphology design: Balancing thermal comfort and energy consumption in hot-summer and cold-winter climates. Build. Environ. 2025, 268, 112658. [Google Scholar] [CrossRef]
- Bian, C.; Lee, C.C.; Chen, X.; Li, C.Y.; Hu, P. Quantifying the Thermal and Energy Impacts of Urban Morphology Using Multi-Source Data: A Multi-Scale Study in Coastal High-Density Contexts. Buildings 2025, 15, 2266. [Google Scholar] [CrossRef]
- Shenzhen Municipal Bureau of Planning and Natural Resources. Shenzhen Urban Planning Standards and Guidelines (2021 Edition); Shenzhen Municipal Bureau of Planning and Natural Resources: Shenzhen, China, 2021. (In Chinese) [Google Scholar]
- Zhang, G.; Liu, Y.; Zhu, S. ENVI-met simulation and analysis of the impact of urban building layout elements on regional thermal environment: A case study of parts of Jiangbei New Area, Nanjing. Clim. Environ. Res. 2022, 27, 513–522. (In Chinese) [Google Scholar] [CrossRef]
- Urban Planning Committee of Shenzhen. Statutory Plan of Shenzhen Futian Central District: NO.FT01-01&02/03; Urban Planning Committee of Shenzhen: Shenzhen, China, 2018. (In Chinese) [Google Scholar]
Disclaimer/Publisher’s Note: The statements, opinions and data contained in all publications are solely those of the individual author(s) and contributor(s) and not of MDPI and/or the editor(s). MDPI and/or the editor(s) disclaim responsibility for any injury to people or property resulting from any ideas, methods, instructions or products referred to in the content. |
© 2026 by the authors. Licensee MDPI, Basel, Switzerland. This article is an open access article distributed under the terms and conditions of the Creative Commons Attribution (CC BY) license.