Abstract
This paper presents a PRISMA-ScR scoping review of 20 digital maturity assessment tools in the architecture, engineering, and construction (AEC) sector and wider business domains. The objective is to compare key features including assessment matrices, maturity dimensions, completion time, accessibility, and platform availability. The review follows predefined eligibility criteria and a structured screening process to identify and analyse tool frameworks in terms of scope, metrics, platform type, usability, and focus areas. Most tools primarily target the AEC sector, while some address broader organisational digital transformation. Common maturity areas include technology, organisation, data management, and processes. The analysis highlights limitations such as underemphasis on people, strategy, policy, skills development, standards, and financial resources, as well as the fragmented integration of maturity components. A combined bottom-up (scoring) and top-down (dimension structuring) approach is recommended for future tool development. The review provides insights for practitioners when selecting tools and proposes guidelines for creating more comprehensive and integrated maturity models.
1. Introduction
Digital transformation (DT) is essential for businesses of all sizes, allowing a rapid evaluation of the processes, competencies, tools and practices [1], to address the increasing demands of partners, employees and customers [2]. This transformation is enabled by integrating digital technologies such as cloud computing, big data, social media, and mobile internet [3], driving industries to innovate and create new business models [4] and involves a transition by integrating new technologies into current business models. Digitalisation has accelerated industry advancement by enhancing connectivity, speed and manageability, simplifying access to critical data and essential information [5]. Organisations embracing digitalisation can significantly enhance their competitiveness, while those delaying adoption often find maintaining profitability to be challenging [6,7].
A major challenge in today’s global economy is fostering innovation and implementing digital initiatives within businesses [8]. It is essential to acknowledge the critical role of small and medium-sized enterprises (SMEs) in this context [9]. According to Akinsola [10], drawing on World Bank Group data, SMEs generate “more than half of all formal jobs worldwide and offer effective solutions to crucial development challenges”. SMEs play an important role in the global economy and have the potential to contribute substantially to global economic growth through digital endeavours. It would be prudent for organisations to evaluate their existing capabilities and anticipated needs to ascertain their digital maturity prior to initiating novel digital ventures, including services, tools, and processes [11]. Digitalisation has played a transformative role in the construction industry, evolving it from a traditionally fragmented ecosystem into a more integrated and collaborative environment [11]. A key enabler of this shift is building information modelling (BIM), which facilitates streamlined and structured information exchanges among diverse stakeholders throughout a project lifecycle. Rather than merely improving data access, BIM supports real-time collaboration, clash detection, lifecycle asset management, and decision-making processes, functions that are critical in the context of digital maturity [12,13]. As such, BIM maturity is often used as a proxy indicator for overall digital maturity in construction firms. However, despite its importance, many digital maturity assessment tools either inadequately address BIM-specific capabilities or incorporate them only superficially [14,15]. This highlights a crucial gap in existing evaluation frameworks, particularly in aligning digital maturity with BIM implementation readiness and effectiveness. This emphasis on BIM reflects the broader evolution of digitalisation in the construction industry from isolated applications to IT-driven, collaborative frameworks that require organisation-wide adoption [16]. Consequently, the challenges of BIM implementation have also evolved, shifting from purely technical issues to continuous process integration and change management [17,18,19]. In this context, evaluating an organisation’s digital maturity becomes critical for digital transformation leaders and industry stakeholders to identify appropriate improvement pathways [20].
Despite the increasing number of digital maturity assessment tools available to construction organisations, the landscape remains highly fragmented: tools differ in scope, maturity dimensions, assessment criteria, granularity, and evidence requirements [21]. Prior reviews of digital maturity tools across various sectors report promising progress [22,23,24,25,26,27,28,29,30], yet the knowledge remains dispersed and difficult for practitioners to apply. The construction sector in particular lacks a consolidated understanding of how existing tools cover critical dimensions such as people, processes, culture, policy, data governance, and training. These gaps create challenges for industry stakeholders who must select an appropriate tool, interpret scores, and translate results into actionable improvement plans. Accordingly, this study addresses a clear industry and research need by systematically evaluating 20 digital maturity assessment tools—developed by academia and industry and which are government-backed—to determine their suitability for the AEC sector. The review analyses each tool against multiple criteria, including maturity dimensions, evaluation matrices, assessment questions, accessibility, and platform type, offering a structured comparison that clarifies current strengths, limitations, and areas requiring enhancement. To guide this investigation, the study addresses the following research questions:
RQ1:
How comprehensively do existing digital maturity assessment tools cover the technological, organisational, people-centric, cultural, and governance dimensions relevant to AEC digitalisation?
RQ2:
What limitations and gaps exist within current tools, and how can these insights inform the development of an improved, industry-appropriate digital maturity framework for the AEC sector?
By answering these questions, the study provides a theoretically grounded and practice-oriented foundation that assists organisations in selecting suitable tools, interpreting maturity results, and planning structured digital transformation pathways tailored to construction sector priorities.
2. Background
DT has redefined how organisations design processes, develop competencies, and make strategic decisions, moving far beyond the adoption of discrete technologies. Foundational reviews define DT as a multilevel organisational change process in which digital technologies reshape structures, workflows, and performance outcomes [1], while large-scale management studies emphasize that leadership, strategy, and organisational agility, not technology alone, are decisive determinants of digital maturity [31]. In parallel, general maturity model theory provides important scaffolding. Early models such as the capability maturity model (CMM) conceptualized maturity as staged organisational progression, linking process formalization to predictable performance outcomes [32]. More contemporary digital transformation and information systems maturity frameworks, such as the state-of-the-art synthesis of maturity models for information systems by Proença and Borbinha [33] and Teece’s dynamic capabilities perspective [34], highlight that digital maturity emerges from a combination of technology, organisational capabilities, learning capacity, governance, culture, and strategic alignment. These wider theories reinforce the idea that digitalisation cannot be evaluated solely through technical indicators but must incorporate people, processes, culture, and governance.
In the construction industry, these cross-sector principles are complicated by structural fragmentation, multi-stakeholder coordination needs, and lifecycle information flows. As a result, assessing an organisation’s “digital maturity” becomes a practical prerequisite for structured improvement. Within the AEC sector, BIM has become a central mechanism of digitalisation because it operates on information management across design, delivery, and asset operations. BIM literature demonstrates how common data environments, model-based coordination, and standardised information exchanges generate measurable gains in collaboration, efficiency, and downstream asset performance [12].
Consequently, many organisations use BIM capability or maturity as a leading proxy for broader digital readiness. However, existing BIM tools vary widely: some emphasize the technological implementation or model quality, whereas people-centred, cultural, and governance aspects remain underdeveloped. Cross-industry research reinforces these observations. A comprehensive systematic scoping review spanning manufacturing, IT, public administration, and AEC sectors [35] shows that maturity frameworks consistently converge around multidimensional constructs encompassing technology, processes, people, culture, leadership, strategy, and data governance. This cross-sector evidence positions digital maturity as an organisational capability system rather than a technology-centric phenomenon, strengthening the rationale for balanced assessment structures that extend beyond BIM implementation alone. Building on these broader insights, seminal BIM-focused work introduced maturity constructs and matrix linking stages, competency sets, and organisational scales, establishing a research tradition for measuring progress and planning capability development [16,36]. Complementary frameworks emphasize role-specific competencies, professional development, and organisational learning [20], while enterprise-level digitalisation studies now incorporate dimensions validated in construction firms to assess digital transformation progress beyond BIM alone [37].
Despite these advances, comparative evaluations highlight substantial variation in scope, granularity, and evidence requirements. Tools range from rapid scans and checklists to comprehensive, multi-layered matrices with detailed subdimensions and staged descriptors [22,38]. These discrepancies mirror patterns observed in other industries, where maturity assessments increasingly incorporate multidimensional perspectives technology, processes, organisation, culture, and governance to prevent overemphasis on technological factors while underrepresenting people, leadership, and strategy. For the AEC specifically, recent reviews point to persistent gaps in standards alignment [39], coverage of lifecycle stages beyond design and construction, and explicit treatment of data governance, security, interoperability/compliance checking, and financial or procurement considerations. These limitations motivate more integrated assessment designs that combine bottom-up scoring (granular, auditable indicators) with top-down structuring anchored in recognised information management standards, strategic objectives, and organisational capability theory. The comparative analysis in our review reflects these trends, revealing uneven coverage across technology, organisation/management, data and processes, and, especially, the limited treatment of culture, skills/training, policy, governance, and finance, all of which are essential for sustained and scalable digital adoption.
Against this backdrop, using BIM maturity as a conceptual foundation becomes justified not because BIM alone defines digital transformation, but because BIM acts as the information backbone of AEC digitalisation. BIM-based workflows require integration across technology, people, processes, standards, and governance, therefore offering a practical entry point for operationalizing broader DT principles. This study further strengthens the theoretical base by grounding its maturity structure in (i) cross-industry DT frameworks, (ii) dynamic capabilities and organisational learning theory, (iii) established capability/maturity model logic, and (iv) ISO 19650-oriented information management principles [40]. The 11-dimension structure adopted in this research emerges from a systematic synthesis of existing BIM and DT maturity tools (20 tools reviewed), mapping overlaps and gaps, clustering recurring organisational themes, and integrating constructs drawn from digital capability literature. This process provides the theoretical derivation logic that underpins the dimensions used in the proposed toolkit. The dimensions were subsequently confirmed and refined through alpha and beta testing activities reported later in this paper.
Accordingly, this study positions digital maturity assessment as both a diagnostic mechanism and a planning instrument. By triangulating insights from BIM maturity research, organisational capability theory, and cross-industry DT frameworks, the study advances evaluation criteria that (i) reflect staged improvement pathways; (ii) incorporate auditable and role-aware indicators; (iii) expand coverage into people, culture, governance, and finance; and (iv) align with standards-based lifecycle information management. This integrative positioning situates the study at the intersection of general digital transformation theory and construction-specific digital practice, providing a theoretically anchored and practically applicable foundation for developing a comprehensive BIM-enabled digital maturity toolkit that addresses long-standing gaps in existing models [1,22,31].
3. Methodology
3.1. Methodology for Tools Selection
This review is reported with reference to the PRISMA extension for scoping reviews (PRISMA-ScR) as a reporting framework. An internal protocol document was compiled to document the objectives, eligibility criteria, search strategy, and coding procedures and to ensure transparent reporting aligned with PRISMA-ScR. As the database searches and initial screening had already been completed when the protocol was drafted, it was not prospectively registered and should be interpreted as a retrospective documentation of the methods applied, rather than a preregistered protocol or pre-analysis plan. A completed PRISMA-ScR checklist is provided in Supplementary Material S1. The identification, screening, and eligibility stages are summarized in the PRISMA flow diagram (Figure 1), while the three-phase methodological framework (Figure 2) operationalizes this protocol, with Phase 1 corresponding to these stages. As the protocol was developed retrospectively, this review should be interpreted as PRISMA-ScR-aligned reporting of the selection process rather than evidence of prospective protocol registration. Data screening, coding, and descriptive analyses were performed using Microsoft Excel 365 (Version 2511).
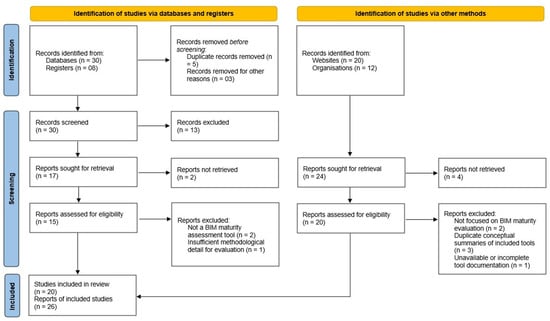
Figure 1.
PRISMA flow diagram for study selection.
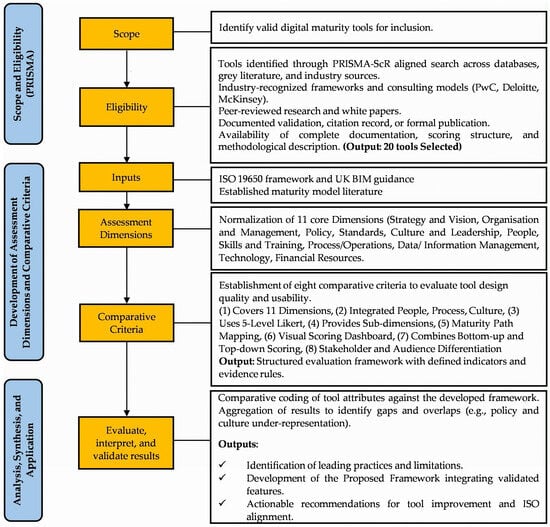
Figure 2.
Three-phased methodological framework for tools (PRISMA) and criteria selection.
3.1.1. Information Sources and Search Dates
Information sources included both academic databases and grey literature repositories. Peer-reviewed publications were identified through Scopus, Web of Science and Google Scholar, complemented by targeted searches of publisher platforms (Elsevier, ASCE, Taylor and Francis, IEEE Xplore). Grey literature and industry tools were located via the websites of international consultancies and professional bodies (e.g., Boston Consulting Group, Deloitte, McKinsey, TM Forum, European Commission, NIBS, CIFE Stanford) and via general web searches.
The database searches covered material published from 2007 to 2022, reflecting the period during which most BIM and digital maturity tools emerged, as explained in Section 5.3. Only documents available in English were included. The final search and screening update was completed in August 2023.
3.1.2. Search Strategy
Search strings combined three concept blocks: (1) digital maturity and capability models, (2) BIM/construction/AEC, and (3) assessment or evaluation tools. Typical database queries were in the following form:
“Digital maturity” OR “digital transformation” OR “maturity model” OR “maturity assessment”.
AND “BIM” OR “building information modelling” OR “construction” OR “AEC” OR “built environment”.
AND “assessment” OR “framework” OR “scorecard” OR “index” OR “tool”.
Boolean operators and field limits were adapted to each database. For web and organisational searches, similar keyword combinations were applied (e.g., “digital maturity index construction”, “BIM maturity assessment tool”), and backward/forward citation chasing was used on key publications to identify additional tools. All identified records were exported to a reference manager and spreadsheet for de-duplication and screening.
3.1.3. Inclusion Exclusion (Eligibility) Criteria
Inclusion Criteria
The research initially identifies the digital maturity assessment tools to be analysed by applying selection criteria to identify a representative sample of leading tools. A representative sample of tools was selected using five screening criteria derived from previous studies [14,15] and industry best practices such as PwC, Deloitte, and McKinsey. These criteria ensured that the selected tools were relevant, well documented, and had demonstrable impact:
- Industry Recognition: A tool qualified if at least one of the following held:
- Official release or sponsorship by a public authority/standards body (e.g., the European Commission’s Maturity Scan; NIBS’s NBIMS-CMM).
- Documented deployments/validation in practice (e.g., Stanford CIFE’s VDC BIM Scorecard used and validated on real projects; BIM Compass used for national benchmarking); or
- Commercial roll-out by a tier-1 consultancy with client deployments (e.g., BCG’s Digital Acceleration Index; McKinsey’s Digital Quotient).
- Availability of Detailed Literature: Each included tool had at least one primary source (peer-reviewed article, standards/technical document, or an official white paper/user guide) that discloses scope, structure, and scoring so methods are auditable (e.g., BIM-CAREM in Computers in Industry 2019/2023; BIM-MM in IGI Global 2010; BIM Cloud Score in ASCE J. Constr. Eng. Manage.; VDC BIM Scorecard in the CIFE technical report; TM Forum/Deloitte DMM in TMF documentation; BCG DAI and McKinsey DQ on official portals). Tools lacking primary source were excluded.
- Reputable Development and Support: Tools developed by universities, international consultants, or government bodies were selected to ensure legitimacy, methodological rigor, and continued maintenance.
- Distinctive Features: Tools had to demonstrate a unique approach such as multi-dimensional assessment, BIM integration, or benchmarking capability that justified their inclusion in a comparative review.
- Citation and Recognition: Preference was given to tools that had been cited in academic literature or professional reports, indicating impact and acceptance by the research and practitioner communities.
Exclusion Criteria
- Conceptual articles on digital transformation that did not provide a maturity tool or scoring method.
- Studies focused solely on technology adoption, predictive modelling or standard project performance metrics without a maturity construct.
- General digital readiness or IT governance models with no clear application to AEC or BIM.
- Marketing leaflets or webpages lacking methodological detail on dimensions, scales or scoring.
- Non-English sources or tools for which full documentation was unavailable or inaccessible.
These criteria were applied through a structured screening process to ensure a balanced mix of tools across geographic regions, development origins (academic, industry, government), and application scopes. As a result, 20 tools were selected that reflect both diversity and methodological robustness, forming a sound basis for comparative analysis. The detailed characteristics and supporting references for each tool are presented in Appendix A.1.
Moreover, the study selection process is reported using the PRISMA-ScR flow structure summarized in Figure 1. Database and register searches yielded 38 records (30 from databases and 8 from registers). After removing duplicates (n = 5) and records excluded for other reasons (n = 3), 30 records were screened by title and abstract, of which 13 were excluded as not meeting the basic maturity tool criteria. Full texts were sought for 17 records, of which two could not be retrieved, leaving 15 reports assessed for eligibility. Of these, three were excluded (two were not BIM/digital maturity tools, one lacked sufficient methodological detail), resulting in twelve tools from academic and formal sources.
Searches via websites and other organisational sources identified an additional 32 records (20 from general websites and 12 from organisational portals). Full-text retrieval was attempted for 24 records, of which 4 could not be retrieved. The remaining 20 reports were assessed for eligibility, of which 6 were excluded (2 were not focused on BIM/digital maturity evaluation, 3 were duplicate conceptual summaries of tools already included, 1 with incomplete documentation). This process yielded eight additional tools. In total, 20 distinct digital maturity tools and 26 supporting reports were included in the review, consistent with the counts reported in the PRISMA diagram (Figure 1). A detailed breakdown of the search operations, including per-database query strings, date limits, hit counts, and exported records, is provided in Supplementary Table S2.
3.1.4. Screening Reliability and Data Extraction
To enhance the reliability, screening was conducted using the same application of eligibility criteria across both stages. Any uncertainties were addressed through discussion within the research team and by consulting the underlying tool documentation when needed. Formal kappa statistics were not calculated; however, consensus was reached for all included and excluded records, and any uncertainties were documented in the screening log. This independent review process reduces the risk of selection bias relative to a single-coder approach, although the absence of formal inter-rater coefficients is acknowledged as a limitation [41].
For each included tool, data were extracted into a structured spreadsheet capturing tool provenance and audience, underlying documentation, dimensional coverage, scoring method, scale type, visualisation features, and evidence of validation or deployment. These data formed the basis for the subsequent coding procedures described in Section 3.2.2 and Section 3.2.3, informed the coverage analysis presented in Section 5.5, and supported the comparative criteria discussed in Section 6.3. For transparency and reproducibility, the complete coding dataset (tool-by-dimension and tool-by-criteria matrices) is provided in Supplementary Material S3 (coding data), with the associated codebook definitions in S4 (codebook definitions) and the tools inventory with source links in S5 (tools inventory).
3.2. Methodology for Criteria Selection
The criteria framework was developed into two layers. First, a set of coverage dimensions was assembled to characterise the scope of each digital maturity tool (Section 5.5, Appendix A.2). Second, a set of comparative features was defined to evaluate design and usability across tools (Section 6.3). Both layers were derived through evidence mapping of peer-reviewed BIM maturity research, digital transformation scholarship, and information management standards, followed by normalization and a conservative coding protocol.
3.2.1. Development of Assessment Dimensions
Primary dimensions were collected from the following:
- Foundational BIM maturity work that specifies stages, competency sets, and hierarchical scales, establishing the need for balanced, multi-domain assessment [36] and the BIM Maturity Matrix articulation of levels and granularity [16].
- Digital transformation literature emphasising strategy, leadership, culture, and organisational capabilities beyond technology [1].
- BIM information management standards and role definitions that anchor governance, responsibilities, and lifecycle information flows [39,40].
- Competency frameworks translating maturity into role-level capabilities for owners and delivery organisations [20].
Concepts extracted from these sources were clustered and de-duplicated to a stable set of 11 dimensions reflecting socio-technical views such as strategy and vision; organisation and management, policy; standards, culture and leadership; people, skills and training; process/operations; data and information management technology; and financial resources. The integration of policies and standards is based on the ISO 19650 framework, which outlines roles, responsibilities, and information requirements [31]. Emphasis on people, process, culture, and skills follows BIM adoption studies that identify collaboration, learning, and organisational readiness as persistent determinants of success [42]. These need to consider finance/resources in alignment with digital transformation reviews that highlight investment capacity and resource orchestration as maturity constraints [1].
3.2.2. Coding Framework and Criteria for Identifying Maturity Dimensions
To ensure a consistent and transparent evaluation of the selected tools, a structured coding framework was applied to determine whether each maturity dimension was genuinely assessed within a tool. This framework standardised interpretation across diverse tool formats, including questionnaires, maturity matrices, narrative models and benchmarking scorecards.
A dimension qualified as present when both of the following conditions were met:
- Visible structural definition of the dimension, such as a named domain, an equivalent thematic cluster, or at least three distinct indicators that explicitly mapped to that domain; and
- Explicit measurement, demonstrated through scored questions, maturity level descriptors, structured rubrics or documented weighting schemes. Unscored mentions or general statements were treated as contextual background rather than evidence of assessment.
Moreover, a dimension was marked as present only when the primary source explicitly defined indicators or evaluation content that mapped unambiguously to the normalized definitions (e.g., role-bound information requirements → “Standards”; competency/skills rubrics → “Skills and Training”). Ambiguity was resolved by cross-checking at least one additional primary or standards source, while absence of clear evidence resulted in a blank. To maintain reliability, comparable thresholds were applied across all domains. For example, the ‘People’ domain required measurement across at least two human-centred subthemes (e.g., user engagement, cultural readiness, digital skills, leadership support), supported by a minimum of three scored items or equivalent maturity descriptors. Similarly, ‘Policy and Governance’ required evidence of assessment across areas such as standards compliance, legal or contractual arrangements, information security or procurement alignment. ‘Technology’ required structured evaluation of infrastructure readiness, interoperability or integration, platform capability or innovation readiness, while ‘Process/Operations’ require defined workflows, process control or standardisation. ‘Data and Information Management’ required explicit assessment of data quality, metadata structures or lifecycle information flow. ‘Strategy, culture’ and ‘Skills and Finance’ were coded only when domain-specific descriptors or multiple scored items were present. Different tool formats were coded using parallel logic: for questionnaire-based tools, item counts referred to scored questions, while for narrative frameworks, a domain was recognised only if maturity descriptors were present across multiple levels or if explicit weighting was applied. Composite questions spanning multiple domains were disaggregated only when the scoring allowed clear attribution. This coding framework ensured consistency across the review and enabled fair comparison between tools with varied structures and levels of detail. It also addressed ambiguity by verifying each coding decision against at least one additional primary source to minimise misinterpretation. This approach provided a robust empirical basis for the comparative analysis presented in later sections.
3.2.3. Development of Comparative Evaluation Criteria
The comparative evaluation criteria were established to ensure that the selected digital maturity assessment tools could be compared not only with their technical coverage but also with their design robustness, interpretability, and practical usability. The purpose was to identify structural and functional qualities that differentiate comprehensive, evidence-based tools from those limited to descriptive assessments. For this purpose, the criteria were synthesized from maturity model design theory, which defines a tool’s value in terms of clarity of progression, measurement transparency, and actionable insight, which are core characteristics of credible benchmarking tools [1,43]. Comparative attributes were therefore chosen to capture both measurement structure and user-oriented functionality. This dual focus aligns with established evaluation practices in BIM and digital maturity reviews [18,37]. The rationale for selection of the eight criteria is explained below.
- Eleven Dimensions: To ensure methodological consistency and representativeness, a detailed content analysis of existing BIM and digital maturity frameworks was undertaken prior to defining this criterion. The analysis compared recurrent constructs across international standards (ISO 19650) and benchmark models such as the Maturity Scan, BIM Maturity Matrix, BIM Quick Scan, and VDC Scorecard. Through iterative synthesis, overlapping themes were consolidated to avoid redundancy, resulting in a stable set of eleven key maturity dimensions. This number reflects a balanced and comprehensive structure that captures all critical socio-technical aspects spanning strategy, organisation, technology, people, process, and governance without unnecessary fragmentation. The inclusion of eleven dimensions aligns with findings from established maturity matrix research, which emphasizes complete yet manageable domain coverage to ensure meaningful benchmarking [39,40]. The complete list and criteria for selecting these dimensions are explained in Section 5.5.
- Integrated Assessment of People, Process and Culture: Inclusion of this triad acknowledges the centrality of behavioural and cultural transformation within digital adoption, emphasized by leadership-driven models [31].
- Uses five-level Likert Scale: A five-point Likert scale is widely used in maturity models for its statistical stability and interpretive consistency [44].
- Subdimensions: Explicit subdimensions allow transparent traceability between qualitative indicators and quantitative scores, ensuring the model’s auditability and internal validity.
- Maturity Path Mapping: The presence of a staged or roadmap-like structure that makes improvement trajectories explicit. The construction is consistent with staged capability models (e.g., CMMI) and BIM-specific maturity matrices that articulate levels and pathways [36,45]. Tools were credited only when stages/levels were explicitly defined and linked to progress guidance.
- Visual Scoring Dashboard: Availability of a results interface (e.g., scorecards, radar charts, dashboards) that communicates scores to different audiences. Justification derives from visual management research in construction showing dashboards improve transparency and decision-making [46] and recent reviews on visual dashboards for performance monitoring [47].
- Combines Bottom-up and Top-down Scoring: Evidence that granular indicator scores (bottom-up) are aggregated to higher-level dimensions or strategic objectives (top-down) using an explicit schema. The logic follows hierarchical evaluation in maturity and multi-criteria decision frameworks where local measures roll up to composite judgments [48] and staged/continuous capability representations [45].
- Stakeholder and Audience Differentiation: Support for role-specific views, responsibilities, or outputs (e.g., owners, project teams, managers), aligned with role delineation in ISO 19650-based information management [39,40] and competency-based framing for different organisational actors [20].
A criterion was marked pass (✓) only when the feature was (i) explicitly stated in the tool’s primary documentation or peer-reviewed description, or (ii) operationally demonstrated in a method paper (e.g., a published scorecard, staged roadmap, or role-aware output). Where evidence was indirect or anecdotal, the attribute remained unmarked to maintain methodological rigor. This ensured that the comparative analysis reflects substantiated design features rather than interpretive assumptions.
The three-phased methodological framework is illustrated in Figure 2. This framework illustrates the systematic process adopted for identifying, evaluating, and synthesizing digital maturity assessment tools. In Phase 1 (tool identification and eligibility), the review followed the PRISMA guidelines to ensure transparency, reproducibility, and rigor. In this phase, candidate tools were screened using five predefined inclusion filters: industry recognition, authoritative publication source, availability of supporting literature, distinct feature set, and documented validation or citation record, as described in Section 3.1. The PRISMA-aligned screening process resulted in a curated selection of 20 tools drawn from consultancy models, peer-reviewed studies, and institutional frameworks. Phase 2 (development of assessment dimensions and comparative criteria) established the analytical foundation for comparison. Guided by ISO 19650 principles, UK BIM Framework guidance, and established maturity model literature [1,16], this phase normalized 11 core dimensions and formulated eight comparative criteria encompassing both design quality and usability factors, such as the use of five-point Likert scales, maturity path mapping, visual dashboards, and stakeholder differentiation, as explained in Section 6.3. The outcome was a structured evaluation matrix that enabled consistent cross-tool analysis. Phase 3 (analysis, synthesis, and application) focused on comparative evaluation and integration, identifying thematic gaps (e.g., underrepresentation of people, process, culture, and policy dimensions) and synthesizing the findings into a unified digital maturity evaluation framework aligned with ISO 19650. Iterative feedback loops ensured that findings from Phase 2 refined tool inclusion decisions, while Phase 3 outputs informed further validation, maintaining end-to-end traceability from evidence to recommendations.
4. Characteristics and Classification of Existing Digital Maturity Assessment Tools
Various tools have been developed to assess and improve the digital maturity of organisations. These tools are customised to the construction environment, leading to the use of distinct criteria and frameworks. The identified tools define assessment metrics such as key performance indicators (KPIs), critical success factors, criteria, fields, dimensions, subdimensions, evaluation aspects/areas, categories, and divisions. Robin and Yahya [49] identified five key dimensions for assessing an organisation’s digital maturity in the AEC sector such as technology, process, policy, people, and organisation. These dimensions are ranked in terms of their importance, with process and people rated as highly significant, whereas technology, policy, and organisation are considered moderately important. These dimensions can be further subdivided to capture specific aspects of digital transformation across AEC organisations.
Following the screening described in Section 3, the 20 selected tools were profiled using descriptive attributes such as source, developer, year, target sector, platform, accessibility and time required for completion. The consolidated profiles are provided in Appendix A. The selected tools span from 2007 to 2022 and reflect contributions from both academic institutions (e.g., Stanford, Cambridge, Hong Kong University) and industry stakeholders (e.g., McKinsey, BDO, Deloitte). The majority (65%) are designed specifically for the AEC sector, while others support broader industry applications. In terms of accessibility, tools range from freely available online platforms to proprietary or research-based systems requiring direct author contact. Some tools offer quick self-assessments that take 5–15 min, while others involve extensive evaluations requiring hours or even months. This diversity highlights varying levels of maturity evaluation complexity, technological integration, and stakeholder orientation, providing valuable insight into how digital readiness is measured across contexts. These tools form the basis for the comparative analysis as attached in Appendix A.2, which explores the maturity dimensions most frequently addressed across the reviewed frameworks. Section 5 presents a detailed discussion of these aspects to support stakeholders in selecting, implementing, and developing digital maturity tools that are aligned with industry needs.
5. Overall Analysis of the Selected Tools
This section presents an in-depth analysis of the 20 digital maturity assessment tools and their key characteristics. A summary of these tools, including their development year, source, platform, accessibility, and completion time, is provided in Appendix A.1. The comparative evaluation of maturity dimensions addressed by these tools is presented in Appendix A.2 and the linkage of these eleven maturity dimensions to the relevant ISO 19650 clauses are presented in Appendix A.3.
5.1. Origins of Tools
Both academic institutions and private organisations have facilitated the global dissemination of digital maturity assessment tools. Notably, the European Commission’s Maturity Scan [26] exemplifies this trend. Furthermore, prestigious universities, such as Cambridge, Stanford, and Carnegie Mellon have made valuable academic contributions by developing similar tools to enhance scholarly discourse. Consulting firms such as Boston Consulting Group and McKinsey facilitate collaboration between academia and industry. Tools such as BIM Compass [22], the European Commission’s Digital Maturity Assessment for Construction SMEs, BIM-MM [26,36], I-CMM [30] and VDC BIM Scorecard [50] are leading examples of digital maturity assessment tools for the AEC sector. The widespread global adoption of these tools highlights their international significance in enhancing standards and digital maturity across various sectors.
5.2. Target Sector
Figure 3 provides a visual overview of the target sectors with a subset of tools specifically designed for the AEC sector, by tailoring their criteria and structures to address industry-specific needs. These AEC specific tools aim to evaluate and enhance digital maturity in the context of construction projects. Most of the tools target the AEC sector (65%), with some addressing general business transformation across all industry sectors (30%), while a smaller proportion related to the information communication and technology (ICT) and communication service provider (CS) sectors (5%).
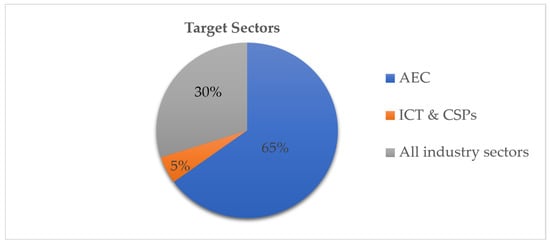
Figure 3.
Target sectors of the selected digital maturity assessment tools.
5.3. Evolution of the Tools (2007–2022)
Figure 4 presents a chronological timeline for the development of the reviewed tools. Thirteen out of twenty were developed before the publication of ISO 19650 in 2018, which is now widely recognised for guiding information management in BIM-enabled environments. Including the pre-2018 tools remain important for two reasons. First, several of them established the core constructs that still underpin digital maturity thinking in the AEC sector and they continue to be used or adapted in practice and academia. Examples include NBIMS-CMM, BIMe and BIM Compass. Second, these tools document the discipline’s shift from isolated capability checklists to integrated, lifecycle-oriented assessments. Reading them alongside post-2018 tools clarify how methods have matured over time and where legacy approaches need light recalibration to meet current expectations.
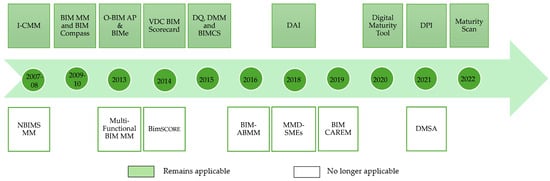
Figure 4.
Timeline of the development of selected digital maturity assessment tools.
A brief clarification of standards helps explain this continuity. ISO 19650 was developed from the UK BS/PAS 1192 series and internationalized its information management approach. The two families share the same conceptual backbone. Both emphasize clear information requirements across the asset and project lifecycle, the use of a common data environment for controlled information exchange, defined roles and responsibilities for producing and checking information, and the progressive development of models and documentation. The differences are mainly in scope and terminology rather than intent. ISO 19650 provides globally harmonized terms, a clearer split of responsibilities between the appointing party and appointed parties, updated process clauses that reflect collaborative delivery across borders, and extensions that reference contemporary concerns such as security-minded information management. In practice, BS/PAS-era concepts map cleanly to ISO 19650 language, so earlier maturity tools can be interpreted and, where needed, updated rather than discarded.
Between 2013 and 2016 there was a pronounced surge in the release of new frameworks, with nine introduced during this period. This reflects a period of rapid consolidation in the field, during which maturity models increasingly embedded structured principles from the BS/PAS 1192 series and expanded beyond technology- focused capability checks. Tools developed in this phase introduced more refined constructs such as information exchange quality, decision support mechanisms, data governance themes and competency-based assessments. This period therefore marks a transition from early, checklist-driven tools toward more holistic and methodologically robust frameworks.
Momentum continued after 2018 with the appearance of tools such as the Maturity Scan, the Digital Performance Indicator and the Digital Maturity Self-Assessment, which show a more explicit alignment with ISO 19650. Many of these newer tools incorporate cloud-based assessments, collaborative features, dashboard reporting and strategy-oriented outputs that reflect modern information management practices. Further growth followed 2020 with the release of several ISO aligned web platforms. These developments indicate a broader trend toward standardisation, digital delivery, and deeper organisational integration moving beyond BIM capability alone to encompass culture, leadership, governance and strategic readiness.
As shown, Figure 4 captures this fifteen-year progression and shows the increasing complexity of assessment, broader platform accessibility and stronger integration with BIM workflows. As standards and practices evolve, earlier tools remain useful baselines but may require contextual updates to terminology and evidence requirements so that evaluations remain fully effective. The mapping of earlier tools to ISO 19650 principles is further reflected in the framework proposed in Section 4 and Section 5.
5.4. Platform and Accessibility
Figure 5 presents an integrated view of both the platform types and accessibility modes of the selected tools. The results show that 20% of the tools including OBAP [15,51], I-CMM [30], NBIMS-CMM [52] and BIM CAREM [53,54] are available as Microsoft Excel workbooks, reflecting the use of widely adopted spreadsheet environments for conducting digital maturity assessments. A further 25% of the tools, such as the Maturity Model of Digitisation for SMEs [24], Multifunctional BIM MM [28], BIM Action-Based Maturity Model [55], BIMCS [21], and VDC BIM Scorecard [50], are research-based, generally developed in academic contexts or specialist studies, often requiring domain expertise for implementation. The majority, accounting for 55%, are web-based tools, including Maturity Scan [26], Digital Performance Indicator [23], Digital Maturity Self-Assessment [55], Digital Maturity Tool [25,56], BimSCORE [57], DMM [58,59], Digital Acceleration Index [60], Digital Quotient [27], BIM Compass [22] BIMe [61] and BIM-MM [16,35], thereby reflecting the increasing trend to easy accessibility, collaboration, and real-time data management.
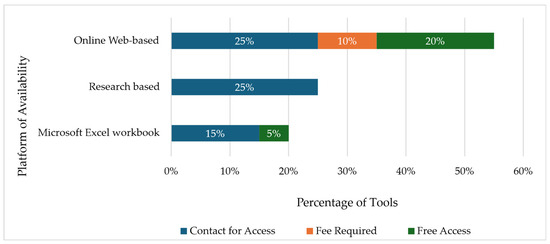
Figure 5.
Distribution of platform types and accessibility modes among selected digital maturity assessment tools.
In terms of accessibility, the figure shows that 65% of the tools require users to contact the developer for access, indicating that controlled or semi-restricted distribution remains the prevailing practice. Such restricted access suggests that much of the digital maturity landscape is shaped by proprietary mechanisms, customized consultancy models, and service-based ecosystems. While this approach enables developers to maintain quality oversight and ensure intended application, it also limits openness, hinders independent benchmarking, and reduces the potential for sector-wide standardisation. An additional 10% of tools require a fee, reflecting subscription-based or commercially licensed assessment models. However, a notable 25% of tools are freely accessible, removing financial and administrative barriers and enabling broader adoption across varied organisational contexts.
Taken together, the distribution of platform types and accessibility conditions underscores the technological diversity of existing maturity tools and the differing levels of openness that shape their uptake within the AEC sector. The predominance of web-based platforms, coupled with the restricted-access nature of most tools, highlights ongoing tensions between proprietary control and the need for wider, more standardized digital maturity benchmarking.
5.5. Dimensions
The dimensions or tiers signify key maturity areas [24]. Table 1 and Figure 6 analyse the dimensions assessed by various digital maturity tools across different organisational types, with particular emphasis on those applied within the AEC sector. Table 1 provides a simplified overview of the five most comprehensive tools, highlighting their dimensional coverage strengths and key gaps, while Figure 6 illustrates the total number of dimensions and subdimensions considered by each tool and presents a comparative analysis of the structural frameworks of various tools. This focuses on the number of main dimensions (blue bars) and subdimensions (orange bars). Tools, such as BIMe, Digital Acceleration Index and Digital Quotient, exhibit a more comprehensive structure, characterized by a significantly higher number of subdimensions. This indicates their capacity to provide detailed and granular insights by addressing specific and diverse aspects of digital maturity. Conversely, tools like BIM CAREM, Digital Maturity Self- Assessment and the Maturity Model of Digitisation for SMEs adopt a simpler framework, with fewer main dimensions and subdimensions, suggesting that they are designed for more practical assessments or less complex organisational requirements. The lack of correspondence between the number of main and subdimensions in most tools is noteworthy. For instance, while BIMe and the Digital Acceleration Index have a broader focus, they prioritize detailed exploration within their subdimensions, emphasizing depth over breadth. In contrast, tools like ICMM maintain a more balanced perspective, which is potentially impactful for individuals seeking a more equitable assessment framework. This variation underscores the diversity of assessment strategies, with some tools aiming for extensive coverage across multiple layers of evaluation, while others provide focused insights with limited parameters. This comparison highlights the significance of selecting a tool based on the required depth, breadth and application context.

Table 1.
Evaluation of coverage and gaps in five leading comprehensive digital maturity tools.
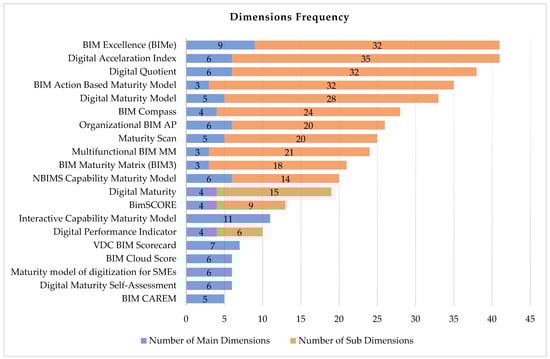
Figure 6.
Comparison of selected tools for main dimensions and sub dimensions.
Table 1 presents the five most comprehensive digital maturity assessment tools, highlighting coverage across 11 dimensions, areas of greatest strength, and key gaps. This provides comparative insight into how leading tools operationalize maturity across technological, organisational, and socio-technical domains. The table shows where the construction sector places emphasis and where blind spots persist, particularly in human, governance, and resource-related dimensions. Based on the application of criteria mentioned in Section 3.2.2, the most frequently addressed maturity areas are technology (90%), organisation and management (70%), data and information management (55%) and process and operations (55%). These dimensions are crucial for evaluating an organisation’s digital maturity. Culture and leadership (45%), strategy and vision (45%), standards (45%), and people (40%) received moderate attention, whereas skills training (20%), policy (20%) and financial resources (15%) were rarely considered. The importance of technological readiness contrasts with the limited focus on skills training, policy and financial resource allocation (15%). These findings underline the importance of each dimension in assessing digital maturity in AEC organisations, while also highlighting the industry’s continued prioritization of infrastructural and operational readiness. Full dimensional coverage for all 20 tools, including presence/absence mapping used to calculate these percentages, is provided in Appendix A.2. Furthermore, the linkage of the eleven maturity dimensions with the relevant ISO 19650 clauses and guiding principles is explicitly presented in Appendix A.3.
Beyond the numerical distribution, these frequencies reveal deeper patterns about how digital maturity is conceptualized across the AEC sector. The consistent dominance of ‘Technology’, ‘Organisation and Management’, and ‘Data and Information Management’ reflects the sector’s historical emphases on infrastructure readiness, system integration, governance structures and procedural efficiency areas traditionally reinforced by BIM standards and information management frameworks. Their prominence suggests that most tools continue to prioritize structural and technical capabilities as the primary determinants of maturity. By contrast, the relatively low representation of ‘People’, ‘Skills and Training’, and ‘Policy and Financial Resources’ indicate the persistent under- recognition of human-centred, regulatory and investment-related factors, despite their well-documented influence on digital transformation outcomes. This imbalance highlights a methodological tendency to focus on operational readiness while underestimating socio-technical and resource-based enablers, potentially limiting the ability of tools to capture organisational readiness in a holistic manner. The observed variation therefore underscores both strengths and gaps within current assessment approaches, signalling the need for future tools to better integrate behavioural, cultural and financial dimensions to support a more balanced evaluation of digital maturity. Overall, the most crucial aspect in digital transformation remains technology, followed by organisation and management, data and information handling, and process and operations. These key areas reflect their critical roles in driving digital change, evaluating readiness, emphasizing strong leadership and organisational alignment, recognising data-informed decision-making, optimising workflows, and acknowledging the impact of culture and leadership in fostering innovation. Strategy, vision, standards and people were accorded moderate attention, indicating their significance in shaping overall digital maturity, while the reduced focus on skill development, policy and financial resources points to persistent shortcomings in current assessment methodologies. By considering all these dimensions, AEC organisations can develop more effective strategies for digital transformation, ensuring that every critical aspect is adequately addressed.
A simple co-occurrence review of the dimensions further reinforces these patterns. Tools that include ‘Technology’ almost always include ‘Organisation and Management’, with 80% of technology-focused tools also assessing managerial structures, indicating that digital infrastructure and organisational capability are viewed as jointly influential in determining maturity. Similarly, ‘Data and Information Management’ frequently appears alongside ‘Process and Operations’ (over 70% co-occurrence), suggesting that information workflows are commonly evaluated in relation to broader operational practices. By contrast, low-frequency dimensions such as ‘Policy’ or ‘Finance and Skills’ rarely appear together or in combination with high-frequency domains, demonstrating their peripheral treatment across existing tools. These quantitative patterns highlight a structural imbalance in how maturity is conceptualized, reinforcing the need for future frameworks to more evenly integrate human, regulatory and resource-based dimensions.
5.6. Evaluation Matrix
5.6.1. Assessment Matrix
The assessment matrix of the tools considered in this study varies across different sectors, each focusing on specific dimensions and subdimensions. Several digital maturity assessment tools exist across various sectors, each with unique evaluation areas and dimensions, as described in Section 5.5. The Maturity Scan provides Quick Scan and In-depth Scan options, with the former taking approximately five minutes assessment to complete while the latter thoroughly evaluates an organisation’s digital maturity and takes 15 to 20 min, considering both technical and non-technical aspects of maturity. The Digital Maturity Self-Assessment and Digital Maturity Model provide a comprehensive report covering scores, strengths, weaknesses, and recommendations for improvement. The Digital Maturity Tool [56] encompasses four dimensions and fifteen subdimensions, providing a comprehensive evaluation of digital maturity across multiple aspects of an organisation. The BIM Action-based Maturity Model targets sequential stages to enhance productivity and competitiveness in the Brazilian and Portuguese construction sectors, whereas the BIM Cloud Score assesses BIM performance by analysing user data. The BIM Capability Assessment Reference Model improves facility management in the AEC industry across life cycle phases, while BimSCORE evaluates project BIM maturity by comparing current performance with industry benchmarks and proposing improvements. The VDC BIM Scorecard covers four areas and ten subdivisions, providing a detailed evaluation of virtual design and construction and BIM implementation, comparing project outcomes with industry benchmarks using a weighted sum of measures on a five-level ratio scale. The Organisational BIM Assessment tool focuses on six main elements and twenty sub- elements, to evaluate an organisation’s digital capabilities. The ultimate level of maturity is determined by combining the weighted scores of all component elements, resulting in an aggregate score and a visual representation using a spider web diagram. The Multifunctional BIM Maturity Model assesses three domains and twenty-one subdomains, offering a comprehensive assessment of BIM maturity across multiple functional areas within an organisation.
BIM Excellence (BIMe) uses various methods to evaluate BIM compliance, readiness, capability and maturity, delivering customised scores and reports. BIMe assessments use Likert-scale, multiple-choice, and free-text questions designed for the specific aspects under review. Competency items are rated on a 2-, 5-, or 10-point scale and converted to percentages. The scores cover 56 competency topics and 8 sets according to the scoping phase profile, with 100% indicating complete satisfaction and 0% indicating no satisfaction. The BIM Compass assesses the BIM maturity of organisations through an online questionnaire followed by paid consultation, plotting scores on the Bew–Richards BIM maturity scale. The BIM Maturity Matrix considers five factors evaluated across competencies, capability stages, and organisational scales, offering a multi-dimensional approach to assess digital maturity. The Interactive Capability Maturity Model assesses individual competencies, organisational capabilities, and project performance by providing a quantifiable framework for evaluating BIM implementation, converting subjective views into measurable stages. NBIMS-CMM and I-CMM evaluate project performance in 11 areas using a weighted sum on a 10-level maturity scale through a static, tabular, and multitab interactive Microsoft Excel file. These tools offer varying levels of detail and complexity in their assessments, ranging from quick scans to in-depth evaluations covering multiple dimensions and subdimensions. The choice of tool depends on the specific needs of the organisation, the sector in which it operates and the desired level of granularity in the assessment. While some tools provide free assessments with comprehensive reports, others may require paid consultations or more extensive data inputs for a thorough evaluation of digital maturity.
5.6.2. Measuring Scale and Maturity Levels
Various scaling methods are employed to measure digital maturity and capability assessment. These include the Likert scale for subjective assessments, the ratio scale for quantitative measurements, and the ordinal scale for ranking items. The selected tools employ various scoring and weighting methods. The NBIMS-CMM and I-CMM (10 maturity levels through an ordinal scale) use a weighted sum system to calculate overall maturity scores. BIMe uses 2-, 5-, or 10-point scales to rate competency items on various scales converted to percentages for consistency. The BIM Maturity Matrix (ordinal scale), BIM Compass (Bew–Richard scale) VDC BIM Scorecard (five-level ratio scale) and BIM Cloud Score analyse user data to assess performance, providing a data-driven approach to maturity evaluation. The key features of these maturity scales include the following:
- Consistent progression patterns across different tools, despite variations in terminology
- Association with scoring systems (e.g., percentages or 0–4 or 1–5 ratings)
- Ability to assess various aspects of digital maturity within an organisation
This maturity scale approach provides a comprehensive overview of an organisation’s capabilities while maintaining a manageable number of distinct levels for evaluation. Figure 7 illustrates that the majority of tools assess digital maturity across three to six distinct maturity levels, allowing for a detailed evaluation of an organisation’s progress. The NBIMS CMM is an exception, providing a more granular assessment across ten maturity levels. The distribution of rating scale types employed in the selected tools is shown in Figure 8. The ordinal scale is the most prevalent, accounting for 70% of the total, demonstrating its extensive use in evaluations based on ranking or order. The Likert scale, which is frequently used to assess attitudes or perceptions, represents 20% of the scale. The ratio scale and the Bew–Richard scale are less commonly used, each constituting only 5% of the total, suggesting their limited application within the reviewed tools. The five-level digital maturity level is considered the optimal scale for assessing digital maturity. It offers sufficient detail to capture meaningful differences in maturity levels without becoming overly complex. This scale typically includes initial/ad hoc, planned, defined, managed, and optimised/innovative scales. This progression allows organisations to benchmark their current state and provide a roadmap for improvement. By using such a scale, organisations can effectively evaluate their current digital maturity status and identify areas for improvement to reach higher maturity levels. This structured approach enables organisations to develop targeted strategies to enhance their digital capabilities and overall performance.
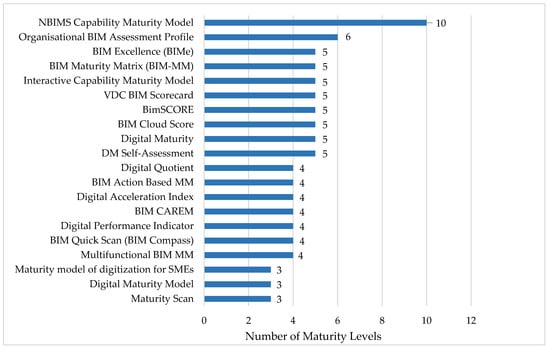
Figure 7.
Number of maturity levels in selected digital maturity assessment tools.
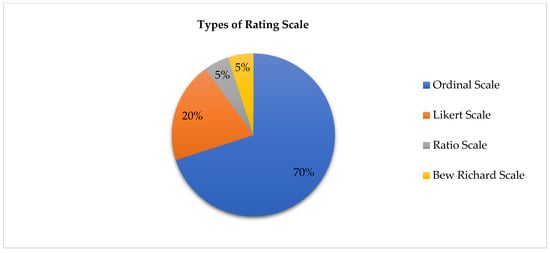
Figure 8.
Types of rating scales included in selected digital maturity assessment tools.
5.6.3. Number and Types of Assessment Questions
The number of questions in these assessment tools varies significantly, with the minimum number of questions being 11 and the maximum being 179, as shown in Figure 9. This range allows for different levels of detail and depth in the assessment process, serving various organisational needs and time constraints. The graphical representation compares the number of assessment questions across various digital maturity assessment tools, highlighting significant variations in their depth and comprehensiveness. The Digital Maturity Model has the highest number of questions, indicating its detailed and extensive approach for evaluating digital maturity. This level of detail may make it suitable for organisations requiring thorough analysis but is potentially less practical for organisations seeking quick assessment. The VDC BIM Scorecard and the Maturity Model of Digitisation for SMEs also include a substantial number of questions, showcasing their focus on offering a well-rounded evaluation framework tailored to specific needs. In contrast, tools such as the Interactive Capability Maturity Model and the NBIMS Capability Maturity Model feature far fewer questions, reflecting a more concise and focused methodology. These tools may appeal to users with time constraints or those looking for a preliminary evaluation rather than an in-depth analysis. Other tools, such as BIM Excellence and BimSCORE, occupy the middle ground, providing a balance between comprehensive insights and assessment efficiency.
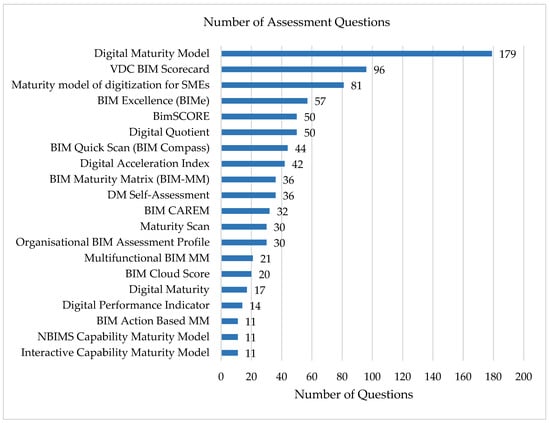
Figure 9.
Number of assessment questions in selected digital maturity assessment tools.
The disparities in question count suggest that these tools are designed with varying complexity and target sectors. Some prioritize exhaustive frameworks for detailed assessments, while others aim for simplicity, emphasising alignment with organisational goals and resources. This variation underscores each tool’s individual assessment scope. The distribution of question types across tools is illustrated in Figure 10, showing notable differences in usage. Multiple-choice questions (MCQs) comprise 40% of the total, reflecting their broad application in structured evaluations and result interpretation. Checklists followed at 20%, demonstrating their value in task verification and compliance checks. The remaining categories, including capabilities, datasets, criteria, practices, competences, measures, and metrics, each represent 5% of the total, indicating their specialized functions in offering varied evaluation approaches within these tools. This distribution highlights the incorporation of question types designed for diverse assessment requirements.
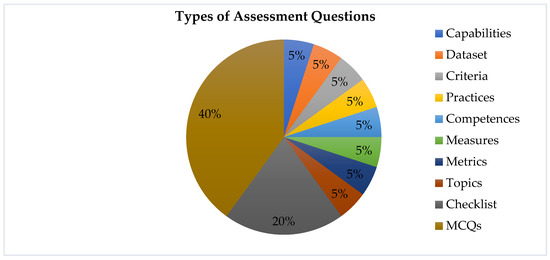
Figure 10.
Types of assessment questions included in selected tools.
The key characteristics of the evaluation approaches adopted in the selected tools are presented in Table 2, including the types of assessment questions, measurement scales, and points on the scale. This analysis provides an insight into the methodologies and evaluation levels for assessing the organisational digital maturity of various sectors. Most of the selected tools employ a five-point ordinal scale or Likert scale, while BIM Compass and VDC BIM Scorecard are notable exceptions, using the Bew–Richard and ratio scales, respectively.
Table 2.
Evaluation matrix of selected digital maturity assessment tools.
5.7. Comparative Analysis of Digital Maturity Assessment Tools
A comparative analysis of digital maturity assessment tools in the AEC sector reveals a diverse landscape of approaches, key features, and focus areas. These tools vary in their frameworks, scopes of assessment, evaluation metrics, strengths, and limitations. Framework diversity is evident, with tools ranging from Microsoft Excel-based options such as OBAP, ICMM and NBIMS-CMM to software as a system (SaaS)-based platforms such as BIMCS and online assessments, which include Maturity Scan, DAI, DPI and BIMe etc. The assessment scope differs among tools, with some focusing on internal capability (ICMM), while others enable cross-organisational comparisons (NBIMS-CMM, BIMCS) or assess multiple levels including individual, team and organisations (BIM MM, BIMe). Evaluation metrics also vary, with tools employing capability maturity scales (NBIMS-CMM), compliance quantification (VDC BIM Scorecard), and dimensional assessments (Organisational BIM assessment profile). Each tool has unique strengths, such as real-time collaboration capabilities (BIMCS), comprehensive coverage (VDC BIM Scorecard) and alignment with industry standards. However, limitations also exist, including subjectivity issues (NBIMS-CMM), reliance on self-reporting (BIMe), and lack of practical use documentation (Organisational BIM Assessment Profile). Despite the differences, prioritized dimensions across the tools include technology, organisational management, data, information management and process and operations. Notably, some areas appear to have lower priority across the tools, including people, leadership, culture, policy, strategy, vision, skills training, standards, and financial resources. These findings suggest that current tools may overlook critical human and strategic elements in favour of more technical aspects. This imbalance could potentially lead to incomplete or skewed evaluations of an organisation’s true digital readiness. Future iterations of these tools may benefit from incorporating a more holistic approach that gives appropriate weight to both technological and human-centric factors when assessing digital maturity. This comparison highlights the complexity and diversity of digital maturity assessment in the AEC sector while also identifying areas for potential improvement and standardisation in future tool development.
The diversity of assessment tools reflects the complicated nature of digital maturity in the AEC sector, underscoring the necessity for comprehensive evaluation approaches. Future tool development could benefit from addressing the highlighted areas for less prioritized areas to provide a more holistic assessment of digital maturity. Standardisation efforts in digital maturity assessment could potentially yield more consistent and comparable results across industries, thereby facilitating benchmarking and targeted improvement strategies.
Based on this analysis, the development of a novel tool for the AEC sector could facilitate further digital transformation. The new tool, which can take various forms, such as Microsoft Excel spreadsheets, web-based applications, research platforms, or static tabular formats as observed in the reviewed tools, can be selected for immediate, free access to support AEC organisations in conducting digital maturity assessments to facilitate their digital transformation journey. Such a tool should incorporate the following key features.
- A five-level maturity scale (ranging from initial/ad-hoc, planned, defined and managed to optimised) associated with a five-point Likert rating scale.
- Integrating key components such as maturity assessment levels, dimensions, sub dimensions, and a path to maturity.
- The tool should align with ISO 19650 maturity stages and clearly identify gaps in evaluating the organisation’s digital maturity.
The choice between top-down or bottom-up approaches in developing a maturity assessment tool is a common dilemma for developers [61]. The top-down approach defines maturity stages first and then selects dimensions and subdimensions, whereas the bottom-up approach begins with requirements and measures and then defines stages. De Bruin et al., [43] provides a clear answer to this question, where a top-down approach is considered ideal for emerging dimensions without maturity evidence, whereas a bottom-up approach fits established dimensions focused on maturity assessment. Conversely, Solli and Gottschalk [62] recommended a step-by-step method for developing a maturity tool, irrespective of the maturity of the dimension. Consequently, there are no definitive guidelines for the selection of a suitable methodology. It is essential to rely on established research and to empirically validate the dimensions and constructs of the tool. Through the careful selection and implementation of an appropriate assessment tool, organisations in the AEC sector can effectively evaluate their digital maturity and establish a trajectory for successful digital transformation.
5.8. Gaps in Current Tools and Future Recommendations
This study highlights emerging trends and opportunities in digital maturity assessment tools, with a focus on identifying gaps in the selected tools, thereby highlighting the need for a potential new tool to provide a comprehensive assessment approach for evaluating digital maturity in the AEC sector. The recommended framework for such a tool is as follows:
5.8.1. Gaps in Dimensions Assessment
A thorough evaluation of the 20 reviewed digital maturity assessment tools (Section 4 and Section 5) reveals that there is a lack of a holistic assessment approach in the selected tools to address the 11 key maturity areas cited in the literature [14,15,16,63,64,65,66]. Furthermore, these tools do not simultaneously assess the critical dimensions of processes, people, culture, technology, skills training, financial resources, and policy and governance, which are essential for comprehensive assessment. To bridge this gap, the development of a new and comprehensive digital maturity assessment tool would facilitate parallel evaluation of the identified areas in terms of associated dimensions.
Lack of Integrated Assessment Approach in Process, People and Culture
The reviewed tools assess critical maturity dimensions such as processes, people and culture, either individually or partially. However, consistently evaluating dimensions, including business processes, organisational structure, employee skills and cultural attitudes towards technology, is crucial for assessing an organisation’s digital maturity and successful digital transformation. An integrated assessment approach of culture, leadership, people, processes, and operations would offer a comprehensive evaluation of how these dimensions interact and influence each other.
Lack of Technology Integration
In acknowledging the key role of technology in digital maturity assessment presented in Table 1, a new tool should evaluate the organisation’s technology infrastructure, including software for model optimisation, collaboration, data sharing, asset information integration, site planning, scheduling, cost estimation, facility management, clash detection, visualisation and access to fully licensed software. This comprehensive assessment would address the technological foundation essential for effective digital transformation in the AEC sector from the perspectives of clients, consultants, contractors, and asset management teams.
Lack of Policy and Governance Alignment
The third dimension focuses on integrating policy and governance into digital maturity assessment. This includes evaluating the adherence to industry standards and protocols, BIM policy, strategy and vision, legal and contractual aspects, data management, integration with existing processes and cybersecurity protocols. Evaluating organisational alignment with these policies provides valuable insights into their commitment to compliance, quality assurance and ethical considerations.
Collective Assessment Approach
Most maturity assessment tools evaluate strategy, vision, process, and technology individually, often neglecting people, culture, policy, skill training, and financial resources. However, the interrelated nature of these areas in terms of assessing process, people, and culture alongside technology and policy and governance would provide a holistic assessment approach and a more clear and comprehensive understanding of an organisation’s digital maturity.
Based on the identified limitations in current toolkits and gaps in maturity domain coverage, this study proposes a tailored digital maturity evaluation framework. This is presented in detail in the following section.
6. Proposed Digital Maturity Evaluation Framework
This section presents a thorough digital maturity evaluation framework developed to address the critical gaps identified across existing assessment tools. As discussed in earlier sections, many tools within the construction industry disproportionately emphasize technological readiness while neglecting equally important dimensions such as policy, leadership, skills development, and financial capacity. The proposed framework is designed to offer a balanced, multi-dimensional, and construction-specific structure that aligns with contemporary industry needs, ISO 19650 principles, and digital transformation goals.
6.1. Framework Structure and Components
The conceptual foundation of the proposed framework is illustrated in Figure 11, which outlines key design considerations such as target audience, stakeholder involvement, unit of analysis, and representation challenges [67]. These factors were synthesized from literature and tool analysis to ensure the framework fits diverse organisational contexts in the AEC sector. It integrates theoretical underpinnings and practical realities, serving as a blueprint for developing a digital maturity assessment tool.
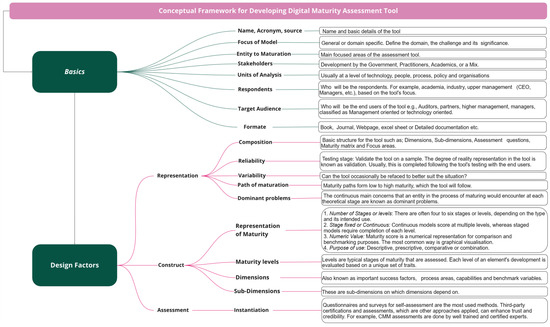
Figure 11.
Guideline for the proposed conceptual framework for a digital maturity assessment tool.
Figure 11 has two main clusters: “Basics” and “Design Factors”. This structure separates contextual prerequisites from assessment mechanics. “Basics” covers conditions determining tool fitness for each organisation, including audience, stakeholders, unit of analysis, assessment targets and reporting form. These elements govern applicability and intended use. “Design Factors” covers the tool’s construction—dimensions, maturity levels, scoring, representation, variability handling, reliability and instantiation—as these elements govern methodological rigor and auditability. This split addresses gaps identified in the review, where tools report scores but under-document their context of use or measurement logic. This aligns with recognised guidance on maturity model development, where scoping and stakeholder design choices precede tool development, testing and representation [43,67]. By making the context layer explicit (“Basics”) and formalizing the measurement layer (“Design Factors”), Figure 11 provides a blueprint that is usable across diverse AEC settings and transparent enough to be replicated, audited and improved. It fills critical gaps in tool design strategy and provides a replicable guide for new maturity evaluation tools in the AEC industry.
The framework comprises five integrated components guiding the maturity evaluation process. The first component is the maturity level structure, using a five-point Likert scale common in digital maturity models. The framework categorises development into five levels: initial, defined, integrated, managed, and optimised, enabling benchmarking and gap analysis. The second component involves eleven maturity dimensions, identified through cross-tool comparative analysis. These include technology, process and operations, organisation and management, people, data and information management, policy, standards, culture and leadership, strategy and vision, skills and training, and financial resources. Each dimension is decomposed into subdimensions to provide granular insight into organisational capabilities. The third component is composed of assessment questions aligned with each subdimension, serving as the basis for evaluating organisational performance. The fourth component is maturity path mapping, which charts current state against desired future state across dimensions. This gap analysis supports prioritisation of interventions and planning. The fifth component is a visual scoring model for the intuitive interpretation of results, presented in matrix or radar chart format. The complete scoring structure and evaluation model is shown in Figure 12b.
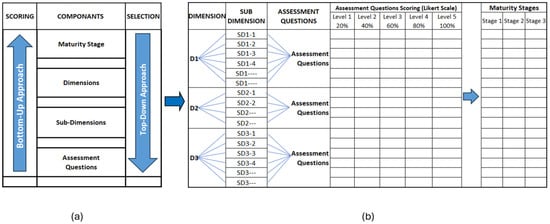
Figure 12.
Top-down and bottom-Up approach and proposed framework: (a) Top-down and bottom-up approaches for component selection and scoring criteria, (b) proposed framework for the digital maturity assessment tool.
For illustration, the “Process, People and Culture” dimension is operationalized through six subdimensions: BIM training and education, BIM awareness, BIM competency, BIM change management and adaptability, BIM leadership and support, and collaborative culture. Each subdimension is measured through 3–6 behaviour-anchored questions scored on a five-point Likert scale that is aligned with the five maturity levels in Figure 11. For example, for “BIM Training and Education”, Level 1 represents no structured training and only ad hoc awareness, Level 3 reflects regular role-specific training embedded within organisational procedures, and Level 5 denotes a continuous learning culture with advanced, accredited programs and systematic knowledge-sharing across projects. Respondents select the statement that best reflects their current practice and item scores are averaged to obtain a subdimension score and mapped to the nearest maturity level (1–5). Subdimension scores are then aggregated (equal weighting) to produce an overall maturity score for “Process, People and Culture”, which is displayed alongside technology and policy and governance in the dashboard. This example demonstrates how the proposed framework translates abstract dimensions into concrete questions, level descriptors, and scores that can be used to benchmark organisations and identify targeted improvement actions, particularly for people- and culture-related aspects of digital maturity.
6.2. Framework Development Approach
The development approach for the framework is based on a hybrid methodology that combines top-down and bottom-up strategies as noted in Section 6.1. The top-down approach is used to define the high-level architecture of the tool; namely, the selection of dimensions, subdimensions, and thematic clusters. This ensures strategic alignment with sectoral needs and international digitalisation guidelines. Conversely, the bottom-up approach is applied during the scoring process, where data are collected through assessment questions and used to calculate maturity levels. This methodology enables a robust link between abstract strategic priorities and measurable organisational realities. Figure 12a illustrates this integrated approach. On the left, it shows how dimensions and subdimensions are selected using a top-down logic, while on the right, it shows how scoring is derived from responses at the subdimension level, ultimately feeding into maturity stage classification. The framework accommodates both qualitative and quantitative assessment methods. Organisations can use this tool for self-evaluation or integrate it into external audits and benchmarking studies. Scores derived from the Likert scale responses can be translated into percentage thresholds, offering a consistent basis for comparative analysis across firms or over time.
In sum, this proposed framework seeks to bridge the current gap between fragmented digital capability assessments and the industry’s need for a structured, comprehensive, and adaptable maturity evaluation model. It serves as both a diagnostic tool and a strategic roadmap, empowering AEC organisations to plan, implement, and monitor their digital transformation efforts effectively.
6.3. Benchmarking Comparison with Existing Tools
The proposed framework in Figure 11 was benchmarked against widely adopted maturity tools such as BIM Maturity Matrix (BIM-MM), BIM Quick Scan (BIM Compass), VDC BIM Scorecard, ICMM and NBIMS-CMM, representing diverse design philosophies within the AEC domain. These tools were selected for their sustained citation, methodological variety, and practical influence, covering a spectrum from checklist-based diagnostics to matrix-driven scoring systems. This ensured a balanced and representative benchmarking base to evaluate the proposed framework across contrasting digital maturity traditions.
The comparative analysis criteria used for benchmarking (Table 3) were synthesized from the comprehensive review in Section 5, integrating evidence on assessment structures, rating approaches, and usability attributes. The aim was to capture not only the scope of maturity dimensions but also the methodological quality and practical robustness of each tool. Criteria such as the use of a five-level Likert scale, provision of subdimensions, and visual scoring dashboards assess measurement transparency and clarity of progression, while features like the integrated assessment of people, process, and culture and stakeholder differentiation represent inclusivity and contextual adaptability. In parallel, maturity path mapping and combined bottom-up and top-down scoring evaluate how tools facilitate iterative growth and multi-level engagement. Collectively, these criteria translate the analytical outcomes of Section 5 into a multidimensional benchmarking framework that evaluates both content coverage and design quality, ensuring a holistic comparison aligned with maturity model best-practice principles [31,37,44].
Table 3.
Comparative evaluation of selected digital maturity tools and the proposed framework.
Scope of coverage: Table 3 indicates that none of the benchmarked tools consistently cover all eleven maturity dimensions identified in this review. Technology, organisation and management, and process are frequently represented, yet people, policy and governance, skills and training, and financial resources are either absent or receive less attention. The proposed framework is intentionally complete at the dimensional level. It requires explicit representation of each of the eleven domains and assigns subdimensions to ensure measurable coverage rather than narrative mention. This breadth directly addresses the imbalance highlighted earlier in the paper, where human and policy-related factors receive less attention despite being critical for durable change in AEC organisations. A quantitative frequency analysis of the eleven maturity dimensions demonstrates that existing tools collectively prioritize technology (90%), organisation and management (70%), process and operations (55%), and data and information management (55%). In contrast, people (40%), standards (45%), culture and leadership (45%), strategy and vision (45%), skills and training (20%), policy (20%), and financial resources (15%) remain significantly underrepresented. These patterns reinforce the benchmarking results in Table 3 by providing measurable evidence of inconsistent dimension coverage across existing tools and highlight the contribution of the proposed framework in achieving complete and balanced representation.
Depth and granularity: Existing tools differ greatly in granularity. NBIMS-CMM gives a broad, tabular view of capability areas that is easy to grasp yet often lacks sub dimensional detail for people, policy, and finance. BIM-MM and VDC BIM Scorecard offer richer structures, but their depth concentrates on process and project delivery mechanics. The proposed framework formalizes subdimensions for every domain and ties them to scored questions or maturity descriptors, which prevents “checkbox coverage” and supports diagnostic drill-down. This design choice improves actionability because weaknesses surface at a subdimension level that can be directly assigned to teams or functions.
Measurement logic and scale: Many tools use five-point Likert or ordinal scales, though level definitions and scoring logic are not always transparent to end users. The framework retains a five-level structure for comparability but requires two clarifications that are often missing in existing practice. First, each domain and subdimension must have level descriptors that reference observable behaviours or artefacts rather than generic adjectives. Second, the scoring model must disclose how domain scores aggregate to an overall result. These clarifications improve auditability and reduce the risk that maturity labels are interpreted differently across projects or organisations. Table 3 reflects this standardisation through a column that captures the use of a five-point Likert or ordinal scale combined with visual dashboards for interpretation.
Maturity path mapping: Tools such as VDC BIM Scorecard and BIM Quick Scan often return a snapshot score or a radar chart. They communicate with the current state well but offer limited support for planning staged improvements that cut across interdependent domains. The proposed framework introduces a maturity path map that links current and target levels for every domain and subdimension and then sequences interventions according to dependencies. For example, policy and governance actions that establish common data environment rules are mapped before process automation that relies on those rules. This feature converts assessment into a delivery plan and is captured in Table 3 as “Maturity Path Mapping”.
Stakeholder and audience differentiation: Several existing tools were designed primarily for either project teams or enterprise functions, which can narrow their usefulness when ownership of actions is distributed. Figure 11 explicitly separates context design (“Basics”) from tool design (“Design Factors”). The context layer defines the target audience and stakeholder roles up front so that the same tool can be instantiated for different units of analysis, such as owner organisations, design consultants, contractors or facility managers. This differentiation improves relevance and supports governance because responsibilities for closing gaps are visible within the assessment outputs. Table 3 records this as “Stakeholder and Audience Differentiation”.
Hybrid top-down and bottom-up approach: The benchmarked tools typically emphasize one approach. Matrix-based tools lean top-down by locking stage definitions first, while questionnaire tools accumulate bottom-up evidence that is then rolled up. The proposed framework combines both. Dimensions and subdimensions are set top-down to ensure coverage of the full model of digital capability, while maturity levels and scores are produced bottom-up from item responses and artefact checks. This hybrid logic gives structure without losing empirical grounding. The combination is visible in Table 3 under “Combines Bottom-up and Top-down Scoring”.
Representation and interpretation: Existing toolkits often present results using static tables or spider charts. These are useful for quick communication but can obscure trade-offs across domains. The framework requires visual dashboards that pair radar views with domain heatmaps, maturity path timelines, and evidence traceability so that decision-makers see not only where a gap exists, but also which artefacts or behaviours justify the rating. This emphasis on interpretability is especially important for under- represented domains such as people or policy, which benefit from transparent evidence trails.
Reliability, variability and instantiation: Very few public descriptions of existing tools explicitly discuss tester training, repeatability checks, or how the tool handles variability across project types. Figure 11 adds these design factors to the canonical checklist of maturity model elements. Reliability is addressed by recommending calibration exercises and inter-rater agreement checks before enterprise-wide roll-out. Variability is addressed by allowing optional subdimensions that can be toggled on for specific contexts, for example security-critical projects or asset-intensive portfolios. Instantiation guidance clarifies how the framework is deployed as a web form, spreadsheet, or embedded audit template, which improves adoption and comparability across organisations.
Taken together, the benchmarking in Table 3 shows that existing tools provide valuable yet partial coverage across the maturity dimensions. While they offer strong foundations for assessing technology, process, and project delivery, their treatment of people, policy, skills, and financial domains remains inconsistent or absent. The proposed framework strengthens this landscape by operationalizing each of the benchmarking criteria used for explicit architectural features: measurable subdimensions for all eleven maturity domains, observable maturity level descriptors linked to evidence, a current target maturity path that sequences improvements, role-based stakeholder differentiation, and a hybrid scoring logic that integrates a top-down structure with bottom-up assessments. These mechanisms demonstrate the “Yes” ratings in Table 3 by indicating how each criterion is implemented rather than conceptually claimed. As a result, the framework not only unifies previously disconnected maturity elements but also provides a transparent, repeatable, and context-adaptable evaluation architecture that responds directly to the gaps identified in the literature.
6.4. Testing Regimes and Validation Pathways for Digital Maturity Tools
The development of digital maturity assessment tools within the AEC sector typically incorporates structured testing regimes to ensure clarity, reliability, and practical usefulness. Insights from prior studies demonstrate that tool validation commonly begins with literature reviews to define conceptual boundaries, followed by expert interviews, iterative refinement, and pilot applications in real organisational contexts [68,69,70]. Empirical evidence shows that such tools can significantly enhance digital performance; for instance, one maturity-based implementation reduced document approval time by 75% in construction SMEs [71]. Validation exercises vary widely in scale, ranging from focused expert consultations involving 5 participants [69] to larger pilots with 17 public sector organisations [72] or cross-industry evaluations involving 24 companies or more [43,68,69,73]. Despite this variety, the literature consistently highlights limited empirical validation as a persistent challenge, underscoring the need for structured and repeatable testing phases [73].
Within these testing regimes, iterative feedback is essential for refining tools and ensuring that scoring models accurately capture maturity across dimensions such as technology, people, process, culture, and policy. Studies emphasize that early-stage trials help identify ambiguous indicators, strengthen the behavioural clarity of maturity levels, and improve the alignment of questions with organisational realities [74]. Furthermore, iterative refinement enhances representational transparency and usability, which are crucial for industry adoption. Validation processes that incorporate repeated testing and stakeholder review, such as alpha evaluations with small expert groups followed by broader beta trials, have been shown to sharpen scoring logic, increase reliability, and improve practitioners’ comprehension of the tool’s outputs [74,75].
Positioned within this context, the proposed framework is designed to follow a similar staged validation pathway. Its structure, which integrates both contextual “Basics” and methodological “Design Factors”, is well suited to expert walkthroughs, controlled pilot studies, and subsequent organisational applications. This process will help verify the clarity of maturity descriptors, the consistency of scoring aggregation, and the interpretability of visual dashboards. A key contribution of the framework is its strengthened treatment of underrepresented dimensions, particularly people, culture, skills, policy, and financial capacity, which the benchmarking review identified as major gaps in existing models. The inclusion of structured subdimensions and behaviour- anchored descriptors within these domains allows for more transparent evaluation and better evidential traceability during validation. Through staged pilot testing, these features can be empirically refined to ensure that the human and organisational factors influencing digital transformation are assessed with equal rigor to technical domains. Overall, the testing pathway outlined in the literature provides a clear trajectory for validating the proposed framework. By adopting expert evaluation, small-scale pilots, and progressive beta trials, the framework can be empirically strengthened and prepared for practical deployment across diverse AEC organisational contexts.
7. Conclusions
Addressing RQ1, this study evaluated 20 digital maturity assessment tools across various sectors, with an emphasis on the AEC sector. The key features of the tools analysed included tool developers, target sectors, evaluation matrices, dimensions assessed, accessibility, time required, assessment questions, measurement scales, and maturity levels. Technology (90%), organisation and management (70%), data and information management (55%), and process and operations (55%) were identified as the most frequently assessed maturity areas. Strategy and vision (45%), standards (45%), culture and leadership (45%), and people (40%) received less attention, while policy (20%), skills training (20%), and financial resources (15%) received the least focus.
In relation to RQ2, the review identified several gaps in the selected tools, including the absence of a comprehensive assessment approach, inadequate integration of key components (e.g., maturity levels, dimensions, subdimensions, and maturity pathways), and the lack of simultaneous evaluation of critical dimensions. The selected tools vary in their approaches, with some being user-friendly but subjective (e.g., NBIMS CMM), while others use more complex methods that require more time and data (e.g., BIM-MM, VDC Scorecard, and BIMCS). Based on the analysis, tools such as BIM-MM, BIM Quick Scan, Maturity Scan, VDC BIM Scorecard and ICMM were identified as the most informative sources for designing a new tool. The study therefore recommends developing an improved tool with the following features:
- A five-level maturity scale associated with a five-point Likert scale.
- An integrated assessment approach evaluating multiple critical dimensions simultaneously.
- A combined bottom-up approach for maturity scoring and top-down approach for selecting dimensions and subdimensions.
The paper presents a conceptual framework (Figure 11) that combines existing tools’ strengths while addressing their key limitations. Earlier tools lacked transparency in scoring logic, consistency in maturity levels, or integration of underrepresented dimensions like people, policy, skills, and finance. They emphasized technology and process while neglecting stakeholder engagement and pathway mapping for improvement. Figure 11 addresses these gaps by requiring coverage of all eleven domains, structuring subdimensions for measurable assessment, and embedding maturity path mapping results informs progression strategies rather than static snapshots.
The framework also formalizes elements rarely integrated together in earlier tools, including a combined top-down and bottom-up approach to dimension selection and scoring, stakeholder role differentiation, and visual dashboards that improve interpretation and traceability of results. Compared with widely used tools such as BIM-MM, BIM Quick Scan, VDC BIM Scorecard, and NBIMS-CMM, the proposed framework offers a more balanced and comprehensive evaluation architecture, in contrast with the ability of those tools to provide only partial coverage, for example, NBIMS-CMM offers breadth but limited depth and BIM Quick Scan prioritizes ease of use at the expense of detail. Figure 11 integrates their useful features while closing observed gaps.
Overall, the framework represents a key contribution to the study by providing a practical and scalable blueprint for the development of future digital maturity assessment tools. It demonstrates how ISO 19650 principles can be embedded into a structured evaluation tool that is holistic, transparent, and adaptable to different organisational contexts. Beyond serving as an academic proposal, it offers a forward-looking basis for practitioners, policymakers, and researchers to design tools that not only benchmark digital readiness but also provide actionable guidance for continuous improvement, thereby directly addressing RQ2.
8. Limitations and Future Research
This review aimed to provide a structured evaluation of digital maturity assessment tools relevant to the construction sector; however, several limitations should be acknowledged. First, PRISMA-ScR was applied as a reporting framework and the internal protocol was compiled retrospectively after the database searches and initial screening had been completed; therefore, it should be interpreted as documentation of the methods applied rather than a prospectively registered protocol, which may reduce transparency compared with fully preregistered systematic reviews. Second, although 20 tools were systematically analysed, additional frameworks may exist in grey literature, proprietary industry platforms, or region-specific initiatives that were not publicly accessible at the time of review. Third, variations in tool documentation and inconsistent reporting formats may have limited the depth of comparison across certain dimensions. Fourth, the rapidly evolving nature of digital transformation means that maturity frameworks are frequently updated, deprecated, or replaced, which may influence the long-term applicability of the findings. As this is a scoping systematic review, no formal risk-of-bias or quality appraisal of individual sources was undertaken; instead, tool robustness was assessed using pre- defined design quality criteria (Table 3). While this conservative, rule-based coding protocol was designed to minimise subjectivity, interpretive bias cannot be fully eliminated, and some borderline coding decisions may still reflect the authors’ judgement.
Future research should expand the scope by incorporating empirical validation of these tools through case studies and industry testing. Comparative longitudinal studies could further examine how digital maturity evolves over time and how organisations progress between maturity stages. There is also a need to advance people-centric, governance-focused, and data-driven dimensions within maturity frameworks to better align with contemporary digital transformation practices. Finally, the development and validation of integrated, standards-aligned maturity toolkits such as the framework proposed in this study represent promising directions for improving assessment consistency and supporting strategic digital adoption across the AEC sector.
Supplementary Materials
The following supporting information can be downloaded at: https://www.mdpi.com/article/10.3390/buildings16010239/s1, Table S1: PRISMA-ScR-Checklist. The PRISMA-ScR Checklist standardizes reporting for scoping reviews, distinguishing them from systematic reviews by using broader evidence sources and the term “data charting” for data extraction. It focuses on assessing evidence validity and relevance instead of risk of bias, reflecting the diverse nature of scoping review sources. The guidelines build on frameworks by Arksey and O’Malley, Levac et al., and the Joanna Briggs Institute. Table S2. Detailed search reporting for database, register, and web-based sources, including search strings, limits applied, search dates, initial records retrieved, and records exported for screening, consistent with the PRISMA-ScR framework. Supplementary Table S2 provides a detailed report of the search strategies used across database, register, and web-based sources. It includes search strings, applied limits, search dates, the number of initial records retrieved, and the records exported for screening, all aligned with the PRISMA-ScR framework. Table S3. Coding Data. This file provides the coding materials used in the study, including tool-by-dimension coding with totals, tool-by-criteria coding supporting Table 3, and extracted dimension lists with concise codebook definitions and coding notes. These materials underpin the dimension frequency and coverage analysis as well as the comparative criteria synthesis. Supplementary File S4. Codebook Definitions. This document details the approach and findings of an analysis on the dimension coverage of 20 digital maturity assessment tools. It explains the process of extracting, coding, and synthesizing dimensions, with the support of a codebook that defines 11 essential dimensions. The analysis also uncovers additional dimensions and comparative criteria, ensuring transparency and reliability in the evaluation of digital maturity tools. Supplementary File S5. Tools Inventory. This document provides an overview of the 20 selected digital maturity assessment tools, describing each tool in terms of target audience, year of development, jurisdiction, origin or developer, platform, accessibility, availability, estimated time to complete, brief description, and associated supporting links or documentation.
Author Contributions
Conceptualization, R.U., J.H., T.M. and A.F.; methodology, R.U., J.H. and T.M.; validation, R.U.; formal analysis, R.U.; investigation, R.U., J.H., T.M. and A.F.; resources, J.H. and T.M.; data curation, R.U., J.H. and T.M.; writing—original draft preparation, R.U.; writing—review and editing, J.H., T.M., A.F., M.O. and S.C.; visualization, J.H., T.M. and M.O.; supervision, J.H., T.M., M.O. and S.C.; funding acquisition, J.H. and T.M. All authors have read and agreed to the published version of the manuscript.
Funding
This research project is funded by the Build Digital Project, supported by the Department of Public Expenditure, National Development Plan Delivery and Reform, Ireland.
Data Availability Statement
Aggregated coding results are reported in Appendix A.1, Appendix A.2 and Appendix A.3 and in Table 1, Table 2 and Table 3 of the manuscript. The complete coding dataset (S3. Coding Data), concise codebook definitions (S4. Codebook Definitions), and the tools inventory with source links (S5. Tools Inventory) are provided as Supplementary Materials. Any additional screening notes are available from the corresponding author upon request.
Acknowledgments
The authors would like to acknowledge support from the Build Digital Project, funded by the Department of Public Expenditure, National Development Plan Delivery and Reform, Ireland. This article is an expanded version of a paper entitled “Navigating Digital Maturity: Analysis of Digital Maturity Assessment Tools”, which was presented at the Civil Engineering Research in Ireland 2024 (CERI2024) conference held in Galway in August 2024.
Conflicts of Interest
The authors declare no conflicts of interest.
Abbreviations
The following abbreviations are used in this manuscript:
| AEC | Architecture, engineering and construction |
| DT | Digital transformation |
| ISO | International Organisation for Standardisation |
| VDC | Virtual design and construction |
| ICT | Information communication and technology |
| CSPs | Communication service providers |
| SBI | Strategic building innovation |
| CIC | Computer-integrated construction |
| NIBS | National Institute of Building Sciences |
| SEI | Software Engineering Institute |
| CMU | Carnegie Mellon University |
| CIFE | Centre for Integrated Facility Engineering |
| VTG | Viatel Technology Group |
Appendix A
Appendix A.1
Table A1.
Existing digital maturity assessment tools included in study and their comparative analysis of key characteristics (presented in reverse chronological order).
Table A1.
Existing digital maturity assessment tools included in study and their comparative analysis of key characteristics (presented in reverse chronological order).
| Maturity Assessment Tool | Owner | Country/Source | Year | Target Sector | Platform | Accessibility | Time Required to Complete Assessment | Evaluation Matrix | Reference |
|---|---|---|---|---|---|---|---|---|---|
| Maturity Scan | European Innovation Council | European Commission | 2021–22 | AEC sector | Web based | Free access | Quick Scan 5 min In-Depth Scan 15–20 min | Uses a two-tier scanning method with basic queries and advanced multiple-choice questions across 18 BIM subdimensions. SME digital maturity is measured and visualised, contrasting current performance with digital transformation goals, and categorising companies as late adopters, early adopters, or pioneers based on their digitalisation level. | [26] |
| Digital Performance Indicator (DPI) | Binder Dijker Otte (BDO) | United States | 2021 | All sectors | Web based | For assessment the BDO team should be contacted | 10–15 min | DPI assesses a company’s digital maturity across six dimensions, as outlined in BDO’s 2021 middle market DT survey, yielding a score from 0 to 100. This system evaluates digital maturity in sales, customers, employees, IT and processes, suitable for any industry or enterprise. | [23] |
| Digital Maturity Self-Assessment (DMSA) | Action Point | Ireland | 2021 | All sectors | Web based | For assessment the VTG team should be contacted | 15–20 min | The digital maturity of an organisation is assessed through a 36-item multiple-choice questionnaire, which covers six dimensions of business transformation. The results report includes scores, recommendations, strengths, and areas for improvement, and is applicable to organisations across all sectors. | [76] |
| Digital Maturity Tool (DMT) | Digital Leadership Ltd. | United Kingdom | 2020 | All sectors | Web based | Fee required for access | 10–15 min | Uses a five-level scale to generate the organisation’s digital maturity score through an online assessment. The overall digital maturity level is displayed via live graphs and percentages. | [56] |
| BIM Capability Assessment Reference Model | University of Cambridge | United Kingdom | 2019 | AEC/facility Mngt. | Excel based | For access research team should be contacted | Undefined | BIM-CAREM enables BIM capability assessments of AEC/FM processes throughout the facility’s life cycle phases over five main areas. | [54] |
| Digital Acceleration Index (DAI) | Boston Consulting Group | United States | 2018 | All sectors | Web based | Free Access | 10 min | Evaluates digital capability through readiness for new technologies, innovation, and comparison with peers and digital leaders. Uses 35 KPIs from a study of approximately 900 companies’ digital transformation programs to present predicted success rates and percentile scores graphically. | [60] |
| Maturity model of digitisation for SMEs (MMD-SMEs) | Franziska Blatz | Germany | 2018 | All sectors | Research based | For access to tool, research team should be contacted at franziska@familie-blatz.de | 30–60 min | The tool assesses the digital maturity of SMEs across six dimensions using a Likert scale and categorising them into three levels of maturity. Although the tool is comprehensive, research-based, and freely accessible, the tool lacks customisation capabilities and provides only generalised recommendations for enhancement. | [24] |
| BIM Action-Based Maturity Model (BIM-ABMM) | Joaquim Maria Pires | Brazil and Portugal | 2016 | AEC sector | Research based | For access, contact mail@tecnico.ulisboa.pt | Undefined | Integrates quantitative and qualitative assessments of both hard and soft aspects using 32 KPIs to assess current digital maturity, facilitating BIM implementation and digital transformation adoption. | [55] |
| Digital Maturity Model (DMM) | TM Forum and Deloitte | United States | 2015 | ICT and CSP industry | Web based | For assessment the TM Forum team should be contacted | Undefined | Evaluates an organisation’s digital maturity using 179 key performance indicators (KPIs) across 28 subdimensions, providing insights into strengths, weaknesses, and recommendations for improving digital maturity level. | [58,59] |
| Digital Quotient (DQ) | McKinsey’s Construction | United States | 2015 | All sectors | Web based | Free Access | 30 min | The DQ assesses digital maturity through five dimensions, 32 management practices and 50 questions, enabling consultants to evaluate organisations with aggregated metrics. It provides a broad assessment approach for organisations seeking to enhance digital maturity. | [27] |
| BIM Cloud Score (BIMCS) | University of Texas | United States | 2015 | AEC sector | Research based | For access to tool, contact at (eric.du@essie.ufl.edu) | 30–60 min | The system includes 6 dimensions and 20 subdimensions for assessing BIM maturity. BIMCS is a software as a system (SaaS)-based community cloud, which collects, consolidates, and displays benchmarking data, provides an interactive and autonomous view of industry BIM usage and a customisable tool for specific organisational needs. | [21] |
| BimSCORE | Dr. Calvin Kam | SBI-United States | 2014 | AEC sector | Web based | For access, the SBI team should be contacted | 1–3 h | This tool compares current projects with past ones and industry benchmarks, allowing stakeholders to assess BIM practice, progress, and maturity over time. Although it offers comprehensive and actionable improvement recommendations, it may face implementation challenges and limited vendor support. | [57] |
| Virtual Design Construction (VDC) BIM Scorecard | Stanford University | United States | 2014 | AEC sector | Research based | For access to tool, the CIFE team should be contacted at (ckam@stanfordalumni.org) | 1–4 h | Evaluates VDC implementation maturity across 4 main dimensions, 10 subdimensions and 56 key performance indicators through seven confidence factors. It prioritises certain areas over others through a weighted scorecard and thoroughly assesses an organisation’s BIM maturity, including leadership, governance, data, and analytics, and promotes objectives, standards and resources to meet business goals. | [50] |
| Organisational BIM Assessment Profile (OBAP) | CIC- Penn State University | United States | 2013 | AEC sector | Microsoft Excel workbook | Free access | 30–60 min | The evaluation matrix assesses an organisation’s BIM proficiency across five areas using a five-point Likert scale over six maturity levels. Higher BIM maturity corresponds to higher scores. Additionally, the matrix can be tailored to the organisation’s specific goals and objectives. | [77] |
| Multifunctional BIM Maturity Model (M-BIM MM) | Dr Liang Cong | University of Hong Kong | 2013 | AEC sector | Research based | For access to tool, research team should be contacted at congliang@ln.edu.hk | 30–90 min | Evaluates BIM maturity in individual projects, organisations with multiple projects, or the AEC industry through 21 subdimensions within 5 main dimensions, assessed on an ordinal scale across four maturity levels. The tool offers actionable improvement suggestions and basic evaluations of an organisation’s BIM maturity. | [28] |
| BIM Excellence (BIMe) | ChangeAgents AEC | Australia | 2010–13 | AEC sector | Web based | For access to tool, the BIMe team should be contacted | 1–3 months | BIMe is a versatile tool for evaluating BIM implementation across individuals, organisations, projects, and teams. It provides free assessment with downloadable reports and consultation services. BIMe’s online platform assesses current abilities against requirements and benchmarks, covering leadership, governance, data, and analytics. | [78,79] |
| BIM Compass | BIM Loket | The Netherlands | 2009–10 | AEC sector | Web based | Free access | 40–50 min | It evaluates software, tools, system integration, hardware standards, data protocols, and soft aspects including collaboration, training, skills, culture, leadership, and contractual considerations of BIM. It provides insights into a company’s BIM performance and digital maturity, making it recommended for beginners in digital maturity assessment. | [22,38] |
| BIM Maturity Matrix (BIM MM) | ChangeAgents AEC | Australia | 2009–10 | AEC sector | Web based | Fee required for access | 30–60 min | BIM MM assesses individual competency, organisational capability, and project performance using five metrics, three capability levels, and five maturity levels. The result is a maturity score or level, indicating the organisation’s position on the BIM maturity scale, with recommendations for improvement and follow-up consultation on organisational performance. | [13,16,36] |
| Interactive Capability Maturity Model (I-CMM) | NBIS | United States | 2008 | AEC sector | Interactive Microsoft Excel workbook | For access to tool, the NBIMS team should be contacted | 30–60 min | I-CMM evaluates BIM implementation across 11 dimensions using a 10-level and 5-point Likert scale. The tool uses weighted summation, prioritizing criteria based on significance. Each criterion is scored from 0 to a maximum, with total scores from 0–100 reflecting maturity levels. I-CMM assesses BIM maturity, enables goal setting and provides improvement suggestions, but lacks customisation and reporting features. | [52] |
| NBIMS Capability Maturity Model (NBIMS-CMM) | SEI-CMU | United States | 2007 | AEC sector | Static tabular Excel workbook | For, the NBIMS team should be contacted | 30 min | Assesses BIM’s operational and organisational capabilities through an interactive Microsoft Excel maturity matrix which evaluates digital maturity across 11 dimensions on a 10-level scale. This method converts subjective evaluations into objective, broadly applicable findings, visually depicting BIM’s information management maturity with precise scores across 11 areas. | [52,80] |
Appendix A.2
Table A2.
Comparative analysis of eleven primary dimensions included in selected tools as per the literature.
Table A2.
Comparative analysis of eleven primary dimensions included in selected tools as per the literature.
| Maturity Assessment Tools | Year | Dimension | |||||||||||
|---|---|---|---|---|---|---|---|---|---|---|---|---|---|
| Strategy and Vision | Org. and Mgmt. | Policy | Standards | Culture and Leadership | People | Training and Skills | Process | Data/Info Mgmt. | Technology | Financial Resources | % of Assessed Dimensions | ||
| Maturity Scan | 2021–22 | ✓ | ✓ | ✓ | ✓ | ✓ | 45 | ||||||
| Digital Performance Indicator | 2021 | ✓ | ✓ | ✓ | ✓ | ✓ | ✓ | 55 | |||||
| Digital Maturity Self-Assessment | 2021 | ✓ | ✓ | ✓ | ✓ | ✓ | ✓ | 55 | |||||
| Digital Maturity | 2020 | ✓ | ✓ | ✓ | ✓ | ✓ | 45 | ||||||
| BIM Capability Assessment Reference Model | 2019 | ✓ | ✓ | ✓ | ✓ | 36 | |||||||
| Digital Acceleration Index | 2018 | ✓ | ✓ | ✓ | ✓ | ✓ | 45 | ||||||
| Maturity model of digitization for SMEs | 2018 | ✓ | ✓ | ✓ | ✓ | 36 | |||||||
| BIM Action Based Maturity Model | 2016 | ✓ | ✓ | ✓ | ✓ | ✓ | 45 | ||||||
| Digital Maturity Model | 2015 | ✓ | ✓ | ✓ | ✓ | ✓ | ✓ | 55 | |||||
| Digital Quotient | 2015 | ✓ | ✓ | ✓ | ✓ | ✓ | 45 | ||||||
| Building Information Modelling Cloud Score | 2015 | ✓ | ✓ | ✓ | ✓ | ✓ | ✓ | 55 | |||||
| Bim SCORE | 2014 | ✓ | ✓ | ✓ | 27 | ||||||||
| VDC BIM Scorecard | 2014 | ✓ | ✓ | ✓ | ✓ | ✓ | ✓ | 55 | |||||
| Organisational BIM Assessment Profile | 2013 | ✓ | ✓ | ✓ | ✓ | ✓ | 45 | ||||||
| Multifunctional BIM Maturity Model | 2013 | ✓ | ✓ | ✓ | ✓ | ✓ | 45 | ||||||
| BIM Excellence | 2010–13 | ✓ | ✓ | ✓ | ✓ | ✓ | ✓ | 55 | |||||
| BIM Compass | 2009–10 | ✓ | ✓ | ✓ | ✓ | ✓ | 45 | ||||||
| BIM Maturity Matrix | 2009–10 | ✓ | ✓ | ✓ | 27 | ||||||||
| NBIMS Maturity Model | 2007–08 | ✓ | ✓ | ✓ | ✓ | 36 | |||||||
| Interactive Capability Maturity Model | 2007–08 | ✓ | ✓ | ✓ | ✓ | ✓ | ✓ | 55 | |||||
| % of Tools Assessing Specific Dimension | 45 | 70 | 20 | 45 | 45 | 40 | 20 | 55 | 55 | 90 | 15 | ||
Appendix A.3
Table A3.
Mapping of the eleven maturity dimensions to ISO 19650 Principles.
Table A3.
Mapping of the eleven maturity dimensions to ISO 19650 Principles.
| Maturity Dimension | Brief Description | Relevant ISO 19650 Principles/Clauses * |
|---|---|---|
| Strategy and vision | Organisational digital strategy, information vision, alignment of BIM/information management with asset and project objectives. | ISO 19650-1:2018, Part 1—Concepts and principles (linking information management to organisational objectives and benefits); ISO 19650-2:2018, Clause 5—Information management process during the delivery phase (assessment of need and planning of information management). |
| Organisation and management | Governance structures, appointment model, roles and responsibilities for managing information across project participants. | ISO 19650-1:2018, sections on information management functions and responsibilities; ISO 19650-2:2018, Clause 5 (information management process) including allocation of responsibilities between appointing and appointed parties. |
| Policy | Internal and external policies, contractual and legal rules that govern information management, security and compliance. | ISO 19650-1:2018, principles for information management and legal/regulatory context; ISO 19650-2:2018, clauses on requirements, appointments and information protocols; supported by UK BIM Framework Guidance Part D—Developing information requirements. |
| Standards | Use of BIM/information standards, CDE protocols, naming conventions and classification to support structured information. | ISO 19650-1:2018, container-based information management concepts; ISO 19650-2:2018, clauses on information standard and information production methods (within the information management process). |
| Culture and leadership | Leadership commitment, collaborative culture, change management, support for digital ways of working. | ISO 19650-1:2018, concepts and principles emphasising collaborative production and sharing of information; general guidance on leadership and organisational buy-in in the UK BIM Framework documents. |
| People | Engagement of end-users, client representatives and project teams in defining, using and maintaining information. | ISO 19650-1:2018, information management functions and roles; ISO 19650-2:2018, information management process describing interactions between appointing and appointed parties and their teams. |
| Skills and training | Digital skills, BIM capability, training and competence of staff involved in information management. | ISO 19650-1:2018, principles around capability and capacity of organisations to fulfil information management functions; supported by UK BIM Framework guidance on competency for information management roles. |
| Process/operations | Defined workflows, procedures and process controls for planning, producing, sharing and checking information. | ISO 19650-1:2018, process principles for information management; ISO 19650-2:2018, Clause 5—Information management process during the delivery phase of assets (all stages from assessment of need to handover). |
| Data and information management | Requirements, structures and flows of project/asset information, including CDE use, metadata and information containers. | ISO 19650-1:2018, container-based information management concepts; ISO 19650-2:2018, clauses on information delivery milestones, common data environment and information exchange. |
| Technology | Digital tools, platforms and infrastructure support BIM and information management processes. | ISO 19650-1:2018, overarching principles for technology-neutral information management using BIM; ISO 19650-2:2018, information management process as implemented through CDEs and related technologies. |
| Financial resources | Investment, budgeting and resource allocation to support digital transformation and information management activities. | ISO 19650-1:2018, benefits of information management and business-case principles, which imply the need for appropriate resourcing; these are typically expanded in national/client guidance rather than in detailed clauses of ISO 19650-2. |
Note: * Clause references are indicative and focus on the main ISO 19650 parts and process clauses that conceptually underpin each dimension.
References
- Vial, G. Understanding Digital Transformation: A Review and a Research Agenda. In Managing Digital Transformation; Routledge: Milton Park, UK, 2021; ISBN 978-1-003-00863-7. [Google Scholar] [CrossRef]
- Remane, G.; Hanelt, A.; Wiesböck, F.; Kolbe, L. Digital Maturity in Traditional Industries—An Exploratory Analysis. 2017. Available online: https://aisel.aisnet.org/ecis2017_rp/10/ (accessed on 10 March 2025).
- Bharadwaj, A.; El Sawy, O.A.; Pavlou, P.A.; Venkatraman, N. Digital Business Strategy: Toward a next Generation of Insights. MIS Q. 2013, 37, 471–482. [Google Scholar] [CrossRef]
- Fitzgerald, M.; Kruschwitz, N.; Bonnet, D.; Welch, M. Embracing Digital Technology: A New Strategic Imperative. MIT Sloan Manag. Rev. 2014, 55, 1. [Google Scholar]
- Lee, M.; Yun, J.J.; Pyka, A.; Won, D.; Kodama, F.; Schiuma, G.; Park, H.; Jeon, J.; Park, K.; Jung, K. How to Respond to the Fourth Industrial Revolution, or the Second Information Technology Revolution? Dynamic New Combinations between Technology, Market, and Society through Open Innovation. J. Open Innov. Technol. Mark. Complex. 2018, 4, 21. [Google Scholar] [CrossRef]
- Oliveira, M.; Zancul, E.; Salerno, M.S. Capability Building for Digital Transformation through Design Thinking. Technol. Forecast. Soc. Change 2024, 198, 122947. [Google Scholar] [CrossRef]
- Yeow, A.; Soh, C.; Hansen, R. Aligning with New Digital Strategy: A Dynamic Capabilities Approach. J. Strateg. Inf. Syst. 2018, 27, 43–58. [Google Scholar] [CrossRef]
- Mittal, S.; Khan, M.A.; Romero, D.; Wuest, T. A Critical Review of Smart Manufacturing and Industry 4.0 Maturity Models: Implications for Small and Medium-Sized Enterprises (SMEs). J. Manuf. Syst. 2018, 49, 194–214. [Google Scholar] [CrossRef]
- Kannan, S.M.; Suri, K.; Cadavid, J.; Barosan, I.; Van Den Brand, M.; Alferez, M.; Gerard, S. Towards Industry 4.0: Gap Analysis between Current Automotive MES and Industry Standards Using Model-Based Requirement Engineering. In Proceedings of the 2017 IEEE International Conference on Software Architecture Workshops (ICSAW), Gothenburg, Sweden, 5–7 April 2017; IEEE: New York, NY, USA, 2017; pp. 29–35. [Google Scholar] [CrossRef]
- Akinsola, F. Digital Innovation: SMEs Need a Bridge to Cross the Digital Divide. Medium. 2018. Available online: https://medium.com/@FemiAkinsola/digital-innovation-smes-need-a-bridge-to-cross-the-digital-divide-d45b37d12047 (accessed on 10 May 2025).
- Zim, A.H.; Iqbal, A.; Hossain, L.; Arif, S.; Malik, A.; Rasool, I.; Kuribayashi, M.; Ahmad, F. Smart Manufacturing with Transfer Learning under Limited Data: Towards Data-Driven Intelligences. Mater. Today Commun. 2023, 37, 107357. [Google Scholar] [CrossRef]
- Eastman, C.; Lee, G.; Teicholz, P.M. BIM Handbook: A Guide to Building Information Modeling for Owners, Designers, Engineers, Contractors, and Facility Managers; John Wiley & Sons: Hoboken, NJ, USA, 2011. [Google Scholar] [CrossRef]
- Succar, B.; Sher, W.; Williams, A. An Integrated Approach to BIM Competency Assessment, Acquisition and Application. Autom Constr 2013, 35, 174–189. [Google Scholar] [CrossRef]
- Adekunle, S.A.; Aigbavboa, C.; Ejohwomu, O.; Ikuabe, M.; Ogunbayo, B. A Critical Review of Maturity Model Development in the Digitisation Era. Buildings 2022, 12, 858. [Google Scholar] [CrossRef]
- Alankarage, S.; Chileshe, N.; Samaraweera, A.; Rameezdeen, R.; Edwards, D.J. Organisational BIM Maturity Models and Their Applications: A Systematic Literature Review. Archit. Eng. Des. Manag. 2023, 19, 567–585. [Google Scholar] [CrossRef]
- Succar, B. Building Information Modelling Framework: A Research and Delivery Foundation for Industry Stakeholders. Autom. Constr. 2009, 18, 357–375. [Google Scholar] [CrossRef]
- Hajoary, P.K. Industry 4.0 Maturity and Readiness Models: A Systematic Literature Review and Future Framework. Int. J. Innov. Technol. Manag. 2020, 17, 2030005. [Google Scholar] [CrossRef]
- Osei-Kyei, R.; Chan, A.P.C. Review of Studies on the Critical Success Factors for Public–Private Partnership (PPP) Projects from 1990 to 2013. Int. J. Proj. Manag. 2015, 33, 1335–1346. [Google Scholar] [CrossRef]
- Sony, M.; Naik, S. Key Ingredients for Evaluating Industry 4.0 Readiness for Organisations: A Literature Review. Benchmarking: Int. J. 2020, 27, 2213–2232. [Google Scholar] [CrossRef]
- Giel, B.; Issa, R.R.A. Framework for Evaluating the BIM Competencies of Building Owners. In Proceedings of the Computing in Civil and Building Engineering (2014), Orlando, FL, USA, 17 June 2014; American Society of Civil Engineers: Reston, VA, USA, 2014; pp. 552–559. [Google Scholar] [CrossRef]
- Du, J.; Liu, R.; Issa, R.R.A. BIM Cloud Score: Benchmarking BIM Performance. J. Constr. Eng. Manage 2014, 140, 04014054. [Google Scholar] [CrossRef]
- Sebastian, R.; Van Berlo, L. Tool for Benchmarking BIM Performance of Design, Engineering and Construction Firms in The Netherlands. Archit. Eng. Des. Manag. 2010, 6, 254–263. [Google Scholar] [CrossRef]
- BDO, D. The 10-Minute Digital Performance Indicator. Available online: https://www.bdo.az/en-gb/insights/insights/10-minutes-to-gauge-your-digital-competitiveness-digital-performance-indicator (accessed on 15 May 2025).
- Blatz, F.; Bulander, R.; Dietel, M. Maturity Model of Digitization for SMEs. In Proceedings of the 2018 IEEE International Conference on Engineering, Technology and Innovation (ICE/ITMC), 17–20 June 2018; IEEE: New York, NY, USA, 2018; pp. 1–9. [Google Scholar] [CrossRef]
- Digital Maturity Framework|Digital Maturity. Available online: https://digitalmaturity.org/digital-maturity-framework/ (accessed on 3 May 2025).
- European Commission Maturity Scan|Digitalisation of Construction SMEs. Available online: https://digital-construction.ec.europa.eu/maturity-scan (accessed on 13 May 2025).
- McKinsey Raise Your Digital Quotient. Available online: https://www.mckinsey.com/featured-insights/digital-disruption/raise-your-digital-quotient (accessed on 30 May 2025).
- Liang, C.; Lu, W.; Rowlinson, S.; Zhang, X. Development of a Multifunctional BIM Maturity Model. J. Constr. Eng. Manag. 2016, 142, 06016003. [Google Scholar] [CrossRef]
- Perera, S.; Jin, X.; Das, P.; Gunasekara, K.; Samaratunga, M. A Strategic Framework for Digital Maturity of Design and Construction through a Systematic Review and Application. J. Ind. Inf. Integr. 2023, 31, 100413. [Google Scholar] [CrossRef]
- Suermann, P.C.; Issa, R.R.A. The US National Building Information Modeling Standard. In Handbook of Research on Building Information Modeling and Construction Informatics: Concepts and Technologies; IGI Global Scientific Publishing: Palmdale, PA, USA, 2010; pp. 138–154. ISBN 978-1-60566-928-1. [Google Scholar] [CrossRef]
- Strategy, Not Technology, Drives Digital Transformation. Available online: https://sloanreview.mit.edu/projects/strategy-drives-digital-transformation/ (accessed on 15 October 2025).
- Paulk, M.C.; Curtis, B.; Chrissis, M.B.; Weber, C.V. Capability Maturity Model, Version 1.1. IEEE Softw. 1993, 10, 18–27. [Google Scholar] [CrossRef]
- Proença, D.; Borbinha, J. Maturity Models for Information Systems—A State of the Art. Procedia Comput. Sci. 2016, 100, 1042–1049. [Google Scholar] [CrossRef]
- Teece, D.J. Explicating Dynamic Capabilities: The Nature and Microfoundations of (Sustainable) Enterprise Performance. Strateg. Manag. J. 2007, 28, 1319–1350. [Google Scholar] [CrossRef]
- Tubis, A.A. Digital Maturity Assessment Model for the Organisational and Process Dimensions. Sustainability 2023, 15, 15122. [Google Scholar] [CrossRef]
- Succar, B. Building Information Modelling Maturity Matrix. In Handbook of Research on Building Information Modeling and Construction Informatics: Concepts and Technologies; IGI Global: Palmdale, PA, USA, 2010; pp. 65–103. [Google Scholar] [CrossRef]
- Jäkel, J.-I.; Fischerkeller, F.; AG, E.Z.; Oberhoff, T. Development of a Maturity Model for the Digital Transformation of Companies in the Context of Construction Industry 4.0. J. Inf. Technol. Constr. 2024, 29, 778–809. [Google Scholar] [CrossRef]
- Van Berlo, L.; Dijkmans, T.; Hendriks, H.; Spekkink, D.; Pel, W. BIM QuickScan: Benchmark of BIM Performance in the Netherlands. In Proceedings of the CIB W78 2012: 29th International Conference, Beirut, Lebanon, 17–19 October 2012; Volume 78, p. 2012. [Google Scholar]
- Abanda, F.H.; Balu, B.; Adukpo, S.E.; Akintola, A. Decoding ISO 19650 Through Process Modelling for Information Management and Stakeholder Communication in BIM. Buildings 2025, 15, 431. [Google Scholar] [CrossRef]
- ISO 19650; Managing Information with Building Information Modelling (BIM). The British Standards Institution (BSI): London, UK, 2018.
- Hwang, B.-G.; Ngo, J.; Teo, J.Z.K. Challenges and Strategies for the Adoption of Smart Technologies in the Construction Industry: The Case of Singapore. J. Manag. Eng. 2022, 38, 05021014. [Google Scholar] [CrossRef]
- Merschbrock, C.; Munkvold, B.E. Effective Digital Collaboration in the Construction Industry—A Case Study of BIM Deployment in a Hospital Construction Project. Comput. Ind. 2015, 73, 1–7. [Google Scholar] [CrossRef]
- De Bruin, T.; Rosemann, M.; Freeze, R.; Kaulkarni, U. Understanding the Main Phases of Developing a Maturity Assessment Model. In Australasian Conference on Information Systems (ACIS); Bunker, D., Campbell, B., Underwood, J., Eds.; Australasian Chapter of the Association for Information Systems: Perth, Australia, 2005; pp. 8–19. ISBN 978-0-9758417-0-9. [Google Scholar]
- Whelan, E.; Teigland, R. Managing Information Overload: Examining the Role of the Human Filter. SSRN Electron. J 2010. [Google Scholar] [CrossRef]
- SEI CMMI for Development, Version 1.2. Available online: https://cc.ee.ntu.edu.tw/~farn/courses/SE/CMMI_DEV_V12.pdf (accessed on 13 May 2025).
- Bascoul, A.M.; Tommelein, I.D.; Douthett, D. Visual Management of Daily Construction Site Space Use. Front. Built Environ. 2020, 6, 139. [Google Scholar] [CrossRef]
- Ghosh, S.; Mukherjee, N.; McCuen, T. Use of Visual Dashboards in Construction Projects. In EPiC Series in Built Environment, Proceedings of 60th Annual Associated Schools of Construction International Conference, Auburn, Alabama , 2–5 April 2024; University of Oklahoma: Norman, OK, USA, 2024; Volume 5, pp. 486–494. [Google Scholar]
- Saaty, T.L. Decision Making with the Analytic Hierarchy Process. Int. J. Serv. Sci. 2008, 1, 83. [Google Scholar] [CrossRef]
- Robin, R.O.; Yahya, M.Y. The Development of Building Information Modelling (BIM) Performance Model for the Malaysian Construction Industry. Int. J. Sustain. Constr. Eng. Technol. 2023, 14, 184–196. [Google Scholar] [CrossRef]
- Kam, C.; Senaratna, D.; McKinney, B.; Xiao, Y.; Song, M. VDC Scorecard: Formulation and Validation. J. Constr. Eng. Manag. 2013, 143, 04016100. [Google Scholar] [CrossRef]
- Alaghbandrad, A. BIM Maturity Assessment and Certification in Construction Project Team Selection. 2015. Available online: https://open.library.ubc.ca/soa/cIRcle/collections/52660/items/1.0076339 (accessed on 3 May 2025).
- NBIMS–US Version 3.5.2: Minimum BIM Requirements. National Institute of Building Sciences (NIBS), National BIM Standard–United States. Available online: https://nibs.org/wp-content/uploads/2025/04/NBIMS-US_V3_5.2_Minimum_BIM.pdf (accessed on 3 May 2025).
- Yilmaz, G.; Akcamete, A.; Demirors, O. BIM-CAREM: Assessing the BIM Capabilities of Design, Construction and Facilities Management Processes in the Construction Industry. Comput. Ind. 2023, 147, 103861. [Google Scholar] [CrossRef]
- Yilmaz, G.; Akcamete, A.; Demirors, O. A Reference Model for BIM Capability Assessments. Autom. Constr. 2019, 101, 245–263. [Google Scholar] [CrossRef]
- Pires, J.M. BIM Action Based Maturity Model. Available online: https://fenix.tecnico.ulisboa.pt/downloadFile/1689244997256751/E.A.BIMMaturityModelfortheNationalIndustry.pdf (accessed on 3 May 2025).
- Digital Leadership Ltd. Digital Maturity|An Invaluable Tool to Measure and Improve the Digital Maturity of Your Organisation. 2020. Available online: https://digitalmaturity.org/ (accessed on 15 November 2025).
- SBI. bimSCORE Overview-Strategic Building Innovation. Available online: https://sbi.international/ (accessed on 20 June 2024).
- Deloitte Future of Control|Control Automation: DMA (D.DMA). Available online: https://www2.deloitte.com/cn/en/pages/risk/articles/dma-digital-maturity-assessment.html (accessed on 3 May 2025).
- TM Forum Digital Maturity Model. Available online: https://www.tmforum.org/digital-maturity-model-metrics/?iframe=true (accessed on 5 May 2025).
- Boston Consulting Group: Digital Acceleration Index, The Leaders’ Path to Digital Value. Available online: https://www.bcg.com/publications/2021/digital-acceleration-index (accessed on 7 May 2025).
- Mettler, T.; Rohner, P.; Winter, R. Towards a Classification of Maturity Models in Information Systems. In Management of the Interconnected World; D’ Atri, A., De Marco, M., Braccini, A.M., Cabiddu, F., Eds.; Physica-Verlag HD: Heidelberg, Germany, 2010; pp. 333–340. ISBN 978-3-7908-2403-2. [Google Scholar]
- Solli-Sæther, H.; Gottschalk, P. The Modeling Process for Stage Models. J. Organ. Comput. Electron. Commer. 2010, 20, 279–293. [Google Scholar] [CrossRef]
- Calitz, S.; Wium, J.A. A Proposal to Facilitate BIM Implementation across the South African Construction Industry. J. S. Afr. Inst. Civ. Eng. 2022, 64, 29–37. [Google Scholar] [CrossRef]
- Damle, M.; Grover, B. Comparison of Select Digital Maturity Models for Digital Transformation Dynamics. Palarch’s J. Archaeol. Egypt/Egyptol 2020, 17, 4835–4856. [Google Scholar] [CrossRef]
- Jayanetti, J.; Perera, B.; Waidyasekara, K.; Siriwardena, M. Critical Analysis of Lean Construction Maturity Models: A Systematic Literature Review. Buildings 2023, 13, 1508. [Google Scholar] [CrossRef]
- Monla, Z.; Assila, A.; Beladjine, D.; Zghal, M. Maturity Evaluation Methods for BIM-Based AR/VR in Construction Industry: A Literature Review. IEEE Access 2023, 11, 101134–101154. [Google Scholar] [CrossRef]
- Lasrado, L.A.; Vatrapu, R.; Andersen, K. Maturity Models Development in IS Research: A Literature Review. Selected Papers of the IRIS, Issue Nr 6 (2015) 2015. Available online: https://www.researchgate.net/publication/281288783_MATURITY_MODELS_DEVELOPMENT_IN_IS_RESEARCH_A_LITERATURE_REVIEW?channel=doi&linkId=55e00e0e08aecb1a7cc1da2b&showFulltext=true (accessed on 7 May 2025).
- Siebelink, S.; Voordijk, J.T.; Adriaanse, A. Developing and Testing a Tool to Evaluate BIM Maturity: Sectoral Analysis in the Dutch Construction Industry. J. Constr. Eng. Manag. 2018, 144, 05018007. [Google Scholar] [CrossRef]
- Brooks, A.; Krebs, L.; Paulsen, B. Beta-Testing Requirements Analysis Tool. SIGSOFT Softw. Eng. Notes 2014, 39, 1–6. [Google Scholar] [CrossRef]
- de Bruin, T.; Freeze, R.; Kulkarni, U.; Rosemann, M. Understanding the Main Phases of Developing a Maturity Assessment Model. 2005. ACIS 2005 Proceedings. 109. Available online: https://aisel.aisnet.org/acis2005/109/ (accessed on 5 October 2025).
- Aras, A.; Büyüközkan, G. Digital Transformation Journey Guidance: A Holistic Digital Maturity Model Based on a Systematic Literature Review. Systems 2023, 11, 213. [Google Scholar] [CrossRef]
- Ustaoğlu, N. A Maturity Model for Digital Transformation, 2019. Available online: https://files.core.ac.uk/download/pdf/328813197.pdf (accessed on 10 October 2025).
- Gökalp, E.; Martinez, V. Digital transformation maturity assessment: Development of the digital transformation capability maturity model. Int. J. Prod. Res. 2022, 60, 6282–6302. [Google Scholar] [CrossRef]
- Voss, M.; Jaspert, D.; Ahlfeld, C.; Sucke, L. Developing a Digital Maturity Model for the Sales Processes of Industrial Projects. J. Pers. Sell. Sales Manag. 2024, 44, 7–28. [Google Scholar] [CrossRef]
- Babkin, A.V.; Shkarupeta, E.V.; Gileva, T.A.; Polozhentseva, Y.S.; Chen, L. Methodology for Assessing Digital Maturity Gaps in Industrial Enterprises. Mod. Innov. Res. 2022, 13, 443–458. [Google Scholar] [CrossRef]
- Action point Digital Maturity Score–What It Is and Why It Matters. Available online: https://action-point.com/digital-maturity-score-what-it-is-and-why-it-matters/ (accessed on 3 May 2025).
- Pennsylvania State University. Planning Guide for Facility Owners; Pennsylvania State University: University Park, PA, USA, 2020; Available online: https://bim.psu.edu/owners_guide/ (accessed on 10 June 2025).
- BIMe 301in BIM Maturity Matrix|BIMe Initiative 2010. Available online: https://bimexcellence.org/ (accessed on 14 July 2025).
- Kassem, M.; Li, J.; Kumar, B.; Malleson, A.; Gibbs, D.J.; Kelly, G.; Watson, R. Building Information Modelling: Evaluating Tools for Maturity and Benefits Measurement; Centre for Digital Built Britain: London, UK, 2020; Available online: https://www.cdbb.cam.ac.uk/files/bim_evaluating_tools_for_maturity_and_benefits_measurement_report.pdf (accessed on 30 September 2024).
- NBIMS-US Version 3.4.2: COBie Annex B-Capability Maturity Model. National Institute of Building Sciences (NIBS), Na-tional BIM Standard–United States. Available online: https://nibs.org/wp-content/uploads/2025/04/NBIMS-US_V3_4.2_COBie_Annex_B.pdf (accessed on 13 May 2025).
Disclaimer/Publisher’s Note: The statements, opinions and data contained in all publications are solely those of the individual author(s) and contributor(s) and not of MDPI and/or the editor(s). MDPI and/or the editor(s) disclaim responsibility for any injury to people or property resulting from any ideas, methods, instructions or products referred to in the content. |
© 2026 by the authors. Licensee MDPI, Basel, Switzerland. This article is an open access article distributed under the terms and conditions of the Creative Commons Attribution (CC BY) license.