Abstract
Understanding the causal relationships between safety factors is essential for successful intervention in industries with intrinsically high-risk environments such as the construction industry. Therefore, the aim of this study is to employ the Interpretive Structural Modeling (ISM) and Decision-Making Trial and Evaluation Laboratory (DEMATEL) techniques to analyze and map the interdependencies among various safety-related elements affecting construction safety. According to the results, resource allocation was shown to be the highest-level, most independent element in the analysis, highlighting its function as the primary facilitator of safety initiatives. This strategic commitment directly drives Management Commitment and Competence, which form the core organizational support structure. Mid-level elements that translate management intent into site-level practice include workers’ training, safety motivation, and communication structure. The frequency of safety observations, workers’ involvement in safety decisions, and subcontractor and procurement management—the immediate procedural controls—are then used to assess operational efficacy. Crucially, the most dependent factor was found to be Workers’ Compliance, indicating that frontline safety behavior is the result of efficient management at all higher levels. Therefore, in order to improve overall safety performance in construction, this research emphasizes the importance of improving resource provision and leadership commitment. The outputs of the current study provide an organized, evidence-based roadmap for selecting interventions.
1. Introduction
The construction industry serves as a foundational pillar of the local and global economy, responsible for developing the critical infrastructure and built environments that underpin modern society. Despite its indispensable role, the sector consistently ranks among the most hazardous worldwide [1]. Construction environments are inherently dynamic and complex, characterized by transient workspaces, the use of heavy machinery, and exposure to significant risk factors, including work at height, dropped objects, and complex lifting operations. The imperative to improve Occupational Health and Safety (OHS) in this sector is therefore threefold: it is an ethical obligation to safeguard human life, a legal necessity to ensure compliance with governmental regulations, and an economic mandate. High incident rates translate directly into catastrophic business impacts, including soaring insurance and litigation costs, diminished workforce morale and productivity, project delays, and severe reputational damage [2,3]. It is critical to create and implement comprehensive, proactive strategies for upgrading safety performance above mere compliance in order to ensure the construction industry’s long-term sustainability and societal value.
Occupational safety and health is affected by a complex interplay of numerous factors that can be classified as direct workplace risks, organizational/human factors, and external socioeconomic effects [4,5]. Direct factors include environmental hazards (noise, temperature), chemical hazards (fumes, dust), biological hazards (microorganisms), and ergonomic hazards (manual material handling). Beyond the direct factors, organizational and human factors have a key influence, such as, the degree of management commitment, the strength of the company’s safety culture, the quality of training and education provided, and individual worker behavior. Finally, external factors such as government regulations and enforcement, overall economic situation, and technological shifts all have a significant impact on the resources allocated to OSH and the standards maintained in the workplace, making worker protection a continuous challenge. The enhanced focus on organizational and individual factors is crucial, because these elements represent the root causes of the majority of workplace incidents [6,7]. These incidents are typically not random but are symptoms of systemic failures, such as high production pressure, inadequate training, poor design, and weak safety culture. Furthermore, the organizational and individual factors determine the success of all other safety measures; for instance, a lack of management commitment will lead to non-compliance and misuse of safety equipment, rendering even the best engineering controls unreliable. Therefore, there is a need to study the complex relationship between these factors and the safety level.
Several studies investigated the factors affecting safety in the construction sector using different tools. For instance, a combination of multi-criteria decision making (MCDM) tools [8,9,10] statistical models [11,12,13], machine learning techniques [14], and structural equation modeling [15,16]. However, according to the literature, none of the previous research determined the hierarchal structure of influence of the driving factors and the dependent factors that affect the safety levels in the construction sector. Therefore, to study the hierarchy of these factors, interpretive structural modeling (ISM) integrated with Decision-Making Trial and Evaluation Laboratory (DEMATEL) technique can be used. Interpretive Structural Modeling (ISM) is a highly effective tool for studying the factors affecting safety, particularly in complex domains like the construction sector, because it provides a systemic, hierarchical structure rather than just a simple list of factors. The primary strength of ISM is its ability to model complexity and interdependence (e.g., whether Factor A drives Factor B), thereby clarifying how a change in one factor propagates throughout the entire safety system. Furthermore, ISM is crucial for establishing a hierarchy of influence, as it distinguishes between the high-leverage driving factors (the root causes) and the dependent factors (the outcomes), which is vital for efficient strategic planning. Finally, Because ISM can efficiently manage qualitative and expert data, it is well-suited for safety research. By utilizing the combined expertise of experts, it can produce a rational, actionable, and theoretically grounded model that directs the development of safety policies as well as actions. Moreover, the DEMATEL technique was applied for several reasons. First, to verify the relationship obtained from the ISM tool. The DEMATEL analysis classifies factors into either causes or effects. Second, to measure the influence of each factor quantitative. Therefore, the objectives of the current study were:
- To determine and model the contextual interrelationships between the human and organizational elements that influence safety levels in the construction industry.
- To create a hierarchical structure by classifying the factors into different levels using the ISM technique.
- To identify the most important, high-leverage driving factors that need to be addressed in order to effectively improve systemic safety.
- To quantify the influence of the casual factors affecting safety levels using the DEMATEL analysis.
This research contributes to the field of OSH by going beyond simple factor identification to develop a hierarchical, practical framework for construction safety management. Furthermore, it enables OSH specialists to strategically devote resources to the most crucial root drivers, boosting the efficiency and effectiveness of building safety interventions.
Background
As mentioned earlier, the safety level in the construction sector is affected by multiple factors. For instance, management commitment and safety rules have constantly been regarded as the most influential factors for site safety. For instance, management commitment has been consistently acknowledged as a critical driver of safety levels. According to research, when management prioritizes safety, establishes clear goals, and actively supports safety programs, workers’ safety attitudes, compliance, and overall safety outcomes increase significantly [17,18,19].
Most studies show that adequate safety training decreases accidents, injuries, and fatalities in high-risk industries, such as construction, mining, and manufacturing [20]. Investing in safety training decreases safety dangers, worker injuries, and increases the likelihood of being chosen by procurement professionals [21]. For example, a 10% increase in safety training hours per capita led to a 6–10% decrease in safety hazards, and mandatory training requirements reduced injury rates by up to 19% [22].
Active worker participation in safety decision-making leads to a stronger safety levels, increased compliance, and lower accident rates. Employee participation in safety policies, procedures, and conversations promotes a sense of accountability, ownership, and teamwork, all of which directly lower workplace hazards and accidents [23]. Furthermore, organizational support and leadership enhance the advantages of employee involvement, particularly when paired with a culture of safety and open communication [24].
Increased safety incentive results in improved safety involvement, compliance, and fewer infractions or accidents. Workers who are driven to put safety first are more likely to adhere to safety protocols, take part in safety-related activities, and refrain from dangerous behaviors, all of which improve safety results [25,26]. The relationship between safety management and safety performance is frequently mediated by safety motivation. For example, transformational leadership and a positive safety level increase safety motivation, which in turn enhances safety behaviors and reduces incidents [27].
By enabling prompt hazard detection and proactive responses, safety monitoring is essential to preserving and raising safety standards across a range of sectors. In organizational settings, safety monitoring serves as a leading indicator that reflects the dynamic safety potential of the system, helping to motivate safety-related activities and improve overall safety performance [28].
Management and supervisor safety competence directly improves employee safety behaviors and reduces accidents. High proficiency in safety management is essential for preventing accidents in a variety of industries and enhances the connection between safe employee behavior and safety culture [29,30]. Competent managers build a good safety climate by emphasizing safety, communicating effectively, and taking timely remedial steps. These skills are consistently identified as the one of most influential factors in shaping organizational safety climates and outcomes [31]. Positive leadership and safety participation explained 22.8% and 33.6% of safety compliance behavior, respectively [32].
Higher worker competence leads to better safety performance and in turn fewer accidents. Studies in construction and industrial settings reveal that workers with more safety knowledge, abilities, and attitudes are more likely to comply with safety protocols and participate in safety activities, which directly reduces risky behaviors and occurrences [33,34].
Several studies revealed that the presence and quality of safety policies are highly related to greater safety performance and fewer workplace incidents. Corporations with comprehensive safety policies have much lower injury rates and better safety results than those without such policies [35]. Safety policies provide clear expectations, give guidance for safe behavior, and establish accountability, all of which are crucial for establishing a safe workplace.
Multiple studies showed that clear, open, and multi-directional communication structures—encompassing both formal (e.g., safety briefings, meetings) and informal (e.g., peer conversations) channels—are crucial for increasing safety in high-risk contexts. Effective communication ensures that safety information, expectations, and concerns are shared promptly, enabling collective awareness and rapid response to hazards [36]. Both top-down (management to workers) and bottom-up (workers to management) communication are necessary: top-down communication clarifies roles and procedures, while bottom-up channels empower employees to report hazards and suggest improvements [37].
Several approaches have been used to study the relationship between safety factors in different sectors. Table 1 summarizes these approaches in the OSH field. However, none of these approaches determined the hierarchy of the safety factors that contribute to the overall level of safety, especially in the construction sector.

Table 1.
Summary of different approaches used in modeling safety factors.
2. Methodology
2.1. Key Factors Affecting Safety Levels in the Construction Sector
As mentioned earlier, safety levels in the construction sector are affected by many factors. Table 2 shows the factors included in the current study. The 12 critical factors identified in this study were derived from the Nordic Occupational Safety Climate Questionnaire-50 (NOSACQ-50), a validated instrument widely recognized for measuring the safety climate across various industrial sectors, including construction [47].
Table 2.
Factors affecting the level of safety in the construction sector.
2.2. Experts Selections
The methodology for data collection in ISM analysis uses a systematic way to obtain expert assessments on the relationship between factors. In the current study, a panel of 19 experts, each with adequate levels of expertise in OSH and construction domains, participated in the assessments, as delineated in Table 3 below. Moreover, the specialists were provided with a list that consists of 12 factors that are considered important to safety in the construction industry. Then, the experts received detailed instructions on how to interpret and use the evaluation matrix, to ensure consistency and accuracy in the assessment process. The experts were urged to perform the comparisons based on their professional experience and knowledge in OSH and construction. Each expert performed a pairwise comparison matrix to evaluate how each factor affected the others. Note, employing a purposive sampling strategy, this study deliberately selected experts based on their specialized knowledge and extensive experience within the occupational safety and health (OSH) domain, rather than relying on random selection. Experts were selected based on having sufficient years of hands-on experience in OSH or construction. Moreover, to ensure independence and minimize organizational bias, the panel was recruited from a minimum of five distinct organizations. All expert judgments were collected anonymously.
Table 3.
Profiles of the experts that participated in the research.
2.3. Interpretive Structural Modeling (ISM)
Considering that safety in the construction sector is continuously affected by many factors, the reason for selecting the ISM is that it is a well-established methodology for identifying relationships among specific items. The steps of ISM development is described below:
Step 1: Development of the Structural Self-Interaction Matrix (SSIM): Experts used pairwise comparisons to establish the relationship between every pair of factors (i and j) based on the defined contextual relation. In the case of Conflicting SSIM Entries, the final accepted entry for all SSIM judgments was determined by the majority rule (the option selected by ≥50% of the experts). The relationships are encoded using four symbols:
- V: Factor i affects Factor j.
- A: Factor j affects Factor i.
- X: Factors i and j affect each other.
- O: Factors i and j are unrelated.
Step 2: The SSIM is converted into a binary matrix called the Initial Reachability Matrix (IRM) by replacing the symbols (V, A, X, O) with 1 s or 0 s.
- If the relationship is V, i → j is 1 and j →i is 0.
- If the relationship is A, i → j is 0 and j → i is 1.
- If the relationship is X, i → j is 1 and j → i is 1.
- If the relationship is O, i → j is 0 and j → i is 0.
Step 3: Application of Transitivity and Generation of the Final Reachability Matrix (FRM): The transitivity rule of mathematics is applied to the IRM to determine and incorporate implicit (indirect) relationships. The rule states that if Factor i influences Factor j, and Factor j influences Factor k, then Factor i also implicitly influences Factor k (i.e., i → j and j → k, implies i → k). For example, in the current study Resource Allocation does not directly watch a worker on-site, it influences “Training,” and “Training” influences “Compliance.” This justifies the “indirect link” created by the math. The resulting matrix, which includes both direct and indirect influences, is the Final Reachability Matrix (FRM). The transitivity rule is mathematically represented by the equation for the Final Reachability Matrix, FRM:
where
- M is the Initial Reachability Matrix (the binary form of the SSIM).
- I is the Identity Matrix (a square matrix with ones on the main diagonal and zeros elsewhere)
- + represents the Boolean addition (OR operation: 1 + 1 = 1, 1 + 0 = 1, 0 + 0 = 0).
- n is the power to which the matrix must be raised until no further changes occur (i.e., until
Step 4: Internal consistency is one of the most often used methods to measure the reliability of a questionnaire. One of the techniques used to assess internal consistency is the item–total correlation method, which is defined as the correlation between an individual item and the total score without that particular item. The corrected item–total correlation test was performed to check if any item in the set of the questionnaire is inconsistent with the averaged behavior of the others. Formula (10) was used to find the corrected item–total correlation [48].
where
- : The responses of expert a.
- : The sum of the experts’ responses to question i.
Step 5: Partitioning of the Final Reachability Matrix into Hierarchical Levels: The FRM is partitioned iteratively to assign a hierarchical level to each factor. For each factor, three sets are identified:
- Reachability Set (R(i)): Factors influenced by i.
- Antecedent Set (A(i)): Factors that influence i.
- Intersection Set (I(i)): The intersection of R(i) and A(i). Factors for which R(i) = I(i) are positioned at the topmost level of the hierarchy (the most dependent factors). These factors are then removed, and the process is repeated until levels have been assigned to all factors.
Step 6: Construction of the Diagraph and Final ISM Model: A directed graph (diagraph) was constructed based on the hierarchical levels and the relationships identified in the FRM. All redundant or transitive links were removed from the diagraph to create a simplified, and easily interpretable model of the system’s structure.
2.4. MICMAC Analysis
The MICMAC analysis, which is an extension of the ISM process, is applied to the Final Reachability Matrix (FRM) to categorize the system factors based on their relative Driving Power and Dependence Power. The steps involved in the MICMAC analysis are as follows:
Step 1: Calculation of Driving and Dependence Power: The powers are derived directly from the FRM:
- Driving Power (Influence): Calculated as the sum of all ‘1 s’ in the row corresponding to the factor, which represents the total number of other factors it affects.
- Dependence Power: Calculated as the sum of all ‘1 s’ in the column corresponding to the factor, which represents the total number of other factors that affected it.
Step 2: Driving-Dependence Power Plot is constructed. Dependence power (D) is plotted on the x-axis, and Driving power (R) is plotted on the y-axis. Each factor is mapped as a point in this plane. The chart’s x-axis (Driving Power) ranges from the minimum D to the maximum D, and the y-axis (Dependence Power) ranges from the minimum R to the maximum R observed among the 12 factors. The standard practice in MICMAC analysis is to set the cut-off boundaries (the intersection point of the four quadrants) at the arithmetic mean (average) of the Driving Power sums and the arithmetic mean of the Dependence Power sums.
Step3: The plot is divided into four quartiles, allowing for the strategic classification of all factors:
Q1. Autonomous Factors: (Low Driving Power, Low Dependence Power) These factors have weak linkages to the other factors. They are usually stable and can be controlled independently.
Q2. Dependent Factors: (Low Driving Power, High Dependence Power) These factors are sensitive to change because they are heavily influenced by the primary drivers and connection factors while having little influence on the system itself. They represent the system’s outcomes.
Q3. Linkage Factors: (High Driving Power, High Dependence Power) These factors are extremely unstable and active. Any change in these parameters has a significant impact on others. Due to the complicated feedback loops, strategic intervention in this case necessitates careful preparation.
Q4. Independent/Driver Factors: (High Driving Power, Low Dependence Power) These factors form the system’s foundation. They are the most powerful influencers or root drivers, requiring little support from others. These factors represent key levers for systemic transformation.
2.5. Decision Making Trial and Evaluation Laboratory (DEMATEL) Analysis
The DEMATEL analysis is performed after an ISM analysis to complement the structure with quantitative relationship strength, thereby maximizing the advantages of both methods. The DEMATEL method is a structured approach used to analyze complex systems and visualize causal relationships among factors. The process involves several mathematical steps as follows:
Step 1: Establish the Direct Relation Matrix (A) using a numerical scale to perform the pairwise comparisons between the factors. Table 4 illustrates the evaluation criteria.
Table 4.
Evaluation criteria used in the DEMATEL pairwise comparisons.
The responses for all experts are aggregated by taking the average to form the initial Direct Relation Matrix, A = [a{j] where aij is the averaged degree of direct influence of Factor i on Factor j.
Step 2: The Direct Relation Matrix A is normalized to obtain the Normalized Direct Relation Matrix, D. The normalization is typically performed by dividing A by the largest sum of a row in matrix A.
Step 3: Calculate the Total Influence Matrix (T) using the formula below:
where I is the identity matrix.
Step 4: For each Factor i, two key metrics are calculated from the Total Influence Matrix T to Determine Influence Degrees:
- Driving Power (Di): The sum of the rows in matrix T. This represents the total influence Factor i exerts on all other factors.
- Receiving Power (Ri): The sum of the columns in matrix T. This represents the total influence Factor i receives from all other factors.
Step 5. The calculated Di and Ri are combined to determine the role of each factor in the system:
- Prominence: The sum of driving and receiving power (Di + Ri). This value shows the overall importance of the factor in the system. Factors with a high prominence are crucial, highly interconnected factors.
- Relation: The difference between driving and receiving power (Di − Ri). This value determines the factor’s causal role. If (Di − Ri) > 0, the factor belongs to the Cause Group (net driver). If (Di − Ri) < 0, the factor belongs to the Effect Group (net dependent).
Step 6: Generate the Cause-and-Effect Relationship Diagram, in which the x-axis represents prominence (Di + Ri), and the y-axis represents relation (Di − Ri).
3. Results
3.1. Interpretive Structural Modeling (ISM)
Table 5 illustrates the pairwise relationship prevailing structural self-interaction matrix (SSIM) which shows the relation between the factors according to the experts’ evaluations. Moreover, Table 6 represents the initial reachability matrix that was obtained after converting the SSIM to 0’s or 1’s based on their relationship types. Additionally, Table 7 shows the final reachability matrix after including the transitivity effect between the factors.
Table 5.
Structural self-interaction matrix (SSIM). The symbols ↓ and → indicate the direction of the relationship, where the row factor i influences the column factor j.
Table 6.
Initial reachability matrix.
Table 7.
Final reachability matrix.
For evaluating the internal consistency of the questionnaire, a corrected item–total correlation was used, with the criterion of 0.30 considered an acceptable threshold [48].
The computed values of the corrected item–total correlation between the experts and the behaviors of others are shown in Table 8. Since all these values are significantly above the 0.30 criterion, this indicates a suitable consistency level.
Table 8.
Corrected item—total correlation between experts’ responses.
Level partitioning are shown in Table 9, Table 10, Table 11 and Table 12, depicting iterations 1–4, respectively. Moreover, Figure 1 shows the ISM diagraph that summarizes the hierarchy and the relationship between the factors affecting safety in the construction sector.
Table 9.
Iteration 1 of level partitioning.
Table 10.
Iteration 2.
Table 11.
Iteration 3.
Table 12.
Iteration 4.
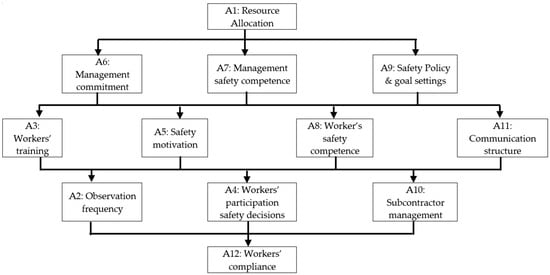
Figure 1.
The ISM diagraph.
In order to conduct the MICMAC analysis, the values of the dependence and the driving power of the factors were determined as shown in Table 13. These values are then used to plot the MICMAC chart, which classifies the factors as shown in Figure 2. It is worth noting that none of the selected factors fell under the “autonomous” quartile. The absence of any factor in Quadrant 1 (Autonomous Factors—low driving power, low dependence power) is not an artifact of arbitrary cut-off parameters, but rather a logical consequence of the selection and nature of the factors chosen for the analysis. Autonomous factors are typically disconnected from the rest of the system, and they have few links to other factors and are generally not influenced by them. The twelve factors selected are all fundamental Human and Organizational Performance (HOP) elements in the construction domain. By definition, these factors were specifically chosen because they are believed to be highly interconnected within the organizational safety system. Therefore, the finding that no factor falls into Q1 confirms that, according to the expert panel, all twelve factors play an active, integral, and necessary role in the influence structure. There are no “isolated” factors that can be ignored. This result strengthens the conclusion that safety in construction is a tightly coupled system.
Table 13.
Dependence and driving powers of factors.
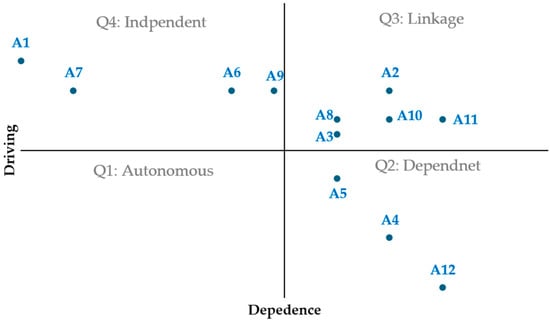
Figure 2.
Driving power and dependence diagram.
3.2. DEMATEL
The goal of using the DEMATEL analysis in the current study is to verify the results obtained from the ISM model, and to measure the effect of casual Factors. According to the calculations, A1: Resource Allocation, A6: Management Commitment and Leadership, A7: Management Safety Competence, and A9: Safety Policy and Goal Setting were identified as the most influential causal factors. On the other hand, Factor A12: Worker Safety Behavior/Compliance was the factor that affected by the main causes. These results are consistent with the results obtained from the ISM analysis. Table 14 shows the computations of prominence, relation, and factor type. Similarly, Figure 3 depicts the mapping of cause and effects relationships.
Table 14.
Calculation of prominence, relation, and factor type.
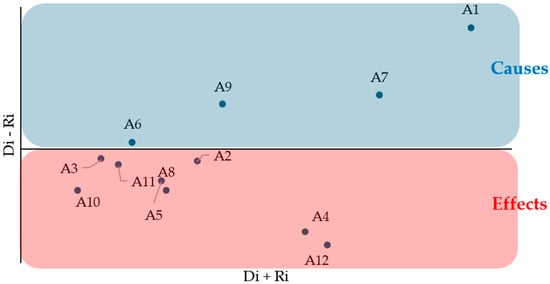
Figure 3.
Mapping causes and effects of factors affecting safety levels in the construction industry.
3.3. Sensitivity Analysis
Sensitivity analysis in ISM and MICMAC is crucial primarily to validate the model’s robustness and structural stability, as the entire framework is built upon subjective expert judgments in the SSIM. By intentionally altering a few key relationships, analysts can determine if the resulting hierarchical structure (ISM) or factor categorization (MICMAC) is stable; a high degree of sensitivity indicates that the initial consensus requires further investigation to confirm the critical relationships. This process effectively identifies critical leverage points by highlighting factors whose classification (e.g., driver vs. outcome) is vulnerable to input variations, ultimately allowing practitioners to refine strategic intervention plans and increase the credibility and scientific rigor of the final model. In the current study, sensitivity analysis was performed by randomly excluding the assessments of two and three experts, respectively, to test the ISM model’s robustness and stability against variations in expert judgment. The sensitivity analysis reveals one shift in the system’s structure. Only one factor out of the twelve has been changed. For instance, Factor A8 has moved down from Level 3 to Level 2 and changed from a volatile Linkage Factor to a simple Dependent Factor, signifying that it could be a result driven by higher-level factors. Some experts might view Workers’ Safety Competence is positioned as a Dependent Factor because it functions as an outcome or resulting state, driven by higher-level organizational inputs. It could be driven by Workers’ Training (which imparts the necessary knowledge and skills), Safety Motivation (which determines the willingness and consistency of application), and the Communication Structure. The finding that only one out of twelve factors experienced minor, single-level positional change in the sensitivity analysis is a strong indicator of the high robustness and structural stability of the ISM model. This minimal movement confirms that the strategic hierarchy—particularly the identification of the top-level drivers and bottom-level outcomes—is reliable and not highly sensitive to potential subjective variations in the expert judgments (SSIM). Consequently, the core strategic recommendations derived from the original ISM structure are validated, demonstrating that the model accurately captures the fundamental relationships in the system. Table 15 summarizes the sensitivity analysis of the ISM and MICMAC models.
Table 15.
Summary of sensitivity analysis.
4. Discussion
4.1. The Integration of ISM and DEMATEL Models
The main objective of the current study is to determine the relations, hierarchy, and the strength of influence of the factors affecting safety level in the construction sector. Therefore, the ISM analysis was used to determine the relationship between the factors and the DEMATEL analysis was applied to quantify the influence of the casual factors affecting safety levels. The ISM analysis reveals a clear, tiered hierarchy of factors affecting safety in the construction sector. At the foundational and strategic level (Levels 4 and 5) they are the Independent Drivers, which possess the highest driving power and lowest dependence. The absolute most critical factor is A1: Resource Allocation (Level 5), which acts as the root cause influencing the success of nearly every other safety measure. In the field of OSH, resource allocation is the fundamental strategic decision-making process by which an organization dedicates its finite assets toward achieving its health and safety goals [49]. Without adequate resources (funding, personnel, equipment), the quality of policies, management commitment, training programs, and safety observations will all be compromised. Firstly, financial resources (budget) are essential, covering the costs for purchasing high-quality control measures like proper Personal Protective Equipment (PPE) and engineering controls, funding for OSH training, certification programs, and the maintenance of management systems and facilities [50]. This result is in line with previous studies that concluded that recognize that without earmarked funds, safety measures are under-implemented and accident risk rises [51,52]. Secondly, human resources (personnel and expertise) are critical, requiring the allocation of sufficient, qualified safety professionals (such as OSH managers and industrial hygienists) and, crucially, the dedicated, paid time for all employees—from management to frontline workers—to actively participate in safety activities, including training, inspections, and safety committee meetings [53]. A recent study found that recruitment, selection, and training-oriented HR practices significantly improve workers’ knowledge and awareness of OHS programs, leading to safer behavior in manufacturing and other industries [54]. Third, the provision and upkeep of essential safety infrastructure, such as emergency communication systems, first-aid stations, and efficient information systems for documenting and evaluating incident data to support ongoing improvement, requires the allocation of physical and technical resources. Altogether, the allocation of these three resource types determines the true strength and effectiveness of an organization’s OSH management system. Moreover, A1: resource allocation sits at the absolute top of the hierarchy (Level 5). Therefore, improving resource allocation will immediately create a chain reaction, strengthening the other top-tier drivers. The DEMATEL results provide a clear picture of how different organizational factors interact to shape the overall safety level. The prominence values indicate that some factors occupy a more central position in the safety system, whereas the relation values distinguish between those that act primarily as drivers (“cause” factors) and those that function mainly as outcomes (“effect” factors). Resource Allocation (A1) emerges as the most central factor in the network, with the highest prominence (0.850) and a relation value close to zero, and it is classified as a cause factor. This suggests that decisions regarding financial, human, and material resources devoted to safety are foundational and exert influence across the entire system, while being only minimally shaped by other factors. In other words, resourcing appears to be an upstream strategic decision rather than a reactive response to other safety dimensions. This finding supports the view that sustained investment in safety is a precondition for building effective training, observation, and communication practices, rather than a consequence of them.
Key management factors are as follows: A6: Management Leadership and Commitment, A7: Management Safety Proficiency, and A9: Safety Policy and Goal Setting (all level 4). Management must give these fundamental components top priority and make significant investments in order to bring about systemic transformation. Factor A6: Management commitment is crucial because it establishes the organization’s safety culture and values and guarantees that management clearly puts safety ahead of budget and schedule. For instance, in an Asian construction company, management commitment was one of only two factors significantly predicting workers’ safe behavior [55]. Additionally, in Chinese mining enterprises, safety management commitment increased workers’ safety compliance and participation, partly through better training and safety policies [56]. The technical capacity for effective implementation is provided by Factor A7: Management Safety Competence, which enables managers to make well-informed decisions, accurately identify hazards, choose suitable controls, and carry out the required supervision and quality training that directly affect A12: Worker Safety Behavior/Compliance. For example, construction research from Malaysia identified safety management competence (planning, budgeting, training, monitoring) as the top core competency of safety managers, directly tied to lower accident rates on sites [57]. Lastly, Factor A9: Safety Policy acts as the official roadmap and guidance, converting the dedication and proficiency into precise, documented guidelines, protocols, and quantifiable goals that set clear expectations and form the basis for all A3: Workers’ Training and compliance initiatives throughout the site [58]. In China, stricter, broader, and more technically detailed safety policies show a strong long-term negative correlation with work-related mortality; increasing stringent policies significantly improved production safety [59]. Without this top-level direction, capability, and commitment, all operational safety initiatives will lack the support, clarity, and resources needed to be sustained which affect the overall safety level [60]. These results are in line with the DEMATEL results, which stated that management-related attributes also figure prominently among the cause factors. Management Safety Competence (A7) shows a relatively high prominence (0.556), indicating that competent managers who understand safety principles and regulatory requirements influence multiple downstream elements. Similarly, Safety Policy and Goal Setting (A9), with a prominence of 0.427, is another influential driver, implying that clearly articulated safety objectives and formalized policies shape how safety is operationalized in daily activities. Management Commitment and Leadership (A6), though having moderate prominence (0.240), is also categorized as a cause factor; this suggests that visible leadership support acts as a catalyst that channels resources, reinforces policies, and legitimizes safety initiatives. Together, these results indicate that safety performance is strongly conditioned by the way top and middle management frame, resource, and operationalize safety.
Immediately below these are the Linkage Factors (Level 3), characterized by high driving and high dependence. These include A3: Workers’ Training, A8: Workers’ Safety Competence, and the essential A11: Communication Structure. These elements are both strong drivers of the factors at the operational level and results of the strategic level (e.g., training depends on resource allocation). A5: Safety Motivation is another factor at this intermediate level. Although it is very dependent, it is essential for creating an engaged safety culture. The function of element A3: Workers’ Training in creating A8: competence is a crucial Linkage Factor (Level 3) that converts management’s strategic intent into concrete operational capability. A recent study found that construction workers who received safety and health training showed higher safety knowledge, safer behavior, and greater safety awareness than untrained workers [61]. Workers’ safety competence is a direct and essential factor in improving workers’ compliance [62]. Training enhances the knowledge required to understand specific construction hazards, legal compliance, and the consequences of unsafe acts. Simultaneously, it develops the necessary practical skills, providing instruction and practice in safe operating procedures (SOPs), correct equipment use (including PPE), and emergency response. Thus, training is the essential vehicle that converts management’s commitment and allocated resources into an empowered and competent workforce, directly enabling the desired outcome of A12: Worker Safety Behavior/Compliance. Factor A11: Communication Structure is considered a Linkage Factor in the construction site safety model because its defining characteristic is having both high driving power and high dependence, making it a critical intermediary between strategy and execution. Several studies found that clear top-down communication of rules, hazards, and expectations improves workers’ understanding of procedures, roles, and safe behavior, boosting performance and motivation [63,64]. Additionally, strong bottom-up paths (easy reporting of hazards, near misses, concerns) support awareness, learning from incidents, and a more supportive climate, reducing accidents and disasters. Its high dependence means the quality of communication is highly sensitive to and determined by factors higher up, specifically the formal establishment from A9: Safety Policy and Goal Setting and the time and resources provided by A1: Resource Allocation and A6: Management Commitment and Leadership [65]. Conversely, its high driving power ensures it is a powerful force for change, acting as the essential channel that transmits safety content for A3: Workers’ Training, thereby building A8: Workers’ Safety Competence, and serving as the primary feedback loop that encourages A4: Workers’ Participation in Safety Decisions [66]. Thus, the communication structure links the strategic will of management to the operational compliance and behavior of the workers, meaning any issue with communication will immediately disrupt the flow of safety information throughout the entire system.
The factors at Level 2 of the safety hierarchy—Safety Observation Frequency, Workers’ Participation in Safety Decisions, and Subcontractor and Procurement Management—serve as the critical operational bridge between the high-level management commitment and resources (Levels 3, 4, 5) and the lowest level of on-site behavior, Workers’ Compliance (Level 1). Regular observation of site operations offers data and quick feedback for ongoing development [67]. A case study showed safety performance increasing from 86% to 92.9% over 6 weeks after observation-based feedback, goal-setting, and recognition [68]. By actively including the workers in danger identification and process creation, Workers’ Participation in Safety Decisions promotes ownership and increases Safety Motivation (Level 3) [69]. For example, in Malaysian institutions, employee involvement in formulating safety policies, procedures, and decisions was identified as the most important factor for cultivating a strong safety culture and moving toward zero-accident workplaces [70]. Last but not least, Subcontractor and Procurement Management extends the principal contractor’s control over the entire project ecosystem by ensuring that other parties and acquired materials follow project safety standards. Because subcontractors are so prevalent and have such a big impact on construction sites, it is crucial to manage them well. Subcontractors, particularly smaller businesses, sometimes have varied degrees of safety resources and compliance, which, if improperly managed, can result in inconsistent safety procedures and increased accident rates [71,72]. Subcontractors can make up to 90% of the construction workforce and are often small firms with limited safety staff and poorer working conditions, which increases vulnerability to accidents [73]. Moreover, accident rates for subcontractor employees are frequently higher than for principal contractor staff, linked to economic pressure, long hours, weaker training, and fragmented communication. Together, these Level 2 factors represent the practical, action-oriented mechanisms that translate strategic safety goals into tangible, daily safety performance.
Finally, Factor A12: Worker Safety Behavior/Compliance is categorized in the Dependent Quartile (Level 1) in the ISM analysis. This factor exhibits the highest dependence score and the lowest driving power score. This categorization indicates that rather than being the main forces behind change, compliance and behavior are essentially the results of the whole safety management system, for instance, a worker’s ability to comply is dictated by whether A1: Resource Allocation provides safe equipment and time, whether A6: Management Commitment enforces rules consistently, and whether A3: Workers’ Training has built the necessary A8: Workers’ Safety Competence. Multiple studies show that what workers do (compliance and participation) largely reflects the broader safety management system (SMS) and leadership. Across industries, management commitment, training, rules/procedures, communication, promotion policies, and worker involvement influence safety compliance, often via mediators like safety participation, safety knowledge, or motivation [74]. The strategic conclusion is obvious: businesses should prioritize addressing the higher-level Independent Drivers and Linkage Factors that regulate and facilitate safe conduct, rather than concentrating on treating the symptoms (worker behavior). In the DEMATEL analysis, Worker Safety Behavior/Compliance (A12) has the lowest prominence (0.009) but the highest relation value (0.675), positioning it as the most downstream element in the network. This implies that worker behavior is largely a product of upstream conditions rather than an autonomous driver of safety outcomes.
4.2. STAMP Analysis of Construction Safety Control Structure
To strengthen the complexity argument and demonstrate how the ISM-identified hierarchical dependencies operate in practice, this section presents a small case-model using the Systems-Theoretic Accident Model and Processes (STAMP) framework [75]. This case-model illustrates how organizational, management, and frontline safety factors interact through control structures, and feedback loops mechanisms. The STAMP framework conceptualizes safety as an emergent property of a complex socio-technical system where safety is maintained through feedback and control. Figure 4 presents the hierarchical control structure for the construction safety system, mapping the ISM-identified factors A1 to A12 into three distinct control levels.
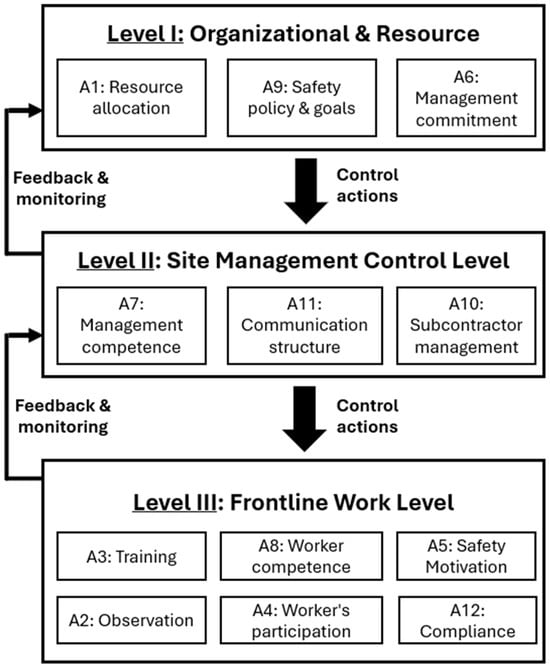
Figure 4.
STAMP Control Structure for Construction Safety: Multi-level hierarchy with control and feedback loops.
The hierarchical levels and control actions:
Level I: Organization and Resource Level: These factors generate control actions that cascade downward, determining how much investment and priority are given to safety initiatives at the site level.
Level II: Site Management Control Level: Site managers translate organizational directives into operational safety management. Site managers receive control actions from Level 1 (e.g., resource availability, policy directives) and issue their own control actions downward regarding task planning, work procedures, and resource deployment. They also receive feedback from the frontline through observations, incident reports, and worker communications.
Level III: Frontline Work Level: At the frontline, workers and their immediate supervisors execute safety practices. Frontline factors are influenced by control actions from Level 2 (training programs, supervision schedules, participation opportunities) and generate feedback upward through observations, near-miss reports, and worker suggestions.
Feedback Loops:
The control structure includes critical feedback paths. First, monitoring feedback from Level 3 to Level 2: Safety observations (A2) and workers’ participation (A4) provide real-time data on work conditions and compliance (A12). Second, escalation feedback from Level 2 to Level 1: Site managers report safety performance, incident trends, and resource constraints through communication structures (A11), informing higher-level decisions on resource allocation (A1) and policy refinement (A9). These feedback loops are essential for adaptive safety management; without them, the system cannot detect and correct deviations from safe performance.
4.3. Research Limitations
It is worth mentioning the research limitations and future research. ISM is a structural modeling technique; it determines “what affects what” but did not investigate the measurable effect that occurs in the overall safety level. The model provides a clear structure but lacks empirical evidence regarding the statistical impact of each factor on overall safety performance. Therefore, future studies could investigate the effect of change on the overall system (e.g., how much a 10% increase in Resource Allocation impacts accident rates). Moreover, in the current study, only internal factors were included. However, future research could incorporate external factors, such as regulatory and legal environment, economic conditions, and technological advancement.
5. Conclusions
The current study produced a rigorous, five-level hierarchical structure that maps the dependency and driving power of safety factors within the construction sector, confirming that effective safety management requires strategic intervention at the highest levels of the organization. The model defines Resource Allocation (Level 5) as the most important independent driver, generating the financial and infrastructural capability that directly enables Management Commitment and Competence (Level 4), the fundamental factors influencing safety culture and leadership. These drivers subsequently translate intent into operational effectiveness through Workers Training, Safety Motivation, and Communication Structure (Level 3), alongside critical procedural controls: Safety Observation Frequency, Workers’ Participation in Safety Decisions, and Subcontractor and Procurement Management (Level 2). Importantly, the analysis places Workers’ Compliance (Level 1) as the most dependent factor, indicating that safety behavior on the job site is an effect rather than a cause of safety outcomes and stating that proactive strengthening of the resource and leadership commitments that come before operational execution is the ultimate control of construction hazards. Additionally, the DEMATEL results suggest that meaningful improvements in safety levels are more likely to be achieved by targeting upstream structural and managerial drivers than by focusing exclusively on downstream behaviors. Enhancing resource allocation for safety (A1), building management safety competence (A7), and strengthening safety policy, goal setting (A9), and leadership commitment (A6) should create favorable conditions that subsequently improve training, communication, motivation, and oversight practices. These changes, in turn, are expected to foster better worker participation, competence, and compliance. From a practical standpoint, the analysis thus argues for a strategic shift from behavior-centric interventions toward system-level managerial and resource reforms as the primary route to sustainable safety enhancement. To summarize, the strategy should be to achieve the appropriate budget and staff allocation for safety, as this single step is the prerequisite for all effective following interventions. If resources are constrained, every lower-level factor—like worker training or providing high-quality PPE—becomes an uphill struggle.
Funding
This research received no external funding.
Data Availability Statement
The original contributions presented in this study are included in the article. Further inquiries can be directed to the corresponding author.
Conflicts of Interest
The author declares no conflicts of interest.
References
- Bilim, A. Demographic Analysis of Occupational Safety in the Construction Sector: Strategies and Insights for Risk Reduction. Buildings 2025, 15, 528. [Google Scholar] [CrossRef]
- Juhari, M.L.; Rasli, F.N.; Rahman, A.H.A.; Yusoff, S.; Khalid, M.S. A Review of Occupational Safety and Health in the Construction Sector: Negative Impacts of Workplace Accidents. Int. J. Acad. Res. Bus. Soc. Sci. 2023, 13, 2682–2691. [Google Scholar] [CrossRef]
- Aziz, N.A.A.; Nordin, R.M.; Ismail, Z.; Yunus, J.; Hashim, N. Occupational Safety and Health (OSH) Concept Towards Project Performance. Built Environ. J. 2019, 16, 55. [Google Scholar] [CrossRef]
- El Kholti, R.; Soltani, S.; Durand, P.; El Kholti, A. P-405 Understanding the Role of Determinants in Improving Occupational Health and Safety. Occup. Med. 2024, 74, 405. [Google Scholar] [CrossRef]
- Milošević, I.; Stojanović, A.; Nikolić, Đ.; Mihajlović, I.; Brkić, A.; Perišić, M.; Spasojević-Brkić, V. Occupational health and safety performance in a changing mining environment: Identification of critical factors. Saf. Sci. 2025, 184, 106745. [Google Scholar] [CrossRef]
- Bouraima, M.B.; Gore, A.; Ayyildiz, E.; Yalcin, S.; Badi, I.; Kiptum, C.K.; Qiu, Y. Assessing of causes of accidents based on a novel integrated interval-valued Fermatean fuzzy methodology: Towards a sustainable construction site. Neural Comput. Appl. 2023, 35, 21725–21750. [Google Scholar] [CrossRef]
- Chan, D.W.M.; Baghbaderani, A.B.; Sarvari, H. An Empirical Study of the Human Error-Related Factors Leading to Site Accidents in the Iranian Urban Construction Industry. Buildings 2022, 12, 1858. [Google Scholar] [CrossRef]
- Gul, M.; Ak, M.F. Assessment of occupational risks from human health and environmental perspectives: A new integrated approach and its application using fuzzy BWM and fuzzy MAIRCA. Stoch. Environ. Res. Risk Assess. 2020, 34, 1231–1262. [Google Scholar] [CrossRef]
- Demir, G.; Bouraima, M.B.; Badi, I.; Stević, Ž.; Das, D.K. Identification of Industrial Occupational Safety Risks and Selection of Optimum Intervention Strategies: Fuzzy MCDM Approach. Mathematics 2025, 13, 301. [Google Scholar] [CrossRef]
- Ak, M.F.; Yucesan, M.; Gul, M. Occupational health, safety and environmental risk assessment in textile production industry through a Bayesian BWM-VIKOR approach. Stoch. Environ. Res. Risk Assess. 2022, 36, 629–642. [Google Scholar] [CrossRef]
- Seo, H.J.; Rhee, S.-Y.; Kim, N.K. A Study on the Factors Affecting Safety Behaviors and Safety Performance in the Manufacturing Sector: Job Demands-Resources Approach. Safety 2025, 11, 29. [Google Scholar] [CrossRef]
- Ghahramani, A.; Ebrahimi, M.; Hajaghazadeh, M. Development and psychometric evaluation of an occupational health and safety performance tool for manufacturing companies. Heliyon 2023, 9, e17343. [Google Scholar] [CrossRef]
- Hoła, B.; Nowobilski, T. Analysis of the Influence of Socio-Economic Factors on Occupational Safety in the Construction Industry. Sustainability 2019, 11, 4469. [Google Scholar] [CrossRef]
- Kumar, L.S.; Burns, G.N. Determinants of safety outcomes in organizations: Exploring O*NET data to predict occupational accident rates. Pers. Psychol. 2024, 77, 555–594. [Google Scholar] [CrossRef]
- Omidi, L.; Zakerian, S.A.; Hadavandi, E.; Saraji, J.N. Boosted neural network modeling of psychological and social factors of work affecting safety performance and job satisfaction in the process industry. BMC Psychol. 2025, 13, 866. [Google Scholar] [CrossRef]
- Abbasianjahromi, H.; Aghakarimi, M. Safety performance prediction and modification strategies for construction projects via machine learning techniques. Eng. Constr. Archit. Manag. 2023, 30, 1146–1164. [Google Scholar] [CrossRef]
- Moda, H.M.; Ofodile, N.; Zailani, B.M.; Abubakar, M.; Ibrahim, Y.M. Management support as a critical success factor (CSF) for changing worker’s safety attitude: A case of the Nigerian construction industry. Int. J. Constr. Manag. 2023, 23, 2551–2557. [Google Scholar] [CrossRef]
- Jameel, M.; Khan, F. Factors Effecting Safety Culture in the Construction Industry. Soc. Sci. Rev. Arch. 2024, 2, 928–939. [Google Scholar] [CrossRef]
- Him, N.F.; Ismail, W.N.T.; Abdullah, T.N.T. Assessment of safety management attitude practices toward the safety culture of the construction sector. Plan. Malays. 2023, 21, 12–23. [Google Scholar] [CrossRef]
- Anireddy, A.R. Construction Safety Management: Analyzing the Effectiveness of Safety Training Programs on Job Sites. Int. J. Sci. Res. Eng. Manag. 2024, 8, 1–7. [Google Scholar] [CrossRef]
- Chen, Y.; Sridhar, S.; Han, K.; Singh, S.; Mittal, V.; Im, T. The Value of Safety Training for Business-to-Business Firms. J. Mark. Res. 2024, 61, 742–759. [Google Scholar] [CrossRef]
- Senouci, A.; Jedinia, A.; Eldin, N. Safety Performance in Industrial Construction: A Case Study. J. Civ. Eng. Constr. 2021, 10, 237–244. [Google Scholar] [CrossRef]
- Wang, J.-M.; Liao, P.-C.; Yu, G.-B. The Mediating Role of Job Competence between Safety Participation and Behavioral Compliance. Int. J. Environ. Res. Public Health 2021, 18, 5783. [Google Scholar] [CrossRef]
- Zhao, L.; Yang, D.; Liu, S.; Nkrumah, E.N.K. The Effect of Safety Leadership on Safety Participation of Employee: A Meta-Analysis. Front. Psychol. 2022, 13, 827694. [Google Scholar] [CrossRef]
- Basahel, A.M. Safety Leadership, Safety Attitudes, Safety Knowledge and Motivation toward Safety-Related Behaviors in Electrical Substation Construction Projects. Int. J. Environ. Res. Public Health 2021, 18, 4196. [Google Scholar] [CrossRef]
- Syed-Yahya, S.N.; Idris, M.A.; Shimazu, A. Support for safety in the fire service: A test of reciprocal causality for safety motivation. Ind. Health 2023, 61, 419–431. [Google Scholar] [CrossRef]
- Peker, M.; Doğru, O.C.; Meşe, G. Role of Supervisor Behavioral Integrity for Safety in the Relationship Between Top-Management Safety Climate, Safety Motivation, and Safety Performance. Saf. Health Work 2022, 13, 192–200. [Google Scholar] [CrossRef] [PubMed]
- Reiman, T.; Pietikäinen, E. Leading indicators of system safety—Monitoring and driving the organizational safety potential. Saf. Sci. 2012, 50, 1993–2000. [Google Scholar] [CrossRef]
- Zhang, S.; Hua, X.; Huang, G.; Shi, X. How Does Leadership in Safety Management Affect Employees’ Safety Performance? A Case Study from Mining Enterprises in China. Int. J. Environ. Res. Public Health 2022, 19, 6187. [Google Scholar] [CrossRef]
- Tappura, S.; Kivistö-Rahnasto, J. Assessing and developing safety management competences. Int. J. Occup. Environ. Saf. 2018, 2, 9–17. [Google Scholar] [CrossRef]
- Bafail, O.; Alamoudi, M. Investigation and Analysis of Interrelationships Among Safety Managerial Aspects Affecting Safety Climate Using Decision-Making Trial and Evaluation Laboratory Approach. Sustainability 2024, 16, 10924. [Google Scholar] [CrossRef]
- Tang, Z. Safety Culture in The Construction Industry: A Proposed Enhanced Safety Management Program. J. Bus. Manag. Stud. 2025, 7, 98–125. [Google Scholar] [CrossRef]
- Wijayanto, P. The Effect of OHS Procedures and Worker Competence on Occupational Safety and Health with Worker Communication as a Mediator at Public Company (PERUM) Jasa Tirta II. Return Study Manag. Econ. Bussines 2025, 4, 269–283. [Google Scholar] [CrossRef]
- Pourmazaherian, M.; Musonda, I. Worker competence and safety performance the mediation role of safety orientation in construction industry. Cogent Public Health 2022, 9, 2145702. [Google Scholar] [CrossRef]
- Bautista-Bernal, I.; Quintana-García, C.; Marchante-Lara, M. Safety culture, safety performance and financial performance. A longitudinal study. Saf. Sci. 2024, 172, 106409. [Google Scholar] [CrossRef]
- Zara, J.; Nordin, S.M.; Isha, A.S.N. Influence of communication determinants on safety commitment in a high-risk workplace: A systematic literature review of four communication dimensions. Front. Public Health 2023, 11, 1225995. [Google Scholar] [CrossRef]
- Andelia, N.; Silaban, G.; Syahri, I.M. The Impact of Leadership and Communication on Safety Culture Maturity Level. Contag. Sci. Period. J. Public Health Coast. Health 2023, 4, 1056. [Google Scholar] [CrossRef]
- Pernetti, M.; Antoniazzi, A.; Ketabdari, M.; Crispino, M.; Toraldo, E. Determining the Safety Level of State Roads: An Italian Case Study. Appl. Sci. 2024, 14, 6663. [Google Scholar] [CrossRef]
- Oah, S.; Na, R.; Moon, K. The Influence of Safety Climate, Safety Leadership, Workload, and Accident Experiences on Risk Perception: A Study of Korean Manufacturing Workers. Saf. Health Work 2018, 9, 427–433. [Google Scholar] [CrossRef]
- Bae, J.-H.; Park, J.-W. Research into Individual Factors Affecting Safety within Airport Subsidiaries. Sustainability 2021, 13, 5219. [Google Scholar] [CrossRef]
- Stefanović, V.; Milijić, N.; Urošević, S.; Mladenović-Ranisavljević, I.; Završnik, B. New approach of modeling influential factors of safety climate in industrial companies with a predominantly female labor force. Serbian J. Manag. 2025, 20, 137–156. [Google Scholar] [CrossRef]
- Abikenova, S.; Aitimova, S.; Daumova, G.; Koval, A.; Sarybayeva, I. Statistical Monitoring of OSH: Analysis of Deviations and Recommendations for Optimization. Int. J. Saf. Secur. Eng. 2023, 13, 1049–1059. [Google Scholar] [CrossRef]
- Prihatiningsih, S.; Martiana, T.; Widajati, N.; Fajar, J.K. Determinants of safety performance in healthcare settings: A meta-analysis. Narra J. 2025, 5, e1654. [Google Scholar] [CrossRef]
- Eskandari, D.; Gharabagh, M.J.; Barkhordari, A.; Gharari, N.; Panahi, D.; Gholami, A.; Teimori-Boghsani, G. Development of a scale for assessing the organization’s safety performance based fuzzy ANP. J. Loss Prev. Process Ind. 2021, 69, 104342. [Google Scholar] [CrossRef]
- Soltanzadeh, A.; Zarei, E.; Mahdinia, M.; Sadeghi-Yarandi, M. An integrated approach to assess safety and security risks in chemical process industries. J. Loss Prev. Process Ind. 2024, 90, 105344. [Google Scholar] [CrossRef]
- Bafail, O.; Alamoudi, M. Prioritizing Worker-Related Factors of Safety Climate Using Fuzzy DEMATEL Analysis. Systems 2025, 13, 383. [Google Scholar] [CrossRef]
- Kines, P.; Lappalainen, J.; Mikkelsen, K.L.; Olsen, E.; Pousette, A.; Tharaldsen, J.; Tómasson, K.; Törner, M. Nordic Safety Climate Questionnaire (NOSACQ-50): A new tool for diagnosing occupational safety climate. Int. J. Ind. Ergon. 2011, 41, 634–646. [Google Scholar] [CrossRef]
- Javali, S.B.; Gudaganavar, N.V.; Raj, S.M. Effect of Varying Sample Size in Estimation of Coefficients of Internal Consistency Effect of Varying Sample Size in Estimation of Coefficients of Internal Consistency. WEbmed Cent. Biostat. 2011, 2, 1–8. [Google Scholar]
- Peng, J.; Zhang, Q.; Feng, Y.; Liu, X. Optimization of construction safety resource allocation based on evolutionary game and genetic algorithm. Sci. Rep. 2023, 13, 17097. [Google Scholar] [CrossRef]
- Yang, K.; Kim, K.; Go, S. Towards Effective Safety Cost Budgeting for Apartment Construction: A Case Study of Occupational Safety and Health Expenses in South Korea. Sustainability 2021, 13, 1335. [Google Scholar] [CrossRef]
- Sitanggang, A.P.; Manurung, E.H.; Purwanto, D. Occupational Safety and Health (K3) Budget for Construction in Accordance with the Omnibus Law. SENTRI J. Ris. Ilm. 2024, 3, 823–827. [Google Scholar] [CrossRef]
- Seo, H.J.; Rhee, S.-Y.; Yoon, Y.-G. Enhancing Worker Safety Behaviors Through the Job Demands–Resources Approach: Insights from the Korean Construction Sector. Buildings 2025, 15, 486. [Google Scholar] [CrossRef]
- Obeidat, M.S.; Sarhan, L.O.; Qasim, T.Q. The influence of human resource management practices on occupational health and safety in the manufacturing industry. Int. J. Occup. Saf. Ergon. 2023, 29, 1279–1293. [Google Scholar] [CrossRef] [PubMed]
- Ajmal, M.; Isha, A.S.N.; Nordin, S.M.; Al-Mekhlafi, A.-B.A. Safety-Management Practices and the Occurrence of Occupational Accidents: Assessing the Mediating Role of Safety Compliance. Sustainability 2022, 14, 4569. [Google Scholar] [CrossRef]
- Badriyah, L.; Widajati, N.; Haqi, D.N.; Ernawati, M. The Effect of Occupational Health and Safety (OHS) Management on Safety Behavior of Workers at Construction Service Company in Surabaya. J. Vocat. Health Stud. 2022, 6, 134–141. [Google Scholar] [CrossRef]
- Lu, Y.; Taksa, L.; Jia, H. Influence of management practices on safety performance: The case of mining sector in China. Saf. Sci. 2020, 132, 104947. [Google Scholar] [CrossRef]
- Adnan, H.; Yussof, F.N.M.; Jaafar, F.W.; Rashid, Z.Z.A.; Abidin, Z.Z.; Bakhary, N.A. Safety Manager Competencies in Managing Construction Projects in Malaysia. IOP Conf. Ser. Earth Environ. Sci. 2019, 385, 012057. [Google Scholar] [CrossRef]
- Nykänen, M.; Puro, V.; Tiikkaja, M.; Kannisto, H.; Lantto, E.; Simpura, F.; Uusitalo, J.; Lukander, K.; Räsänen, T.; Heikkilä, T.; et al. Implementing and evaluating novel safety training methods for construction sector workers: Results of a randomized controlled trial. J. Saf. Res. 2020, 75, 205–221. [Google Scholar] [CrossRef]
- Wang, X.; Wei, C.; He, Y.; Zhang, H.; Wang, Q. Research on the Correlation between Work Accidents and Safety Policies in China. Processes 2021, 9, 805. [Google Scholar] [CrossRef]
- Bundalevski, S.; Gjorgjiev, M. The influence of occupational safety training management on the perception of safety among construction workers. Ekonomika 2025, 71, 13–22. [Google Scholar] [CrossRef]
- Bęś, P.; Strzałkowski, P. Analysis of the Effectiveness of Safety Training Methods. Sustainability 2024, 16, 2732. [Google Scholar] [CrossRef]
- Jamil, Z.; Nordin, S.M.; Miraj, M.; Alqahtani, M.; Shaik, R.A.; Akhtar, S.; Isha, A.S.N. Sustainable safety practices and hazard management in the oil and gas industry: An HSE perspective. Front. Public Health 2025, 13, 1611106. [Google Scholar] [CrossRef]
- Nordin, S.M.; Rizal, A.R.A.; Rashid, R.A.; Omar, R.C.; Priyadi, U. Incidents and Disaster Avoidance: The Role of Communication Management and the Organizational Communication Climate in High-Risk Environments. Sustainability 2021, 13, 10138. [Google Scholar] [CrossRef]
- Cigularov, K.P.; Chen, P.Y.; Rosecrance, J. The effects of error management climate and safety communication on safety: A multi-level study. Accid. Anal. Prev. 2010, 42, 1498–1506. [Google Scholar] [CrossRef]
- Acheampong, A.; Adjei, E.K.; Adade-Boateng, A.; Acheamfour, V.K.; Afful, A.E.; Boateng, E. Impact of construction workers informal safety communication (CWISC) on safety performance on construction sites. Eng. Constr. Archit. Manag. 2025, 32, 4338–4356. [Google Scholar] [CrossRef]
- Mutlu, N.G.; Altuntas, S. Developing an integrated conceptual framework for monitoring and controlling risks related to occupational health and safety. J. Eng. Res. 2021, 9, 262–278. [Google Scholar] [CrossRef]
- Varma, P.; Dash, M.; Sagar, V.J.; Purohit, S. Examining the Effect of Occupational Health and Safety Practices on Improving Workplace Safety Outcomes. Health Leadersh. Qual. Life 2022, 1, 143. [Google Scholar] [CrossRef]
- Choudhry, R.M. Behavior-based safety on construction sites: A case study. Accid. Anal. Prev. 2014, 70, 14–23. [Google Scholar] [CrossRef] [PubMed]
- Kim, M.-J.; Ahn, S.-P.; Shin, S.-H.; Kang, M.-G.; Won, J.-H. Comparison of Influencing Factors on Safety Behavior and Perception Between Contractor Managers and Subcontractor Workers at Korean Construction Sites. Buildings 2025, 15, 963. [Google Scholar] [CrossRef]
- Ahmad, S.; Zain, A.Z.M.; Rahman, I.A.; Fadzil, S.M.; Zulkifly, S.S. The Relationship Impact of Employee Participation in the Safety Culture of TVET Institutions in Malaysia. PaperASIA 2025, 41, 322–329. [Google Scholar] [CrossRef]
- Dale, A.M.; Colvin, R.; Barrera, M.; Strickland, J.R.; Evanoff, B.A. The association between subcontractor safety management programs and worker perceived safety climate in commercial construction projects. J. Saf. Res. 2020, 74, 279–288. [Google Scholar] [CrossRef]
- Liu, K.; Luo, X.; Feng, J.; Li, H.; Liu, B.; Jian, Y. Research on the Impact of Managers’ Safety Perception on Construction Workers’ Safety Behaviors. Buildings 2024, 14, 3467. [Google Scholar] [CrossRef]
- Çeküç, S.; Gürcanlı, G.E.; Akın, F.D.; Kale, Ö.A. Determination of Subcontractor Selection Criteria from the View of Occupational Health and Safety in the Construction Industry. Int. J. Adv. Eng. Pure Sci. 2024, 36, 23–32. [Google Scholar] [CrossRef]
- Valluru, C.T.; Dekker, S.; Rae, A. How and why do subcontractors experience different safety on high-risk work sites? Cogn. Technol. Work. 2017, 19, 785–794. [Google Scholar] [CrossRef]
- Leveson, N.G. A systems-theoretic approach to safety in software-intensive systems. IEEE Trans. Dependable Secur. Comput. 2004, 1, 66–86. [Google Scholar] [CrossRef]
Disclaimer/Publisher’s Note: The statements, opinions and data contained in all publications are solely those of the individual author(s) and contributor(s) and not of MDPI and/or the editor(s). MDPI and/or the editor(s) disclaim responsibility for any injury to people or property resulting from any ideas, methods, instructions or products referred to in the content. |
© 2025 by the author. Licensee MDPI, Basel, Switzerland. This article is an open access article distributed under the terms and conditions of the Creative Commons Attribution (CC BY) license.