Article

Factors Influencing Perceived Ease of Use and Usefulness of BIM Tools

1
Department of Architecture, Mimar Sinan Fine Arts University, 34427 Istanbul, Türkiye
2
Department of Civil Engineering, İstanbul University-Cerrahpaşa, 34320 Istanbul, Türkiye
3
School of Science, Engineering & Environment, University of Salford, Manchester M5 4WT, UK
*
Authors to whom correspondence should be addressed.
Buildings 2026, 16(1), 106; https://doi.org/10.3390/buildings16010106
Submission received: 10 October 2025 / Revised: 16 December 2025 / Accepted: 24 December 2025 / Published: 25 December 2025
(This article belongs to the Special Issue BIM Uptake and Adoption: New Perspectives)

Abstract

BIM Adoption in firms and projects requires considerable changes in design and construction processes. There has been ongoing research on exploring the drivers and barriers to BIM adoption. BIM Tools can be defined as all software tools and applications that can input information into/acquire information from semantically rich digital 3D building models, also known as Building Information Models (BIM). The aim of this study was to identify the impact of demographic, social, education-related, previous training-related, and profession-related factors on the perception of the ease of use and usefulness of BIM Tools for students and early career professionals. The main question of the research was defined as follows: “What factors influence the perception of the ease of use and usefulness of BIM tools for students and early career professionals?” The study involved a questionnaire survey with 227 participants to measure the impact of eleven different factors on the perception of the ease of use and usefulness of these tools. The findings suggest that both the perceived ease of use and perceived usefulness of BIM Tools are mostly stable and not substantially affected by most of the external factors. Among the factors that can influence the perceived ease of use and perceived usefulness, Participation in a BIM Certification Training Program appeared to be the factor with the strongest influence, as it had a significant influence on both dimensions. Factors with weaker influence included Age Group, Gender, Being a Student or Not, Computing Habits, and Gaming Habits. The other five factors investigated appeared to have no influence on either dimension.

1. Introduction

Building Information Modeling (BIM) has become the key information management and sharing strategy in large-scale construction projects today. This strategy is based on sharing design, construction, and maintenance-related information through 3D, semantically rich, digital building models that act as information containers. BIM Tools is a generic term that can be used to define all software tools and applications that can input information into/acquire information from these digital 3D building models (i.e., Building Information Models, BIMs). BIMs can contain, point out, or link all the types of information used throughout the life cycle of a building (related to planning, design, construction, maintenance) [1]. Since there is a well-recognized need to use and share information effectively in the construction project management process, BIM has emerged and is being used as a solution to serve this purpose. BIM is rapidly changing the way buildings are designed, constructed, and operated. BIM has a long history, dating back to research in the US and Europe in the 1970s and 1980s. However, it started to be implemented in projects in the architecture, engineering, and construction (AEC) domain in the mid 2000s [2]. A 3D digital model of a building consisting of geometry, form, material, and the cost of the building can be created with BIM Tools, which can then be used in different ways by the project participants throughout the entire life cycle of the building [3,4].

1.1. Literature Review

BIM Adoption in firms and projects requires considerable changes to traditional paper and CAD-based design and construction processes. There has been ongoing research on exploring the drivers and barriers to BIM adoption in projects and in companies. Many of these studies benefited from the Technology Acceptance Model Theory. Below, some key studies on BIM adaptation and BIM implementation for different fields and use cases are summarized according to their intended users.

1.1.1. BIM Studies for Students

Sanchís-Pedregosa et al. (2020) [5] examined the factors influencing BIM adoption among architects and engineers in Peru using the Technology Acceptance Model (TAM). The data they obtained through a survey (n = 73) showed that Perceived Usefulness (PU) was the strongest determinant of Behavioral Intention (BI), while Perceived Ease of Use (PEOU) had no significant effect. Their work laid the foundation for developing policies and roadmaps for BIM implementation in Peru. Peng et al. (2022) [6] examined university students’ BIM learning behaviors based on the Unified Theory of Acceptance and Use of Technology (UTAUT) theory and added the learning attitude variable to the model. They collected online survey data from 2000 undergraduate students in China and analyzed it using structural equation modeling (SEM). The results of the study showed that learning attitude, performance expectation, and social influence positively affected students’ learning intention, which in turn indirectly increased learning behavior. Torres et al. (2025) [7] surveyed 45 undergraduate and 30 graduate students to examine their perceptions of BIM’s role in reducing cost overruns in residential construction. The results show that there are different perspectives among students, and that BIM is seen as more effective in the early stages of a project but is limited by external factors. The findings reveal the need for better integration of BIM training and cost management knowledge and contribute to developing the professional competence of future construction managers. Ahankoob et al. (2025) [8] used the Technology Acceptance Model (TAM) to examine the BIM perceptions of undergraduate construction students. A total of 773 responses were collected from Australian students, with 607 providing qualitative data. Qualitative analysis revealed student perspectives, while quantitative analysis identified interdisciplinary patterns. The findings showed that perceived usefulness and attitudes toward use were prominent, while ease of use received less attention. The study documented student perceptions of BIM education, facilitating an understanding of the interaction between technological enthusiasm and professional concerns in education and industry.

1.1.2. BIM Studies for Professionals

Okakpu et al. (2020) [9] empirically examined the environmental factors influencing BIM adoption decisions in the renovation of complex buildings. Their study, using data from 105 construction professionals in New Zealand, shows through structural equivalence model analysis that information sharing, improvement tools, organizational culture, and customer expectations strongly influence BIM adoption, and provides insights into how environmental factors can positively or negatively affect BIM use in renovation projects. Huang et al. (2021) [10] examined the impact of BIM on green buildings and the obstacles encountered through a 27-question survey administered to various stakeholders. In the study, they analyzed data obtained from 300 participants (designers, construction managers, certification experts) using SPSS and AMOS, and they concluded that BIM makes significant contributions to green building design and construction. Shaqour (2022) [11] used descriptive, analytical, and quantitative research methods in their study, which aimed to examine current practices in project management and predominant knowledge areas in the construction sector in Egypt, investigate the impact of BIM on the development of these areas, and highlight the benefits provided by BIM applications. She included 106 participants with BIM experience in areas such as drafting, quantity estimation, cost management, and scheduling. The results showed that BIM applications improved project management and provided benefits in areas such as central data management, cost control, program tracking, and communication with stakeholders. Wang and Feng (2022) [12] conducted structural equation modeling (SEM) analyses using data from 295 surveys while examining the relationships between BIM definition, BIM capability maturity, Integrated Project Delivery (IPD), BIM adoption, and existing risks. The results showed that BIM technology, process, and policies have a positive effect on BIM capability maturity. Furthermore, these three factors act as mediating variables that influence the relationship between BIM capability maturity and other variables. Yu et al. (2023) [13] presented a new approach that measures cost requirements and values for BIM adoption using the Adaptive Analytic Hierarchy Process (A-AHP). Their proposed method prioritizes BIM usage elements within the framework of cost, prerequisite relationships, and budget constraints. Its effectiveness has been validated through a survey of 50 construction professionals, and they have proposed two BIM prioritization methods under budget constraints: project goal-oriented and value-oriented. This approach is important for enabling decision-makers to select appropriate BIM elements and estimate their costs under limited budgets. Mata et al. (2024) [14] extended the Technology Acceptance Model (TAM) to examine the factors influencing BIM adoption in the architectural, engineering, and construction (AEC) sector in the Philippines. They analyzed antecedent factors such as system quality, user interface, and personal innovativeness using a partial least squares structural equation model on 527 participants. The findings showed that these factors influenced behavioral intention toward BIM use and that young professionals have the most potential to adopt BIM. Li et al. (2024) [15], with data collected from 192 managers by the survey method, made suggestions to assist managers in developing an understanding of BIM to aid in their adoption decisions. Using fuzzy set qualitative comparative analysis (fsQCA) on the dataset, they developed recommendations to motivate managers to adopt BIM and avoid decision-making bias. Waqar et al. (2024) [16] examined the impact of BIM adoption in the AEC sector by focusing on its external environment using the Political, Economic, Social, and Technological (PEST) approach through a survey form applied to a sample of 216 professionals in the AEC sector. The results showed that BIM collaboration, continuous improvement, effective data management, gradual acceptance, and standardization led to positive outcomes in various areas such as social, economic, political, and technical. Sajjad et al. (2024) [17] used surveys and exploratory factor analysis with structural equation modeling (SEM) on 215 participants in their study, which aimed to identify the factors influencing BIM adoption in Pakistan and examine the role of conflict and risk management, communication, technical security, and resource management. Their results showed that planning and technical security management had the strongest relationship with BIM implementation (path impact value = 0.613), followed by conflict and risk management. Gharaibeh et al. (2024) [18] provided a comprehensive framework to quantify the benefits of BIM in construction in their work. Their model, validated through industry insights, surveys, and case studies from the Swedish construction sector, demonstrates that while there may be increased costs during the design phase, overall time and cost savings are achieved throughout the process. Operational gains, particularly in maintenance planning and energy efficiency, account for the majority of the total benefits. The study contributes methodologically to the BIM adoption debate and offers valuable insights for practitioners. Wei et al. (2025) [19] analyzed the factors influencing BIM adoption by integrating the Technology Acceptance Model (TAM) and the Theory of Planned Behavior (TPB), using data collected from 588 Chinese practitioners and researchers. The findings indicate that perceived environmental concern, behavioral intention, and perceived behavioral control are the most influential factors in BIM adoption. The study emphasizes the need to increase environmental awareness, encourage positive behavioral intentions, and strengthen technical support and system optimization. Mehrizi et al. (2025) [20] identified 30 key barriers to BIM implementation in commercial buildings through a survey of 115 industry experts and a literature review, and analyzed them using PLS-SEM. The most critical barriers included a lack of training workshops, software, and technology, high hardware costs, and stakeholder demand. The study offers practical recommendations for overcoming these barriers through training programs, policy reforms, and financial incentives.

1.1.3. BIM Studies for Companies and Corporate Level

Qin et al. (2020) [21] investigated the factors influencing the adoption of BIM in construction companies. Twelve external variables identified using the Technology Acceptance Model (TAM) and Technology Organization Environment (TOE) frameworks were examined through surveys conducted with development, design, construction, and consulting companies. An analysis of 120 surveys using the Decision Making Trial and Evaluation Laboratory (DEMATEL) method revealed that “national policies” were the most important driving force behind BIM adoption. Furthermore, it was determined that “BIM Usage Intention” is influenced by national policy, standardization, and popularity within the industry. The findings indicate that government incentives play a critical role in the widespread adoption of BIM in China. Cui et al. (2021) [22] experimentally examined the factors influencing continuous use intention (CUI) through the integration of TAM and expectation–confirmation theory (ECT). They analyzed 207 surveys collected from architectural design companies in Qingdao, China, using a structural equation model. Their findings showed that perceived ease of use and satisfaction directly influenced CUI, while perceived usefulness and fit indirectly influenced CUI through satisfaction. Ao et al. (2021) [23] evaluated the BIM learning outcomes of 2777 students who participated in the BIM Graduation Design Innovation Competition and used statistical methods to verify the reliability of the dataset (Cronbach’s alpha = 0.962, KMO = 0.965, ANOVA). As a result, they provided recommendations and theoretical support for the improvement of BIM learning performance in their study
Table 1 gives a summary of selected studies and findings related to BIM adoption and acceptance.
Park and Kim (2014) [25] provided a dataset that can be used as an input to BIM for homeowners’ housing renovation projects. In the survey, 112 homeowners and 39 construction professionals involved in renovation work in the UK participated in this study, and it was found that the first priority of both types of respondents was roof renovation. The study revealed that BIM requires an appropriate BIM dataset and objects for the topic of residential refurbishment. Elshafey et al. (2020) [26] used the Technology Acceptance Model 3 (TAM3) in their study to investigate the acceptance of BIM and Augmented Reality (AR) integration and concluded that, since this model can predict the acceptance of BIM and AR users, it can be used for the development of new BIM-AR integration applications. Xue et al. (2023) [27] aimed to extend theoretical models of technology acceptance to understand the perceptions of non-managerial practitioners on working with BIM in China. As a result, management strategies, such as improving the perception of BIM’s benefit and sense of usefulness among non-managerial staff, selecting appropriate tools to match staff’s tasks, and promoting a middle-out approach in parallel with top-down interventions, were proposed to increase BIM acceptance among Chinese AECO organizations. Deng et al. (2023) [28] identified 16 factors affecting BIM and established a relationship between them according to the current situation. The model created in the article aimed to improve the current level of BIM implementation and encourage its development. Li et al. (2024) [15], with data collected from 192 managers through a survey, made suggestions to enable managers to develop an understanding of BIM to aid in adoption decisions. Using fuzzy set qualitative comparative analysis (fsQCA) on the dataset, they provided recommendations to motivate managers to adopt BIM and avoid decision-making bias. Eze et al. (2024) [29] aimed to observe the potential impact of a developing country’s adoption of BIM on its reduction in construction waste. Using statistical methods on data collected from construction professionals in the Nigerian construction industry, they aimed to showcase major waste-generating activities that could be avoided by using BIM. Wang et al. (2024) [30] developed a model based on 63 datasets of the most frequently examined constructs related to BIM adoption. The analysis reveals that BIM adoption is primarily influenced by performance expectancy, social impact, enabling conditions, effort expectancy, and perceived value. The research serves to enrich the existing literature on BIM adoption by addressing the contradictory and mixed results found in empirical studies. It represents one of the first attempts to explore the influence of sample size, economic level, and Hofstede’s six cultural dimensions as moderators in the BIM field using meta-analytic techniques. Olugboyega (2024) [31] investigated the impact of basic BIM implementation methodologies on the occurrence of proportional effects between phases. The study provided new insights into the models, phases, and linkages in the implementation process and contributed to BIM implementation theories.
This study addresses the existing research gap regarding the evaluation of the stability of the Usefulness and Ease of Use perceptions surrounding BIM Tools across different user profiles in a country with an emerging digital economy.
The study explained in this paper focuses on evaluating the robustness and stability of the Usefulness and Ease of Use perceptions surrounding BIM Tools across different user profiles, such as students and early career professionals, who can be regarded as digital natives living in a country with an emerging digital economy. Although the usefulness perceptions surrounding BIM tools have been studied in the context of TAM, the unique contribution of this paper stems from reframing the well-known casual testing in TAM to a robustness and stability assessment, and in this context, evaluating both the distributional and central tendency towards stability and the robustness of the Usefulness and Ease of Use perceptions surrounding BIM tools specifically for digital natives living in a country with an emerging digital economy.
The primary objective of this research was to identify the demographic, social, educational, and professional factors that influence perceptions of the ease of use and usefulness of BIM tools among students and early-career professionals. The study aimed to contribute to the literature by examining the role of external factors in the perceptions of the ease of use and usefulness of BIM tools.

2. Materials and Methods

2.1. Research Design

Perceived usefulness is defined as “the degree to which a person believes that using a particular system would enhance his or her job performance”. A system high in perceived usefulness, in turn, is one for which a user believes in the existence of a positive use–performance relationship [32,33]. Perceived ease of use, in contrast, refers to “the degree to which a person believes that using a particular system would be free of effort”. Refs. [32,33] advocate that, all else being equal, an application perceived as being easier to use than another is more likely to be accepted by users. It is also indicated that the perceived ease of use has a significant direct effect on perceived usefulness. If two systems provide the same functions, a user should find the one that is easier to use to be more useful [33].
Measuring the perceived usefulness and ease of use in the context of technology acceptance has been very popular for the last 35 years in the field of ICT adoption. For example, more than 2500 studies [34] based on the Technology Acceptance Model (TAM) [32,33] were published throughout the COVID-19 pandemic in just two years, exploring the perceived ease of use and perceived usefulness of different ICT tools, applications, and technologies. Since 1989, numerous studies have demonstrated and confirmed the hypotheses in [32,33] advocating for (i) the positive impact of perceived ease of use on perceived usefulness and (ii) the positive impact of perceived usefulness on the intention to accept an ICT tool or application.
The intentions of students and early career professionals towards the acceptance of a new technology provide important indicators of the future trends and popularity of that technology in the near future. In recent years, the use of BIM as the main information management and delivery strategy for public projects has been mandated in many countries. In fact, the success that would lead to actual use of BIM in AEC projects does not depend solely on what is mandated, but mainly relates to the level of acceptance by the end users. In this context, this research is conducted with the aim of identifying the impact of demographic, social, educational, previous training-related, professional, and habit-related factors on the perception of the ease of use and usefulness of BIM Tools in students and early career professionals. In addition, the effect of perceived ease of use on perceived usefulness was also tested for BIM Tools to understand this relation in terms of BIM acceptance in students and early career professionals.
The main research question of the study was “What factors influence the perception of the ease of use and usefulness of BIM tools for students and early career professionals?” The research framework has both structural and methodological dimensions.
Structural Framework:
This question generates a conceptual layer for the research framework where each of the external (observed) factors (such as age, gender, student status, computing habits) becomes a grouping variable. These variables do not enter a path model; they instead define subgroups whose distributions are compared against the perceptions of the Usefulness and Ease of Use of BIM Tools. This differentiates our framework from classical SEM-based TAM studies. Each independent factor is hypothesized to potentially change the distribution of either PU or PEOU, but we did not test these through causal modeling, but rather through distributional comparison. The research question “What factors influence perception?” was formulated in a distributional and robustness sense, not in a causal one, to explore/discover the factors that influence perception. Thus, the methodology of this study was primarily focused on measuring “Whether” the given external (observed) factors influence the Usefulness and Ease of Use perceptions surrounding BIM. This is a robustness testing framework that evaluates whether perceptions remain stable despite changes in demographic or experience-related conditions.
Methodological Framework:
The methodological framework relies on a non-parametric comparative methodology. The methodological framework included 3 stages. (a) Measurement where (i) PU and PEOU were measured with 6 items each (Likert-5), (ii) external factors were measured as binary/categorical factual variables and (iii) internal consistency was verified (α = 0.935 for PU, 0.785 for PEOU), (b) data Screening and removal of biased/uncareful responses was conducted and (c) distributional comparison was performed for each external factor with the Brunner–Munzel or Brunner–Dette–Munk tests for robust stochastic equality of central tendency, and the Cramér–von Mises/Anderson–Darling k-sample tests for equality cumulative distributions.
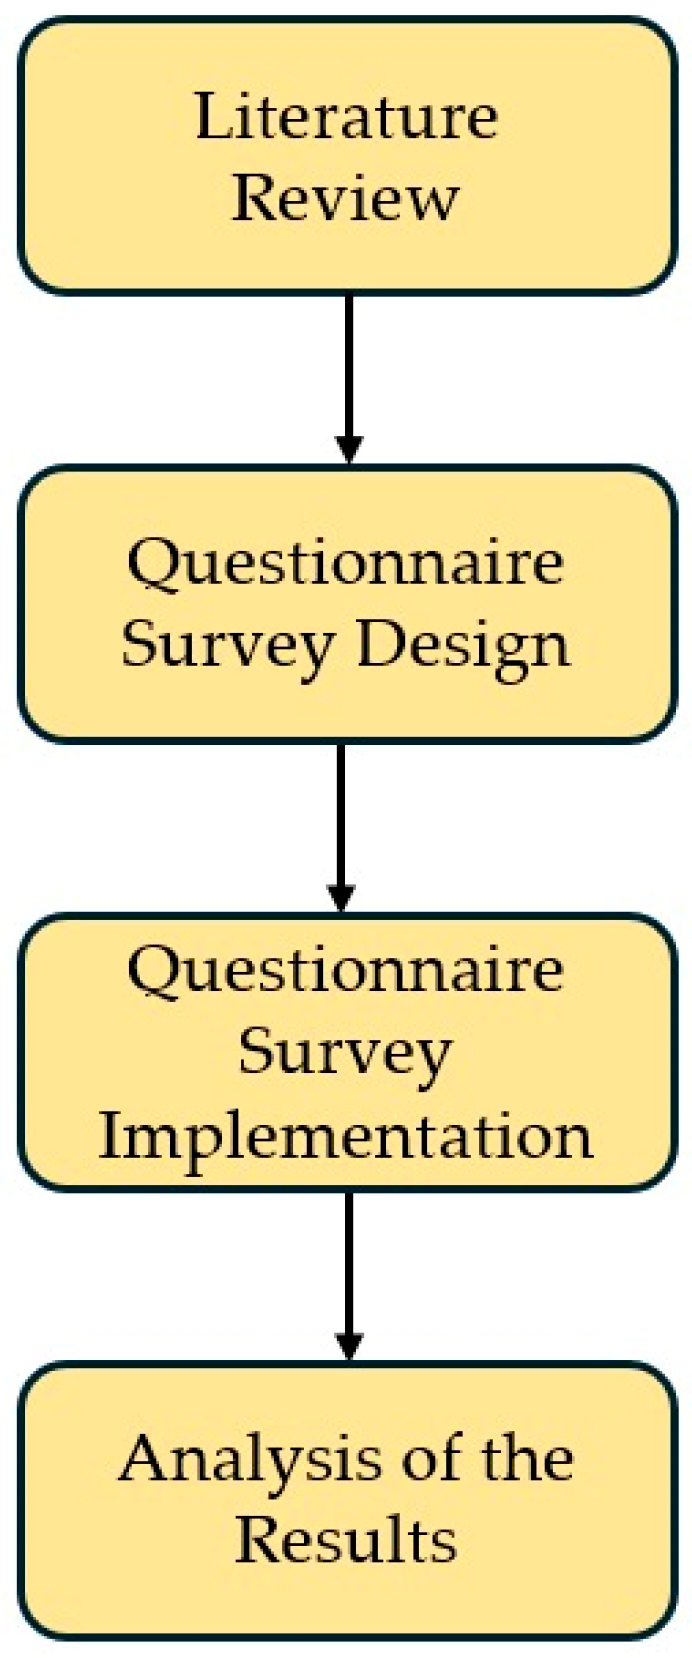
As depicted in Figure 1, following the literature review, for data acquisition, a questionnaire survey was prepared considering independent factors (demographic, social, education, previous training, profession, and habit-related) represented with factual variables and dependent constructs (ease of use and usefulness of the BIM tools) that were represented by a set of questions (items). The data collection was accomplished based on a questionnaire survey. An online survey form was used as the data collection tool. Participants were selected on a voluntary basis, and convenience sampling was adopted as the sampling strategy. The sample consisted of students studying in the Architecture and Urban Informatics MSc. Program at MSGSÜ and their colleagues, including both BSc/MSc students and professionals in the early stages of their careers.
The questionnaire consisted of 23 questions (items) in total. The first set of 11 questions was developed to measure the independent factors; the following set of 12 questions was used to measure the dependent constructs. The questions related to the independent factors (i.e., factual questions) were prepared by the researchers by screening similar studies in the literature, which were explained in the previous section. Face validity was considered to be the validity measure for the factual questions. These questions were validated with 5 academics in the fields of statistics and linguistics. The questions were checked in terms of their understandability, ease of interpretation by the respondents, and clarity to ensure that the wording of the questions was understandable and made sense for the respondents. The following 12 questions, which measured the perceived usefulness and perceived ease of use, were adopted from [32,33] without any change in wording. These two constructs’ construct validity has been confirmed numerous times in an excessive number of earlier studies on the Technology Acceptance Models for different tools and technologies.

2.2. Data Collection and Dataset

This section presents an overview of the dataset and basic characteristics of the dataset by grouping items into factual variables and two constructs (latent variables).
The questionnaire included two sets of questions. The first set consisted of factual questions, of which most had binary response options (e.g., yes/no, laptop/desktop), excluding two that were about respondents’ background and current work status (i.e., included 4/5 response options). The questions in the second set were adopted from [35], and the items were developed based on [32,33]. Instead of the 7-point Likert scale provided by [35], we have implemented a 5-point Likert scale to ensure the clarity of the responses.
Dawes [36] indicated that data characteristics and reliability do not change substantially between five- and seven-point scales, suggesting little empirical advantage in expanding the categories. The authors indicate that data gathered in a 5-point format can readily be transferred to 7-point equivalency using a simple rescaling method.
Google Forms [37] was used to prepare questions and gather responses. The link to the questionnaire was sent to major construction companies and students of 5 universities in Turkey. Only participants with work experience < 5 years were asked to fill in the questionnaire in the call for responses message that was sent. A total of 243 responses were gathered in return.
The acquired data was first screened for straight lining (i.e., marking the same Likert Scale Item for all questions), Acquiescence/Disacquiescence Bias (tending towards answering yes or no to all questions), and for extremely high/low variances in responses. Following the screening stage and the removal of biased/uncareful responses, the final dataset for analysis remained, with 227 records. The sample in this study consists of 227 participants. This sample size is consistent with the number of participants used in similar BIM acceptance studies (e.g., Park and Kim [25], Olawumi and Chan [24], Cui et al. [22]) and is considered sufficient for the reliable application of statistical analyses. The statistical analysis conducted in this research was performed using Jamovi [38] and SmartPLS [39].
The methodology implemented in this study was a comparative group analysis instead of an extension of a path model, such as the one implemented in [6]. The methodology of this study was focused on analyzing the impact of grouping variables (termed in this paper as external factors) on the Perceived Usefulness and Perceived Ease of Use of BIM Tools, using non-parametric hypothesis testing methods such as Brunner–Munzel and Brunner–Dette–Munk tests, and additionally the shape of the data distributions of the responses were tested by the Cramer–Von Mises and Anderson–Darling k-sample tests, which compare cumulative distribution functions.

2.3. Dataset Overview: Factual Variables

Table 2 and Table 3 provide the frequency and percentage distributions of the responses provided to the factual questions for the final dataset.
As shown in Table 2, 55.1% of the 227 participants were male, and 44.9% were female. While 72.6% of the participants were aged 25 and above, 27.4% were in the age range below 25. Looking at the educational level of the participants, 25.1% of the participants were students, and the majority were non-students. In terms of employment field, 19.4% of the participants were civil engineers, 49.8% were architects, 2.6% were mechanical engineers, and 16.7% were unemployed. The majority (65.2%) of the respondents were either architects or students of architecture. (The fact that most participants came from the field of architecture is related to the participation of the Architecture and Urban Informatics MSc. Program at MSGSÜ where the research was conducted. Many architects enroll in the program, as it is the only BIM-focused MSc in the country where BIM Tools and Technologies are used extensively. In this degree program, students are exposed to these technologies at an early stage and gain extensive knowledge and practical experience regarding BIM tools). This was followed by Civil Engineering with 25.1%. The majority of the respondents (78.4%) preferred to use a laptop as their main work PC. In addition, 28.6% of the respondents had the habit of playing computer games.
The remaining questions of the first set were focused on measuring experience and willingness to learn and use BIM, and to learn advanced computing methods, such as coding. When asked if the respondent, if they had to join a BIM training, would prefer it to be conducted through distance learning or face to face, the opinions were evenly distributed. The situation was similar for whether respondents had been students of a BIM course before. In total, 51.1% mentioned that they had taken an academic course on BIM. In fact, the ratio of having been a participant in a BIM certification program was lower, with 29.1%. When asked about their experience with coding, 57.5% mentioned none, which clarifies that for the majority, ICT skills were mainly at the user level, instead of a developer level.

2.4. Dataset Overview: The Constructs and Underlying Items

The second part of the dataset comprised 12 items developed to assess two underlying constructs, namely the Perceived Usefulness of BIM Tools (PU) and Perceived Ease of Use of BIM Tools (PEOU). Each latent construct was measured using 6 items, which were adopted from [32,33]. The responses were measured and recorded with a 5-point Likert scale. The questions in [32,33] were translated from English to Turkish for all items regarding PU and PEOU that are explained in this section. Reliability was assessed in terms of internal consistency by using Cronbach’s alpha test, and for the PU, the Cronbach’s α score was found to be 0.935 (Excellent), and for the PEOU Cronbach’s α score was found to be 0.785 (Acceptable/Good).
Table 4 provides the frequency and percentage distributions of the responses provided to the items developed to assess the two underlying constructs.
For the first item of the Perceived Usefulness dimension, PU1, there was 95.6% agreement with the item. For the second item, PU2, the agreement was strong, i.e., 93.8%, but slightly less when compared with PU1. For the third item, PU3, the agreement with the item was still strong, 88.5%, but was a bit lower than PU2. When the responses to PU4 were explored, the agreement level was similar to PU2, i.e., 91.2%. For the fifth item in this dimension, the agreement was 93.4%, which is very similar to both PU2 and PU4. The final item of this dimension was PU6, and 92.5% of the respondents agreed with the statement in the last item of this dimension. The results indicate a very positive perception regarding the usefulness of BIM Tools, which indicates that respondents find BIM Tools useful for their jobs.
Regarding the Perceived Ease of Use dimension, for the first item, PEOU1, the agreement ratio was 71.3%, while 23.3% remained neutral to the statement that claims that learning BIM tools is easy. A very similar agreement ratio of 71.8% was obtained for PEOU2, while 23.8% were neutral to the statement. The third statement was about clear and understandable interaction with the tools, and a vast majority 83.7% agreed with the statement. When asked about the flexibility of interaction with BIM tools, only 67% agreed with the statement, which was one of the lowest agreement levels observed among the items of both constructs. In total, 93.8 of the respondents agreed that it was easy to become skillful at using BIM Tools. In contrast, only 57.8% thought that BIM Tools were easy to use. The agreement levels varied in the items of the second construct, but in general, the majority did not find BIM tools difficult to use.

3. Results

This section presents the results of statistical analyses examining how various factors affect latent variables, and further explores how these latent variables influence each other, particularly in terms of Usefulness and Ease of Use perceptions among students and early-career professionals.

3.1. Factors Influencing Perception of Usefulness

This section investigates factors influencing the Usefulness perception of the respondents through statistical hypothesis tests. Each factor investigated here considers each factual question as the grouping variable (i.e., the independent variable), which is used to generate the groups to compare, and the Usefulness perception as the dependent variable, which is grouped according to the factual question. The metric used to represent Usefulness perception was named Perceived Usefulness and was calculated by obtaining the mean of all 6 responses for the items of the construct, and then the score of each record was scaled between 1 and 100 based on all mean scores obtained from participants. The following presents the results of hypothesis tests on the sub-groups of the Percieved Usefulness construct.

3.1.1. The Influence of Age on Usefulness

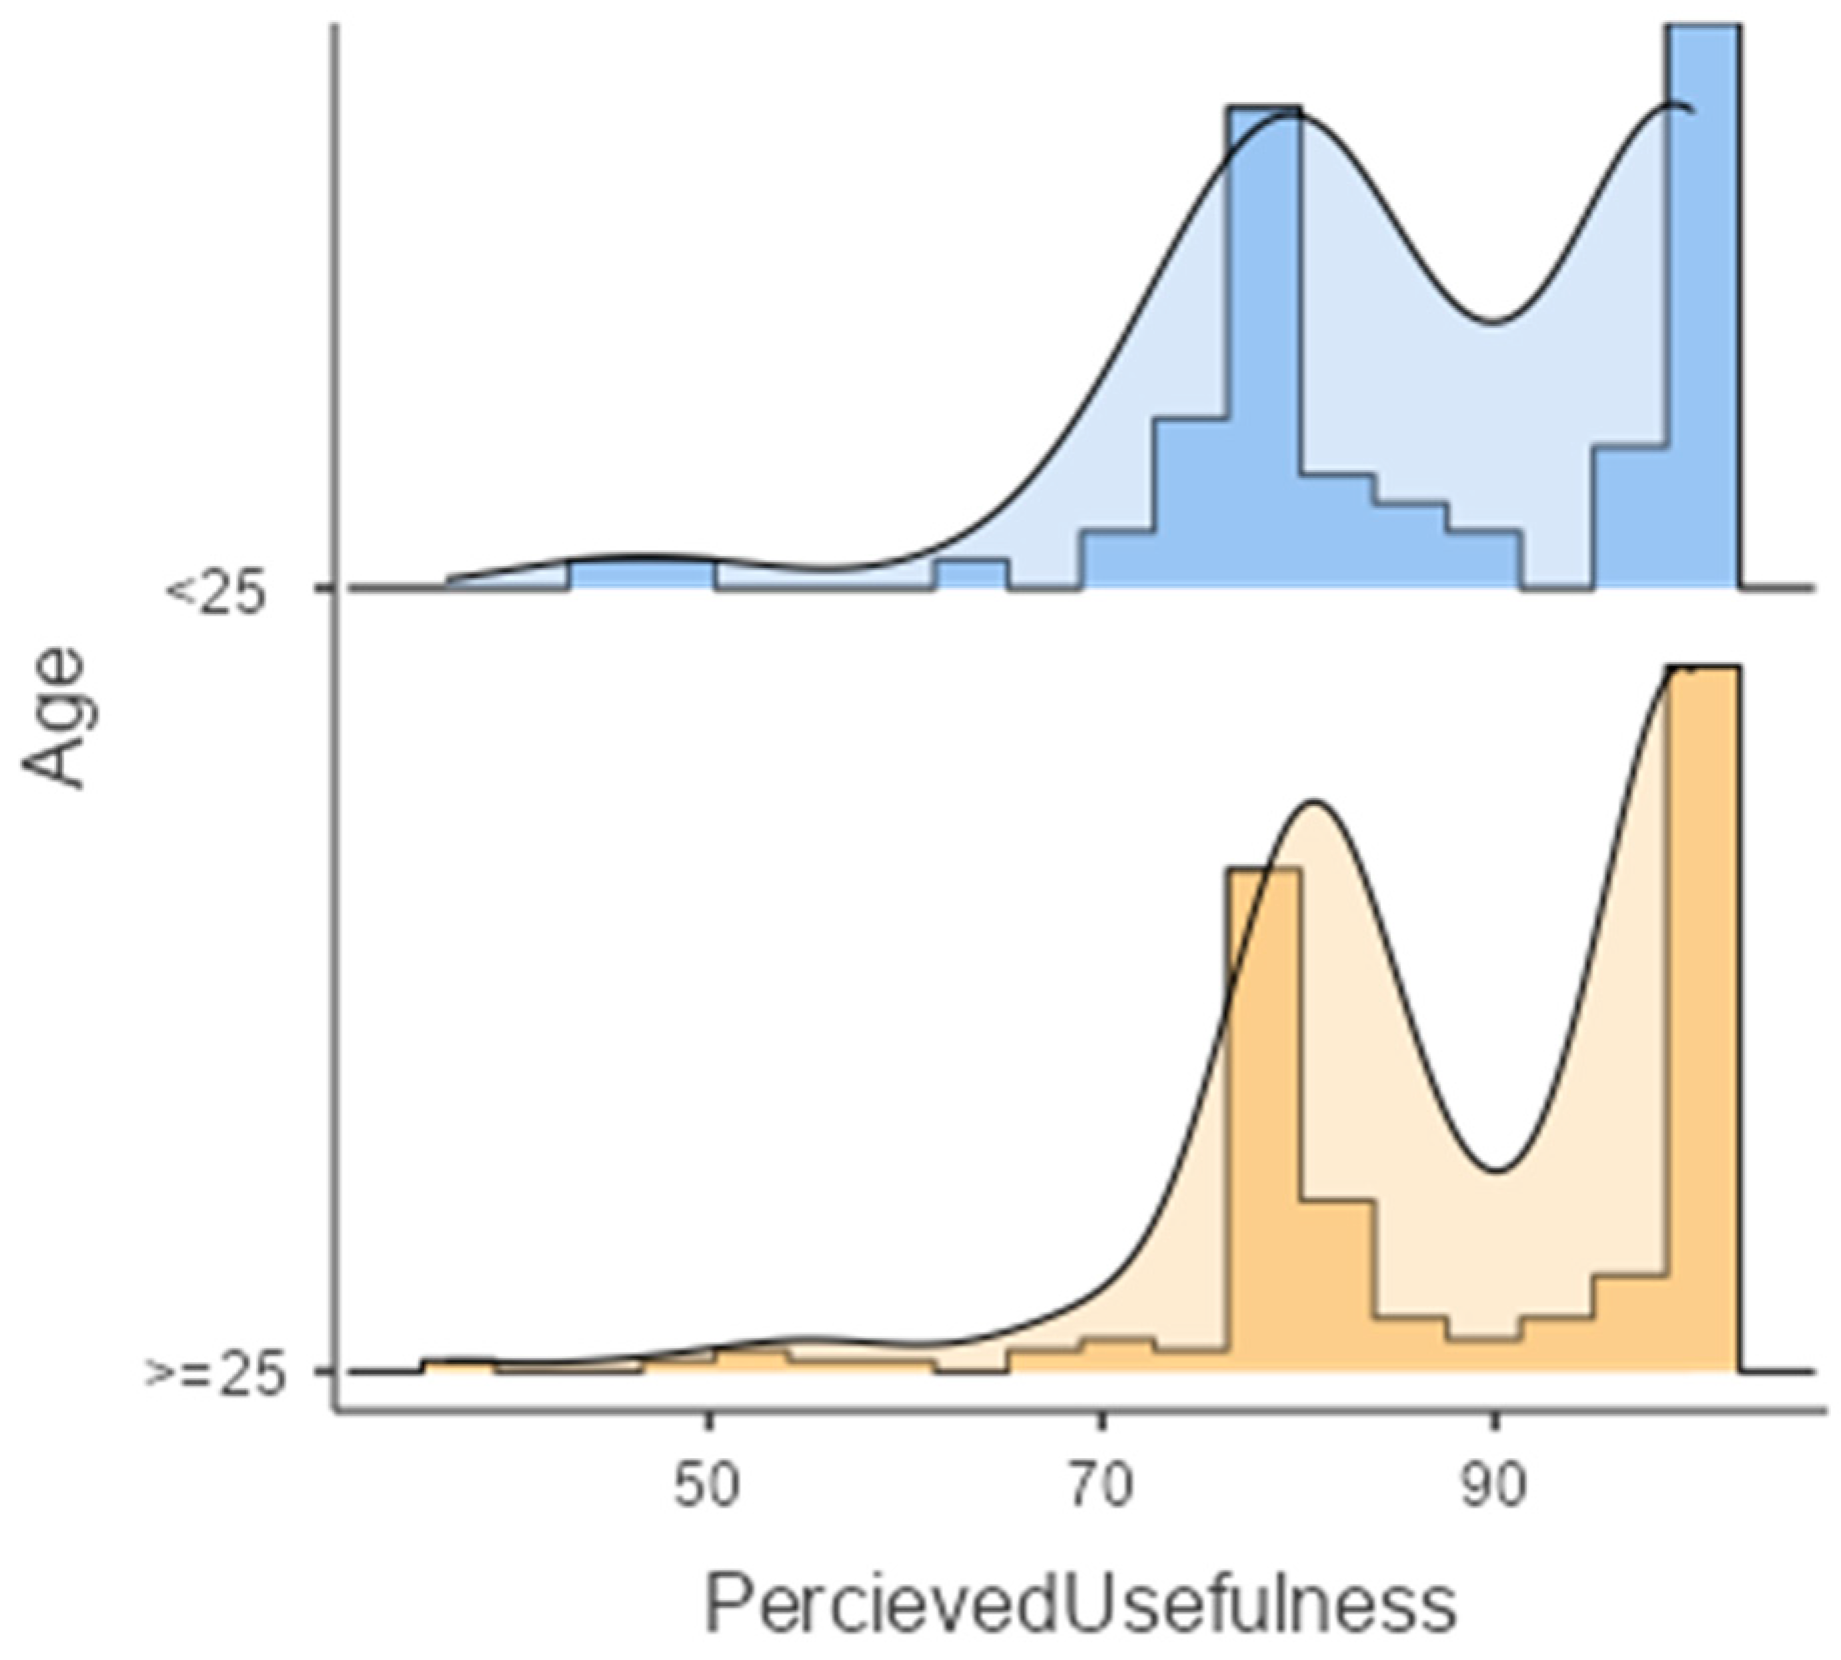
Figure 2 illustrates the Perceived Usefulness Scores grouped by Age in the form of a Histogram and Density Plot. Table S1 in Supplementary Materials provides the results of the Kolmogorov–Smirnov (K–S) test. As the data distribution is not normal and thus does not meet parametric assumptions, we employed a median-based Mann–Whitney U test to test the equality of the distributions of two Age groups. Table S2 in Supplementary Materials provides the results of this test. The results reveal that there is no statistically significant difference in the central tendency of Perceived Usefulness Scores between the age groups (U = 5724.0, p = 0.130 > 0.05). To confirm these results, we have implemented the Brunner–Munzel test, which is a nonparametric test for stochastic equality between two groups, and, unlike Mann–Whitney U, this test is robust to unequal variances and shapes. The results of the Brunner–Munzel test are provided in Table S3, and the results (W = 1.47, p > 0.05) confirm that, in terms of central tendency, the Age factor does not have any influence on the Usefulness Perception of BIM Tools.

3.1.2. The Influence of Background on Usefulness Perception

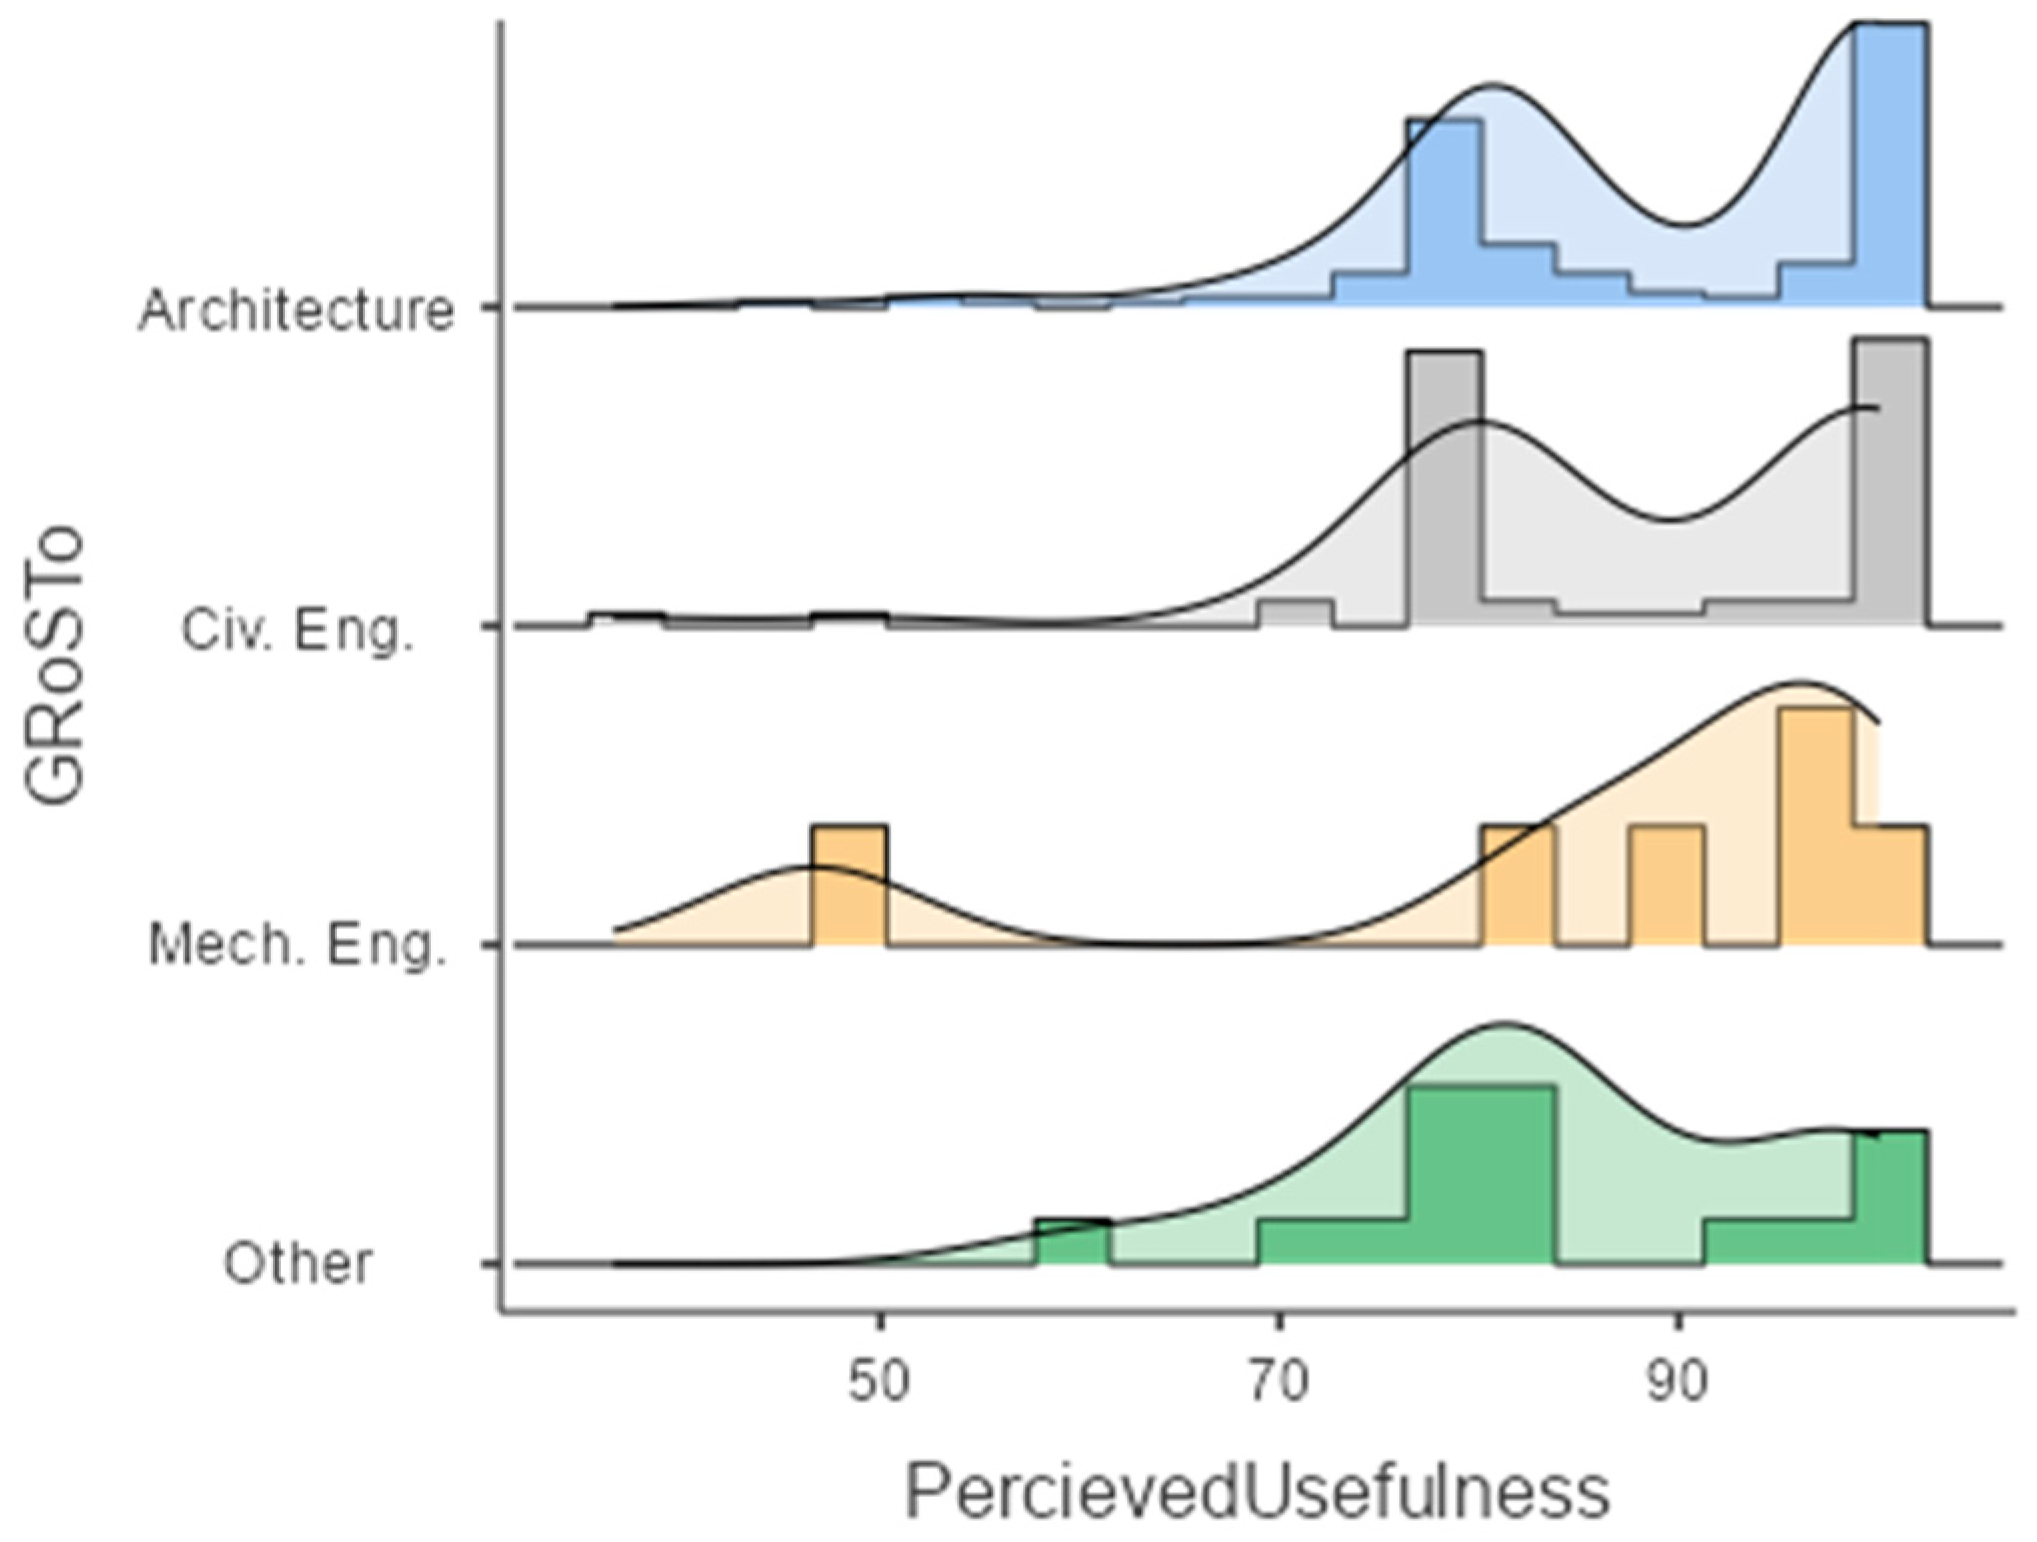
Figure 3 depicts Perceived Usefulness Scores grouped by the backgrounds of participants in the form of a Histogram and Density Plot. The acronym GRoSTo in Figure 3 refers to “Graduate of Student of…”. To determine a hypothesis test to compare the four Background groups, we conducted a Kolmogorov–Smirnov (K–S) test (Table S4 in Supplementary Materials). Although normality (p > 0.05) was assured for the “Mechanical engineering” group, it could not be assured for the other three groups. Therefore, a non-parametric Kruskal–Wallis test was performed to test the equality of the distributions of the four Background groups. The result of the test is provided in Table S5 in Supplementary Materials. The null hypothesis of the Kruskal–Wallis test is retained. Although the distributions of perceived usefulness appear to differ in shape among Backgrounds, the Kruskal–Wallis test indicated no statistically significant difference in median Perceived Usefulness (K-W = 1.929, p = 0.587 > 0.05). The Kruskal–Wallis (K-W) test assumes that groups have similar distributions (i.e., same shape/variance) and can give misleading results if variances differ between groups, as in our case. The Brunner–Dette–Munk test assesses stochastic dominance and does not assume equal variances, i.e., it is heteroscedasticity-robust and handles unequal sample sizes better. Thus, the BMD test is more robust when compared with the K-W test. Table S6 in Supplementary Materials provides the results of the BMD test. In the Brunner–Dette–Munk test, the ATS (ANOVA-Type Statistic) is a test statistic used for rank-based nonparametric analysis of variance. It is analogous to the F-statistic in classical ANOVA, but works with ranks instead of raw values, similarly to Kruskal–Wallis. The BDM test results (ATS = 4.183, p = 0.999 > 0.05) indicated that there was no statistically significant difference among the groups in terms of central tendency, and the test failed to reject the null hypothesis that states that all group distributions are identical. This confirms the results of the Kruskal–Wallis test. The results of all tests indicated that the Background factor (i.e., the academic background among the mentioned groups) does not have any influence on the Usefulness Perception of BIM Tools.

3.1.3. The Influence of Profession on Usefulness

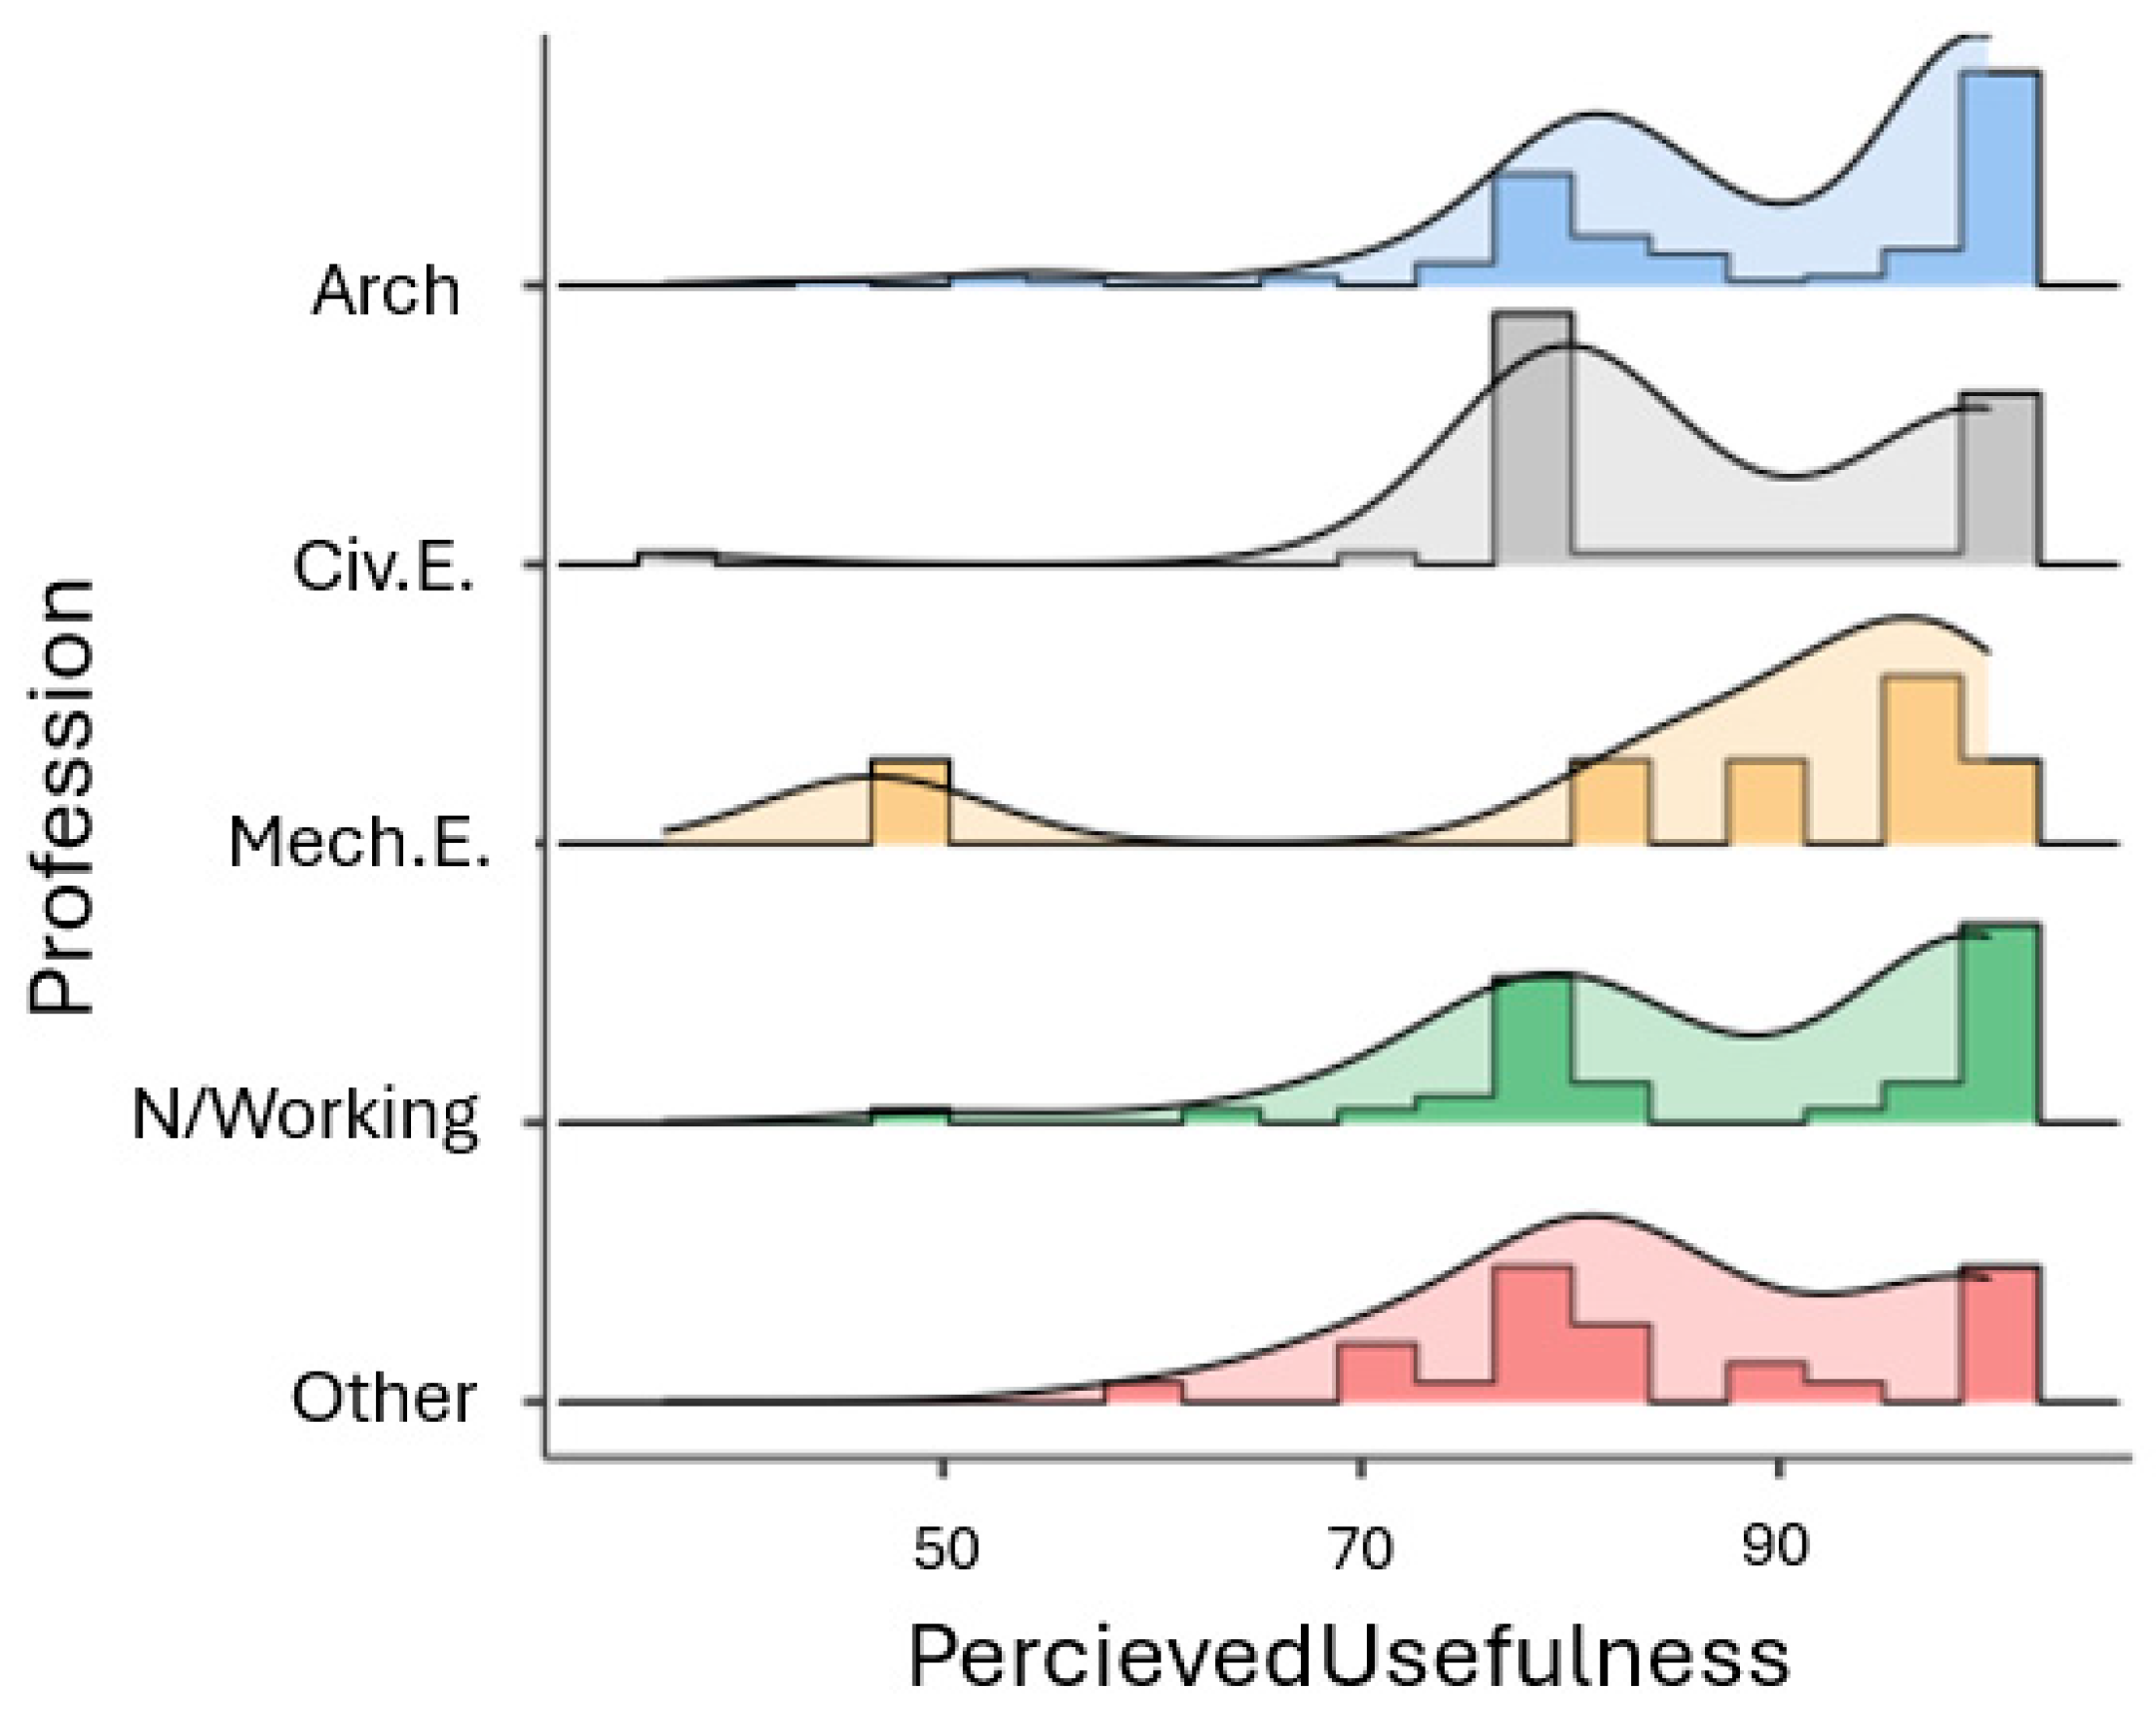
Figure 4 depicts Perceived Usefulness Scores grouped by Profession. As indicated in Table S7 in Supplementary Materials, normality was not ensured for all groups. Table S8 in Supplementary Materials provides the results of the test on group differences. The results of all tests indicated that the Profession factor (i.e., current role/employment status) does not have any influence on the Usefulness Perception of BIM Tools.

3.1.4. The Influence of Gender on Usefulness Perception

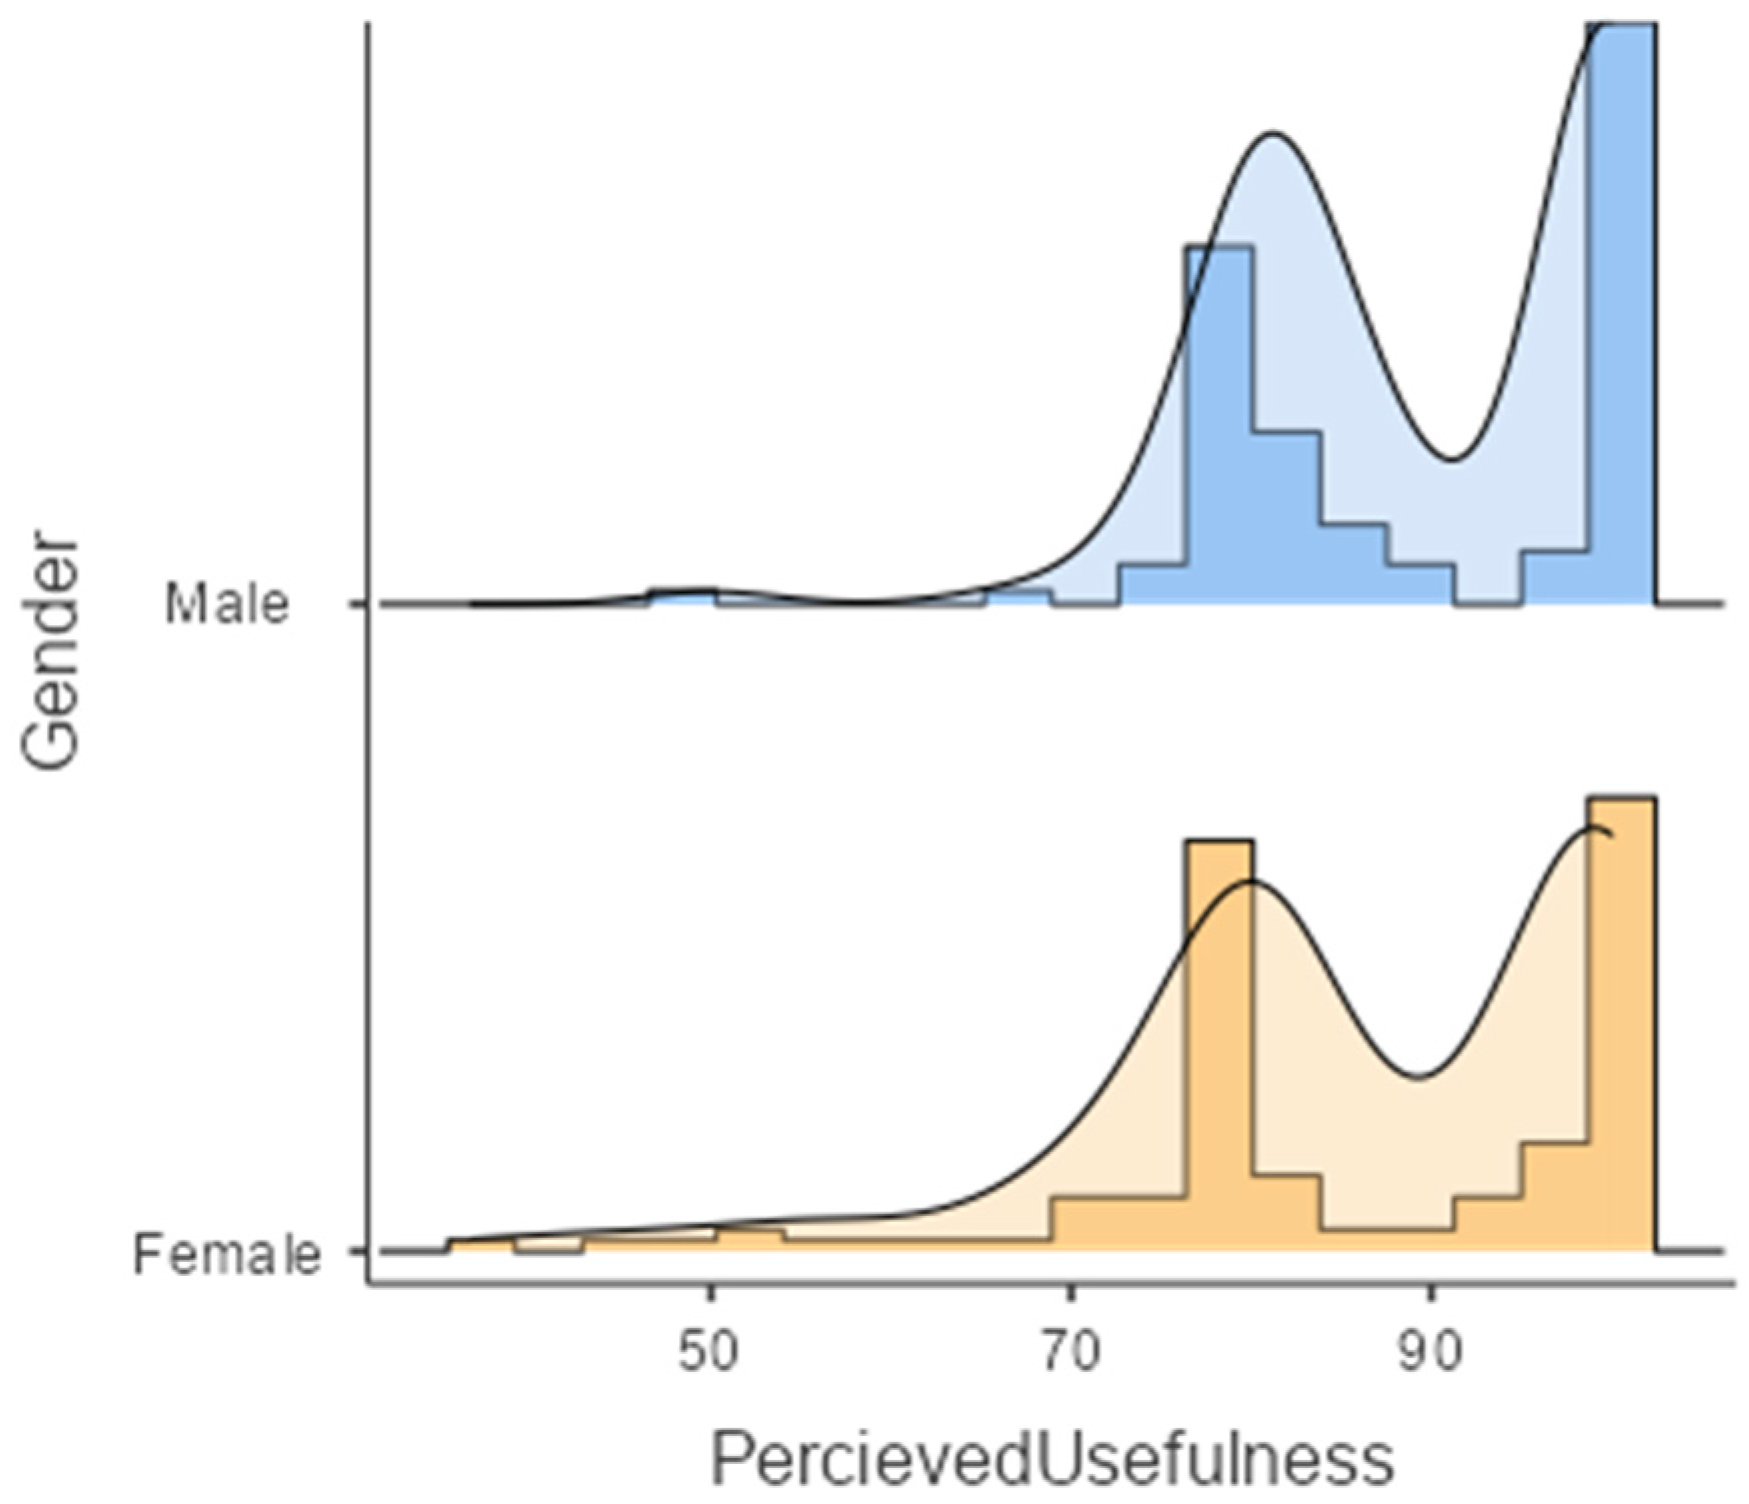
Figure 5 depicts Perceived Usefulness Scores grouped by the Gender of participants in the form of a Histogram and Density Plot. Table S9 in Supplementary Materials, normality was not ensured for all groups. Table S10 in Supplementary Materials provides the results of the test on group differences. The results indicate that being male or female changes the Perception of Usefulness of BIM Tools. When the means of the two group scores were investigated to gain a deeper understanding of this difference, it appeared that Females had a more positive Perception of Usefulness for BIM Tools compared to Males (89.6 > 86.3).

3.1.5. The Influence of Being a Student on Usefulness Perception

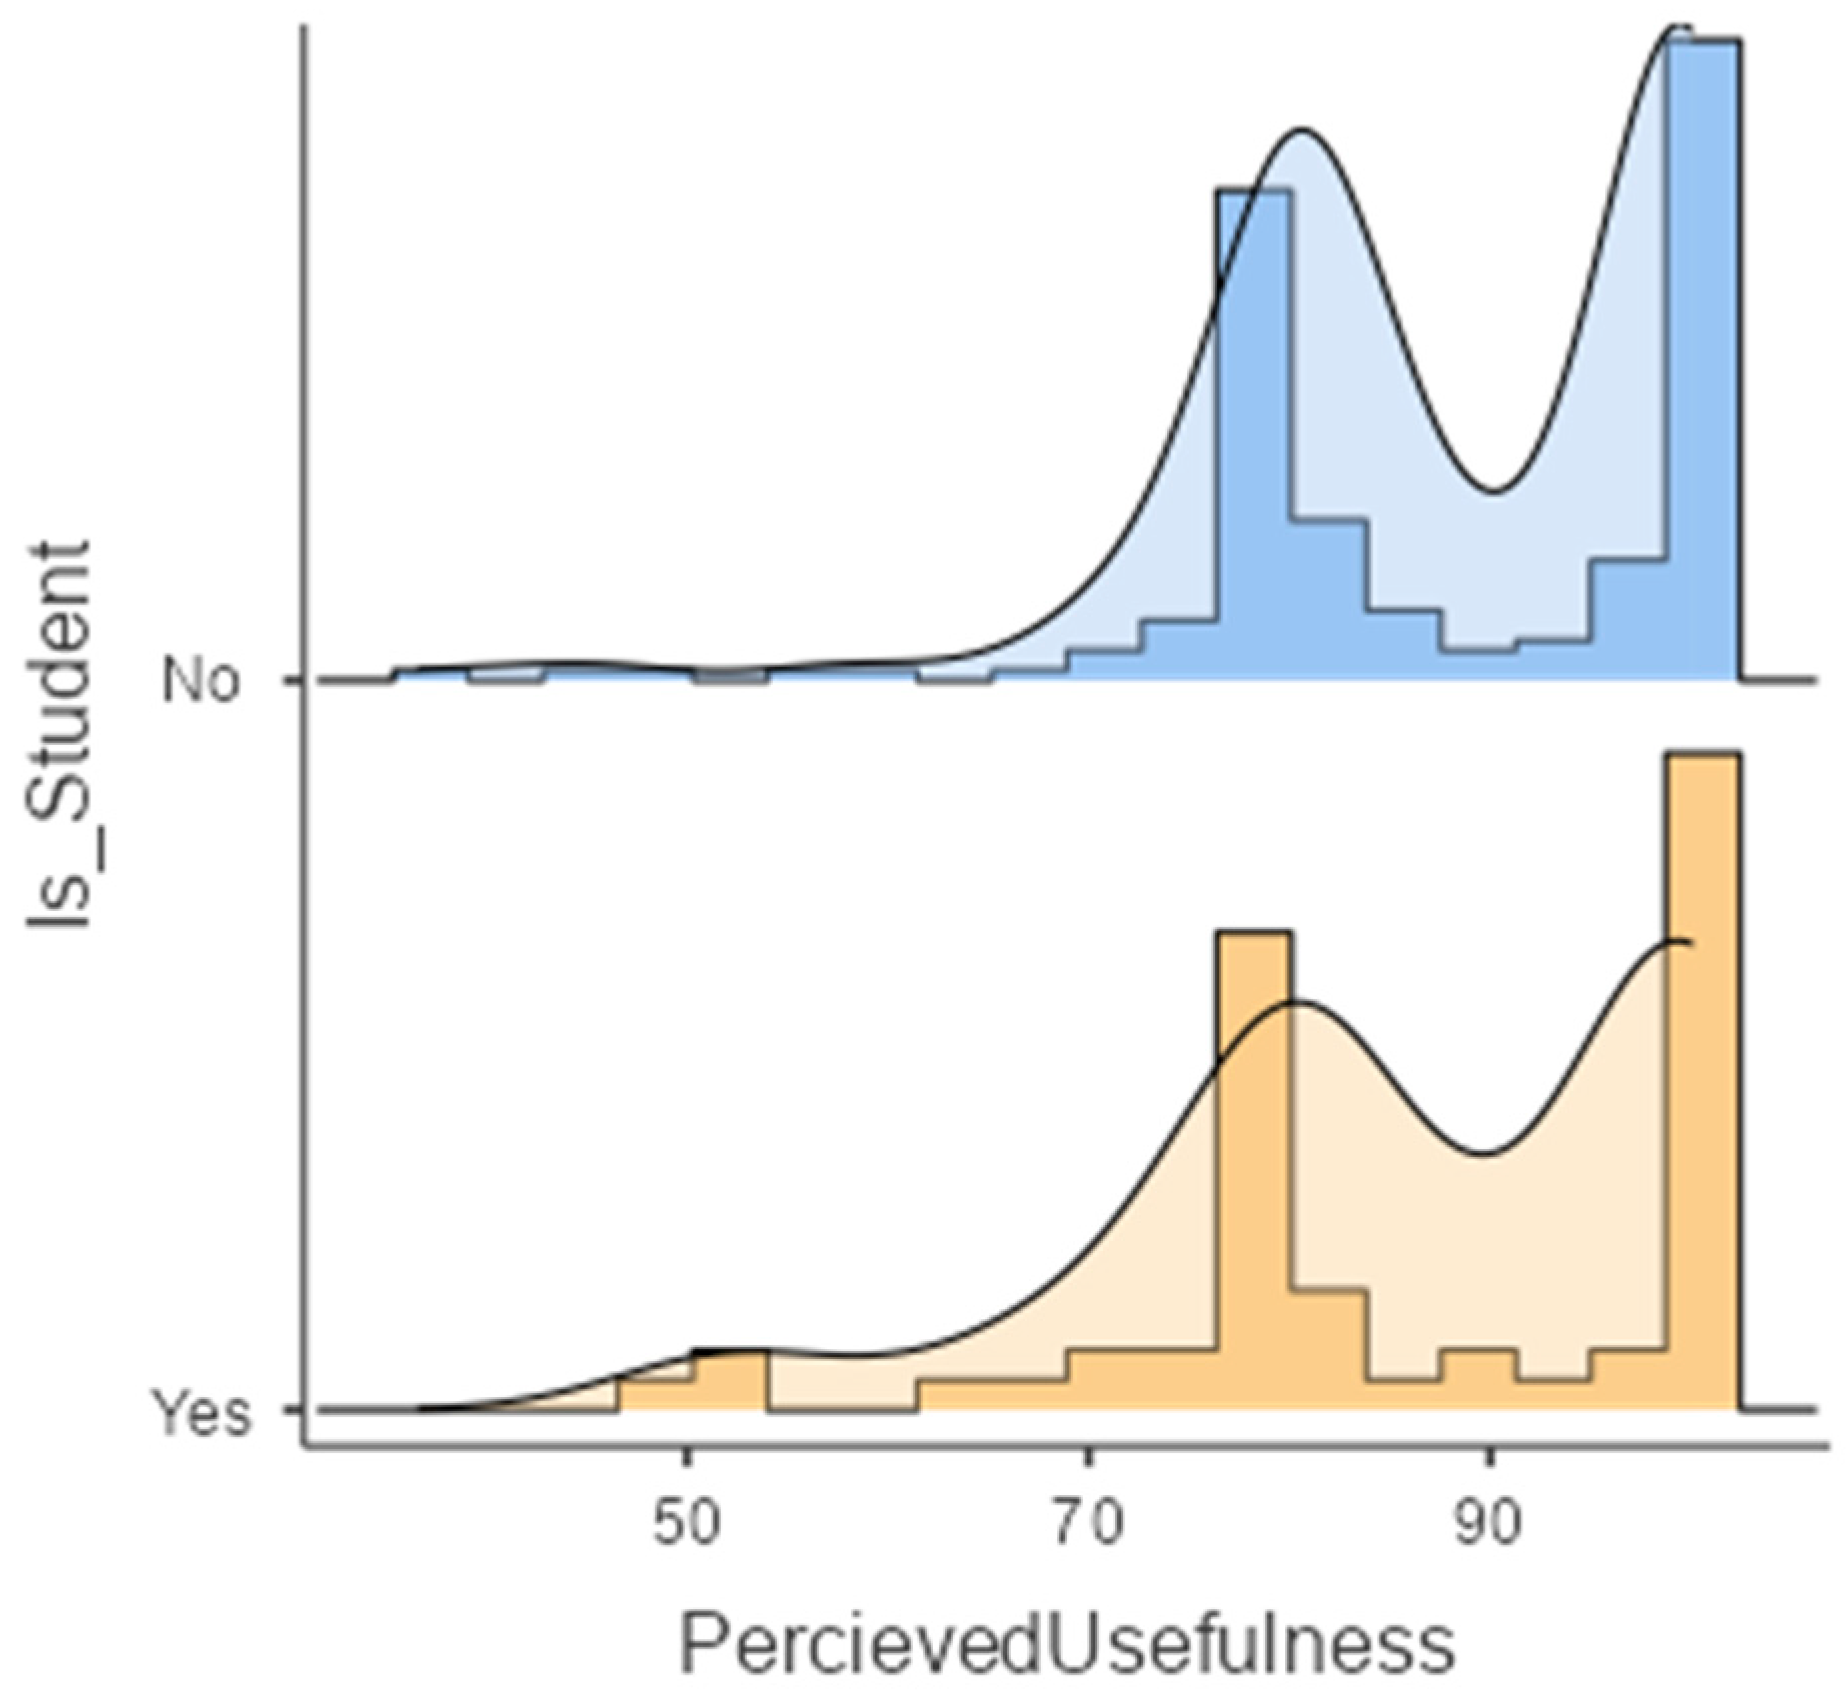
Figure 6 shows the Perceived Usefulness Scores grouped by the Student Status of participants in the form of a Histogram and Density Plot. In Table S11 in Supplementary Materials, normality was not ensured for all groups. Table S12 in Supplementary Materials provides the results of the test on group differences. The results of tests indicated that being a student or not does not have any influence on Usefulness Perception for BIM Tools.

3.1.6. The Influence of Computing Habits on Usefulness Perception

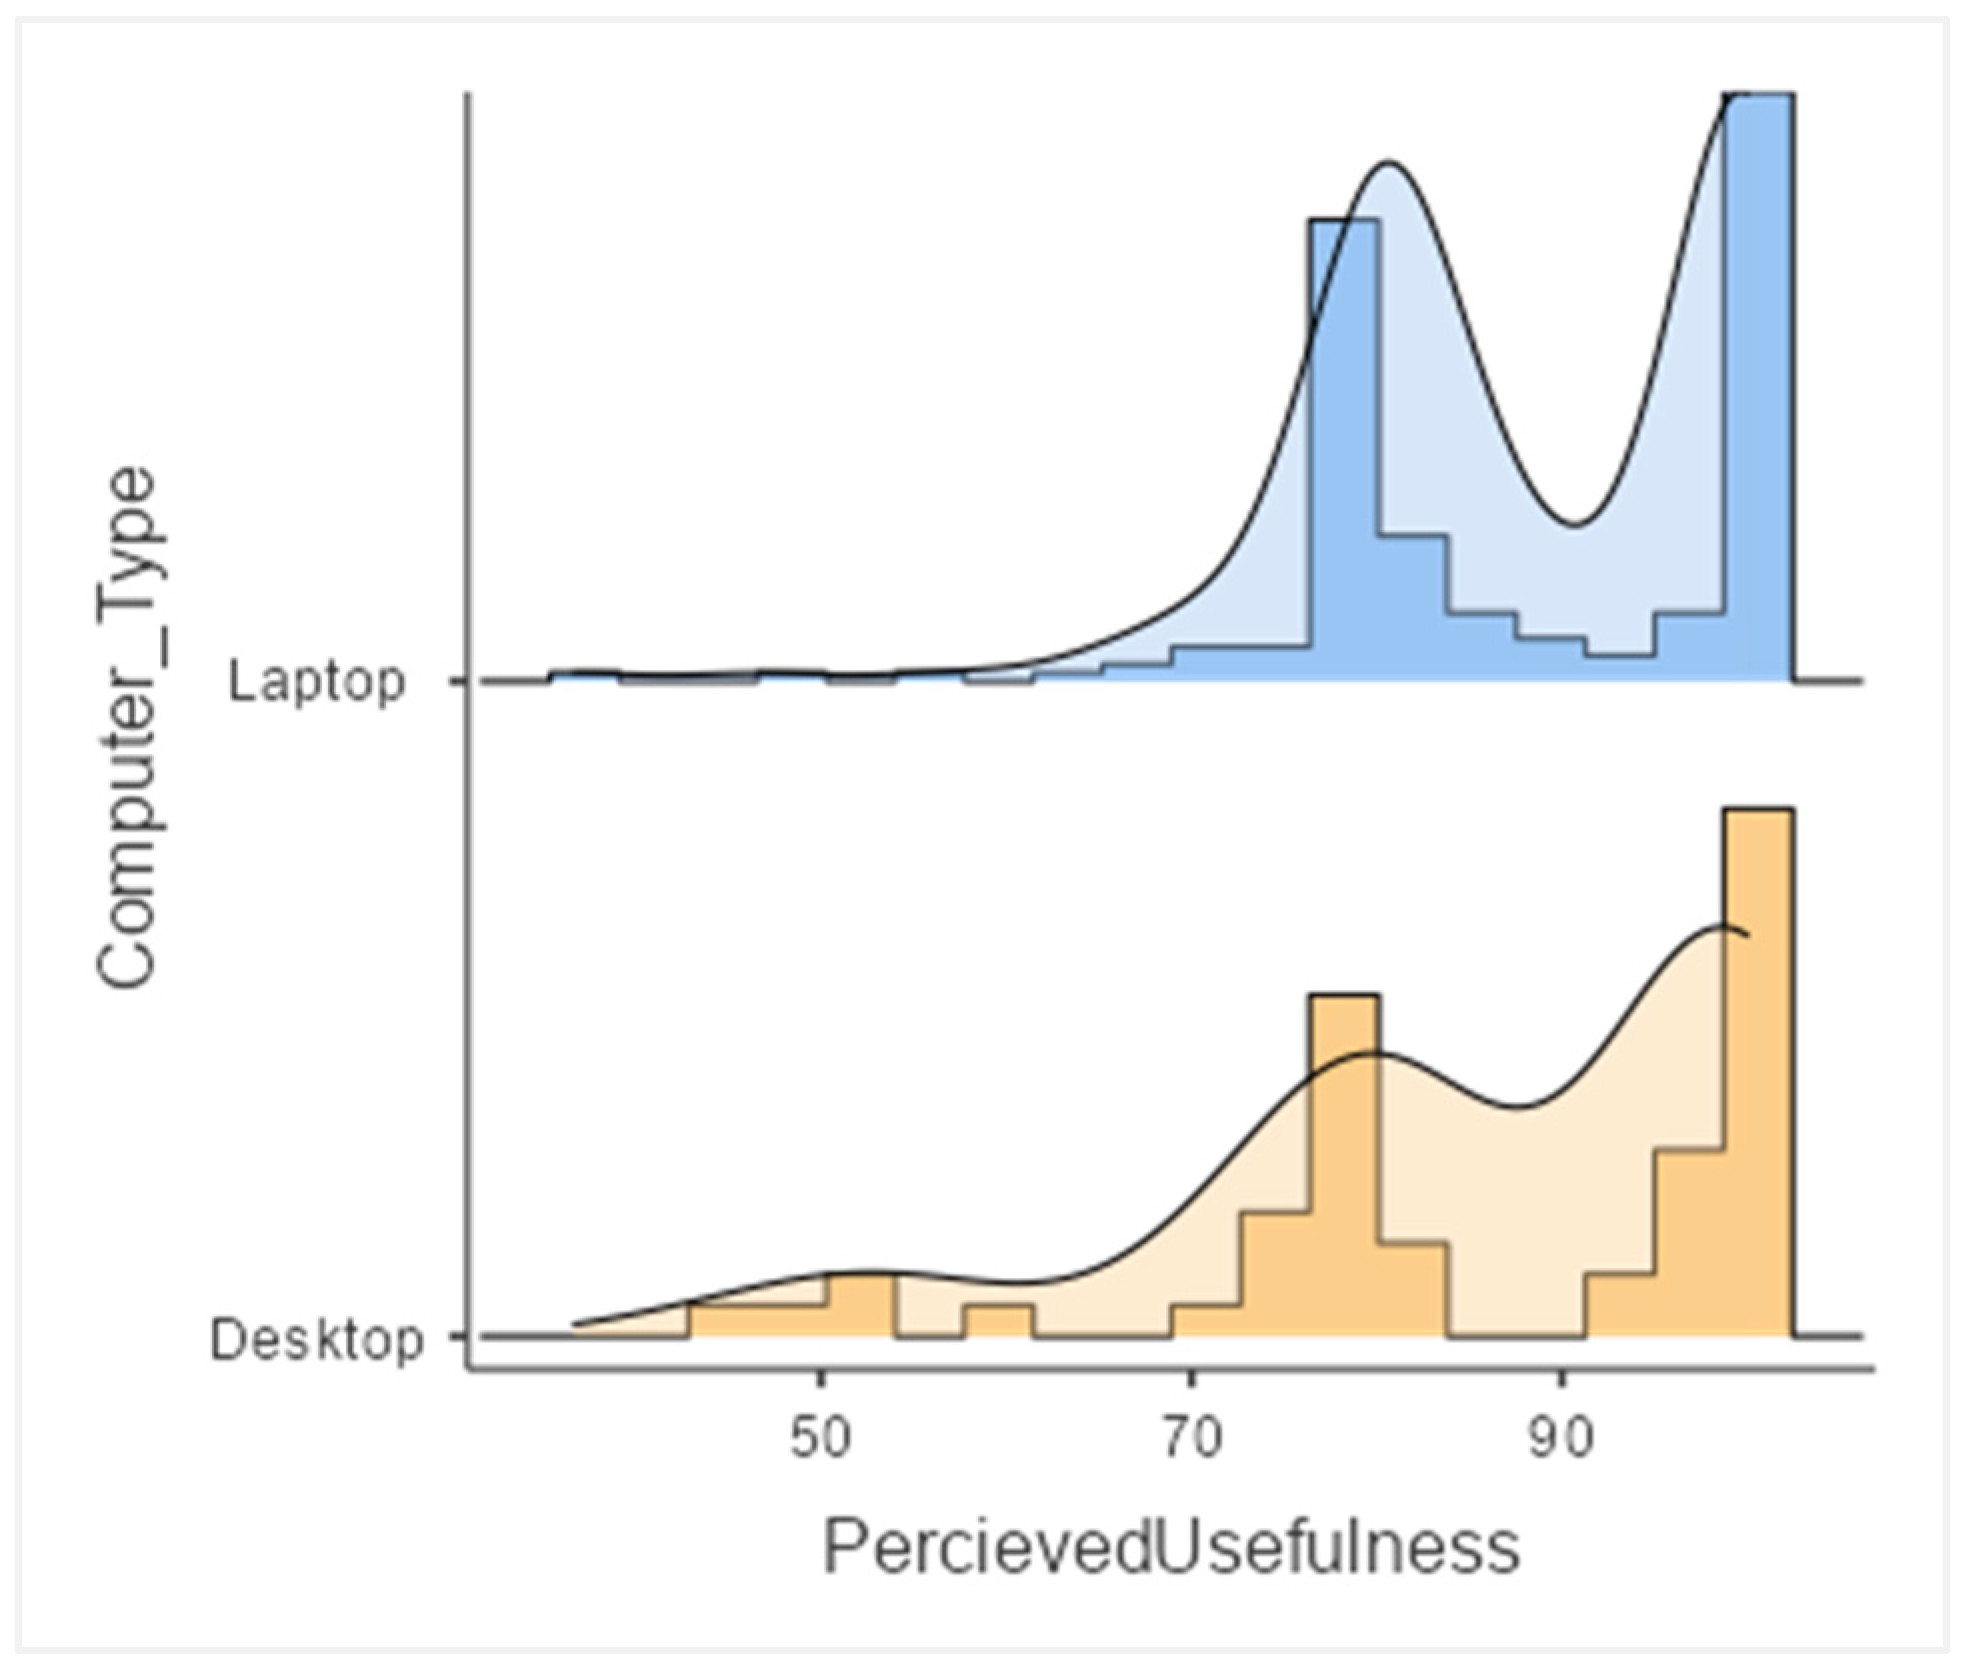
Figure 7 shows Perceived Usefulness Scores grouped by the type of primary computer (PC) used by participants in the form of a Histogram and Density Plot. In Table S13 in Supplementary Materials, normality was not ensured for all groups. Table S14 in Supplementary Materials provides the results of the test on group differences. The results indicated that the type of personal computer used, where tools are used, does not have any influence on the Usefulness Perception of BIM Tools.

3.1.7. The Influence of Being a Gamer on Usefulness Perception

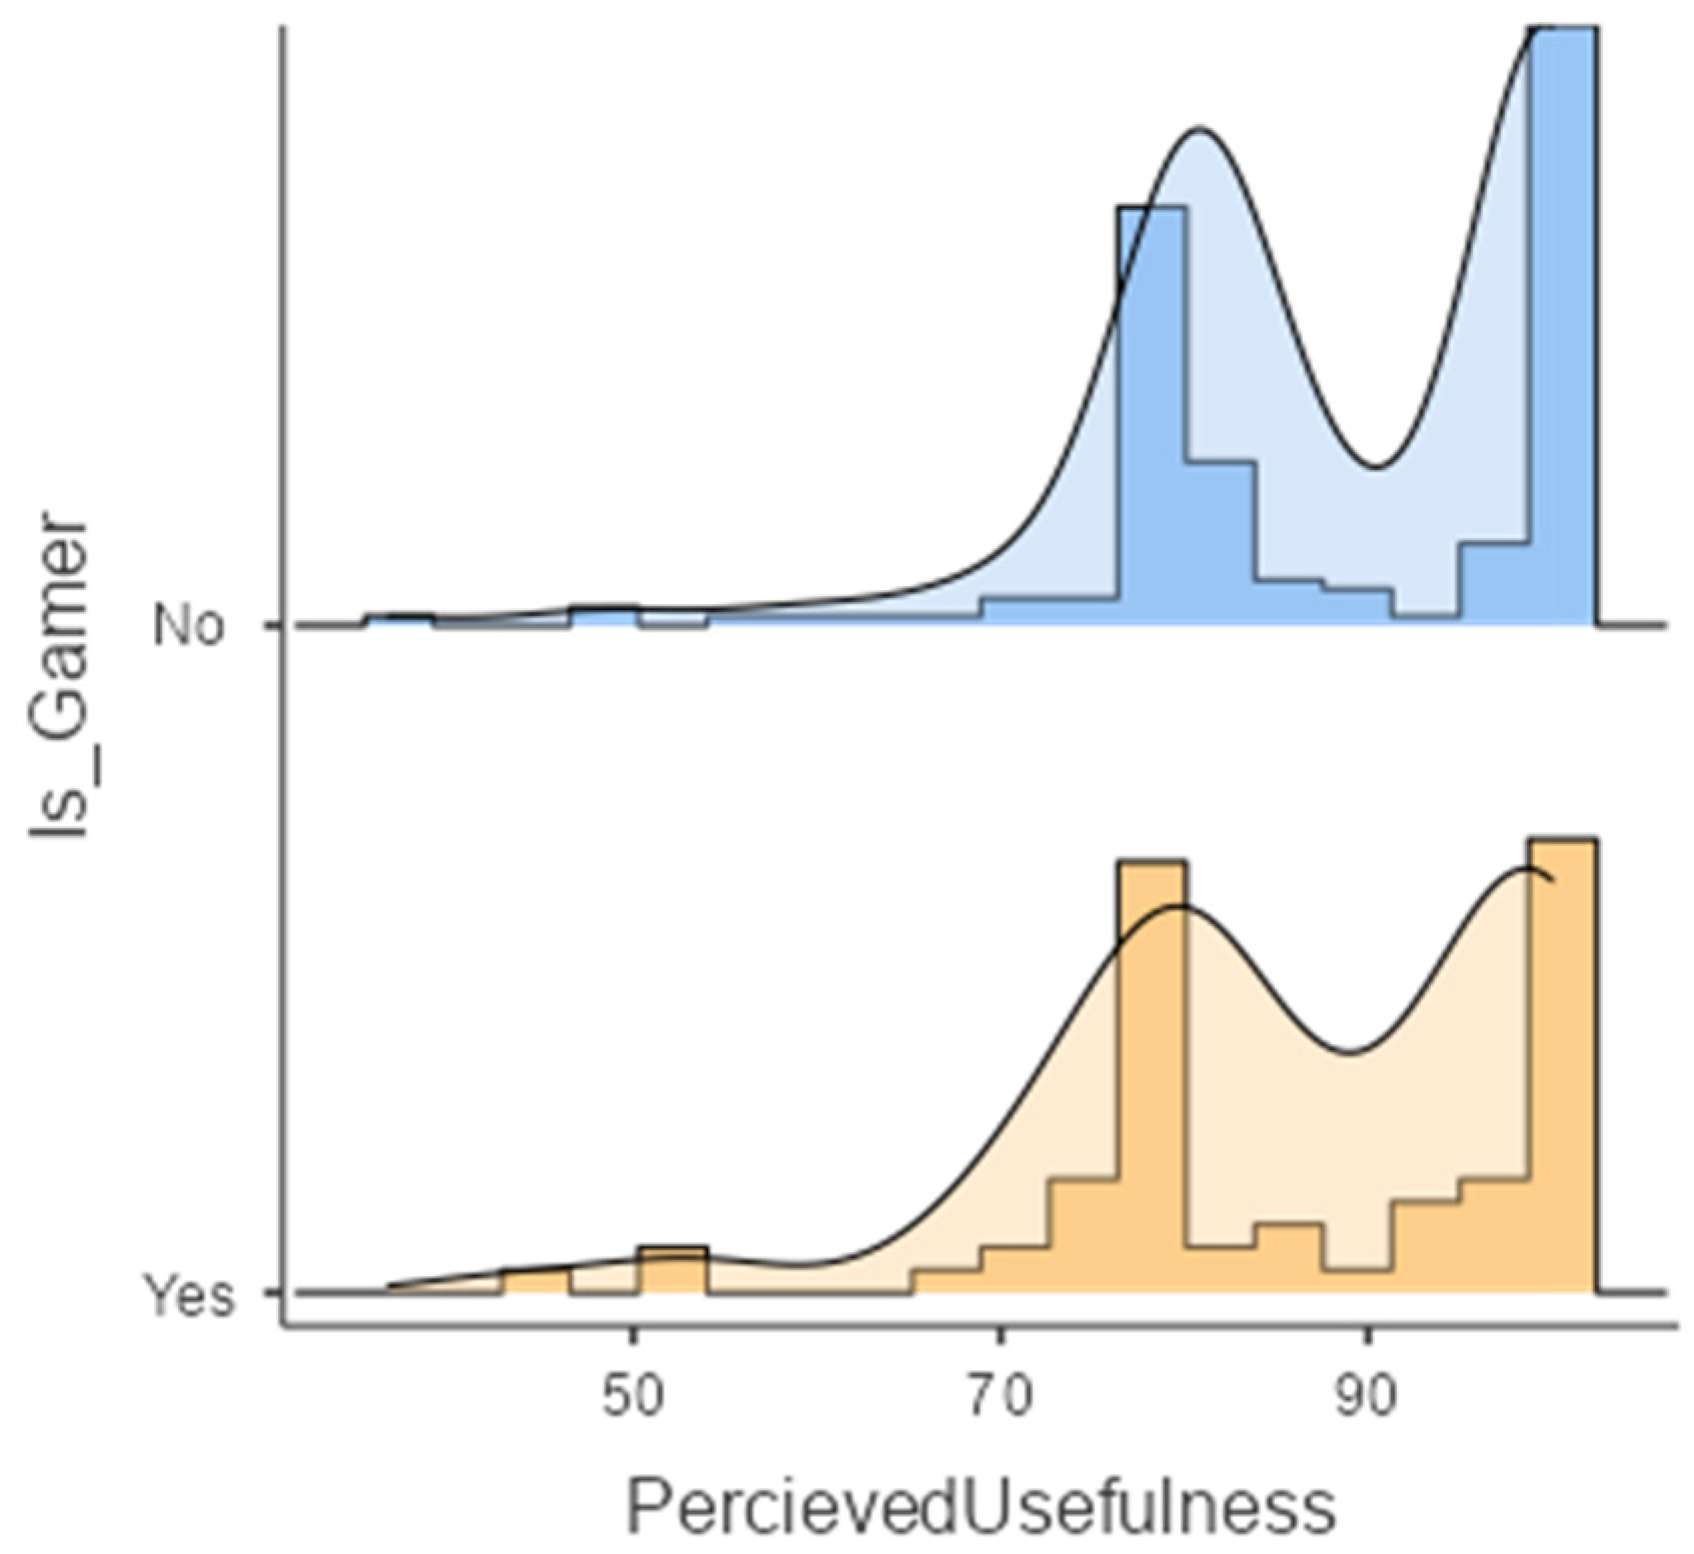
Figure 8 provides Perceived Usefulness Scores grouped by Gamer Status in the form of a Histogram and Density Plot.
In Table S15 in Supplementary Materials, normality was not ensured for all groups. Table S16 in Supplementary Materials provides the results of the test on group differences. The results show that being a Gamer (i.e., in terms of having experience with the use of 3D environments in advance) does not have any influence on the Usefulness Perception of BIM Tools.

3.1.8. The Influence of Training Type Preference on Usefulness Perception

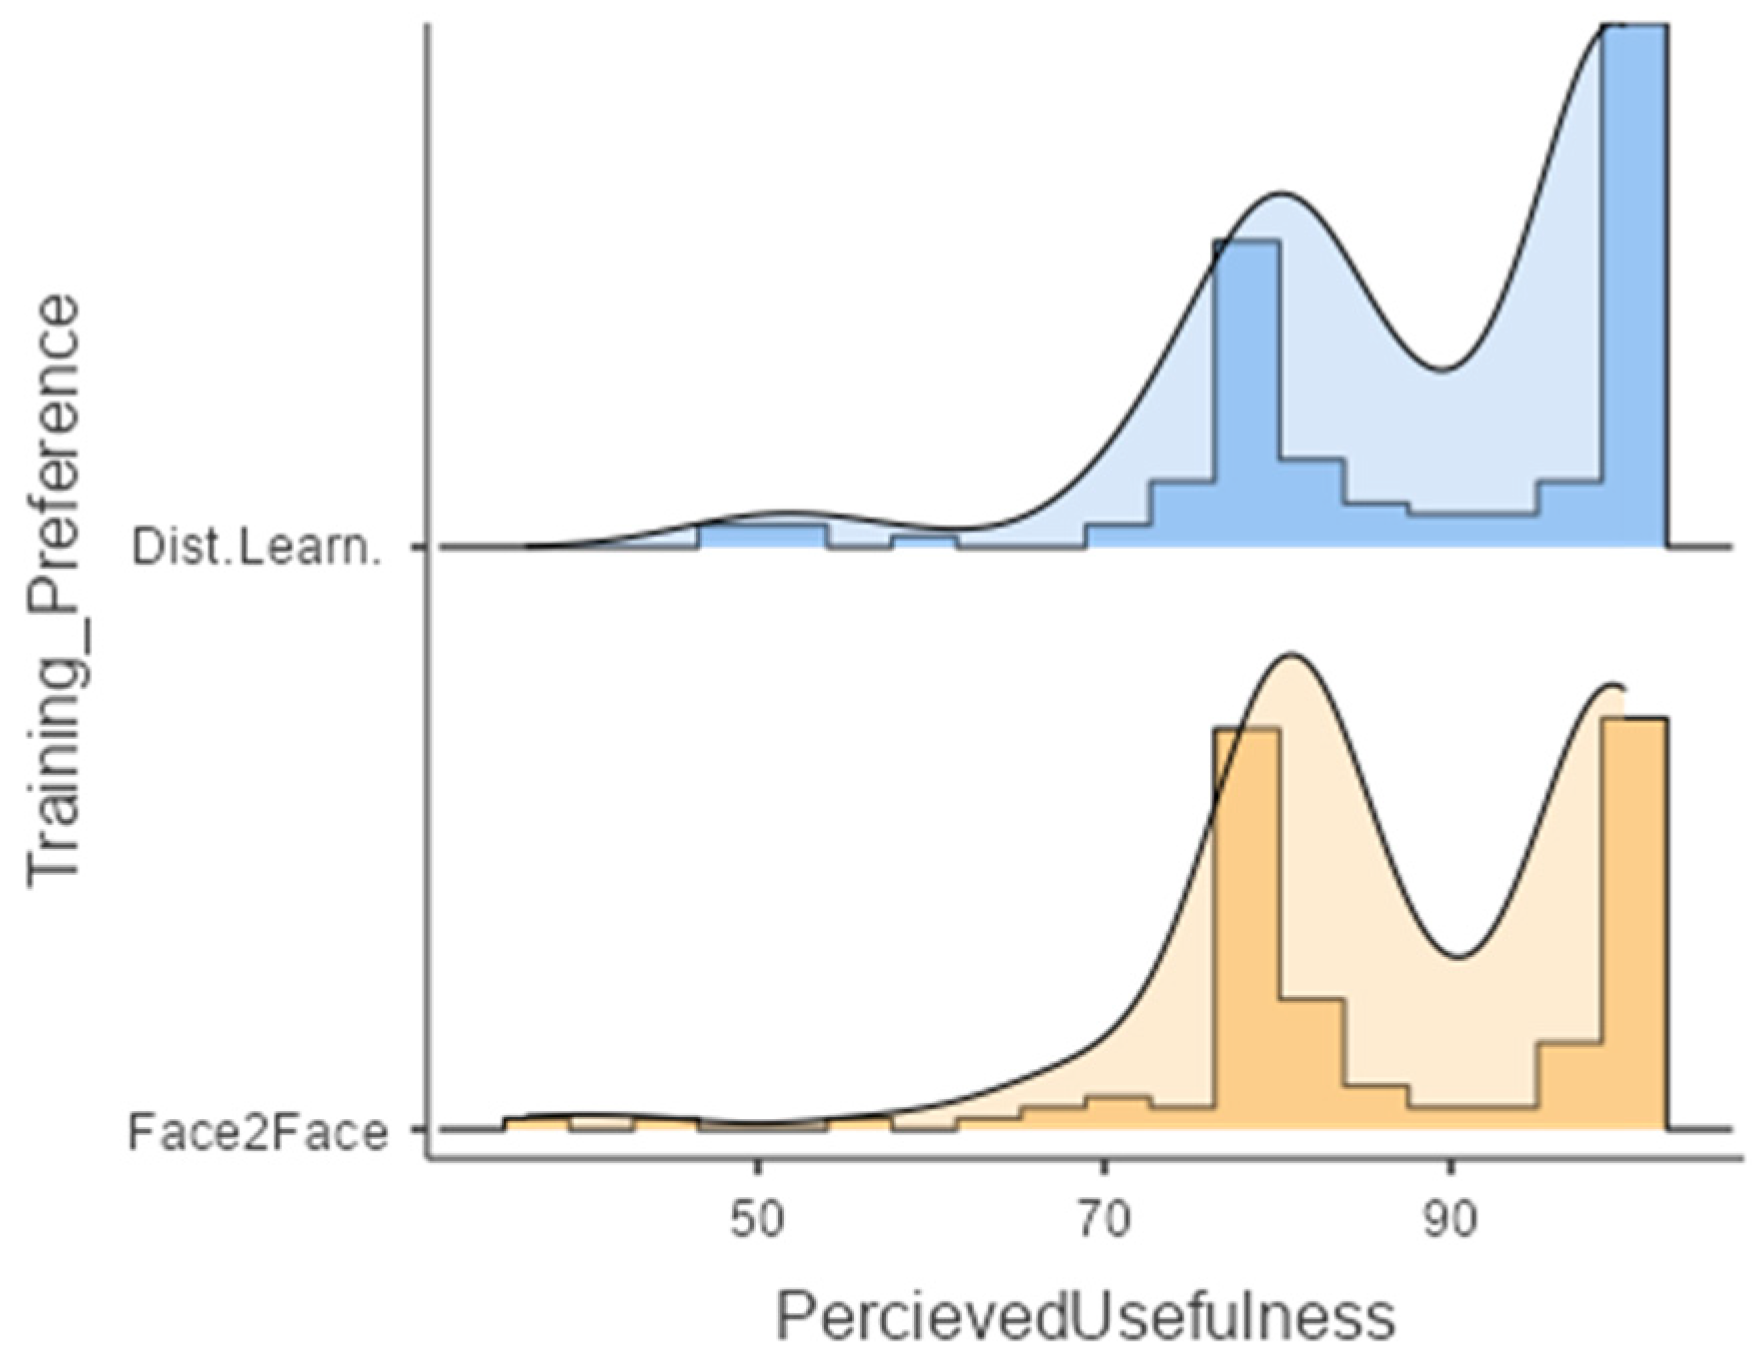
Figure 9 provides Perceived Usefulness Scores grouped by Training Preference in the form of a Histogram and Density Plot. Table S17 in Supplementary Materials demonstrates that normality was not ensured for all groups. Table S18 in Supplementary Materials provides the results of the test on group differences. The results indicated that users who preferred Face2Face training did not perceive the usefulness of BIM Tools differently from users who preferred online training.

3.1.9. The Influence of Experience in Coding on Usefulness Perception

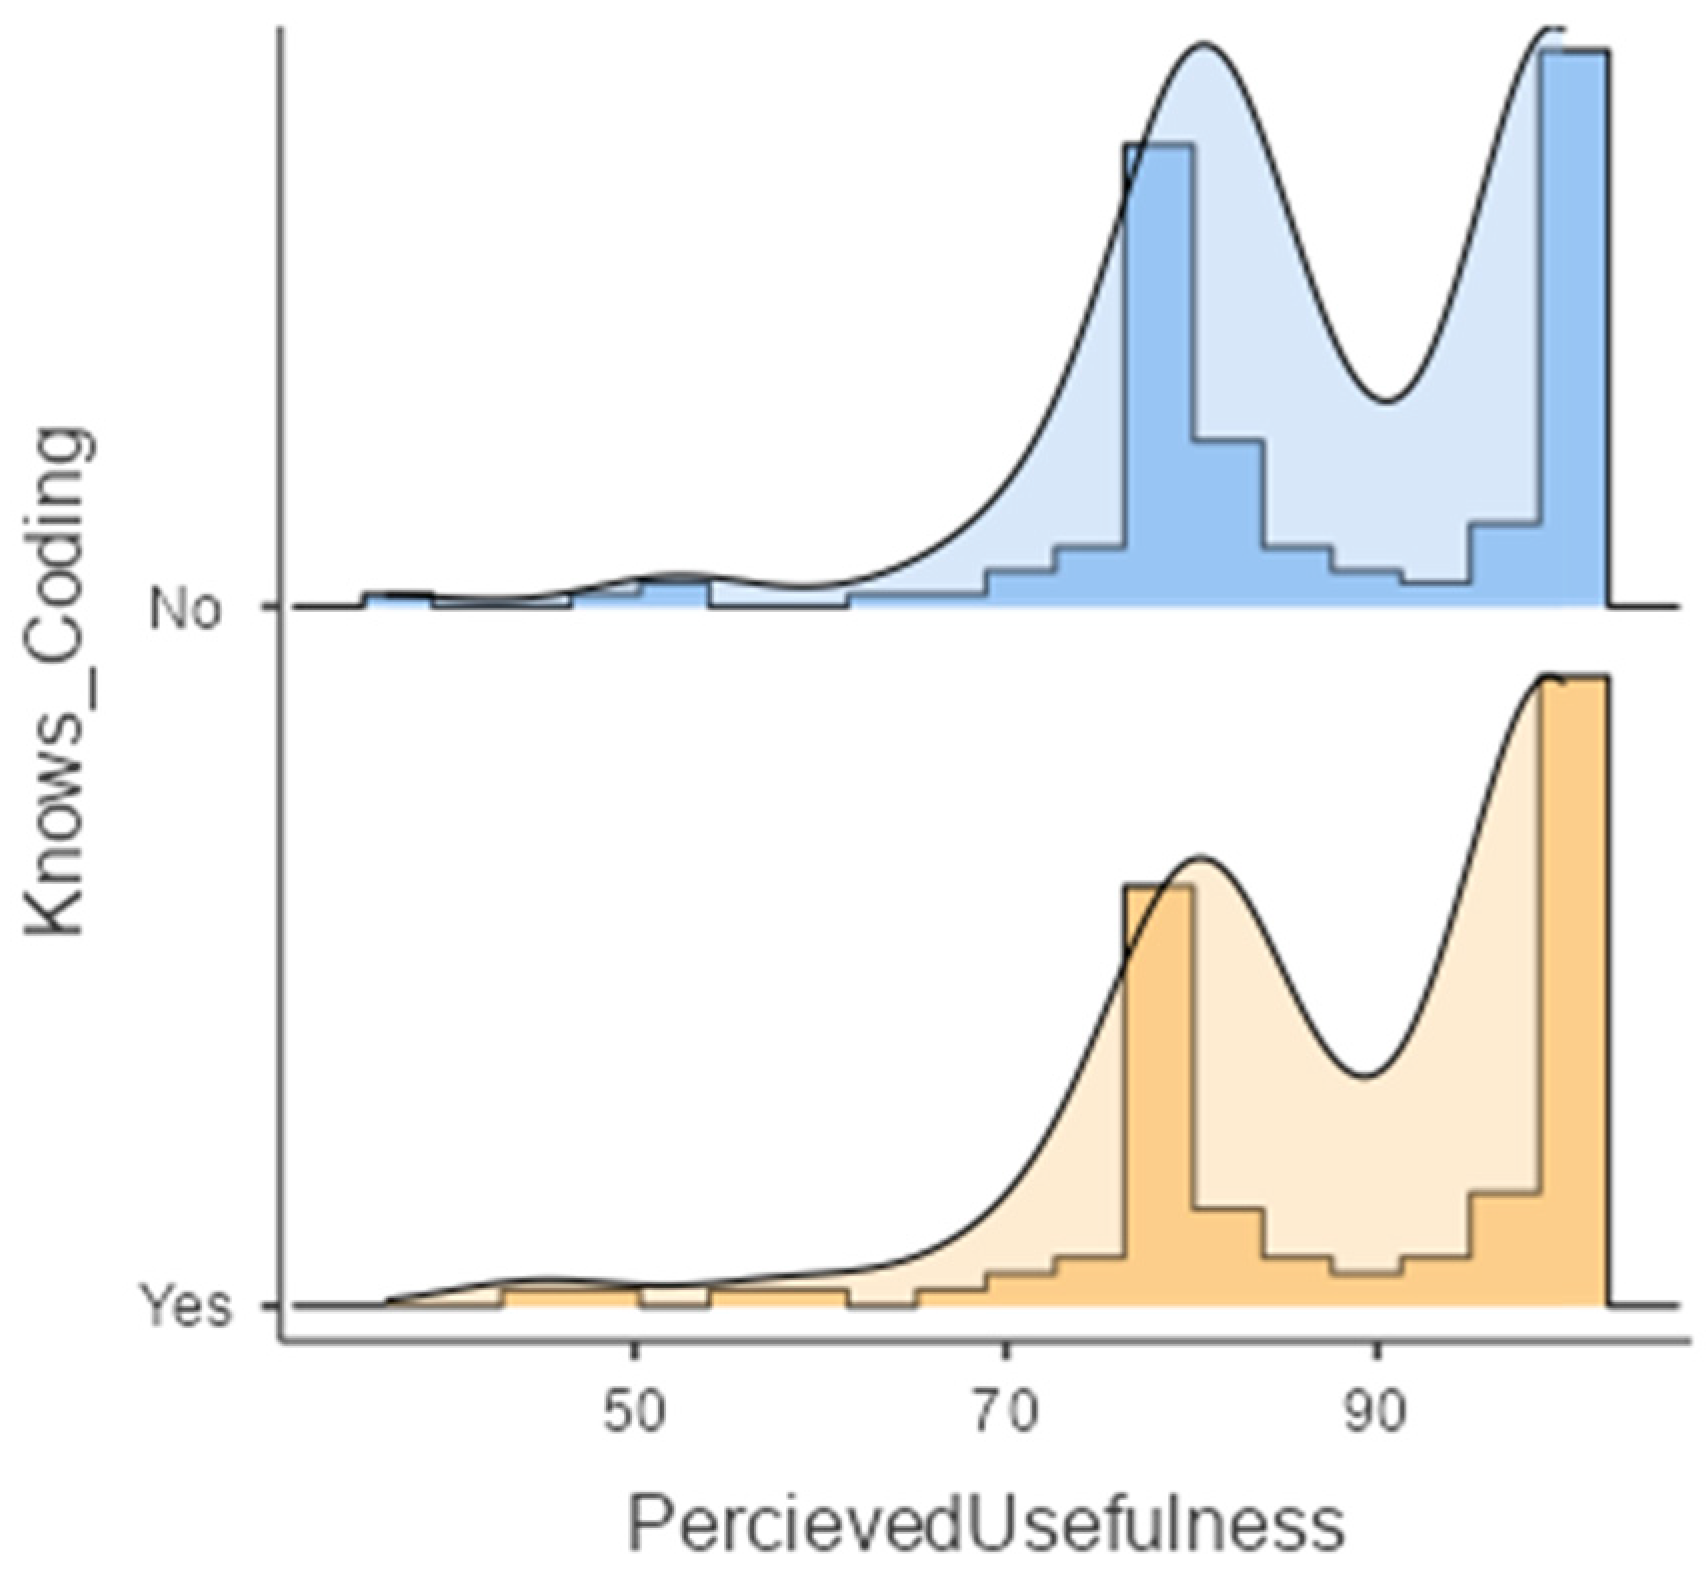
Figure 10 provides Perceived Usefulness Scores grouped by Coding Experience in the form of a Histogram and Density Plot. Table S19 in Supplementary Materials demonstrates that normality was not ensured for all groups. Table S20 in Supplementary Materials provides the results of the test on group differences. The results indicated that prior knowledge of advanced computing, even at a coding level, did not influence the perception of the usefulness of BIM Tools.

3.1.10. The Influence of Having Taken Academic Courses on BIM Before on Usefulness Perception

Figure 11 illustrates the Perceived Usefulness Scores grouped by Having Taken Academic Courses on BIM Before in the form of Histogram and Density Plots. Table S21 in Supplementary Materials demonstrates that normality was not ensured for all groups. Table S22 in Supplementary Materials provides the results of the test on group differences. The results indicated that Having Taken Academic Courses on BIM Before did not influence the perception of the usefulness of BIM Tools.

3.1.11. The Influence of Participation in a BIM Certification Training Program on Usefulness Perception

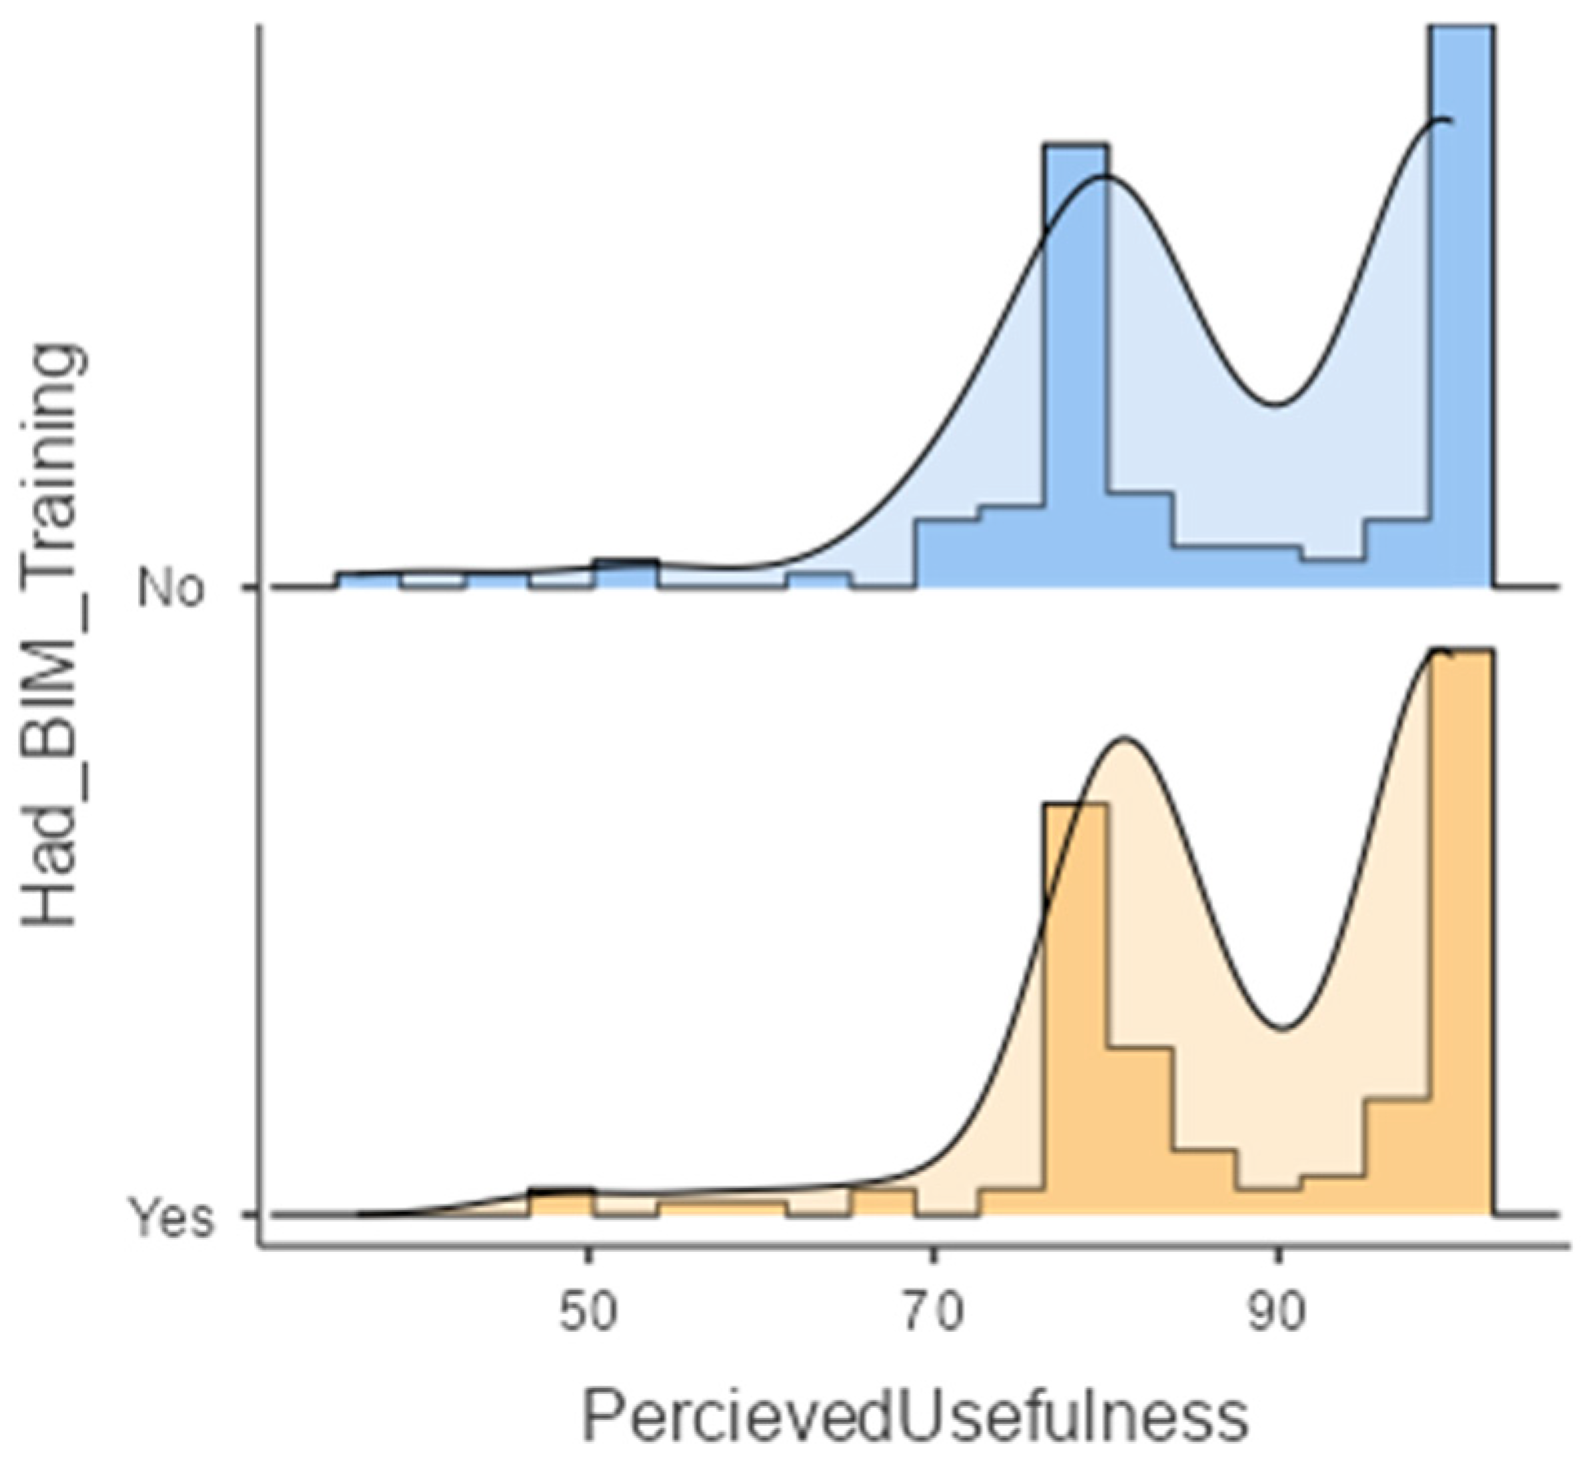
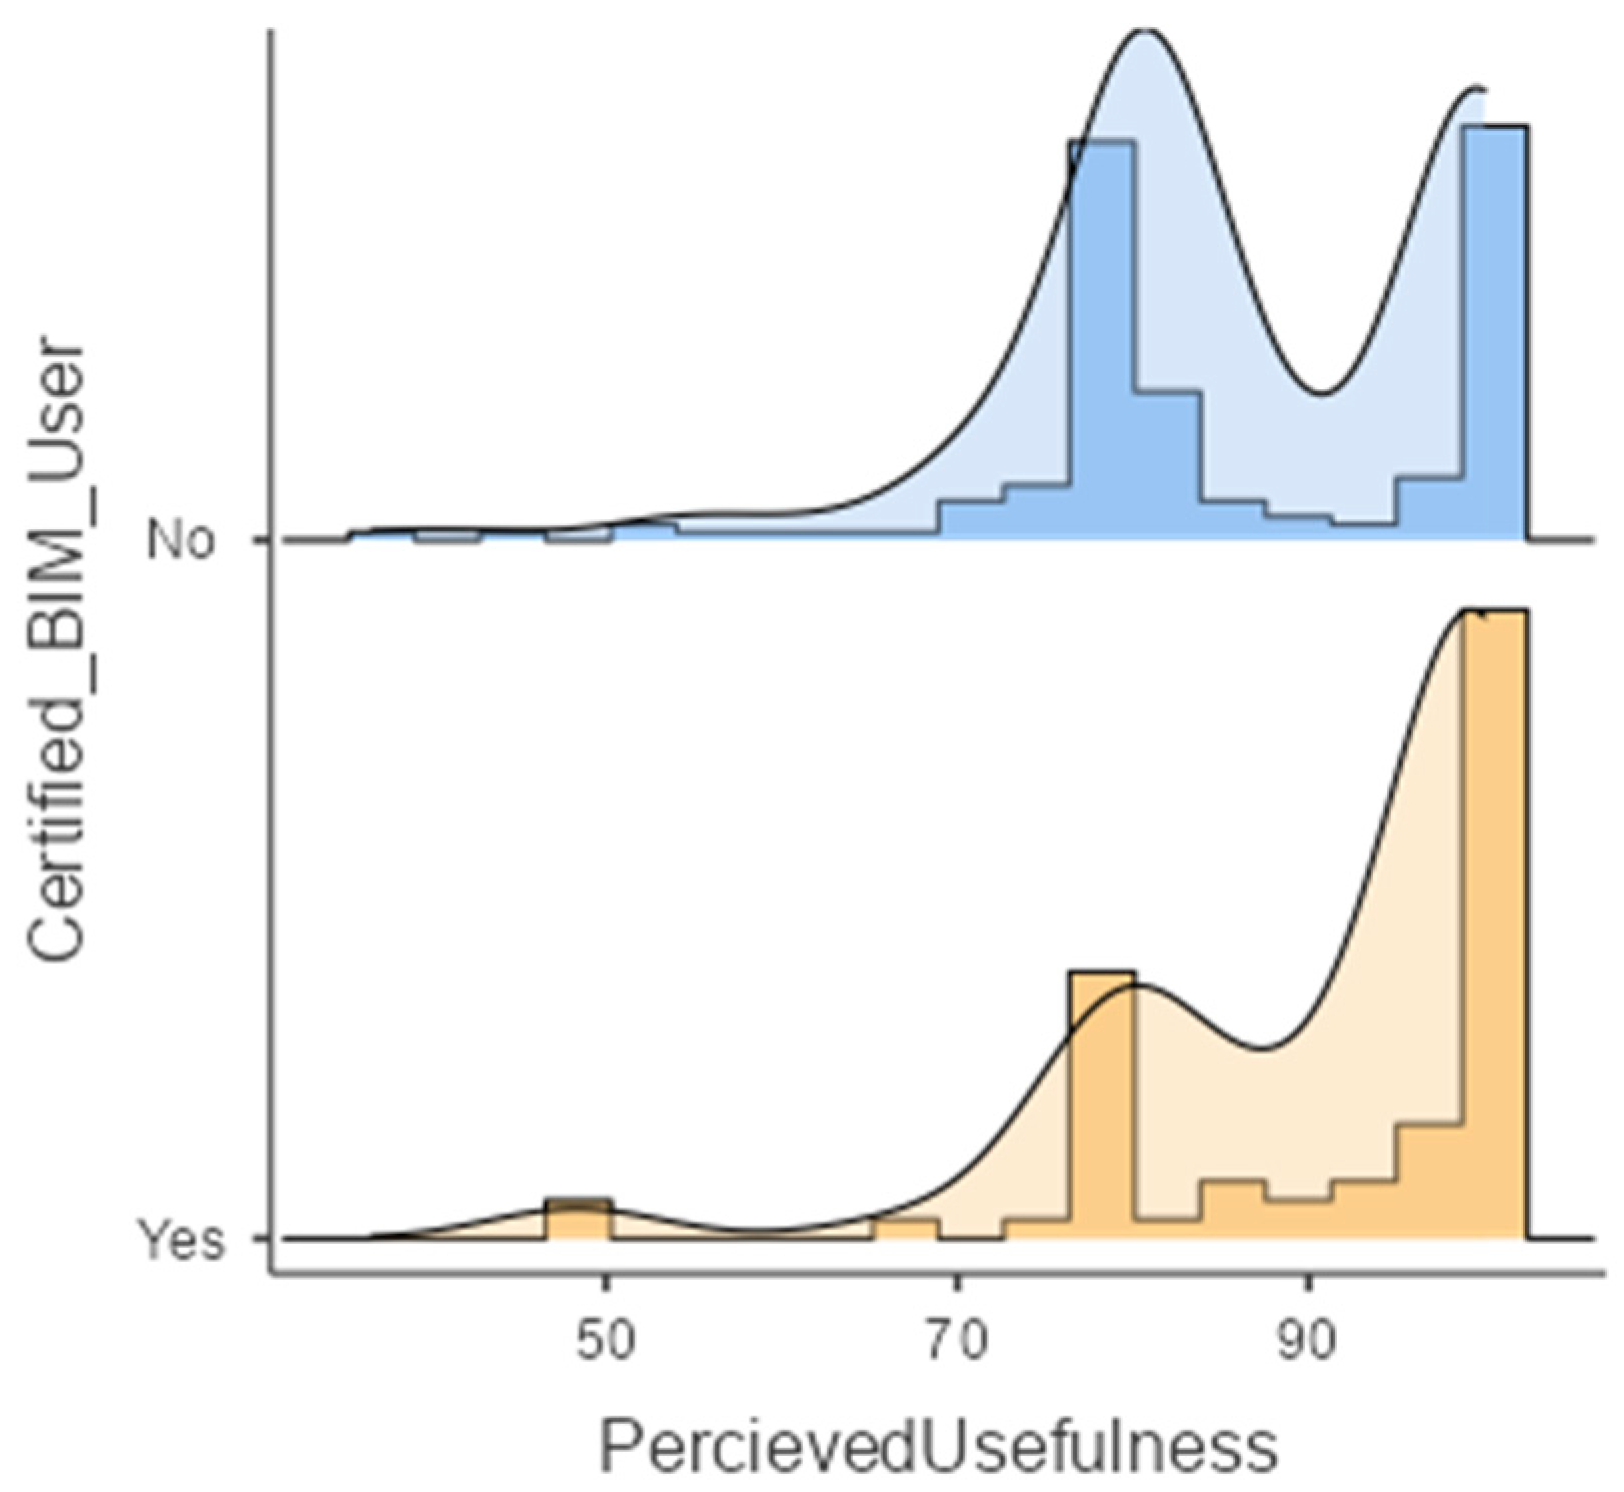
Figure 12 illustrates Perceived Usefulness Scores grouped by participation in a BIM certification training program in the form of a Histogram and Density Plot. Table S23 in Supplementary Materials demonstrates that normality was not ensured for all groups. Table S24 in Supplementary Materials provides the results of the test on group differences. The results show that participation in a BIM certification training program influenced the perception of the usefulness of BIM Tools. The people who had participated in BIM certification training programs had a more positive perception of the usefulness of BIM Tools.

3.2. Factors Influencing Ease of Use Perception

This section investigates the factors influencing the Ease of Use perception of the respondents for BIM tools through statistical hypothesis tests. The metric used to reprensent Usefulness perception was named the Perceived Ease of Use, and all tests explained in this section followed the same approach described earlier in the previous section.

3.2.1. The Influence of Age on Perception of Ease of Use

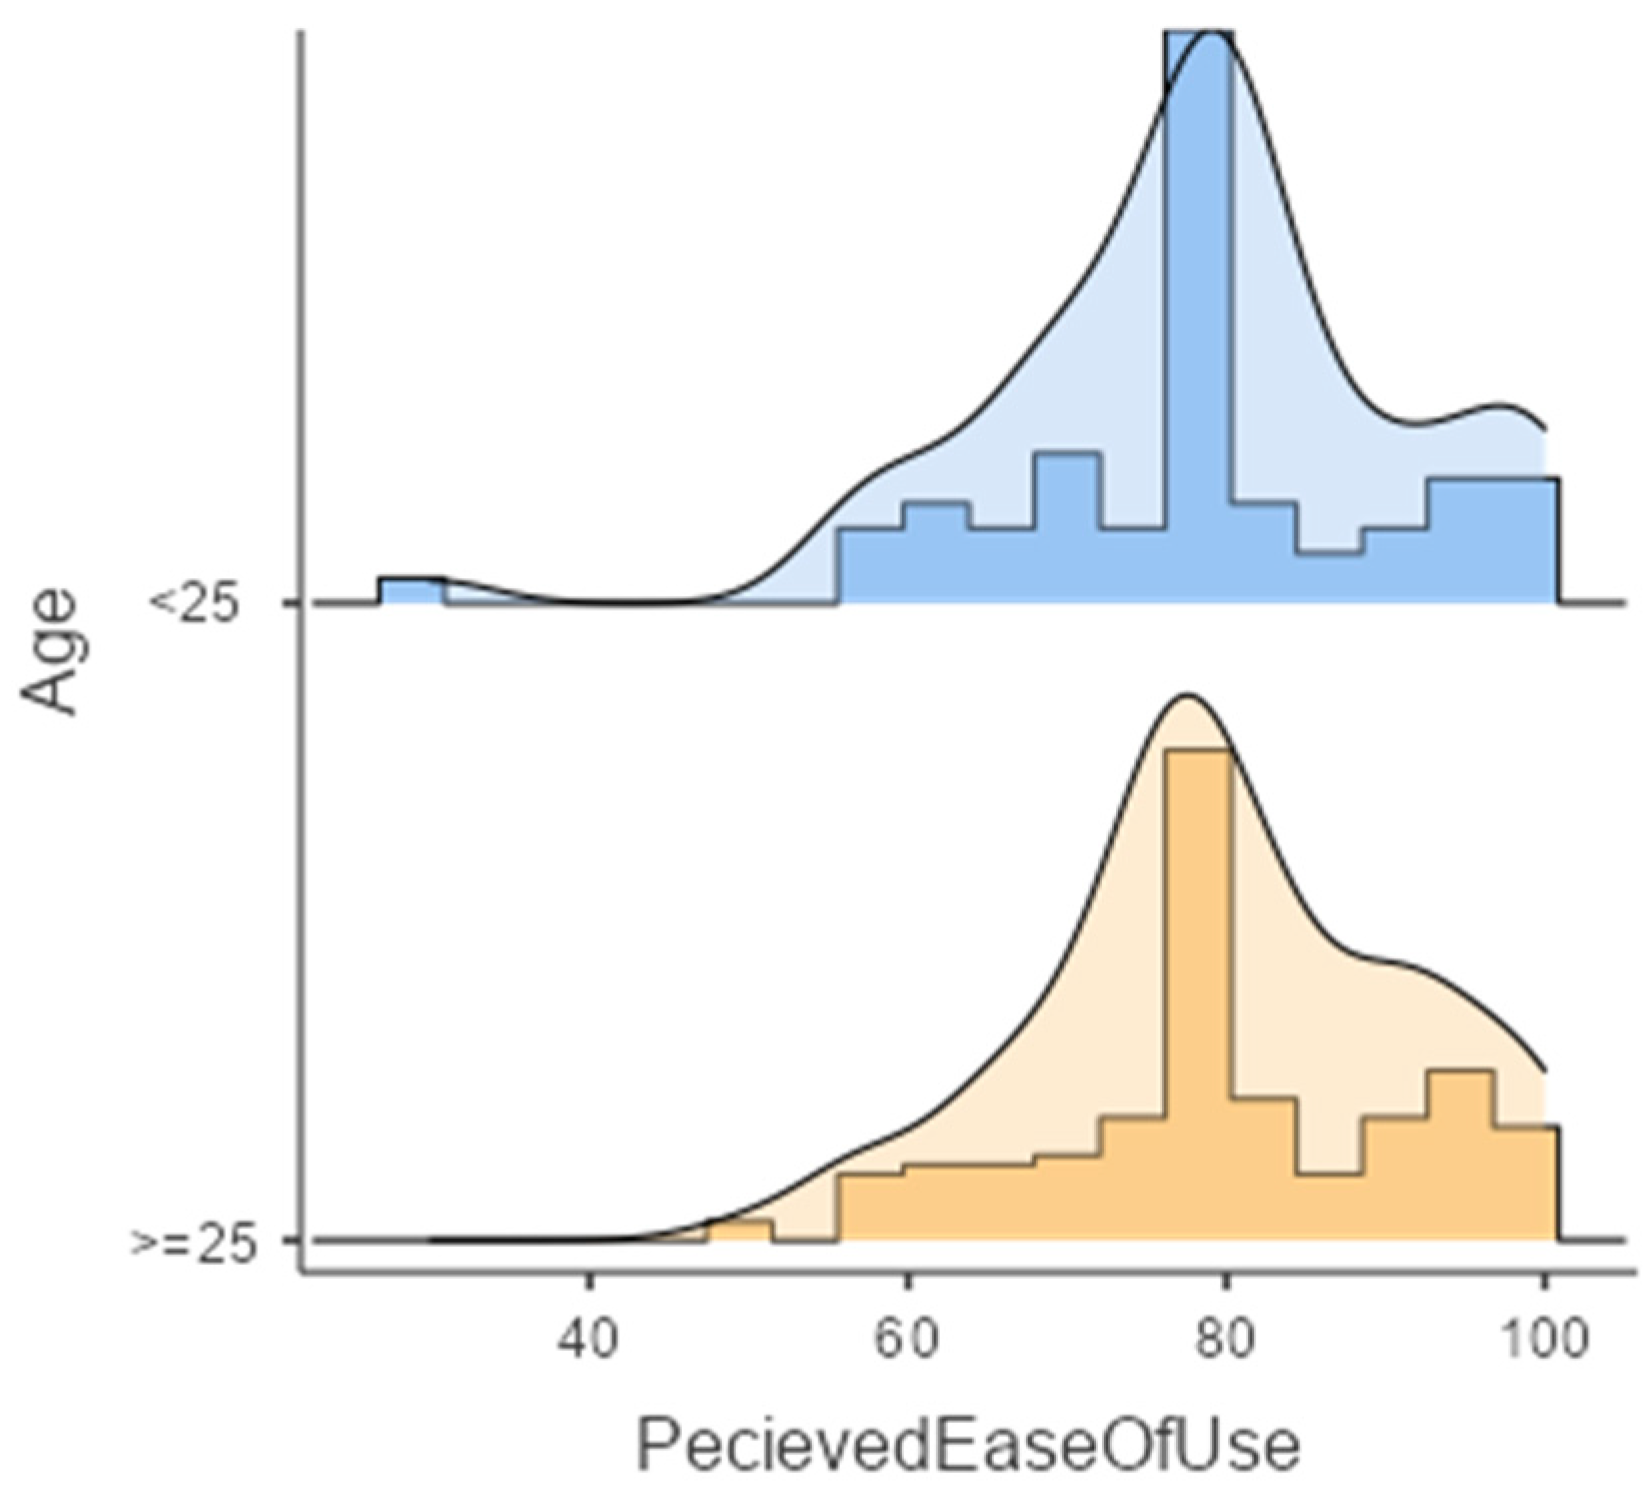
Figure 13 illustrates Perceived Usefulness Scores grouped by Age in the form of a Histogram and Density Plot. Table S25 in Supplementary Materials demonstrates that normality was not ensured for all groups. Table S26 in Supplementary Materials provides the results of the test on group differences. The results confirmed that, in terms of central tendency, the Age factor did not have any influence on the Ease-of-Use Perception of BIM Tools.

3.2.2. The Influence of Background on Perception of Ease of Use

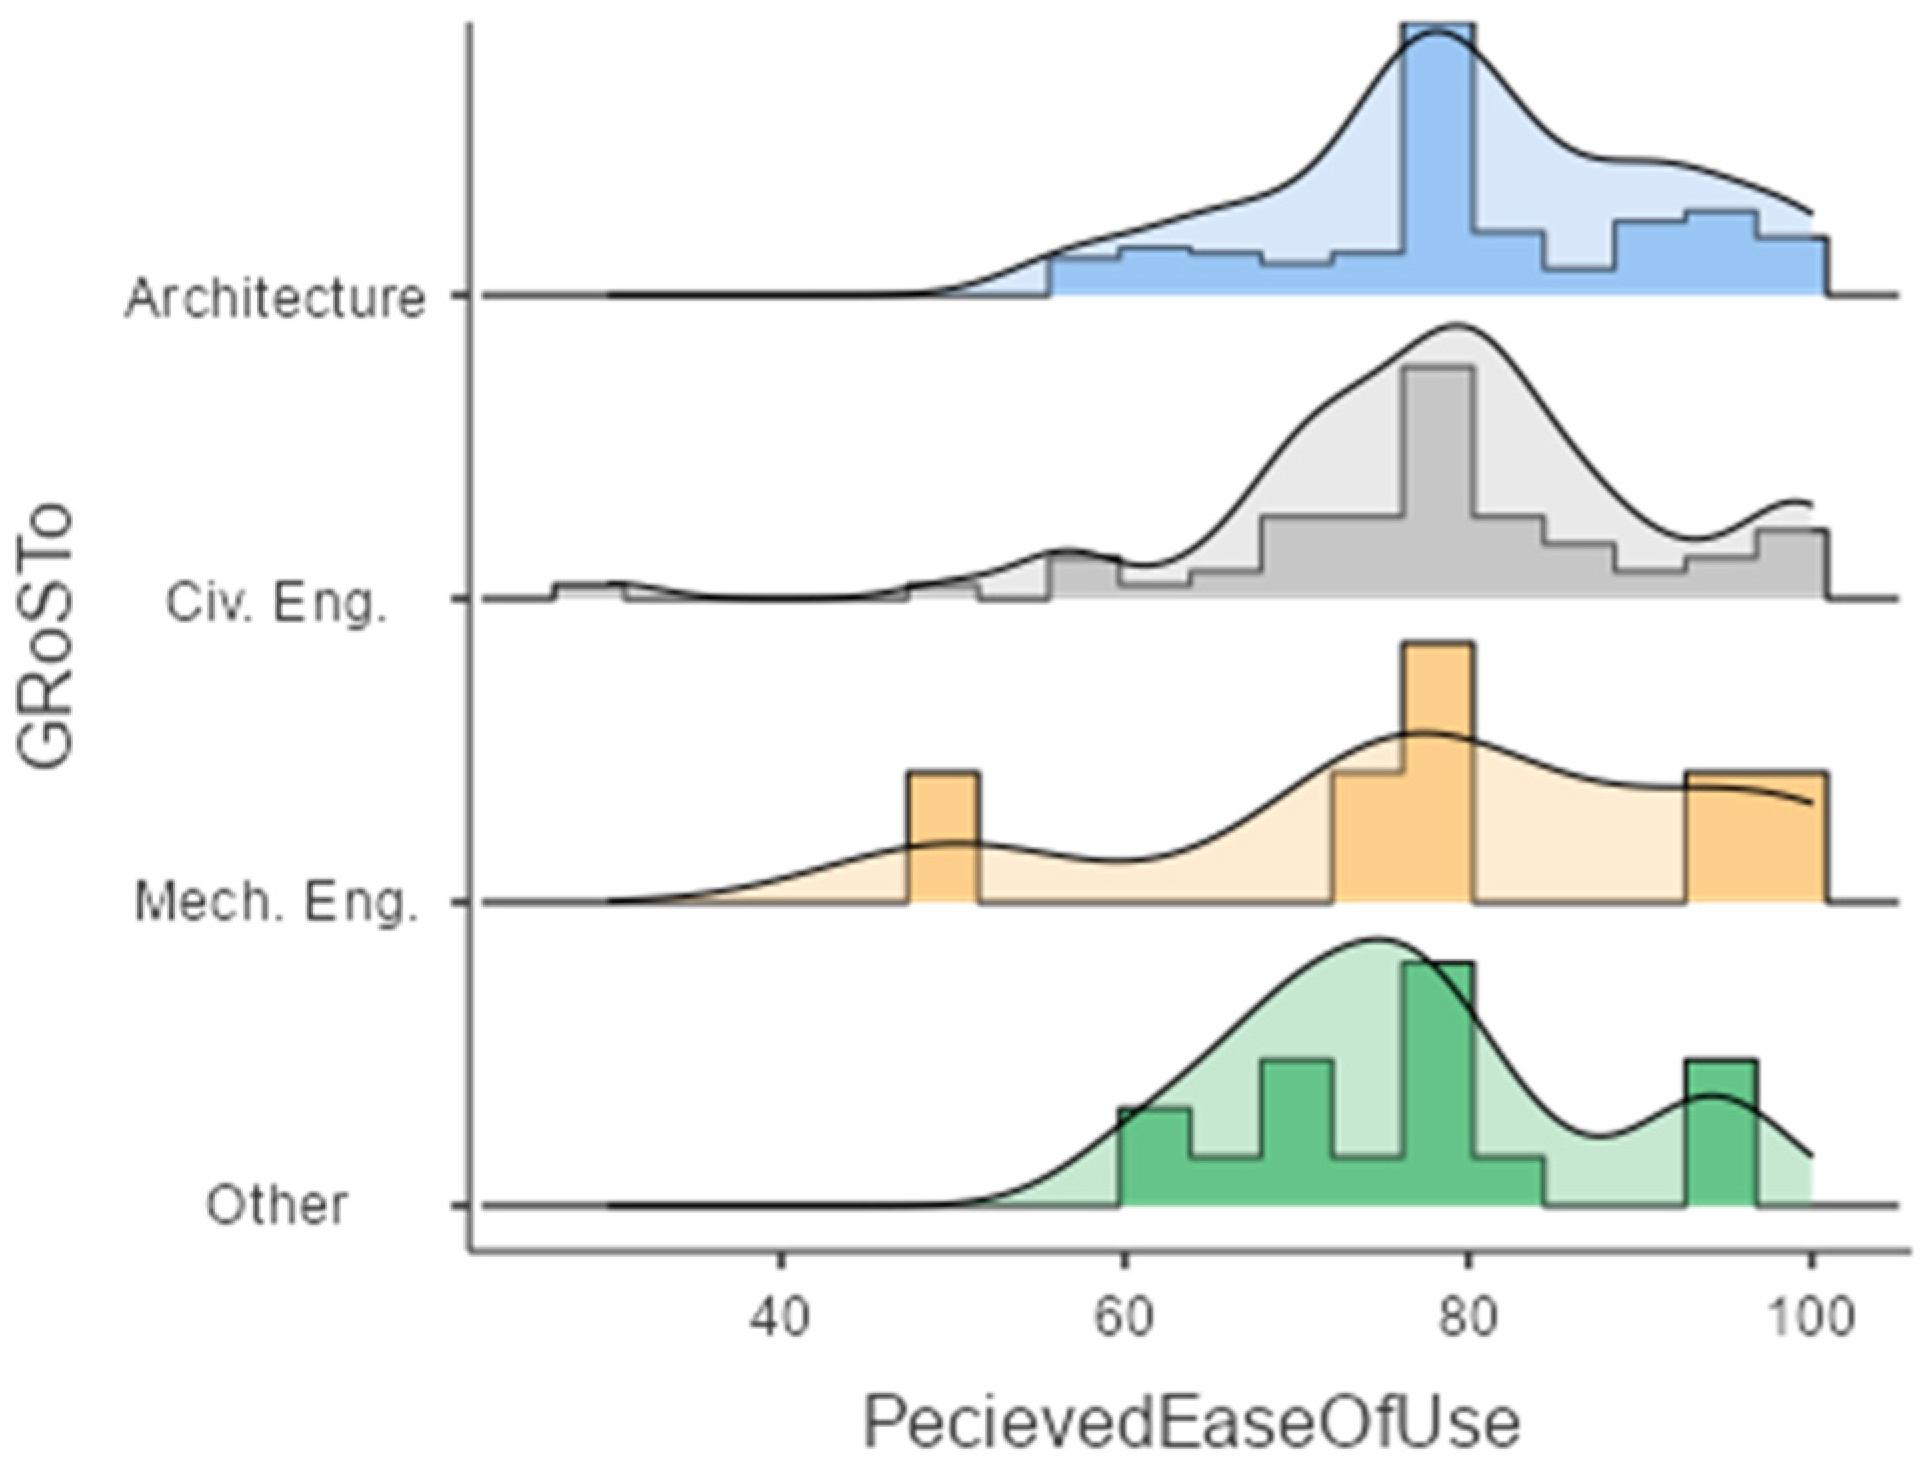
Figure 14 depicts Perceived Ease-of-Use Scores grouped by the Backgrounds of participants in the form of a Histogram and Density Plot. Table S27 in Supplementary Materials demonstrates that normality was not ensured for all groups. Table S28 in Supplementary Materials provides the results of the test on group differences. The results of the BMD test indicated that the Background factor (i.e., the academic background only among the mentioned groups) did not have any influence on the Ease-of-Use Perception of BIM Tools.

3.2.3. The Influence of Profession on Perception of Ease of Use

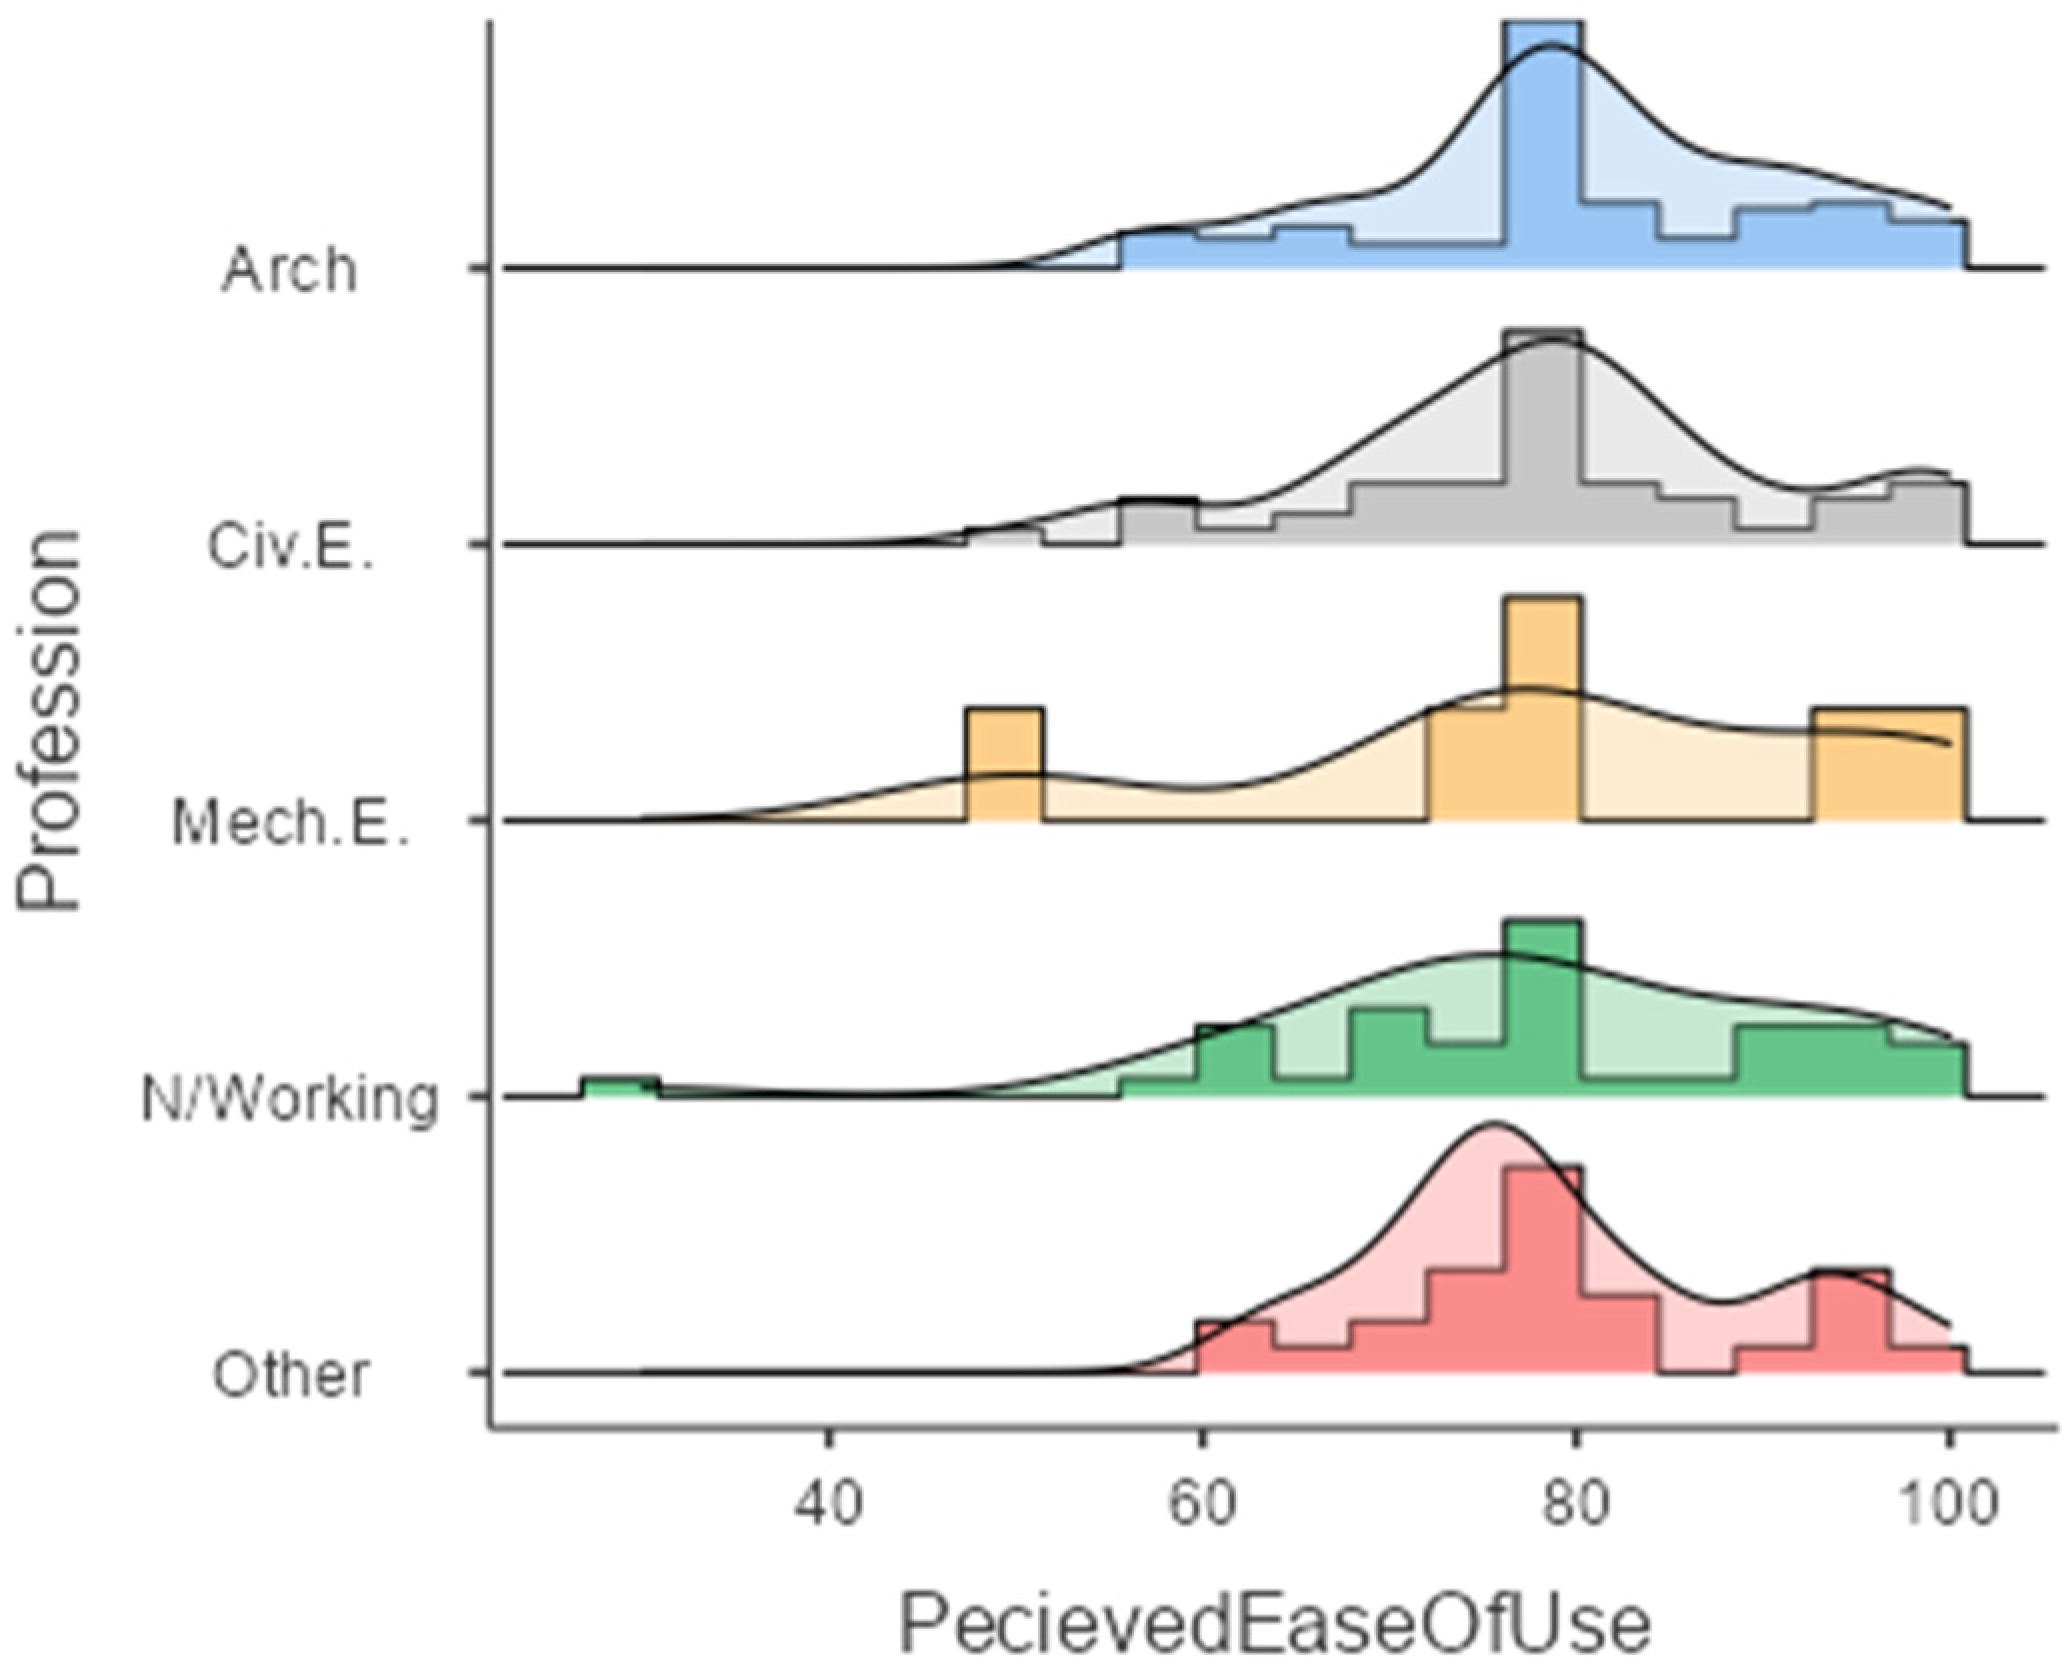
Figure 15 illustrates Perceived Ease-of-Use Scores grouped by Profession. Table S29 in Supplementary Materials demonstrates that normality was not ensured for all groups. Table S30 in Supplementary Materials provides the results of the test on group differences. The results of all tests indicated that the Profession factor (i.e., current role/employment status) did not have any influence on the Ease-of-Use Perception of BIM Tools.

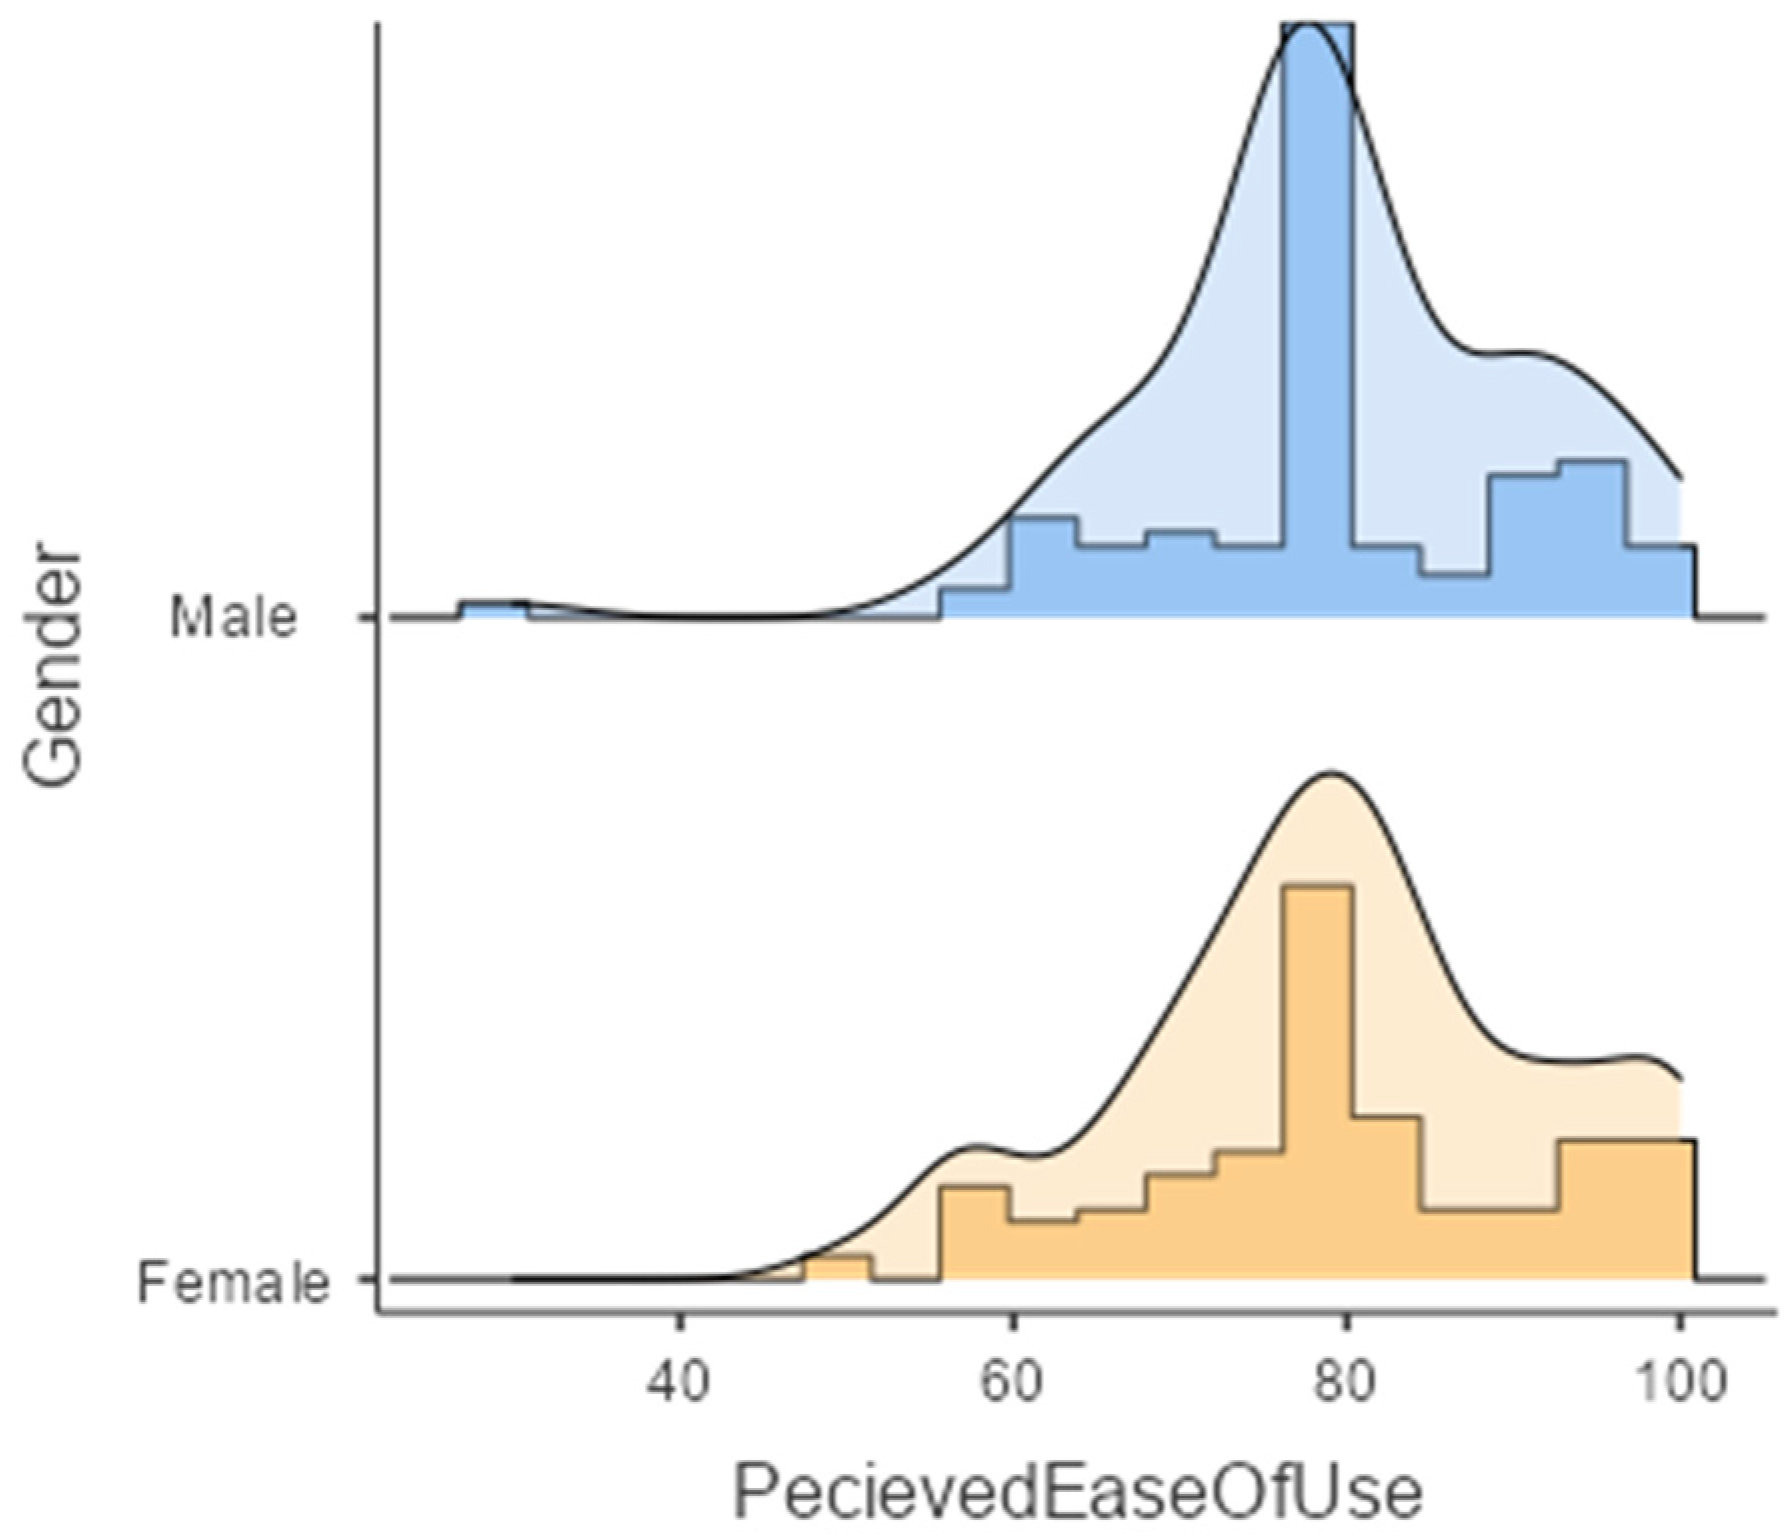
3.2.4. The Influence of Gender on Perception of Ease of Use

Figure 16 shows Perceived Ease-of-Use Scores grouped by the Gender of participants in the form of a Histogram and Density Plot. Table S31 in Supplementary Materials demonstrates that normality was not ensured for all groups. Table S32 in Supplementary Materials provides the results of the test on group differences. The results indicated that, in terms of the central tendency of the groups, Gender did not have any influence on the Ease-of-Use Perception of BIM Tools.

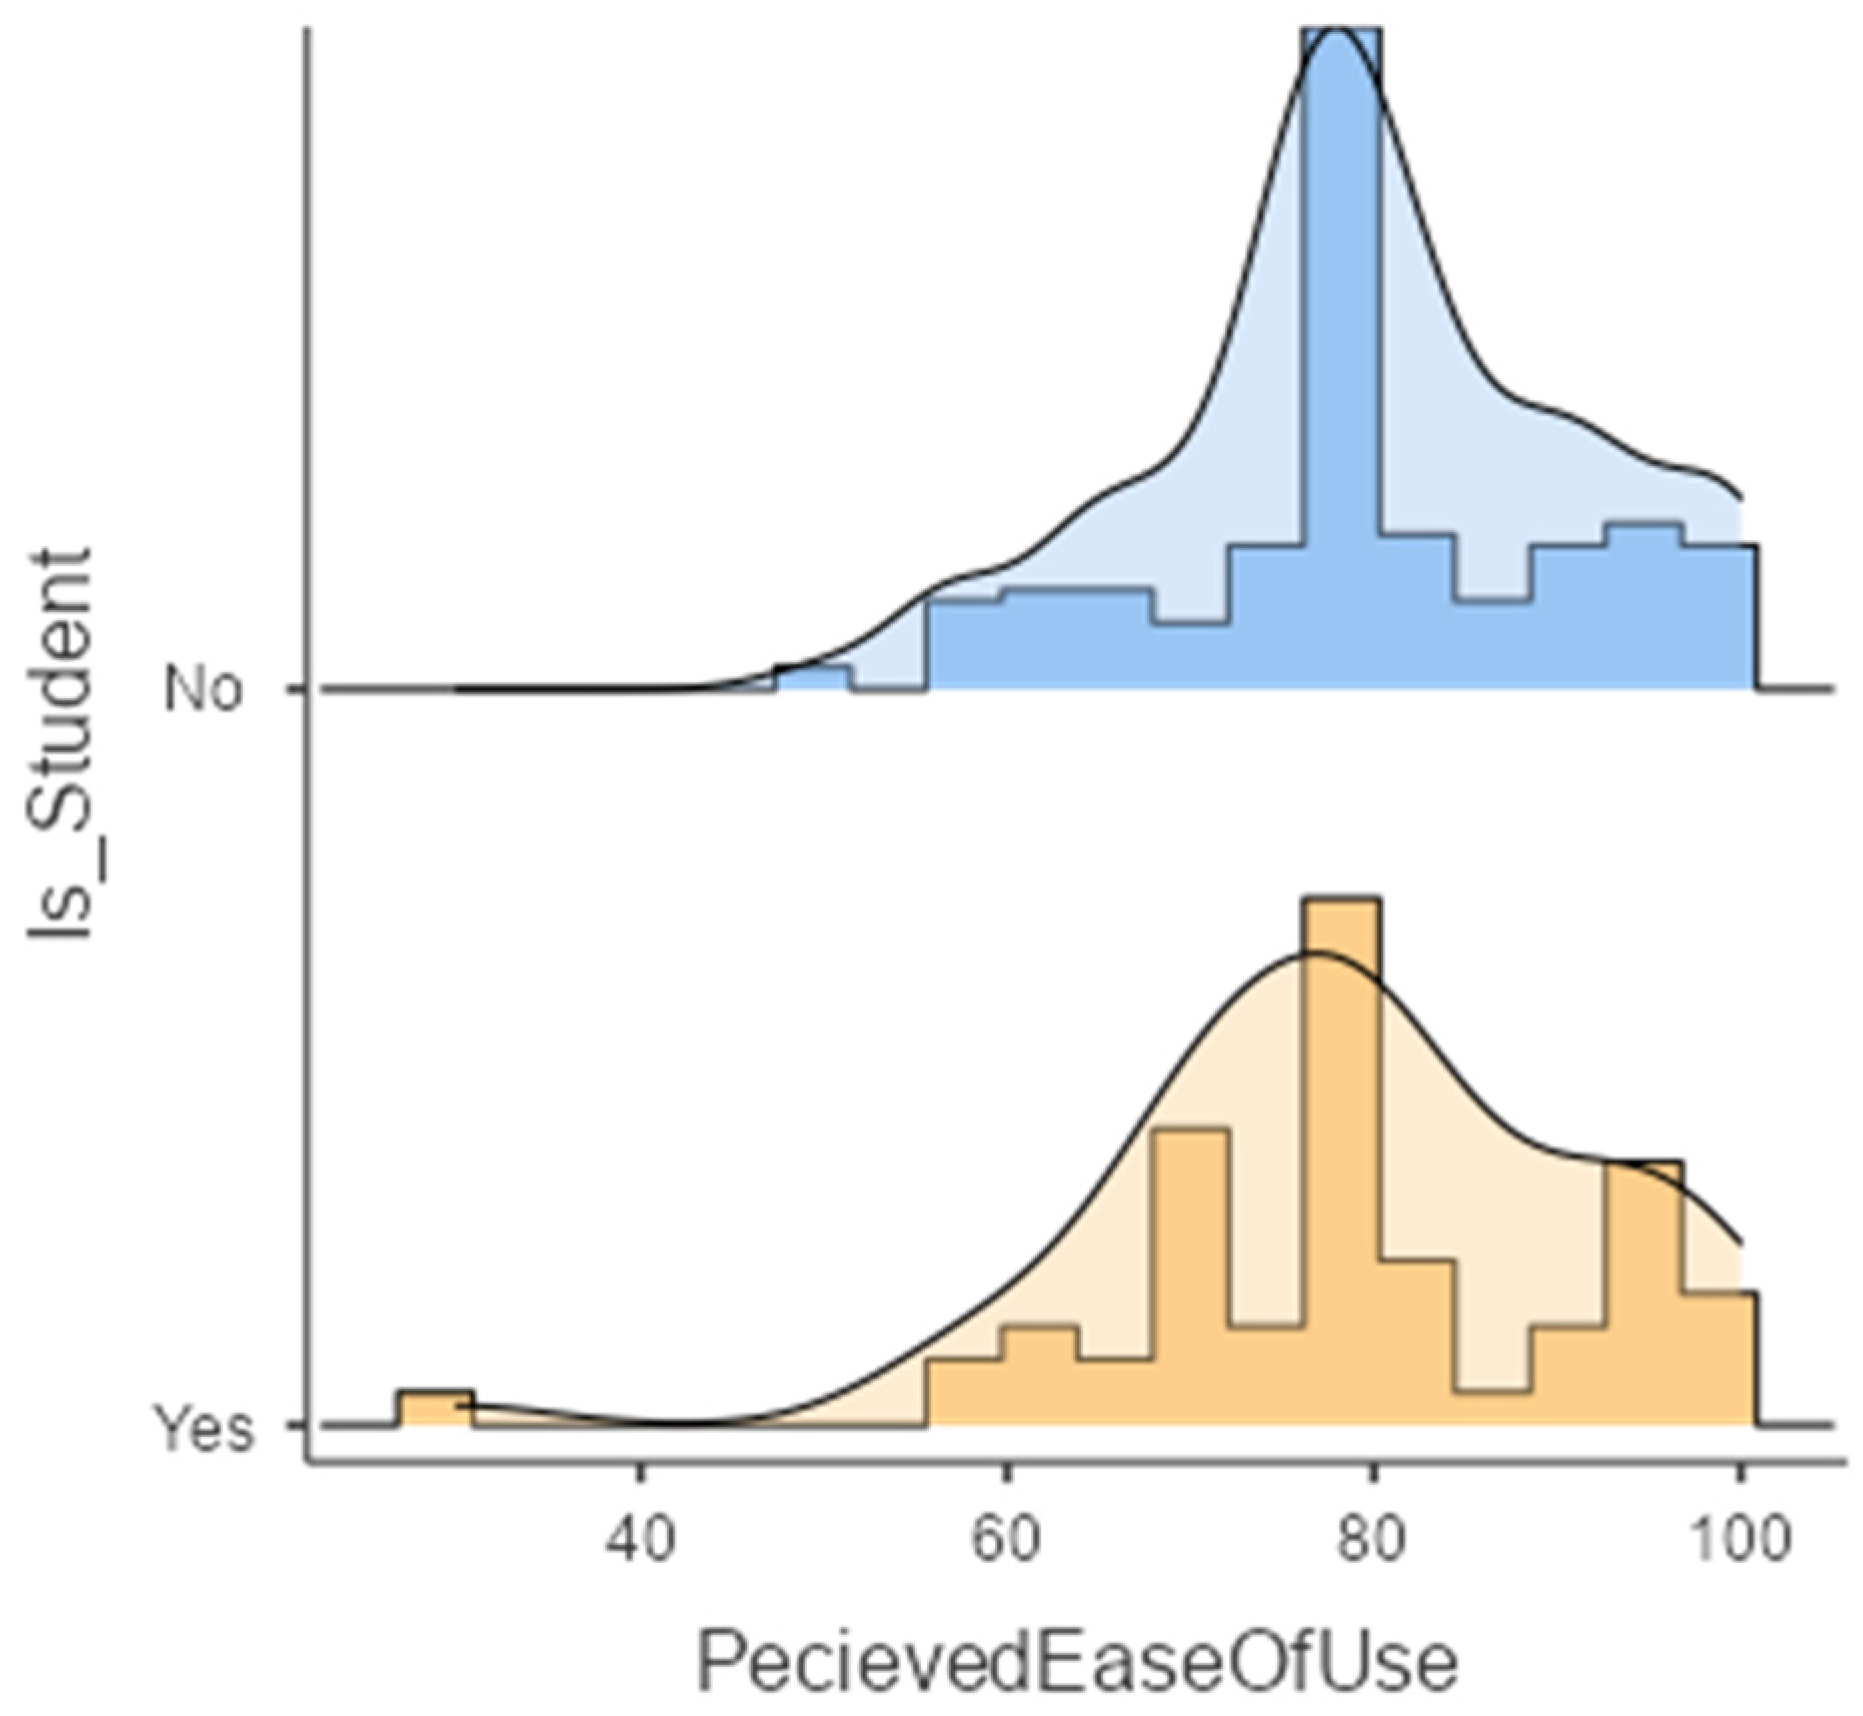
3.2.5. The Influence of Student Status on Perception of Ease of Use

Figure 17 shows Perceived Ease-of-Use Scores grouped by Student Status of participants in the form of a Histogram and Density Plot. Table S33 in Supplementary Materials demonstrates that normality was not ensured for all groups. Table S34 in Supplementary Materials provides the results of the test on group differences. The results of tests indicated that being a student or not does not have any influence on the Ease-of-Use Perception of BIM Tools.

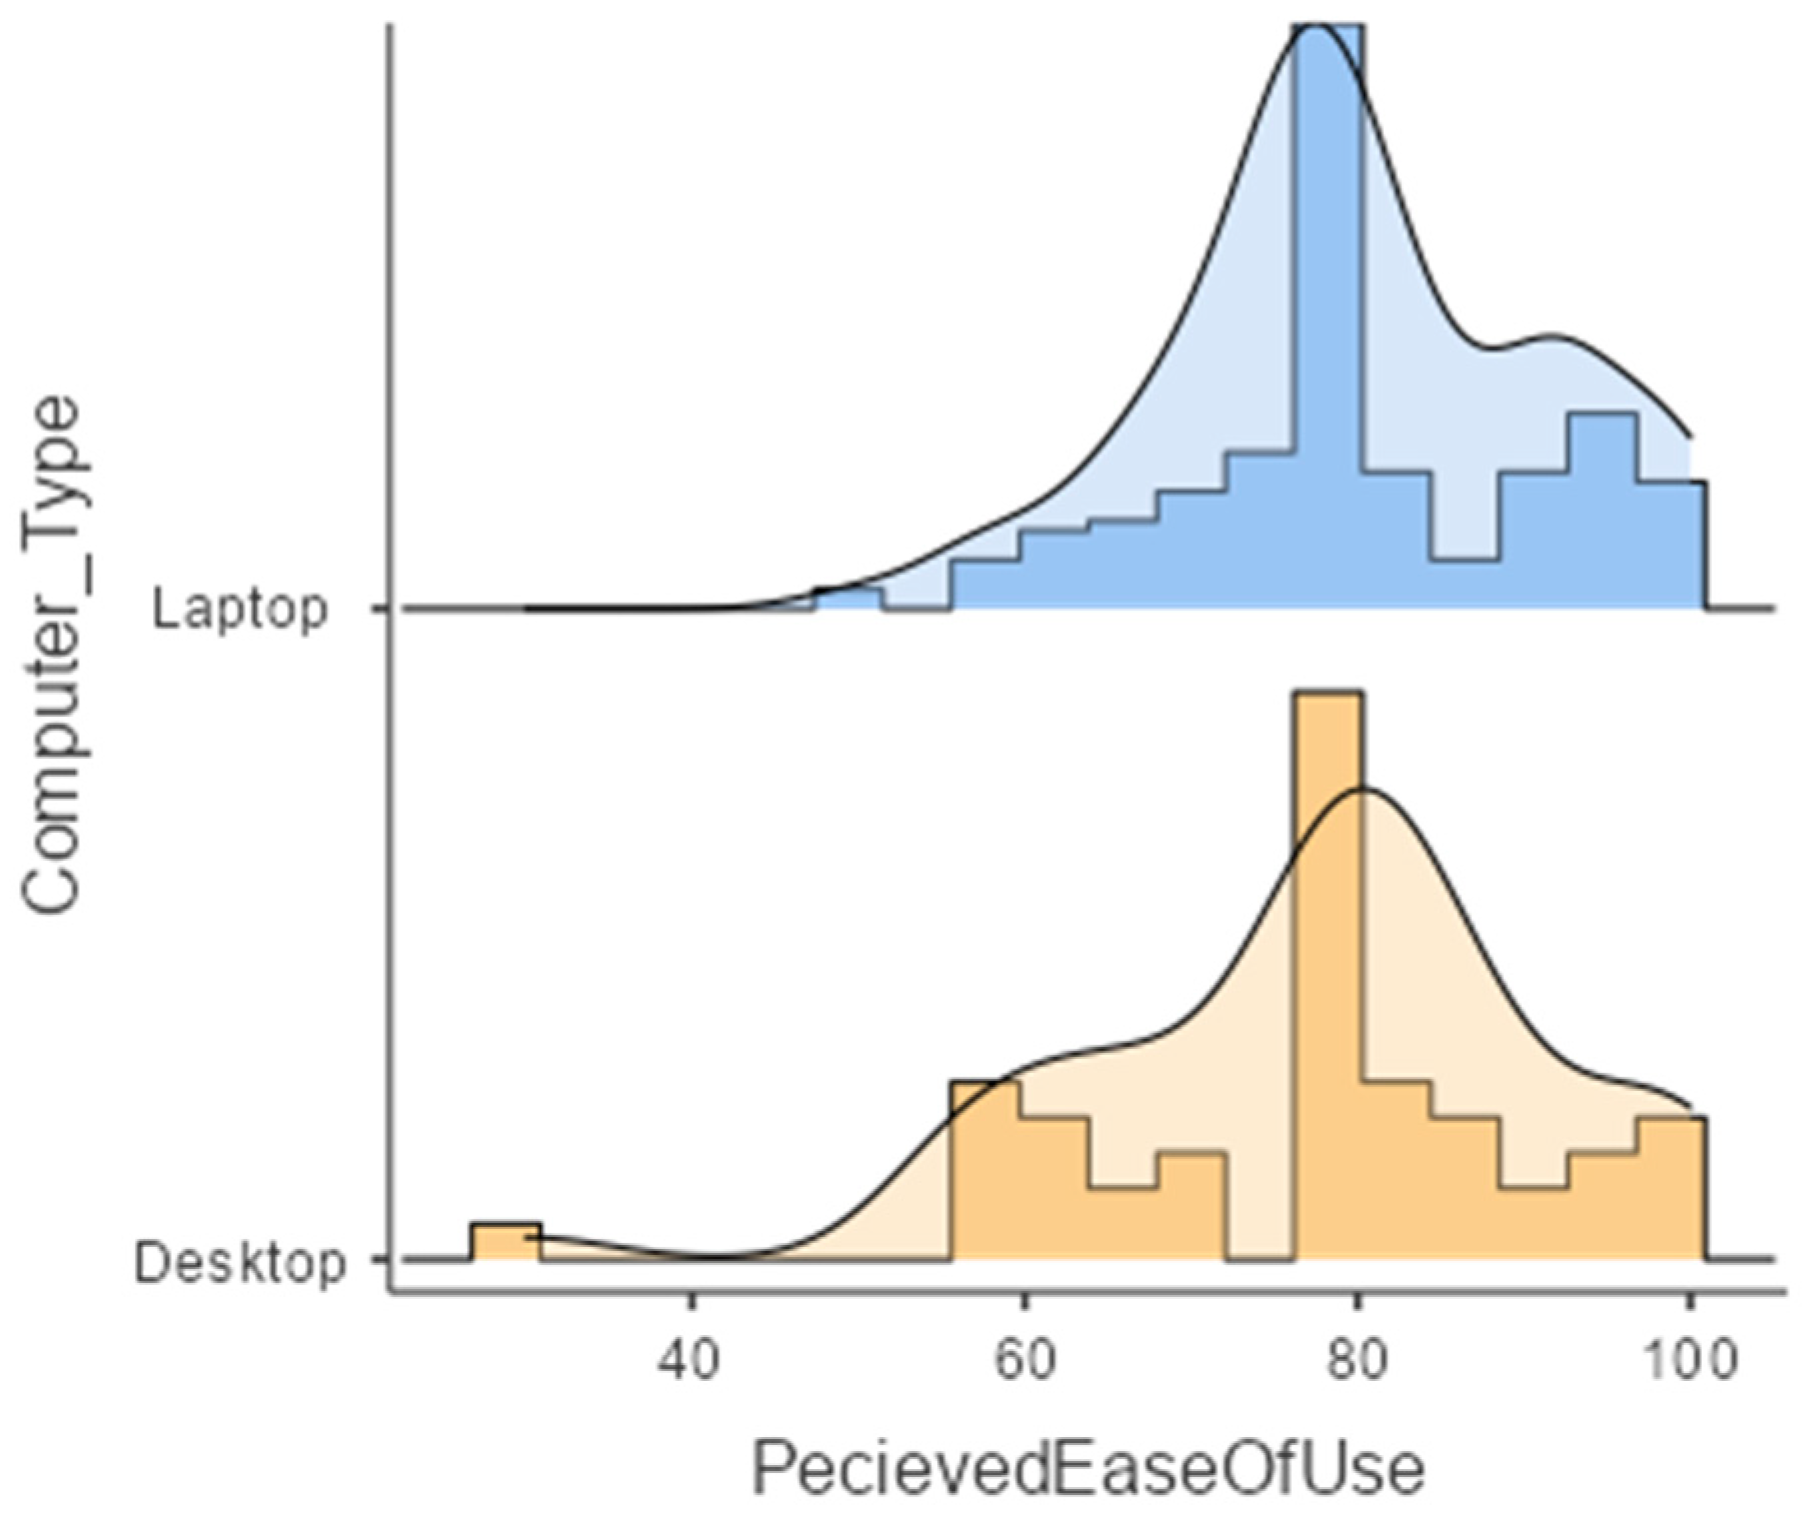
3.2.6. The Influence of Computing Habits on Ease-of-Use Perception

Figure 18 shows Perceived Ease-of-Use Scores grouped by the type of primary computer (PC) used by participants in the form of a Histogram and Density Plot. Table S35 in Supplementary Materials demonstrates that normality was not ensured for all groups. Table S36 in Supplementary Materials provides the results of the test on group differences. The results indicated that the type of personal computer, where tools are used, does not have any influence on the Ease-of-Use Perception of BIM Tools.

3.2.7. The Influence of Being a Gamer on Ease-of-Use Perception

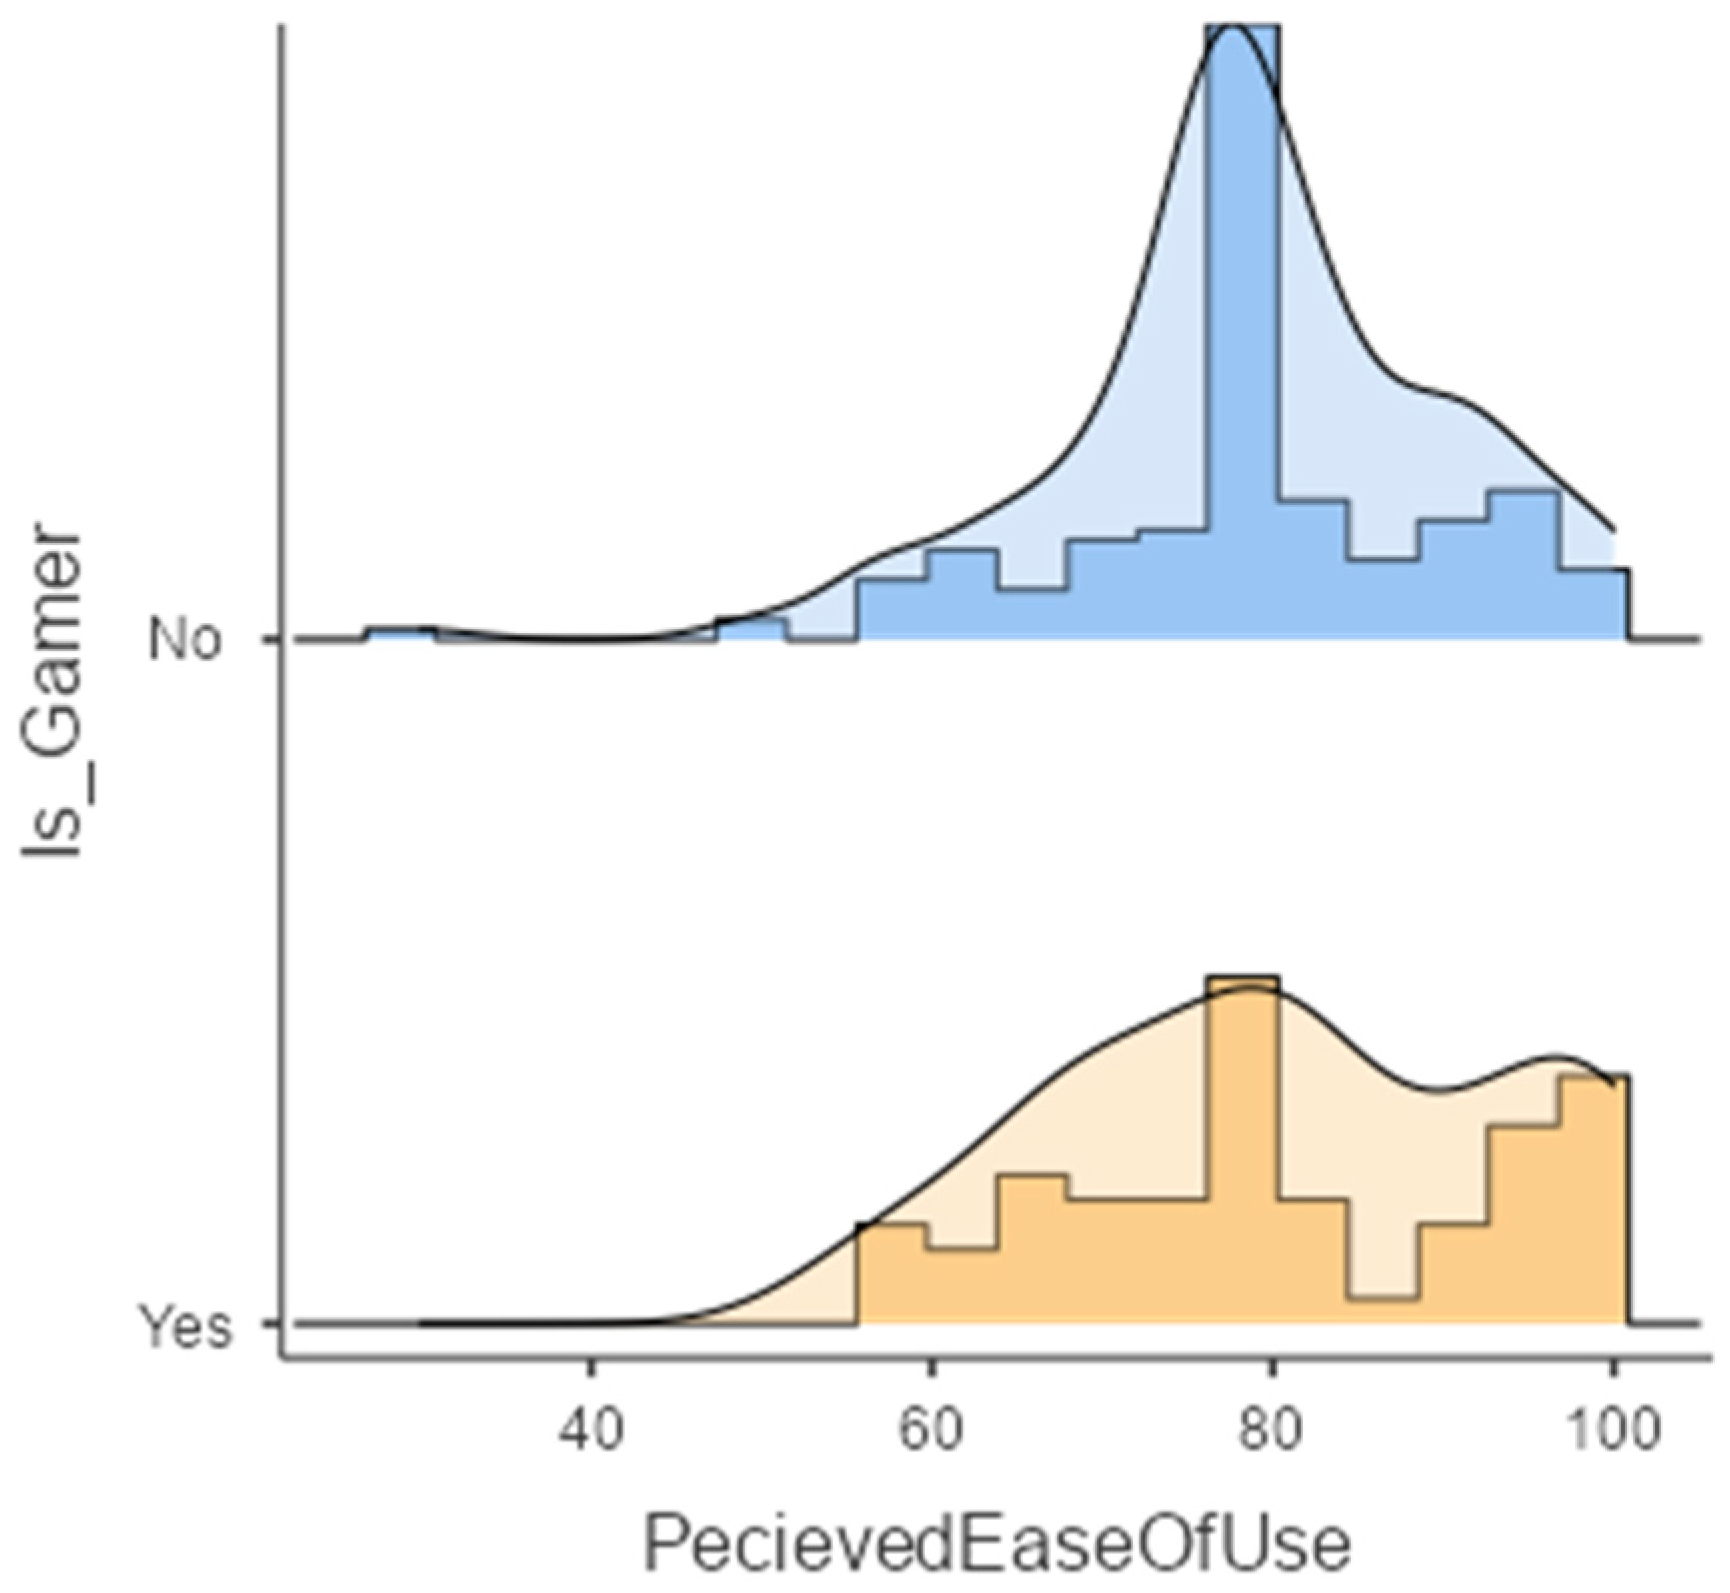
Figure 19 shows Perceived Ease-of-Use Scores grouped by Being a Gamer or Not in the form of a Histogram and Density Plot. Table S37 in Supplementary Materials demonstrates that normality was not ensured for all groups. Table S38 in Supplementary Materials provides the results of the test on group differences. The results indicated that being a Gamer (i.e., in terms of having experience with the use of 3D environments in advance) does not have any influence on perception regarding the Ease-of-Use of BIM tools.

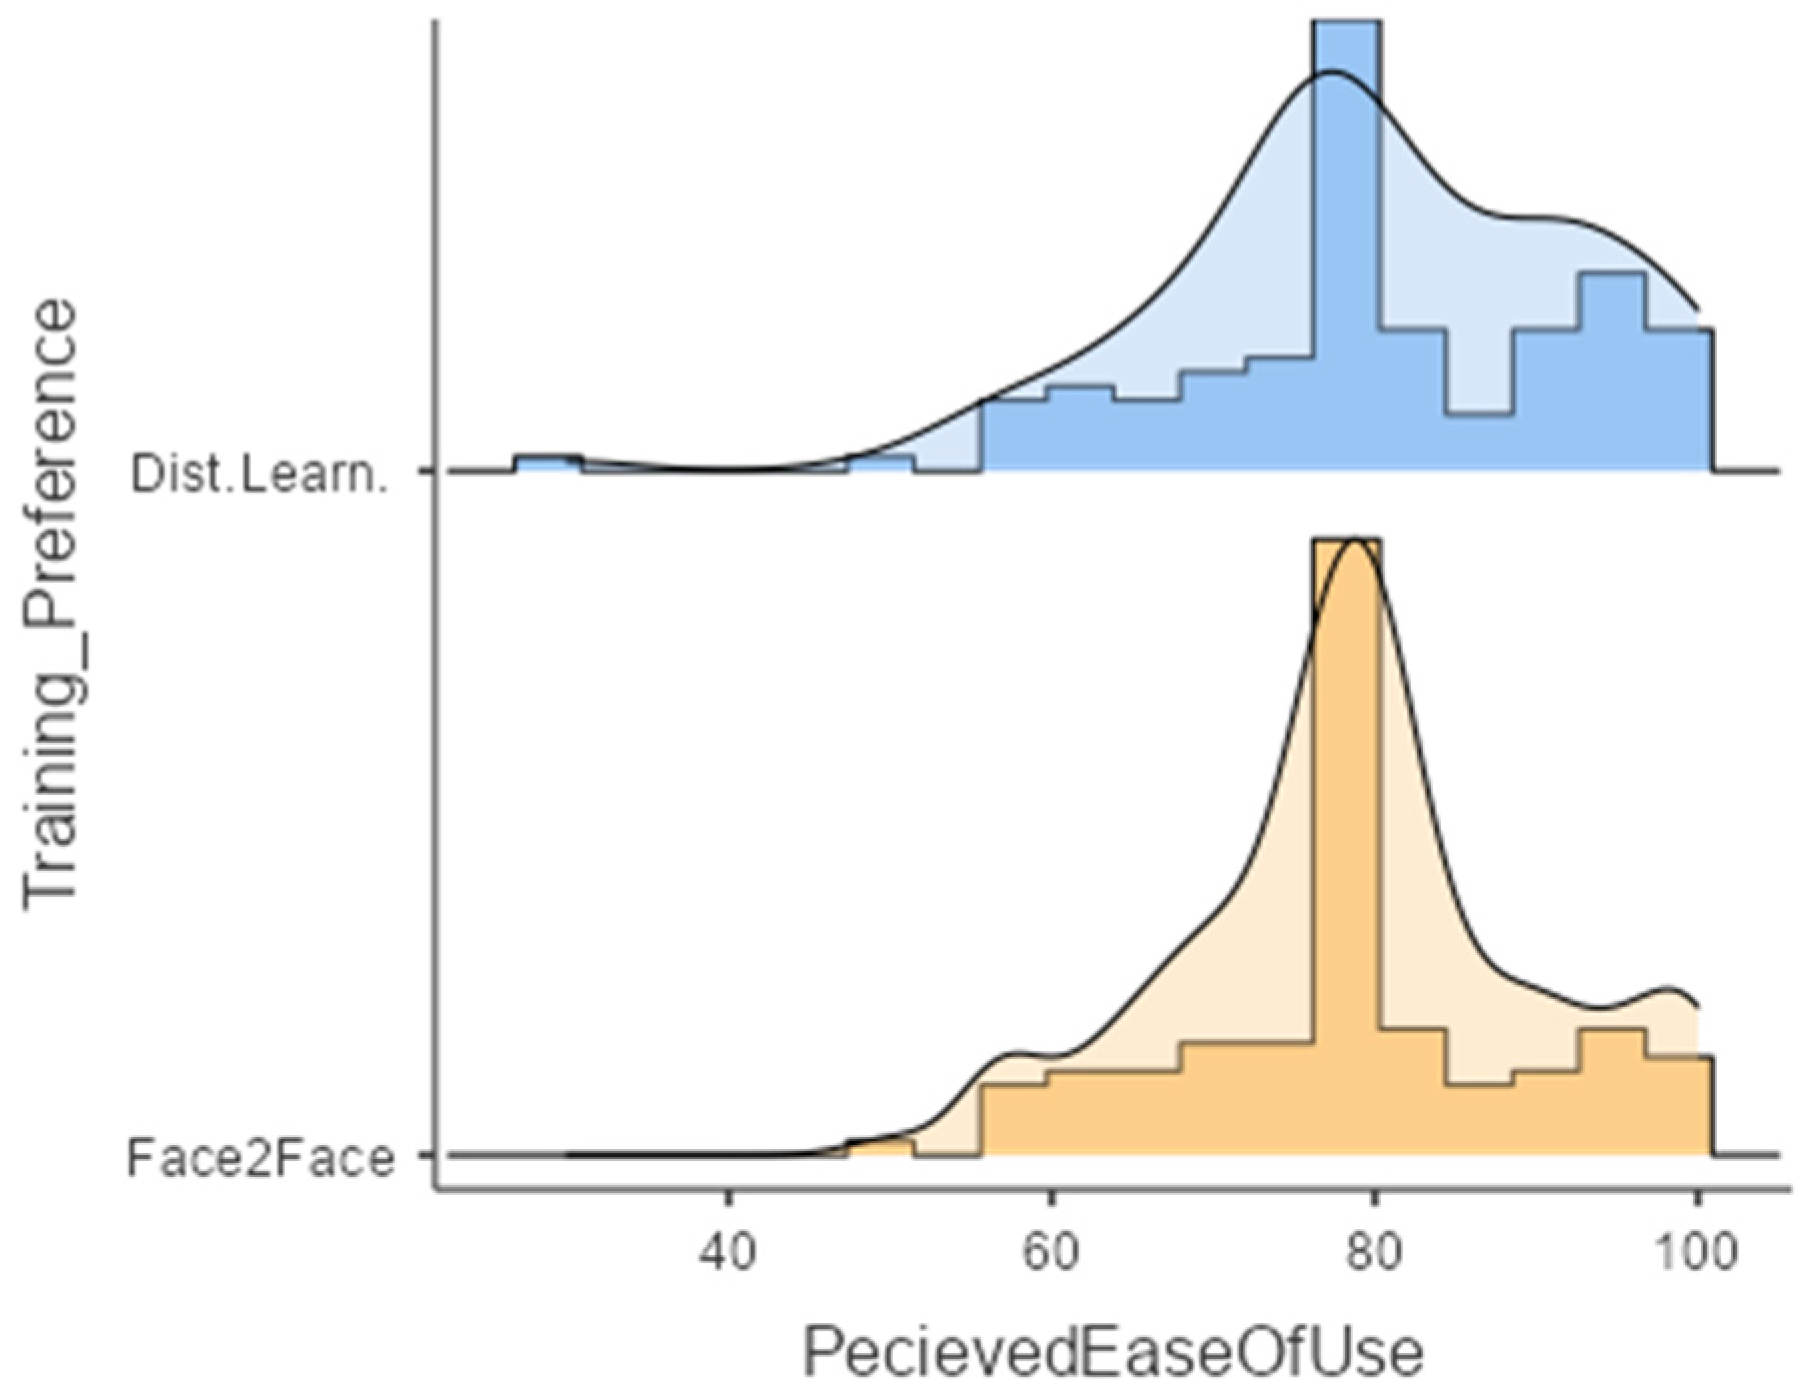
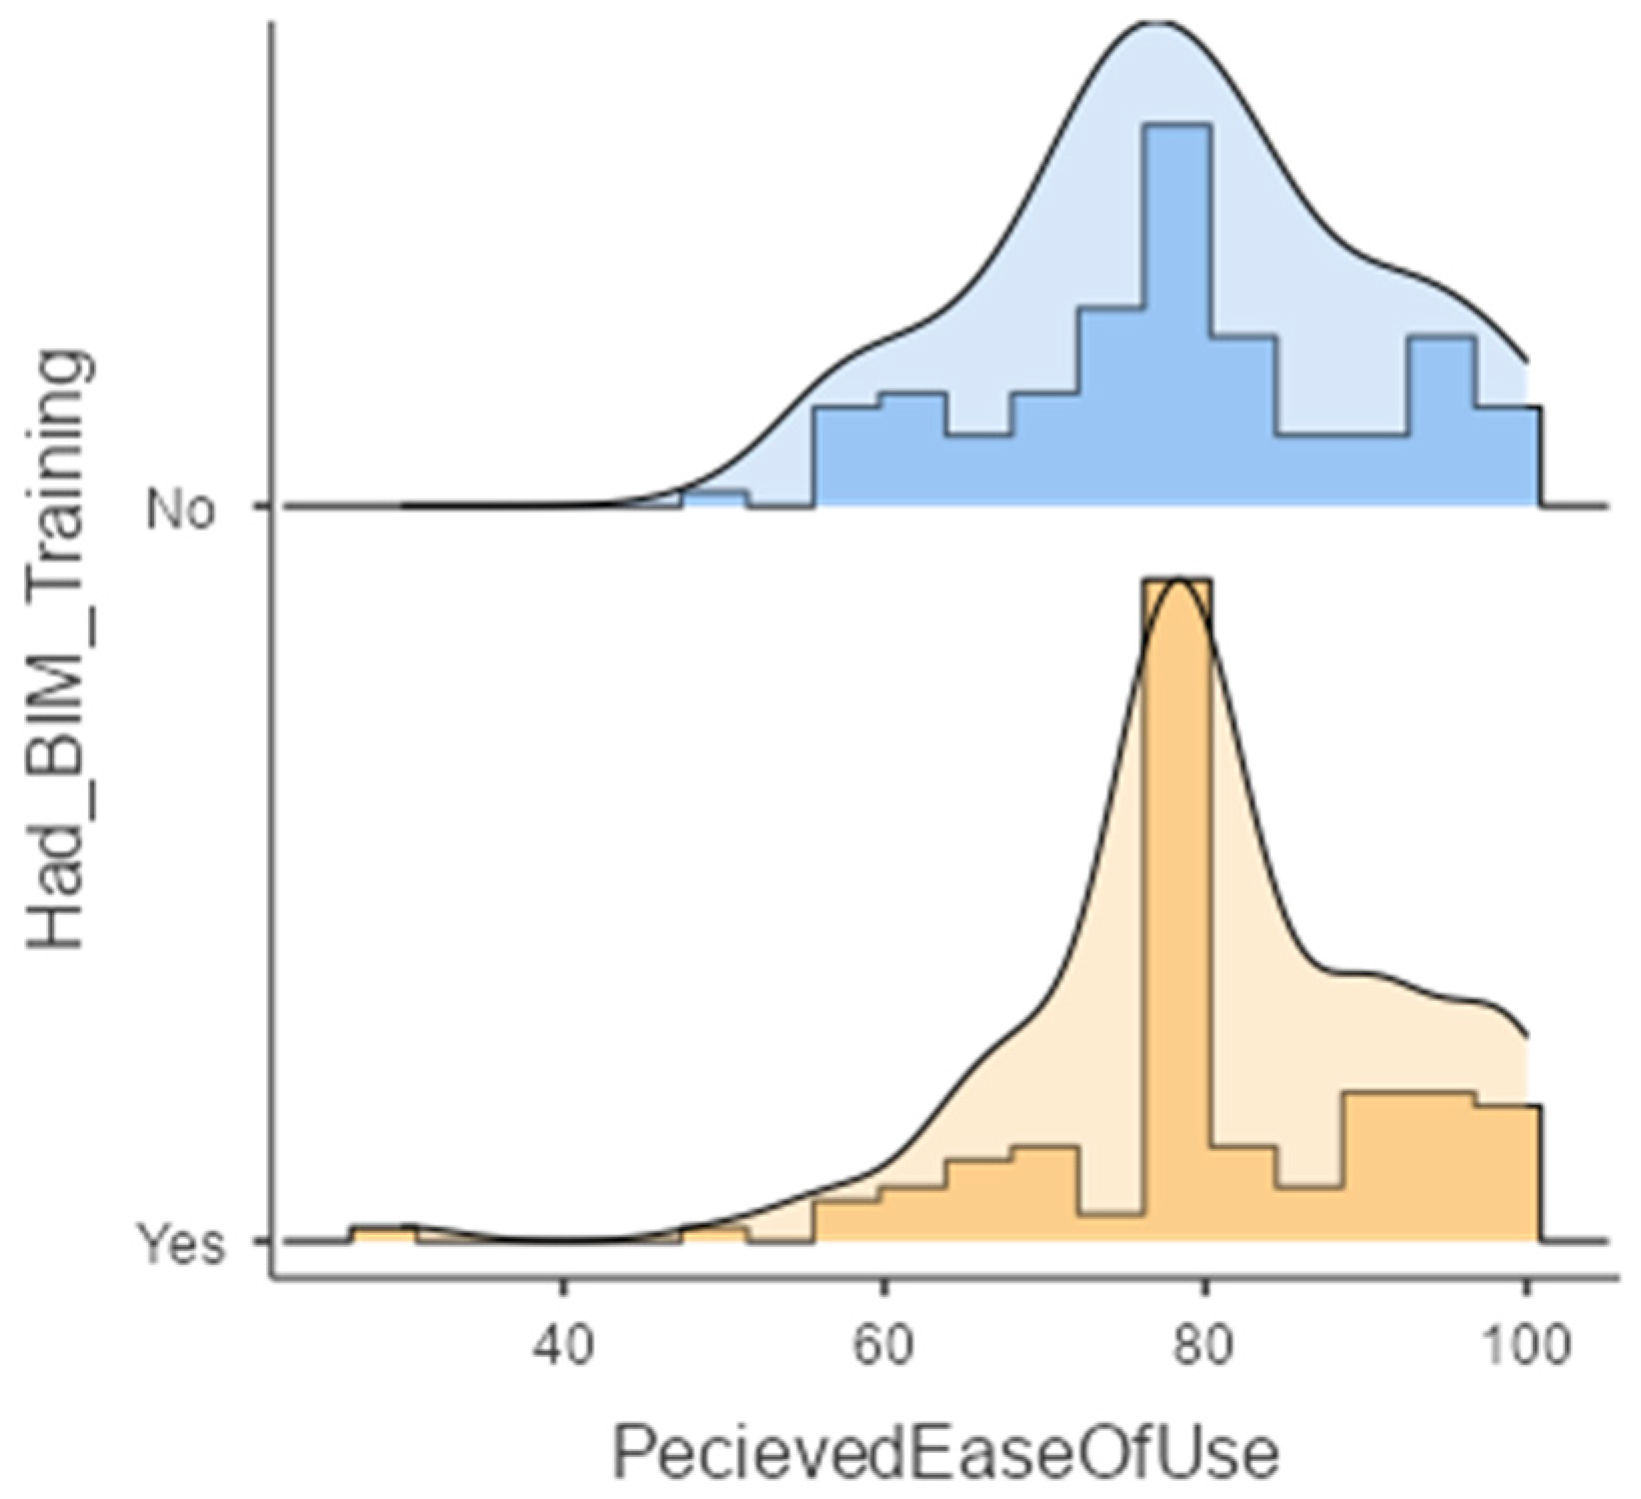
3.2.8. The Influence of Training Type Preference on Ease-of-Use Perception

Figure 20 provides Perceived Ease-of-Use Scores grouped by Training Type Preference. Table S39 in Supplementary Materials normality was not ensured for all groups. Table S40 in Supplementary Materials provides the results of the test on group differences. The results indicated that users preferring the Face2Face training do not perceive the Ease-of-Use of BIM Tools differently from users who prefer distance learning.

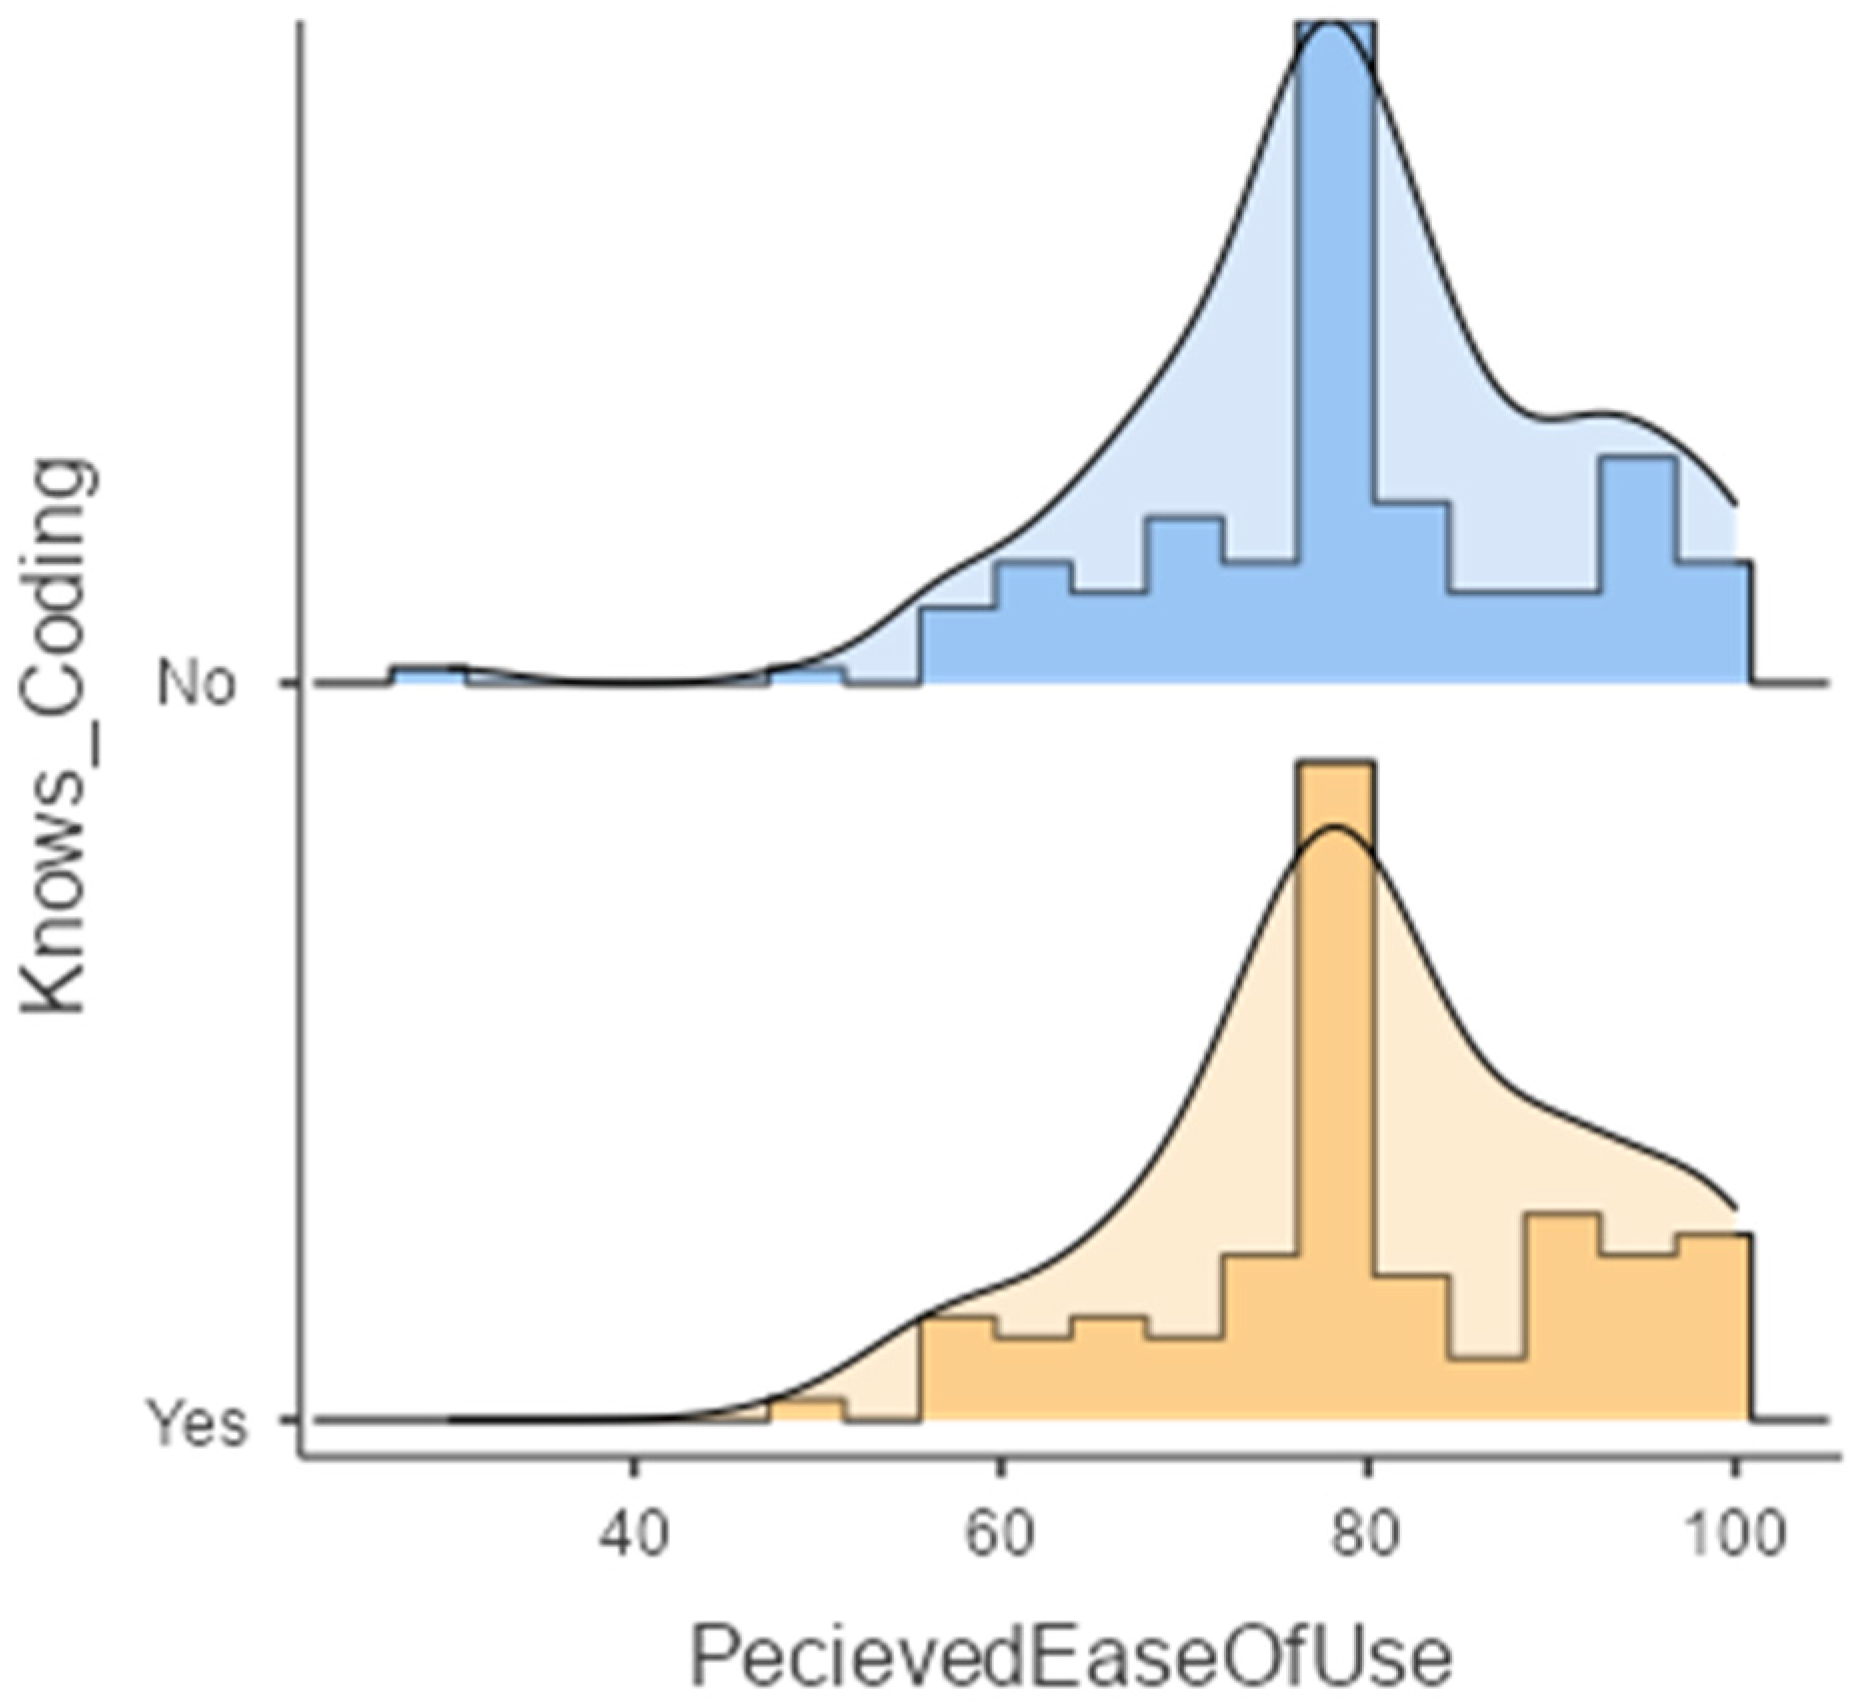
3.2.9. The Influence of Experience of Coding on Ease-of-Use Perception

Figure 21 provides Perceived Usefulness Scores grouped by Experience in Coding in the form of Histogram and Density Plots. Table S41 in Supplementary Materials demonstrates that normality was not ensured for all groups. Table S42 in Supplementary Materials provides the results of the test on group differences. The results indicated that prior knowledge of advanced computing, even at a coding level, did not influence the perception of the Ease-of-Use of BIM Tools.

3.2.10. The Influence of Having Taken Academic Courses on BIM Before on Ease-of-Use Perception

Figure 22 illustrates Perceived Ease-of-Use Scores grouped by Having Taken Academic Courses on BIM Before in the form of a Histogram and Density Plot. Table S43 in Supplementary Materials demonstrates that normality was not ensured for all groups. Table S44 in Supplementary Materials provides the results of the test on group differences. The results indicated that Having Taken Academic Courses on BIM Before did not influence the perception of the Ease of Use of the BIM Tools.

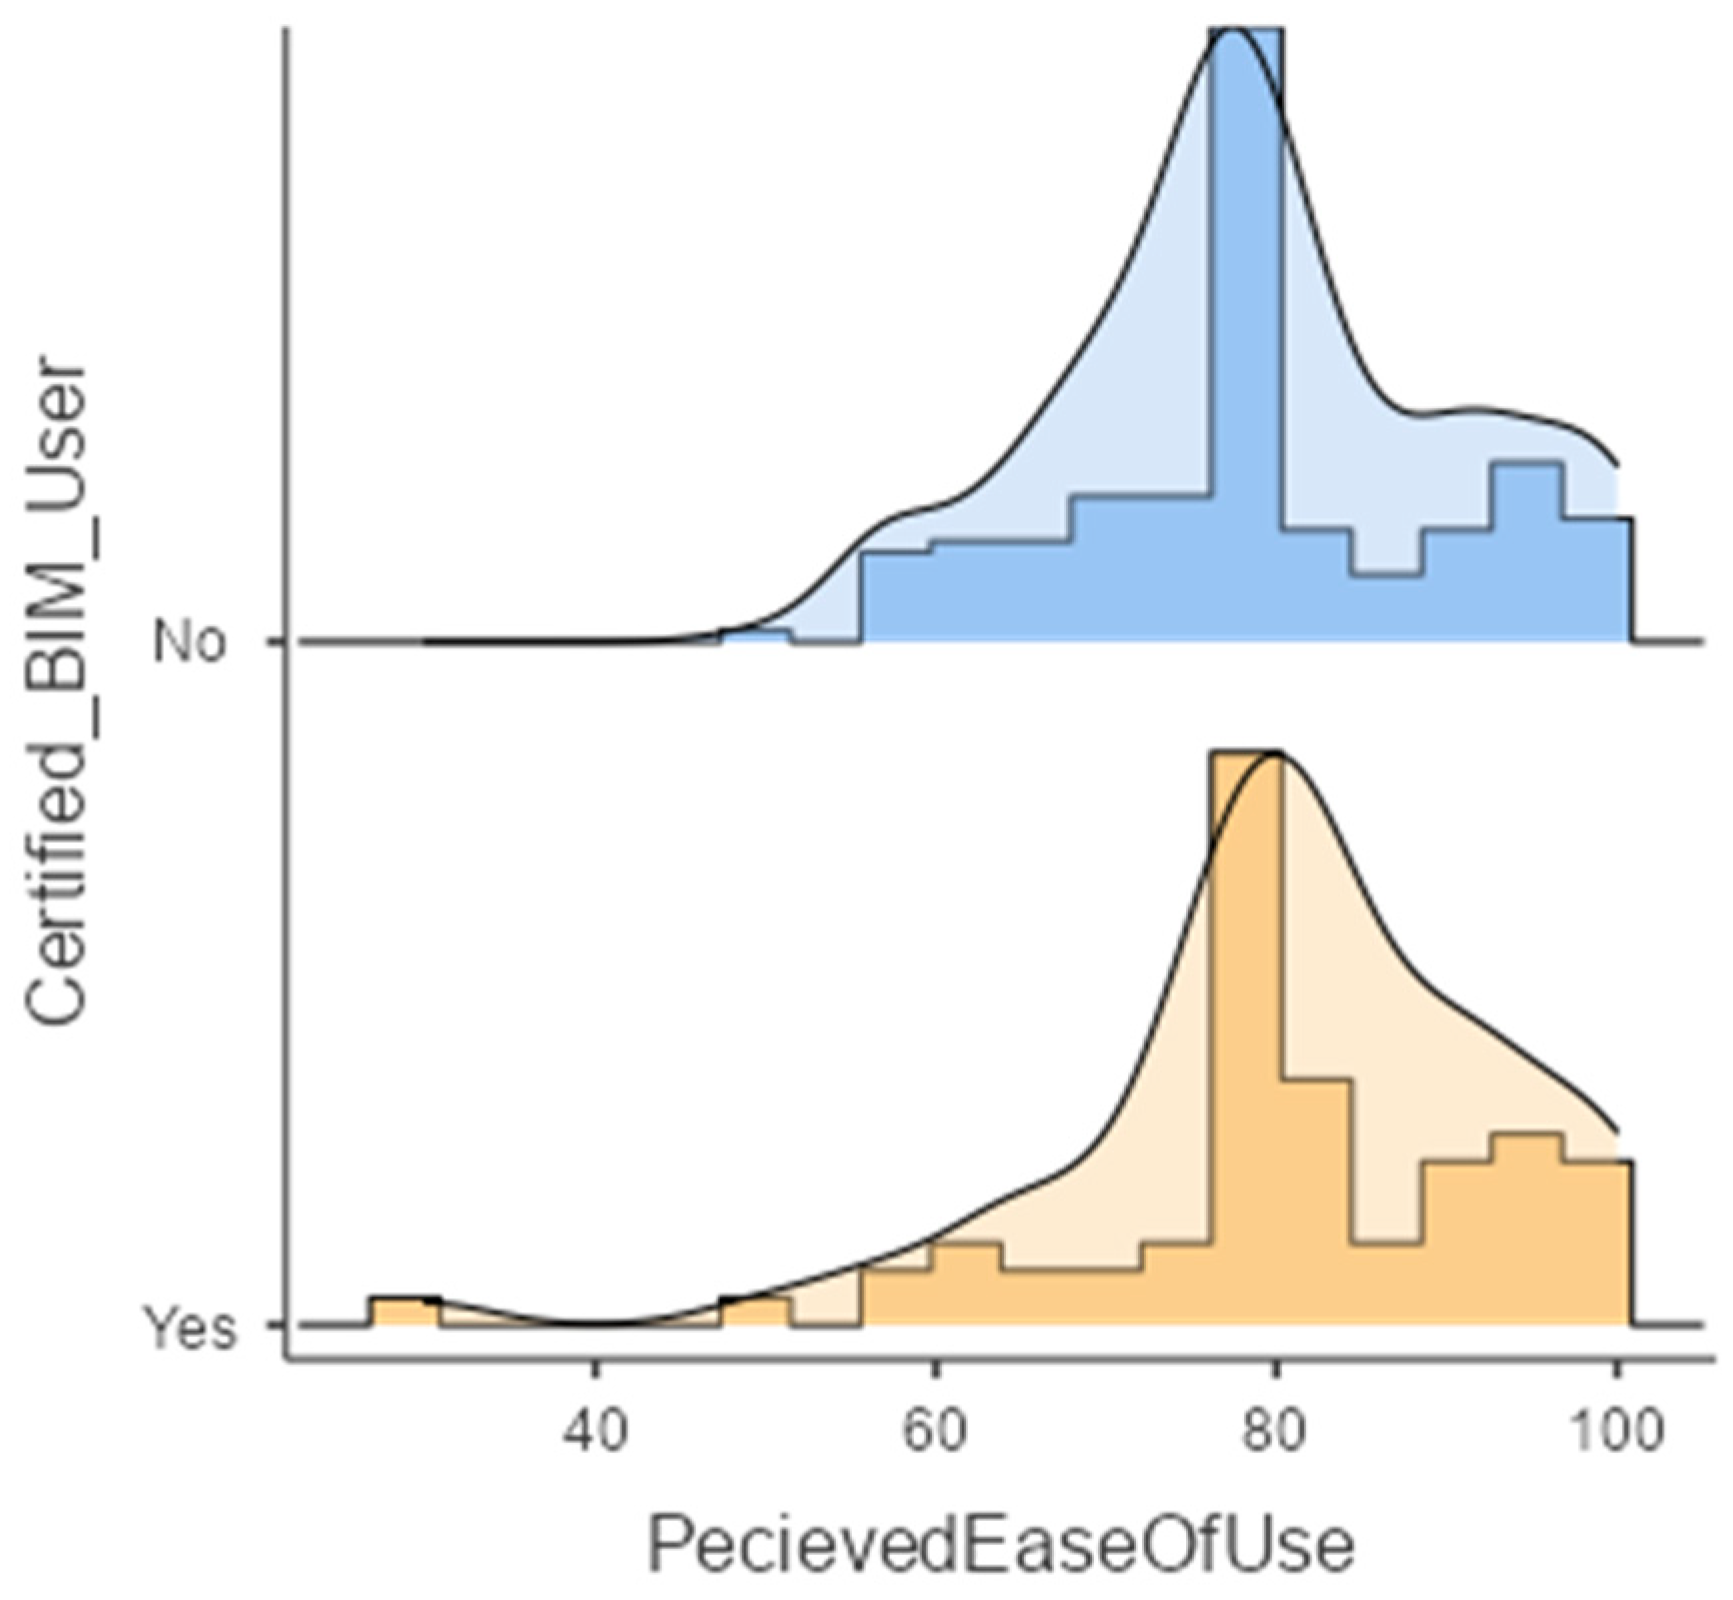
3.2.11. The Influence of Participation in a BIM Certification Training Program on Ease-of-Use Perception

Figure 23 illustrates Perceived Ease-of-Use Scores grouped by participation in a BIM certification training program in the form of Histogram and Density Plots. Table S45 in Supplementary Materials demonstrates that normality was not ensured for all groups. Table S46 in Supplementary Materials provides the results of the test on group differences. The results showed that participation in a BIM certification training program did not have an influence on the perception of the Ease-of-Use of BIM Tools. Table 5 provides a summary of all results. It should be noted that all hypothesis tests were conducted using a 95% confidence level, with the significance threshold set at p < 0.05. It should also be noted that these interpretations provided are solely based on central tendency of the data distributions and not consider the shape of the distributions.

3.3. Comparing the Distribution of the Responses

In the next stage, to explore and compare the cumulative distribution functions of the subgroups (i.e., the shape of distributions) of Perceived Usefulness and Perceived Ease of Use, a series of Cramer–Von Mises and Anderson–Darling k-sample tests were conducted. Table 6 provides the results of these tests.
As indicated in Table 6, the subgroups of Perceived Usefulness defined by the factors of Age, Student Status, Computing Habits, Gamer Status, and Participation in a BIM certification training program had significant differences in their data distribution. In fact, differences in central tendency (explored earlier) only existed in the subgroups defined by Gender and Participation in a BIM certification training program. The subgroups of Perceived Ease of Use defined by Computing Habits (i.e., PC type used), Gamer Status, and Participation in a BIM certification training program have significant differences in their data distribution. Interestingly, differences in central tendency (explored earlier) do not exist in any subgroup for Perceived Ease of Use.

3.4. The Influence of Perceived Ease of Use on Perceived Usefulness for BIM Tools

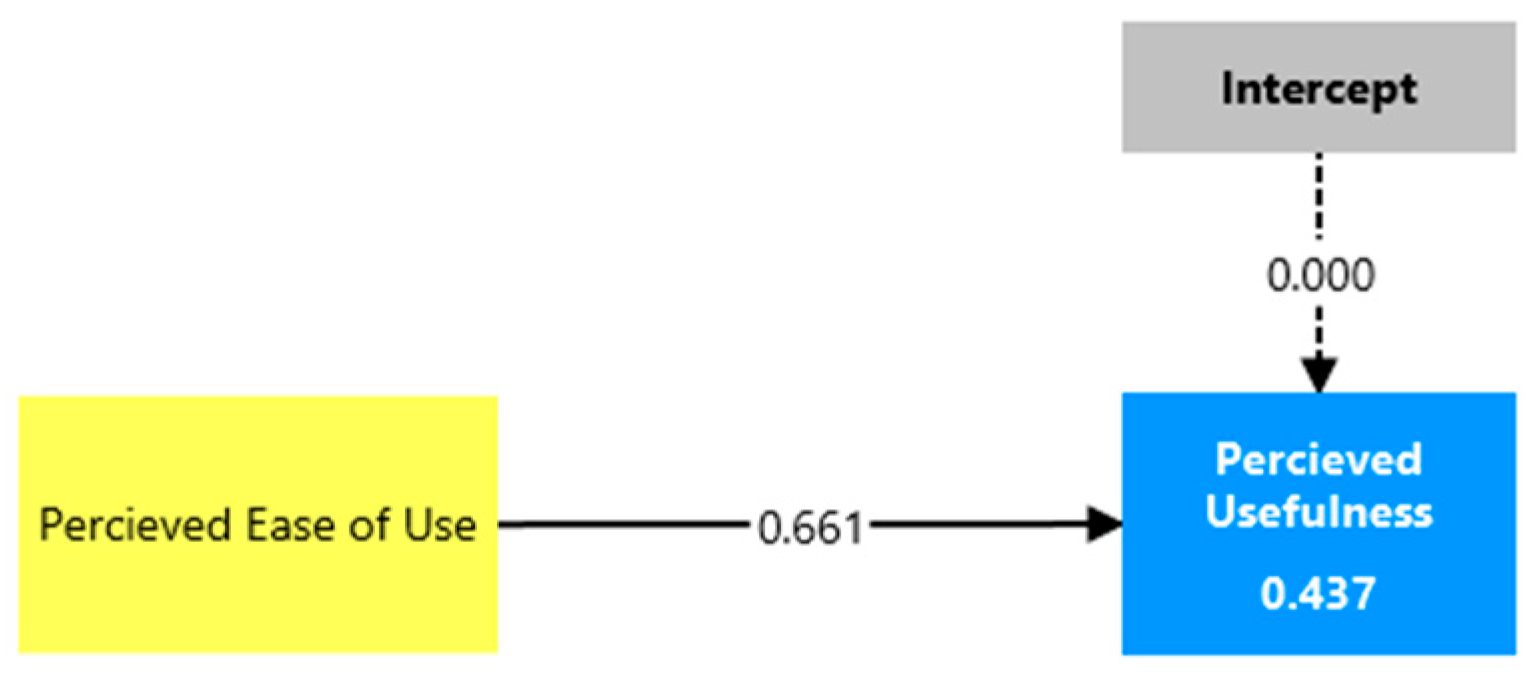
According to the Technology Acceptance Model’s (TAM) theory, the Perceived Ease of Use has a positive influence on Perceived Usefulness. The theory has been confirmed with numerous studies over the years, as mentioned in [34]. Based on the responses we received in this study, we conducted a regression analysis to explore if this effect is significant in our findings. The regression analysis wasperformed with SmartPLS 4 [39] software, and the results are depicted in Figure 24.

4. Discussion

This study was initiated with the aim of identifying the impact of demographic, social, educational, previous training-related, professional, and habit-related factors on the perception of the ease of use and usefulness of BIM Tools in students and early career professionals. Based on the statistical results explained earlier in this paper, we have identified the following:
(a)
“Participation in a BIM Certification Training Program” is a strong factor, as it has an impact on Perceived Usefulness, as explained by differences in central tendency, and significant differences existed in data distributions for both the subgroups of Perceived Usefulness and Perceived Ease of Use that were formed by this factor.
(b)
“Computing Habits” and “Being a Gamer” appeared to be moderate factors, as significant differences were observed in the data distributions of both the Perceived Usefulness and Perceived Ease of Use subgroups that were formed by this factor. However, this finding should be interpreted with caution, since no statistically significant differences in central tendency were detected between the subgroups for either Perceived Usefulness or Perceived Ease of Use according to the Brunner–Munzel test.
(c)
“Gender” can be considered a weak/moderate factor, as it appears to influence Perceived Usefulness, which is confirmed through differences in central tendency. However, this finding should be interpreted with caution, since no statistically significant differences were detected in the distribution of Perceived Usefulness scores between gender subgroups according to the Cramer–von Mises test.
(d)
“Age” and “Student Status” can be interpreted as being weak factors, as significant differences were only observed in the data distributions for the Perceived Usefulness subgroups that were formed by this factor. However, this finding should be interpreted with caution, since no statistically significant differences in central tendency were detected between the subgroups for Perceived Usefulness according to the Brunner–Munzel test.
(e)
The findings suggest Perceived Usefulness appears to be relatively resistant to external factors, as the central tendency of responses remains stable across subgroups defined by many factors (with the exception of Participation in a BIM Certification Training Program and Gender), indicating a limited influence of eleven tested factors on participants’ perceptions.
(f)
These findings suggest that Perceived Ease of Use is relatively stable and not substantially affected by external factors, as no meaningful differences were observed in the central tendency of responses across subgroups defined by the eleven examined variables.
(g)
These findings show that Perceived Ease-of-Use positively influences Perceived Usefulness in the context of BIM Tool usage, in parallel with TAM theoretical foundations.
The key finding of the study is that Perceived Usefulness and Perceived Ease of Use are robust to most (nearly all) external factors. This robustness might be related to the demographic focus of the study, which only covers students and early-career professionals, or the finding might be totally generalized, but further research should be conducted to eliminate the effect of the demographic focus of the study. In addition, this study shows that participation in a BIM Certification Training Program has the most significant impact on the Perceived Ease of Use and Usefulness of BIM Tools among students and early-career professionals.

It appears that the status of being trained in a BIM certification program directly alters users’ level of perception and understanding of BIM tools and BIM-related technologies. This situation indicates that the perception regarding the usefulness BIM tools is closely related not only to technical knowledge but also to discovering all the different methods, tools, and technologies implemented in a BIM environment, such as using a Common Data Environment (CDE), a shared workspace, a real-time design collaboration environment, which were only made available to the participants through BIM Certification Programs offered in selected organizations. Therefore, these results provide important clues for universities regarding the integration of methods and technologies offered in BIM Certification Training into their own curriculum. On the other hand, the robustness of Perceived Usefulness and Perceived Ease of Use regarding most (nearly all) external factors could mainly be related to the similarities in the participants regarding the BIM technology awareness and experience with BIM tools.
Two recent studies [6,23] indicated that transferring BIM developments in the industry to the learning environment in real time increases students’ interest in BIM and their desire to learn. Learning attitude, performance expectation, and social influence positively affect students’ learning intention, which in turn indirectly increases learning behavior. Our finding indicating the status of being trained in a BIM certification program directly alters users’ level of perception and understanding of BIM tools and BIM-related technologies supports these viewpoints. In addition, ref. [20] mentioned that barriers to BIM implementation can be overcome through training programs, which is also in parallel with our findings.
Although [6] found that Learning Attitude was the strongest driver of intention, this study tested two different items to measure training type, such as “Having taken academic courses” and “Participation in Certification Training” and the results of the analysis showed that the “Participation in Certification Training” is isolated as the only external factor that statistically significantly alters Perceived Usefulness. This indicates a practical limitation of “Academic Courses” on changing the perception of the users, and underlines that “Participation in Certification Training” would have a real impact on the usefulness perception of BIM Tools.
Ref. [8] stated that students view the professional value of BIM positively, but they have experienced uncertainty due to BIM’s steep learning curve, especially with the integration of new technologies such as artificial intelligence (AI). Our findings on the impact of having extensive and comprehensive training on BIM tools, methods, and technologies on the perceived usefulness of BIM tools indicate that this uncertainty arising due to BIM’s steep learning curve can be (or needs to be) overcome by extensive and comprehensive hands-on BIM training. Ref. [19] mentioned that BIM system quality, information quality, and system services affect the usability and ease of use of BIM, this viewpoint indicates that although is Perceived Usefulness and Perceived Ease of Use is found robust to most (nearly all) user related external factors controlled in this study, there might be other system and information quality related factors which might have impact on these dimensions.
The findings of this study have produced meaningful, consistent, and reliable results within the scope of the current sample. However, as with any research, this study has some inherent limitations. Sample selections may have limited representativeness due to the study being conducted within a specific context. This situation is considered a factor that should be taken into account when interpreting the results obtained. Future comparisons using broader data sets obtained from different universities, countries, or sectors may strengthen the generalizability of the current findings. Furthermore, the fact that the data was collected through self-reported measurements may reflect participants’ perceptual differences and biases. In future works, supporting such data with more diverse data collection methods will contribute to testing and deepening the results in different contexts.

5. Conclusions

The study empirically demonstrated that many commonly investigated factors (such as age, background, profession, coding experience, and academic coursework) do not meaningfully alter BIM perceptions among digital natives. The findings show that the perceived ease of use and perceived usefulness of BIM Tools are generally stable and largely unaffected by most external factors. Participation in the BIM Certification Training Program emerged as the factor with the strongest impact on both dimensions. More limited effects are associated with age group, gender, student status, and computer and gaming habits. Other factors had no significant effect. Further research is required to understand the question of “Why are Perceived Ease of Use and Perceived Usefulness very robust to external factors?”
Although the participants in the study were students and early career professionals who were digital natives (as they learn by exploration and interaction [40]), this nativeness did not translate into a positive usefulness perception of BIM tools without having had specific BIM certification training. This indicates that digital natives can face a challenging situation when the context of the information system or tool in focus is complex, such as collaborative design and engineering tools.
The sample size of the study (n = 227) is consistent with the number of participants used in similar BIM adoption and technology acceptance studies and has enabled statistical analyses to be conducted reliably.
The findings of this study have yielded meaningful and reliable results within the scope of the current sample. However, in order to increase the generalizability of the results obtained, it is recommended that future studies use larger data sets that include participants from different universities, countries, and sectors. In particular, the inclusion of public and private sector professionals or BIM practitioners from different disciplines would be useful for assessing the model’s validity in different contexts.
Although the study is empirical in design, its findings offer minor theoretical implications. The results demonstrate that perceived ease of use and perceived usefulness are highly stable among digital-native users and resistant to most external demographic or experiential factors. This suggests that for digital natives in a developing economy, BIM-related acceptance is shaped primarily by structured training exposure rather than general ICT familiarity or demographic characteristics.
The study isolates certification-based BIM training, rather than academic coursework, as the only factor consistently associated with higher perceived usefulness. The findings suggest that curricular exposure alone may not be sufficient to change the BIM perceptions of digital natives; the value of practice-oriented certification models is high for altering the perceptions of this group.
Furthermore, there are some limitations to consider in this study. The sample selections and data collection method indicate that the findings should be evaluated within a specific context. Obtaining data through self-reported measurements may reflect natural differences based on participants’ perceptions and experiences. However, this approach also provides a valuable contribution in terms of allowing direct examination of individual perceptions. In future research, supporting quantitative analyses with qualitative data collection methods may contribute to a multifaceted interpretation of the findings.

Supplementary Materials

The following supporting information can be downloaded at: https://www.mdpi.com/article/10.3390/buildings16010106/s1.

Author Contributions

Conceptualization, Ü.I. and J.U.; methodology, J.U.; validation, Ü.I., G.B. and J.U.; formal analysis, Ü.I.; investigation, Ü.I.; data curation, Ü.I.; writing—original draft preparation, Y.A.; writing—review and editing, Ü.I. and G.B.; visualization, Ü.I.; project administration, J.U. All authors have read and agreed to the published version of the manuscript.

Funding

This research received no external funding.

Institutional Review Board Statement

The study involves an anonymous online survey in which participants voluntarily shared their opinions without providing any personal or identifiable information. Therefore, formal ethics approval was waived.

Data Availability Statement

Dataset available on request from the authors.

Acknowledgments

We would like to thank all students of the Architecture and Urban Informatics program at MSGSÜ for their help in the questionnaire survey processes.

Conflicts of Interest

The authors declare no conflicts of interest.

References

  1. Kim, K.; Son, K.; Kim, E.-D.; Kim, S. Current trends and future directions of free-form building technology. Archit. Sci. Rev. 2015, 58, 230–243. [Google Scholar] [CrossRef] [Scilit]
  2. Azhar, S.; Khalfan, M.; Maqsood, T. Building information modelling (BIM): Now and beyond. Constr. Econ. Build. 2015, 12, 15–28. [Google Scholar] [CrossRef] [Scilit]
  3. Habibi, S. The promise of BIM for improving building performance. Energy Build. 2017, 153, 525–548. [Google Scholar] [CrossRef] [Scilit]
  4. Eastman, C.M. Building Product Models; CRC Press: Boca Raton, FL, USA, 2018. [Google Scholar] [CrossRef] [Scilit]
  5. Sanchís-Pedregosa, C.; Vizcarra-Aparicio, J.-M.; Leal-Rodríguez, A.L. BIM: A technology acceptance model in Peru. J. Inf. Technol. Constr. 2020, 25, 99–108. [Google Scholar] [CrossRef] [Scilit]
  6. Peng, P.; Ao, Y.; Li, M.; Wang, Y.; Wang, T.; Bahmani, H. Building Information Modeling Learning Behavior of AEC Undergraduate Students in China. Behav. Sci. 2022, 12, 269. [Google Scholar] [CrossRef] [Scilit]
  7. Torres, K.; Castañeda, K.; Sánchez, O.; Peña, C.A.; Bobadilla, K.; Hurtado, M. Perceptions of the Influence of BIM Digital Models in Cost Overrun Management: A Construction Education Perspective. KSCE J. Civ. Eng. 2025, 100413. [Google Scholar] [CrossRef] [Scilit]
  8. Ahankoob, A.; Abbasnejad, B.; Aranda-Mena, G. Building Information Modelling (BIM) Acceptance and Learning Experiences in Undergraduate Construction Education: A Technology Acceptance Model (TAM) Perspective—An Australian Case Study. Buildings 2025, 15, 1804. [Google Scholar] [CrossRef] [Scilit]
  9. Okakpu, A.; GhaffarianHoseini, A.; Tookey, J.; Haar, J.; Ghaffarianhoseini, A. Exploring the environmental influence on BIM adoption for refurbishment project using structural equation modelling. Archit. Eng. Des. Manag. 2020, 16, 41–57. [Google Scholar] [CrossRef] [Scilit]
  10. Huang, B.; Lei, J.; Ren, F.; Chen, Y.; Zhao, Q.; Li, S.; Lin, Y. Contribution and obstacle analysis of applying BIM in promoting green buildings. J. Clean. Prod. 2021, 278, 123946. [Google Scholar] [CrossRef] [Scilit]
  11. Shaqour, E.N. The role of implementing BIM applications in enhancing project management knowledge areas in Egypt. Ain Shams Eng. J. 2022, 13, 101509. [Google Scholar] [CrossRef] [Scilit]
  12. Wang, T.; Feng, J. Linking BIM Definition, BIM Capability Maturity, and Integrated Project Delivery in the AECO Industry: The Influences of BIM Diffusion and Moral Hazard. J. Urban Plan. Dev. 2022, 148, 04022025. [Google Scholar] [CrossRef] [Scilit]
  13. Yu, W.-D.; Chang, H.-K.; Wang, K.-C. Measuring the value and cost of BIM use—An empirical lesson learned from Taiwan’s social housing projects. Can. J. Civ. Eng. 2023, 50, 1047–1065. [Google Scholar] [CrossRef] [Scilit]
  14. Mata, M.; Ancheta, R.; Batucan, G.; Gonzales, G.G. Exploring technology acceptance model with system characteristics to investigate sustainable building information modeling adoption in the architecture, engineering, and construction industry: The case of the Philippines. Soc. Sci. Humanit. Open 2024, 10, 100967. [Google Scholar] [CrossRef] [Scilit]
  15. Li, R.; Niu, Z.; Liu, C.; Wu, B. The co-movement effect of managers’ psychological factors on the BIM adoption decision in SMEs: A study based on fsQCA. Eng. Constr. Archit. Manag. 2024, 31, 1454–1472. [Google Scholar] [CrossRef] [Scilit]
  16. Waqar, A.; Shafiq, N.; Othman, I.; Alqahtani, F.K.; Alshehri, A.M.; Sherif, M.A.; Almujibah, H.R. Examining the impact of BIM implementation on external environment of AEC industry: A PEST analysis perspective. Dev. Built Environ. 2024, 17, 100347. [Google Scholar] [CrossRef] [Scilit]
  17. Sajjad, M.; Hu, A.; RADU, D.; Waqar, A.; Almujibah, H.R.; Mateen, A. BIM implementation in project management practices for sustainable development: Partial Least square approach. Ain Shams Eng. J. 2024, 15, 103048. [Google Scholar] [CrossRef] [Scilit]
  18. Gharaibeh, L.; Matarneh, S.; Lantz, B.; Eriksson, K. Quantifying the influence of BIM adoption: An in-depth methodology and practical case studies in construction. Results Eng. 2024, 23, 102555. [Google Scholar] [CrossRef] [Scilit]
  19. Wei, W.; Prasetyo, Y.T.; Belmonte, Z.J.A.; Cahigas, M.M.L.; Nadlifatin, R.; Gumasing, M.J.J. Applying the technology acceptance model–Theory of planned behavior (TAM-TPB) model to study the acceptance of building information modeling (BIM) in green building in China. Acta Psychol. 2025, 254, 104790. [Google Scholar] [CrossRef] [Scilit]
  20. Mehrizi, H.Z.; Pourrostam, T.; Ramesht, M.H.; Rahimi, M. Developing a Model to Assess and Address Challenges in Implementing BIM for Commercial Buildings: A PLS-SEM Analysis in Iran. J. Archit. Eng. 2025, 31, 04025042. [Google Scholar] [CrossRef] [Scilit]
  21. Qin, X.; Shi, Y.; Lyu, K.; Mo, Y. Using a TAM-TOE model to explore factors of Building Information Modelling (BIM) adoption in the construction industry. J. Civ. Eng. Manag. 2020, 26, 259–277. [Google Scholar] [CrossRef] [Scilit]
  22. Cui, Q.; Hu, X.; Liu, X.; Zhao, L.; Wang, G. Understanding Architectural Designers’ Continuous Use Intention Regarding BIM Technology: A China Case. Buildings 2021, 11, 448. [Google Scholar] [CrossRef] [Scilit]
  23. Ao, Y.; Liu, Y.; Tan, L.; Tan, L.; Zhang, M.; Feng, Q.; Zhong, J.; Wang, Y.; Zhao, L.; Martek, I. Factors Driving BIM Learning Performance: Research on China’s Sixth National BIM Graduation Design Innovation Competition of Colleges and Universities. Buildings 2021, 11, 616. [Google Scholar] [CrossRef] [Scilit]
  24. Olawumi, T.O.; Chan, D.W.M. An empirical survey of the perceived benefits of executing BIM and sustainability practices in the built environment. Constr. Innov. 2019, 19, 321–342. [Google Scholar] [CrossRef] [Scilit]
  25. Park, K.; Kim, K. Essential BIM Input Data Study for Housing Refurbishment: Homeowners’ Preferences in the UK. Buildings 2014, 4, 467–487. [Google Scholar] [CrossRef] [Scilit]
  26. Elshafey, A.; Saar, C.C.; Aminudin, E.B.; Gheisari, M.; Usmani, A. Technology acceptance model for Augmented Reality and Building Information Modeling integration in the construction industry. J. Inf. Technol. Constr. 2020, 25, 161–172. [Google Scholar] [CrossRef] [Scilit]
  27. Xue, X.; Sun, X.; Xue, W.; Wang, Y.; Liao, L. Investigating building information modeling acceptance in the Chinese AECO industry. Eng. Constr. Archit. Manag. 2023, 30, 4253–4270. [Google Scholar] [CrossRef] [Scilit]
  28. Deng, J.; Li, X.; Rao, J. Research on Influencing Factors and Driving Path of BIM Application in Construction Projects Based on the SD Model in China. Buildings 2023, 13, 2794. [Google Scholar] [CrossRef] [Scilit]
  29. Eze, E.C.; Aghimien, D.O.; Aigbavboa, C.O.; Sofolahan, O. Building information modelling adoption for construction waste reduction in the construction industry of a developing country. Eng. Constr. Archit. Manag. 2024, 31, 2205–2223. [Google Scholar] [CrossRef] [Scilit]
  30. Wang, K.; Guo, M.; Di Sarno, L.; Sun, Y. Decoding BIM Adoption: A Meta-Analysis of 10 Years of Research—Exploring the Influence of Sample Size, Economic Level, and National Culture. Buildings 2024, 14, 920. [Google Scholar] [CrossRef] [Scilit]
  31. Olugboyega, O. Differential relationships in the BIM implementation process in a developing country: The role of essential BIM implementation strategies. Eng. Constr. Archit. Manag. 2024, 31, 3283–3307. [Google Scholar] [CrossRef] [Scilit]
  32. Davis, F.D. Perceived Usefulness, Perceived Ease of Use, and User Acceptance of Information Technology. MIS Q. 1989, 13, 319. [Google Scholar] [CrossRef] [Scilit]
  33. Davis, F.D. User Acceptance of Information Systems: The Technology Acceptance Model (TAM); University of Michigan: Ann Arbor, MI, USA, 1987. [Google Scholar]
  34. Rosli, M.S.; Saleh, N.S.; Ali, A.M.; Bakar, S.A.; Tahir, L.M. A Systematic Review of the Technology Acceptance Model for the Sustainability of Higher Education during the COVID-19 Pandemic and Identified Research Gaps. Sustainability 2022, 14, 11389. [Google Scholar] [CrossRef] [Scilit]
  35. Perlman, G. Perceived Usefulness and Ease of Use. Available online: https://garyperlman.com/quest/quest.cgi?form=PUEU (accessed on 12 November 2025).
  36. Dawes, J. Do Data Characteristics Change According to the Number of Scale Points Used? An Experiment Using 5-Point, 7-Point and 10-Point Scales. Int. J. Mark. Res. 2008, 50, 61–104. [Google Scholar] [CrossRef] [Scilit]
  37. Google. Google Forms. Google. Available online: https://docs.google.com/forms/u/0/?tgif=d (accessed on 9 October 2025).
  38. The Jamovi Project. Jamovi. Available online: https://www.jamovi.org/ (accessed on 12 November 2025).
  39. Ringle, C.; Wende, S.; Becker, J.-M. SmartPLS 3. Bönningstedt: SmartPLS. Available online: https://www.smartpls.com (accessed on 9 October 2025).
  40. Prensky, M. Digital Natives, Digital Immigrants Part 1. Horizon 2001, 9, 1–6. [Google Scholar] [CrossRef] [Scilit]
Figure 1. Study stages and flow.
Buildings 16 00106 g001
Figure 2. Perceived Usefulness scores grouped by Age (Histogram and Density Plot).
Buildings 16 00106 g002
Figure 3. Perceived Usefulness scores grouped by Background (Histogram and Density Plot).
Buildings 16 00106 g003
Figure 4. Perceived Usefulness scores grouped by Profession (Histogram and Density Plot).
Buildings 16 00106 g004
Figure 5. Perceived Usefulness scores grouped by Gender (Histogram and Density Plot).
Buildings 16 00106 g005
Figure 6. Perceived Usefulness scores grouped by Student Status (Histogram and Density Plot).
Buildings 16 00106 g006
Figure 7. Perceived Usefulness scores grouped by Computer Type (Histogram and Density Plot).
Buildings 16 00106 g007
Figure 8. Perceived Usefulness scores grouped by Gamer Status (Histogram and Density Plot).
Buildings 16 00106 g008
Figure 9. Perceived Usefulness scores grouped by Training Preference (Histogram and Density Plot).
Buildings 16 00106 g009
Figure 10. Perceived Usefulness scores grouped by Coding Experience (Histogram and Density Plot).
Buildings 16 00106 g010
Figure 11. Perceived Usefulness scores grouped by Having Taken Academic Courses on BIM Before (Histogram and Density Plot).
Buildings 16 00106 g011
Figure 12. Perceived Usefulness Scores grouped by participation in a BIM certification training program (Histogram and Density Plot).
Buildings 16 00106 g012
Figure 13. Perceived Ease-of-Use scores grouped by Age (Histogram and Density Plot).
Buildings 16 00106 g013
Figure 14. Perceived Ease-of-Use scores grouped by Background (Histogram and Density Plot).
Buildings 16 00106 g014
Figure 15. Perceived Ease-of-Use scores grouped by Profession (Histogram and Density Plot).
Buildings 16 00106 g015
Figure 16. Perceived Ease-of-Use scores grouped by Gender (Histogram and Density Plot).
Buildings 16 00106 g016
Figure 17. Perceived Ease-of-Use scores grouped by Student Status (Histogram and Density Plot).
Buildings 16 00106 g017
Figure 18. Perceived Ease-of-Use scores grouped by Computer Type (Histogram and Density Plot).
Buildings 16 00106 g018
Figure 19. Perceived Ease-of-cUse sores grouped by Gamer Status (Histogram and Density Plot).
Buildings 16 00106 g019
Figure 20. Perceived Ease-of-Use scores grouped by Training Preference (Histogram and Density Plot).
Buildings 16 00106 g020
Figure 21. Perceived Ease-of-Use scores grouped by Experience in Coding (Histogram and Density Plot).
Buildings 16 00106 g021
Figure 22. Perceived Ease-of-Use scores grouped by Having Academic Courses on BIM Before (Histogram and Density Plot).
Buildings 16 00106 g022
Figure 23. Perceived Ease-of-Use scores grouped by participation in a BIM certification training program (Histogram and Density Plot).
Buildings 16 00106 g023
Figure 24. Results of the regression of Perceived Usefulness on Perceived Ease-of-Use scores. The standardized regression coefficient of Perceived Ease-of-Use was found to be 0.661, and the R2 value was 0.437 (p = 0.00). The result confirms the TAM theory and indicates that Perceived Ease-of-Use influences Perceived Usefulness in the context of BIM Tools.
Buildings 16 00106 g024
Table 1. Summary of selected studies and findings related to BIM acceptance.
StudyCountry/ContextNumber of Participants (N)Target Group/Participant ProfileModel/MethodKey Findings/BIM Acceptance
Sanchís-Pedregosa et al. (2020) [5]Peru/Construction industry73Architects and engineersTechnology Acceptance Model (TAM)Perceived Usefulness (PU): BIM’s contribution to projects has the strongest impact on acceptance intention.
Perceived Ease of Use (PEOU): Ease of use has no significant impact on acceptance intention.
Peng et al. (2022) [6]China/AEC1090Undergraduate students in the AEC departmentsthe Unified Theory of Acceptance and Use of Technology (UTAUT); SEM; SurveyLearning attitude, performance expectation, and social influence positively affected students’ learning intention, which in turn indirectly increased learning behavior.
Torres et al. (2025) [7]China/Construction industry75Undergraduate and graduate students studying construction management.Custom-designed surveys, quantitative data collection methodBIM is seen as more effective in cost management during the early stages of a project.
Ahankoob et al. (2025) [8]Australia/Construction industry773Undergraduate students in civil engineering, construction management, and related AEC disciplines.Exploratory mixed methods using the TAMStudents view the professional value of BIM positively, but they have experienced uncertainty due to BIM’s steep learning curve, especially with the integration of new technologies such as artificial intelligence (AI).
Okakpu et al. (2020) [9]New Zealand/Construction industry105Construction professionalsStructural Equation Modeling (SEM)Information sharing, improvement tools, corporate culture, and customer expectations strongly influence BIM adoption, while environmental factors can positively or negatively affect BIM usage in renovation projects.
Huang et al. (2021) [10]China/Construction industry300Building designers, construction company managers, employees at green building certification companies.Survey; Reliability analysis; Exploratory factor analysis; Confirmatory factor analysisBIM contributes to green building processes, but factors exist that hinder its widespread adoption.
Shaqour (2022) [11]Egypt/Construction industry106Those with experience using BIM applicationsSurvey; descriptive; analytical; quantitativeBIM enhances project management; it contributes significantly to risk, communication, and stakeholder management.
Wang and Feng (2022) [12]-/Construction industry295Professionals in the fields of architecture, engineering, construction, and businessSEM; SurveyBIM technology, process, and policies have a positive effect on BIM capability maturity.
Yu et al. (2023) [13]-/Construction industry50Construction industry professionalsAdaptive Analytic Hierarchy Process (AHP); SurveyThe role of the government and the industry standards are critical in the acceptance of BIM.
Mata et al. (2024) [14]Philippines/AEC527AEC sector professionalsExtended TAM; Partial Least Squares-Structural Equation Modeling (PLS-SEM)BIM acceptance shows potential among young digital natives.
Li et al. (2024) [15]-/AEC192Small- and medium-sized enterprises (SMEs)Fuzzy set qualitative comparative analysis (fsQCA); Necessary conditions analysis (NCA)High perceived risk (PR) and low perceived business value (PBV) are associated with low BIM acceptance intent.
Waqar et al. (2024) [16]-/AEC216Professionals working in the AEC sectorQuantitative research approach; survey; purposive samplingBIM creates positive impacts in social, economic, political, and technological areas.
Sajjad et al. (2024) [17]Pakistan/Construction industry215Construction industry professionalsExploratory Factor Analysis; SEMCommunication and resource management are effective in the success of BIM
Gharaibeh et al. (2024) [18]Swedish/Construction industry-Construction industry stakeholdersSurvey; industry insights; formulated equations validated; case studiesThe benefits of BIM acceptance and implementation cannot be measured solely by the initial cost; operational benefits and lifecycle gains are also critical.
Wei et al. (2025) [19]China/Construction industry588Practitioners and researchers working on green building projectsTAM and the Theory of Planned Behavior (TPB)BIM system quality, information quality, and system services affect the usability and ease of use of BIM.
Mehrizi et al. (2025) [20]Iran/Construction industry115Construction industry experts, BIM practitioners, and relevant stakeholdersSurvey; (PLS-SEM)Barriers to BIM implementation can be overcome through training programs, policy reforms, and financial incentives.
Qin et al. (2020) [21]China/Construction industry120Professionals working in development, construction, design, and consulting companiesTechnology Acceptance Model (TAM) and Technology Organization Environment (TOE); Decision Making Trial and Evaluation Laboratory (DEMATEL)National policy requirements are the most important variable affecting BIM adoption.
Cui et al. (2021) [22]China/Construction industry207Architectural design companiesTAM and expectation-confirmation theory (ECT); SEM; SurveyPerceived ease of use and satisfaction directly influence the continuous use intention (CUI) of BIM technology, while perceived usefulness and expectation verification show an indirect effect through satisfaction.
Ao et al. (2021) [23]China/University2777Undergraduate students in architecture, engineering, and construction (AEC)Data collection via survey (using a 5-point Likert scale); Reliability test; Structural validity test; Test of group differences: t-test and ANOVA; Exploratory Factor Analysis; Ordered Logistic RegressionTransferring BIM developments in the industry to the learning environment in real time increases students’ interest in BIM and their desire to learn.
Olawumi and Chan (2019) [24]21 countries/Construction industry220Architecture and construction industry professionals (engineers, managers, consultants, auditors)SurveyWhen BIM and sustainability are used together, gains are achieved in efficiency, coordination, quality, and environmental performance; participant experience and professional group influence this perception.
Park and Kim (2014) [25]UK/Construction industry151Homeowners and construction professionalsSurvey; Likert ScaleIt provides important information on the more effective use of BIM in residential renovation processes.
Table 2. Demographic and socio-economic status of respondents.
Factual QuestionsFrequencyPercentage
What is your age?<256227.4%
≥2516472.6%
What is the department you graduated or will graduate from?Civil Engineering5725.1%
Architecture14865.2%
Mechanical Engineering62.6%
Other167.0%
Which describes your employment field best?Civil Engineering4419.4%
Architecture11349.8%
Mechanical Engineering62.6%
Unemployed3816.7%
Other2611.5%
What is your gender?Male12555.1%
Female10244.9%
Are you an undergraduate student?Yes5725.1%
No17074.9%
Which is your main PC for work or school?Laptop17878.4%
Desktop4921.6%
Do you have the habit of playing computer games?Yes6528.6%
No16271.4%
Table 3. Experience in and willingness to adopt BIM and advanced computing.
Factual Questions (Contd.)FrequencyPercentage
If you must join a BIM training, do you prefer it to be distance learning or face-to-face?Distance Learning11450.2%
Face-to-face11349.8%
Have you done any coding before?Yes9642.3%
No13157.7%
Have you taken academic courses on BIM?Yes11651.1%
No11148.9%
Have you participated in a certification training program on BIM?Yes6629.1%
No16170.9%
Table 4. Frequency table.
ItemScale ItemFrequencyPercentage
PU1. Using BIM Tools in my job would enable me to accomplish tasks more quicklyStrongly Disagree10.4%
Neutral94.0%
Agree10747.1%
Strongly Agree11048.5%
PU2. Using BIM Tools will improve my job performance.Disagree52.2%
Neutral94.0%
Agree10244.9%
Strongly Agree11148.9%
PU3. Using BIM Tools in my job would increase my productivity.Strongly Disagree31.3%
Disagree73.1%
Neutral167.0%
Agree9240.5%
Strongly Agree10948.0%
PU4. Using BIM Tools would enhance my effectiveness on the job.Disagree73.1%
Neutral135.7%
Agree9843.2%
Strongly Agree10948.0%
PU5. Using BIM Tools would make it easier to do my jobStrongly Disagree20.9%
Disagree31.3%
Neutral104.4%
Agree9843.2%
Strongly Agree11450.2%
PU6. I would find BIM Tools useful in my jobStrongly Disagree10.4%
Disagree52.2%
Neutral114.8%
Agree8637.9%
Strongly Agree12454.6%
PEOU1. Learning to operate BIM Tools would be easy for meStrongly Disagree52.2%
Disagree73.1%
Neutral5323.3%
Agree9742.7%
Strongly Agree6528.6%
PEOU2. I would find it easy to get the BIM Tools to do what I want it to doDisagree104.4%
Neutral5423.8%
Agree10948.0%
Strongly Agree5423.8%
PEOU3. My interaction with BIM Tools would be clear and understandableStrongly Disagree20.9%
Neutral3515.4%
Agree10646.7%
Strongly Agree8437.0%
PEOU4. I would find BIM Tools to be flexible to interact withStrongly Disagree41.8%
Disagree156.6%
Neutral5624.7%
Agree9541.9%
Strongly Agree5725.1%
PEOU5. It would be easy for me to become skillful at using BIM ToolsStrongly Disagree31.3%
Disagree62.6%
Neutral52.2%
Agree10244.9%
Strongly Agree11148.9%
PEOU6. I would find BIM Tools easy to useStrongly Disagree31.3%
Disagree2511.0%
Neutral6830.0%
Agree9541.9%
Strongly Agree3615.9%
Table 5. Summary of results on factors influencing the use perceptions of BIM tools.
External FactorConstructTest Type(s)Test Statisticp-ValueInterpretation
AgePUMann–Whitney-U Brunner–MunzelU = 5724.0;
W = 1.47
0.130
>0.05
No difference between age groups.
BackgroundPUKruskal–Wallis
Brunner–Dette–Munk
K-W = 1.929;
ATS = 4.183
0.587
0.999
No influence of academic background.
ProfessionPUBrunner–Dette–MunkATS = 18.1661.000Profession does not affect perceived usefulness.
GenderPUBrunner–MunzelW = −2.09980.0369Females perceive BIM tools as more useful.
Student StatusPUBrunner–MunzelW = −0.58800.5581Student vs. non-student- no difference.
Computer TypePUBrunner–MunzelW = −0.74210.4606Desktop vs. laptop-no difference.
Gamer StatusPUBrunner–MunzelW = 1.48800.1396Gaming experience has no effect.
Training Type PreferencePUBrunner–MunzelW = −0.99180.3224No difference between online and face-to-face training.
Coding ExperiencePUBrunner–MunzelW = −0.79110.4298Coding experience has no effect.
Academic BIM Courses BeforePUBrunner–MunzelW = −1.11840.2647No effect of prior academic BIM courses.
BIM Certification Program ParticipationPUBrunner–MunzelW = −2.88380.0046Certification training increases usefulness perception.
AgePEOUBrunner–MunzelW = 1.47>0.05No difference by age.
BackgroundPEOUBrunner–Dette–MunkATS = 17.19290.999Background does not affect ease-of-use perception.
ProfessionPEOUBrunner–Dette–MunkATS = 22.65931.000Profession has no influence.
GenderPEOUBrunner–MunzelW = 0.15260.8789Gender has no influence.
Student StatusPEOUBrunner–MunzelW = −0.30710.7595Student vs. non-student-no difference.
Computer TypePEOUBrunner–MunzelW = −0.51680.6069Desktop vs. laptop-no difference.
Gamer StatusPEOUBrunner–MunzelW = −0.99540.3222Gaming experience has no effect.
Training Type PreferencePEOUBrunner–MunzelW = −0.78280.4346No difference between online and face-to-face training.
Coding ExperiencePEOUBrunner–MunzelW = 0.75070.4537Coding experience has no effect.
Academic BIM Courses BeforePEOUBrunner–MunzelW = −1.60040.1110No effect of prior academic BIM courses.
BIM Certification Program ParticipationPEOUBrunner–MunzelW = −1.85210.0664Certification training does not affect Ease of Use perception.
Table 6. Differences in data distribution.
VariableFactorTestResult
Perceived UsefulnessAge *Cramer-von Misesp: 1.221 × 10⁻⁵ < 0.05
Perceived UsefulnessBackgroundAnderson-Darling k-samplep: 0.25 ≥ 0.05
Perceived UsefulnessProfessionAnderson-Darling k-samplep: 0.25 ≥ 0.05
Perceived UsefulnessGenderCramer-von Misesp: 0.053 ≥ 0.05
Perceived UsefulnessStudent Status *Cramer-von Misesp: 178 × 10−5 < 0.05
Perceived UsefulnessComputing Habits *Cramer-von Misesp: 7.683 × 10⁻⁸ < 0.05
Perceived UsefulnessBeing a Gamer *Cramer-von Misesp: 3.143 × 10⁻⁵ < 0.05
Perceived UsefulnessTraining Type PreferenceCramer-von Misesp: 0.2327 ≥ 0.05
Perceived UsefulnessExperience of CodingCramer-von Misesp: 0.34 ≥ 0.05
Perceived UsefulnessHaving Academic Courses on BIM BeforeCramer-von Misesp: 0.2525 ≥ 0.05
Perceived UsefulnessParticipation in a BIM certification training program *Cramer-von Misesp: 3.791 × 10⁻⁵ < 0.05
Perceived Ease of UseAgeCramer-von Misesp: 0.1125 ≥ 0.05
Perceived Ease of UseBackgroundAnderson-Darling k-samplep: 0.25 ≥ 0.05
Perceived Ease of UseProfessionAnderson-Darling k-samplep: 0.25 ≥ 0.05
Perceived Ease of UseGenderCramer-von Misesp: 0.528 ≥ 0.05
Perceived Ease of UseStudent StatusCramer-von Misesp: 0.058 ≥ 0.05
Perceived Ease of UseComputing Habits *Cramer-von Misesp: 0.02 < 0.05
Perceived Ease of UseBeing a Gamer *Cramer-von Misesp: 0.009 < 0.05
Perceived Ease of UseTraining Type PreferenceCramer-von Misesp: 0.322 ≥ 0.05
Perceived Ease of UseExperience of CodingCramer-von Misesp: 0.606 ≥ 0.05
Perceived Ease of UseHaving Academic Courses on BIM BeforeCramer-von Misesp: 0.079 ≥ 0.05
Perceived Ease of UseParticipation in a BIM certification training program *Cramer-von Misesp: 0.018 < 0.05
* Significant difference exists between data distributions of groups.
Disclaimer/Publisher’s Note: The statements, opinions and data contained in all publications are solely those of the individual author(s) and contributor(s) and not of MDPI and/or the editor(s). MDPI and/or the editor(s) disclaim responsibility for any injury to people or property resulting from any ideas, methods, instructions or products referred to in the content.