


Abstract
To investigate the flexural behavior of steel–concrete composite bridge decks with stud–perfobond leist (PBL) shear connectors, two specimens were designed with the stud spacing as the main variable, and static bending tests were conducted. Additionally, refined finite element models were constructed for evaluating the influence of shear connector types, concrete strength, stud diameter, stud height, and PBL hole diameter on the performance and flexural capacity of the structure. The results show that, under bending loads, the failure of the composite bridge deck is mainly concrete crushing and steel plate yielding. When the spacing of the stud decreases, both the flexural behavior of the composite bridge decks and the shear resistance at the steel–concrete interface are enhanced. The steel–concrete composite bridge decks with stud–PBL shear connectors showed higher overall flexural stiffness and flexural capacity than the steel–concrete composite bridge decks with single-type shear connectors. Concrete strength had a pronounced influence on the flexural capacity of the deck system, while the effects of stud diameter and height were minor. As the PBL hole diameter increased, the flexural capacity of the specimens exhibited a decreasing tendency.
1. Introduction
Steel–concrete composite bridge decks are a new type of bridge deck formed by connecting steel plates and concrete through shear connectors [1]. Compared with the conventional concrete composite bridge decks, this composite bridge deck eliminates the need for formwork removal and temporary supports, improving construction efficiency and economy. Shear connectors are essential for achieving composite action between a steel plate and concrete, which directly influences the interfacial shear transfer and overall structural behavior [2,3,4]. Common types of shear connectors include stud shear connectors, perfobond leist (PBL) shear connectors, and angle shear connectors. Stud shear connectors are easy to install and exhibit excellent shear resistance. Therefore, they have been widely adopted as the primary shear connectors in early engineering practice [5,6]. Building on these advantages, researchers have conducted systematic investigations into the mechanical behavior and design optimization of stud shear connectors. Sonoda et al. [7,8] conducted static tests and investigated the influence of stud arrangement and quantity on punching shear capacity. However, with the growing demand for long-span bridges operating under heavy traffic and severe fatigue conditions, the shortcomings of stud shear connectors have become increasingly pronounced. These limitations are mainly reflected in their limited uplift resistance, inadequate fatigue durability, and insufficient control of interface slip.
In this context, PBL shear connectors have attracted increasing attention as a promising alternative. The PBL connector achieves a superior load capacity, stiffness, and fatigue resistance through the cooperative action between the concrete dowel and the perforated rebars. Owing to its excellent shear resistance and construction controllability, it is particularly suitable for heavy-load, long-span, and dynamically loaded bridge structures. Kim and Jeong [9,10,11,12] conducted static experiments on profiled steel–concrete composite bridge decks with PBL shear connectors and proposed calculation methods for deflection and load-bearing capacity, considering partial composite action. Fujiyam [13,14] carried out experimental studies. Their studies examined the influence of PBL geometry, arrangement patterns, and steel–concrete interface treatments on ultimate bearing capacity. Based on these findings, Yang et al. [15,16,17] performed static and fatigue tests. The findings indicated that the composite bridge deck possesses high flexural strength, excellent bending stiffness, and good ductility. Fatigue failure began with bottom steel plate cracking and progressed to crushing of the top concrete layer. In addition to conventional stud shear connectors and PBL shear connectors, several novel shear connectors have been proposed in recent years, such as stud-rubber composite connectors [18] and MCL-type connectors [19,20]. However, their mechanical behavior still requires further experimental validation.
Despite continuous improvements in shear connector configurations, the low tensile strength and cracking susceptibility of ordinary concrete still limit the overall behavior of composite bridge decks. To mitigate cracking risks and enhance load-bearing and fatigue behavior, ultra-high-performance concrete (UHPC) has been introduced into steel–concrete composite structures, owing to its high strength and superior ductility. UHPC is a fiber-reinforced cementitious material noted for its high deformability and strong resistance to cracking [21,22,23]. Previous studies have demonstrated that, compared with conventional steel–concrete composite bridge decks, those incorporating UHPC overlays exhibit significantly improved fatigue, flexural, and shear behavior [24,25,26]. Although UHPC has been used in long-span bridge projects, its broad application is still constrained due to its high material cost and the need for complex steam-curing procedures. Proprietary UHPC materials are typically 20–30 times more expensive than conventional concrete [27].
Therefore, a cost-effective steel–concrete composite bridge deck is proposed in this study. The system consists of a thin steel plate, a concrete layer, and stud–PBL shear connectors. The proposed composite bridge deck employs both stud and PBL shear connectors, unlike conventional steel–concrete composite bridge decks that typically use either studs or PBL shear connectors alone. By exploiting the synergistic action of these two types of shear connectors, the proposed composite bridge decks achieve a significantly higher shear capacity and flexural capacity. Meanwhile, compared with composite bridge decks made of UHPC, the proposed structure offers higher economic efficiency and better engineering applicability while maintaining satisfactory mechanical behavior and durability. In this study, two specimens were designed and fabricated, with the stud spacing serving as the main design variable. Static loading tests under positive bending moments were conducted to evaluate and compare the flexural behavior. A parametric study was conducted to evaluate the effects of key parameters on the ultimate load capacity.
2. Experimental Program
2.1. Specimen for Tests
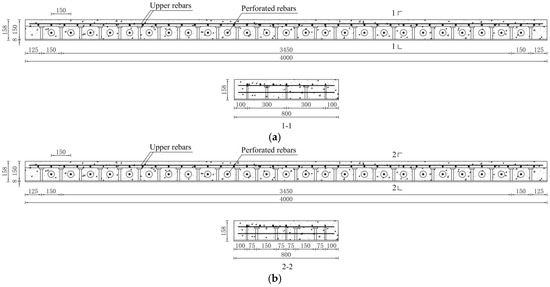
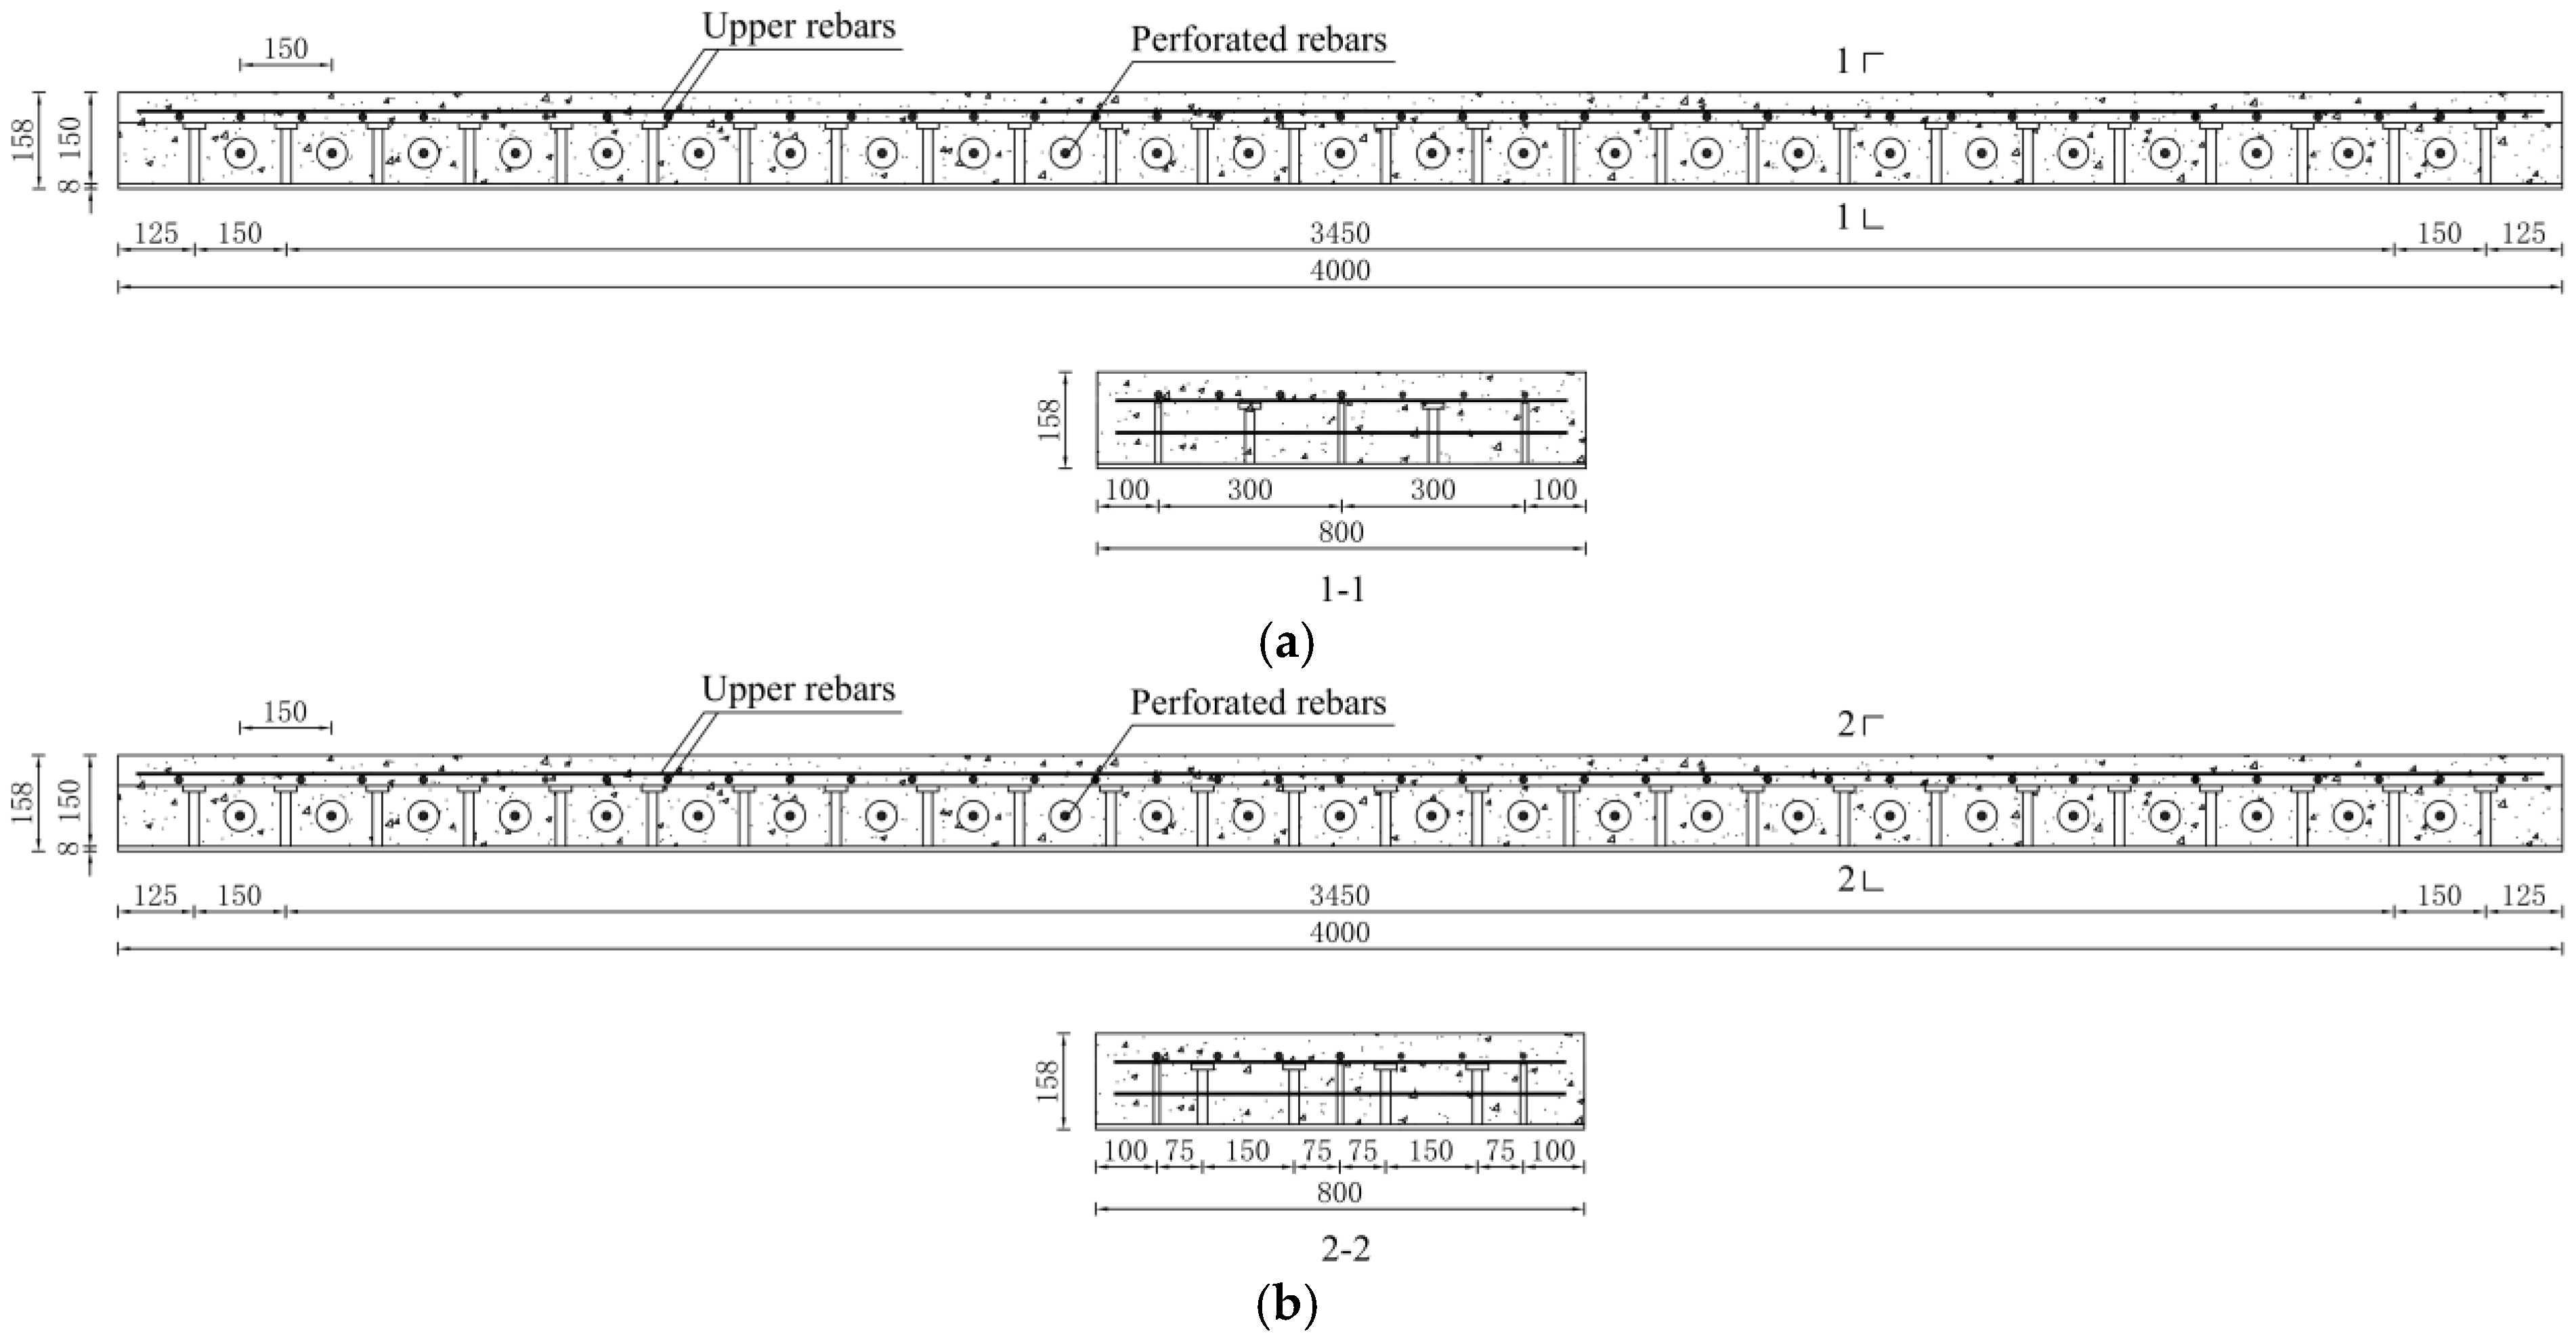
Specimens’ information for the composite bridge decks is shown in Figure 1. Two specimens, denoted as B-1 and B-2, were fabricated. Their dimensions are 4000 mm in length, 800 mm in width, and 158 mm in total depth. The bottom steel plate is 8 mm thick, and the concrete layer is 150 mm thick, connected via stud–PBL shear connectors. Each specimen includes three perfobond strips of 10 mm steel plate, with a transverse PBL spacing of 300 mm. The PBL connectors have a diameter of 50 mm and a height of 100 mm, and both the plate and connectors are made of Q355 steel. Stud connectors are 16 mm in diameter and 100 mm high; their longitudinal spacing is 150 mm for both specimens, while the transverse spacing is 300 mm for B-1 and 150 mm for B-2. Longitudinal and transverse rebars, 10 mm in diameter and placed above the PBL connectors, are fabricated from HRB400 steel.
Figure 1.
Structural information of the composite bridge decks: (a) Specimen B-1; (b) Specimen B-2 (units: mm).
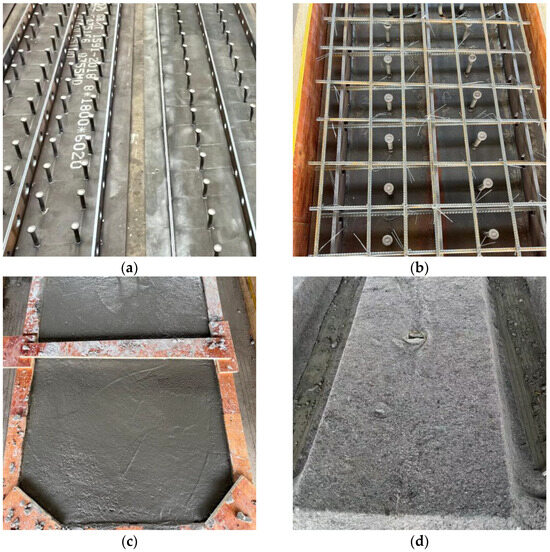
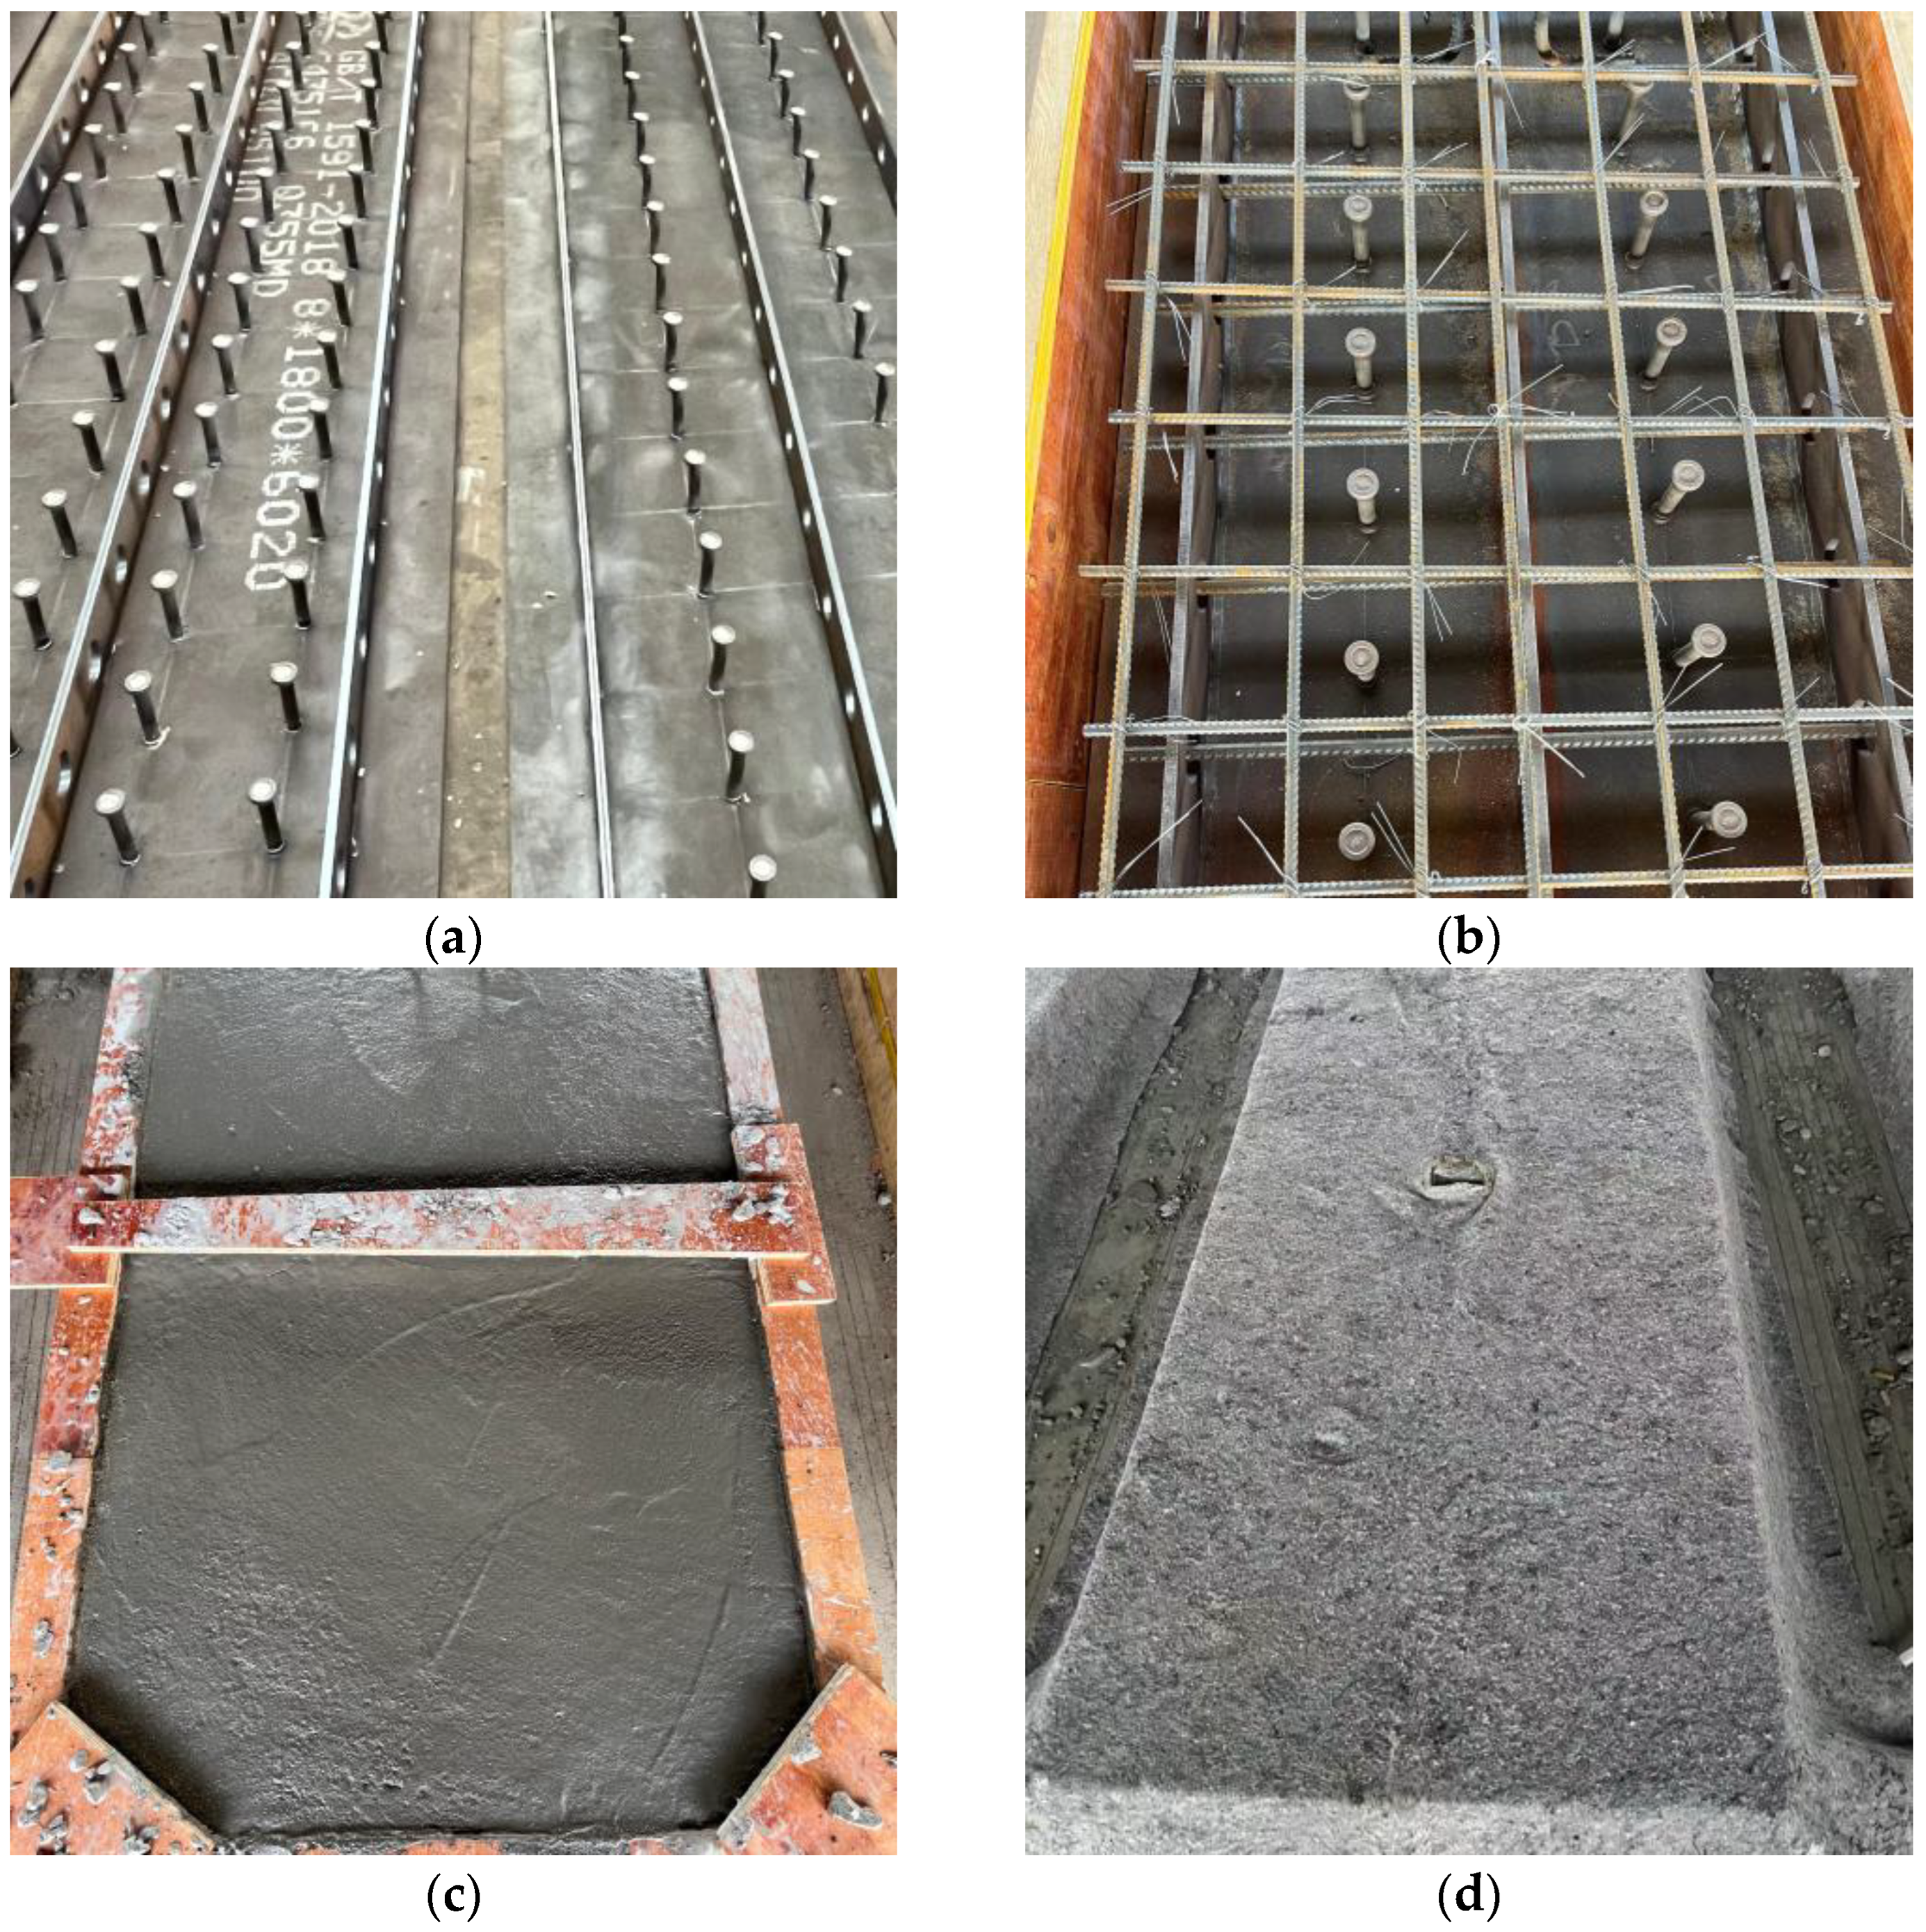
Specimen preparation is shown in Figure 2. The steel components of the specimens were fabricated in a factory, where the PBL shear connectors and stud shear connectors were welded onto the steel plate. Subsequently, the tied rebar mesh was placed above the PBL shear connectors, followed by concrete casting and curing for 28 days.
Figure 2.
Preparation process of the composite bridge decks: (a) fabrication of the steel structure; (b) fabrication of the upper framework; (c) casting the concrete layer; (d) curing of specimens.
2.2. Material Properties
The rebars used in the specimens were HRB400, and the steel plate was Q355. The yield and tensile strengths of the steel are listed in Table 1. The concrete used was C50, and its mix proportions are shown in Table 2. During the casting of the concrete bridge decks, three 150 mm × 150 mm × 150 mm standard concrete cubes were cast from a single batch. After 28 days of curing, the measured compressive strength and elastic modulus of the concrete were 49.6 MPa and 34.49 GPa, respectively. The elastic modulus of steel plate and studs, taken from specification [28] and used in subsequent studies, is 206 GPa.
Table 1.
Mechanical properties of steel rebars, steel plates, and studs.
Table 2.
Mix proportions of the concrete (unit: kg/m3).
2.3. Test Setup and Instrumentation
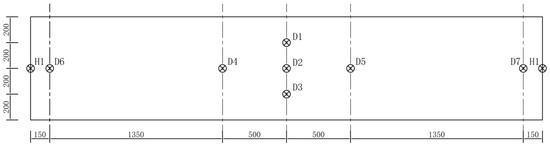
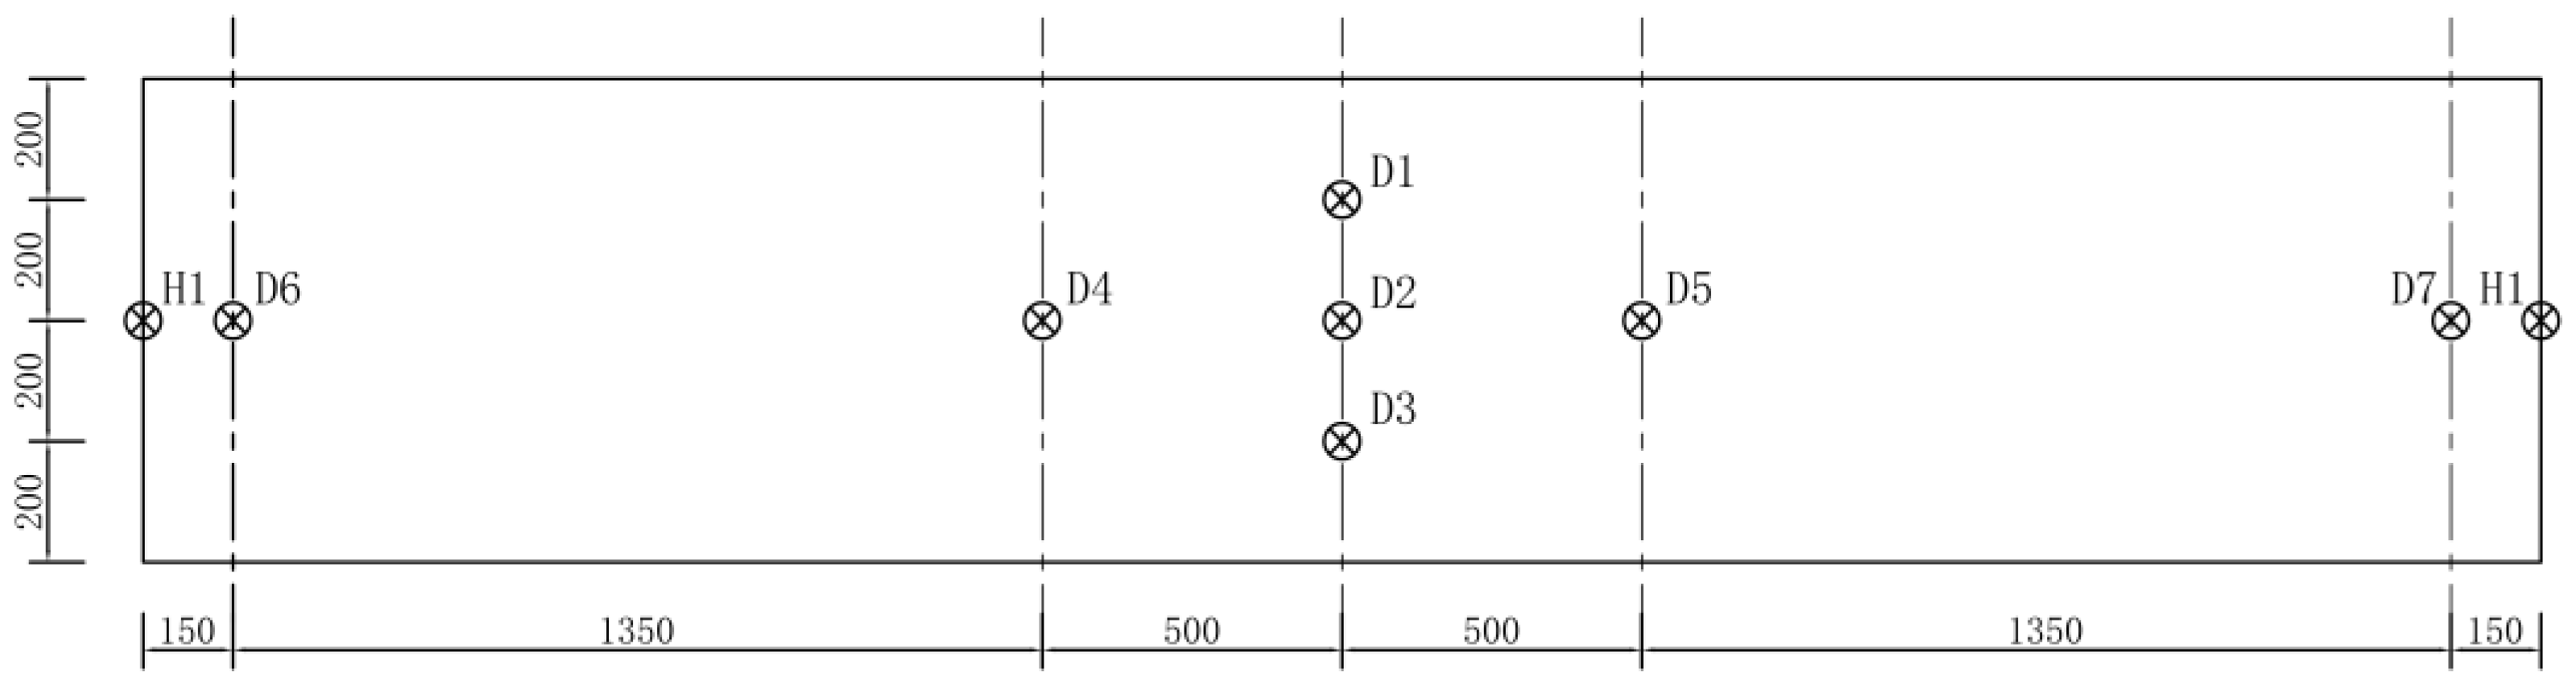
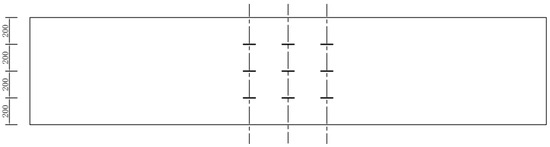
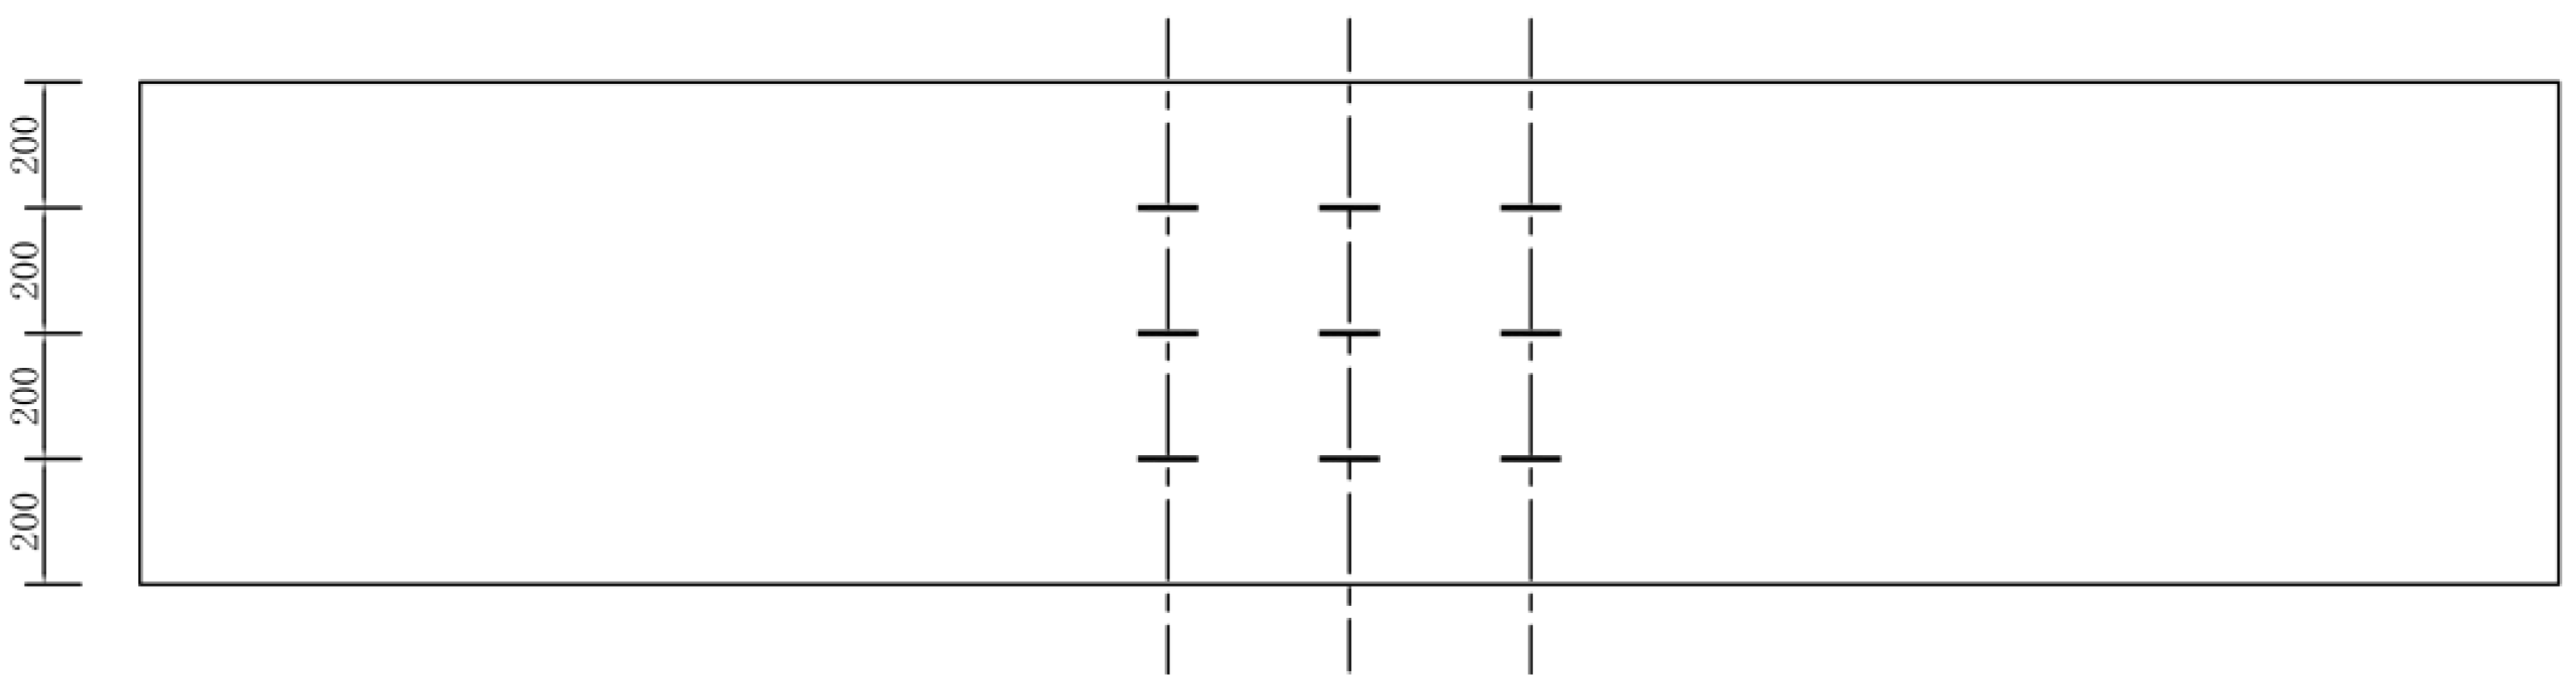
To record the mid-span deflection, three resistance-type displacement sensors (LVDTs) named D1, D2, and D3 were arranged transversely along the bottom surface at the mid-span. Two additional LVDTs, D4 and D5, were mounted beneath the loading points to capture the corresponding local deflections. Meanwhile, two LVDTs, D6 and D7, were positioned above the supports to monitor support settlements. Furthermore, two horizontally oriented LVDTs, H1 and H2, were installed at the supports to measure the relative slip at the steel–concrete interface. To measure the strain distribution in the pure bending section, strain gauges were affixed on the concrete top surface, concrete side surface, and bottom steel plate within this region. The arrangements of LVDTs and strain gauges are shown in Figure 3 and Figure 4.
Figure 3.
Arrangement of LVDTs (units: mm).
Figure 4.
Arrangement of strain gauges within the specimens (units: mm).
2.4. Loading System
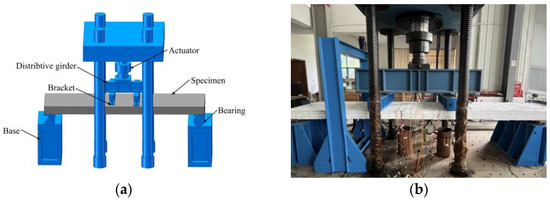
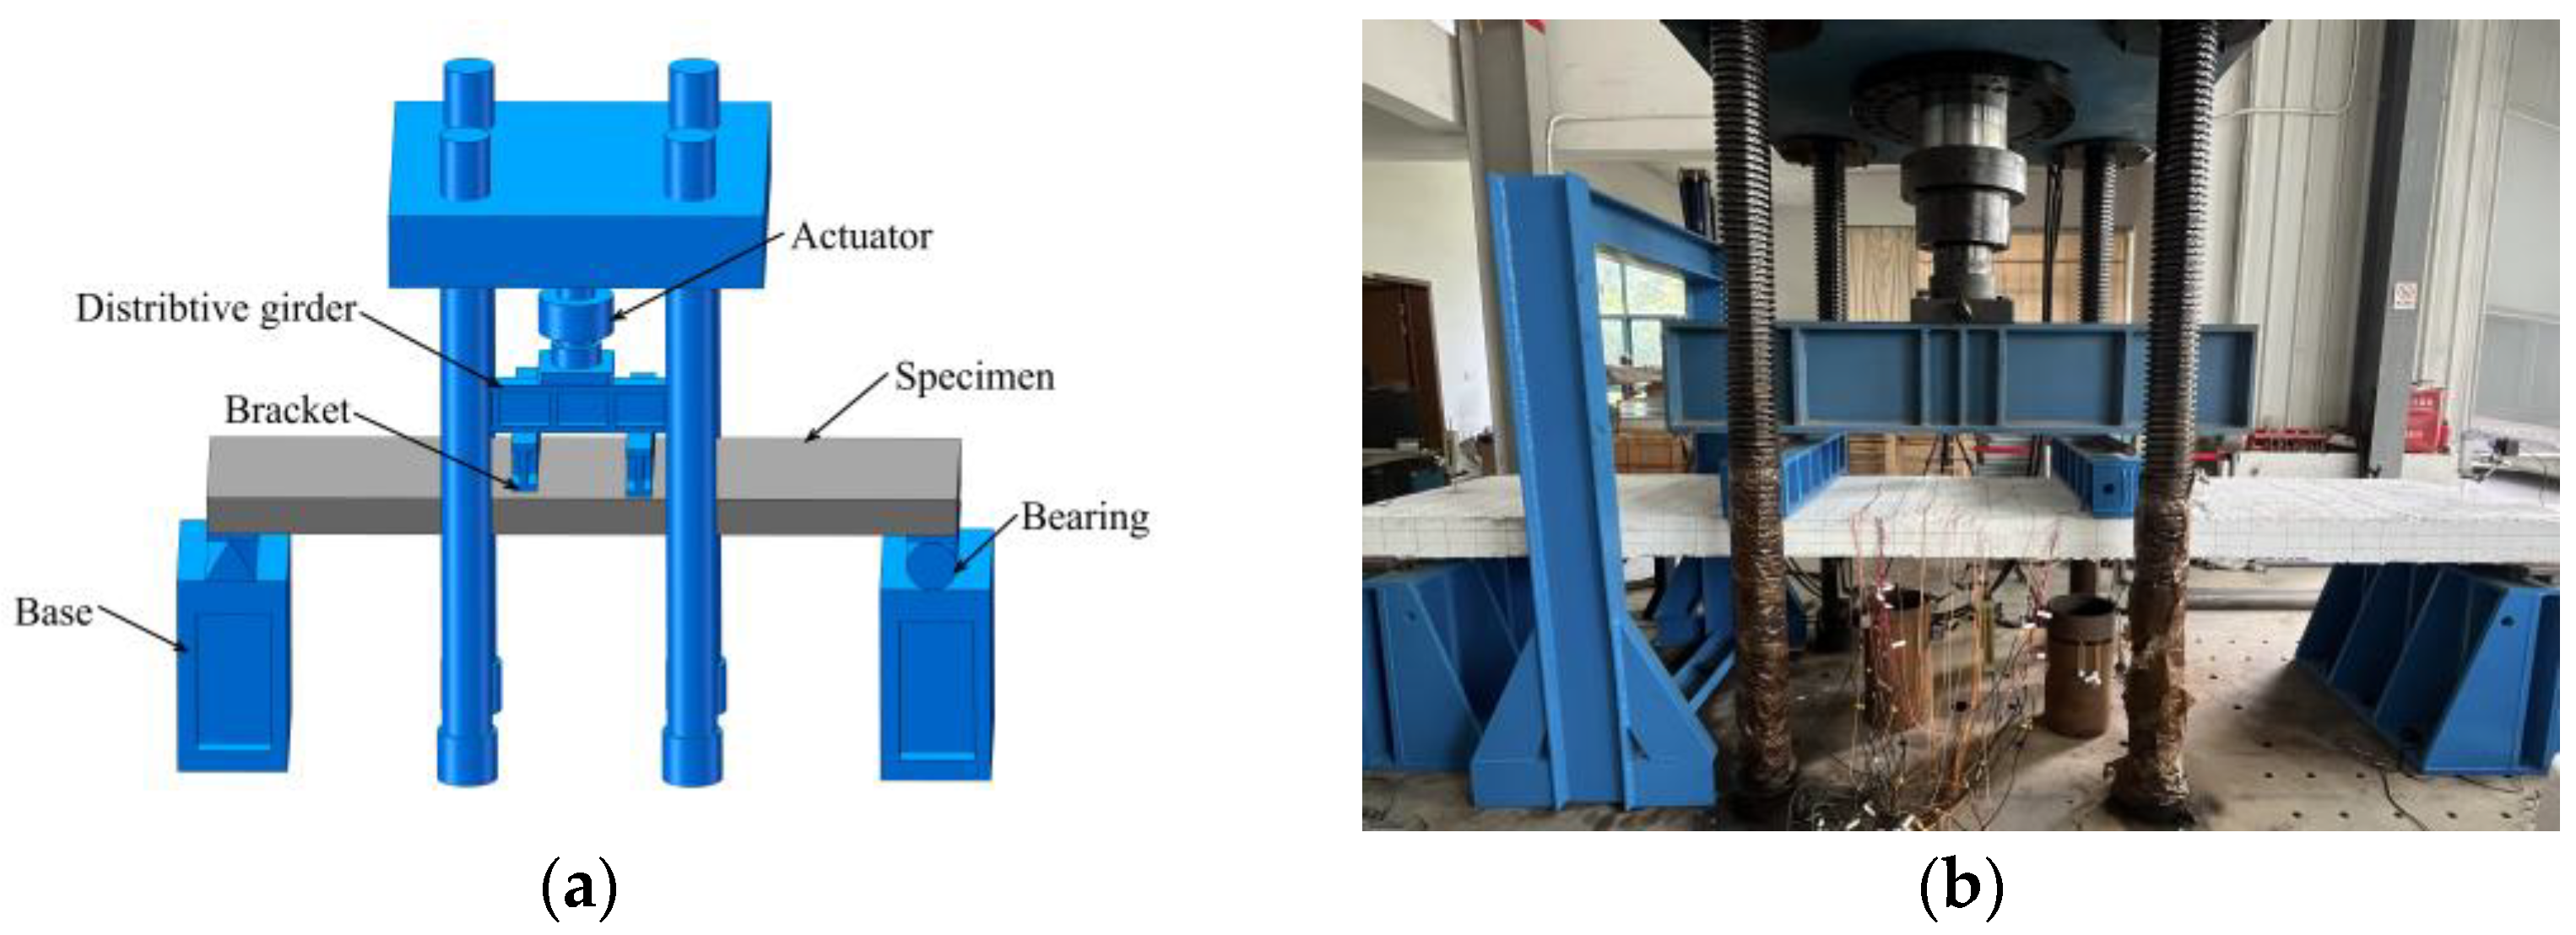
The specimens’ loading setup is illustrated in Figure 5a,b. Both ends of the specimens were simply supported, and two-point symmetric loading was applied to create a pure bending segment of 1000 mm at the mid-span. The simply supported span is 3700 mm. To eliminate contact gaps and ensure stable force transmission, preloading was performed before the main loading. The loading procedure followed the bending member test method specified in the Chinese Standard [29]. A combined force–displacement control scheme was adopted: before reaching the peak load, graded loading was applied in increments of 1/20 of the estimated ultimate load. After reaching the peak load, a displacement control was used, applying a displacement step of 3 mm per increment.
Figure 5.
Loading configuration: (a) schematic illustration; (b) experimental setup.
3. Experimental Results and Observations
3.1. Load–Displacement Response
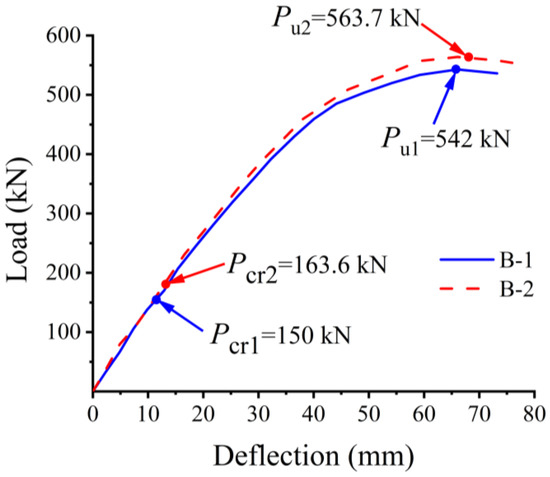
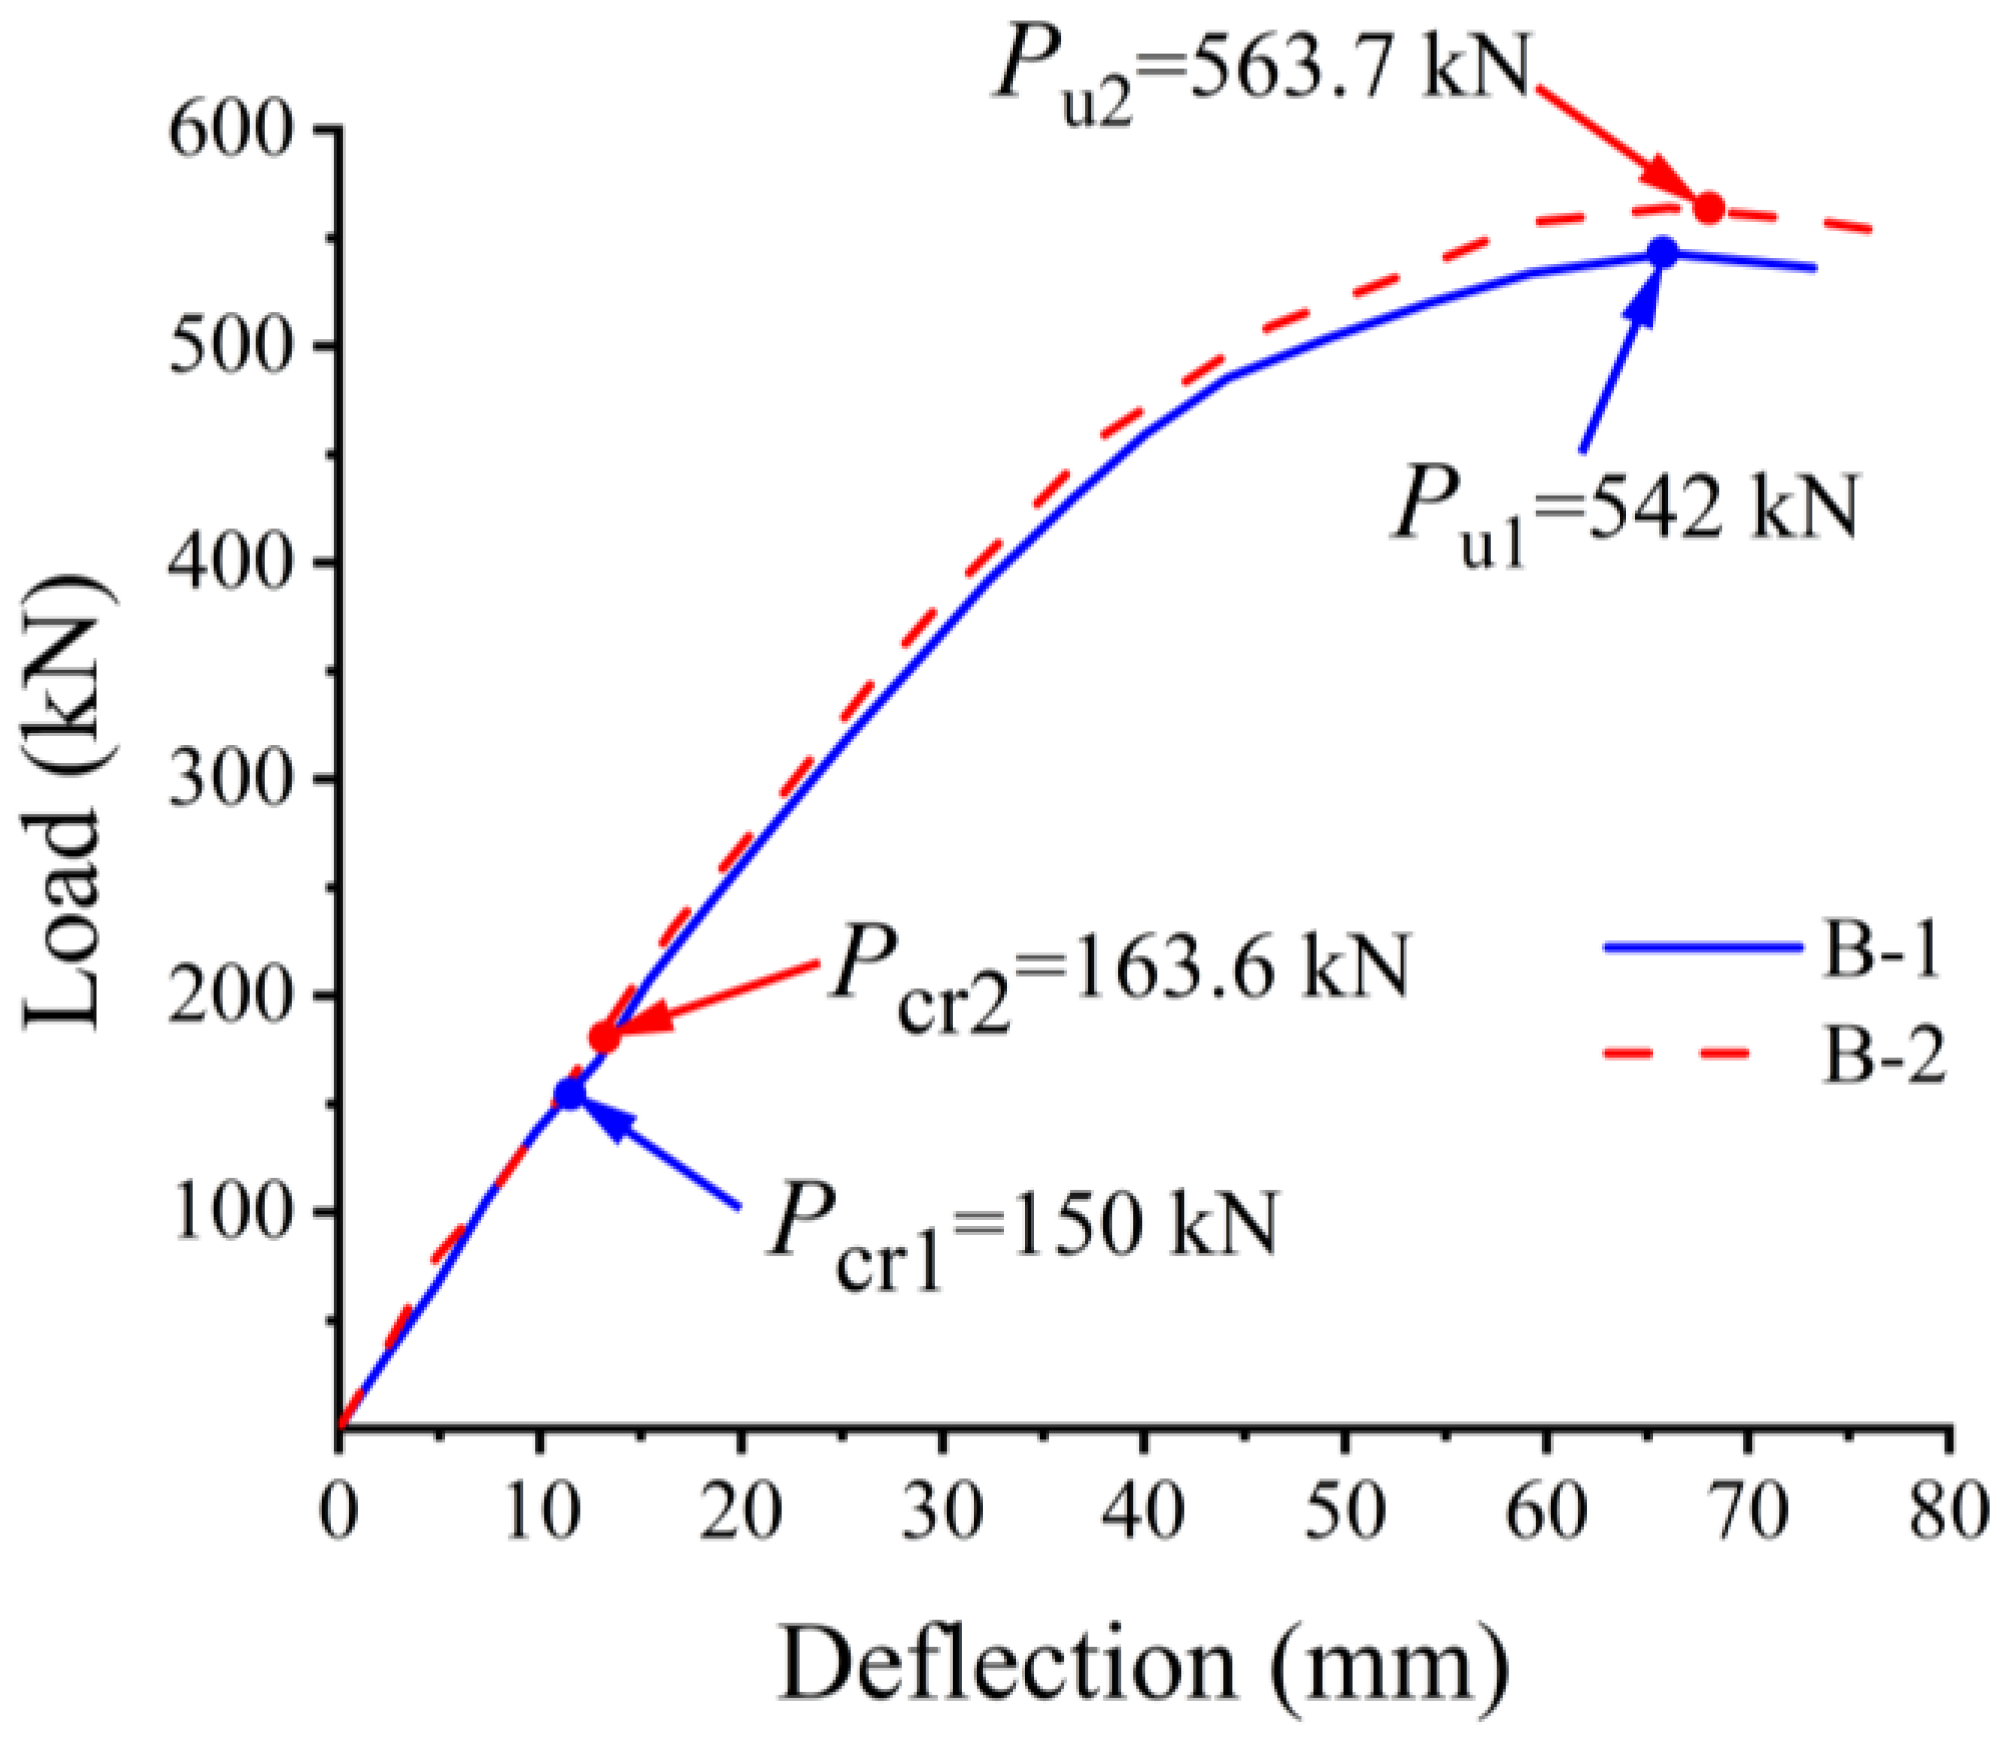
As shown in Figure 6, the load–deflection curves of specimens are presented. Findings indicate that stud spacing had little influence on flexural stiffness. Reducing the stud spacing from 300 mm to 150 mm increased the ultimate load from 542 kN to 563.7 kN. This indicates that, although closer stud spacing results in a moderate improvement in steel–concrete composite action, the increase in flexural capacity remains limited. The ultimate loads of the specimens at failure are summarized in Table 3.
Figure 6.
Load–mid-span displacement curve of the specimens.
Table 3.
Summary of bending test results for specimens.
3.2. Failure Modes
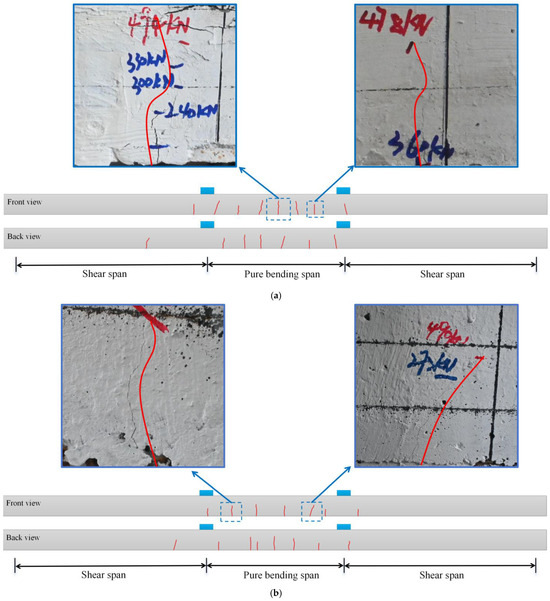
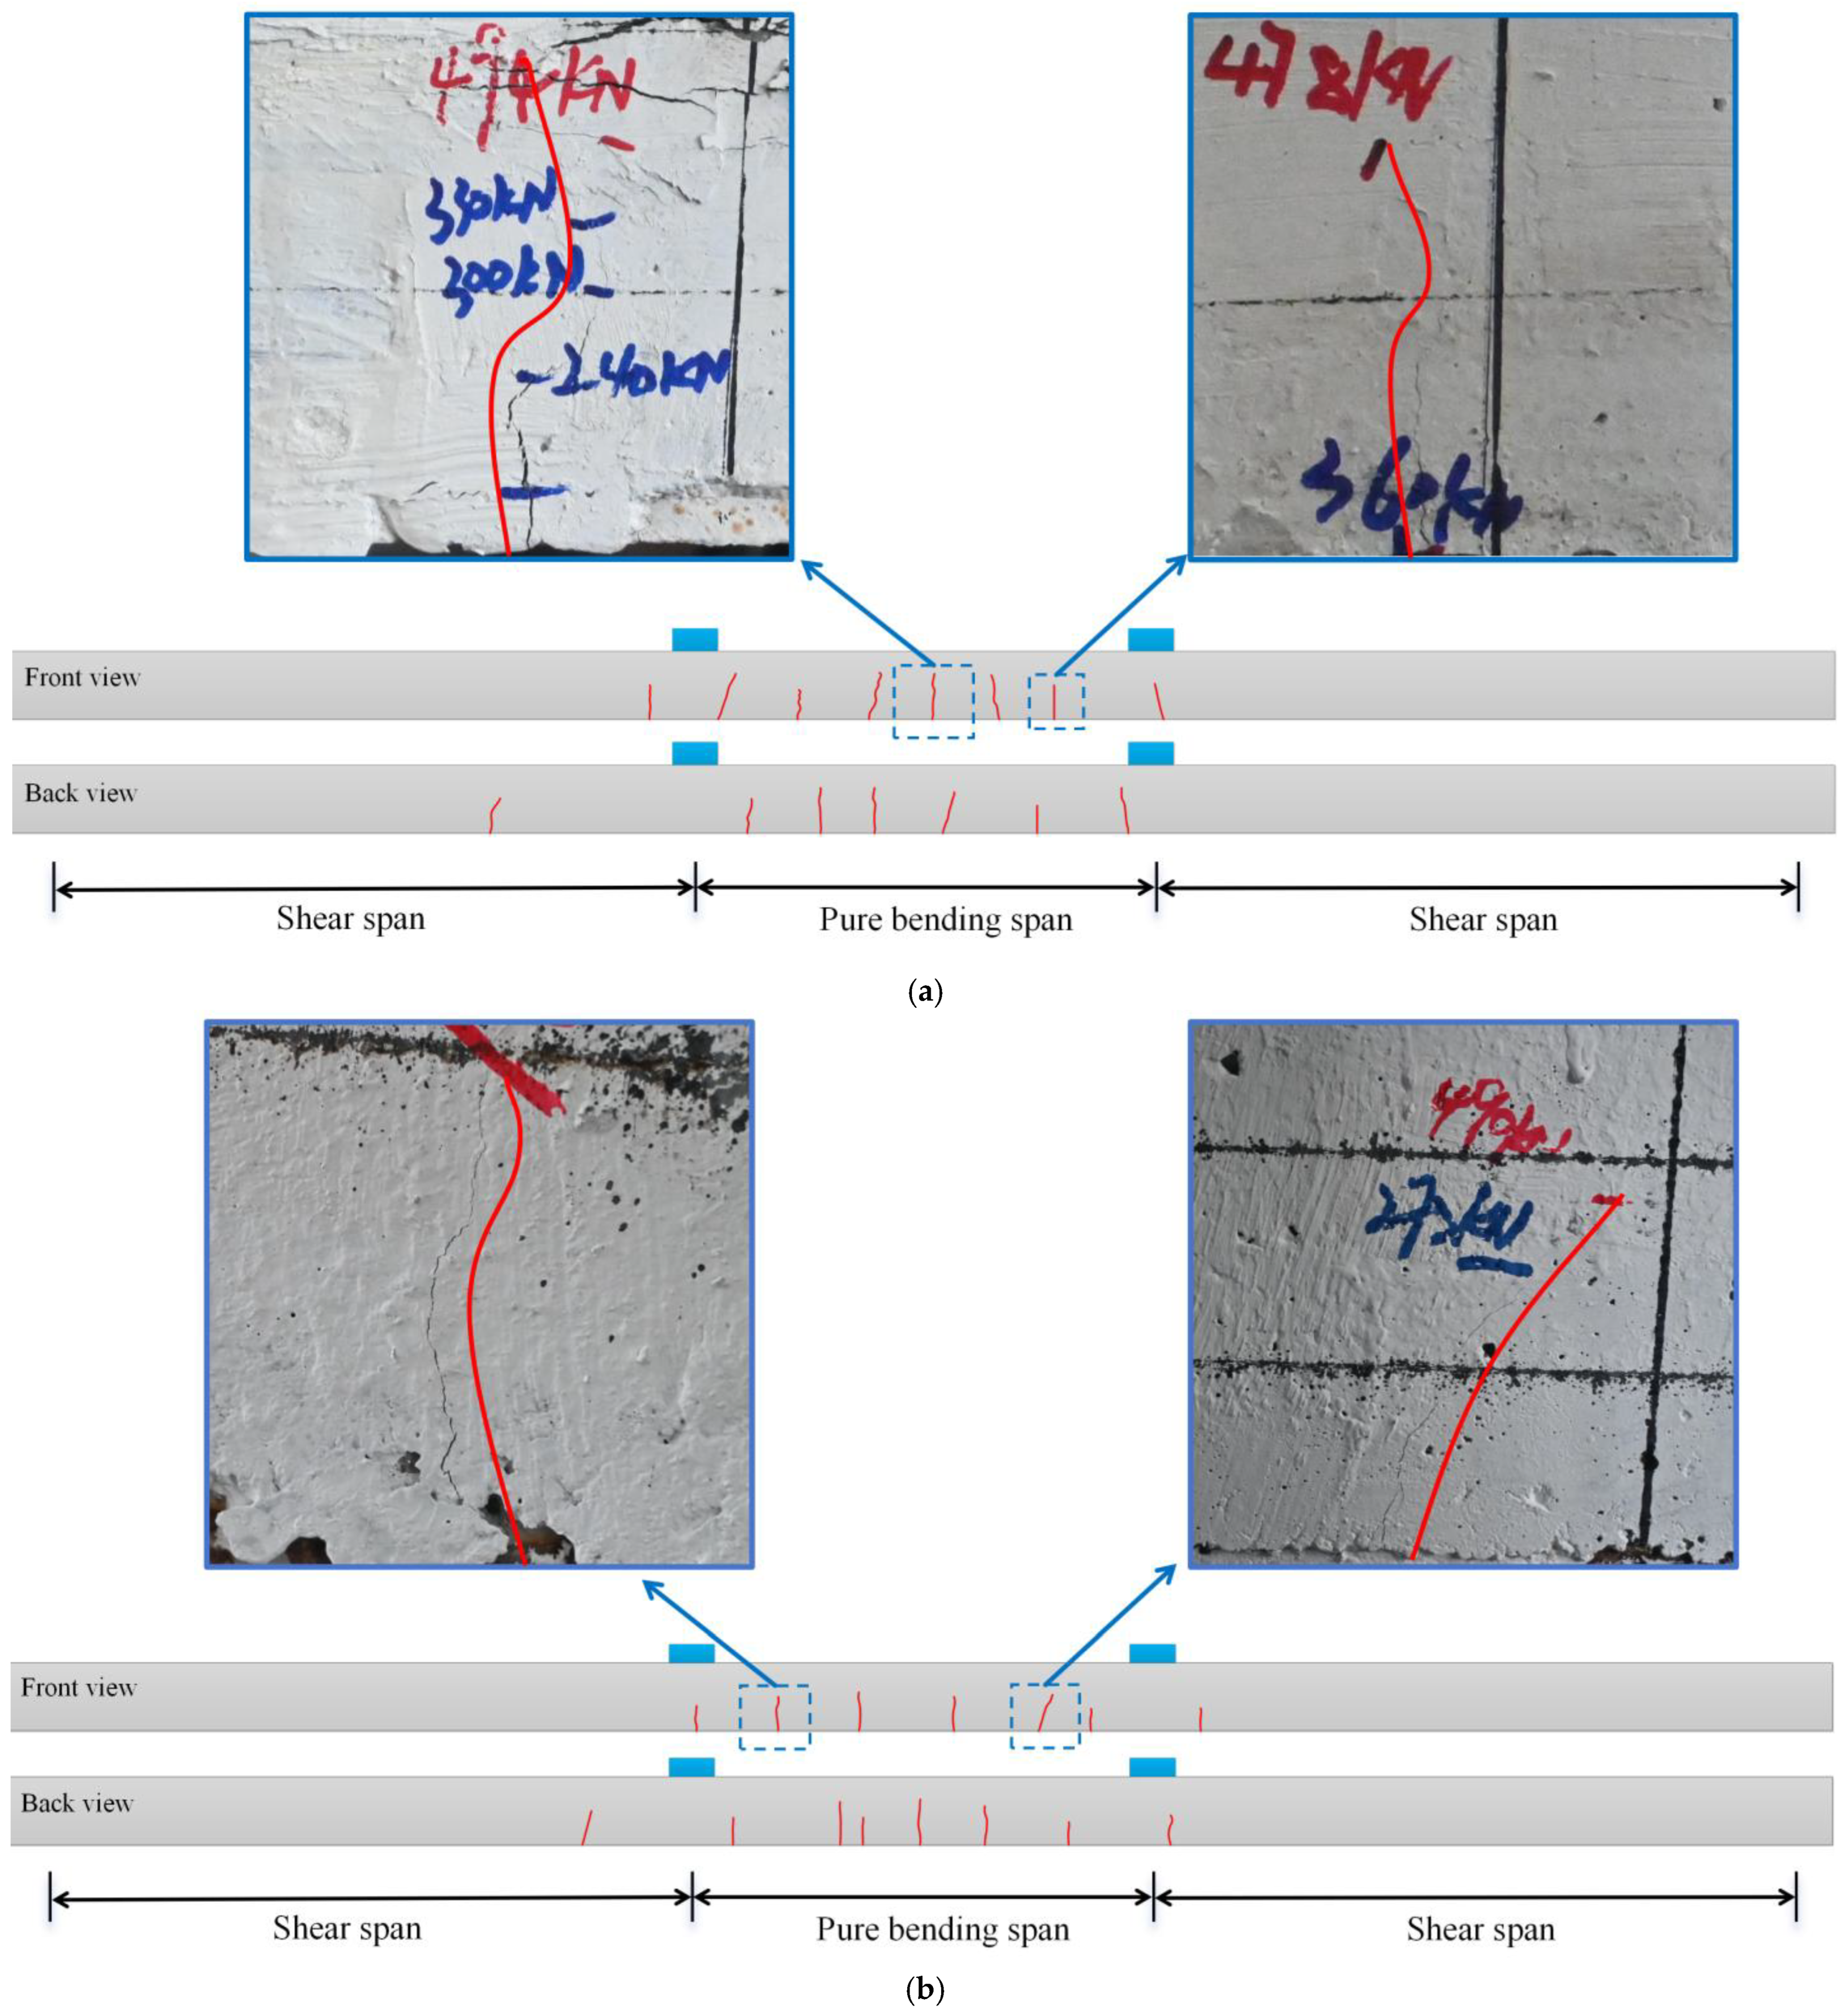
As shown in Figure 7a,b, the crack patterns of the specimens are presented. Both specimens B-1 and B-2 exhibited flexural failure, characterized by concrete crushing in the mid-span region and tensile yielding of the bottom steel plate. At the initial loading stage, cracks first appeared in the tension region at the mid-span. The initial cracking load of Specimen B-1 was 150 kN, with an initial crack width of 0.08 mm. As the load rose, cracks in the mid-span section of the concrete propagated upward from the bottom, as observed from the specimen side, and the flexural stiffness of composite bridge decks began to decrease. When the load reached 433 kN, distinct cracking sounds were heard. With further loading, the cracks developed and widened continuously, resulting in a further reduction in stiffness. When the load approached 542 kN, the specimen entered the failure stage, where mid-span deflection increased further while load remained nearly steady. Subsequently, local crushing and spalling developed in the concrete within the mid-span compression region, and the specimen ultimately failed in bending, showing multiple cracks across the pure bending zone. The largest crack width surpassed 0.2 mm.
Figure 7.
Crack patterns of the following: (a) Specimen B-1; (b) Specimen B-2.
During the early loading stage, Specimen B-2 exhibited elastic behavior. When the load increased to 162 kN, the first crack appeared on the side surface of the concrete within the pure bending region. The crack width was about 0.06 mm. As the load rose, cracks propagated upward from the bottom, and the flexural stiffness of the composite bridge decks began to decrease. When the load reached 452 kN, noticeable cracking sounds were heard, and the cracks gradually extended and widened, resulting in a gradual decrease in structural stiffness. When the load reached 563 kN, the specimen entered the failure stage, during which local crushing and spalling developed in the concrete within the mid-span compression region, and the specimen ultimately failed in bending. After failure, multiple cracks were observed within the pure bending region. The largest crack width surpassed 0.2 mm.
3.3. Relative Interface Slip
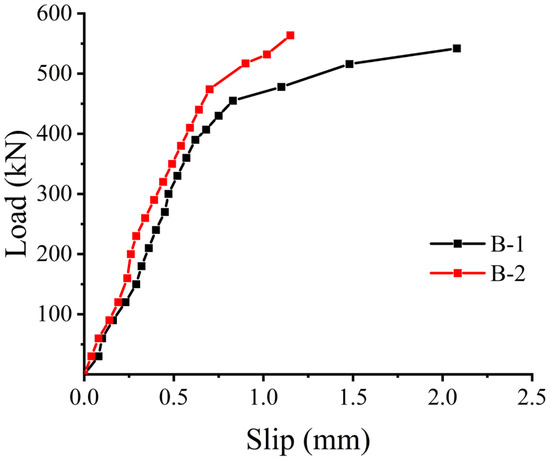
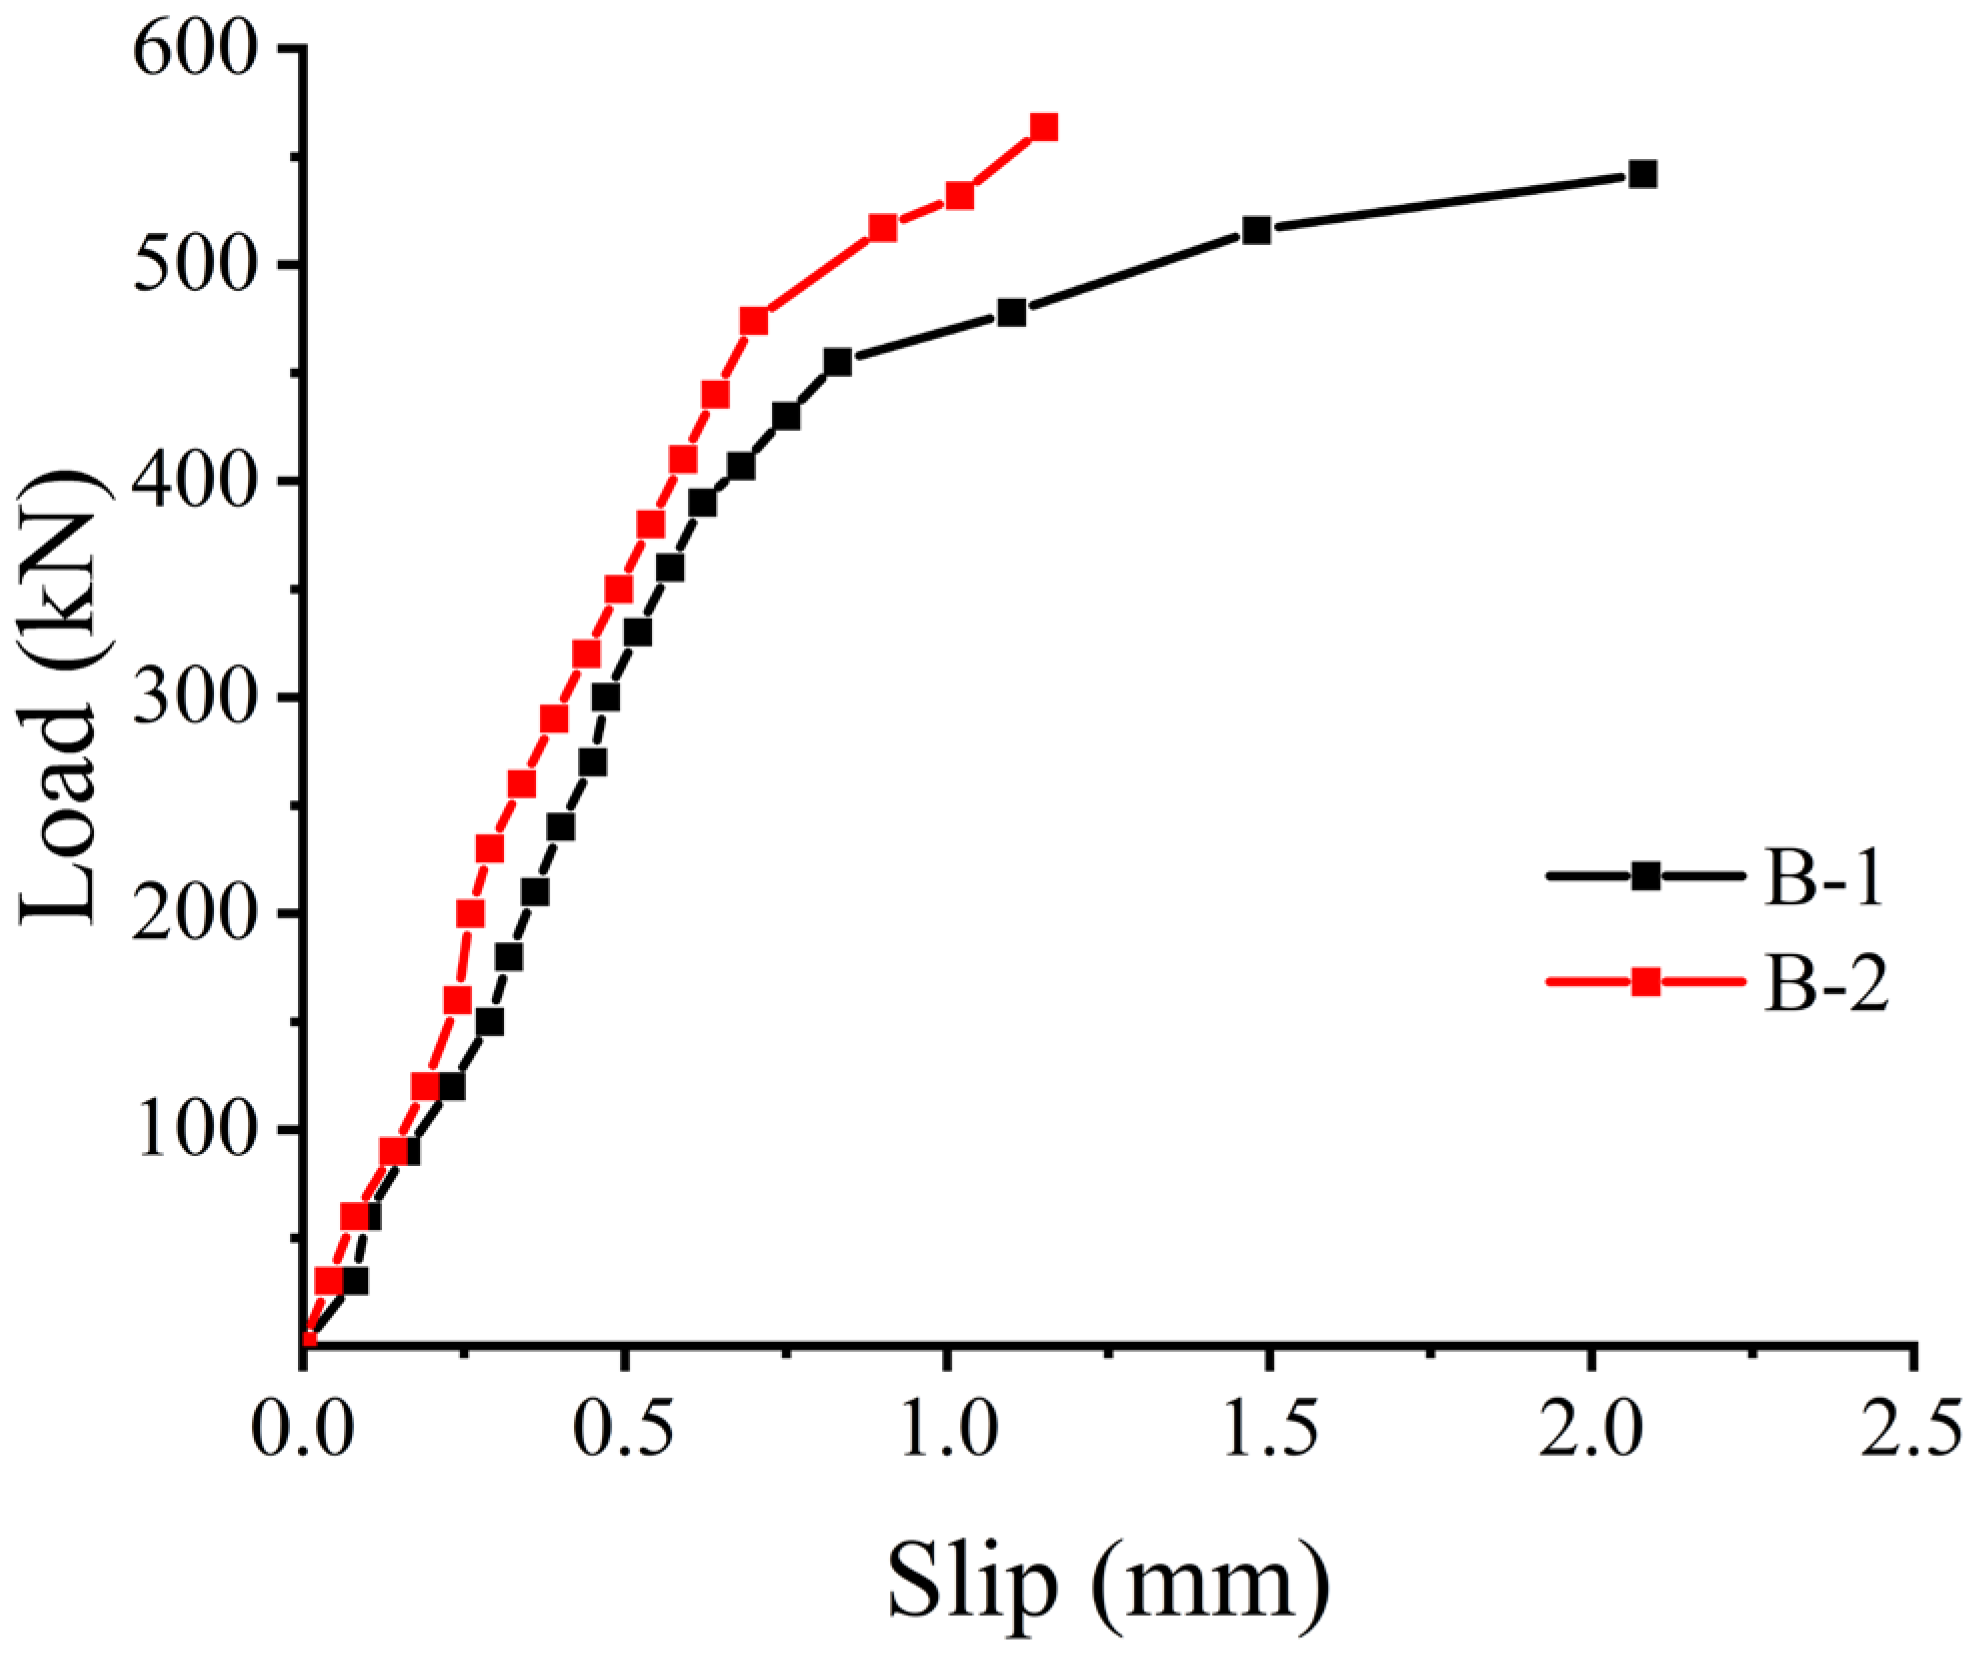
The load–slip curves at the specimen supports are presented in Figure 8. Owing to the symmetric structural and loading conditions, the interface slip was determined as the average of the slips recorded at both ends of the specimens. Both specimens B-1 and B-2 showed a linear response during early loading, with only minor differences in slip. However, as the load continued to increase, Specimen B-1 showed a rapid growth in slip beyond 300 kN, displaying a pronounced nonlinear behavior, with a maximum slip of 2.08 mm. In contrast, Specimen B-2 exhibited more effective slip control under the same load level, reaching a maximum slip of 1.15 mm, which is 45% lower than that of Specimen B-1.
Figure 8.
Load–slip curves of specimens.
3.4. Development of Concrete Strain
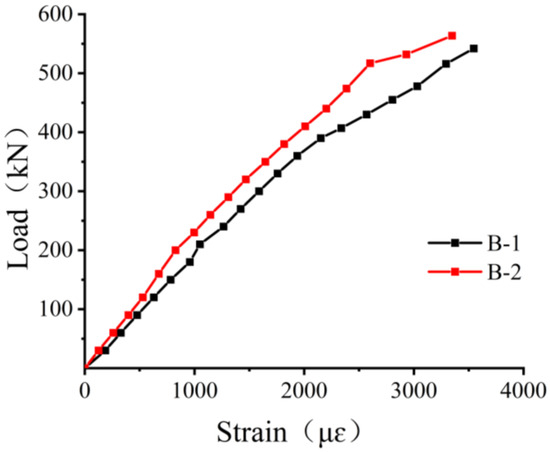
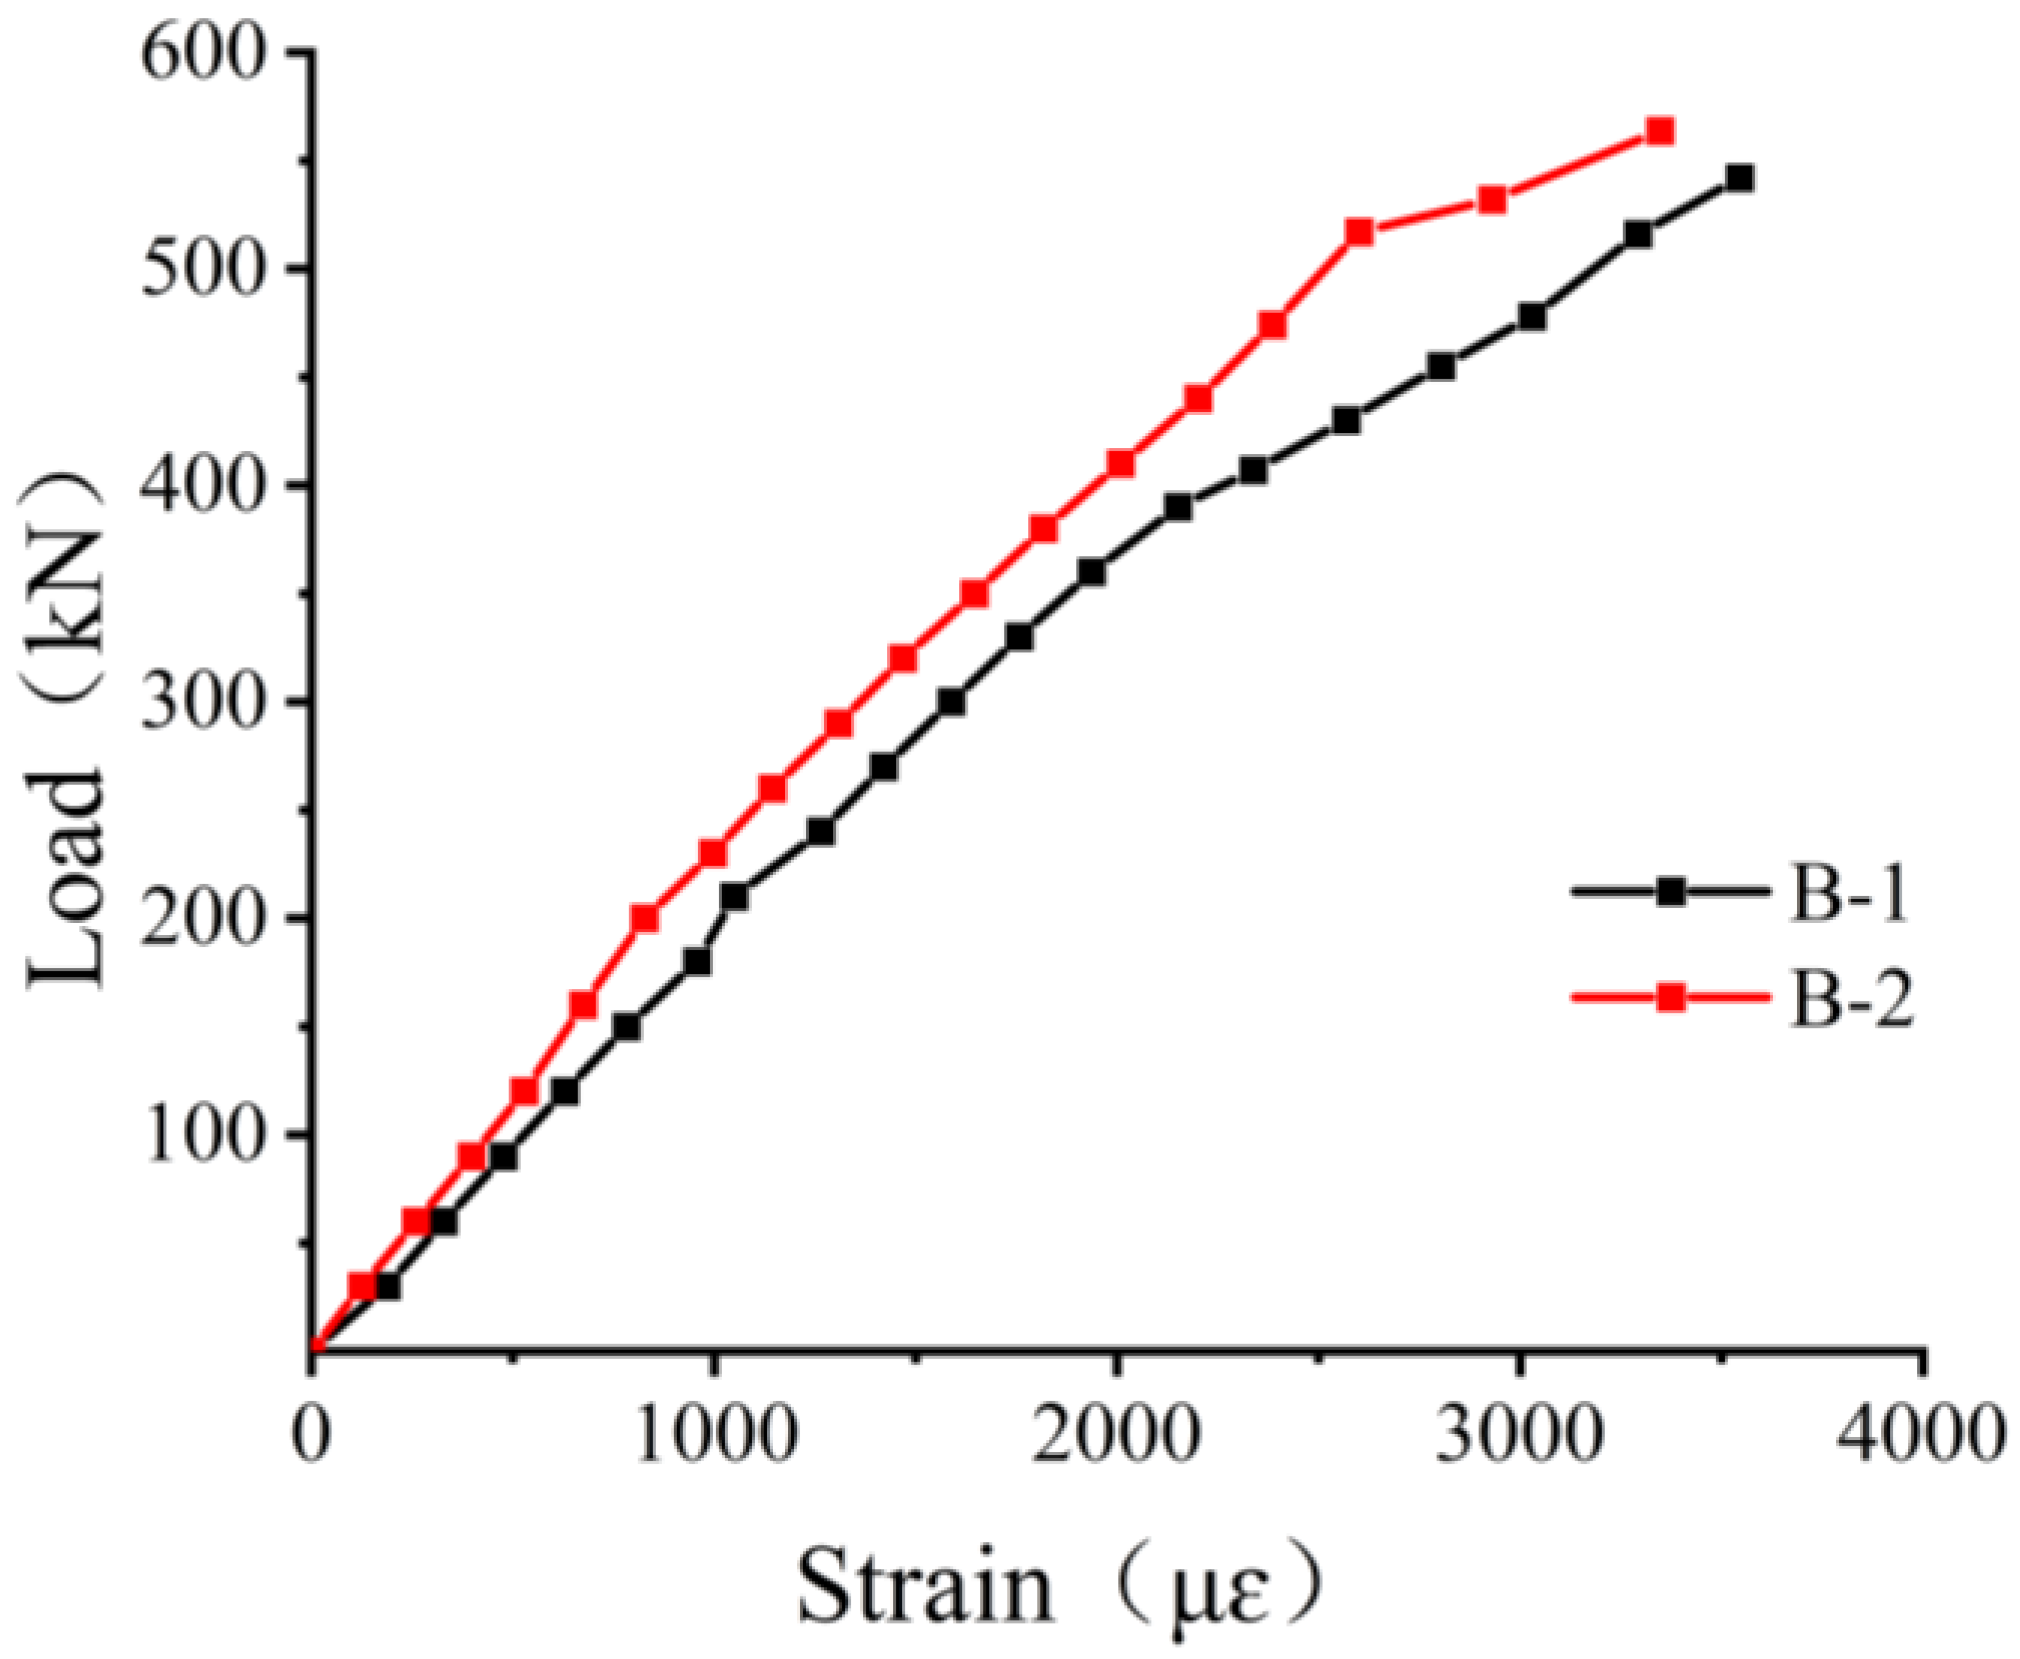
The stress–strain curve of concrete at the mid-span is shown in Figure 9. At the initial loading stage, the strain increased approximately linearly with the applied load, indicating that the specimen was in the elastic stage. As the load continued to increase, cracks began to appear in the lower part. When the load reached approximately 0.8Pu, the slope of the load–strain curve decreased significantly with an increasing load, suggesting that part of the concrete entered the elastoplastic stage, resulting in an enhanced deformation capacity and a notable reduction in stiffness. As shown in the figure, under the same load level, Specimen B-2 exhibited a higher concrete strain.
Figure 9.
Load–strain curves of top concrete at mid-span position.
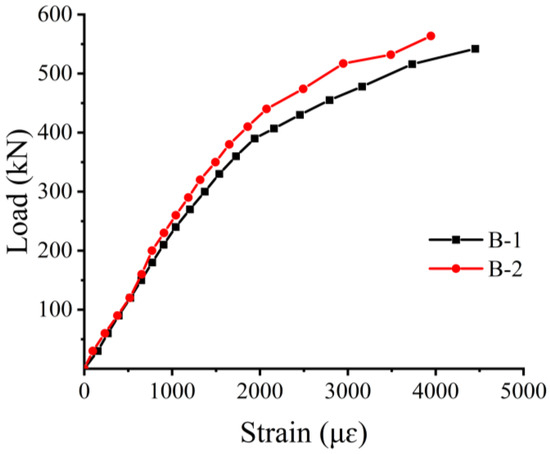
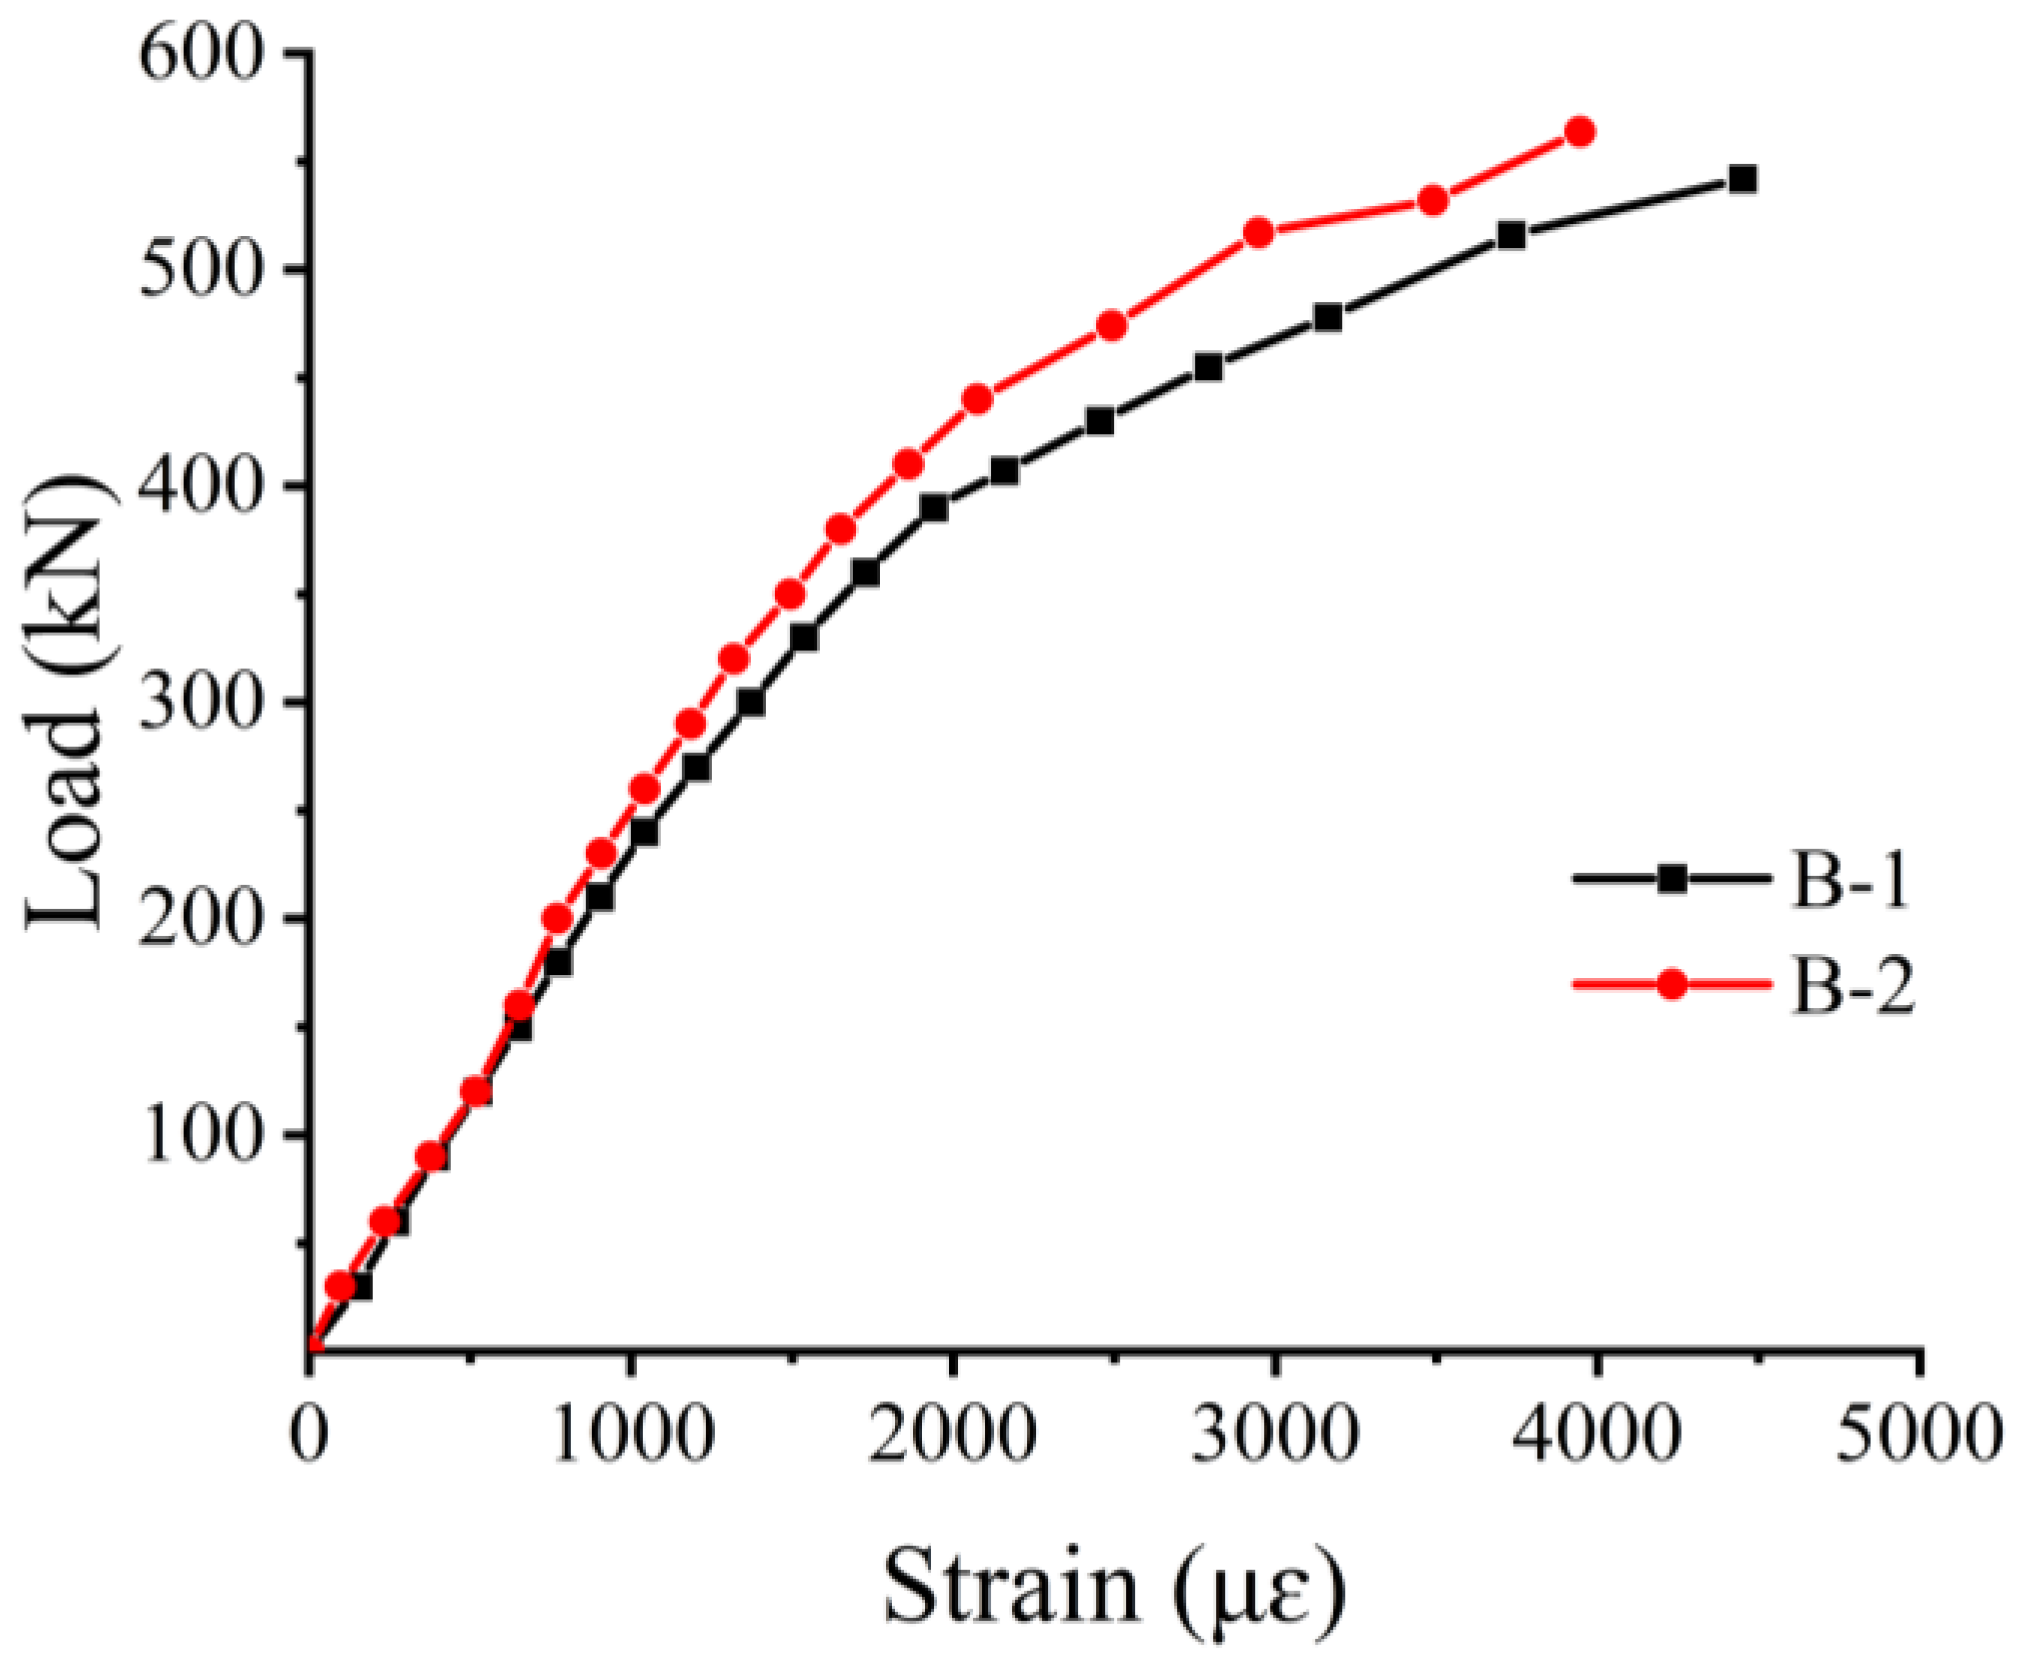
3.5. Development of Steel Plate Strain
The variation in the steel plate strain at mid-span as the load increased is presented in Figure 10. The steel plate strains of both specimens were similar at identical load levels. At early loading, both specimens showed linear load–strain responses, with the steel plates remaining elastic. As the load increased, the strain growth rate gradually accelerated, indicating that the steel plate carried an increasing portion of the tensile stress during the development of flexural deformation. At the later loading stage, the load–strain relationship exhibited nonlinear characteristics, and the steel plate strain gradually approached yielding. Finally, as the load neared the ultimate load, the steel plate yielded. Specimen B-2 exhibited higher strain, as well as a higher ultimate load compared with Specimen B-1, demonstrating superior flexural behavior.
Figure 10.
Load–strain curves of steel plate at mid-span position.
4. Finite Element Analysis
4.1. Finite Element Modeling
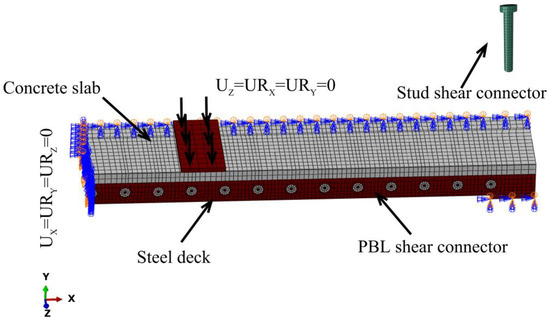
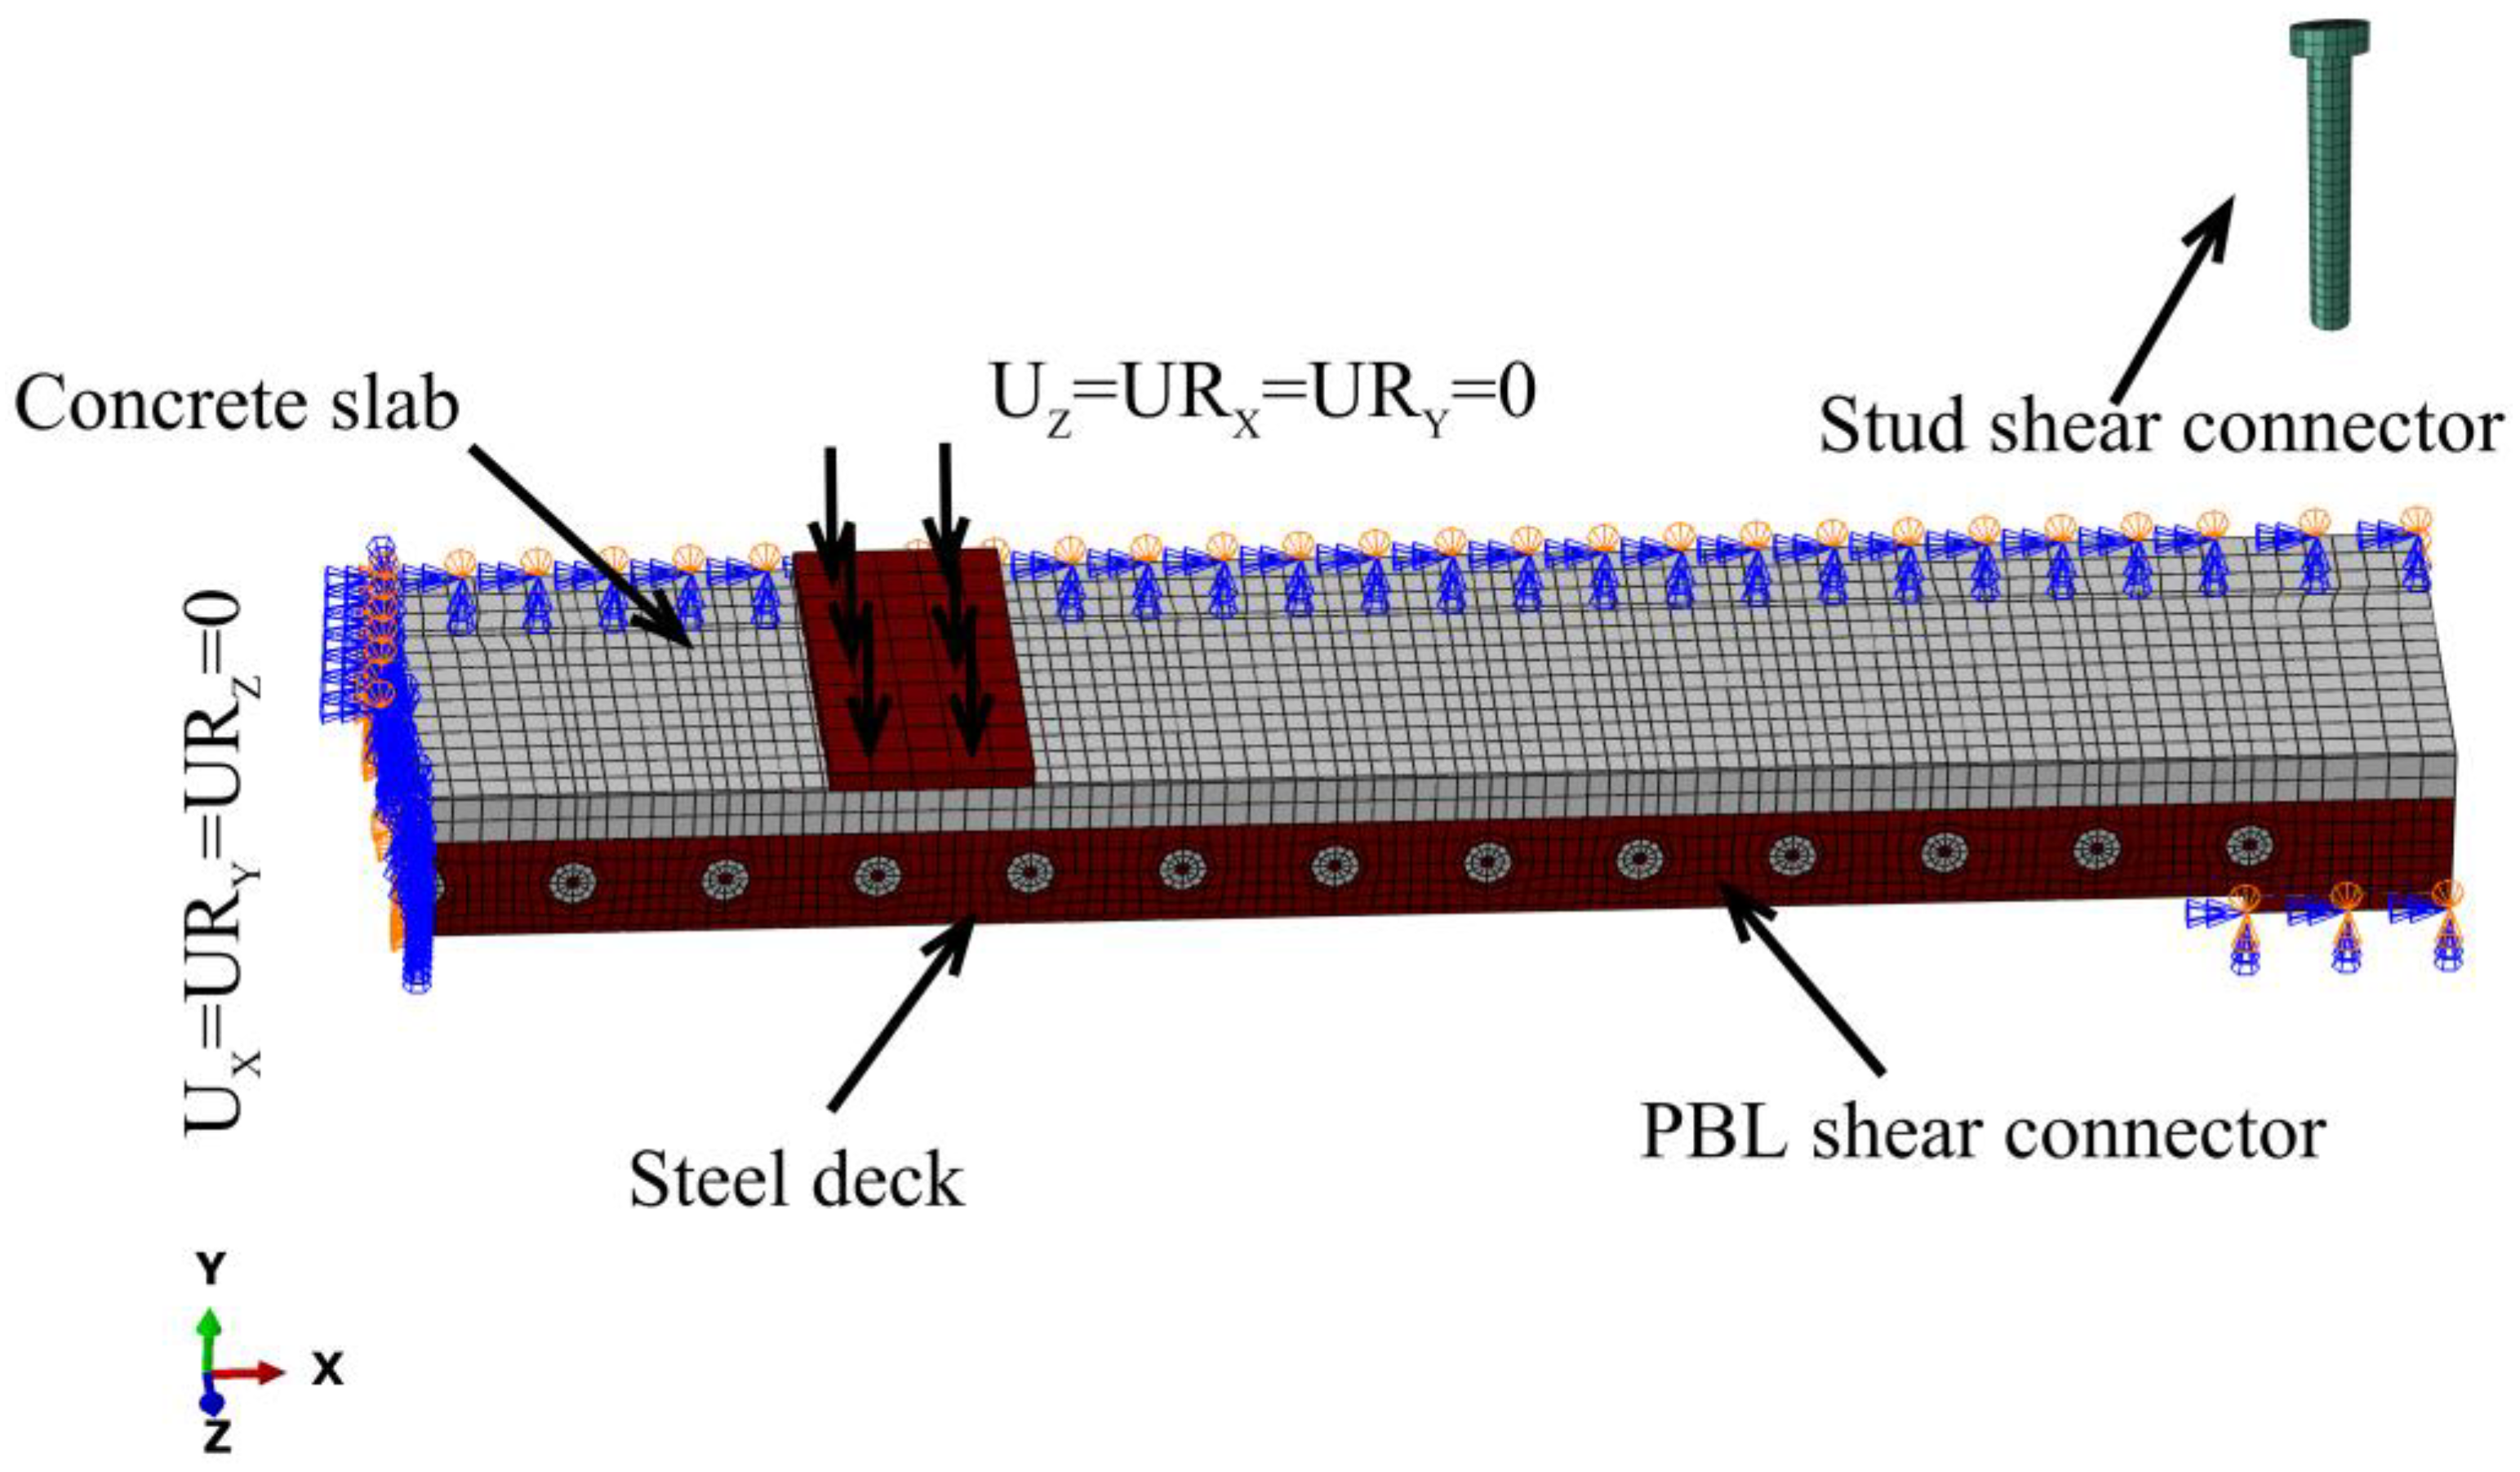
A finite element model of specimens was established through finite element software. To simplify the computation, a one-quarter model was adopted, as shown in Figure 11. The stud shear connectors, PBL shear connectors, rebars, and concrete were modeled with C3D8R solid elements, while the longitudinal and transverse rebars were modeled with T3D2 truss elements. The mesh size was set to 10 mm for the stud shear connectors and 20 mm for the other components, based on a mesh-sensitivity analysis that ensured sufficient accuracy. The final finite element model contained 42,503 nodes and 29,410 elements. Surface-to-surface contact was defined between the concrete and steel components and between the steel components and support plates; the normal behavior was modeled using hard contact, and the tangential behavior was modeled using the penalty method, with a trialed friction coefficient of 0.7. The longitudinal and transverse rebars were embedded in the concrete using an embedded constraint, and the perforated rebars were tied to the surrounding concrete using a tie constraint. The structure was simply supported at its boundaries. A finite element analysis employed the Static General solver in ABAQUS to handle the nonlinearities arising from material behavior, contact, and large deformations.
Figure 11.
Finite element model.
4.2. Constitutive Models
Based on the results of the material tests, the constitutive behavior of the steel plate and rebar was defined using a bilinear stress–strain model, with an elastic modulus of 208 GPa and a Poisson’s ratio of 0.3. Concrete was modeled using the Concrete Damaged Plasticity (CDP) model [30,31]. The corresponding parameters were determined according to the recommendations of Abaqus, as shown in Table 4.
Table 4.
Concrete CDP parameters applied in finite element analysis.
According to the typical analytical expressions [32], concrete constitutive models in compression and tension are presented below:
where is the uniaxial compressive strength of concrete; is the elastic modulus of concrete; is the ultimate compressive strength; is the reduction coefficient describing the descending branch of the compressive stress–strain curve; and is the peak compressive strain corresponding to . The values of and were determined from the results of the concrete material tests.
The concrete tensile stress–strain relationship is expressed as follows:
where is the uniaxial tensile strength of concrete; is the elastic modulus of concrete; is the ultimate tensile strength; is the reduction coefficient describing the descending branch of the compressive stress–strain curve; and is the peak tensile strain corresponding to . The values of and were determined from the results of the concrete material tests.
The tensile and compressive responses of steel rebars and plates were modeled using an ideal elastic–plastic constitutive model, given as follows:
where , , and correspond to the elastic modulus, yield stress, and yield strain of steel.
4.3. Finite Element Analysis Results
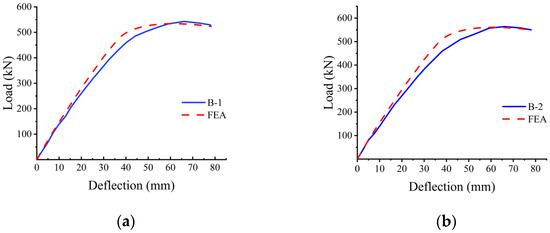
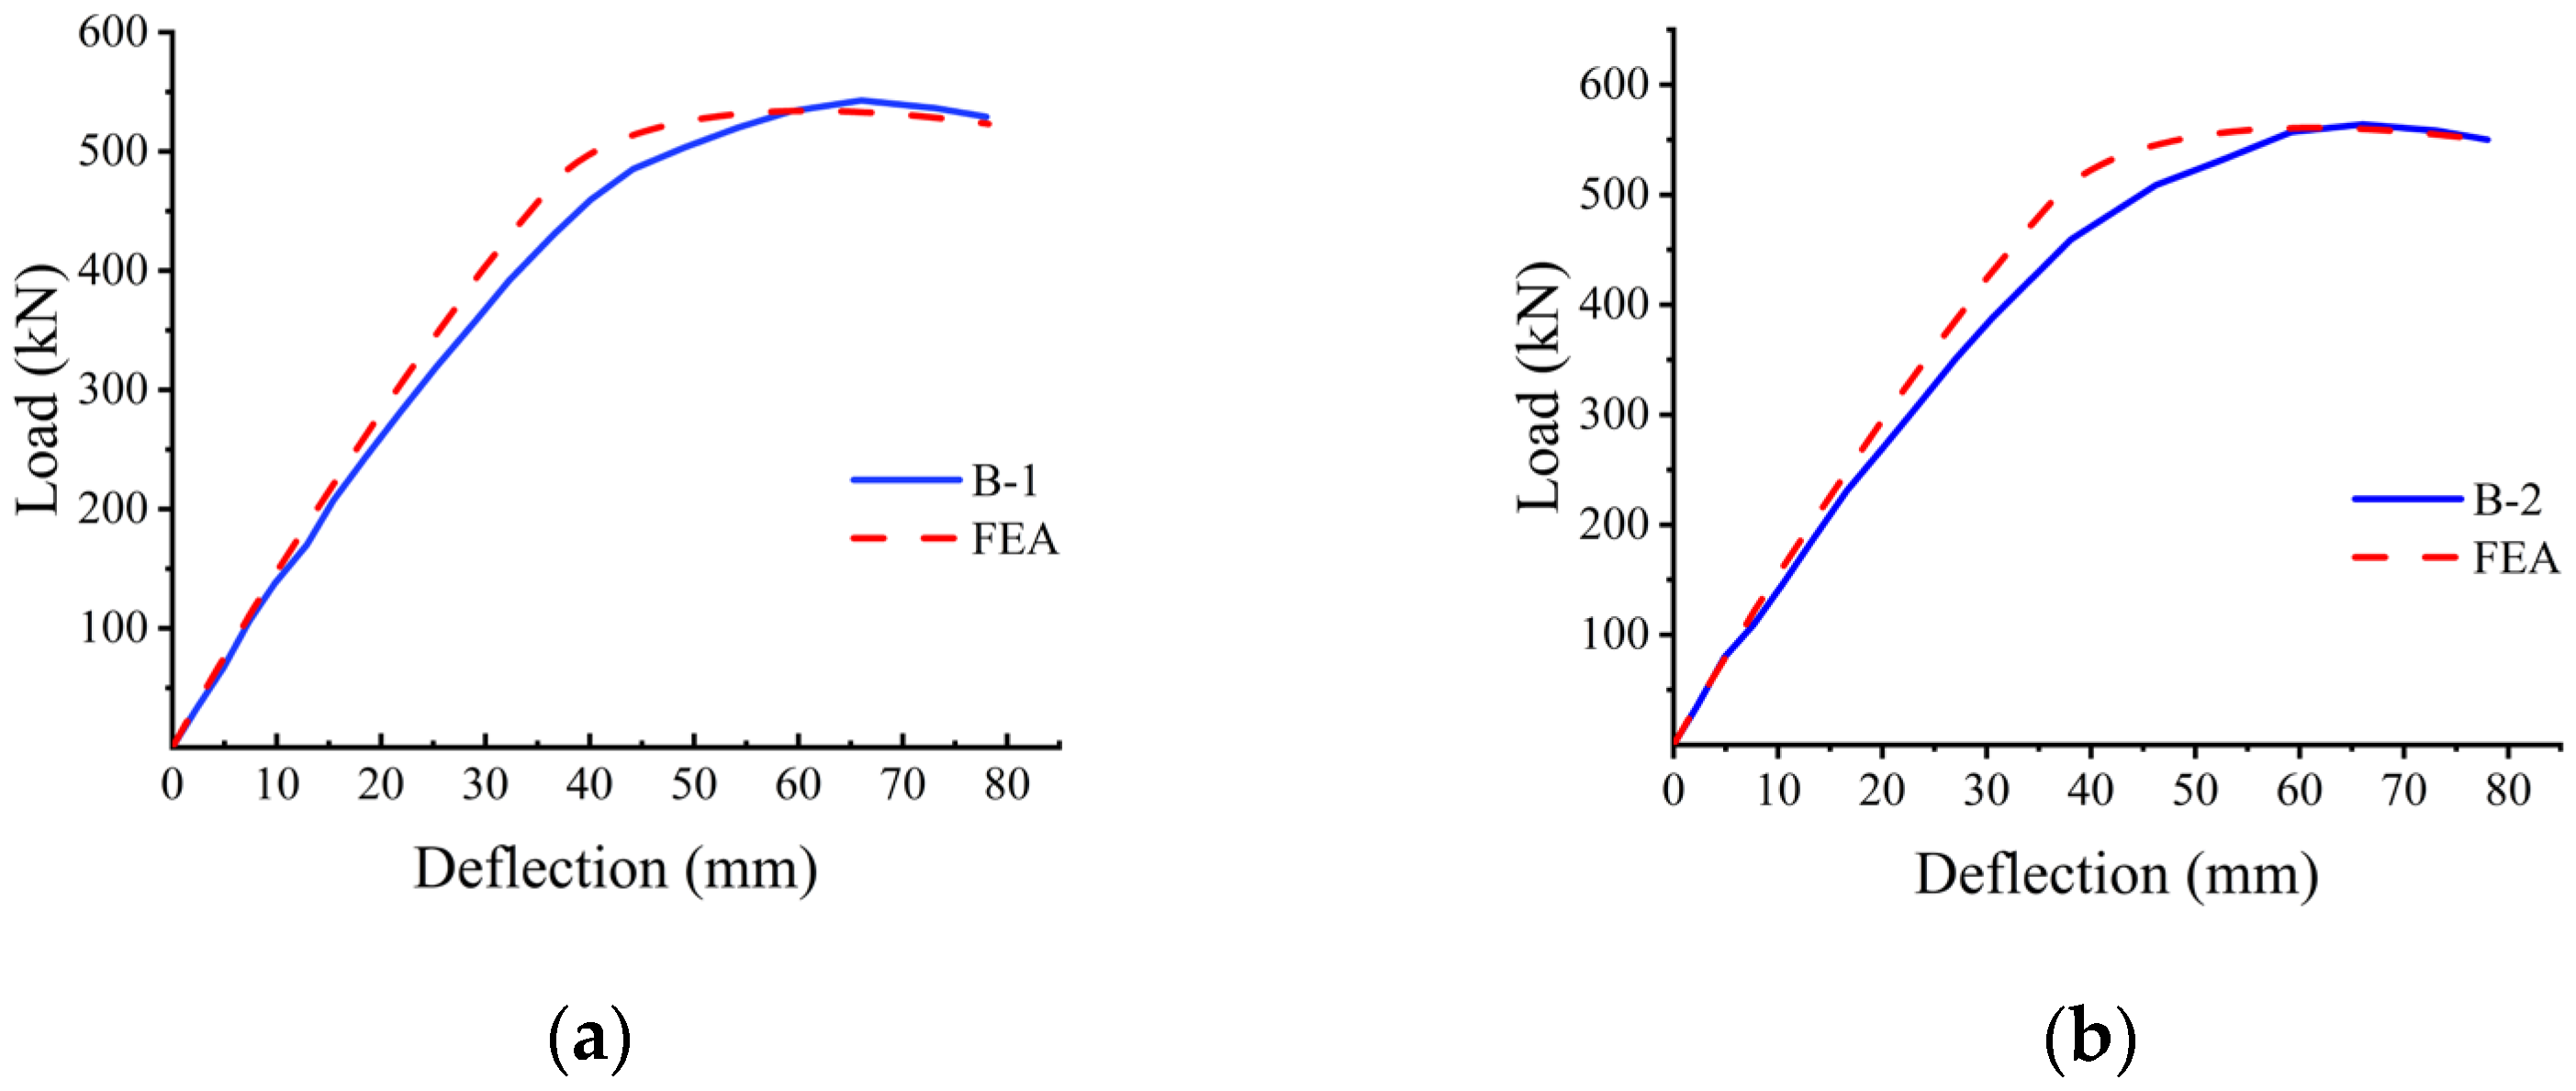
As shown in Figure 12a,b, the load–mid-span deflection curves indicate that the ultimate load capacities of specimens B-1 and B-2 obtained from the numerical simulation are approximately 534 kN and 563.7 kN, respectively, with corresponding flexural stiffness values of about 11.36 kN/mm and 11.50 kN/mm. A comparison against experimental measurements indicates that the differences in the ultimate load capacity between the simulation and the experiment are minimal, and the stiffness deviations are within 10%. Therefore, the finite element model reliably represents the specimens’ load-bearing behavior. The simulated curves show excellent agreement in comparison to experimental observations, thereby validating the reliability and performance of the adopted numerical approach.
Figure 12.
Comparison of numerical and experimental load–deflection: (a) Specimen B-1, (b) Specimen B-2.
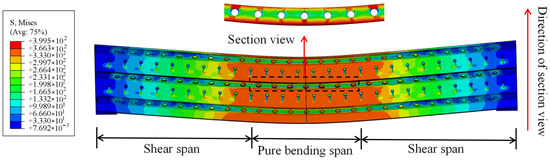
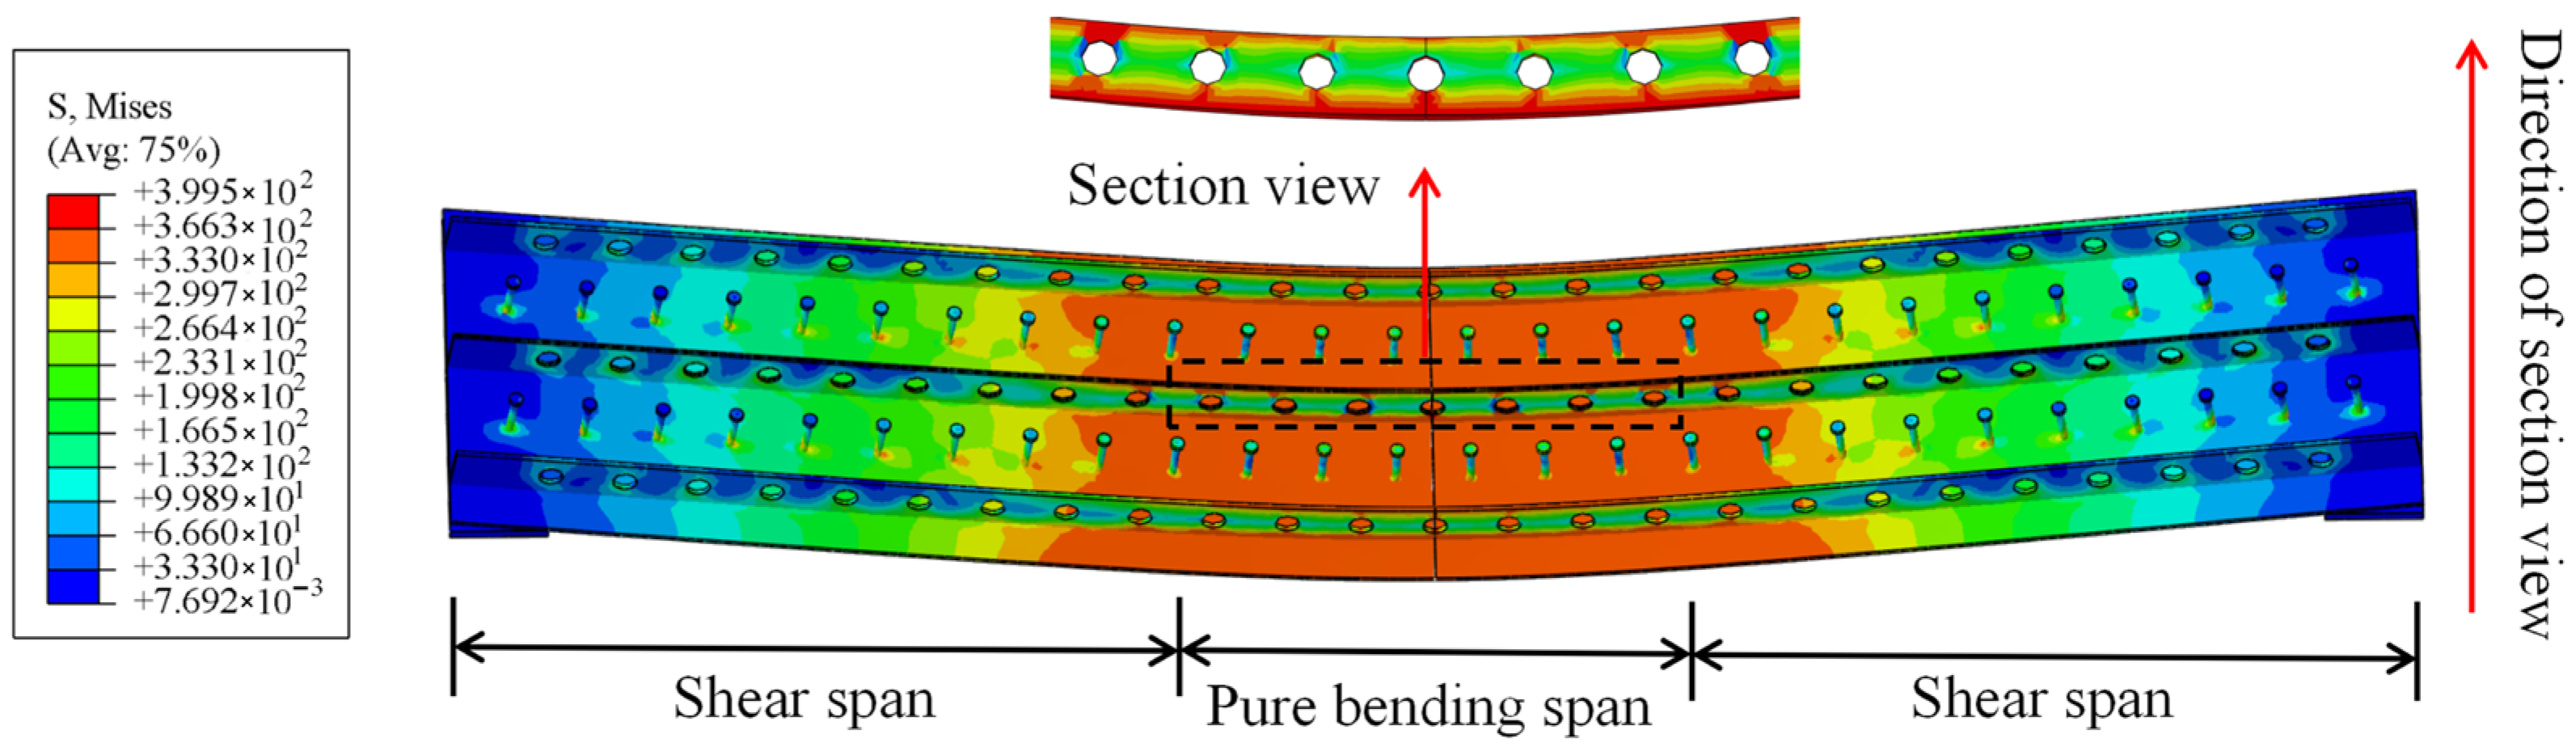
Specimen B-1 was taken as a representative example for the analysis, as shown in Figure 13. The failure mode predicted via the finite element analysis matches the experimental observations, with both indicating that yielding occurred in the bottom steel plate. Under the ultimate load, the Von Mises stress of the steel structure in Specimen B-1 reached approximately 400 MPa, which is close to the material’s yield strength. These findings indicate that the developed finite element model can adequately reproduce the stress field and failure characteristics of the composite bridge decks and, thus, can be effectively used for investigating its flexural behavior.
Figure 13.
Von Mises stress distribution of steel components (unit: MPa).
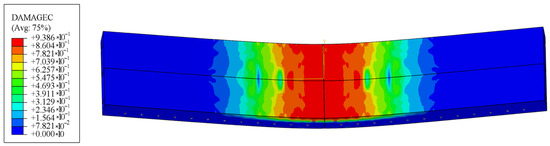
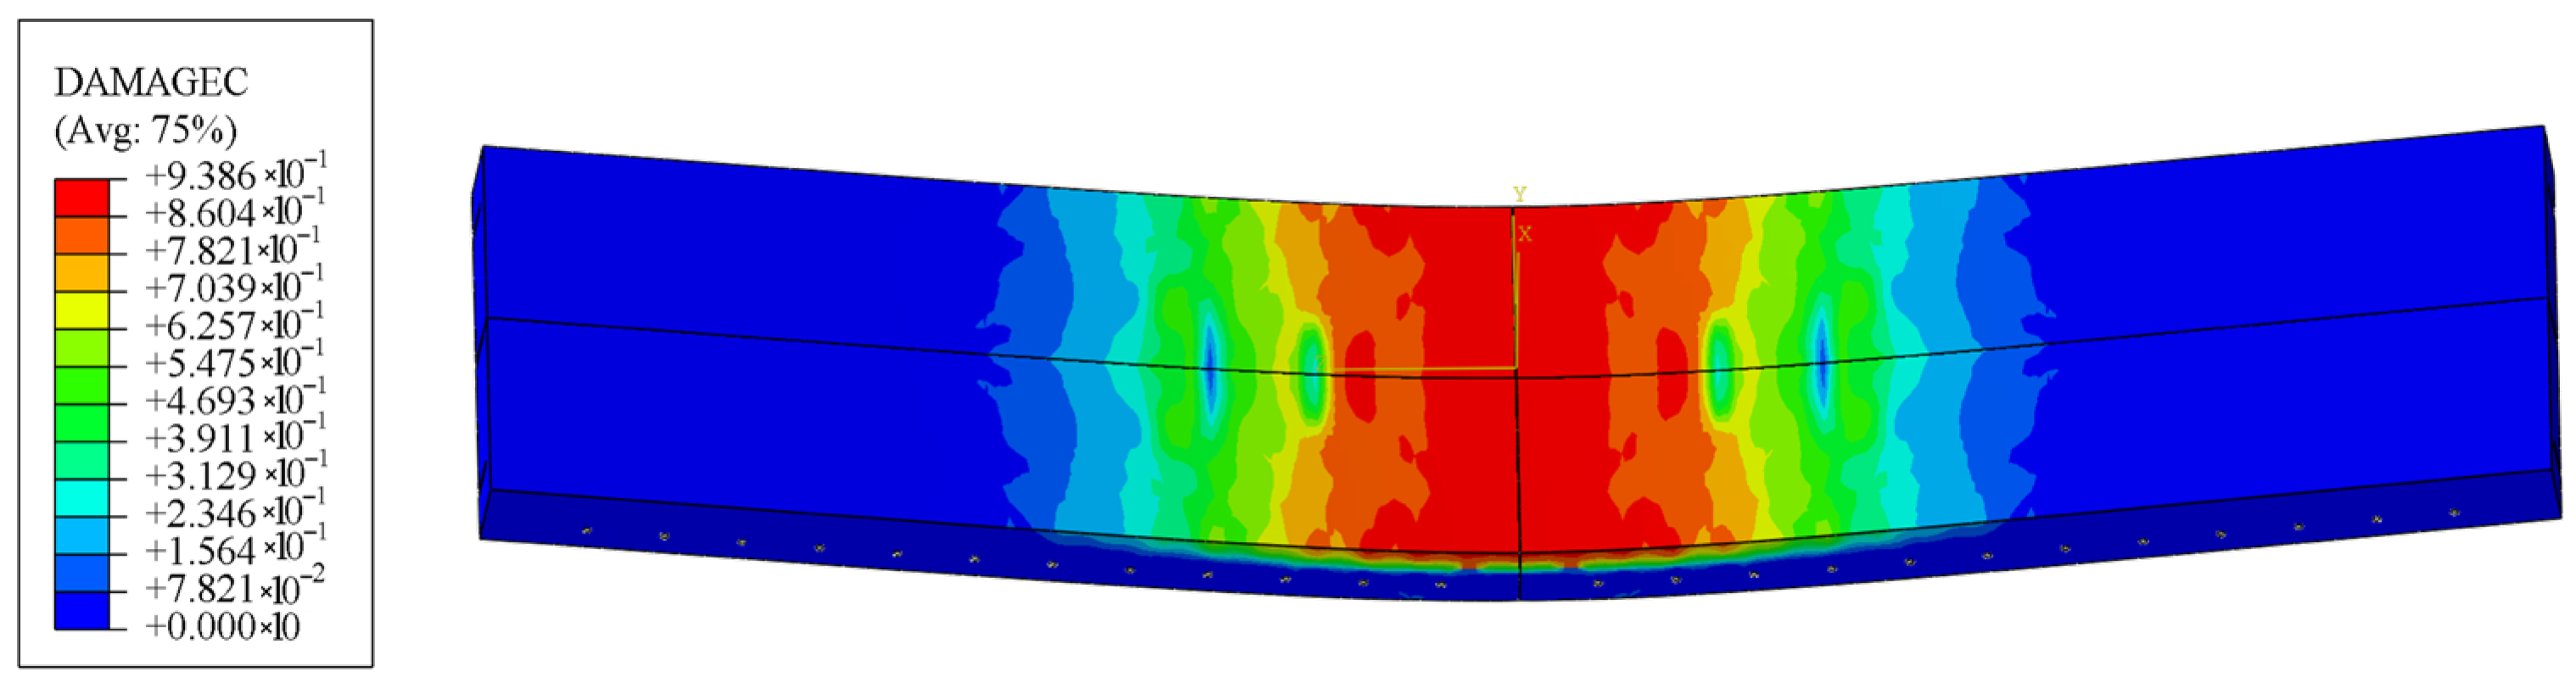
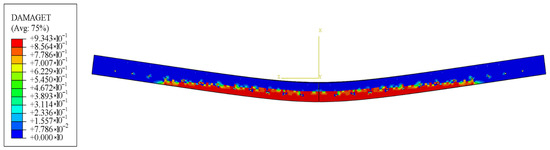
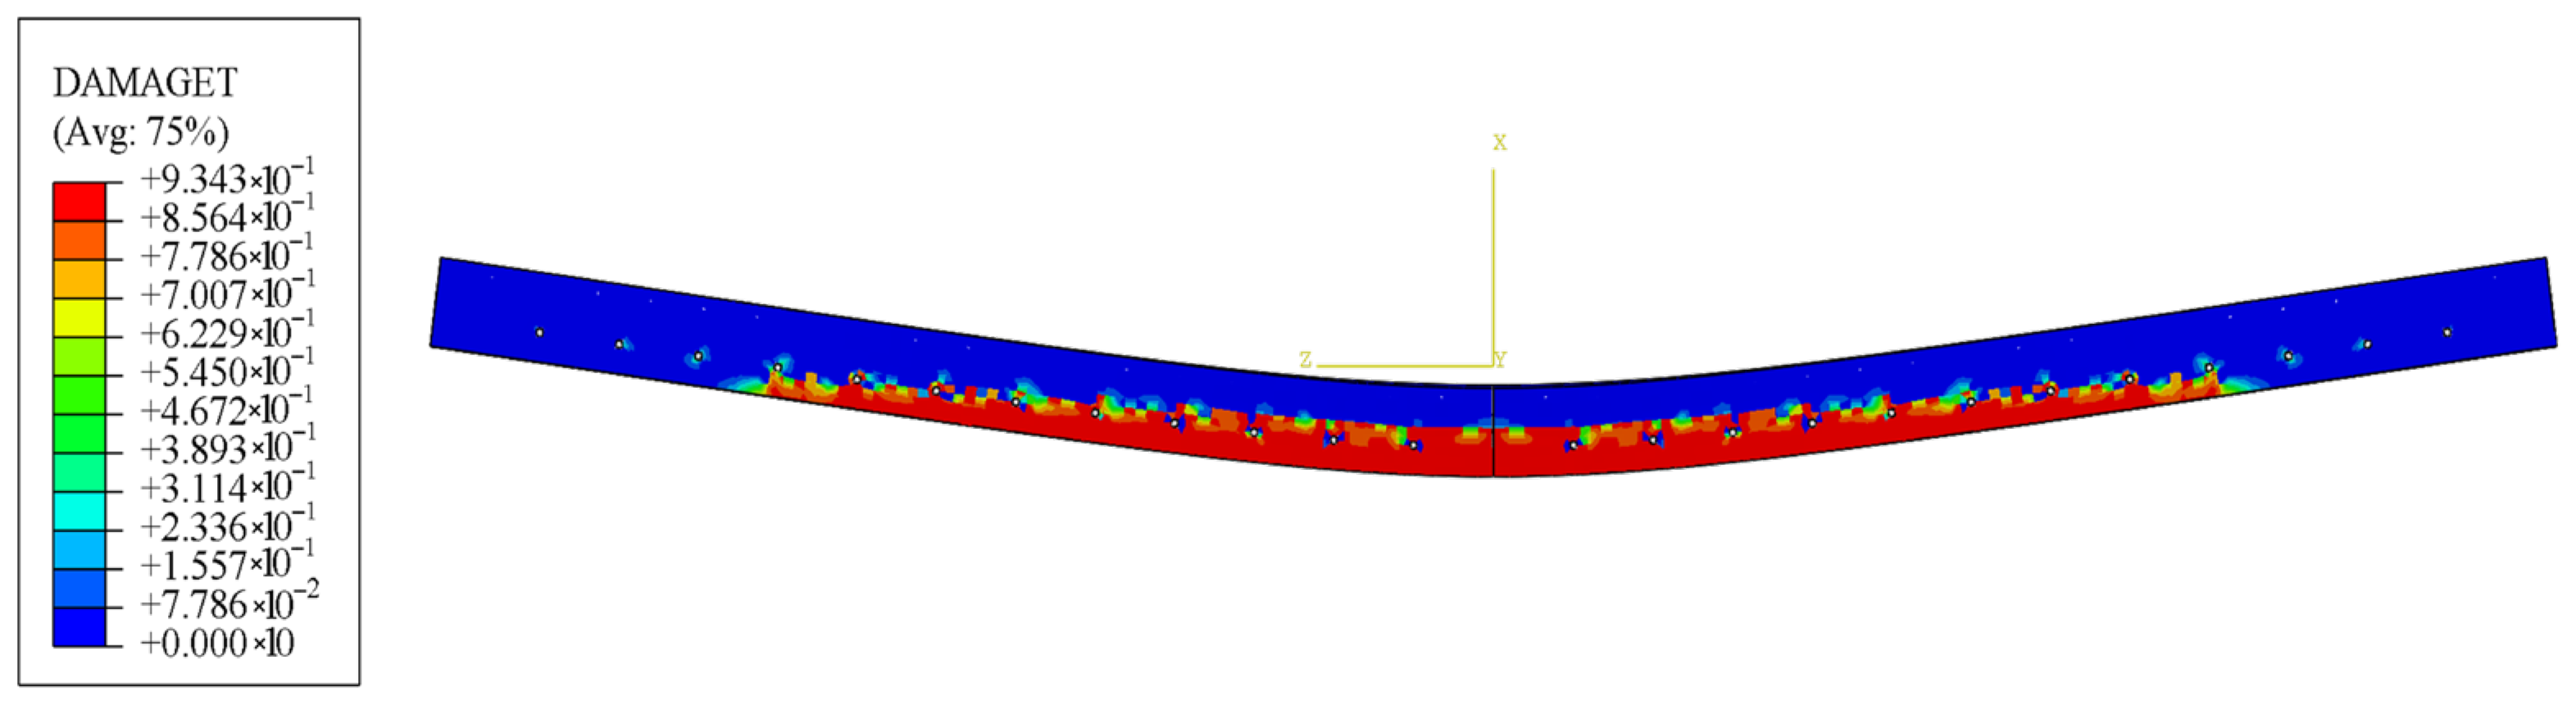
The compressive damage distribution in Specimen B-1 under the ultimate load condition is shown in Figure 14. A damage value of 0 indicates an undamaged state, while 0.938 represents the maximum damage. As shown in the compressive damage contour, the damage is mainly concentrated in the mid-span compression zone, exhibiting a symmetrical and localized distribution pattern that reflects a typical flexural crushing failure mode. Figure 15 presents the tensile damage distribution in Specimen B-1 at the ultimate load condition. A damage value of 0 indicates no damage, and 0.934 represents the maximum value. From the tensile damage contours, the analysis reveals that the tensile damage in the concrete was primarily concentrated in the bottom region of the mid-span and extended in a band-like pattern along the span direction, covering a relatively wide area. As the load increased, cracks gradually developed and spread through the bottom concrete of the bridge deck. They eventually coalesced, leading to a typical flexural failure mode.
Figure 14.
Compressive damage of concrete.
Figure 15.
Tensile damage of concrete.
4.4. Parametric Assessments
Using the validated finite element model, a comprehensive parametric study was carried out to examine the influence of shear connector types, the concrete strength, the stud diameter, the stud height, and the PBL hole diameter on the flexural behavior of the composite bridge decks. Parameter ranges were chosen according to engineering practice and the dimensional requirements of specifications [33,34]. The code requires stud shear connectors to have a nominal shank diameter of between 16 mm and 25 mm and a post-welding length of not less than four times the diameter. Accordingly, stud diameters of 16 mm, 19 mm, and 22 mm were selected. For studs of the same diameter, heights of 80, 100, and 120 mm were analyzed to satisfy the minimum height-to-diameter ratio and ensure adequate embedment. The PBL hole diameters ranged from 30 mm to 70 mm, selected in accordance with code provisions and research. The investigated parameters and their variation ranges are summarized in Table 5.
Table 5.
Configuration of finite element models used in the parametric investigation.
4.4.1. Effect of Different Types of Shear Connectors
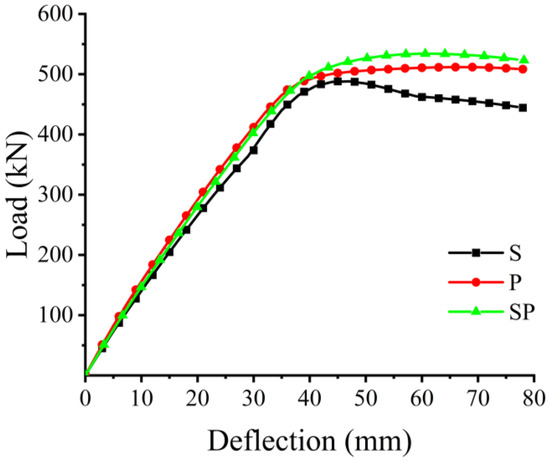
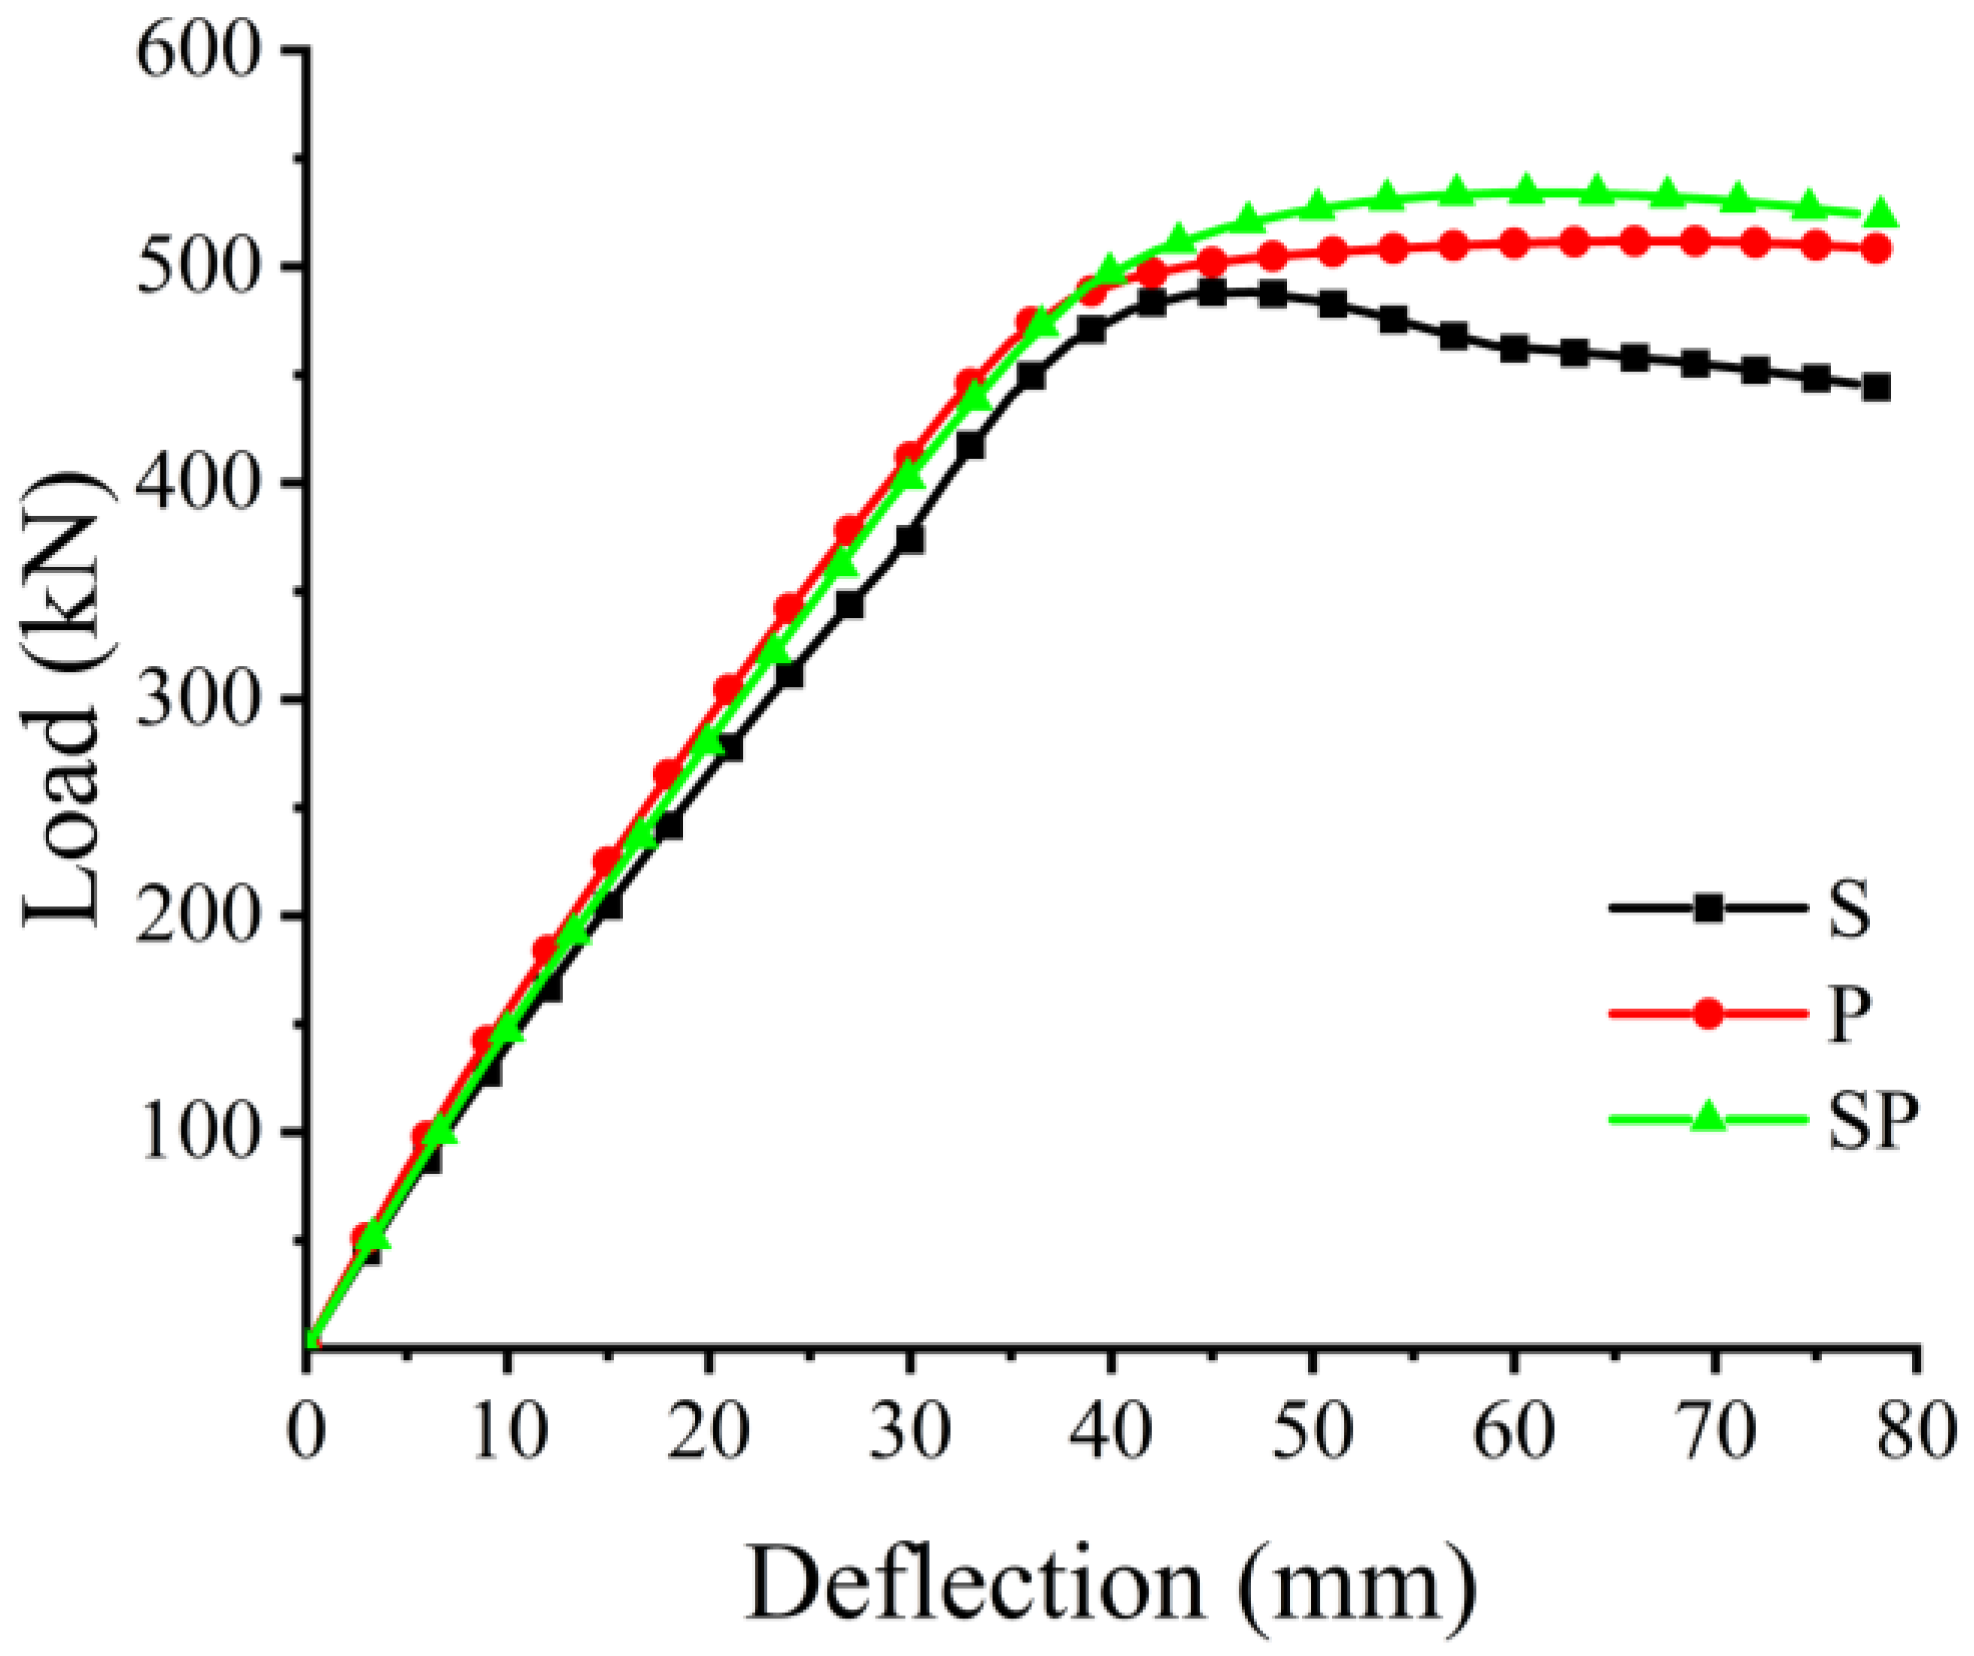
To investigate the effect of different shear connector configurations on the flexural behavior of composite bridge decks, finite element models were developed for specimens with stud shear connectors, PBL shear connectors, and stud–PBL shear connectors. A parametric analysis was performed, presenting the findings in Figure 16. The flexural stiffness values of the three specimens were 12.52 kN/mm, 13.16 kN/mm, and 13.18 kN/mm, respectively, while the corresponding ultimate load capacities were 501.64 kN, 516.87 kN, and 534.04 kN. The specimen with only stud shear connectors exhibited an initially linear load–deflection response. It gradually deviated from linearity and showed a pronounced post-peak drop in load-carrying capacity. This indicates shear failure of the studs or local concrete crushing. In contrast, the specimen with PBL shear connectors displayed much higher initial flexural stiffness. It also showed more gradual post-peak softening and only a modest reduction in load capacity. These features reflect superior shear transfer efficiency and better energy dissipation capacity. Consequently, PBL shear connectors are more suitable for high-cycle fatigue conditions. The specimen with stud–PBL shear connectors effectively combined the merits of both systems. It achieved the highest ultimate load capacity while retaining moderate ductility.
Figure 16.
Effect of different shear connectors on load versus mid-span displacement response.
4.4.2. Effect of Concrete Strength
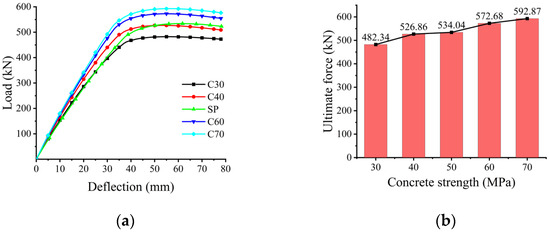
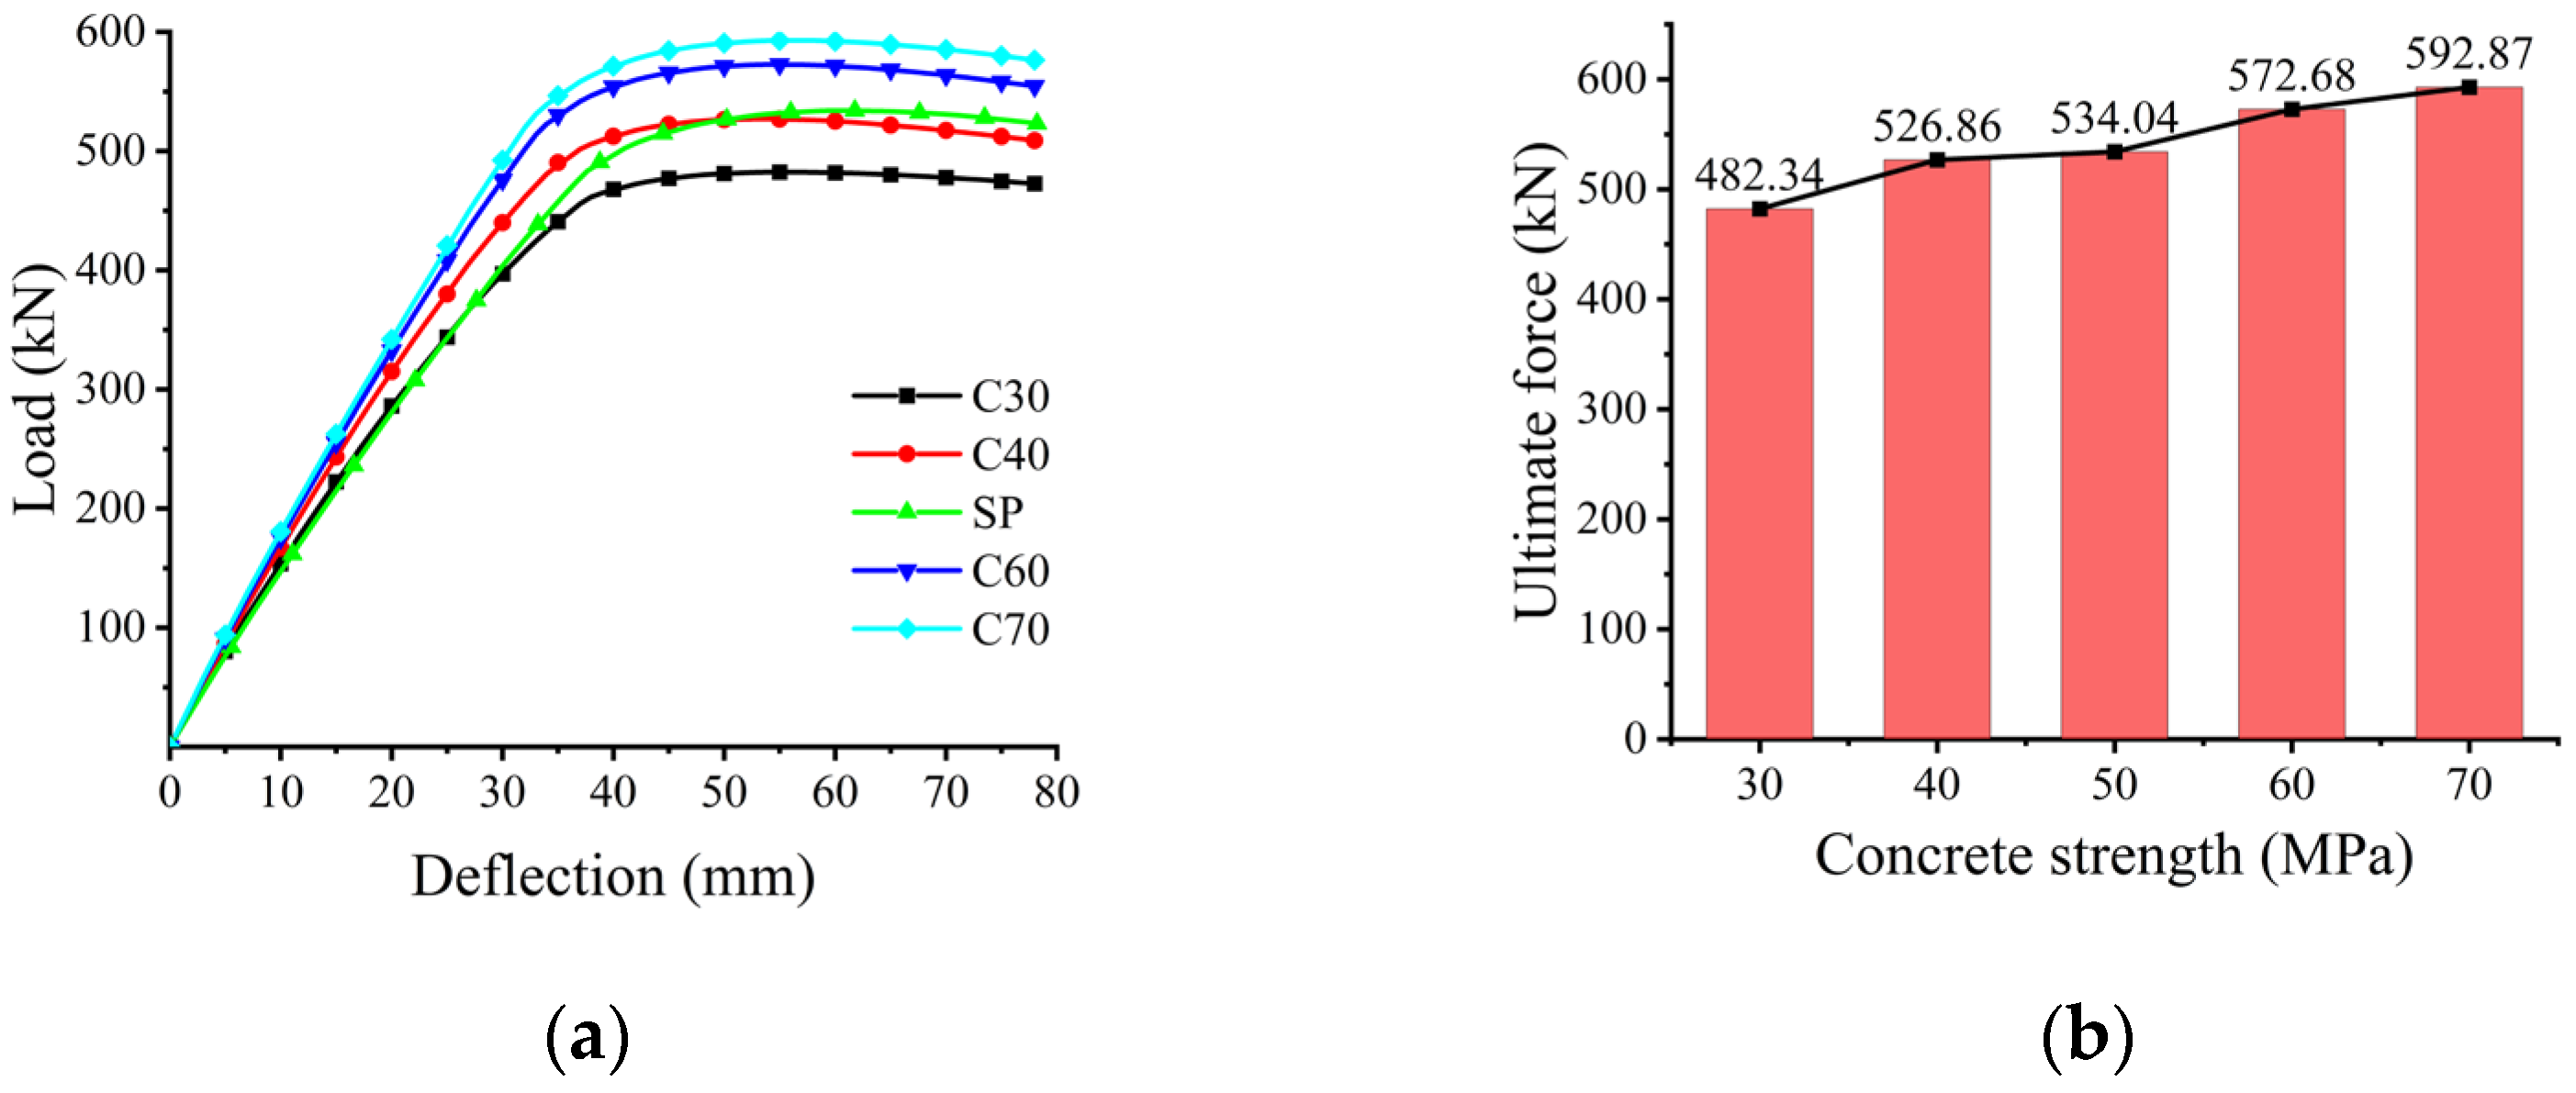
A parametric analysis was conducted on specimens with concrete strengths ranging from C30 to C70. The findings are presented in Figure 17a,b. The load–deflection curves indicate that both the flexural stiffness and load-carrying capacity of the specimens increase significantly with a higher concrete strength. The flexural stiffness increased from 12.43 kN/mm for the C30 specimen to 14.04 kN/mm for the C70 specimen. This improvement demonstrates that high-strength concrete effectively enhances the shear transfer efficiency at the steel–concrete interface. Meanwhile, the peak load rises from 482.34 kN to 592.96 kN. This corresponds to an improvement of approximately 23%. This result indicates that the synergistic effect between PBL and stud shear connectors becomes more pronounced as concrete strength increases, thereby substantially enhancing the overall flexural capacity.
Figure 17.
Effect of concrete strength on the following: (a) load–deflection; (b) ultimate force.
4.4.3. Effect of Stud Diameter
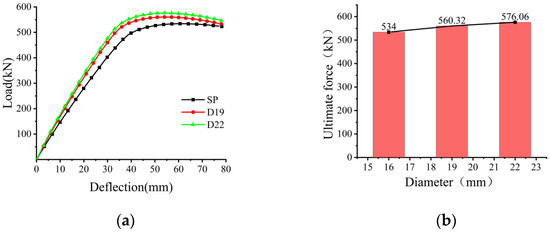
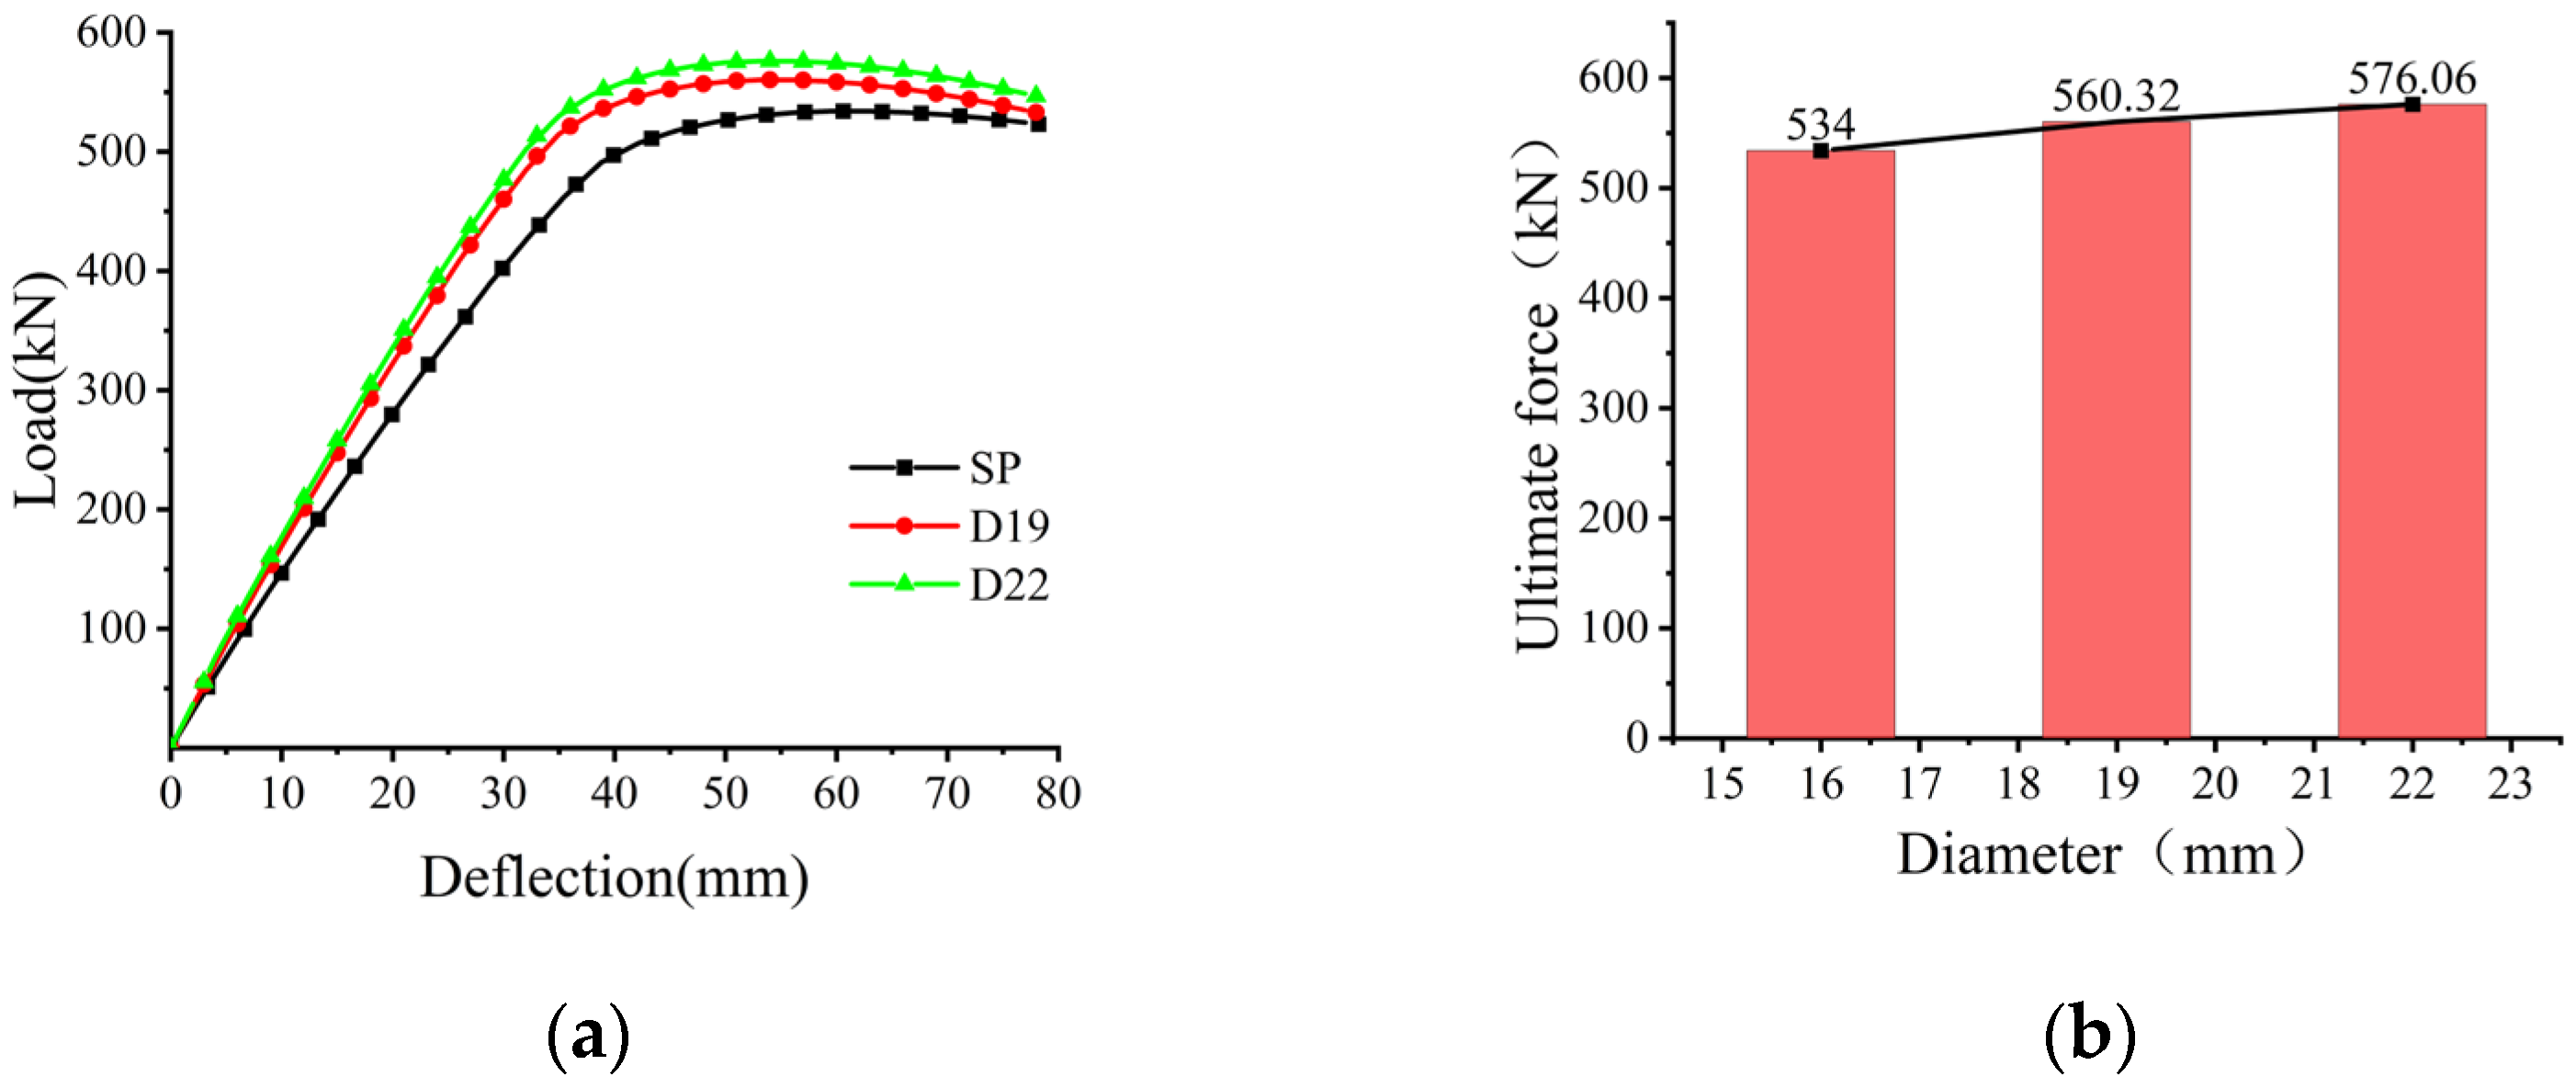
A parametric analysis was conducted on specimens with stud shear diameters of 16 mm, 19 mm, and 22 mm. The results presented in Figure 18a,b indicate that the flexural behavior of the composite bridge decks improved with an increasing stud diameter. The flexural stiffness increased from 13.18 kN/mm for the specimen with 16 mm studs to 13.92 kN/mm for the 22 mm specimen, indicating that the stud diameter has only a marginal effect on the overall stiffness of composite bridge decks. The ultimate load capacity rose from 534.0 kN to 576.0 kN, corresponding to a 7.9% increase. This improvement highlights that a larger stud diameter enhances the synergistic interaction between the PBL shear connectors and the stud shear connectors. Overall, an appropriate increase in the stud diameter can enhance flexural capacity and reduce the slip at the steel–concrete interface.
Figure 18.
Effect of stud diameter on the following: (a) load–deflection; (b) ultimate force.
4.4.4. Effect of Stud Height
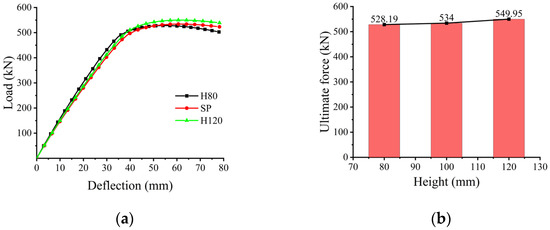
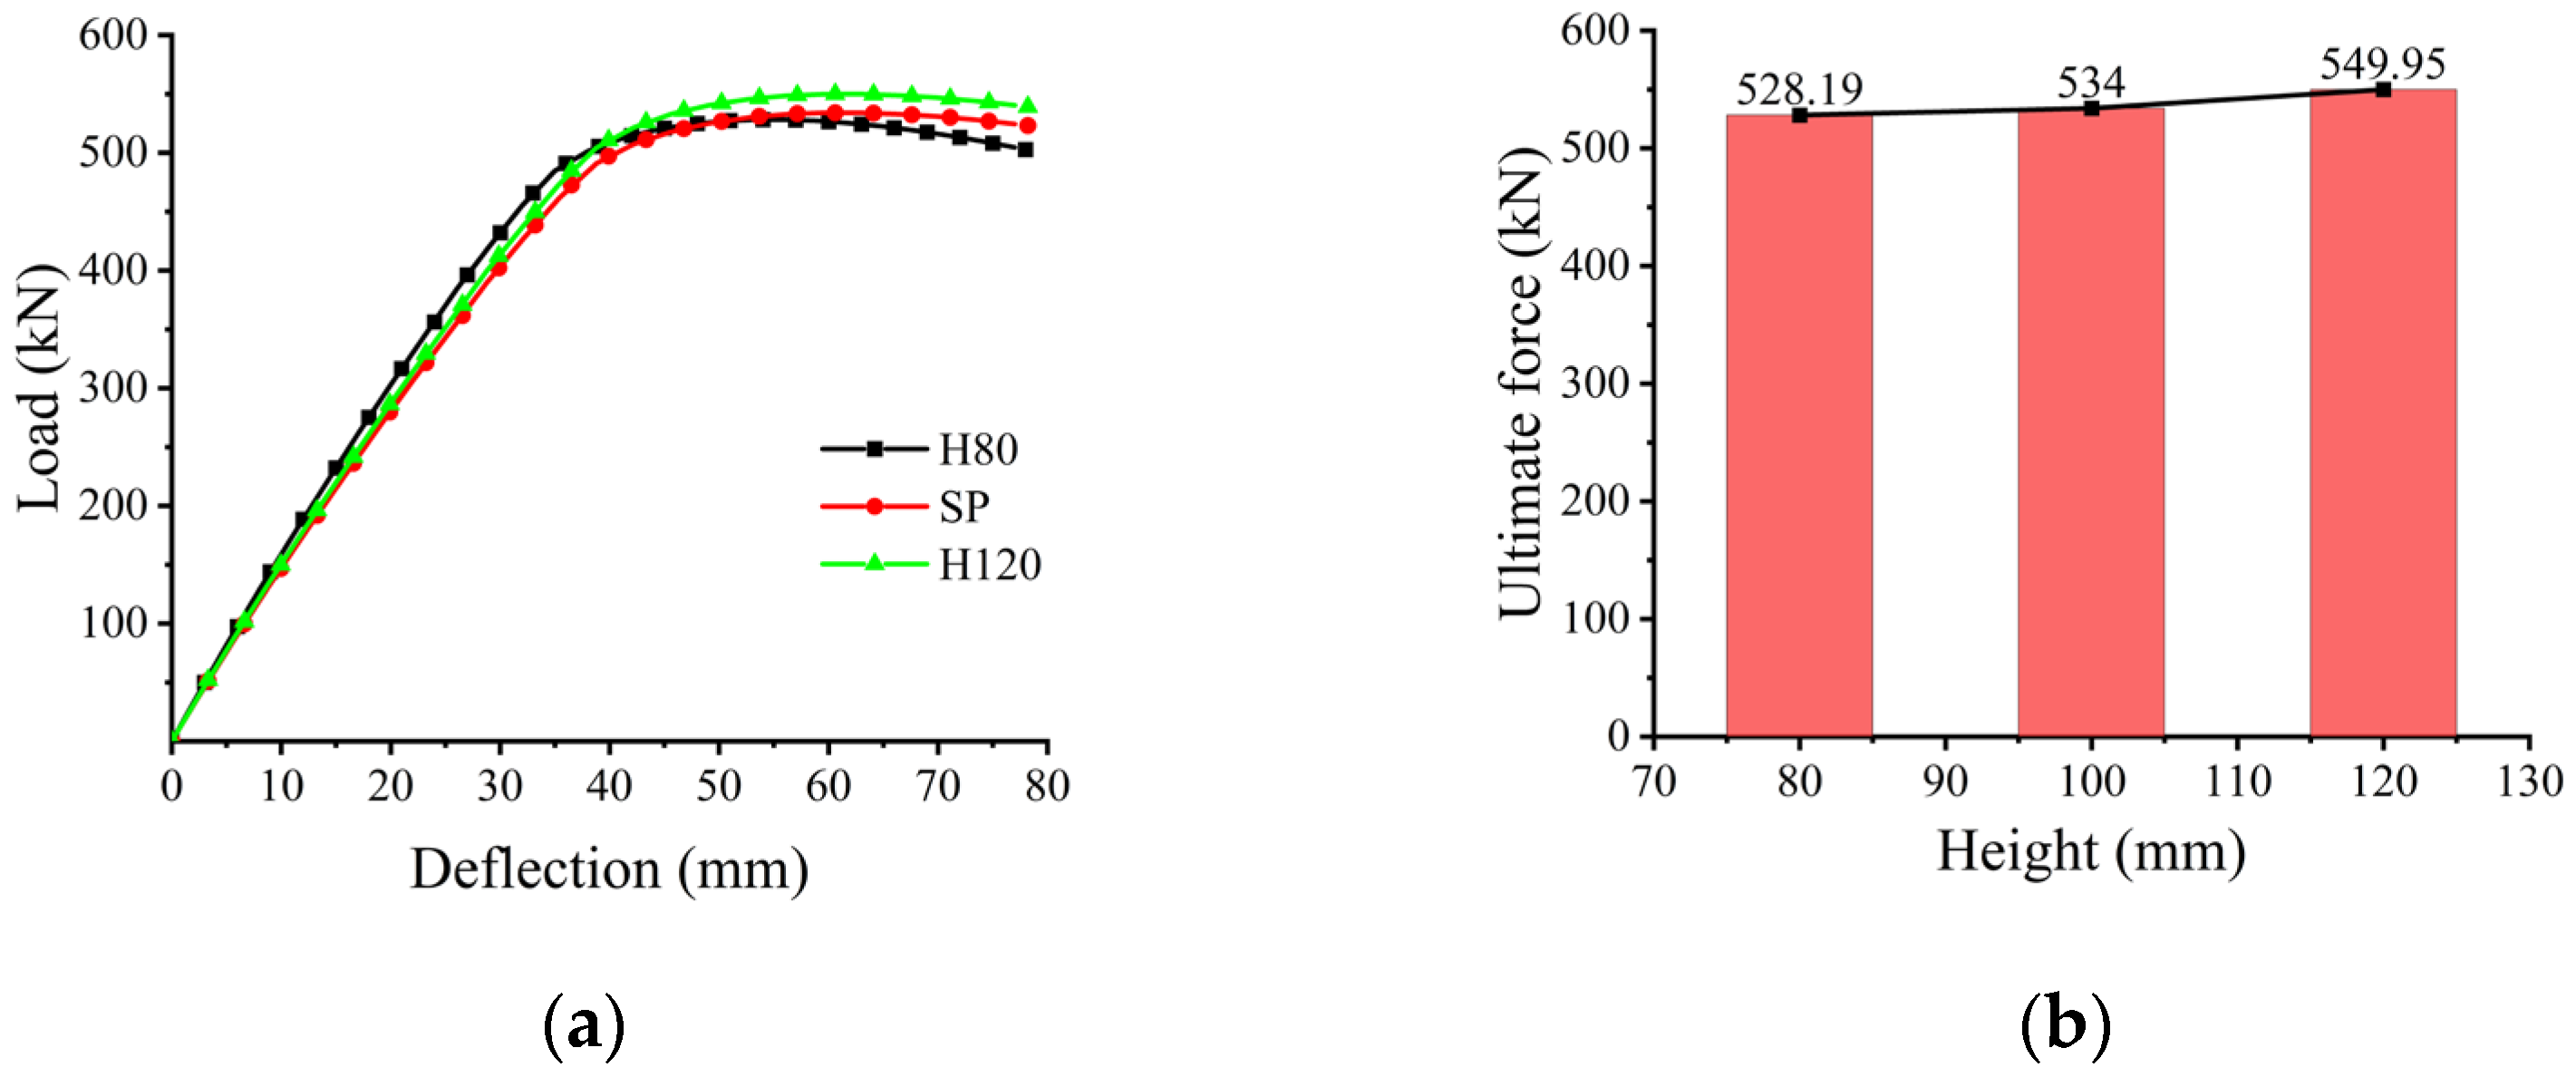
A parametric analysis was conducted on composite specimens with stud heights of 80 mm, 100 mm, and 120 mm. The results presented in Figure 19a,b indicate that both bending stiffness and the ultimate load show only a marginal increase with an increasing stud height, with the overall variation remaining small. The differences in the peak load among the three specimens were all within 5%. This indicates that, although increasing the stud diameter can slightly improve the initial stiffness, its beneficial contribution to the overall flexural performance remains rather limited. Therefore, it is recommended that, in practical design, the stud height should be optimized within a reasonable range to balance structural behavior and construction economy.
Figure 19.
Effect of stud shear height on the following: (a) load–deflection; (b) ultimate force.
4.4.5. Effect of PBL Hole Diameter
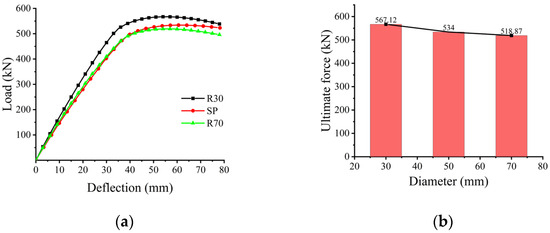
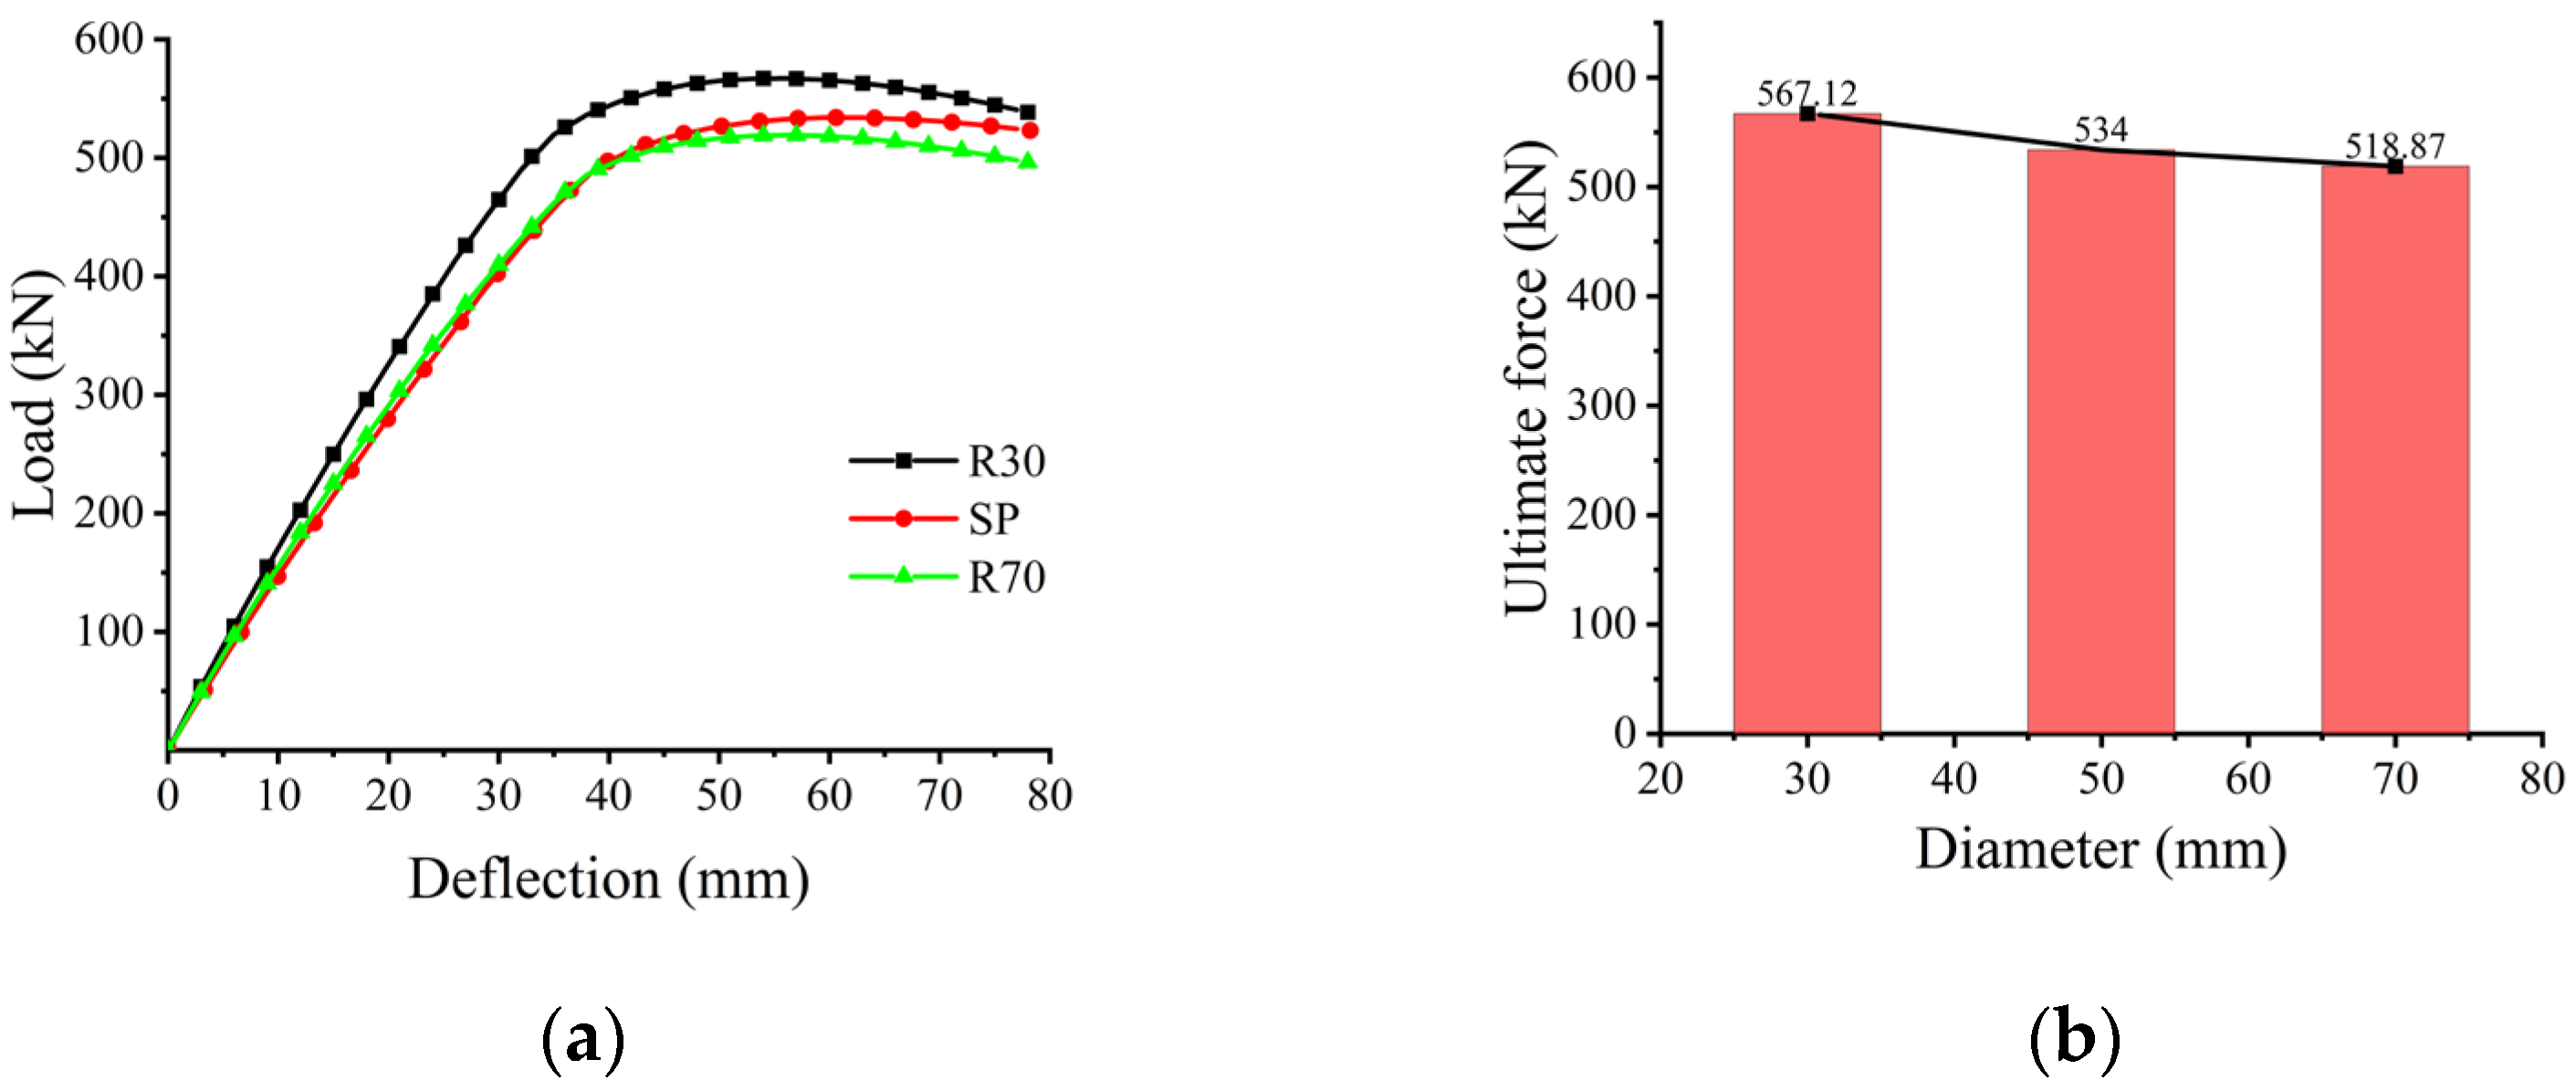
Finite element parametric analysis was performed on PBL shear connectors with hole diameters of 30, 50, and 70 mm to examine their influence on the flexural behavior of composite bridge decks. The results presented in Figure 20a,b indicate that both flexural stiffness and the ultimate load decrease with an increasing PBL hole diameter. The flexural stiffness decreased from 13.92 kN/mm for the specimen with a 30 mm PBL hole to 13.18 kN/mm for the 70 mm PBL hole, corresponding to an approximately 5.3% reduction. This indicates that a larger PBL hole diameter impairs composite action at the steel–concrete interface, thereby reducing the overall flexural stiffness of composite bridge decks. The ultimate load capacity decreased from 561.01 kN for the specimen with a 30 mm PBL hole to 533.44 kN for the specimen with a 70 mm PBL hole, corresponding to a reduction of approximately 5.2%. These results indicate that an increasing PBL hole diameter significantly weakens the perforated steel plate, thereby reducing both flexural stiffness and the ultimate flexural behavior.
Figure 20.
Effect of PBL hole diameter on the following: (a) load–deflection; (b) ultimate force.
The comprehensive analysis results indicate that the shear connector types and concrete strength are the primary factors influencing the flexural behavior of steel–concrete composite bridge decks. A higher concrete strength significantly enhances the flexural capacity of the bridge decks, while the combined use of stud and PBL shear connectors further improves the interfacial composite action. The stud diameter exerts a moderate positive influence on the load-carrying capacity, whereas the stud height has only a marginal effect. In contrast, an excessively large PBL hole diameter significantly weakens the perforated steel plate, thereby degrading the overall flexural performance.
5. Flexural Behavior of Steel–Concrete Composite Bridge Decks
Experimental and numerical findings show that the slip between the steel plate and concrete at the ultimate state is small, demonstrating excellent composite action. The failure mode corresponds to a typical flexural failure, characterized by the yielding of the bottom steel plate and PBL shear connectors. At failure, plastic hinges developed in the positive bending moment regions. Thus, the calculation of the ultimate bearing capacity is based on the assumptions below:
- (1)
- At the ultimate limit state of positive bending and shear, the bottom steel plate yields in tension, the rebar at the upper part of the section yields in compression, and the concrete in the compression zone reaches its design compressive strength.
- (2)
- During all stages of loading, the composite bridge decks’ section satisfies the plane-section assumption, and the deformations of the rebar and concrete are compatible.
- (3)
- The tensile strength of the concrete is neglected.
- (4)
- The contribution of rebars in the concrete slab is neglected.
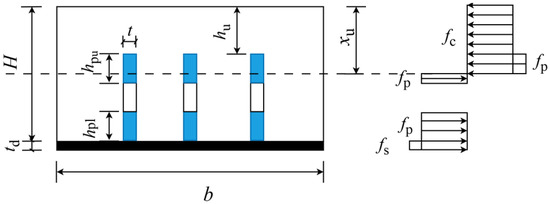
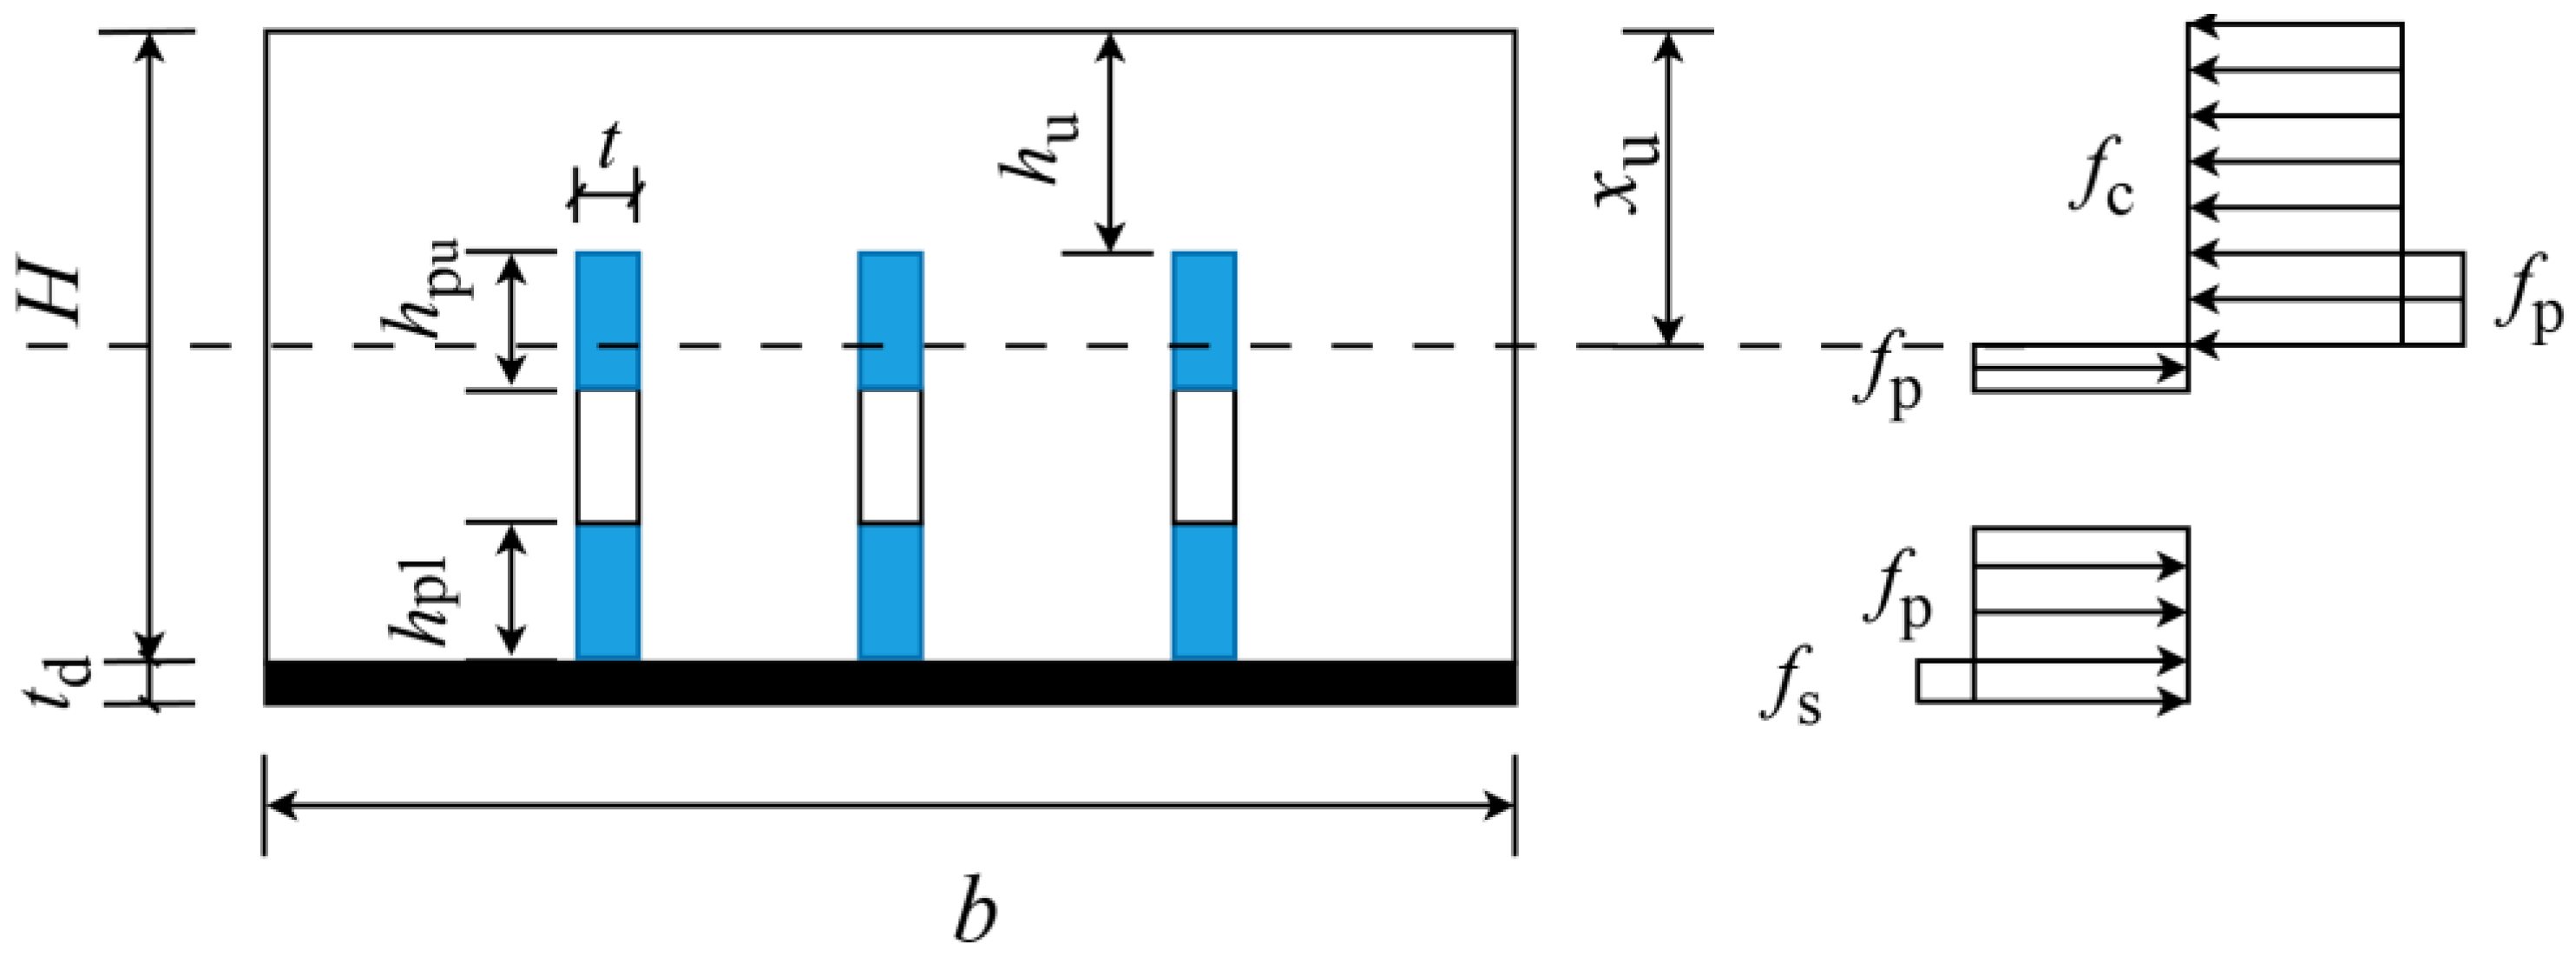
The simplified diagram for calculating the positive bending moment capacity of the composite bridge decks’ section is shown in Figure 21. According to the above assumptions, the ultimate load-carrying capacity of the composite bridge decks was calculated for the following four cases, classified according to the position of the neutral axis.
Figure 21.
Schematic of steel–concrete composite decks under ultimate flexural capacity.
- (1)
- The neutral axis lies within the concrete above the PBL shear connectors.
In the equation, td is the steel plate thickness; t is the PBL shear connectors thickness; is the steel strength; is the PBL shear connectors’ strength; is the concrete strength; x is the equivalent height of the concrete compression zone corresponding to the ultimate limit state under positive bending; H is the height of the steel–concrete composite bridge deck; hpu and hpl are the heights of the upper and lower parts of the PBL shear connectors, respectively; d is the diameter of the hole; hc is the distance from the top of the PBL shear connectors to the top of the steel–concrete composite bridge deck. l0 is the effective span; is the calculated ultimate bearing capacity; and is the length of the distribution beam.
- (2)
- The neutral axis lies within the upper steel plate of the PBL shear connectors.
- (3)
- The neutral axis passes through the perforated connector holes.
- (4)
- The neutral axis lies within the lower steel plate of the PBL shear connectors.
The ultimate flexural capacities calculated using the proposed method are compared with the experimental and finite element results in Table 6 and Table 7. The comparison indicates that the calculated, simulated, and experimental values are in close agreement, demonstrating that the ultimate flexural capacity of the composite bridge deck is governed by the plastic resistance of the cross-section. This confirms that the plastic theory-based calculation of ultimate capacity provides reliable and accurate predictions. The comparative analysis demonstrates that, under identical conditions, the steel–concrete composite bridge deck with stud–PBL shear connectors attains a higher ultimate load-carrying capacity than those equipped with only one type of shear connector. Therefore, this configuration not only increases load-bearing capacity but also enhances the overall structural safety and reliability.
Table 6.
Comparison of the ultimate load capacities of the specimens.
Table 7.
Comparison of the ultimate load capacities from the parametric analysis.
6. Discussion
6.1. Economic Evaluation
The steel–concrete composite deck with stud–PBL connectors offers a cost-effective and widely applicable solution in modern bridge engineering. Compared with conventional stud-only systems, it improves both shear capacity and flexural stiffness.
From an economic perspective, this configuration exhibits advantages over alternatives such as steel–UHPC decks. The use of normal-strength concrete significantly reduces material costs, while the reduced reliance on dense welded connections lowers fabrication complexity and associated fatigue risks. These factors jointly contribute to lower initial construction costs and improved lifecycle economy. The economic component is presented in Table 8.
Table 8.
Economic comparison of different composite bridge decks.
6.2. Flexural Behavior and Failure Mechanisms
This study conducted a systematic evaluation of the flexural behavior of steel–concrete composite bridge decks with stud–PBL shear connectors, based on bending tests and a finite element analysis. The investigation further examined the failure modes, the interface interaction, and the influence of key design parameters. These results indicate that all specimens retained full composite action during loading and that the plane-section assumption is valid for this type of composite bridge deck.
According to current design specifications [36,37], the longitudinal spacing of shear connectors should not exceed three times the concrete deck thickness or 300 mm. The stud spacings of 150 mm and 300 mm adopted in this study both comply with these requirements, with 300 mm representing the code-specified upper limit. The test results indicate that reducing the stud spacing from 300 mm to 150 mm results in only a slight increase in the ultimate load while significantly decreasing the interface slip. This suggests that the code limit is primarily governed by strength requirements, whereas smaller spacing is more effective in improving deformation compatibility and composite action. When economic conditions permit, adopting a reduced stud spacing in the range of 150–200 mm can, therefore, be considered to enhance interface performance and flexural stiffness without a notable increase in construction costs.
6.3. Influence of Design Parameters on Flexural Behavior
The good agreement between the finite element results and the experimental observations demonstrates the reliability of the proposed modeling approach. The load–deflection curves, the ultimate load, the yielding region of the steel plate, and the distribution of concrete damage predicted through the simulation agree well with the test results, with discrepancies remaining within a reasonable range. The finite element analysis results indicate that concrete compressive damage is concentrated in the mid-span compression zone, whereas tensile damage develops continuously along the decks’ bottom, representing a typical bending-dominated failure process. This agreement confirms the effectiveness of the adopted constitutive models and the contact simulation approach. It also demonstrates that the proposed calculation model can reasonably predict the ultimate flexural capacity.
The parameter analysis further clarifies the influence of major design variables on the flexural behavior. Concrete strength exhibits the most significant effect on both stiffness and load capacity, indicating its dominant role in governing the global flexural response. Although the stud diameter and height impose certain effects on flexural resistance, their influence is considerably weaker than that of concrete strength, suggesting that the behavior of an individual stud is not the determining factor within the composite connector system. An increase in the PBL hole diameter results in a decrease in the load capacity, mainly owing to the reduction in the effective steel area and the weakening of the concrete dowel action. These trends are consistent with the deformation patterns and interface slip behavior observed in the tests. In addition, the numerical simulations indicate that the deck system exhibits an improved flexural performance and ductility compared with decks employing conventional stud-only connectors. This demonstrates that stud–PBL shear connectors provide distinct advantages in enhancing the flexural behavior and the shear resistance of the steel–concrete interface.
Despite the comprehensive insights gained into the flexural behavior of steel–concrete composite bridge decks with stud–PBL shear connectors, further research is still warranted. This study focused on static bending behavior and did not account for long-term influences such as fatigue loading, temperature variations, and environmental degradation on interface behavior. Moreover, the optimal arrangement and proportioning of composite shear connectors require additional investigation. In addition, the parameter analysis did not include advanced material systems, such as fiber-reinforced concrete or UHPC. These materials may alter the mechanical response of composite bridge decks with composite connectors. Future research should, therefore, extend to fatigue behavior evolution, interface damage modeling, and the optimization of connector configurations. This will help enhance the applicability of such structures under heavy-duty and multi-scenario service conditions.
7. Conclusions
To investigate the flexural behavior of steel–concrete composite bridge decks with stud–PBL shear connectors, static loading tests were conducted on composite bridge deck specimens. An existing method for predicting the ultimate flexural capacity was adopted and verified with experimental observations. Nonlinear finite element models were additionally established. A subsequent parametric analysis was conducted to investigate the influence of shear connector types, concrete strength, the stud diameter, the stud height, and the PBL hole diameter on the flexural response of the structure. Based on the test, as well as the analytical and numerical results, the key findings are summarized below:
- (1)
- Under positive bending moments, the steel–concrete composite bridge decks with stud–PBL shear connectors exhibit bending-dominated failure, marked by mid-span bottom steel plate yielding and top concrete layer crushing.
- (2)
- Reducing the stud spacing has a negligible effect on the flexural stiffness of the composite bridge decks, but it significantly decreases the interface slip. Additionally, the flexural bearing capacity of the bridge decks was significantly improved. This indicates that a smaller stud spacing can enhance the overall structural performance and deformation compatibility.
- (3)
- The finite element analysis results agree well with the experimental measurements and theoretical calculations. The differences between the calculated and measured capacities fall within an acceptable range, and the predicted failure modes are consistent with the experimentally observed behavior.
- (4)
- Increasing the concrete strength substantially improves the shear transfer at the steel–concrete interface and enhances the overall flexural stiffness. In comparison, variations in stud diameter and height have a limited influence on the flexural capacity. Enlarging the PBL hole diameter slightly decreases the ultimate load of the specimens. Compared with single-type shear connectors, the stud–PBL shear connectors more effectively distribute shear forces and bending moments. They can further enhance both the flexural behavior of the composite bridge decks and shear resistance at the steel–concrete interface.
Author Contributions
Conceptualization, R.D.; methodology, J.Z.; formal analysis, L.S.; investigation, D.W.; writing—original draft preparation, R.D.; writing—review, editing, and visualization, D.Z.; project administration and data curation, W.Z. All authors have read and agreed to the published version of the manuscript.
Funding
This research was funded by the Key Supported Science and Technology Project in Ningbo’s Transportation Sector for 2024 (No. 202403).
Data Availability Statement
The original contributions presented in the study are included in the article; further inquiries can be directed to the corresponding author.
Conflicts of Interest
Authors Jun Zhao, Longhua Shi and Dongjie Weng were employed by the company Ning Bo Communications Engineering Construction Group Co., Ltd. The remaining authors declare that the research was conducted in the absence of any commercial or financial relationships that could be construed as a potential conflict of interest.
References
- Nie, J. Development and prospect of generalized composite structures. J. Build. Struct. 2006, 27, 1–8. [Google Scholar]
- Liu, Y.Q. Steel–Concrete Composite Bridge; China Communications Press: Beijing, China, 2005. [Google Scholar]
- Huang, Q. Design Principle of Steel-Concrete Composite Bridge Structure, 2nd ed.; China Communications Press: Beijing, China, 2017. [Google Scholar]
- Nie, J.G.; Wang, J.J.; Gou, S.K.; Zhu, Y.Y.; Fan, J.S. Technological development and engineering applications of novel steel-concrete composite structures. Front. Struct. Civ. Eng. 2019, 13, 1–14. [Google Scholar] [CrossRef] [Scilit]
- Abdullah, R.; Easterling, W.S. Determination of composite slab strength using a new elemental test method. J. Struct. Eng. 2007, 133, 1268–1277. [Google Scholar] [CrossRef] [Scilit]
- Abdullah, R.; Easterling, W.S. New evaluation and modeling procedure for horizontal shear bond in composite slabs. J. Constr. Steel Res. 2009, 65, 891–899. [Google Scholar] [CrossRef] [Scilit]
- Sonoda, K.; Horikawa, T.; Kitoh, H.; Kiso, S. Shearing force on studs and punching shear load of a steel plate and concrete composite slab. Doboku Gakkai Ronbunshu 1989, 404, 249–258. [Google Scholar] [CrossRef] [Scilit] [PubMed]
- Sonoda, K.; Kitoh, H. Ultimate Loading Capacities and Failure Modes of Steel Plate and Concrete Composite slabs. Doboku Gakkai Ronbunshu 1993, 471, 85–94. [Google Scholar] [CrossRef] [Scilit]
- Kim, H.Y.; Jeong, Y.J. Experimental investigation on behaviour of steel-concrete composite bridge decks with perfobond ribs. J. Constr. Steel Res. 2006, 62, 463–471. [Google Scholar] [CrossRef] [Scilit]
- Jeong, Y.J. Simplified model to predict partial-interactive structural behaviour of steel-concrete composite slabs. J. Constr. Steel Res. 2008, 64, 238–246. [Google Scholar] [CrossRef] [Scilit]
- Jeong, Y.J.; Kim, H.Y.; Koo, H.B. Longitudinal shear resistance of steel-concrete composite slabs with perfobond shear connectors. J. Constr. Steel Res. 2009, 65, 81–88. [Google Scholar] [CrossRef] [Scilit]
- Kim, H.Y.; Jeong, Y.J. Ultimate strength of a steel-concrete composite bridge deck with profiled sheeting. Eng. Struct. 2010, 32, 534–546. [Google Scholar] [CrossRef] [Scilit]
- Fujiyama, C.; Sakurai, N.; Maekawa, K. Fatigue failure mode of steel-concrete composite bridge deck depending on interface property and shear connector profiles. J. Jpn. Soc. Civ. Eng. Ser. A1 (Struct. Eng. Earthq. Eng. (SE/EE)) 2011, 67, 193–206. [Google Scholar] [CrossRef] [Scilit]
- Fujiyama, C.; Sakurai, N.; Maekawa, K. Failure Mode of steel-concrete composite bridge deck depending on shear connector profiles. J. Jpn. Soc. Civ. Eng. Ser. A1 (Struct. Eng. Earthq. Eng. (SE/EE)) 2012, 68, 1–15. [Google Scholar]
- Yang, Y.; Zhou, P.; Nie, J.; Xie, B. Experiment on static and fatigue behavior of steel plate-concrete composite bridge decks. J. Highw. Transp. 2009, 22, 78–83. [Google Scholar]
- Yang, Y.; Huo, X.-D.; Xue, J.-Y.; Zhou, P.-J.; Nie, J.-G. Experiment study on fatigue behavior of steel plate-concrete composite bridge decks. Eng. Mech. 2011, 28, 37–44. [Google Scholar]
- Yang, Y.; Zhou, X.W.; Xue, J.Y.; Huo, X.D. Experimental study on fatigue behavior of composite girders with steel plate concrete composite bridge decks. Civ. Eng. J. 2012, 45, 123–131. [Google Scholar]
- Xu, X.Q.; Liu, Y.Q.; Ren, W.M. Experiments on shear capacity of stud–rubber composite shear connector. J. Tongji Univ. 2014, 42, 346–350. [Google Scholar]
- Lorenc, W.; Kozuch, M.; Rowinski, S. The behaviour of puzzle-shaped composite dowels—Part I: Experimental study. J. Constr. Steel Res. 2014, 101, 482–499. [Google Scholar] [CrossRef] [Scilit]
- Kozuch, M.; Lorenc, W. The behaviour of clothoid-shaped composite dowels: Experimental and numerical investigations. J. Constr. Steel Res. 2020, 167, 105962. [Google Scholar] [CrossRef] [Scilit]
- Yuan, Y.; Wu, C.; Jiang, X. Experimental study on the fatigue behavior of the orthotropic steel deck rehabilitated by UHPC overlay. J. Constr. Steel Res. 2019, 157, 1–9. [Google Scholar] [CrossRef] [Scilit]
- Li, H.H.; Li, L.F.; Fan, X.; Ye, M.; Shao, X.D.; Yi, L.Z. Experimental and numerical investigation on the flexural behavior of a large-scale prestressed UHPC T-Shaped girder. Eng. Struct. 2022, 272, 115027. [Google Scholar] [CrossRef] [Scilit]
- Feng, J.H.; Shao, X.D.; Qiu, M.H.; Li, H.H.; Gao, X.; Huang, Z.L. Reliability evaluation of flexural capacity design provision for UHPC beams reinforced with steel rebars/prestressing tendons. Eng. Struct. 2024, 300, 117160. [Google Scholar] [CrossRef] [Scilit]
- Tan, C.J.; Luo, Z.H.; Zhao, H.; An, J.H.; Liang, L.N.; Guo, W.H.; Shao, X.D. Flexural Behavior on a Steel-UHPC composite bridge deck System of Long-Span Bridges. J. Bridge Eng. 2023, 28, 04023062. [Google Scholar] [CrossRef] [Scilit]
- Shao, X.D.; Cao, J.H. Fatigue Assessment of Steel-UHPC Lightweight Composite deck Based on Multiscale FE Analysis: Case Study. J. Bridge Eng. 2018, 23, 05017015. [Google Scholar] [CrossRef] [Scilit]
- Wei, C.; Zhang, Q.H.; Yang, Z.X.; Li, M.Z.; Cheng, Z.Y.; Bao, Y. Flexural cracking behavior of reinforced UHPC overlay in composite bridge deck with orthotropic steel deck under static and fatigue loads. Eng. Struct. 2022, 265, 114537. [Google Scholar] [CrossRef] [Scilit]
- Cheng, Z.Y.; Zhang, Q.H.; Bao, Y.; Deng, P.H.; Wei, C.; Li, M.Z. Flexural behavior of corrugated steel-UHPC composite bridge decks. Eng. Struct. 2021, 246, 113066. [Google Scholar] [CrossRef] [Scilit]
- GB/T 714-2008; Structural Steel for Bridge. Standards Press of China: Beijing, China, 2008.
- GB/T 50152-2012; Standard for Test Method of Concrete Structures. China Building Industry Press: Beijing, China, 2012.
- Nie, J.; Yu, H.W. Comparison study of constitutive model of concrete in ABAQUS for static analysis of structures. Eng. Mech. 2013, 30, 59–67. [Google Scholar]
- Yu, S.Y.; Sun, Z.H.; Yu, J.; Yang, J.; Zhu, C.H. An improved meshless method for modeling the mesoscale cracking processes of concrete containing random aggregates and initial defects. Constr. Build. Mater. 2023, 363, 129770. [Google Scholar] [CrossRef] [Scilit]
- GB 50010–2010; Code for Design of Concrete Structure. China Building Industry Press: Beijing, China, 2010.
- Eurocode 4; Design of Composite Steel and Concrete Structures-Part 2: General Rules and Rules for Bridge. European Committee for Standardization: Brussels, Belgium, 2005.
- AASHTO. AASHTO-LRFD Bridge Design Specifications; American Association of State Highway and Transportation Officials: Washington, DC, USA, 2007. [Google Scholar]
- Pei, B.D.; Zou, L.T.; Li, H.H.; Li, L.F.; Feng, S.C.; Rao, Z.D. Experimental and analytical study on the flexural behavior a novel steel-NC-UHPC composite bridge deck system. J. Constr. Steel Res. 2025, 235, 109890. [Google Scholar] [CrossRef] [Scilit]
- GB 50017–2017; Standard for Design of Steel Structures. China Architecture and Building Press: Beijing, China, 2018.
- JTG 3362-2018; Specifications for Design of Highway Reinforced Concreteand Prestressed Concrete Bridges and Culverts. China Communications Press: Beijing, China, 2018.

Disclaimer/Publisher’s Note: The statements, opinions and data contained in all publications are solely those of the individual author(s) and contributor(s) and not of MDPI and/or the editor(s). MDPI and/or the editor(s) disclaim responsibility for any injury to people or property resulting from any ideas, methods, instructions or products referred to in the content. |
© 2025 by the authors. Licensee MDPI, Basel, Switzerland. This article is an open access article distributed under the terms and conditions of the Creative Commons Attribution (CC BY) license.