Article

Influence of Construction-Induced Effects and Post-Grouting on the Performance of Mud-Protected Bored Piles: A Numerical Investigation

1
The Guangdong NO.3 Water Conservancy and Hydro-Electric Engineering Board Co., Ltd., Dongguan 523710, China
2
School of Marine Science and Engineering, South China University of Technology, Guangzhou 511442, China
*
Author to whom correspondence should be addressed.
Buildings 2025, 15(9), 1457; https://doi.org/10.3390/buildings15091457
Submission received: 1 April 2025 / Revised: 21 April 2025 / Accepted: 23 April 2025 / Published: 25 April 2025

Abstract

Mud-protected bored piles are widely used in foundation engineering due to their high bearing capacity and strong adaptability to various geological conditions. However, the formation of mud skin around the pile shaft and sediment at the pile bottom during construction significantly affects their mechanical behavior, posing challenges for performance evaluation and design optimization. The post-grouting technique, which involves injecting grout material to strengthen the bottom and surrounding soils, has been practically adopted to enhance pile performance. This study investigates the effect of construction-induced factors (mud skin and sediment) and post-grouting on the performance of mud-protected bored piles. Finite element analyses were conducted based on a super-long test pile (60 m in length, 1.8 m in diameter) from an infrastructure project in Eastern China. The numerical model was validated against field test measurements and previously published numerical results. The results reveal that mud skin and sediment individually decrease the bearing capacity by 28% and 24%, respectively, compared to ideal conditions. When both factors are present, the bearing capacity is decreased by 36%. The post-grouting technique effectively improves pile performance, increasing the bearing capacity by 81% compared to non-grouting conditions. The findings also demonstrate that side friction dominates the bearing behavior of the studied super-long pile, accounting for approximately 90% of the total bearing capacity. Parametric analysis indicates that post-grouting effectiveness varies with soil properties and dimensions of effective grouting zones, showing greater improvement in weak soils. These results provide insights into the mechanisms through which construction-induced effects impact pile performance and offer guidelines for post-grouting applications.

1. Introduction

The rapid development of infrastructure construction globally has led to the widespread use of bored piles in major engineering projects such as high-rise buildings, bridges, high-speed railways, and marine engineering, which leads to a significant increase in the demand for robust foundation engineering solutions [1,2]. Mud-protected bored piles have gained popularity in foundation engineering due to their adaptability to diverse geological conditions and their ability to minimize construction-induced vibrations. This technique has been extensively utilized in high-rise buildings, bridges, and other infrastructure projects, particularly where traditional piling methods may cause excessive ground disturbance. Projects across Asia, Europe, and North America have demonstrated the effectiveness of mud-protected bored piles in challenging soil conditions [3,4].
However, the construction process of bored piles, which involves mud protection, hole formation, and cleaning, often results in the formation of mud skins around the pile shaft and sediment accumulation at the pile bottom. These issues can negatively impact the bearing performance and overall quality of pile foundations [3]. The formation of mud skins and sediment during construction remains a persistent challenge, potentially reducing the bearing capacity of piles. To address these challenges, post-grouting technology has been increasingly adopted. This technique involves injecting high-pressure cement grout through pre-embedded pipes after the concrete has hardened, thereby strengthening the soil at the pile base and sides [5,6].
This study aims to provide a numerical investigation of the effects of construction factors (mud skin and sediments) and post-grouting treatment on the performance of bored piles. By analyzing the combined impact of these factors, this research seeks to offer valuable insights and practical guidance for the design and construction of bored piles in various geological conditions. The findings are expected to contribute to the optimization of foundation engineering practices and the enhancement of pile performance in global infrastructure projects.

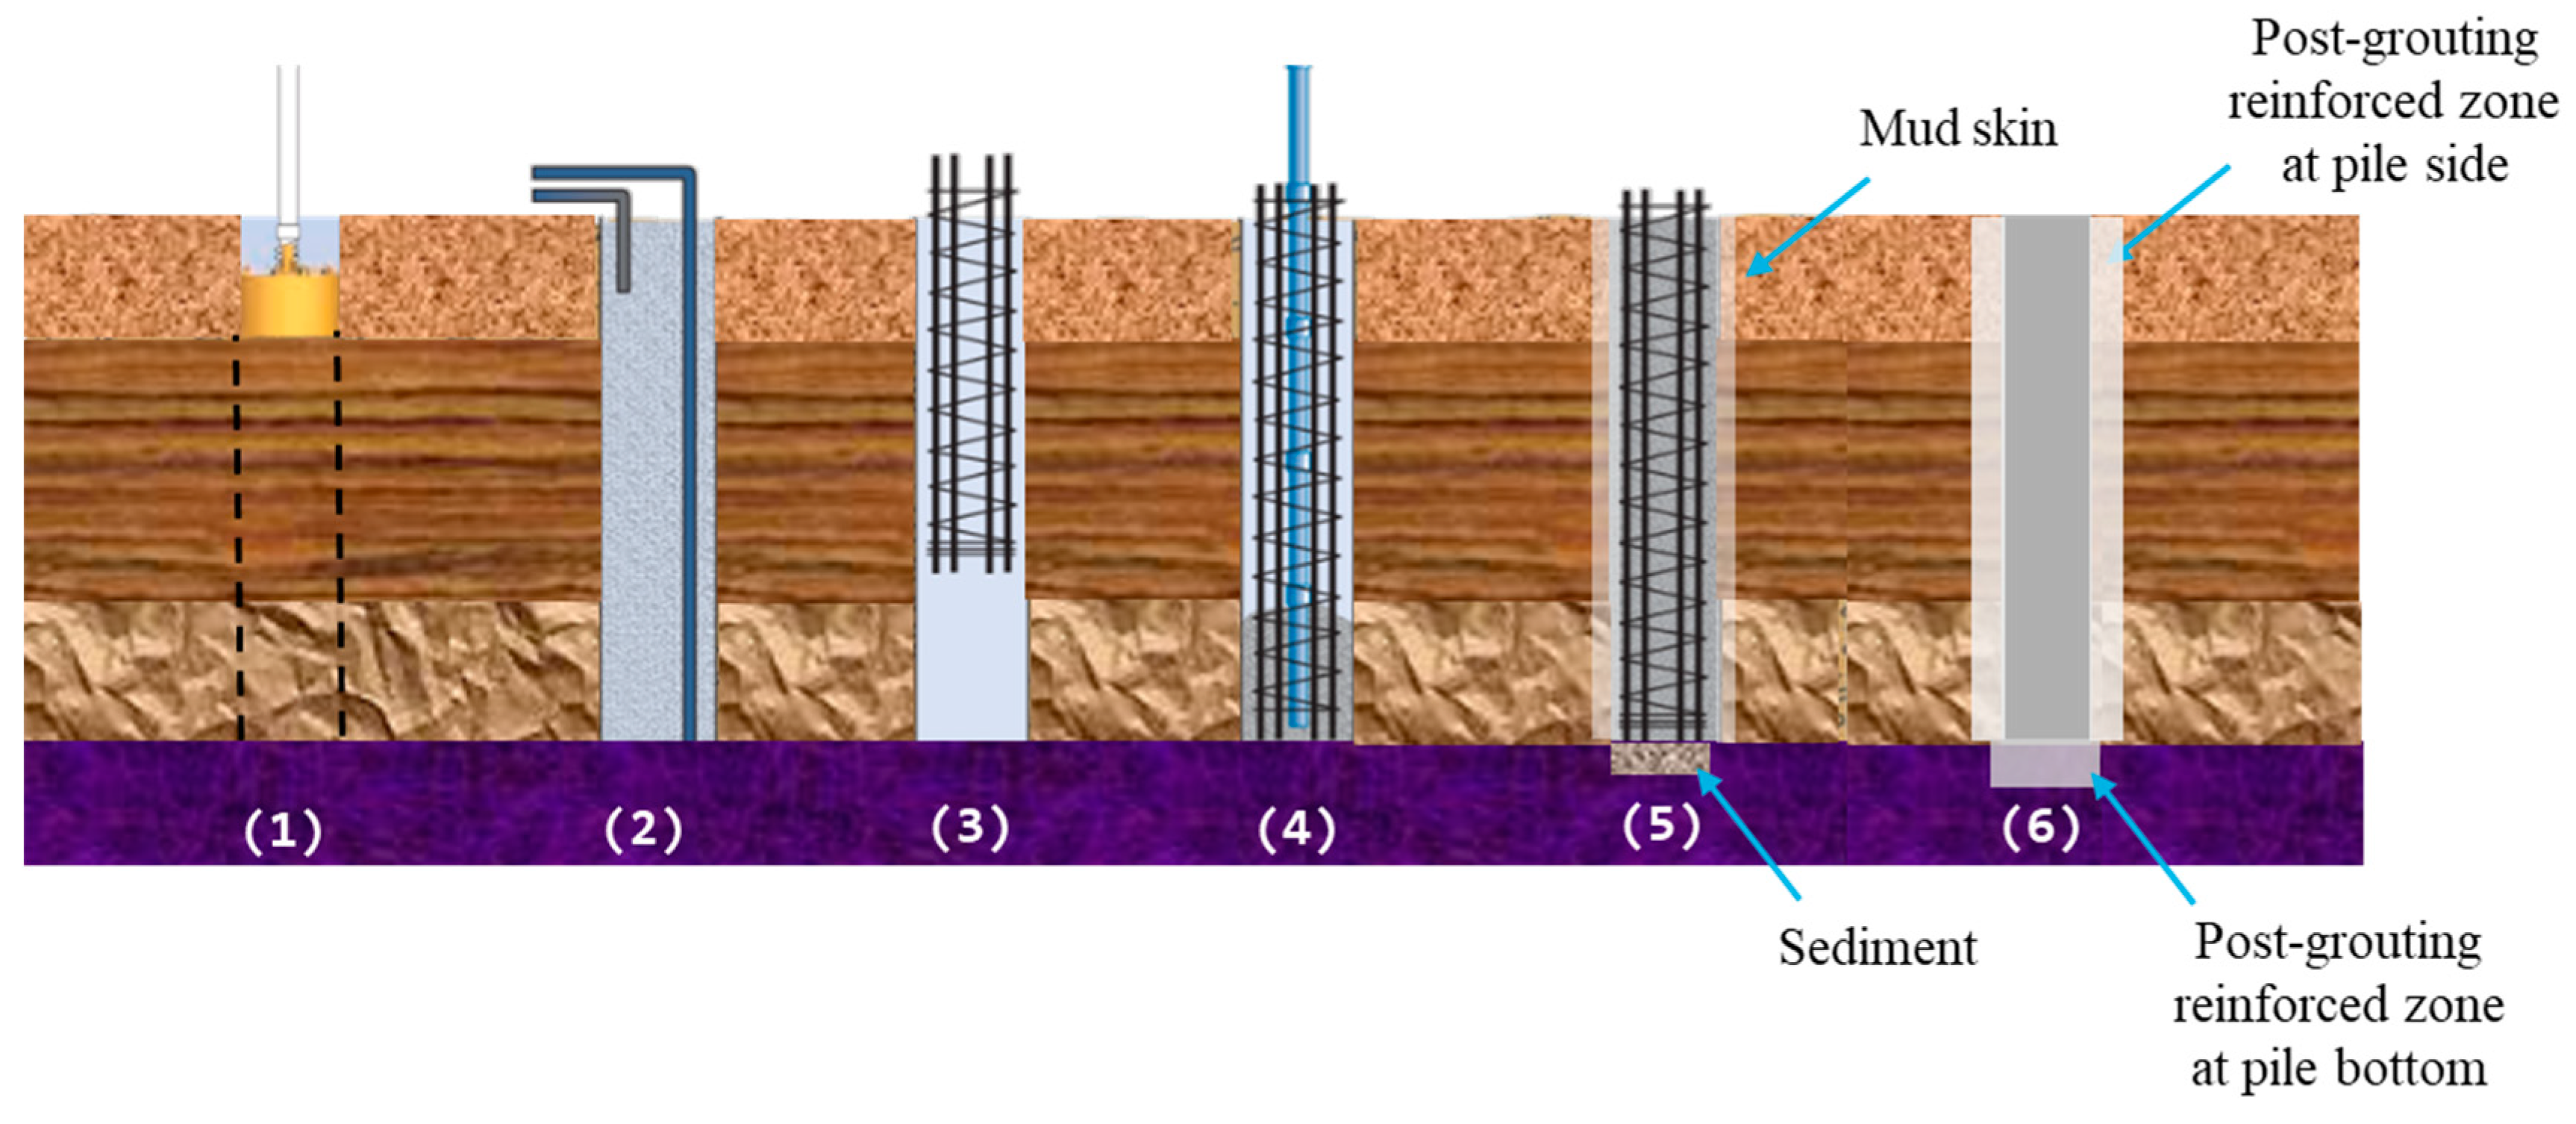
1.1. Conception of Mud-Protected Bored Pile

The construction of mud-protected bored piles involves several key steps, as illustrated in Figure 1. The process begins with drilling under the protection of bentonite mud (Step 1), which serves multiple functions including stabilizing the borehole wall, removing cuttings, cooling equipment, and providing lubrication. Following excavation, the borehole is cleaned (Step 2). The steel reinforcement cage is then placed into the borehole (Step 3), after which concrete is poured through tremie pipes using the displacement method (Step 4) to ensure proper concrete placement from bottom to top while preventing mixing with the drilling mud. The concrete is then allowed to cure and harden (Step 5).
During this construction process, two important phenomena occur that significantly affect pile performance, as shown in Step 5. First, the interaction between drilling mud and the borehole wall leads to the formation of mud skin around the pile shaft. Second, despite cleaning efforts in Step 2, sediment consisting of settled drill cuttings and mud residues may remain at the pile bottom.
After the concrete achieves sufficient strength, post-grouting (Step 6) can be performed to enhance pile performance if planned. Two types of post-grouting are commonly employed: pile bottom grouting and pile shaft grouting. Pile bottom grouting involves injecting grout through pre-embedded pipes to the pile bottom, where it spreads radially to form a reinforced zone that enhances end bearing capacity and improves the properties of any remaining sediment. Pile shaft grouting is conducted through grouting pipes distributed along the pile shaft, creating reinforced zones around injection points that enhance the interface properties between pile and soil, thereby improving side friction resistance. The combination of end and side grouting can effectively address construction-induced defects and significantly improve overall pile performance.

1.2. Previous Works

Research has documented various effects of mud skin and sediment on pile foundation performance. A study by [3] on specific soil conditions found that mud skin exhibited water content 13–16% higher than in situ soil, with the compression modulus reduced by 6–24%, the internal friction angle decreased by 7–25%, and the cohesion diminished by 14–29%. These altered mechanical properties can result in reduced pile side friction and affect overall bearing performance. Regarding pile bottom sediment, [7] observed in their case studies that bearing capacity decreased rapidly when sediment thickness was below 0.3 m, with the rate of decrease slowing when thickness exceeded 0.6 m. The coupling influence between mud skin and sediment on pile foundation bearing characteristics warrants further investigation to better understand their combined effects on pile performance.
Studies have shown varying degrees of improvement in pile performance after post-grouting, depending on specific soil conditions and pile configurations [5,8]. Recent investigations have described how grouting forms a reinforced zone around the injection point, with grout diffusing along the pile’s axial direction [9]. For pile bottom grouting, researchers have observed water-drop-shaped grout diffusion patterns that can affect both the pile bottom bearing area and side friction [4]. The effectiveness of post-grouting has been found to vary with different soil properties and grouting parameters. Studies suggest that soil properties significantly influence grouting effectiveness, with factors such as soil type, density, and strength parameters playing crucial roles [9]. Additionally, pile geometric parameters including length and diameter have been shown to affect the improvement achieved through post-grouting [9].

1.3. Objectives of Present Study

Previous research has extensively explored the effects of construction-induced factors and post-grouting on the performance of mud-protected bored piles. However, several key gaps remain in the literature. For instance, while studies such as those by [1,2] have examined the individual effects of mud skin and sediment on pile performance, they have not provided a comprehensive analysis of the combined effects of these factors, especially for super-long piles. This gap limits the understanding of how these factors interact and collectively influence pile behavior. Additionally, research by [5,6] has demonstrated the effectiveness of post-grouting but has not conducted a detailed parametric analysis of the dimensions and elastic modulus of the grouting reinforced zones. This lack of detailed analysis leaves uncertainties in optimizing post-grouting applications for different geological conditions.
To address these gaps, this study aims to provide a numerical investigation of the effects of construction-induced factors and post-grouting on the performance of super-long bored piles. Specifically, this research will conduct a systematic numerical analysis of the combined effects of mud skin, sediment, and post-grouting on the bearing capacity, settlement characteristics, and load transfer mechanisms of super-long bored piles. This study is expected to provide more understanding about the interactive effects of these factors on pile performance. Additionally, a detailed parametric study will be performed to investigate the influence of grouting parameters, including the dimensions and elastic modulus of the grouting reinforced zones. Such analysis will provide quantitative guidance for optimizing post-grouting applications in various geological conditions. It is noted that the numerical model was first validated against field test measurements and published numerical results before being applied to analyze load transfer mechanisms and effectiveness of post-grouting.
The paper is structured as follows: Section 2 presents the site conditions of the reference project considered in this study. Section 3 details the development and validation of the numerical model. Section 4 analyzes the influence of mud skin, sediment, and post-grouting on pile performance. Section 5 investigates the effects of post-grouting parameters. Section 6 summarizes the findings and their implications for foundation engineering practice.

2. Presentation of the Site Condition

The studied site is located in Eastern China, where a test pile was constructed for a bridge foundation project. The test pile, which serves as the reference case for this study, has a length of 60 m and a diameter of 1.8 m. A comprehensive geological investigation of the area was conducted through on-site geological mapping, in situ testing, drilling, and laboratory soil tests, along with an analysis of regional geological data. For subsequent numerical simulations, the actual geological stratification was simplified into three soil layers: from top to bottom, soft plastic to plastic silty clay, medium dense silt, and hard plastic silty clay (bearing layer). Table 1 presents the mechanical parameters of the simplified three soil layers determined from the measurements.
Two field static load tests were conducted on the same test pile using the static load test by the self-balancing method: one before post-grouting (non-grouting condition) and another after post-grouting treatment on the identical pile. The results were converted to equivalent conventional static load test curves according to [10].
The post-grouting treatment on this test pile included both pile bottom and pile shaft grouting. Quality cement meeting the requirements for post-grouting applications was utilized as the grouting material [11]. The water-cement ratio was determined based on soil conditions: 0.5–0.6 for saturated soils and 0.7–0.9 for unsaturated soils. The grout was thoroughly mixed for at least 2 min and filtered twice through a 16-mesh screen to ensure good fluidity without segregation or precipitation.
A distributed post-grouting system was employed, featuring multiple injection points densely arranged along the pile shaft. For pile shaft grouting, four grouting pipes were symmetrically installed around the pile circumference at equal spacing, with injection points at 6 m intervals along the pile shaft, each equipped with specially designed grouting heads. This distributed approach enabled small-spacing, high-density, multi-depth, and targeted grouting, providing a more controlled effect and uniform grout distribution. For pile bottom grouting, additional grouting pipes were embedded in the pile bottom to enhance the end bearing capacity.

3. Numerical Model and Validation

Based on the test pile described in Section 2, a numerical model was developed to investigate the influence of construction-induced effects and post-grouting on pile performance. The model validation was conducted through two approaches: comparison with the field measurements from the test pile and comparison with the numerical results of a published paper. This section first presents the development of the numerical model, including the model geometry, material properties, and boundary conditions. The model validation process using both field data and published results is then detailed.

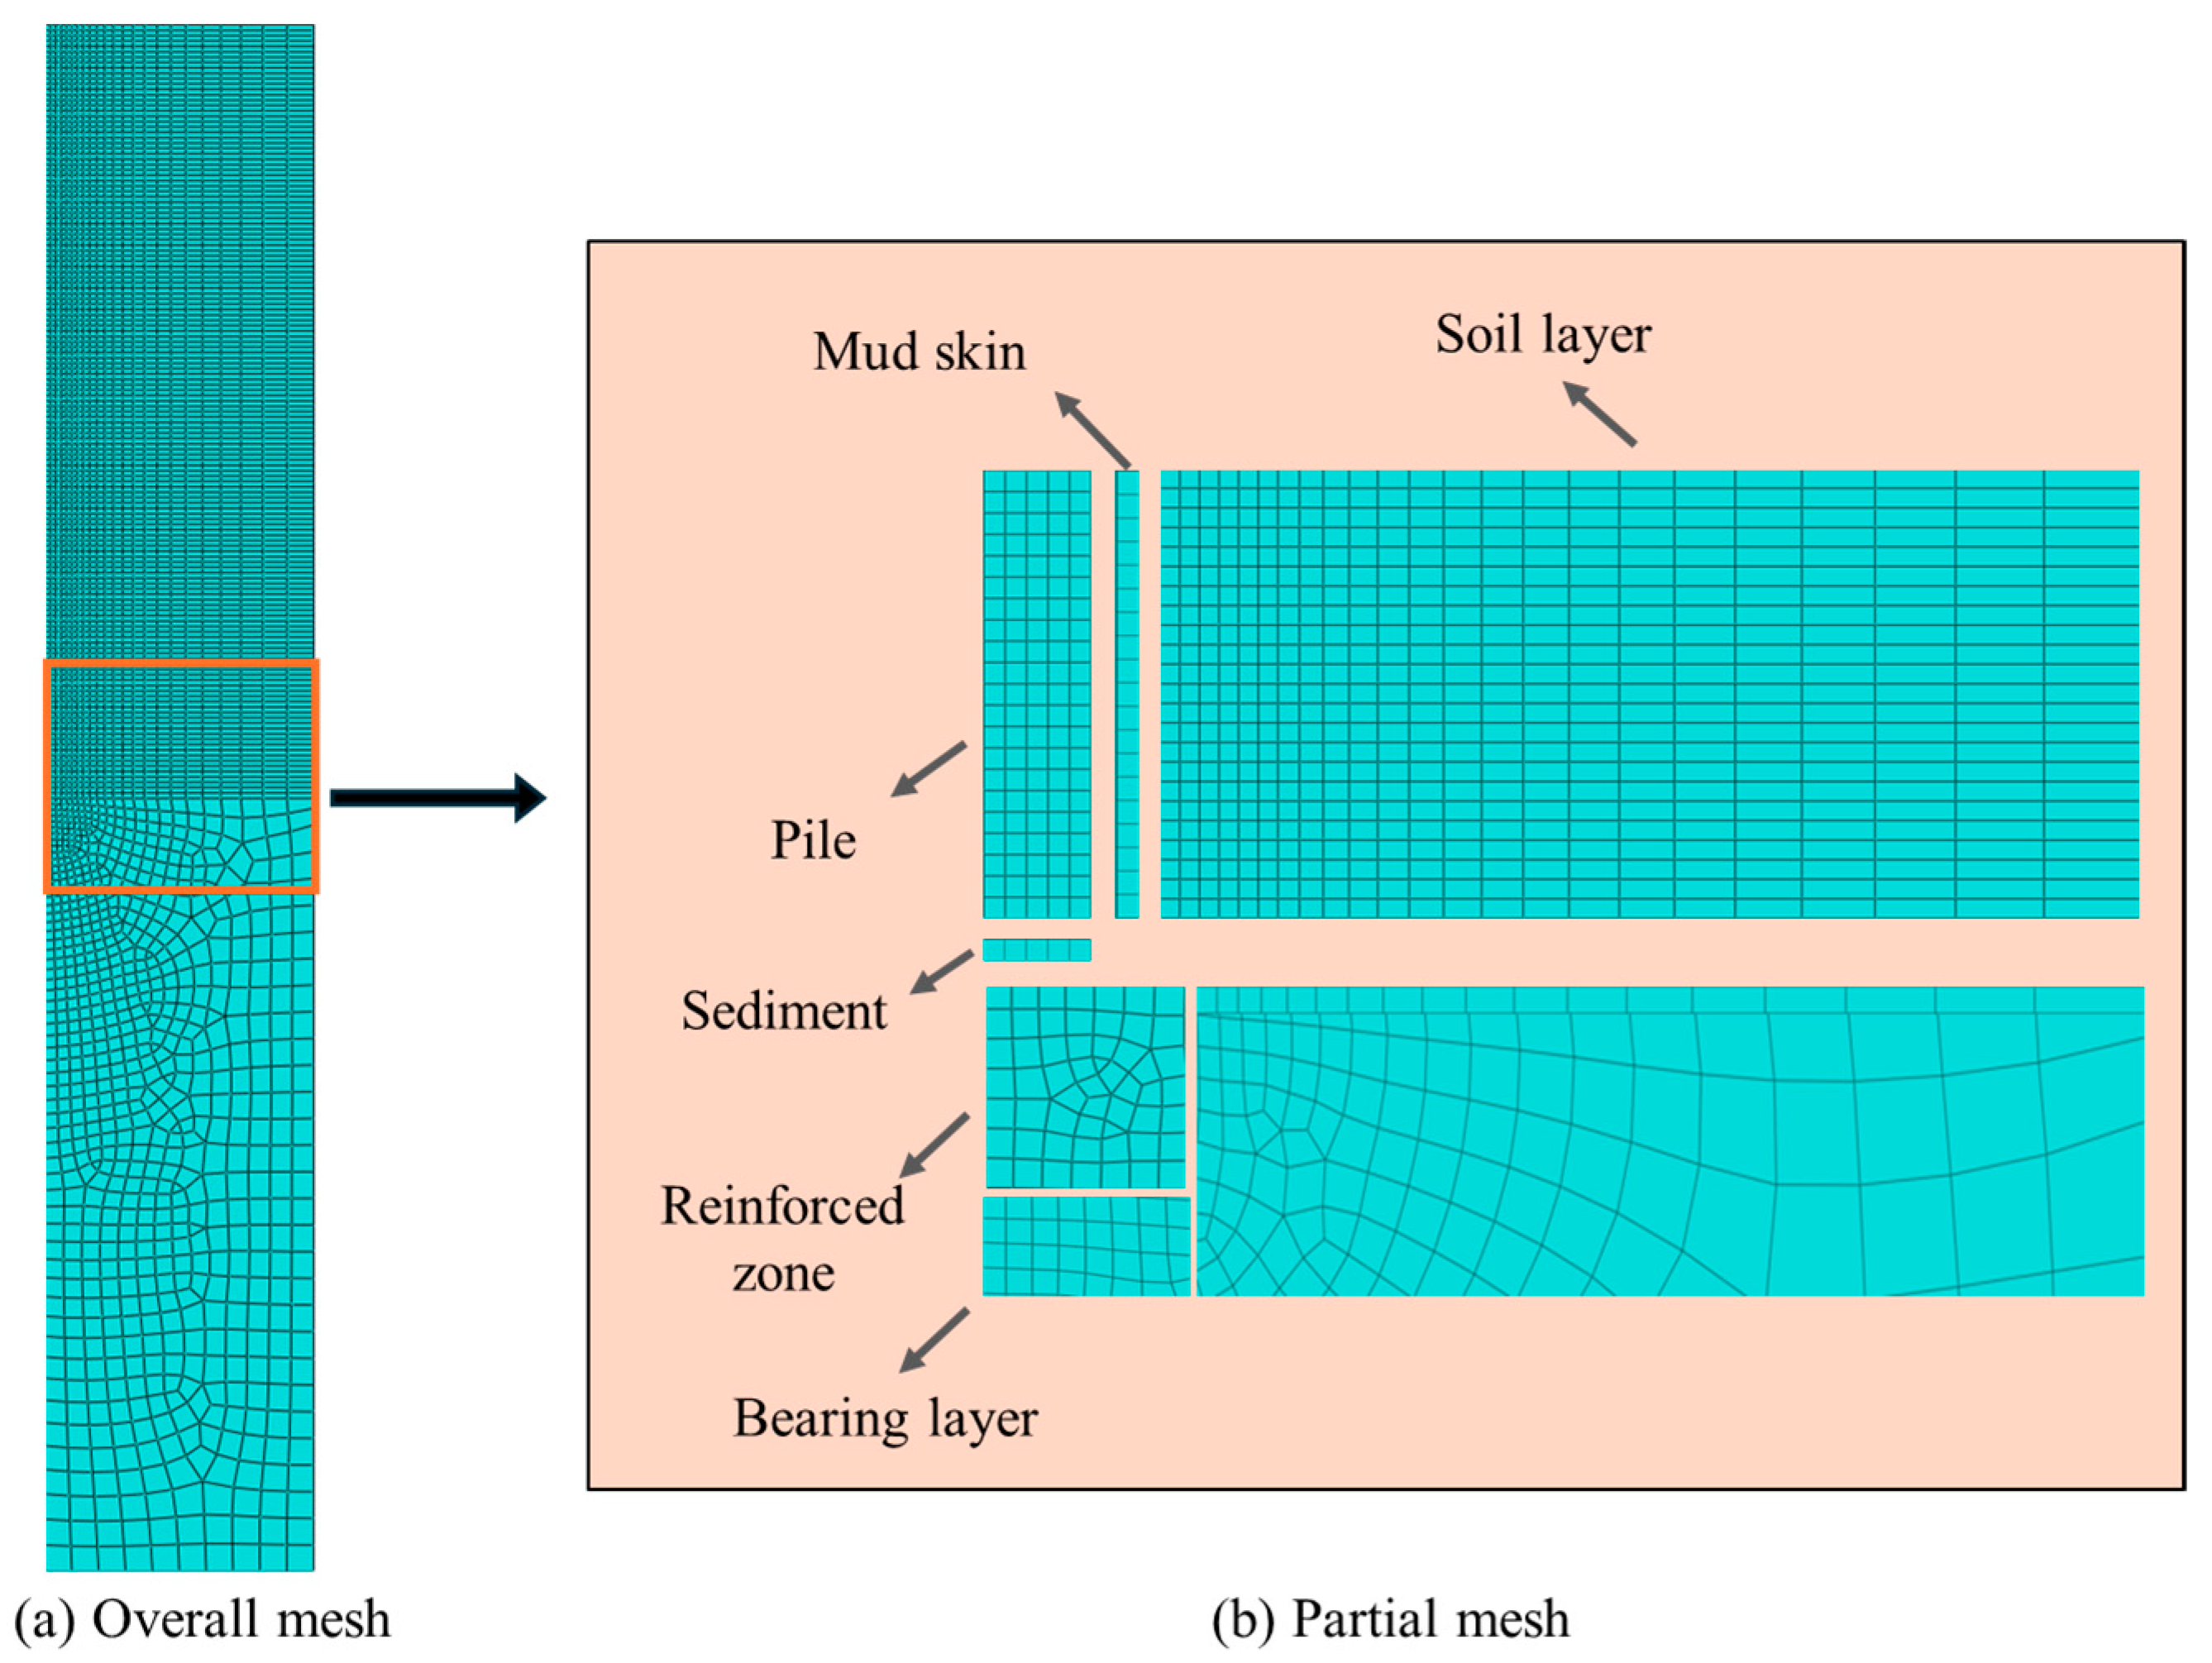
3.1. Numerical Model Configuration

This section presents the development of the finite element model using Abaqus, focusing on the model geometry, mesh configuration, material properties, and boundary conditions. Abaqus was selected due to its common application in geotechnical engineering and its proven capability for simulating soil–structure interactions.

3.1.1. Creation of a Numerical Model

The numerical simulation in this article adopts a 2D axisymmetric model, given the circular cross-section of the pile and the vertical loading conditions. To avoid boundary effects, the overall dimensions of the finite element model were set to 15 m in width and 120 m in height. The mesh was locally refined at the pile–soil interface using elements of different sizes to balance computational efficiency and accuracy. The mesh configuration of the model is shown in Figure 2. The entire model employed four-node bilinear axisymmetric quadrilateral elements (CAX4R), with a total of 11,108 soil elements and 2400 pile elements.
For the boundary conditions in this axisymmetric model, the bottom boundary was fully fixed in both horizontal and vertical directions. The lateral boundaries were constrained only in the horizontal direction, allowing free movement in the vertical direction. The top boundary (ground surface) was left unconstrained in all directions. The axis of symmetry (left boundary of the model) was set with axisymmetric boundary conditions, permitting movement only in the vertical direction. These boundary conditions appropriately simulate the actual constraint state of the soil body while avoiding boundary effects on the analysis results.
For the simulation of mud skin, a layer with a thickness of 0.25 m was established around the pile shaft based on the findings from previous studies [12,13]. As for sediment, following the construction specifications [14], which specify that the sediment thickness should not exceed 0.2 m for friction piles, a layer with the same diameter as the pile and a height of 0.2 m was created at the pile bottom. The post-grouting reinforced zone at the pile bottom is simplified as a cylindrical shape with dimensions of 2 m in height and 1 m in radius [11].
The parameter values for each component of the model are shown in Table 2. Based on literature review and indoor tests [7,15,16,17,18], the following factors were considered when determining the parameters of mud skin, sediment, and post-grouting effects:
(1) The mechanical parameters of mud skin are closely related to the corresponding soil layer, as it forms from the mixing of mud and surrounding hole wall. Compared to the corresponding soil layer parameters, reduction factors of 0.8, 0.9, 0.8, and 0.9 were applied to the elastic modulus, cohesion, internal friction angle, and unit weight, respectively [12,17,18];
(2) Sediments primarily consist of mud sediment and drilling debris, exhibiting characteristics of loose soil with weak correlation to surrounding soil properties. Typical values of 3 MPa for the elastic modulus, 5 kPa for the cohesion, and 3° for the internal friction angle were adopted, along with a unit weight of 13 kN/m3 [7,11,17]. These values reflect the significantly reduced mechanical properties characteristic of sediment layers formed at the pile bottom.
(3) The enhancement of soil properties by grouting is primarily manifested in the elastic modulus, thus a relatively high value of 200 MPa is adopted [13,19]. As for other parameters, the cohesion, unit weight, and internal friction angle are assumed to be 1.5 times those of the corresponding soil layers [15,18,19].
(4) For the size of post-grouting reinforced zones: the dimensions at the pile bottom are listed in Table 2; at the pile side, the reinforced zone occupies the same space as the mud skin layer (0.25 m thickness), where the properties of the mud skin are replaced with those of the post-grouting reinforced material [6,20].
For super-long piles, side friction contributes significantly to the overall bearing capacity. This effect is modeled using the Coulomb friction method in this study, which is a widely used approach and allows accounting for the cohesion along the pile depth. The related formula is as follows:
τ = μ p + C s = p ( μ + C s / p )
where τ is the interface friction, C s is the cohesion of the corresponding soil layer, μ is the soil-pile friction coefficient, and p is the contact pressure between the pile and the soil. μ can be calculated as t a n ( δ ) , where δ is the soil-pile friction angle with δ = a φ s . Through laboratory experiments and theoretical derivation, [21] suggested that a varies between 0.6 and 0.7. This formulation captures both the frictional and cohesive components of side resistance, which is particularly important for the studied super-long pile.

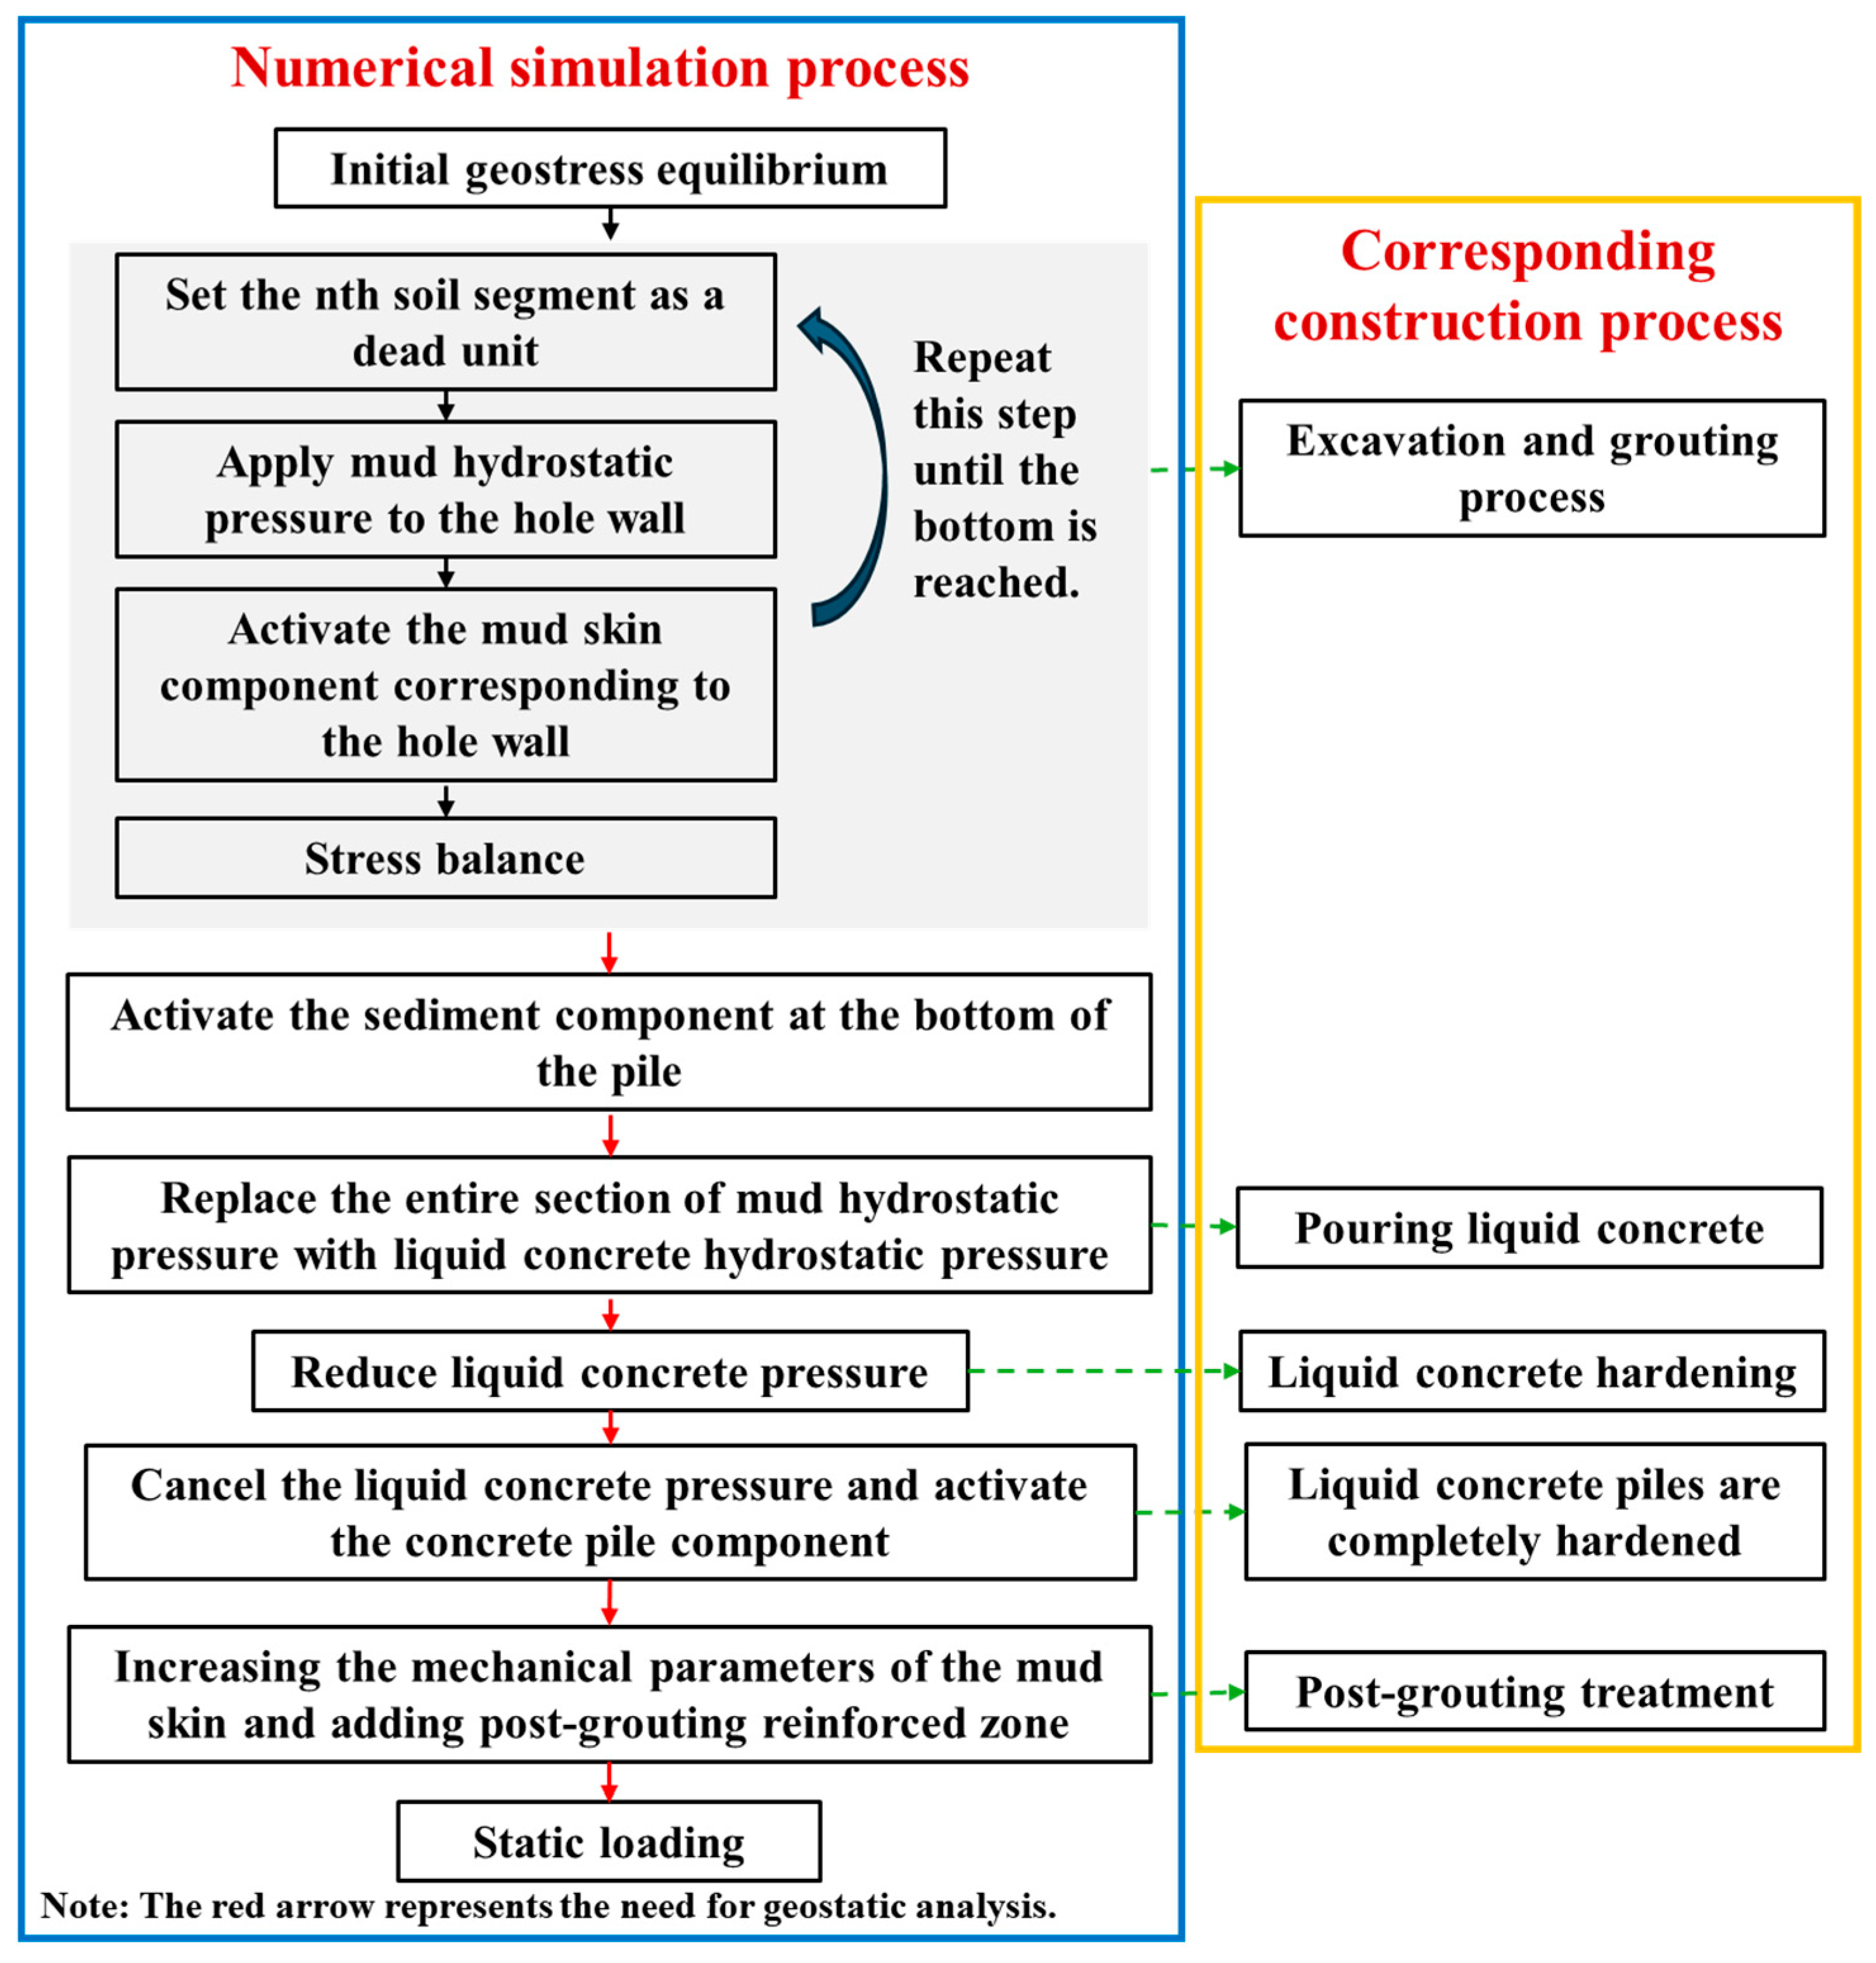
3.1.2. Numerical Simulation Process

Based on the model established above, a bearing capacity and settlement analysis of the bored pile is conducted, taking into account the effects of the construction process. The specific simulation process is introduced as follows, with Figure 3 illustrating the relationship between the simulation and the actual construction process.
(1)
Initial geostatic analysis: Calculate the inherent stress distribution in the soil.
(2)
Simulation of borehole excavation and mud protection: The soil elements to be excavated are progressively deactivated from top to bottom, and hydrostatic pressure is applied perpendicularly to the borehole wall to simulate the mud’s force on the wall. Due to the interaction between drilling mud and borehole wall, a mud skin forms around the pile, which is simulated by reducing the mechanical parameters of the mud skin elements. After each excavation step, a geostatic analysis is performed to determine the balanced stress distribution in soil and ensure that the system reaches equilibrium. After the excavation is completed, a sediment element is set at the pile bottom to simulate the accumulation of drilling debris and mud deposits.
(3)
Simulation of concrete pouring: The mud pressure on the borehole wall along the entire pile length is replaced with the pressure of liquid concrete. A sediment element is set at the pile bottom with significantly reduced mechanical parameters to simulate the effects of drilling debris and mud deposits. The expression is as follows [22]:
σ = γ c l z                                                                                     z < 1 / 3   L P γ c l z + γ m ( 2 z / 3 )                                         z 1 / 3   L P
  • where γ c l is the unit weight of liquid concrete, γ m is the unit weight of mud, and z represents the pile depth. In this study, γ c l is set as 24 kN/m3, γ m is set as 10.1 kN/m3, and L p represents the length of the pile.
(4)
Simulation of liquid concrete hardening: The pressure of the liquid concrete is reduced to simulate water loss and shrinkage during the hardening process, which leads to a decrease in pressure on the borehole wall (assuming the pressure value is k 0 γ z , where k 0 is the coefficient of earth pressure at rest, γ is the unit weight of concrete after water loss, and z is the depth).
(5)
Simulation of completed concrete hardening: The pressure of the liquid concrete is removed, and the concrete pile elements are activated.
(6)
Post-grouting treatment: For the pile shaft, the improvement effect of grouting is simulated by increasing the mechanical parameters of the mud skin elements; at the pile bottom, the sediment element at the pile bottom is replaced with a cylindrical post-grouting reinforced zone with a height of 2 m and a diameter of 2 m, whose mechanical parameters are significantly improved.
(7)
Application of vertical loads: Vertical static loads are applied on top of the pile to calculate the corresponding settlement and derive bearing capacity.

3.2. Validation of the Numerical Simulation Procedure

This section verifies the finite element modeling described above through comparisons with both field test data and previously published numerical studies. For all bearing capacity evaluations in this study, the following criteria are adopted: for piles longer than 40 m, the elastic compression of the pile body is considered [14]; for piles with a diameter greater than 800 mm, the load corresponding to s = 0.05 D p ( s is the settlement at the pile top) is taken as the bearing capacity; for load-settlement curves showing steep variation, the starting point of the obvious steep change is taken as the bearing capacity value [23].
The validation process consists of two parts: first, comparison against field measurements from the test pile under both non-grouting and post-grouting conditions, and second, verification through published numerical results from a relevant pile study.

3.2.1. Comparison Against a Field Test Pile

The reliability of the numerical model is first validated through comparisons with the field test data of both non-grouting and post-grouting bored piles. Figure 4 presents the comparison of load-settlement (Q-s) curves between the numerical simulation of the present study and the pile test.
For the non-grouting case (Figure 4a), both curves demonstrate steep initial slopes and reach their bearing capacity at approximately 15 mm settlement. The numerical model predicted bearing capacity is 16 MN, compared to 17.5 MN measured in the field test, resulting in a difference of 8%.
For the post-grouting case (Figure 4b), the numerical simulation reached its bearing capacity of 29 MN at approximately 20 mm settlement, while the field test recorded a bearing capacity of 29 MN at 30 mm settlement. Despite the difference in settlement values, the overall load-settlement behavior shows good agreement.
For the post-grouting case (Figure 4b), the numerical simulation reached its bearing capacity of 29 MN at approximately 20 mm settlement, while the field test recorded a bearing capacity of 29 MN at 30 mm settlement. Both curves were evaluated using the same criterion identifying the point where the load-settlement curve shows a significant change in slope.

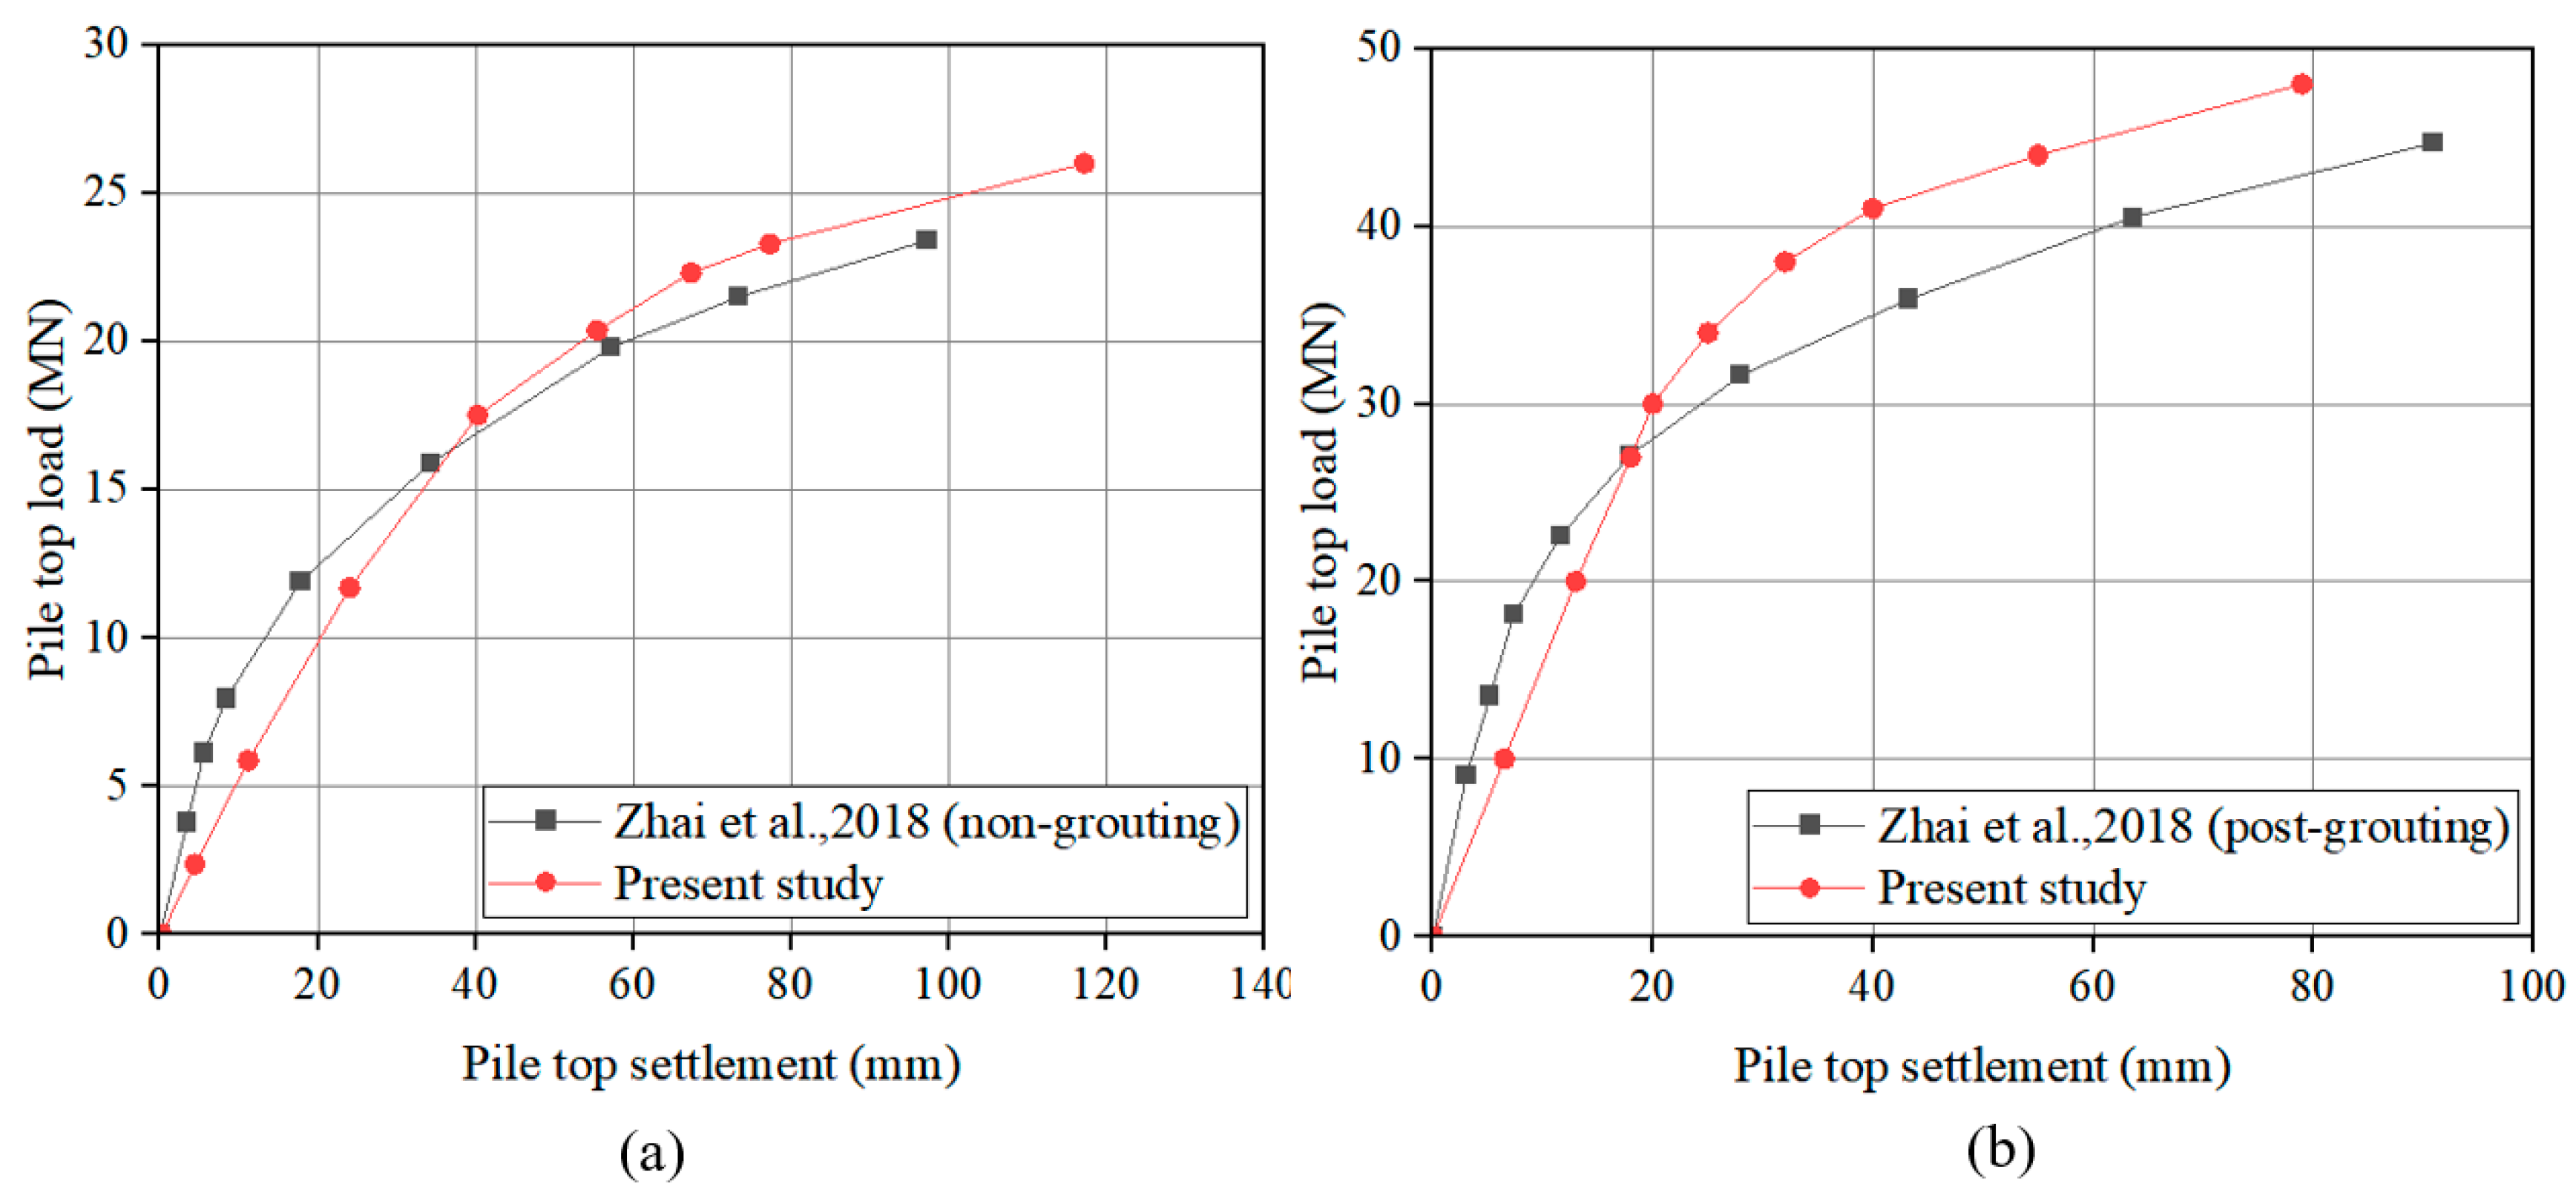
3.2.2. Comparison Against Published Numerical Results

The reliability of the numerical model is further verified by reproducing the pile cases reported in [8] and comparing the obtained results. Figure 5 presents these comparisons.
For the non-grouting case, a pile with 85 m in length and 1 m in diameter was modeled following the pile configurations presented by [8], including the effects of mud skin and sediment. The numerical analysis of the present study estimated a bearing capacity of 20 MN, compared to 18 MN reported in their study, resulting in a difference of 2 MN (Figure 5a).
For the post-grouting case, another numerical model was created based on the pile configuration described by [8] with both bottom and side grouting (85 m in length and 1 m in diameter). Under identical geometric and material parameters, the present analysis estimated a bearing capacity of 30 MN, while their study reported 28 MN, also showing a slight difference of 2 MN (Figure 5b).
In summary, both comparisons against field measurements (Section 3.2.1) and published numerical results demonstrate good agreement, with differences in bearing capacity generally within 10%. These validations confirm that the current numerical model can reliably simulate the behavior of bored piles under both non-grouting and post-grouting conditions with the effects of mud skin and sediment under consideration.

4. Effects of Construction-Induced Factors and Post-Grouting on Pile Performance

Through numerical simulation, this section systematically investigates the mechanical behavior of bored piles under different working conditions. The analysis first focuses on quantifying how mud skin and sediment, individually and jointly, affect the pile’s bearing capacity and settlement characteristics. The improvement effect of post-grouting is then evaluated by comparing the pile performance between non-grouting and post-grouting conditions. Through analyses of axial displacement, bottom reaction force, and side friction distribution, this section examines the load transfer mechanisms and helps understand how construction-induced factors and post-grouting influence pile behavior.

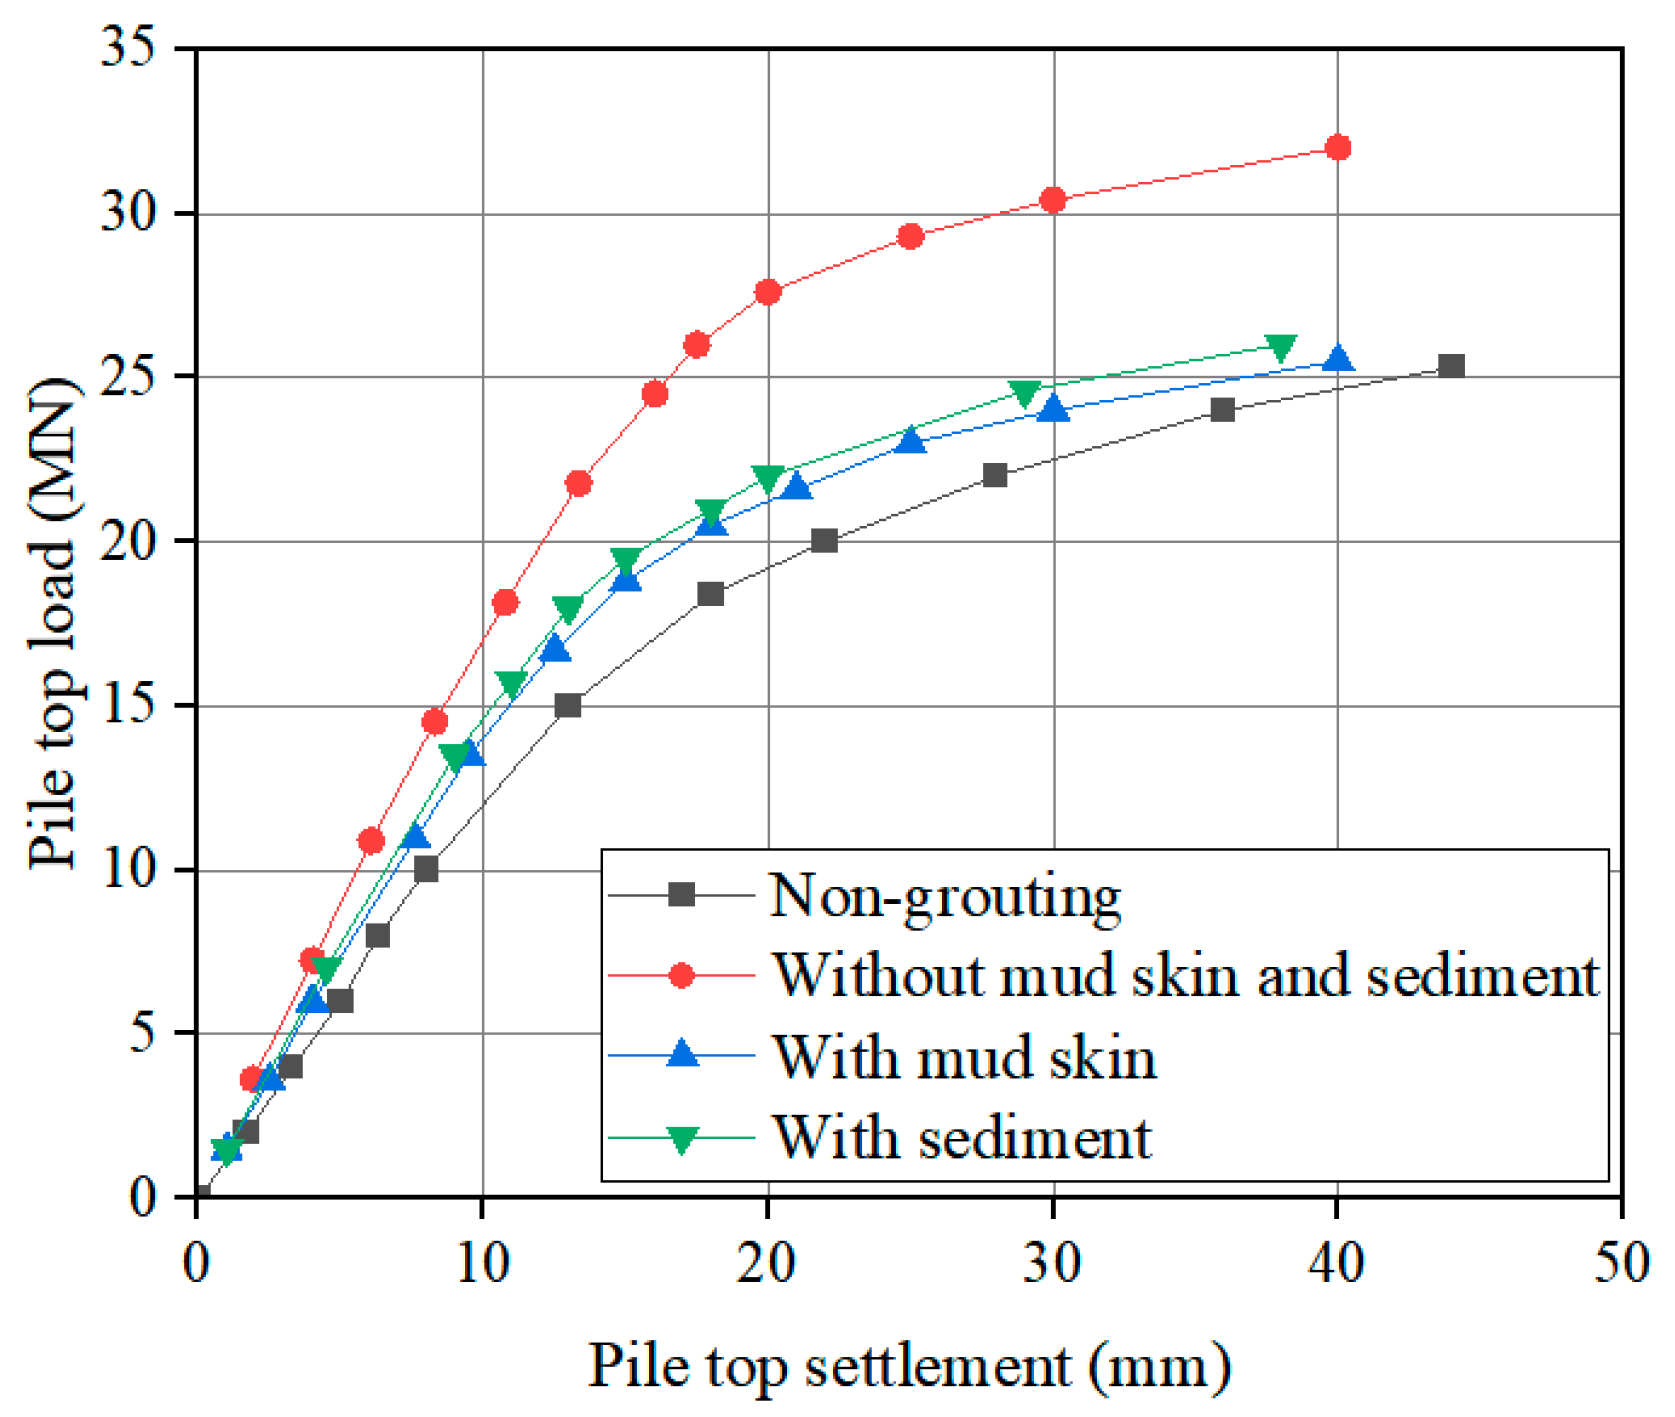
4.1. Effects of Mud Skin and Sediment on Pile Performance

To investigate the effects of mud skin and sediment on the bearing characteristics of bored piles, this section analyzes the Q-s curves under different working conditions. Four scenarios are studied: ideal condition (without mud skin and sediment), only with mud skin, only with sediment, and with both mud skin and sediment (non-grouting).
As shown in Figure 6, the Q-s curves demonstrate that the presence of mud skin and sediment significantly reduces the pile bearing capacity compared to the ideal condition. All four scenarios reach their bearing capacity at settlements of approximately 15 mm, allowing for direct comparison of their bearing capacities. Under ideal conditions, the bearing capacity reaches 25 MN, with a relatively steep initial slope indicating high initial pile stiffness. When only mud skin is considered, the bearing capacity decreases to 18 MN, a reduction of approximately 28% compared to the ideal condition, mainly due to the reduction in pile side friction. When only sediment is considered, the bearing capacity decreases to 19 MN, a reduction of approximately 24% compared to the ideal condition, primarily due to the reduction in end bearing capacity. When both mud skin and sediment are present (non-grouting), the bearing capacity further reduces to 16 MN, a decrease of approximately 36% compared to the ideal condition, demonstrating that these two construction-induced effects lead to a more significant reduction in bearing capacity when combined, but their impact is not merely additive. A summary of the bearing capacity and corresponding settlement under different test scenarios is presented in Table 3.
From the changes in initial curve slopes, it can be observed that the presence of mud skin and sediment reduces the initial curve slope, indicating a decrease in the initial stiffness of the pile-soil system due to these two construction-induced factors.

4.1.1. Effect of Mud Skin and Sediment on Load Transfer Mechanisms

To further investigate the influence mechanisms of mud skin and sediment on load transfer behavior, additional analyses of bottom reaction force, axial displacement, and pile friction were conducted for three cases: non-grouting (with both mud skin and sediment), with mud skin only, and with sediment only, as shown in Figure 7a–c. For each case, loads equal to their respective bearing capacities (16 MN for non-grouting, 18 MN for mud skin only, and 19 MN for sediment only) were applied to ensure fair comparison of load transfer mechanisms at equivalent performance states.
As illustrated in Figure 7a, the model with mud skin only exhibits the highest bottom reaction force. This phenomenon can be attributed to the reduced side friction caused by the presence of mud skin, which leads to a higher proportion of load being transferred to the pile bottom. The end bearing contribution increases to compensate for the decreased side friction resistance.
Figure 7b shows that the axial displacement distributions along the pile depth are relatively similar across all three cases, suggesting that while mud skin and sediment affect the magnitude of bearing capacity, they do not significantly alter the overall deformation pattern of the pile body under loading.
The distribution of side friction along the pile shaft is presented in Figure 7c. The model with sediment only demonstrates the highest side friction forces. This occurs because, in the absence of mud skin, the pile–soil interface maintains its original high friction properties, while the presence of sediment at the pile bottom reduces end bearing capacity, resulting in a higher proportion of load being carried by side friction.
These findings further confirm that mud skin and sediment not only affect the bearing capacity but also significantly alter the load transfer mechanisms between the pile shaft and the pile bottom, highlighting the importance of considering these construction-induced effects in pile design and performance evaluation.

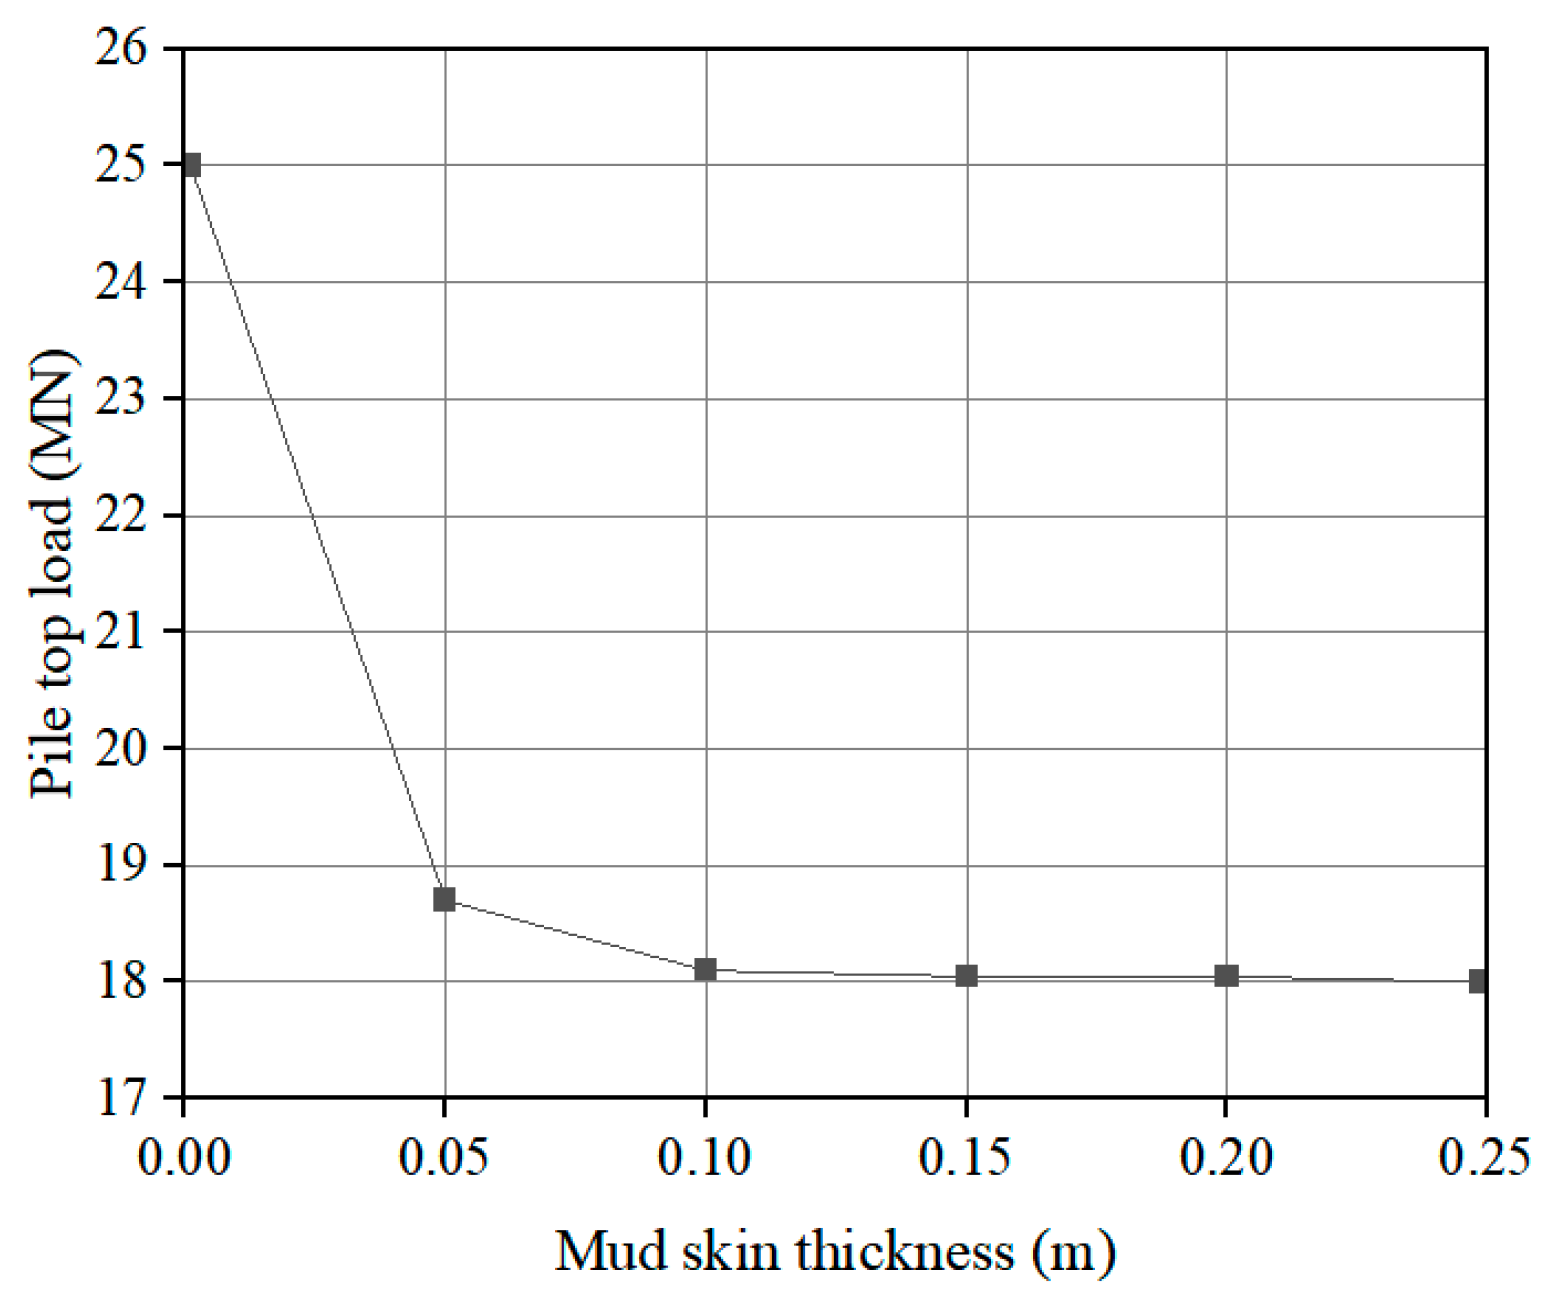
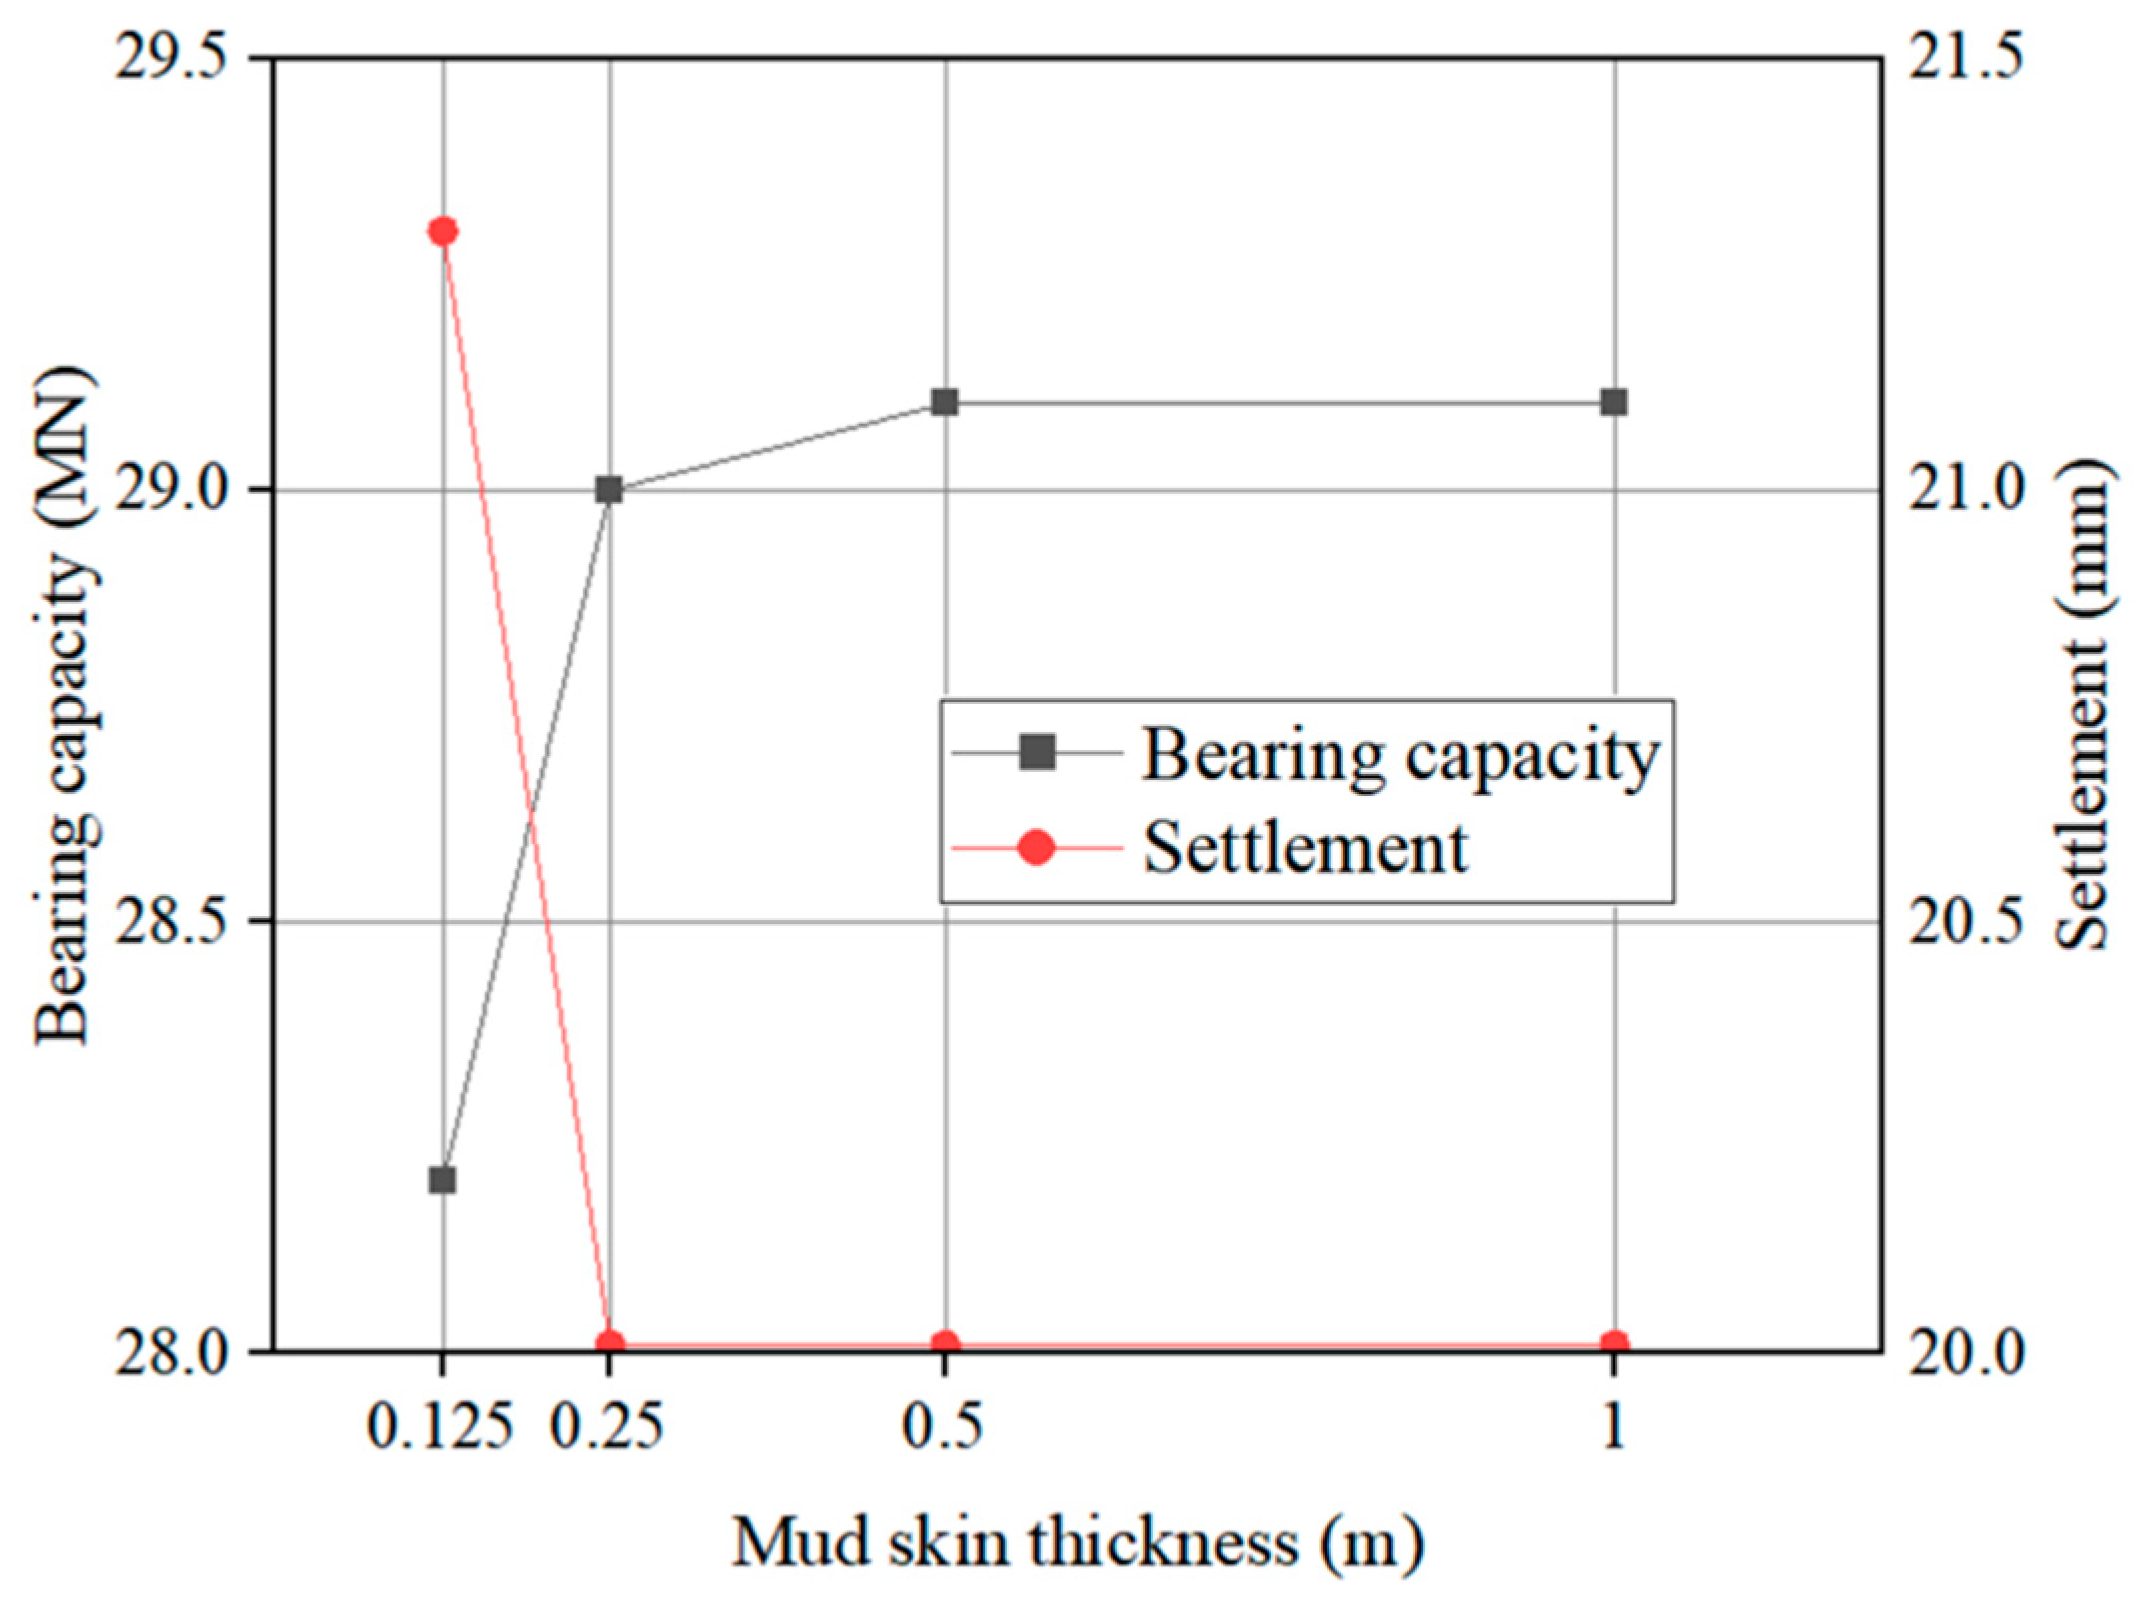
4.1.2. Parametric Analysis of Mud Skin Thickness

To further investigate the sensitivity of pile performance to mud skin thickness, a parametric analysis was conducted with varying mud skin thicknesses while maintaining constant mechanical properties. As shown in Figure 8, mud skin thicknesses of 0.05 m, 0.1 m, 0.15 m, 0.2 m, and 0.25 m were considered in the numerical model.
The results indicate that when mud skin thickness increases from 0.05 m to 0.25 m, the bearing capacity remains relatively stable between 18.7 MN and 18 MN. This suggests that beyond a certain minimal thickness (approximately 0.1 m in this case), further increases in mud skin thickness have limited additional impact on the pile’s bearing capacity. This phenomenon can be attributed to the development of a critical zone of influence around the pile shaft, beyond which additional thickness does not significantly alter the load transfer mechanism.
It is worth noting that this parametric study focused only on mud skin thickness variation without conducting a similar analysis for sediment thickness. This decision was based on practical engineering considerations, as the Chinese Technical Specification for Building Pile Foundations [14] explicitly limits the permissible sediment thickness to no more than 0.2 m for friction piles. Since this regulatory limit is already incorporated into standard construction quality control, variations beyond this threshold were not considered relevant for practical applications.

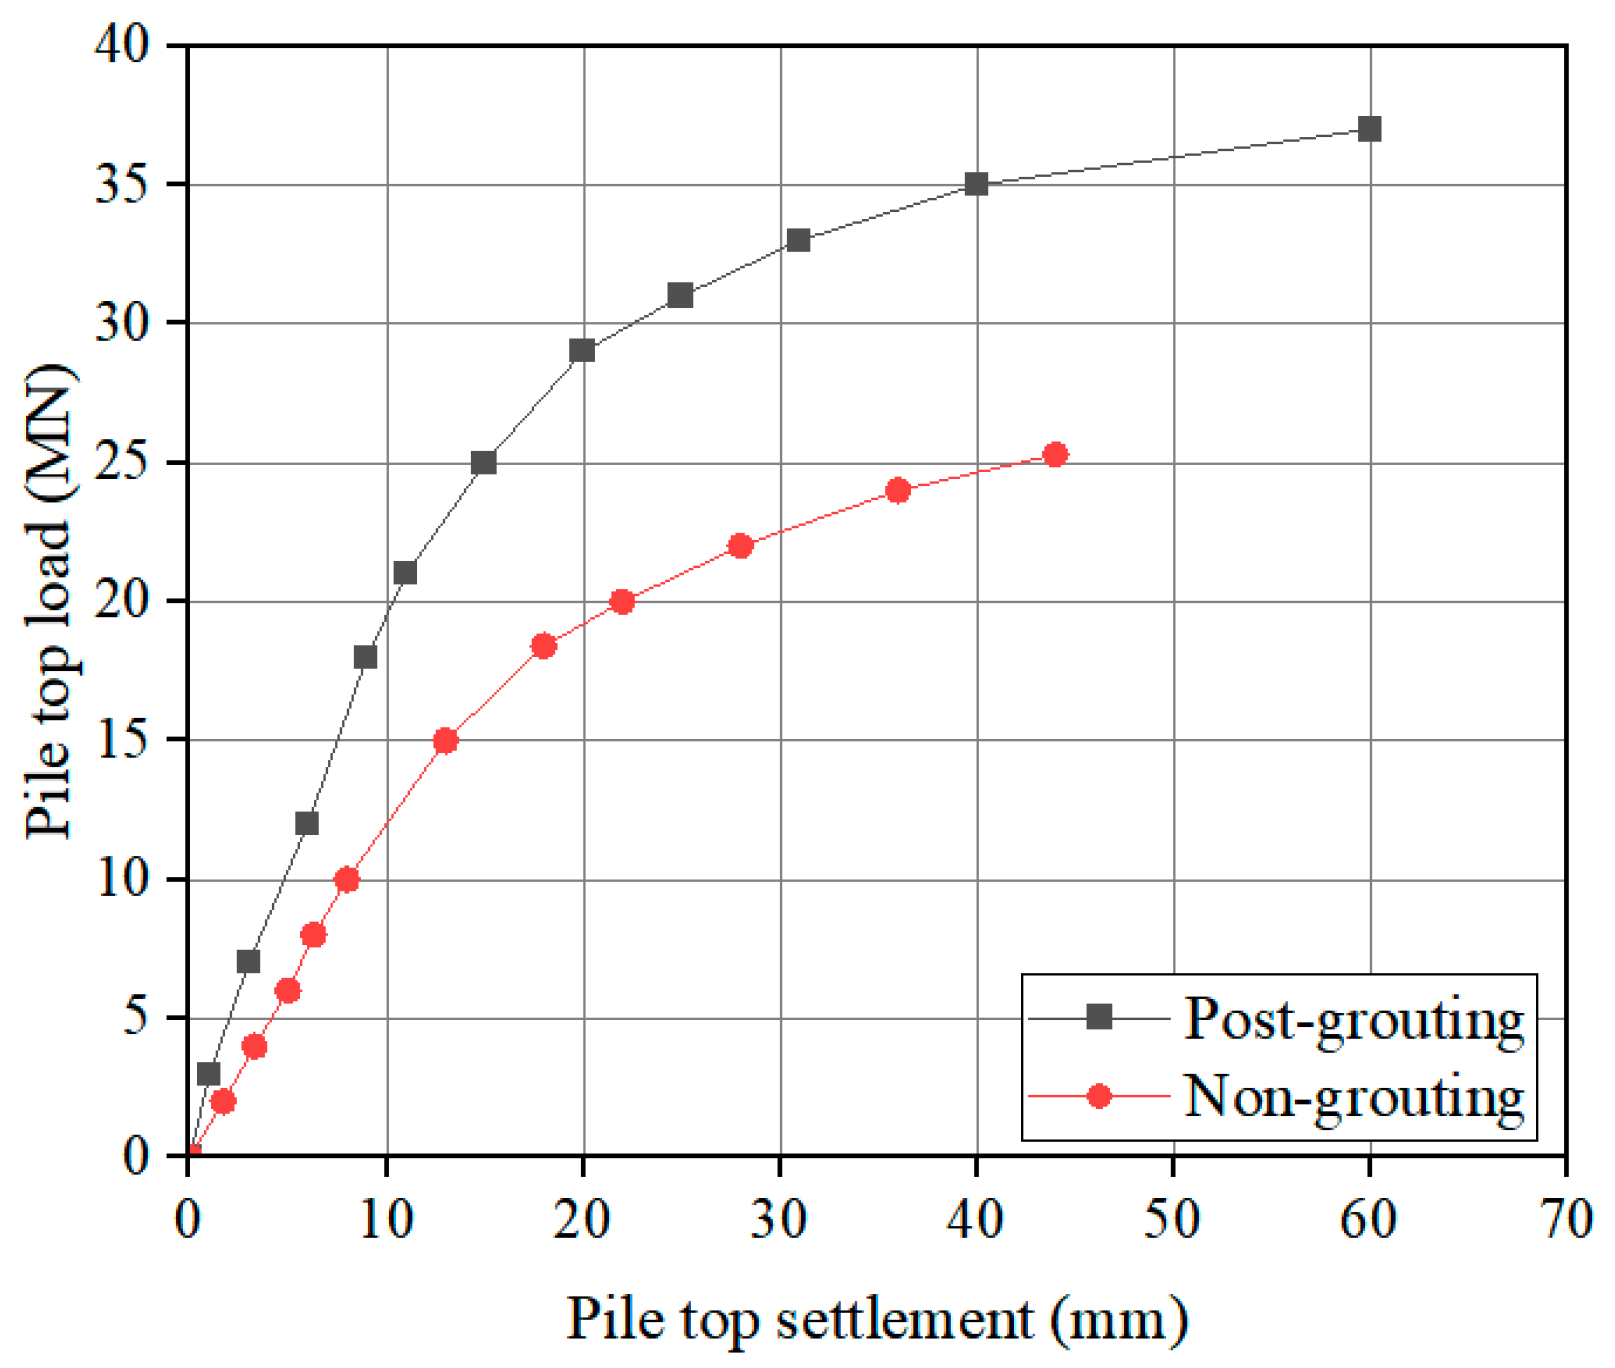
4.2. Effects of Post-Grouting on Pile Performance

This section investigates the effectiveness of post-grouting by comparing pile behavior between post-grouting and non-grouting conditions. The comparison is conducted in terms of four key characteristics: bearing capacity, axial displacement along pile body, bottom reaction force, and shaft friction force. Through analyzing these aspects, this study aims to provide understandings about how post-grouting affects pile performance and load transfer mechanisms.

4.2.1. Analysis of Bearing Capacity

The comparison of bearing capacities between non-grouting and post-grouting conditions is presented in Figure 9. Under non-grouting conditions (with both mud skin and sediment present), the bearing capacity reaches 16 MN with a settlement of 15 mm. After the post-grouting treatment (including both pile bottom and pile shaft grouting), the bearing capacity increases significantly to 29 MN, reached at a settlement of 20 mm. This represents an 81% increase in bearing capacity compared to the non-grouting condition.
The significant improvement in bearing capacity can be attributed to the enhancement of both side friction and end bearing resistance through the combined post-grouting approach. The post-grouting process creates reinforced zones both at the pile bottom and around the shaft injection points, effectively improving the mechanical properties of the surrounding soil and the pile–soil interface characteristics.

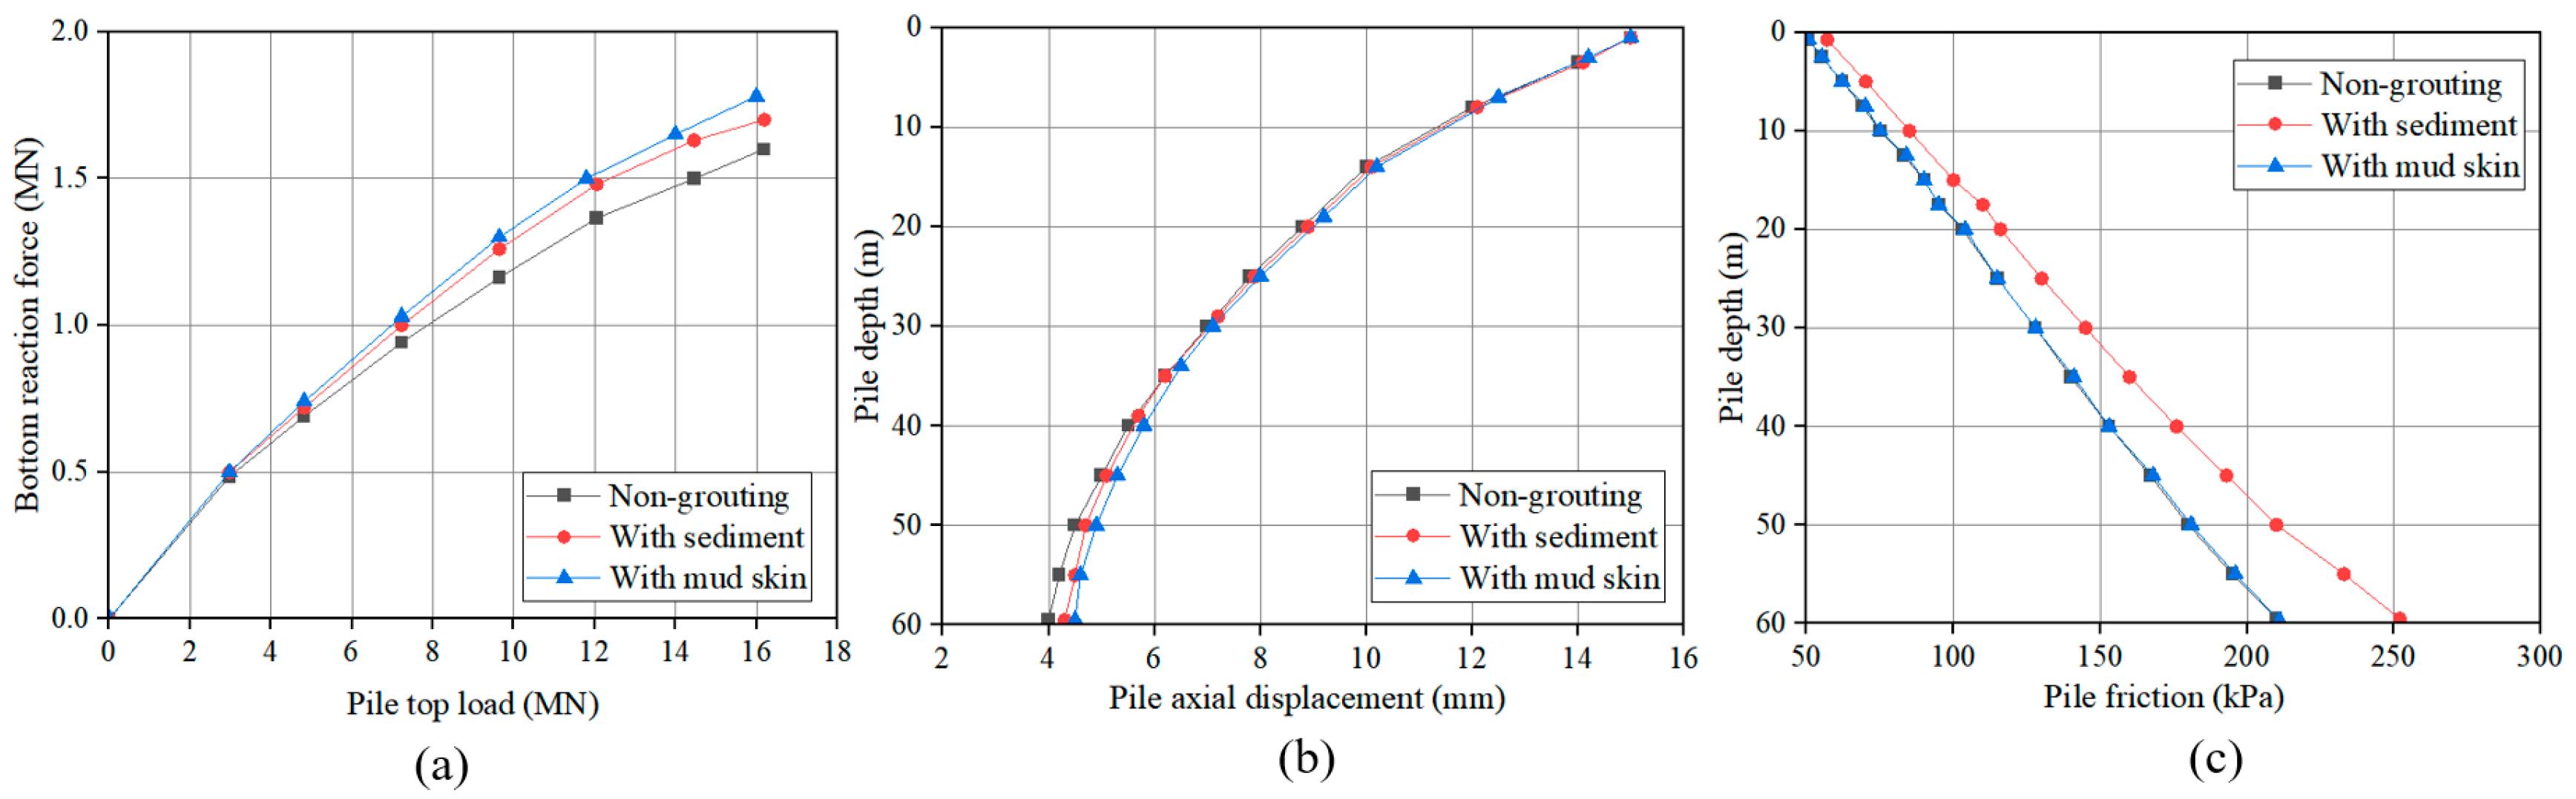
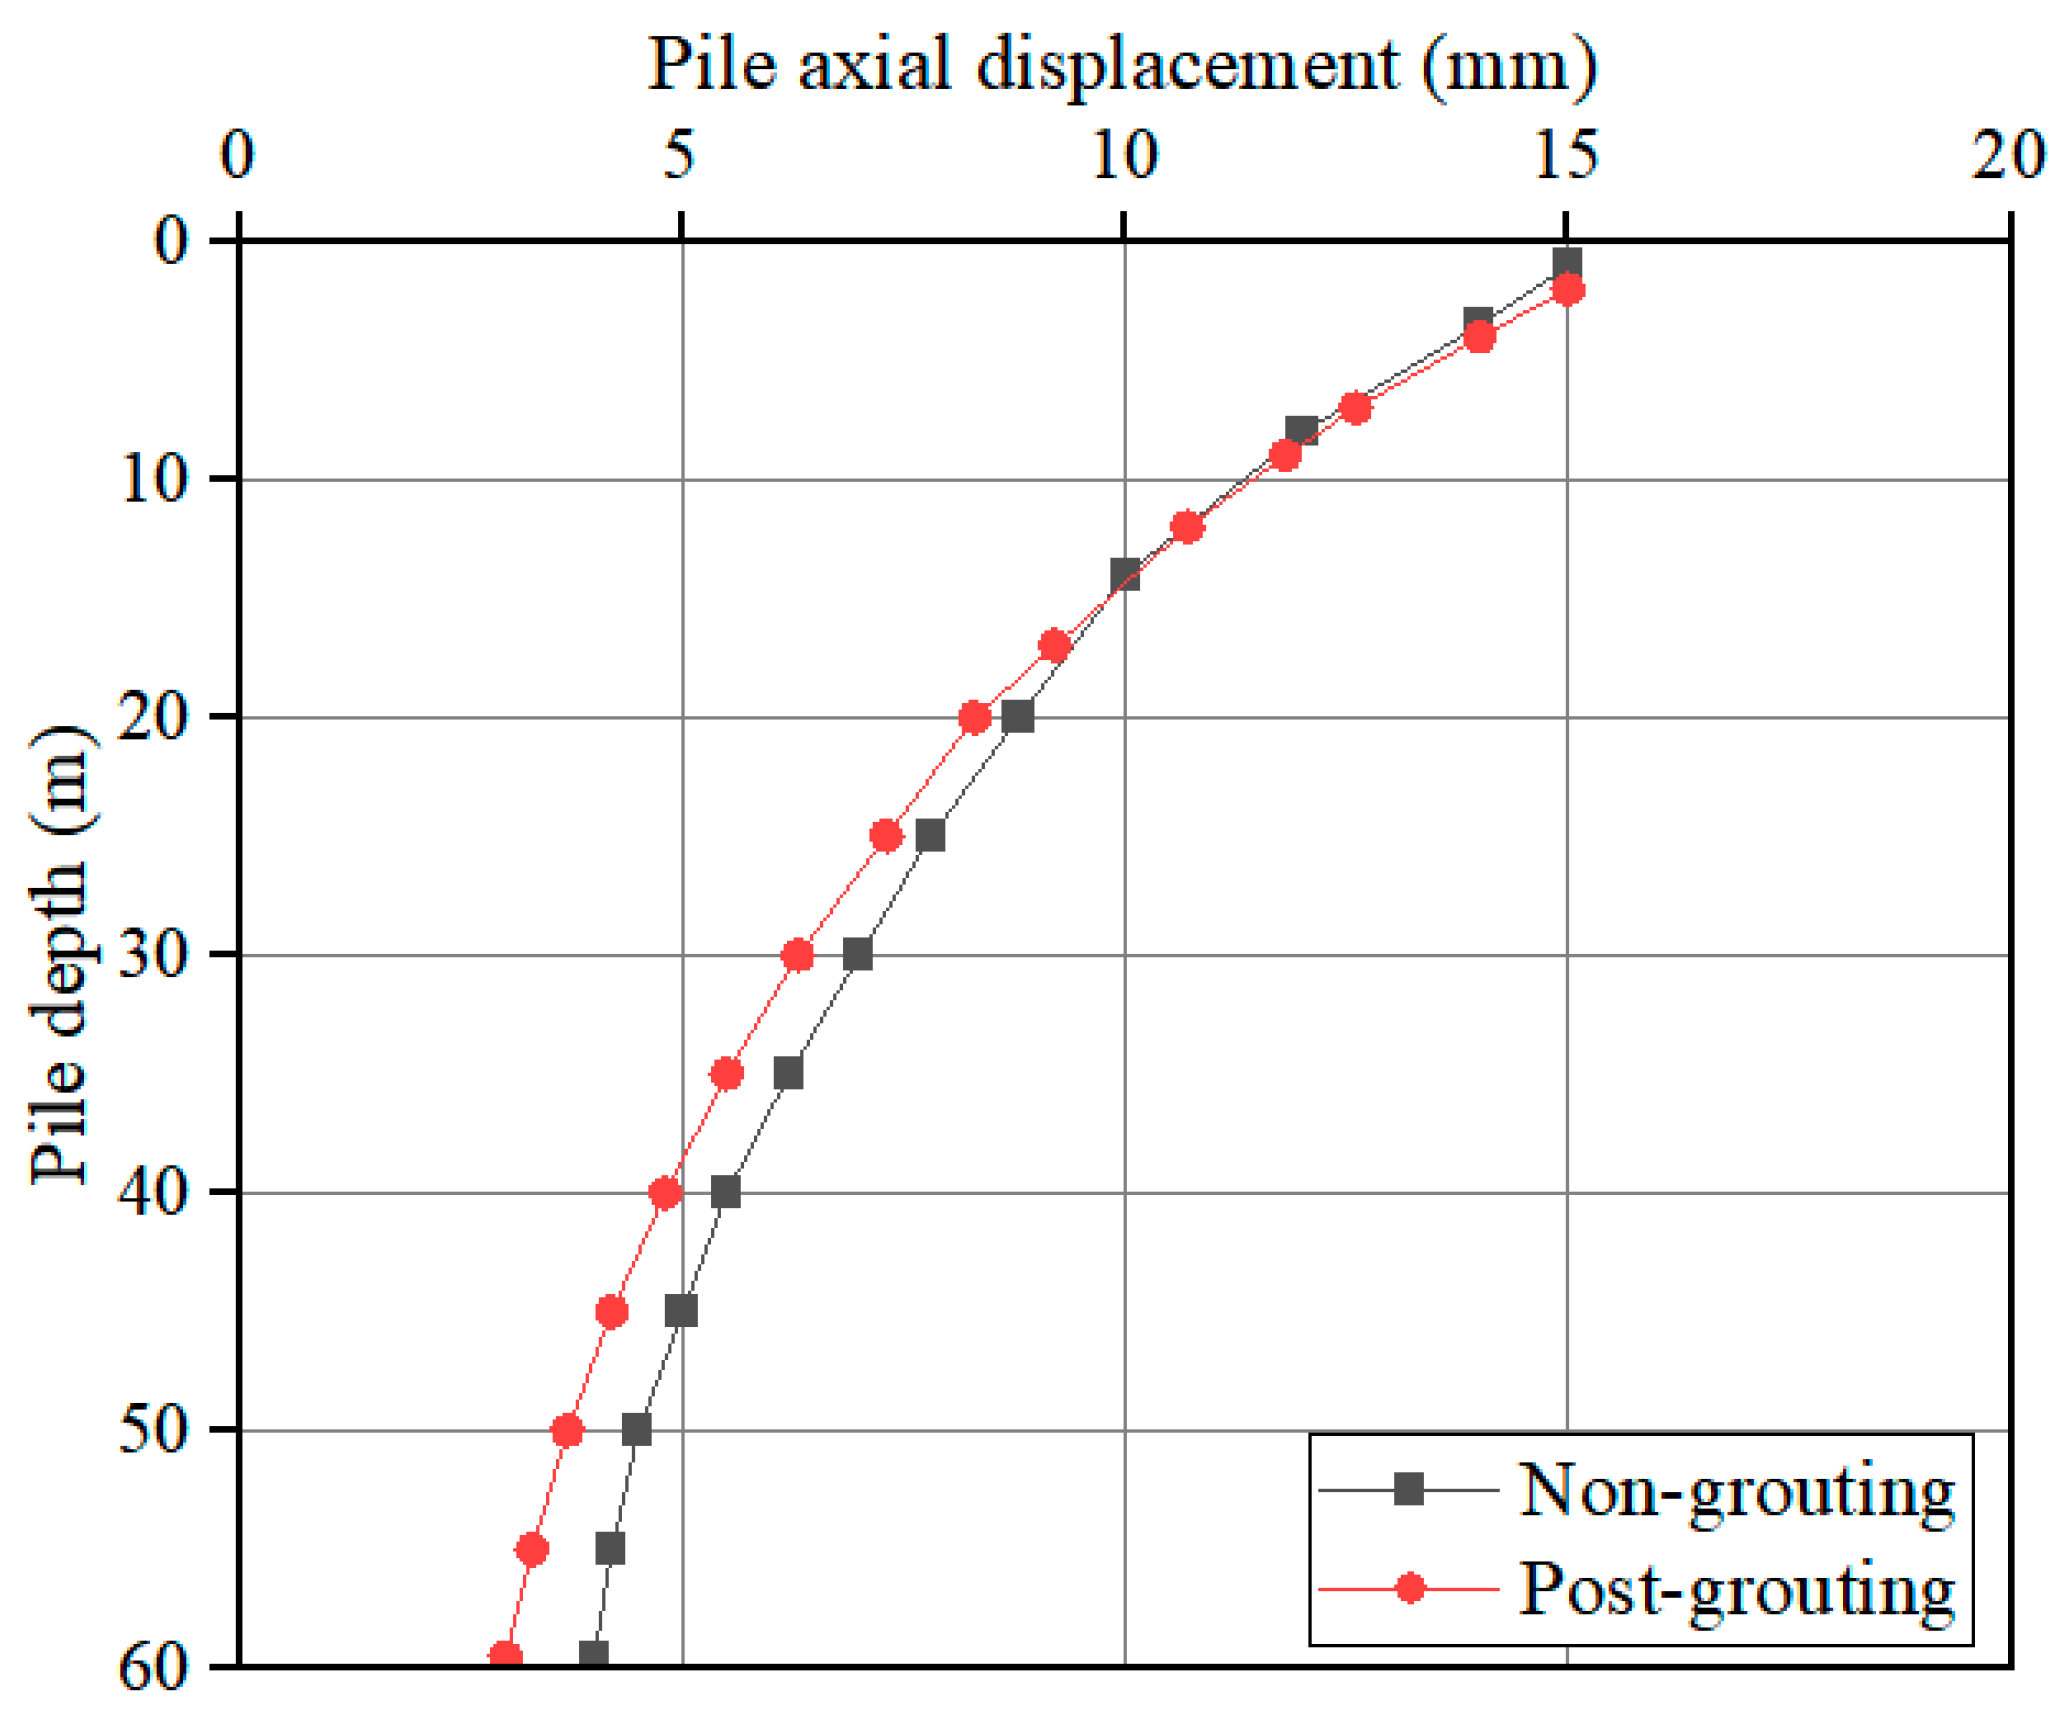
4.2.2. Analysis of Axial Displacement

As shown in Figure 10, the axial displacement along the pile depth was analyzed under both post-grouting and non-grouting conditions at their respective bearing capacities. Both conditions exhibit similar displacement patterns, with the maximum displacement occurring at the pile top and gradually decreasing towards the pile bottom.
The elastic compression of the pile body under loading is significant. For the non-grouting condition, the pile top displacement is approximately 15 mm, while the pile bottom displacement is about 4 mm, resulting in a pile compression of 11 mm. Similarly, under the post-grouting condition, the pile top and bottom displacements are about 15 mm and 3 mm respectively, showing a pile compression of 12 mm. These substantial pile compressions between the pile top and bottom demonstrate that the super-long pile body undergoes considerable elastic deformation under the applied load, which is a typical characteristic of axial deformation in super-long piles.

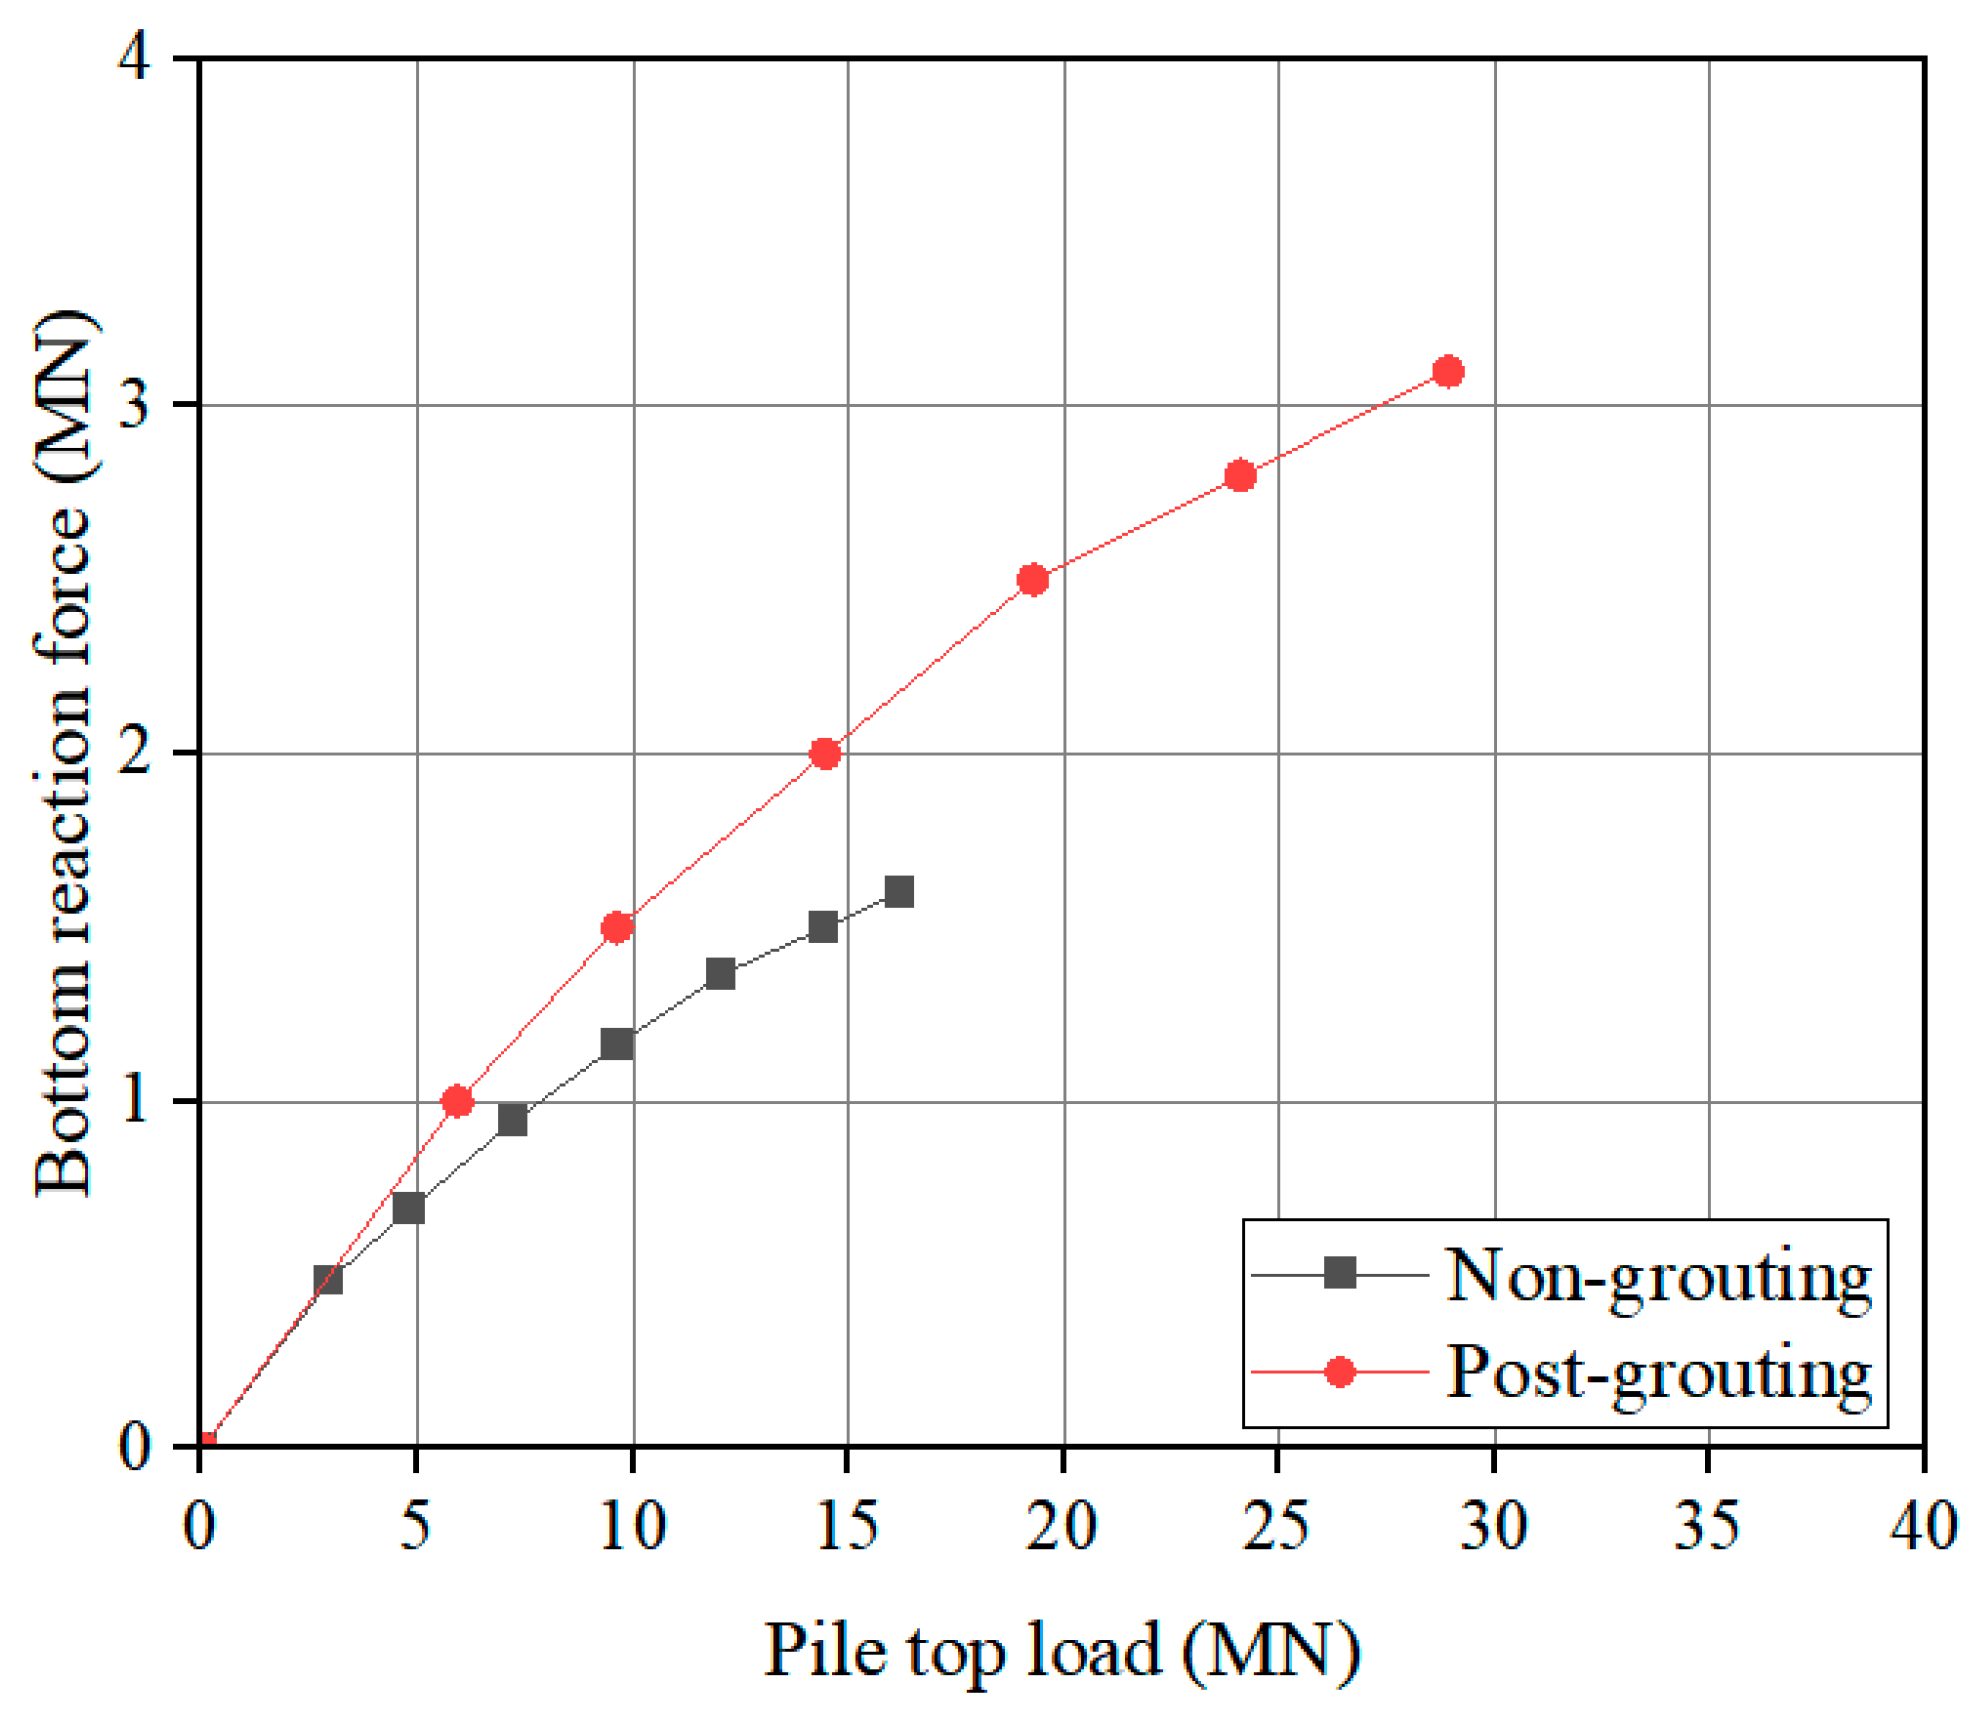
4.2.3. Analysis of Bottom Reaction Force

The load transfer mechanism between pile bottom and pile side is crucial for understanding pile performance. As shown in Figure 11, the relationship between bottom reaction force and pile top load within bearing capacity was analyzed for both post-grouting and non-grouting conditions. Under the non-grouting condition, when the pile top load reaches its bearing capacity of 16 MN, the bottom reaction force is 1.6 MN, accounting for 10% of the total bearing capacity. For the post-grouting condition, at the bearing capacity of 29 MN, the bottom reaction force increases to 3.1 MN, representing 10.6% of the total bearing capacity. These results indicate that for the studied super-long bored piles, the bearing capacity is primarily provided by friction, which contributes approximately 90% of the total bearing capacity in both conditions. This is a typical characteristic of super-long piles, where side friction plays a dominant role in the load-bearing mechanism.

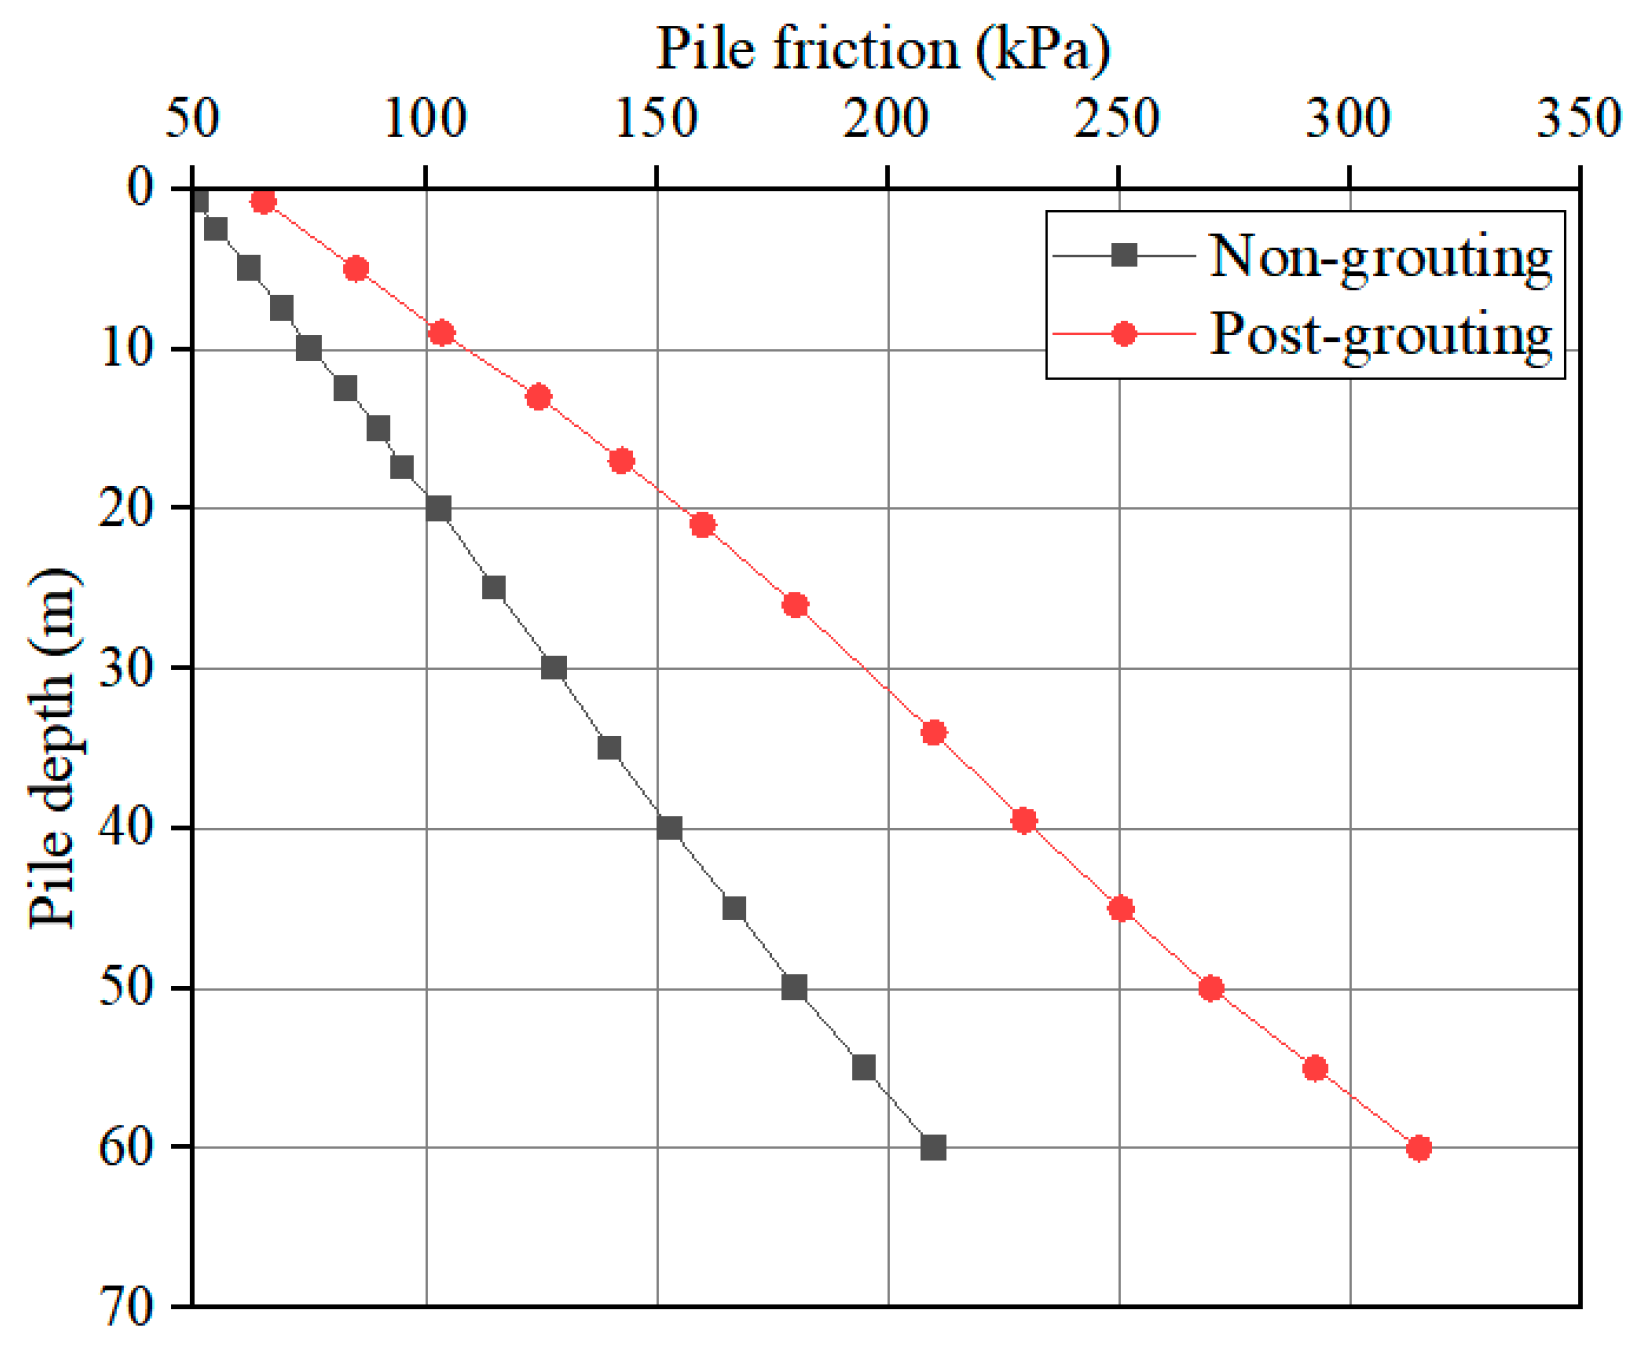
4.2.4. Analysis of Pile Friction

Given that side friction plays a dominant role in the bearing behavior of super-long piles, an analysis of the side friction distribution was conducted. As shown in Figure 12, the distribution of side friction along the pile depth at bearing capacity was analyzed for both post-grouting and non-grouting conditions.
The results reveal important characteristics about the load transfer mechanisms. From Figure 10, the side friction values for the post-grouting condition are consistently higher than the non-grouting condition throughout the entire pile length. This enhancement in side friction directly corresponds to the overall improvement in bearing capacity observed in Section 4.2.1, where post-grouting increased the bearing capacity from 16 MN to 29 MN.
The improved side friction can be connected to the grouting process described in Section 3.1.1, where the improvement effect of grouting was simulated by increasing the mechanical parameters of the mud skin elements. The significant enhancement in side friction confirms the effectiveness of this treatment method for super-long bored piles.
Combining this with the findings from Section 4.2.3, where side friction contributes approximately 90% of the total bearing capacity, the enhancement of side friction through post-grouting is the primary mechanism by which the overall pile performance is improved. The post-grouting process effectively transforms the weak mud skin layer into a reinforced zone with superior mechanical properties, leading to significantly higher friction resistance along the pile shaft.

4.3. Discussion of Results

The study numerically investigates the effects of construction-induced factors (mud skin and sediment) on the bearing capacity of super-long piles and explores the enhancement achieved through post-grouting. The results indicate that construction-induced factors significantly reduce pile bearing capacity. When both factors are present, the combined reduction is even more significant. These findings align with existing research, highlighting the detrimental impact of construction-induced factors on pile performance [7,12].
The study demonstrates that post-grouting significantly increases the pile bearing capacity. This enhancement is comparable to the findings of [2], who reported a substantial increase in bearing capacity for super-long piles through post-grouting. Similarly, [1] observed a significant increase in bearing capacity due to post-grouting. These studies collectively emphasize the significant role of post-grouting in improving the bearing capacity of super-long piles, particularly through the enhancement of side friction.
In summary, the study provides a detailed numerical analysis of the impact of construction factors on super-long pile performance. The results are consistent with existing literature, emphasizing the negative effects of construction factors and the significant benefits of post-grouting.

5. Influence of Post-Grouting Parameters on Pile Performance

Based on the test pile described in Section 2, this section investigates the influence of post-grouting parameters on pile performance. Following the criteria established in Section 3.2, the bearing capacity is determined as the load corresponding to s = 0.05 D p . This section investigates how the properties of post-grouting reinforced zones affect pile performance, focusing specifically on their geometric dimensions and elastic modulus. These parameters reflect the outcome of the grouting process and directly influence pile behavior. While the actual grouting process involves complex parameters such as grouting pressure and material properties, this study examines the final state of the grouted zones through their physical and mechanical characteristics.
The dimensions and mechanical properties of reinforced zones represent the effectiveness of post-grouting treatment. Current literature provides limited quantitative relationships between these reinforced zone parameters and pile performance. Therefore, this section investigates how the geometric dimensions of grouting reinforced zones and their elastic modulus influence pile performance, with parameter ranges determined based on engineering experience and reasonable assumptions. The analysis examines both pile bottom and pile shaft grouting reinforced zones separately to provide insights for assessing post-grouting effectiveness in engineering practice.

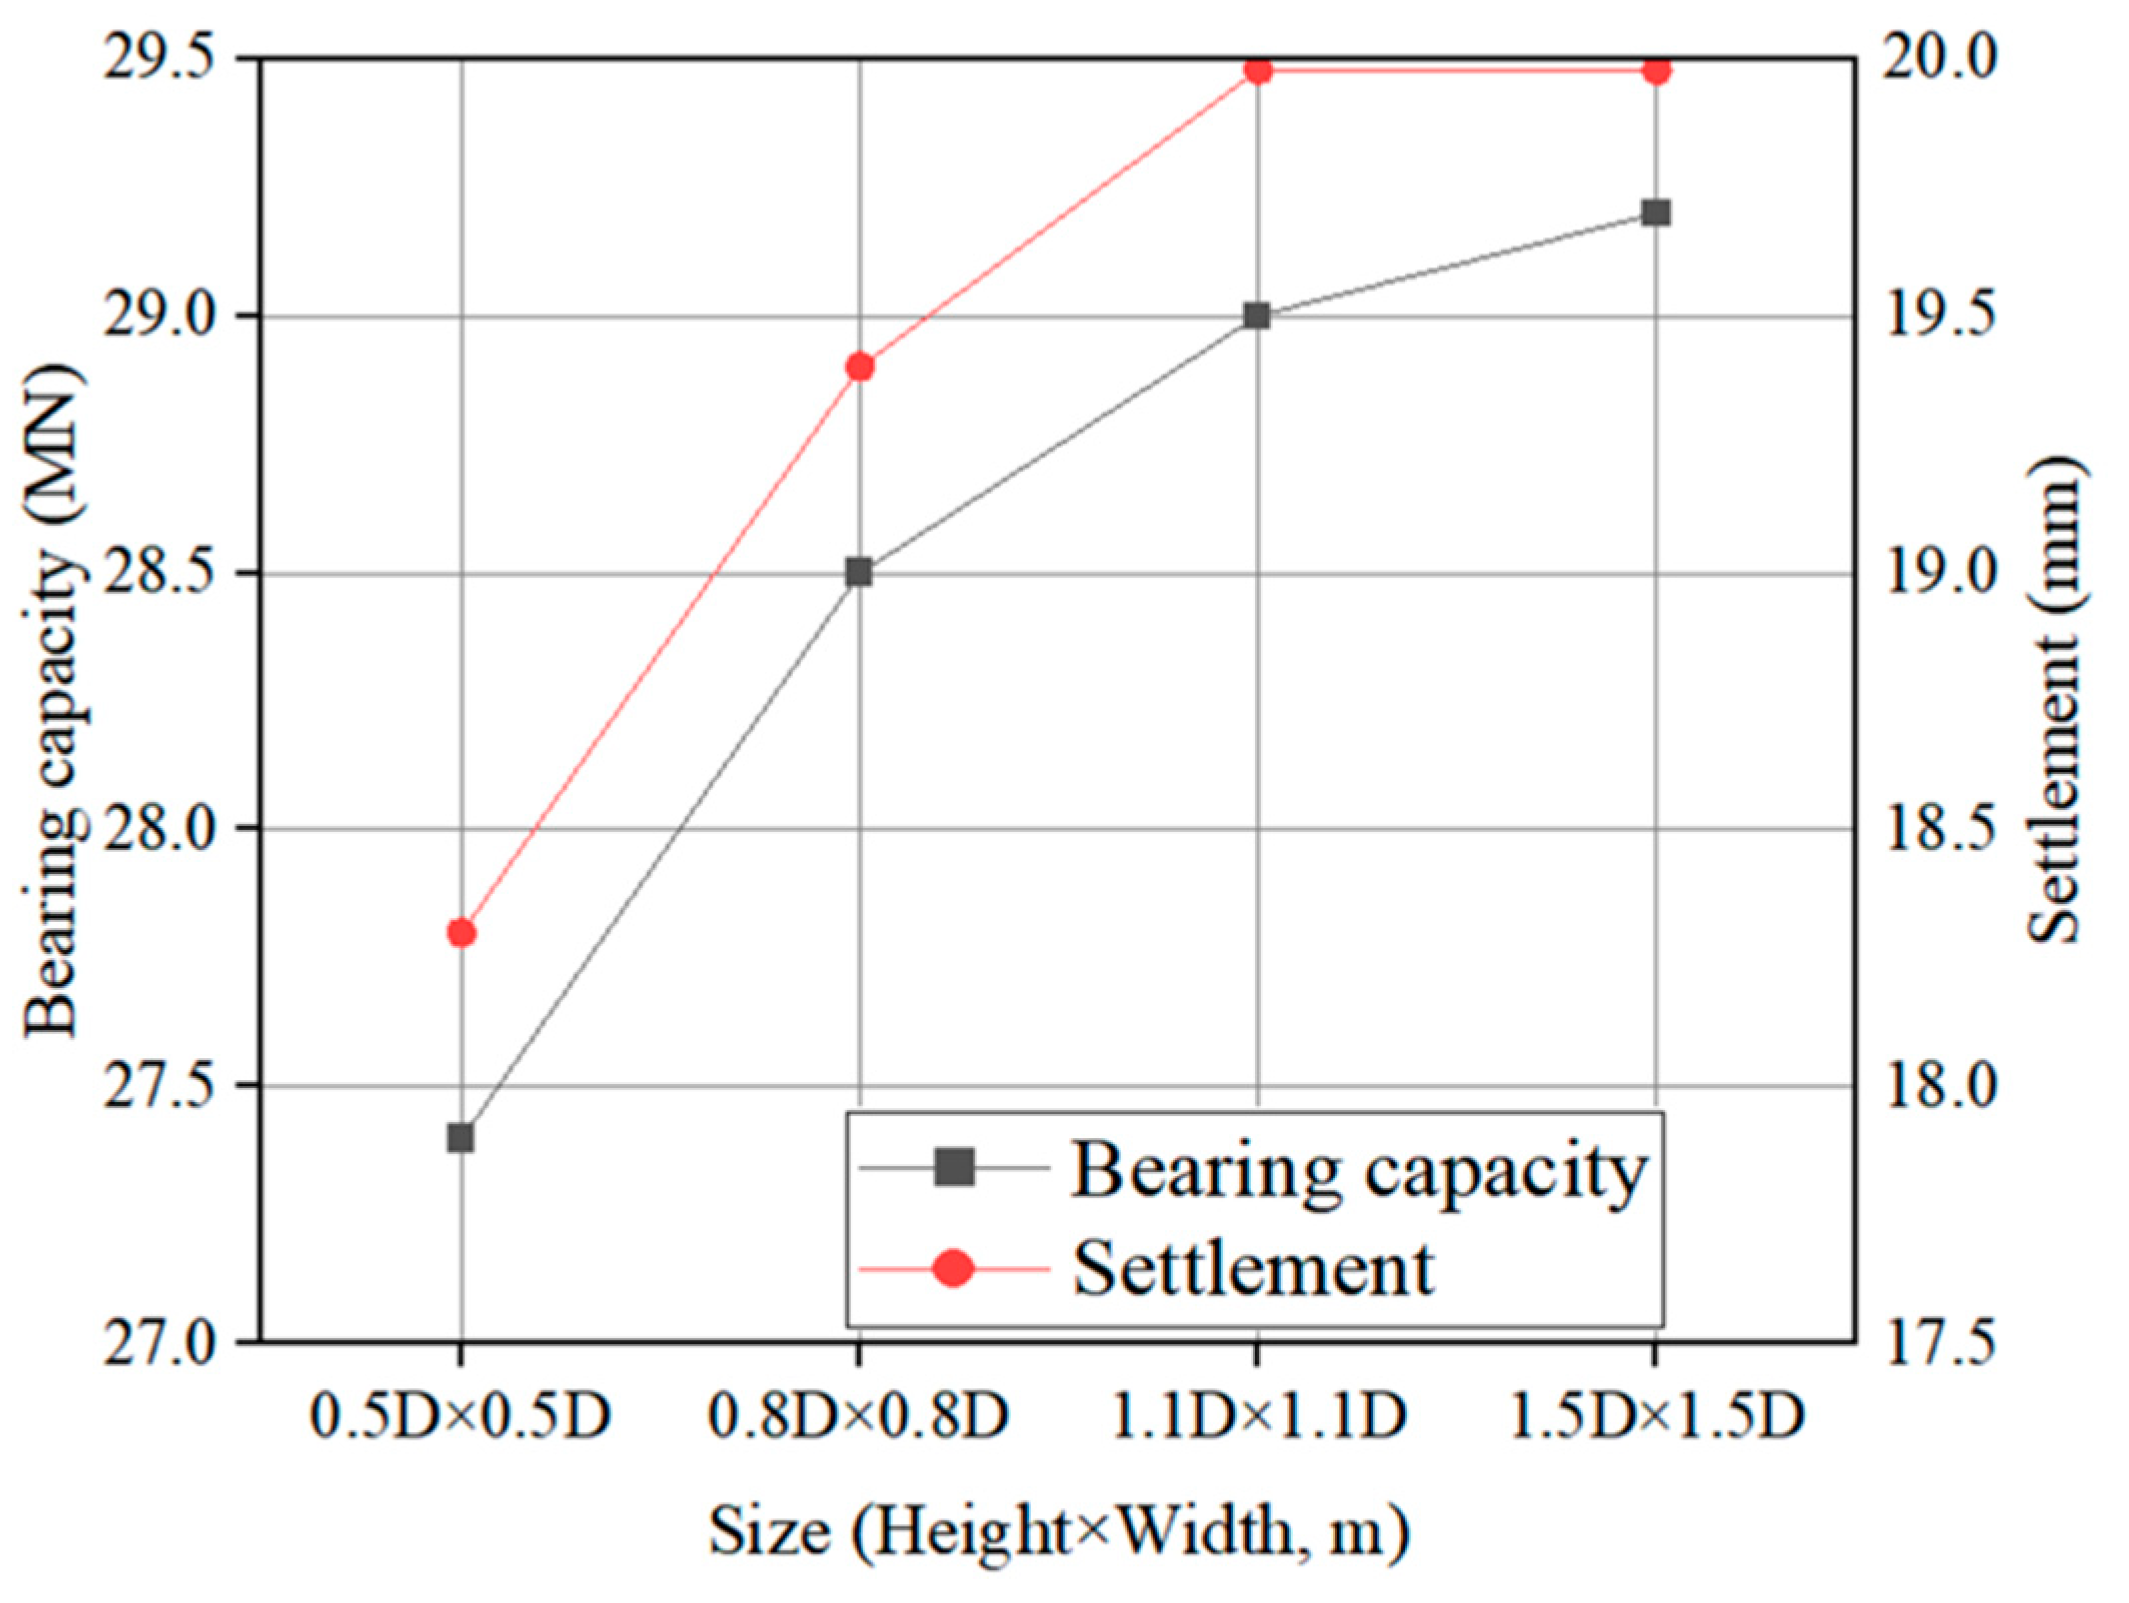
5.1. Effect of Pile Bottom Grouting Reinforced Zone Dimensions on Pile Performance

Based on engineering practice, reasonable assumptions, and previous research [4], the reinforced zone formed by pile bottom grouting is simplified as a cylinder characterized by its diameter and height. The range of dimensions considered in this study was determined based on both engineering practice and reasonable assumptions, where both the diameter and height vary from 0.5D to 1.5D (D = 1.8 m).
Table 4 presents the results of numerical simulations with varying dimensions of the pile bottom grouting reinforced zone. For each case, the elastic modulus of the reinforced zone was maintained constant at 200 MPa, while the geometric dimensions (diameter and height) were kept equal and varied from 0.5D to 1.5D. Throughout these analyses, the shaft grouting reinforced zone was maintained at a constant thickness of 0.25 m around the pile shaft (as established in Section 3.1.1).
As shown in Table 4 and Figure 13, for this specific test pile under the studied soil conditions, when the reinforced zone size increases from 0.5D × 0.5D to 1.1D × 1.1D, the bearing capacity shows a notable increase from 27.4 MN to 29 MN (an improvement of 5.8%), while the settlement at bearing capacity increases from 18.3 mm to 20 mm. However, further increasing the reinforced zone dimensions from 1.1D × 1.1D to 1.5D × 1.5D results in only a marginal improvement in bearing capacity from 29 MN to 29.2 MN (a mere 0.7% increase), with no significant change in settlement values. The numerical analysis results suggest that for this particular case, increasing the reinforced zone dimensions beyond 1.1D may not provide significant additional benefits in terms of bearing capacity improvement, indicating a threshold effect where further material investment yields diminishing returns.

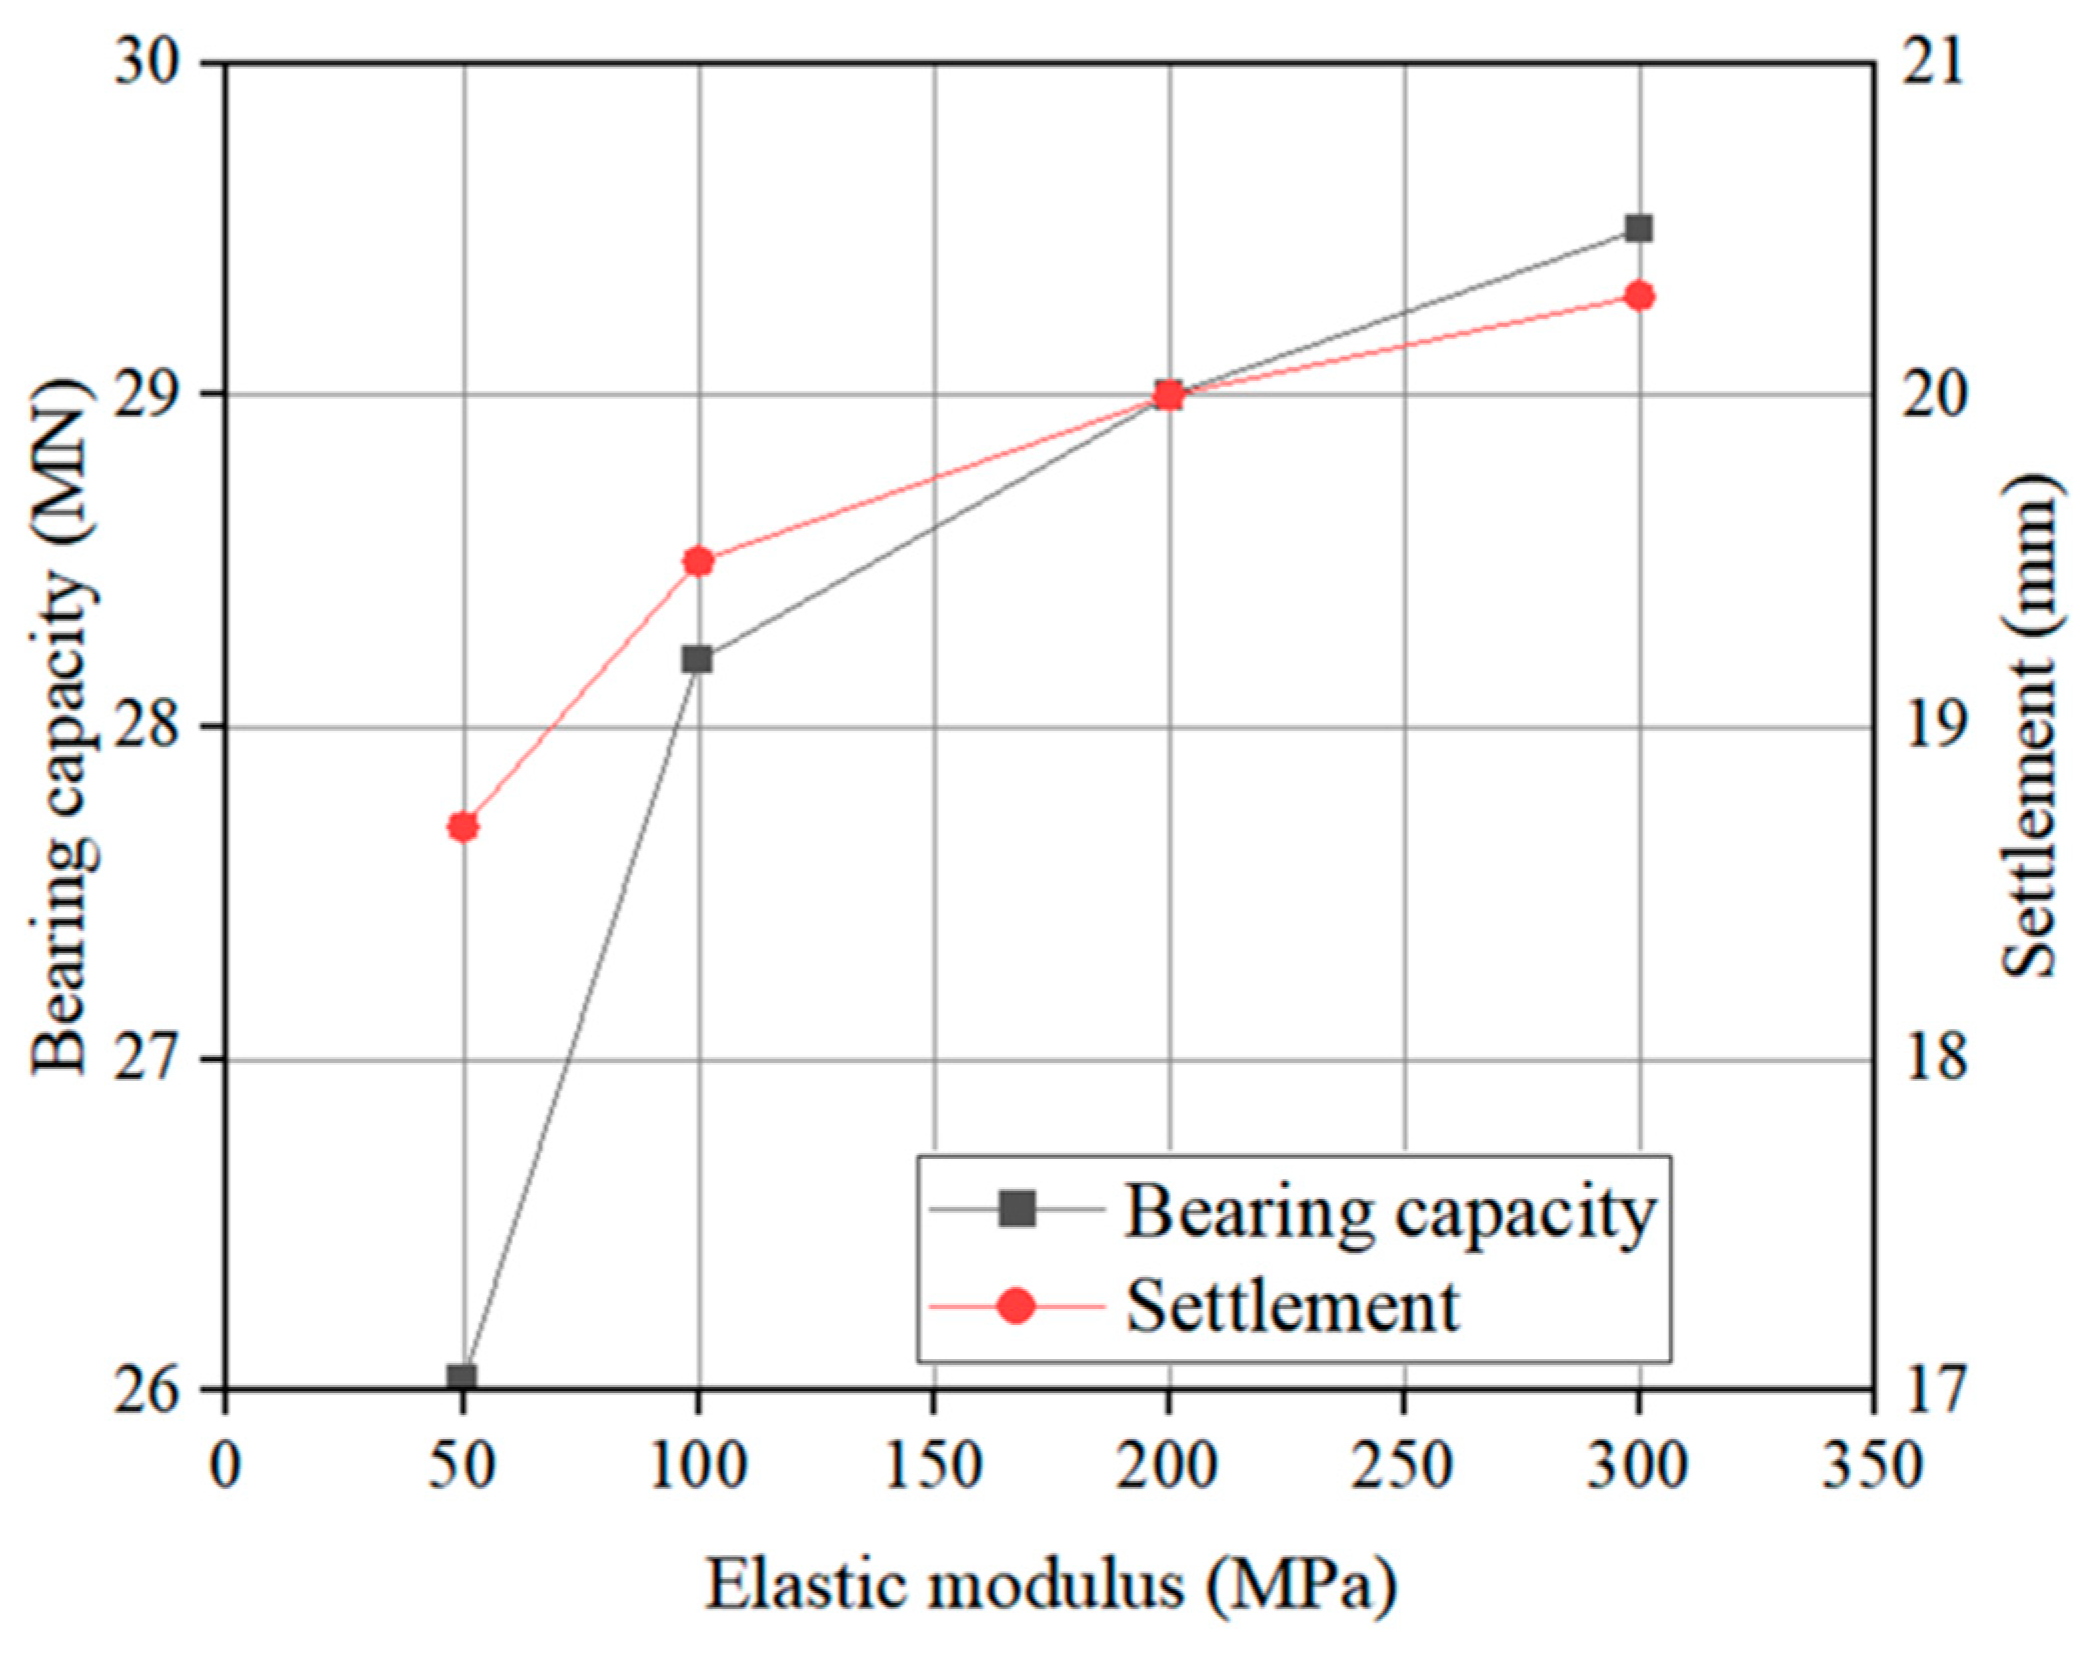
5.2. Effects of Elastic Modulus of Grouting Reinforced Zones on Pile Performance

Following the analysis of geometric dimensions, this section examines how the elastic modulus of post-grouting reinforced zones affects pile performance. Using the same test pile configuration, numerical simulations were conducted with varying elastic modulus values for both the pile bottom and shaft grouting reinforced zones simultaneously, while maintaining their geometric dimensions constant. The dimensions were kept at 1.1D (where D = 1.8 m) for both diameter and height of the pile bottom reinforced zone and 0.25 m thickness for the shaft grouting reinforced zone around the pile shaft (as established in Section 3.1.1). This combined analysis approach considers the overall post-grouting effect where both pile bottom and shaft reinforced zones are present.
The results presented in Table 5 and Figure 14 demonstrate that increasing the elastic modulus of the reinforced zones enhances the bearing capacity, but the improvement becomes less pronounced at higher values. When the elastic modulus increases from 50 MPa to 200 MPa, the bearing capacity increases from 26 MN to 29 MN (a substantial improvement of 11.5%). However, further increasing the elastic modulus to 300 MPa only results in a slight improvement in bearing capacity to 29.5 MN (representing just a 1.7% additional increase). This clear pattern of diminishing returns suggests that for this pile configuration and soil condition, an elastic modulus of approximately 200 MPa represents an optimal value beyond which additional stiffness improvement yields minimal performance benefits. The settlement values show a consistent trend across different elastic modulus values, ranging from 18.7 mm to 20.2 mm. This relatively small variation in settlement despite significant changes in the elastic modulus suggests that the settlement characteristics are more influenced by the overall pile compression under loading rather than solely by the elastic modulus of the reinforced zones.

5.3. Effects of Pile Shaft Grouting Reinforced Zone Dimensions

For pile shaft grouting, the reinforced zone typically forms a cylindrical shell surrounding the pile shaft. Based on engineering practice and reasonable assumptions, the reinforced zone thickness is a key parameter affecting the pile performance. In this numerical analysis, the reinforced zone thickness varies from 0.125 to 1.0 m around the pile shaft. Throughout these analyses, the pile bottom grouting reinforced zone is maintained at 1.1 D × 1.1 D (as established in Section 5.1) to isolate the effects of shaft grouting parameters.
Table 6 presents the results of numerical simulations with varying thicknesses of the shaft grouting reinforced zone. For each case, the elastic modulus of the reinforced zone was maintained constant at 200 MPa, while only the thickness was varied.
As shown in Table 6 and Figure 15, for this specific test pile under the studied soil conditions, when the shaft grouting reinforced zone thickness increases from 0.125 to 0.25 m, the bearing capacity shows an increase from 28.2 MN to 29 MN, while the settlement at bearing capacity decreases from 21.3 mm to 20 mm. However, further increasing the thickness from 0.25 to 0.5 m results in little to no change in bearing capacity and settlement. The numerical analysis suggests that reinforcement beyond the mud skin zone provides no additional benefits for pile performance.

6. Conclusions

Through numerical analysis validated against both field static load test results and published numerical data, this study systematically examines changes in bearing capacity, settlement characteristics, and load transfer mechanisms of mud-protected bored piles. The key findings are summarized as follows:
(1)
For the case study, construction-induced effects significantly reduce pile bearing capacity, with mud skin and sediment individually leading to decreases of 28% and 24%, respectively, compared to ideal conditions. When both construction-induced effects are present, the bearing capacity decreases by 36%.
(2)
The parametric study on mud skin thickness reveals that beyond a certain minimal thickness, further increases in mud skin thickness have limited additional impact on the bearing capacity.
(3)
Post-grouting can effectively improve pile performance, increasing the bearing capacity by 81% compared to the non-grouting condition for the studied test pile. The load-settlement curves also show improved initial stiffness after post-grouting.
(4)
For the studied test pile, side friction dominates pile behavior, contributing approximately 90% of the total bearing capacity. The pile body exhibits significant elastic compression under loading, with pile compression between pile top and bottom reaching approximately 11~12 mm.
(5)
For the test pile studied, parametric analysis indicates that the grouted reinforcement zone at the pile bottom does not need to exceed 1.1 times the pile diameter. Additionally, reinforcement beyond the mud skin zone offers no further benefits to pile performance, and the elastic modulus of the reinforced zones shows diminishing returns beyond 200 MPa.
(6)
The findings from this research have significant practical implications for foundation engineering projects worldwide. While the test pile was located in Eastern China, the observed effects of construction-induced factors and post-grouting mechanisms are relevant to bored pile applications globally. The substantial reduction in bearing capacity due to mud skin and sediment highlights the universal importance of construction quality control in bored pile projects, regardless of geographical location. The optimal grouting zone dimensions identified in this study can serve as a reference for grouting design in similar soil conditions internationally, potentially leading to more cost-effective grouting practices.
Despite the comprehensive analysis presented, this study has several limitations that could be improved in future works:
(1)
The study assumes uniform mud skin thickness and properties along the pile shaft, while in practice, these may vary with depth.
(2)
The post-grouting reinforced zones were modeled with simplified cylindrical geometries, which may not fully represent the complex shapes that develop during actual grouting operations.
Future research could build upon this study in several directions:
(1)
Probabilistic and reliability analysis to quantify uncertainties in input parameters (soil properties, mud skin characteristics, sediment conditions) and their propagation to bearing capacity predictions, providing confidence levels for performance estimations.
(2)
Investigation of grouting process parameters (pressure, volume, injection rate) and their relationship with the resulting reinforced zone characteristics across different soil conditions, which would provide more directly applicable guidance for post-grouting implementation.
(3)
Development of more realistic three-dimensional modeling approaches to better represent the complex geometry of grouting reinforced zones, which typically have irregular, water-drop shapes rather than the simplified cylindrical geometries used in this study.
(4)
Investigation of long-term settlement behavior and creep effects in post-grouted bored piles under various soil conditions.

Author Contributions

Conceptualization, X.G. and M.Z.; investigation, H.M.; methodology, H.M. and H.L.; supervision, X.G. and M.Z.; validation, H.L.; writing—original draft, H.M. and H.L.; writing—review and editing, X.G. and M.Z. All authors have read and agreed to the published version of the manuscript.

Funding

This work was supported by the National Natural Science Foundation of China (52401325), the Fundamental Research Funds for the Central Universities (2023ZYGXZR028), and the Guangdong High-Level Youth Talent Program (2023QN10H491). The authors sincerely appreciate the support of these funding sources. The APC was funded by the National Natural Science Foundation of China (52401325).

Data Availability Statement

The raw data supporting the conclusions of this article will be made available by the authors on request.

Conflicts of Interest

Author Hua Mo is employed by the company Guangdong NO.3 Water Conservancy and Hydro-Electric Engineering Board Co., Ltd. The remaining authors declare that the research was conducted in the absence of any commercial or financial relationships that could be construed as a potential conflict of interest.

References

  1. Ma, H.; Ma, Y.; Yao, W.; Chen, C. Research on Bearing Capacity of Post-grouting Super-long Bored Pile. IOP Conf. Ser. Earth Environ. Sci. 2021, 634, 012111. [Google Scholar] [CrossRef]
  2. Wan, Z.; Dai, G.; Gong, W. Field study on post-grouting effects of cast-in-place bored piles in extra-thick fine sand layers. Acta Geotech. 2019, 14, 1357–1377. [Google Scholar] [CrossRef]
  3. Zhang, Z.-M.; Yu, J.; Zhang, G.-X.; Zhou, X.-M. Test study on the characteristics of mudcakes and in situ soils around bored piles. Can. Geotech. J. 2009, 46, 241–255. [Google Scholar] [CrossRef]
  4. Zhou, Z.; Yang, X.; Wang, H. Numerical simulation and bearing capacity analysis of post grouting reinforcement of bored pile based on CEL method. Found. Treat. 2023, 5, 305–311. [Google Scholar] [CrossRef]
  5. Cao, S.; Wang, Q.; Ma, J.; Xiao, Z.; Li, C.; Yang, Y.; Wang, J. Experimental Investigation of Vertical Bearing Characteristics of Composite Post-grouting Piles in Sandy Soil. Int. J. Civ. Eng. 2024, 22, 303–315. [Google Scholar] [CrossRef]
  6. Gao, Q.; Hu, Q.; Zhang, J.; Ren, Z.; Liu, C.; Liu, J.; Wang, S.; Cheng, G.; Zhang, R.; Ren, C. Experimental study on wall-protecting mud modification of super-long bored pile in the alluvial plain region of the Yellow River. Constr. Build. Mater. 2023, 368, 130395. [Google Scholar] [CrossRef]
  7. Lin, M.; Huang, X.; Han, D. Numerical simulation study on the influence of pile end sediment on the bearing performance of bored pile. Highway 2021, 66, 116–122. [Google Scholar]
  8. Zhai, D.; Zhou, F.; Zhou, J.; Zhu, R. Experimental study and numerical analysis on bearing characteristics of large diameter ultra long bored piles with post grouting on the tip and side. IOP Conf. Ser. Earth Environ. Sci. 2018, 189, 022024. [Google Scholar] [CrossRef]
  9. Zhang, J.; Zhao, C.; Wu, Y. Experimental Study on Post-Grouting Pile Vertical Bearing Performance Considering Different Grouting Methods and Parameters in Cohesive Soil. Appl. Sci. 2023, 13, 12175. [Google Scholar] [CrossRef]
  10. JGJ/T 403-2017; Technical Specification for Static Load Test of Building Foundation Piles. China Architecture & Building Press: Beijing, China, 2017.
  11. Dong, X. Research on the Vertical Bearing Mechanism of Pile end and Side Grouting Drilled Pile. Master’s thesis, Zhengzhou University, Zhengzhou, China, 2012. [Google Scholar]
  12. Gong, Y. Research on the Mechanism and Application of Post Grouting Technology in Drilled Pile Engineering. Master’s Thesis, Shijiazhuang Railway University, Shijiazhuang, China, 2016. [Google Scholar]
  13. Li, Y. Experimental Study on Vertical Bearing Performance of Post Grouting Bored Pile. Master’s Thesis, Zhengzhou University, Zhengzhou, China, 2022. [Google Scholar]
  14. JGJ 94-2008; Technical Specification for Building Pile Foundations. China Architecture & Building Press: Beijing, China, 2008.
  15. Huang, S.; Gong, W. Experimental study and finite element analysis on the bearing performance of large-diameter and ultra long piles after grouting. Rock Soil Mech. 2007, 297–301. [Google Scholar] [CrossRef]
  16. Huang, S.; Liu, P. Research on post grouting technology at the bottom of piles. Geol. Sci. Technol. Inf. 1999, S1, 73–75. [Google Scholar]
  17. Yu, X.; Pan, J.; Yang, N. Analysis of the influence of sediment at the bottom of piles and mud skin around piles on the vertical bearing capacity of large-diameter bored piles. Min. Metall. Eng. 2006, 6, 9–12. [Google Scholar]
  18. Zhang, Z.; Zhang, G.; Wu, Q. Experimental study on the properties of mud skin soil and soil between drilled piles. J. Geotech. Eng. 2006, 6, 695–699. [Google Scholar]
  19. Wang, S. Research on the Bearing Characteristics of Post Grouting of Large-Diameter and Ultra Long Bored Pile Ends. Master’s Thesis, Zhejiang University, Hangzhou, China, 2010. [Google Scholar]
  20. Jia, W.; Wang, L.; Li, J.; Chen, Y.; Li, T.; Huang, J. On-site clay mud modification for bored piles in a multi-layer soft ground. Constr. Build. Mater. 2024, 449, 138251. [Google Scholar] [CrossRef]
  21. Potyondy, J.G. Skin Friction between Various Soils and Construction Materials. Geotechnique 1961, 11, 339–353. [Google Scholar] [CrossRef]
  22. Yan, Y. The Influence of Pile Foundation in Lifecycle on Adjacent Existing Tunnel. Thesis, Tongji University, Shanghai, China, 2007. (In Chinese). Available online: https://kns.cnki.net/kcms2/article/abstract?v=RN_8baVbY4cUOCakC1mboQ4e2Z174dKB5mDisTNEsW633_tcSVvPtbw_HrcjOoL71dFST0cK7MD2jlDnf8kOdOFI01GFMxvAyhkgXtpboFs0h5eip8QdC3Jr7OGPEuZcmPejgvd8wh4Oby7j-iruZ4UwI_JpEjUgAYbgcrCeoOsluMJAJNGY6Q==uniplatform=NZKPTlanguage=CHS (accessed on 22 April 2025).
  23. Cheng, Y. Research on the Bearing Performance of the Super-Long and Large-Diameter Bored Pile. Ph.D. Thesis, Southeast University, Nanjing, China, 2005. [Google Scholar]
Figure 1. The main construction process of mud-protected bored pile.
Buildings 15 01457 g001
Figure 2. Created model in Abaqus and its meshing.
Buildings 15 01457 g002
Figure 3. Numerical simulation procedure for mud-protected bored pile: correspondence between actual construction stages (left) and numerical simulation steps (right).
Buildings 15 01457 g003
Figure 4. Comparison between numerical and field test results: (a) non-grouting pile; (b) post-grouting pile.
Buildings 15 01457 g004
Figure 5. Comparison of Q-s curves with numerical results from [19] (a) non-grouting pile and (b) post-grouting pile.
Buildings 15 01457 g005
Figure 6. Comparison of Q-s curve with different test scenarios under non-grouting conditions.
Buildings 15 01457 g006
Figure 7. Analysis of load transfer mechanisms at bearing capacity for different construction-induced conditions: (a) bottom reaction force; (b) axial displacement distribution along pile depth; (c) side friction distribution along pile depth.
Buildings 15 01457 g007
Figure 8. Influence of mud skin thickness (0.05–0.25 m) on the bearing capacity of bored piles.
Buildings 15 01457 g008
Figure 9. Comparison of bearing capacity between non-grouting and post-grouting conditions.
Buildings 15 01457 g009
Figure 10. Axial displacement distribution along pile depth for non-grouting and post-grouting conditions at bearing capacity.
Buildings 15 01457 g010
Figure 11. Relationship between bottom reaction force and pile top load for non-grouting and post-grouting conditions at bearing capacity.
Buildings 15 01457 g011
Figure 12. Side friction distribution along pile depth for non-grouting and post-grouting conditions at bearing capacity.
Buildings 15 01457 g012
Figure 13. Trend of bearing capacity and settlement with increasing pile bottom grouting reinforced zone dimensions.
Buildings 15 01457 g013
Figure 14. Trend of bearing capacity and settlement with increasing elastic modulus of grouting reinforced zone.
Buildings 15 01457 g014
Figure 15. Trend of bearing capacity and settlement with increasing pile shaft grouting reinforced zone thickness.
Buildings 15 01457 g015
Table 1. Simplified soil layer distribution and corresponding parameters.
E s (a) (MPa) γ s (a) (kN/m3) C s (a) (kPa) φ s (a) (°)Layer Thickness (m)
Layer 1 (soft plastic to plastic silty clay)1519.54313.510
Layer 2 (medium dense silt)2519.8401520
Layer 3 (hard plastic silty clay)3519.74313>50
Note: (a) E s , γ s , C s , φ s represent the elastic modulus, unit weight, cohesion, and internal friction angle of the soil, respectively.
Table 2. Parameter values for mud skin, sediment, and post-grouting reinforced zone at pile bottom.
MaterialElastic Modulus
(MPa)
Cohesion
(kPa)
Internal Friction Angle
(°)
Unit Weight
(kN/m3)
Size (m)
Mud skin0.8 E s (a)0.9 C s (a)0.8 φ s (a)0.9 γ s (a)Thickness: 0.25
Sediment35313Height: 0.2
Width: hole diameter
Post-grouting reinforced zone at pile bottom2001.5 C s (a)1.5 φ s (a)1.5 γ s (a)Height: 2
Width: 2
Note: (a) Parameter of the corresponding soil layer.
Table 3. Bearing capacity and settlement under different test scenarios.
Test ScenarioBearing Capacity (MN)Settlement at Bearing Capacity (mm)
Ideal condition (without mud skin and sediment)2515
With mud skin only1815
With sediment only1915
Non-grouting1615
Table 4. Effect of pile bottom grouting reinforced zone dimensions on pile performance.
Size (Height × Width, m)Bearing Capacity (MN)Settlement (mm)
Non-grouting1615
0.5D × 0.5D27.418.3
0.8D × 0.8D28.519.4
1.1D × 1.1D2920
1.5D × 1.5D29.220
Table 5. Effect of elastic modulus of grouting reinforced zone on pile performance.
Elastic Modulus (MPa)Bearing Capacity (MN)Settlement (mm)
Non-grouting1615
502618.7
10028.219.5
2002920
30029.520.2
Table 6. Effect of pile shaft grouting reinforced zone thickness on pile performance.
Thickness (m)Bearing Capacity (MN)Settlement (mm)
Non-grouting1615
0.12528.221.3
0.252920
0.529.120
129.120
Disclaimer/Publisher’s Note: The statements, opinions and data contained in all publications are solely those of the individual author(s) and contributor(s) and not of MDPI and/or the editor(s). MDPI and/or the editor(s) disclaim responsibility for any injury to people or property resulting from any ideas, methods, instructions or products referred to in the content.

