Article

Investigation of the Energy Comsuption and Indoor Environment in Rural Residences in South China

1
Smart Building College, Guangzhou City Polytechnic, Guangzhou 510405, China
2
School of Civil Engineering, Guangzhou University, Guangzhou 510006, China
*
Author to whom correspondence should be addressed.
Buildings 2025, 15(7), 1129; https://doi.org/10.3390/buildings15071129
Submission received: 6 January 2025 / Revised: 18 March 2025 / Accepted: 26 March 2025 / Published: 30 March 2025
(This article belongs to the Special Issue Healthy, Low-Carbon and Resilient Built Environments)

Abstract

With the development of society, energy application and building thermal comfort in rural residences are receiving more and more attention. The rural residences in this survey mainly cover the rural areas of 21 prefectures in Guangdong province, of which 24.7% are in the Pearl River Delta, 18.9% in western Guangdong, 13.1% in eastern Guangdong, and 43.2% in northern Guangdong. Rural household energy consumption is mainly used for lighting equipment, household appliances, and cooking equipment, where lighting equipment and household appliances mainly consume electrical energy, and cooking equipment consumes different types of energy due to the diversity of types. First, there is a wide variety and variation in rural energy consumption, with electricity and liquefied petroleum gas as the main sources of cooking energy. Hot water is mainly obtained by heating with electricity and natural gas. Secondly, for rural residents, renewable energy is too expensive to build, is also affected by the environment and weather, and is often not convenient to use. Third, rural residents generally experience a warm, humid indoor environment with adequate airflow, but poor kitchen ventilation reduces air quality satisfaction. To enhance renewable energy adoption, technological advancements and cost reductions are necessary, along with increased government efforts in awareness campaigns, policy incentives, and demonstration projects. This study analyses the rural energy structure in Guangdong, proposes the direction of rural energy optimization, and analyses rural energy use and the feasibility of renewable energy promotion, considering the population and income of rural households.

1. Introduction

In Central and Eastern Europe, a series of new laws and subsidy programs have been introduced to encourage households to stop using coal and switch to cleaner energy sources. As a result, gas heaters have become increasingly popular as the primary source of heating and domestic hot water [1]. This has made a significant contribution to reducing carbon emissions. As a developing country with rapid economic development, China’s energy consumption is growing rapidly every year [2], of which rural energy consumption accounts for a large proportion of China’s energy consumption, and per capita energy consumption has exceeded that of urban areas [3]. Research found that China’s carbon dioxide (CO2), sulfur dioxide (SO2), nitrogen dioxide (NO2), nitrogen oxides (NO), and particulate matter emissions mainly from coal and rural renewable energy consumption [4]. The issue of climate change caused by energy consumption and the associated carbon dioxide emissions from human activities has attracted much international attention [5]. In response to this environmental issue, President Xi Jinping announced at the 75th General Debate of the United Nations General Assembly that China is striving to limit peak carbon dioxide and other greenhouse gas emissions by 2030 and achieve carbon neutrality by 2060. Carbon emissions from rural energy consumption have emerged as a potential contributor to China’s peak carbon emissions [6]. According to the Beijing Statistical Yearbook 2016, the amount of coal used for rural life in 2015 was 1,718,100 tons, accounting for 14.89% of the city’s total coal consumption (11,535,700 tons) [7], and the burning of poor-quality coal in rural areas has caused serious pollution. Solving the transformation of the rural energy structure is an important process in the achievement of the dual-carbon goals. At the same time, rural energy transformation is one of the important tasks to reach the carbon emission reduction target, and the important element in energy upgrading is the promotion and application of renewable energy [8].
The rural energy consumption structure is transitioning from traditional non-commercial forms of energy consumption (e.g., biomass and coal) to commercial forms of energy consumption (electricity and natural gas) [9]. However, related studies have shown that although electricity has been fully converted since 2013, more than 50% of China’s rural residents still do not have access to modern fuels (e.g., solar and natural gas) and still rely mainly on wood, etc., for cooking [10]. Currently, energy transition and intensity growth are the two main features of rural energy development in China, and these features influence the formulation and implementation of rural energy policies. With reasonable policy measures and corresponding technology applications, rural areas are excellent places for renewable energy development [11,12]. Field studies have found that rural areas are spatially expansive, facilitating the construction of renewable energy facilities such as wind, hydro, and photovoltaic power [13,14]. Rural areas are needed to contribute space for climate change adaptation and mitigation, such as carbon sinks and renewable energy offsets [15]. The envisioned role of the ‘energy user’ in rural energy planning has shifted from being a passive client, consumer, or user to an active participant in the energy transition [16]. The use of photovoltaic solar panels [17], batteries [18], electric cars [19], feedback systems for energy use, etc. [20], as well as broader energy community initiatives, are changing people’s engagement with energy technologies [21].
In previous studies, some scholars have found that energy behavior and energy consumption decisions in rural areas depend largely on the perceptions of rural residents [22]. Investigating different social manifestations in rural areas and demonstrating the various attitudes towards wind farm development and the adoption of renewable energy sources such as solar photovoltaic (PV) panels play an important role in the success of rural energy. Therefore, there is a need for more empirical research on the factors that determine the energy transition of rural households in the location or representative rural areas from the perspective of rural households [23]. In terms of social benefits, rural areas have great potential as physical sites for energy transition [24]. Rural energy poverty is a topic of concern around the world, and renewable energy development has significant value in alleviating energy poverty [25]. Therefore, the development of rural renewable energy has immeasurable social benefits. Despite the growing importance of rural areas in the energy transition, this aspect is still largely underdeveloped and still needs to be developed at the source [26]. Simultaneously, in the aspect of consumption, the study of energy consumption behavior at home and abroad has gradually become important [27,28,29]. Some of these studies have found factors affecting household energy choices, such as socio-demographic factors, housing characteristics, types of energy carriers (stoves, cooking appliances), energy prices, local traditions and institutions, ethnicity, and dietary preferences [30,31,32,33]. People typically use two or more clean (non-clean) fuels, or even a combination of clean and non-clean fuels (i.e., blended fuel use), rather than a single fuel in their daily energy activities [34]. The use of mixed fuels provides rural residents with a sense of energy security [35]. In rural areas, the renewable energy industry is lagging behind due to relatively obstructed information and generally less educated rural residents with less awareness of energy conservation [4]. For example, when updating equipment, old equipment is often directly replaced by new equipment without fully considering its integration. However, research in Poland has shown that combining new and old equipment can create a better indoor environment [36]. This also means that it is difficult for people to completely transition from traditional fuels to cleaner fuels in a short period of time.
There are relevant studies based on the above analysis that “predict that any transition to this new geography of energy supply will inevitably involve strong new demands, new struggles, and large-scale new deployments of capital and labor in rural spaces in many parts of the globe”, but they do not adequately recognize the fact that as the commercial deployment of renewable energies intensifies, there are issues of local acceptance of renewable acceptance and contestation of renewable energy and the attendant rural problems and conflicts [37].
This study aims to provide a new perspective on rural energy transition by investigating the current energy consumption patterns in rural areas of Guangdong. Unlike previous research, which has primarily focused on macro-level energy policies and technological advancements, this study delves into the micro-level behavioral aspects of rural residents. By analyzing the discrepancies between actual energy consumption behaviors and the willingness to adopt clean energy, while further considering the impacts of household size and income, this study identifies the potential barriers to energy transition. Additionally, it incorporates an assessment of indoor air quality and thermal environment levels, integrating socio-demographic factors with the structural characteristics of rural energy consumption to evaluate the feasibility of promoting renewable energy in rural areas. The findings of this study contribute to a more comprehensive understanding of rural energy optimization and provide empirical insights for designing targeted policies that align with the socio-economic realities of rural households and China’s dual-carbon goals.

2. Research Subjects

This study employed a combined online and offline questionnaire survey methodology. A detailed questionnaire was designed to cover key aspects including demographics, household composition, building envelope characteristics, household appliances, water and electricity usage patterns, energy consumption types, and awareness of renewable energy. The survey specifically targeted rural households in Guangdong Province to systematically investigate and analyze their current energy usage practices.

2.1. Location

This survey was conducted from September 2022 to January 2023. The rural residences surveyed in this study mainly covered the rural areas of 21 prefecture-level cities in Guangdong province, with the Pearl River Delta (PRD) region accounting for 24.7%, the western part of Guangdong accounting for 18.9%, the eastern part of Guangdong accounting for 13.1%, and the northern part of Guangdong accounting for 43.2%. There were 259 buildings in total. The proportion of distribution shows that the questionnaire is typically representative. Reinforced concrete was the predominant structural material and 70% of the buildings had three or fewer floors (as shown in Figure 1). The number of rooms on one floor is mostly three, with thin walls. Due to the geographic location of Guangdong province and the climate characteristics, comprising high temperatures and rainy conditions in summer, and mild and humid conditions in winter, building windows are mostly sliding windows and the window area is large, which is conducive to ventilation and heat dissipation. Additionally, most of the windows are made of aluminium alloy to prevent oxidation and rusting due to excessive exposure to rainwater. The research found that about 71.5% of people use thermal insulation in their homes (as shown in Figure 2).

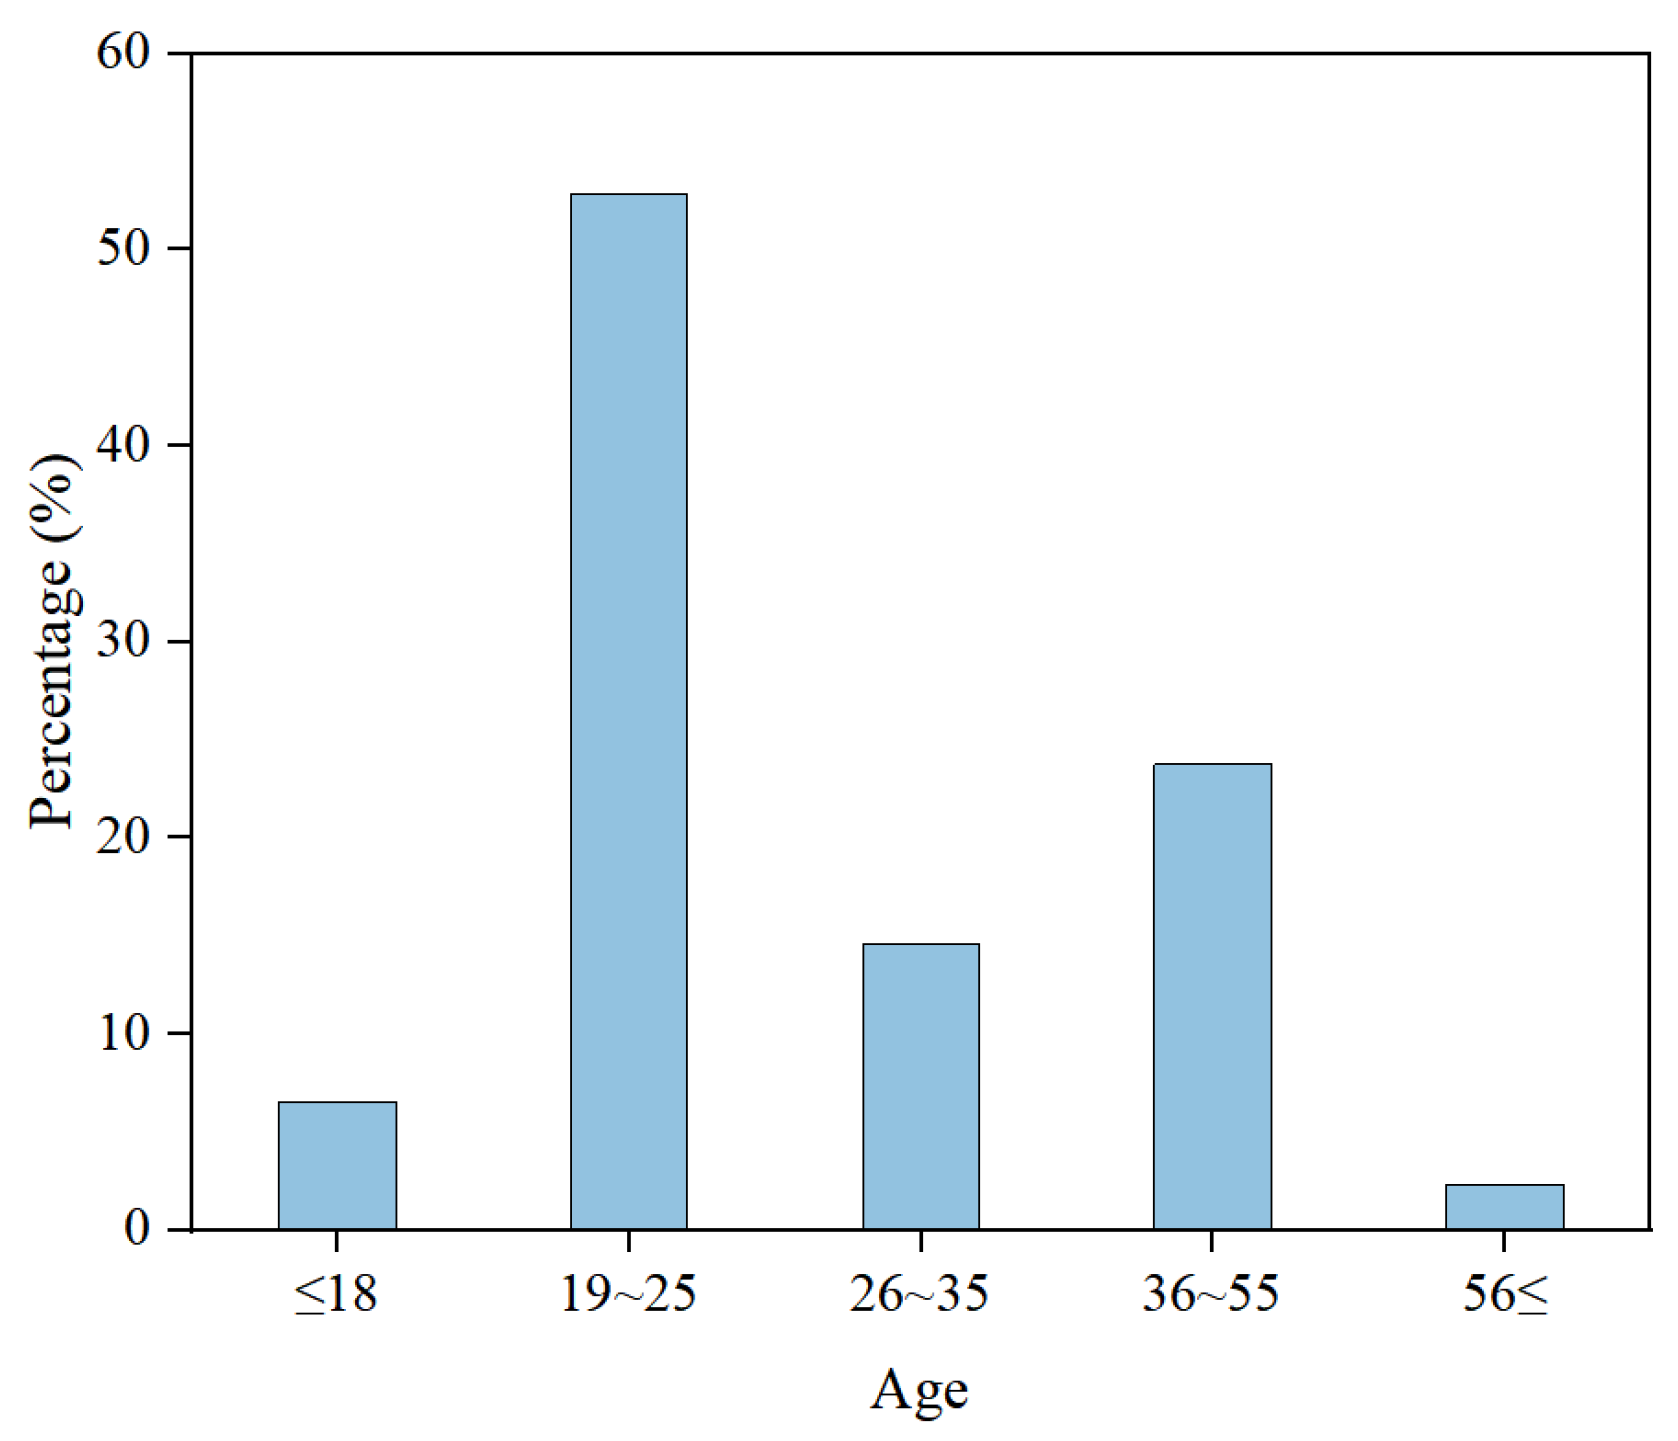
2.2. Target Population

The population of the survey was selected from rural residents who were born and have been living in the subtropical region for a long time, and the interviewees were randomly selected with a basic balance between men and women. The respondents were mainly young people (as shown in Figure 3), with most respondents being students aged 19–35, reflecting college students returning to their hometowns during summer vacation. Of the respondents aged 36–55, most worked as farmers in the countryside and worked outside to earn money.
Figure 4 shows that the resident population of residential buildings in Guangdong is family-oriented, consisting mainly of 4 to 6 persons. Among them, there are mostly 2 or 3 young adults, and 0 to 2 elderly people and teenagers, with only 1 or no children. It can be seen that the family population structure in the Guangdong area is complex and diverse, ranging from small families with three or two persons to large families with as many as nine persons.

2.3. Questionnaire

The questionnaire consists of the following two sections:
Section 1: Indoor Air Quality Assessment. Includes assessments for the bedroom, living room, and kitchen. Air quality is evaluated as neutral, stuffy, or odorous. Air quality satisfaction is assessed as dissatisfied, neutral, or satisfied.
Section 2: Indoor Environmental Assessment. Includes evaluations of the thermal environment, humidity levels, and airflow. Thermal environment is assessed as 1, Very cold; 2, Cold; 3, Cool; 4, Neutral; 5, Warm; 6, Hot; 7, Very hot. Humidity levels are assessed as 1, Very dry; 2, Dry; 3, Slightly dry; 4, Neutral; 5, Slightly damp; 6, Damp; 7, Very damp. Airflow levels are assessed as: 1, Very weak; 2, Weak; 3, Slightly weak; 4, Neutral; 5, Slightly strong; 6, Strong; 7, Very strong. Additionally, residents’ expectations for temperature, humidity, and airflow are considered. Each expectation is evaluated as 1, Decrease; 2, Unchanged; 3, Increase.

3. Results

3.1. Building Energy Consumption

3.1.1. Current Status of Energy Consumption in Residential Buildings Types of Energy Consumption

Household energy consumption in rural areas is mainly used for lighting equipment, household electrical appliances, and cooking equipment (as shown in Figure 5), of which lighting equipment and household electrical appliances mainly consume electricity, and cooking equipment consumes different types of energy due to the diversity of types. Common energy sources include electricity, natural gas, liquefied petroleum gas, firewood, biogas, and so on. Due to the unbalanced socio-economic development of rural areas in the province and different living habits in different places, there are some regional differences in the level and structure of energy consumption. In general, the survey shows (as shown in Figure 6) that the energy consumption of rural households is mainly natural gas, except for electricity.

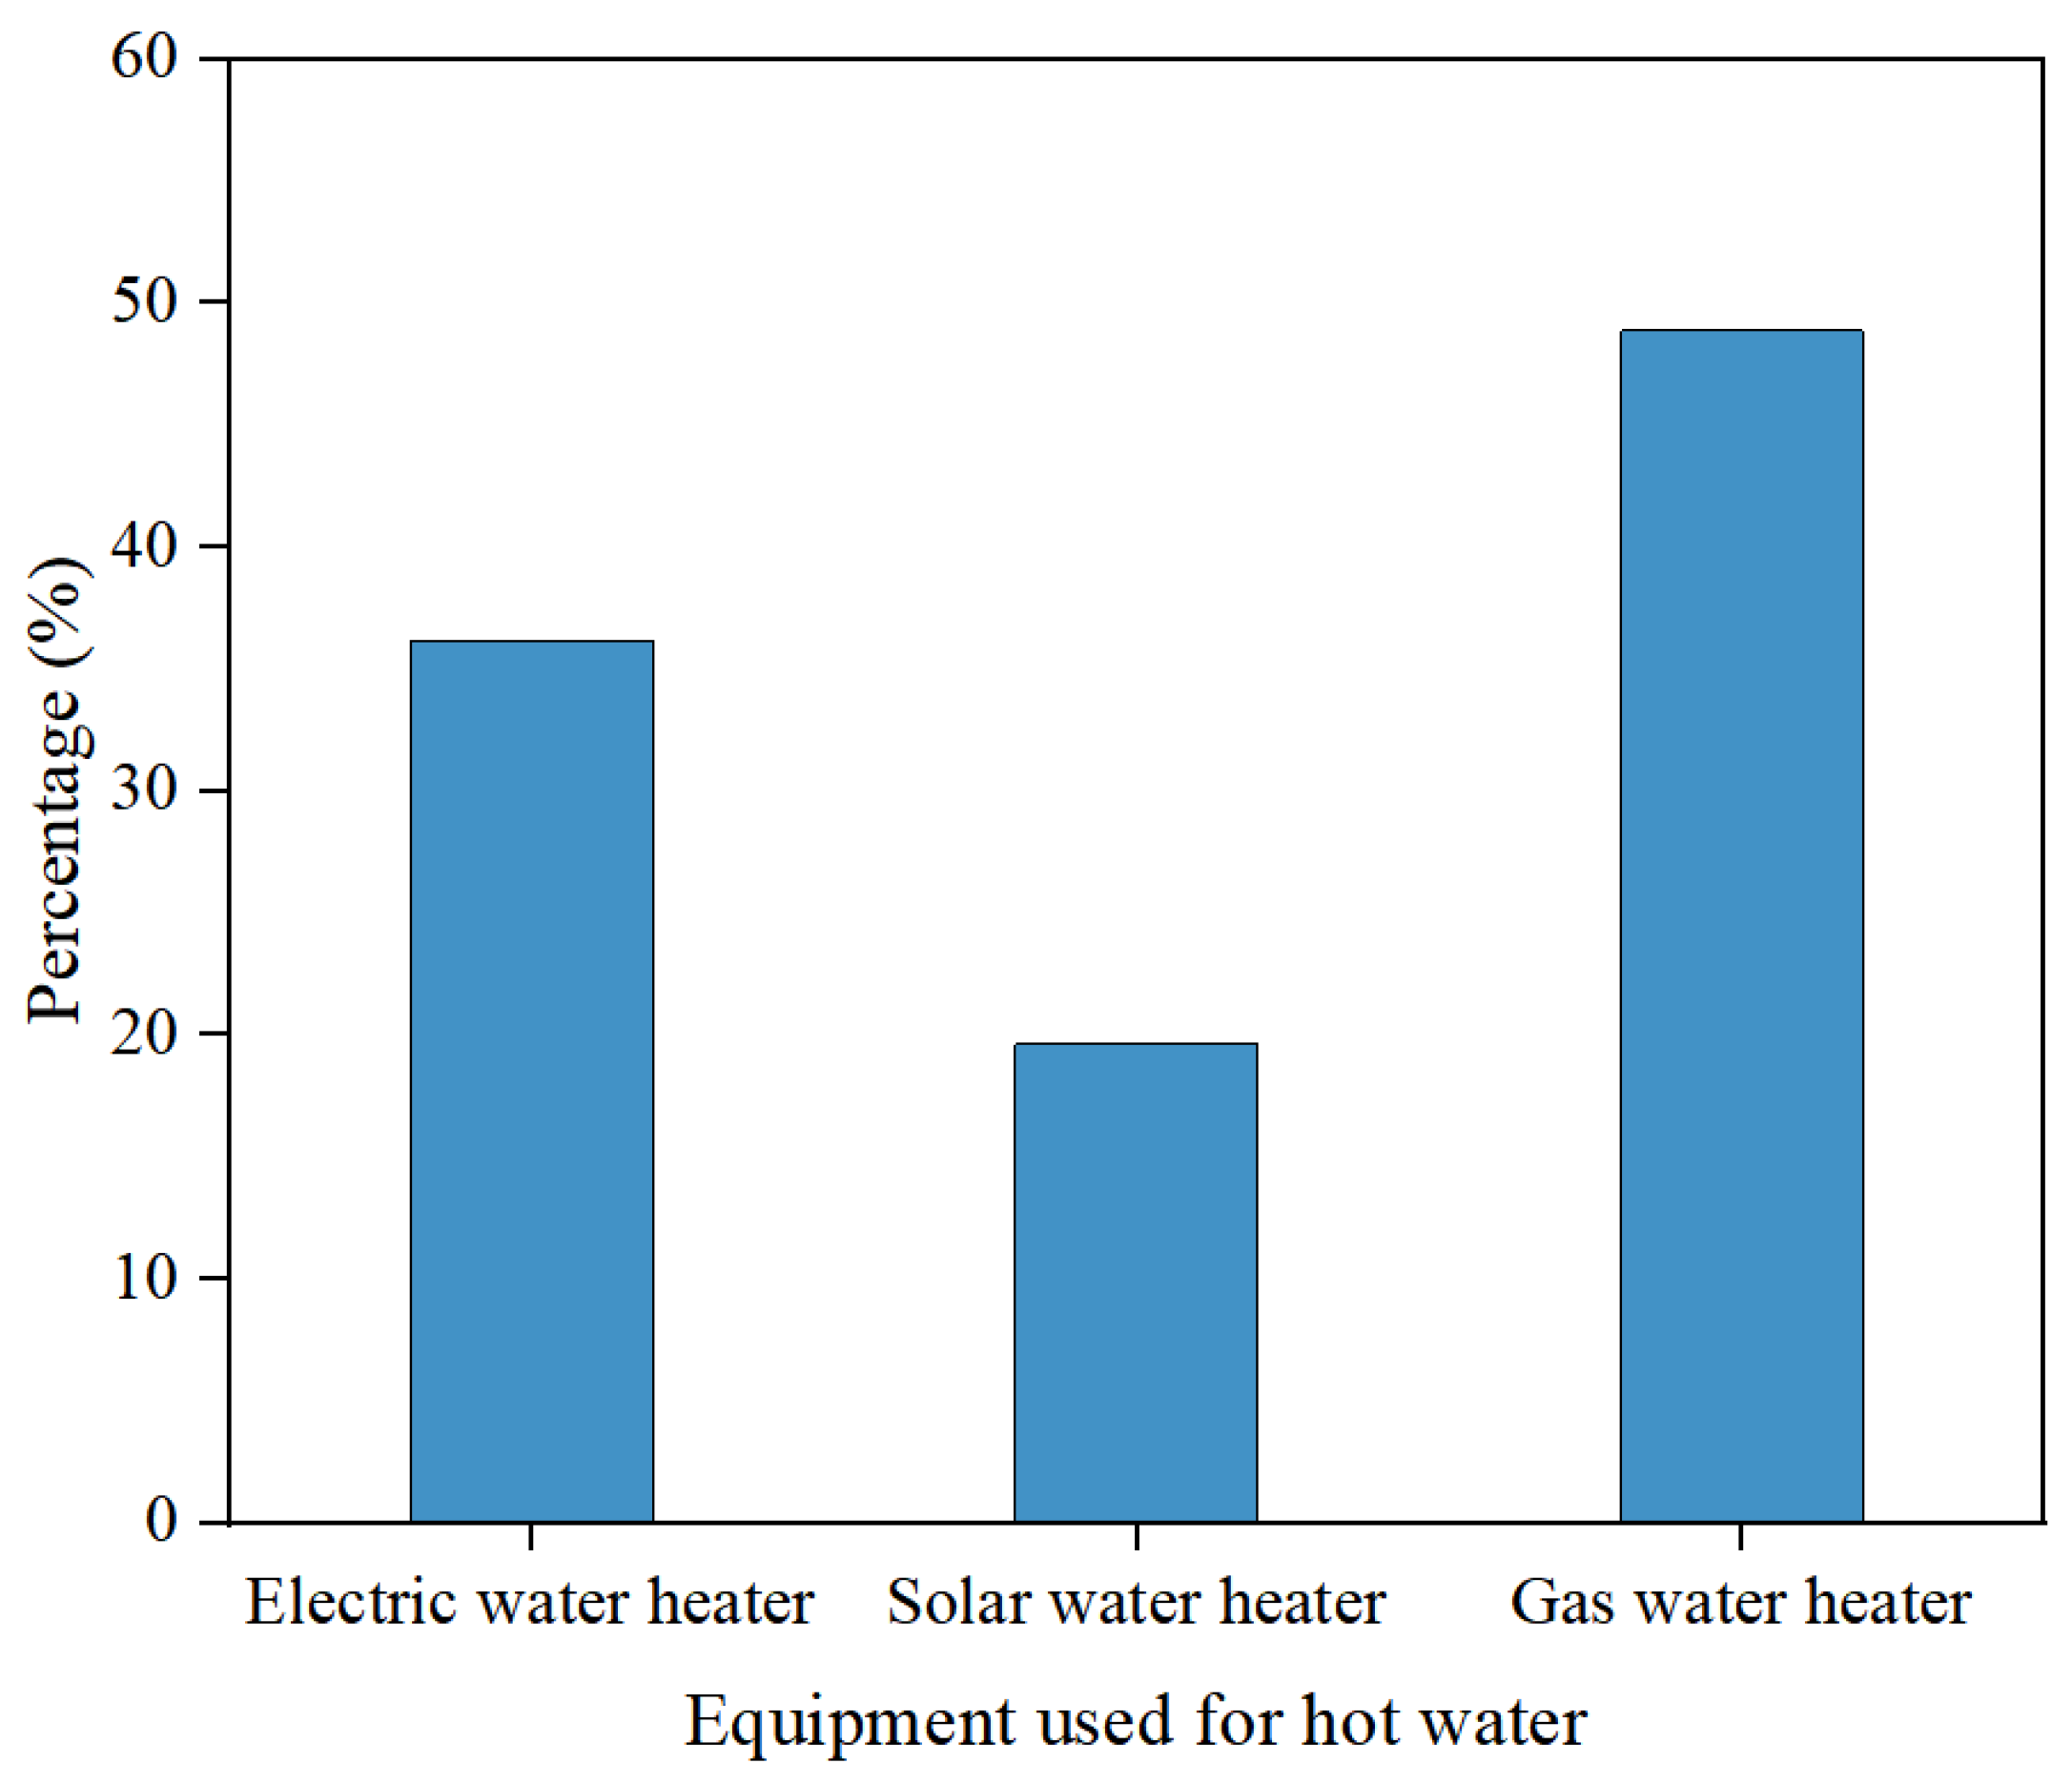
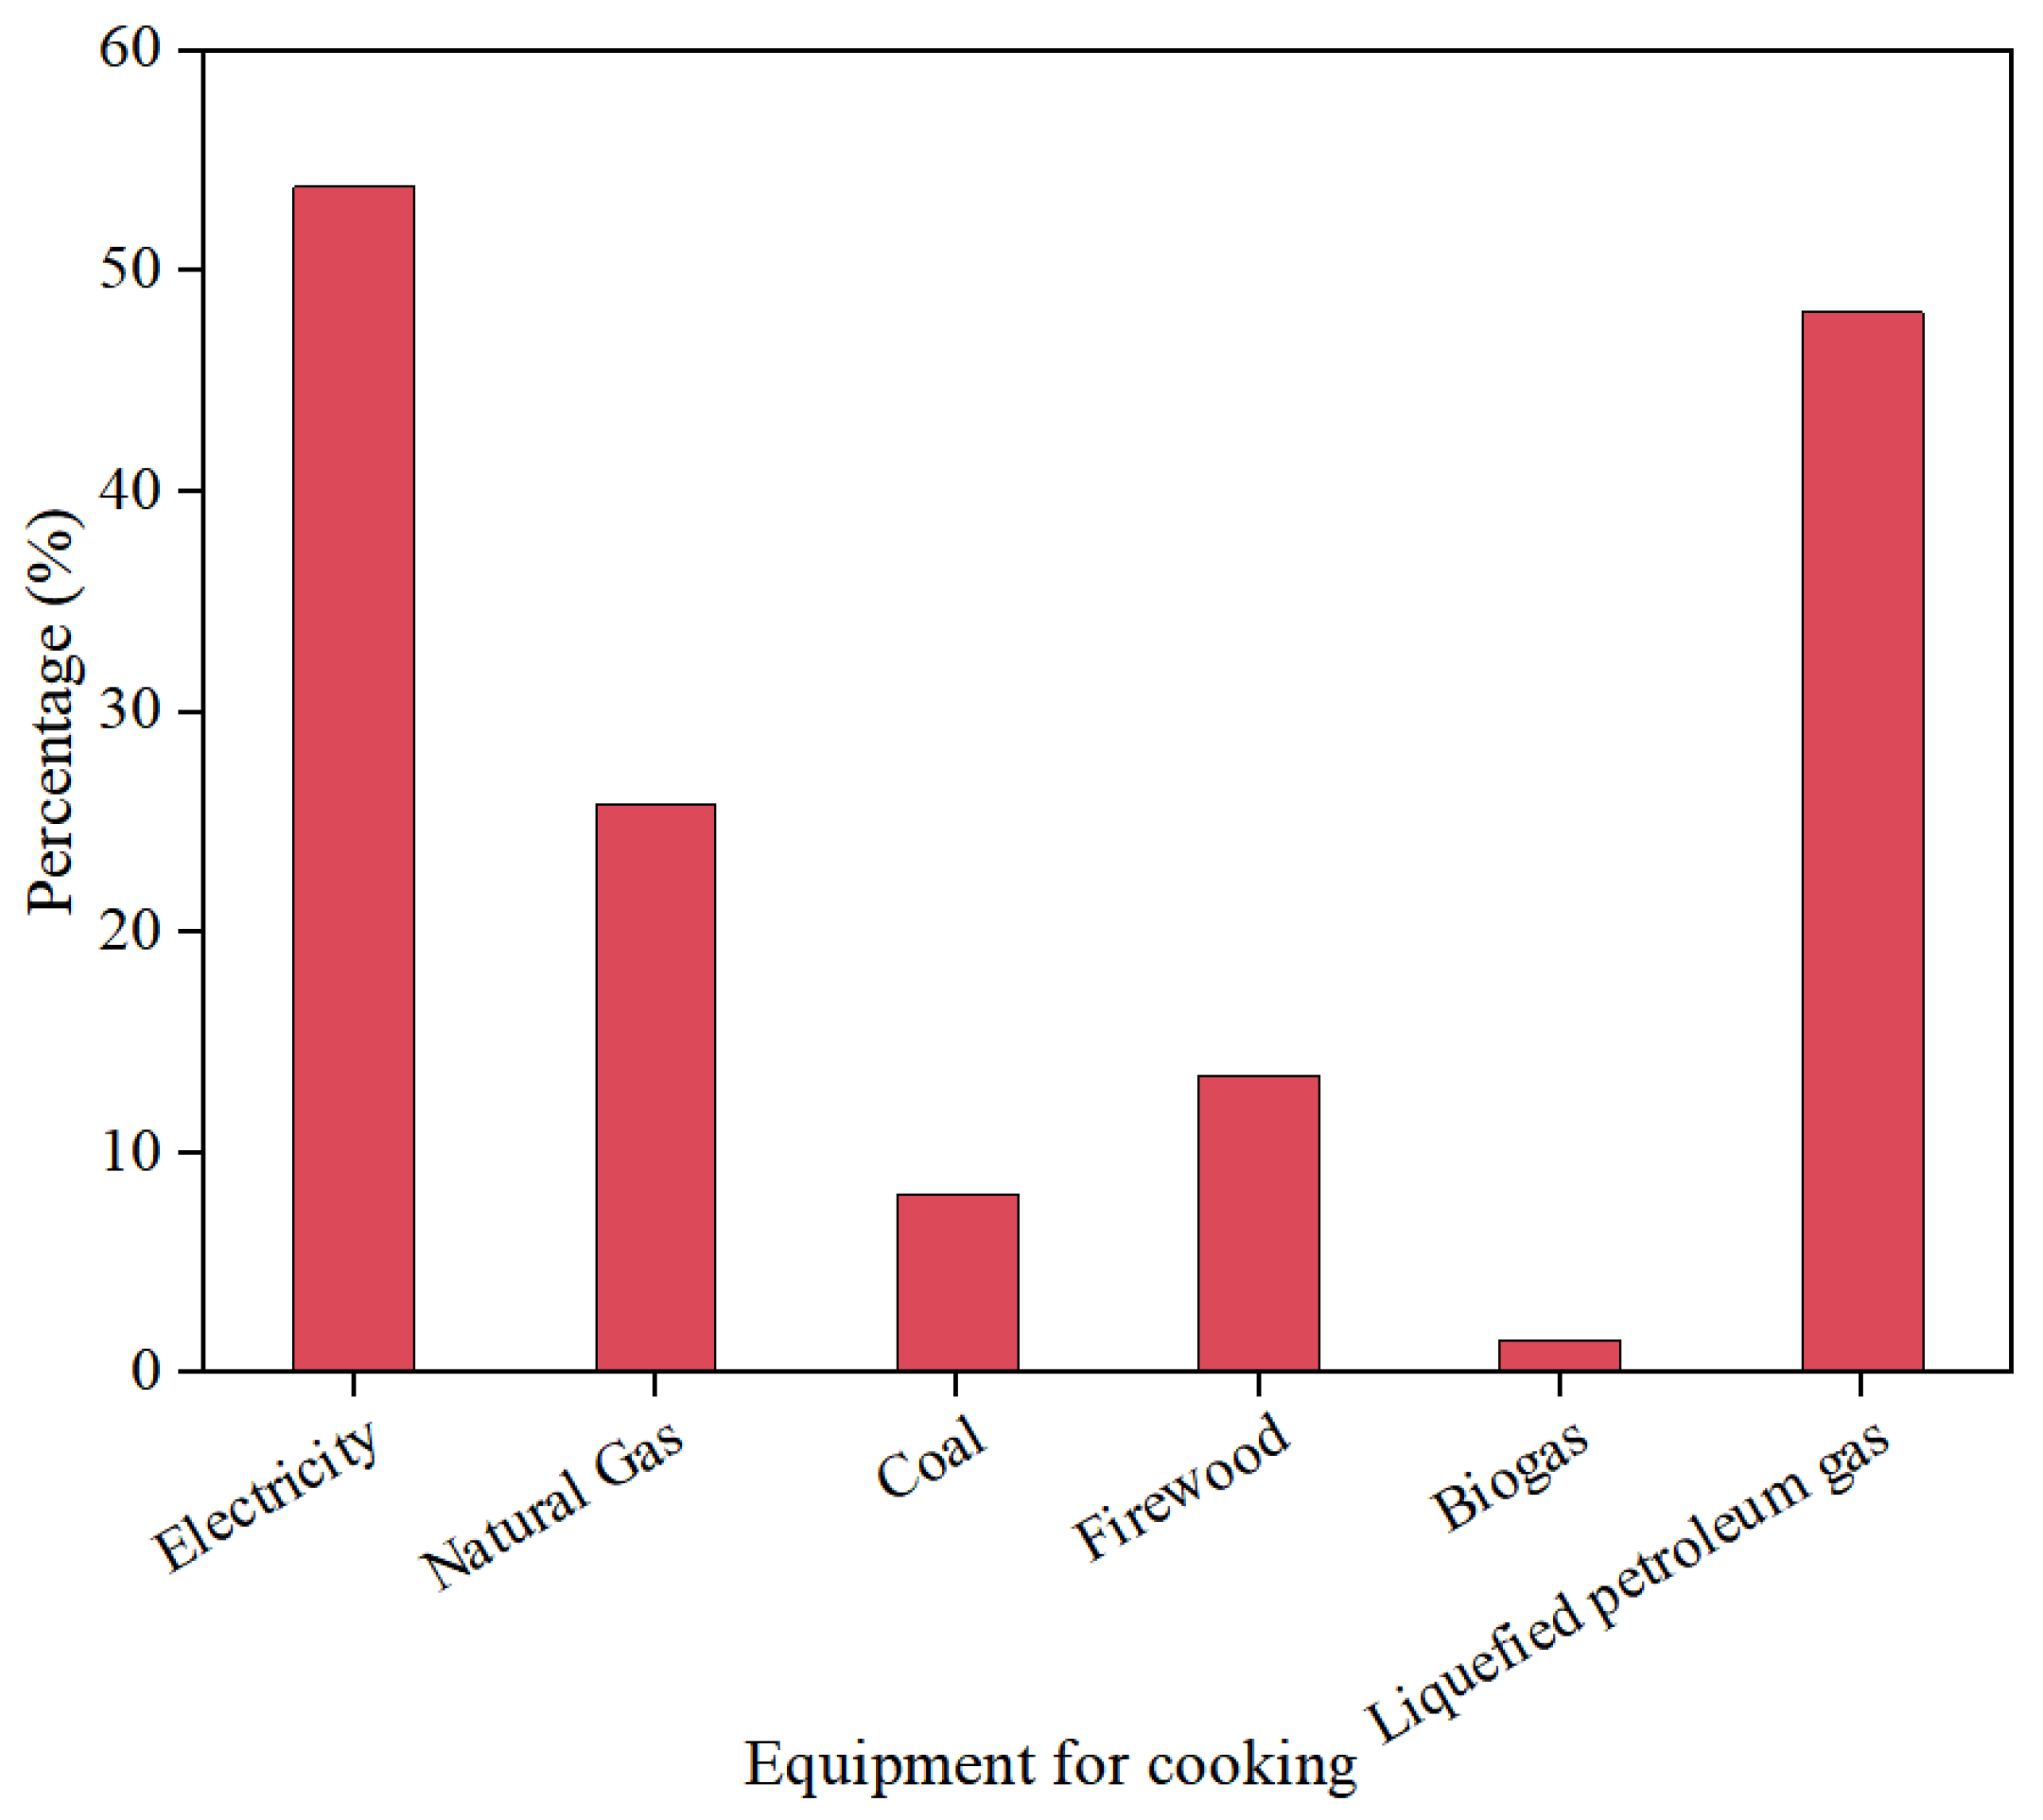
3.1.2. Cooking and Hot Water Energy Consumption

Cooking and hot water supply maintain people’s daily life and food and are the main energy consumption in rural areas in general. As shown in Figure 7, hot water is mainly obtained by heating with electricity and natural gas, and solar heating accounts for a minority of residents, because solar energy is greatly affected by the weather and cannot be used when it rains or is cloudy. As shown in Figure 8, the main sources of energy used for cooking are electricity and liquefied petroleum gas, and the electrical appliances are electric rice cookers and induction cookers, which are more popular because they are less difficult to obtain and cleaner. Due to the living environment, some residents use firewood for cooking. Less than 10% use coal and biogas.

3.1.3. Building Air Conditioning Energy Consumption

Through the research, it was found that in the summer, residents do not use air conditioning during the daytime, and, therefore, air conditioning energy consumption is relatively small. This is because residents mostly use open windows for natural ventilation, supplemented by fans as a form of mechanical ventilation. Families with a high percentage of teenagers in their homes consume more energy for air conditioning. Elderly people in rural areas usually use fans to achieve a cooling effect. In addition, many people indicated that if there are only three floors, the third floor because there is only the roof above, becomes very warm, to the point where the flow of air from a fan becomes inadequate to cool the temperature. At this time, you need to turn on the air conditioning to increase airflow and lower the indoor temperature. Therefore, it is necessary to study the roof insulation and solar energy utilization.

3.2. Indoor Environmental Quality Assessment
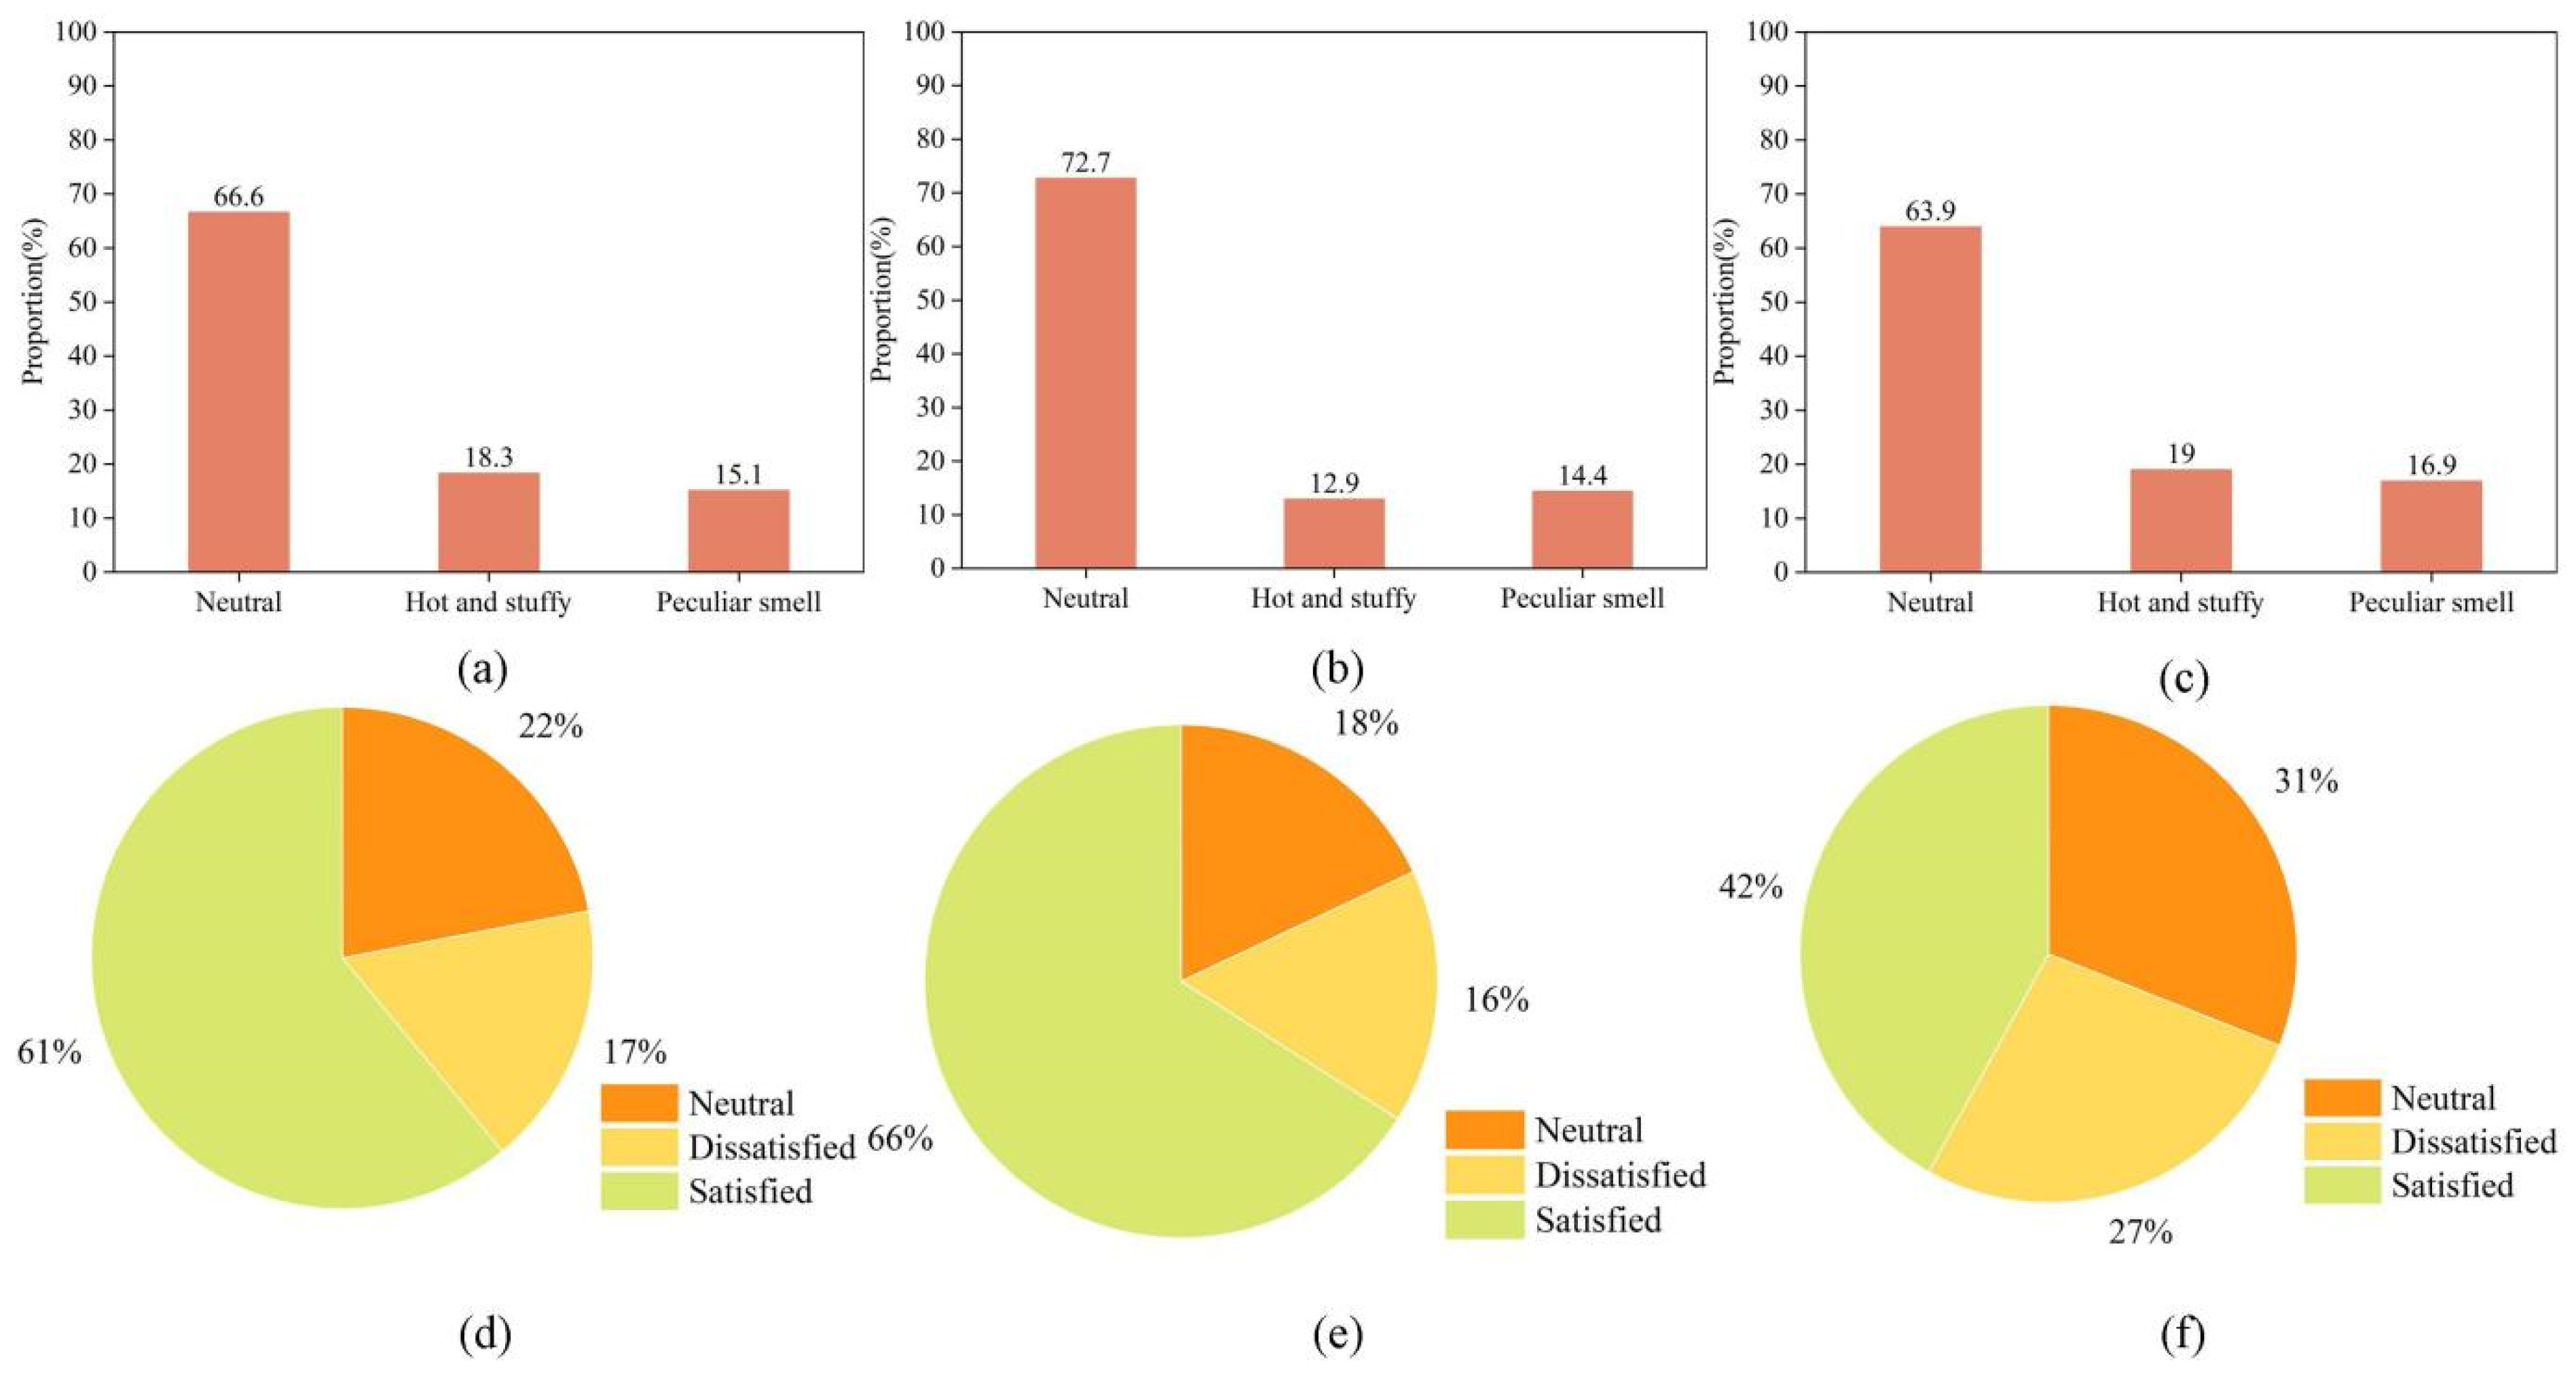
3.2.1. Air Quality

As shown in Figure 9, 66.6% of respondents perceived the air in their bedrooms as odorless, while 18.3% found it stuffy, and 15.1% reported noticeable odors. Among them, 61% were satisfied with the air quality, 22% felt neutral, and 17% were dissatisfied. In the living room, the majority of respondents considered the air quality to be good, and a significant proportion expressed satisfaction with it. The increased airflow generated by fans helps dissipate excess indoor heat. In rural areas, many households are surrounded by open spaces such as courtyards and trees, which facilitate better air exchange and enhance indoor air quality. During field visits, it was observed that residents living in tightly packed spaces without nearby trees were more likely to express dissatisfaction with their environment. In contrast, those who installed thermal insulation materials in their homes generally rated their environment more favorably. Additionally, rural residences are typically more spacious and open, allowing for sufficient airflow exchange, which contributes to a more comfortable indoor environment. It was also found that residents living in single-story houses or above the second floor reported experiencing a more stuffy environment during summer. Regarding kitchen air quality, over 60% of residents stated that their kitchens were odor-free. However, some found them stuffy, and a small proportion reported the presence of cooking fumes. In terms of kitchen structure, it is believed that kitchens are relatively enclosed, with poor ventilation performance. Most households do not install high-quality ventilation systems, leading to poor air circulation. Furthermore, cooking generates a significant amount of heat, exacerbating the issue of stuffiness. The presence of cooking fumes also depends on cooking methods and fuel types. Some households use firewood or straw as fuel, which, without an adequate exhaust system, can produce additional smoke. Although the majority did not report noticeable odors, more than half were dissatisfied with the kitchen’s air environment, warranting further investigation into the specific causes.

3.2.2. Thermal Environment Quality

As shown in Figure 10, 27.6% of respondents perceived the indoor thermal environment as neutral, while 27.1% and 19.7% felt hot and very hot, respectively. Regarding temperature preferences, 41% of respondents wished for a lower indoor temperature, whereas 40% preferred no change. In terms of indoor humidity, 36.1% of respondents considered it to be just right, while 11.7% found it excessively humid, and 2% felt it was too dry. When asked about their humidity preferences, 48% wished for no change, whereas 25% desired higher humidity and 27% preferred lower humidity levels. Regarding indoor airflow, 34.3% of respondents felt the airflow was just right, while 13.5% considered it too strong. Almost no one (only 0.5%) found the airflow to be weak. When it came to preferences, 52% of respondents wanted the airflow speed to remain unchanged, 46% preferred stronger airflow, and only 2% desired weaker airflow. From these findings, it can be concluded that residents of subtropical rural areas generally perceive indoor conditions as slightly hot, humid, and with a relatively strong airflow. A smaller proportion of residents find the indoor temperature moderate, humidity slightly dry, and airflow slightly weak, while only a minimal number of residents feel cold indoors. The primary reason for these perceptions lies in the climatic characteristics of subtropical regions, where summer temperatures are high, moisture exchange is intense, and rainfall and typhoons are frequent. Additionally, rural residents tend to use air conditioning infrequently, resulting in lower energy consumption from cooling. Instead, they primarily rely on natural ventilation through open windows, supplemented by mechanical ventilation using fans. Consequently, residents predominantly experience a warm, humid indoor environment with a noticeable airflow.

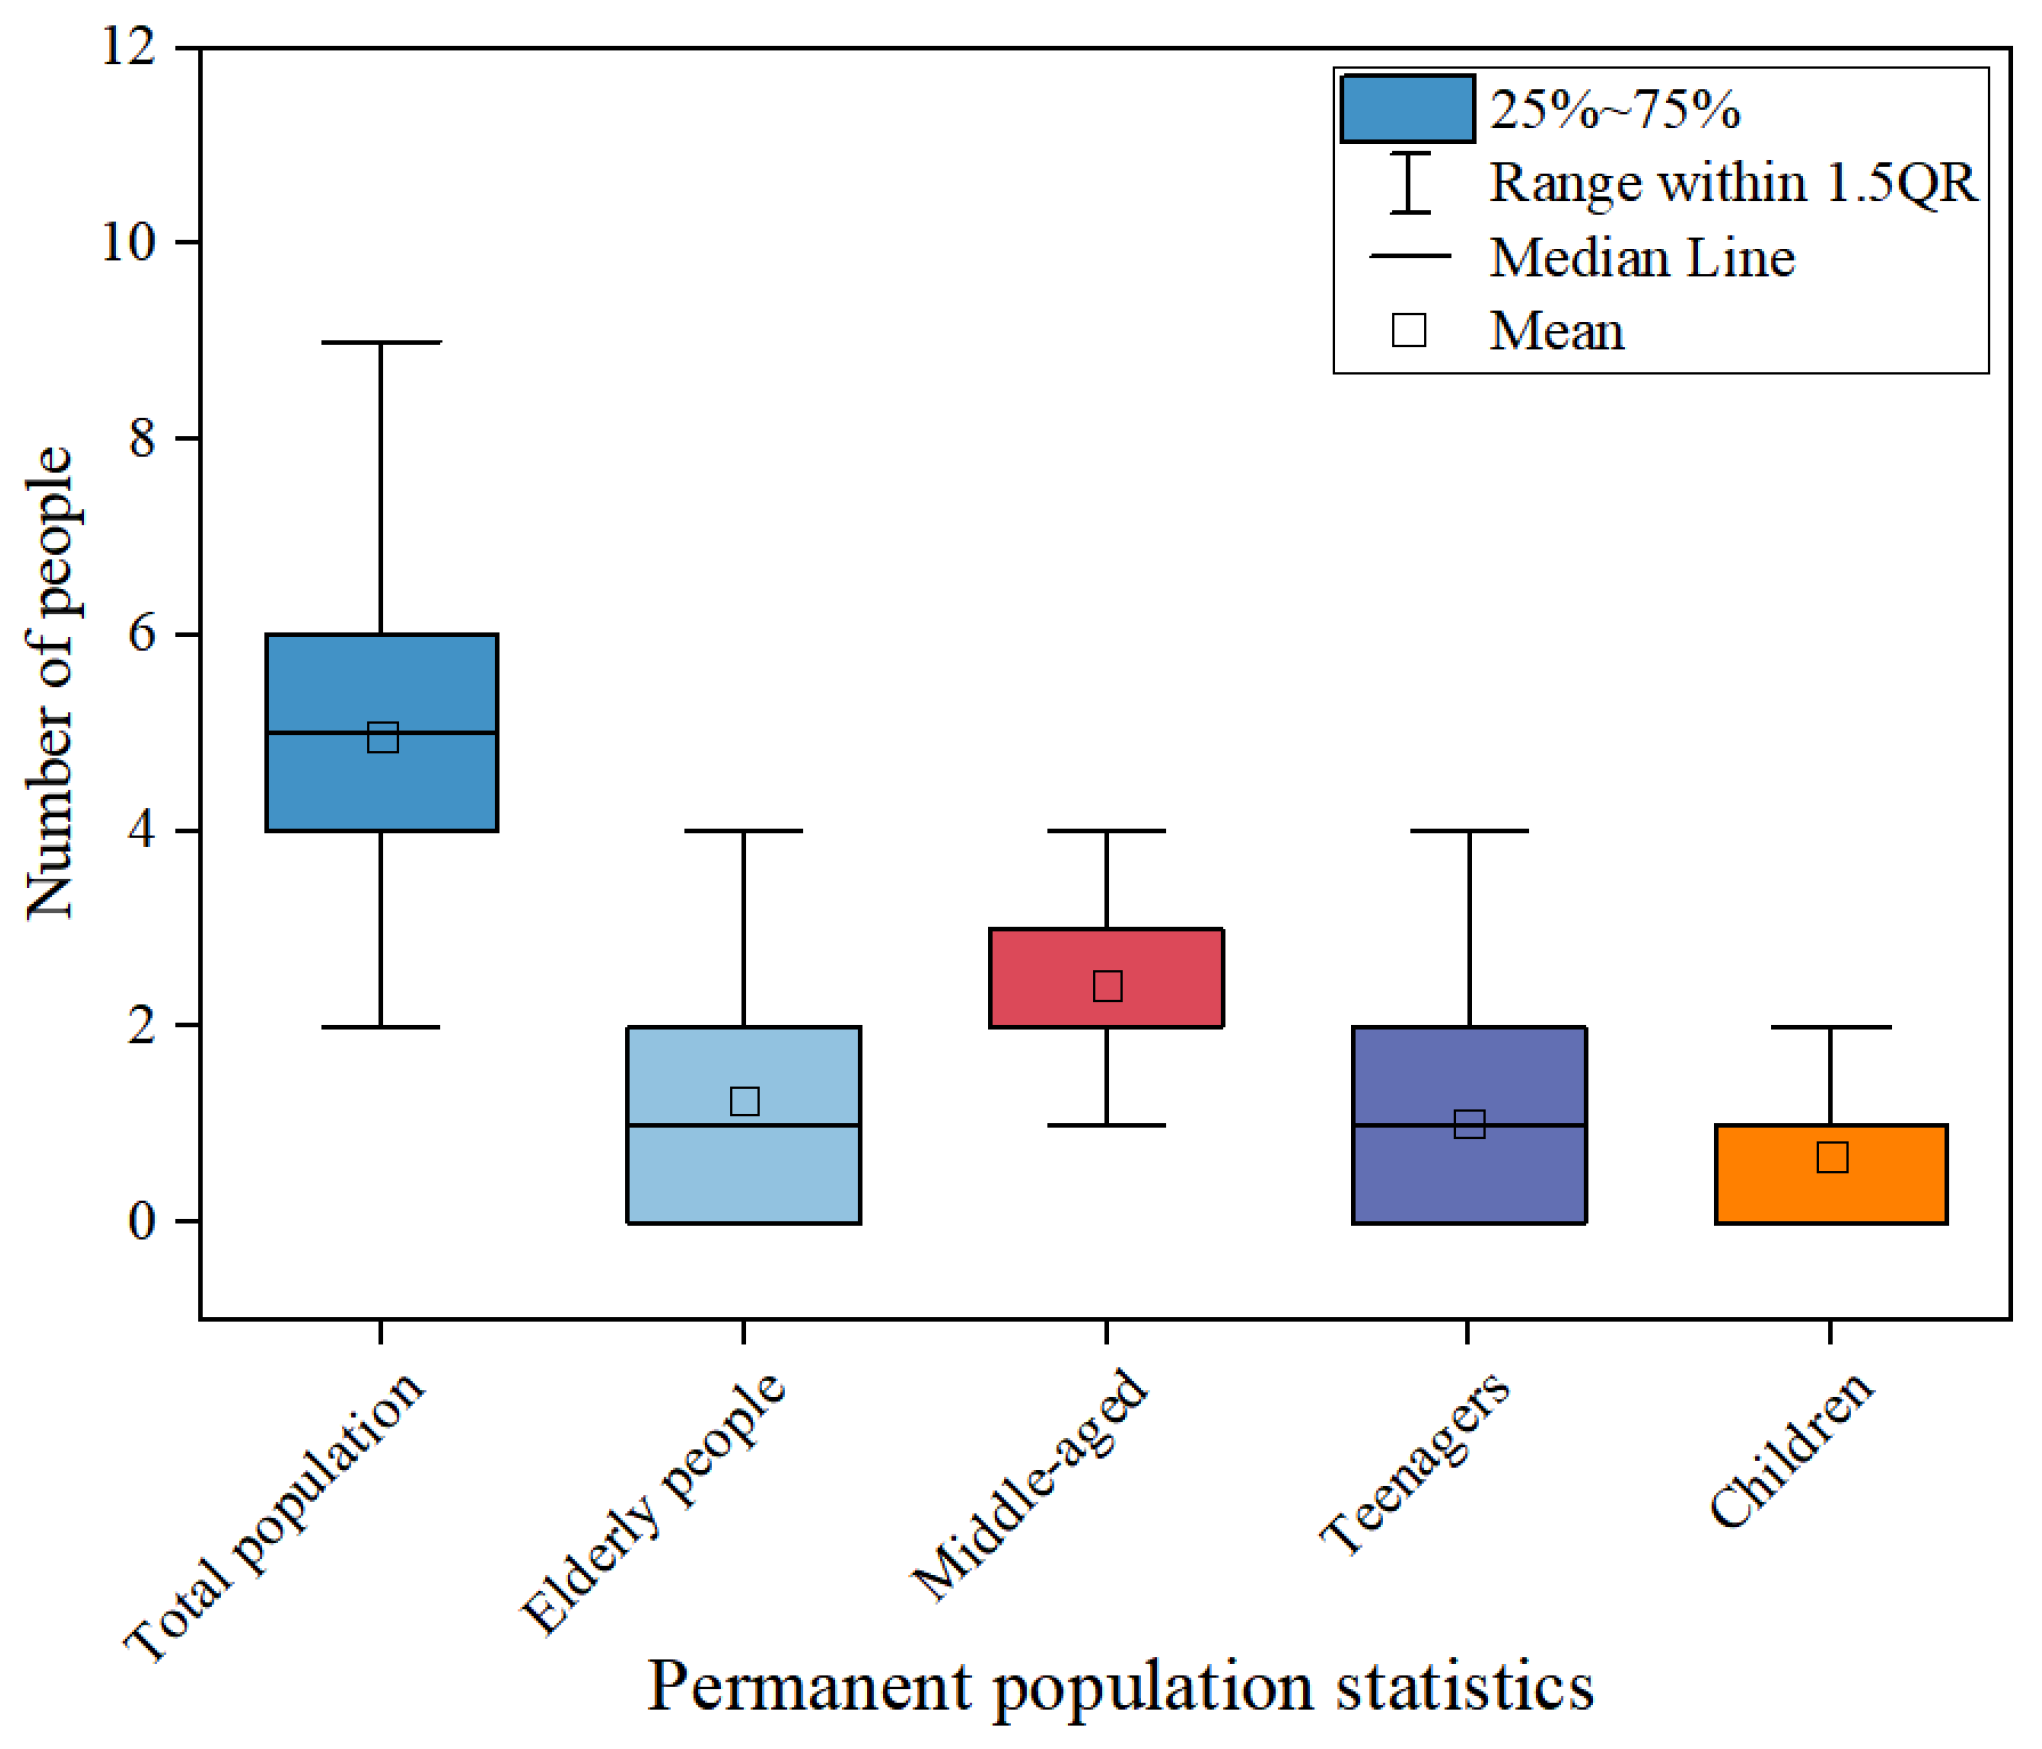
3.3. Statistics on the Income Level of the Population

As shown in Figure 11, the higher the income of the residents, the higher the consumption level, which leads to a higher consumption of building energy. Because families with high income levels usually buy a variety of appliances, and their working lives are also busier, they choose more convenient and faster appliances, such as washing machines, induction cookers, hair dryers, and so on. These appliances also consume more electricity. The total energy consumed in a year is more than that consumed by families with low levels of consumption and low levels of income.

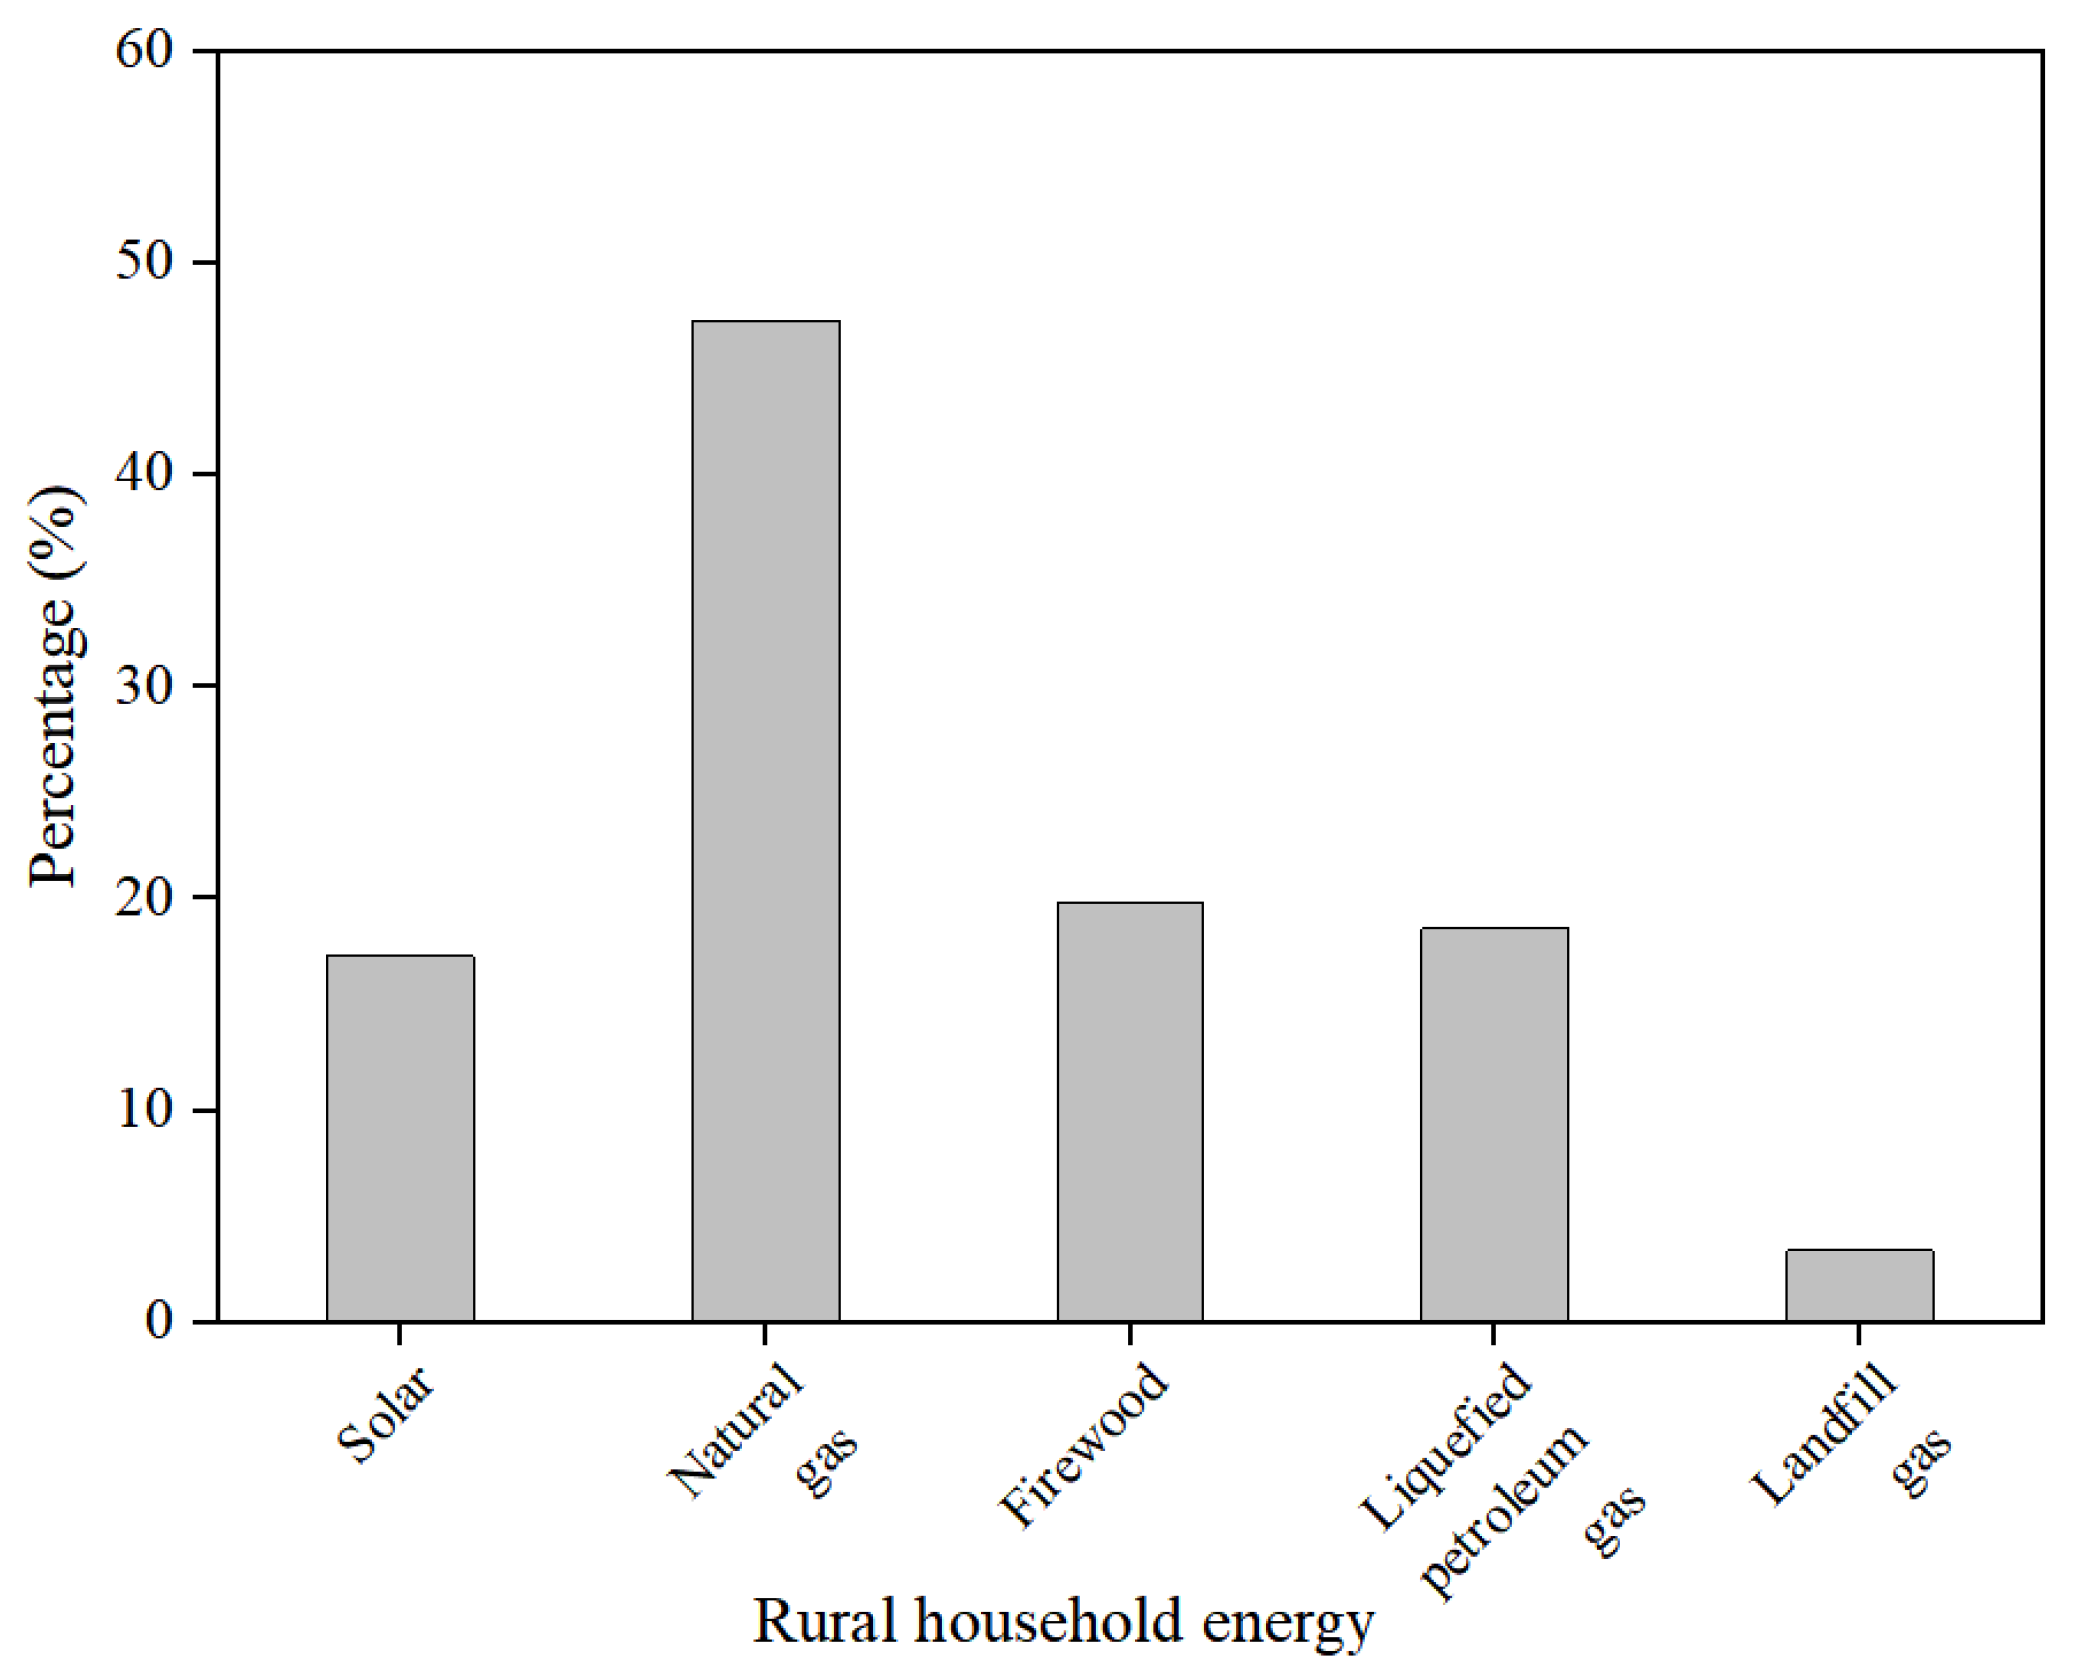
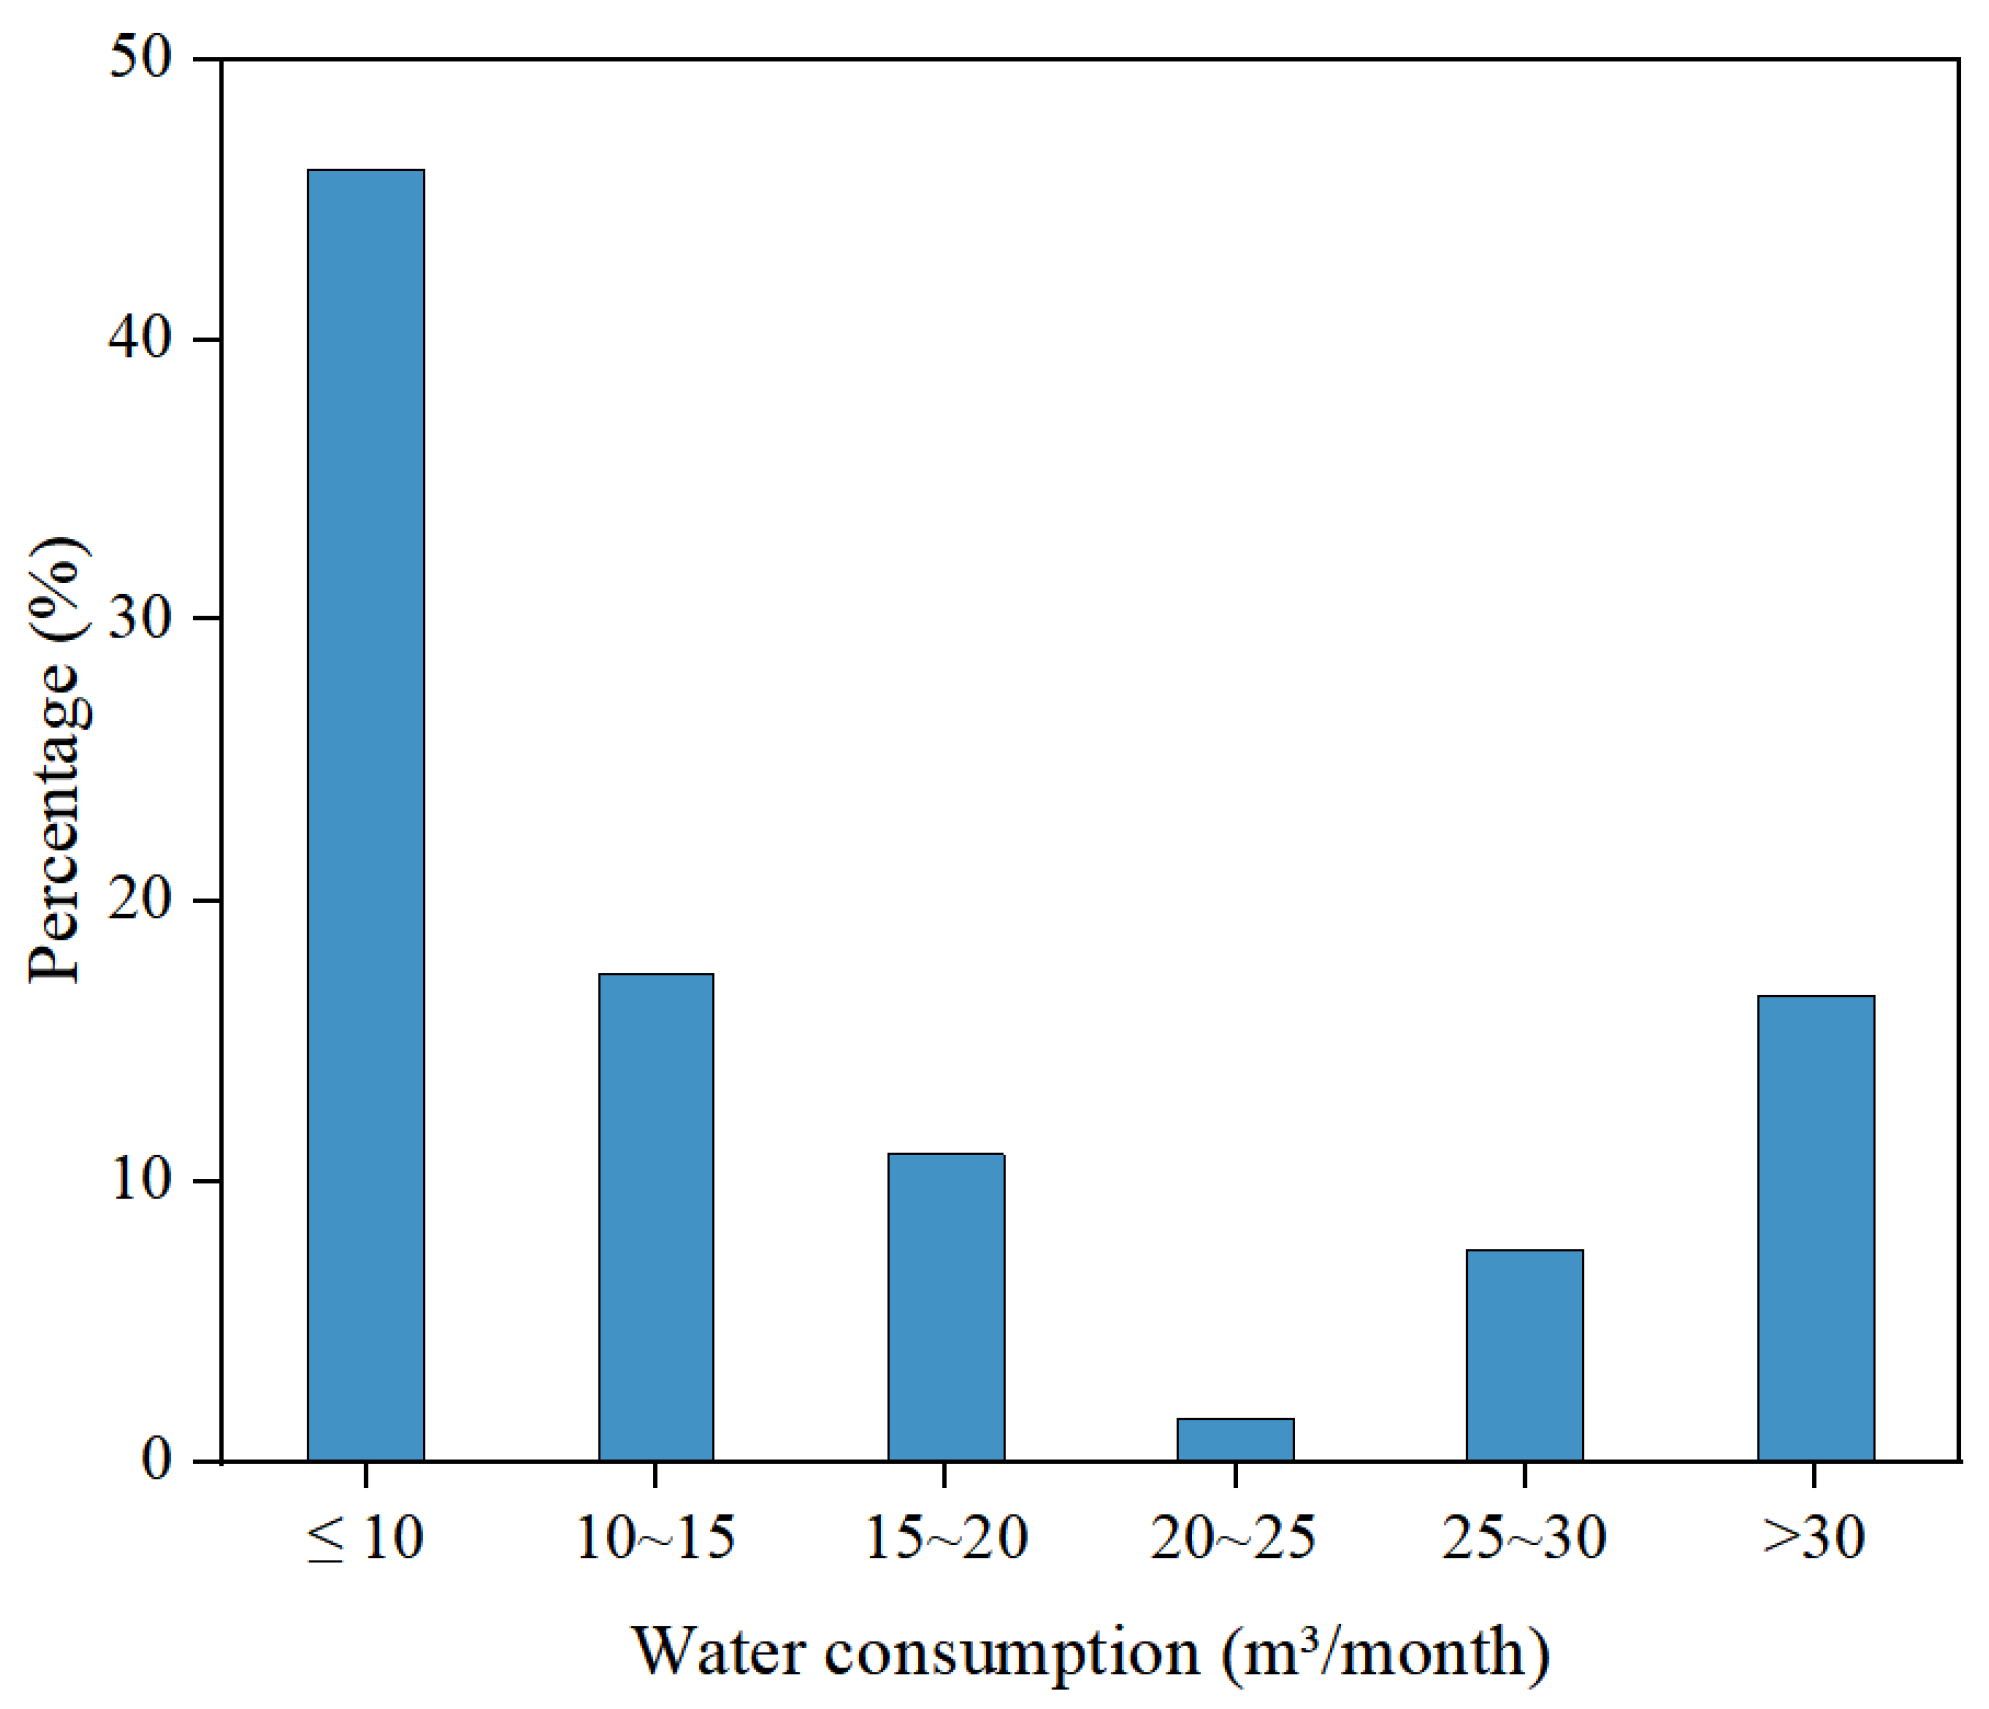
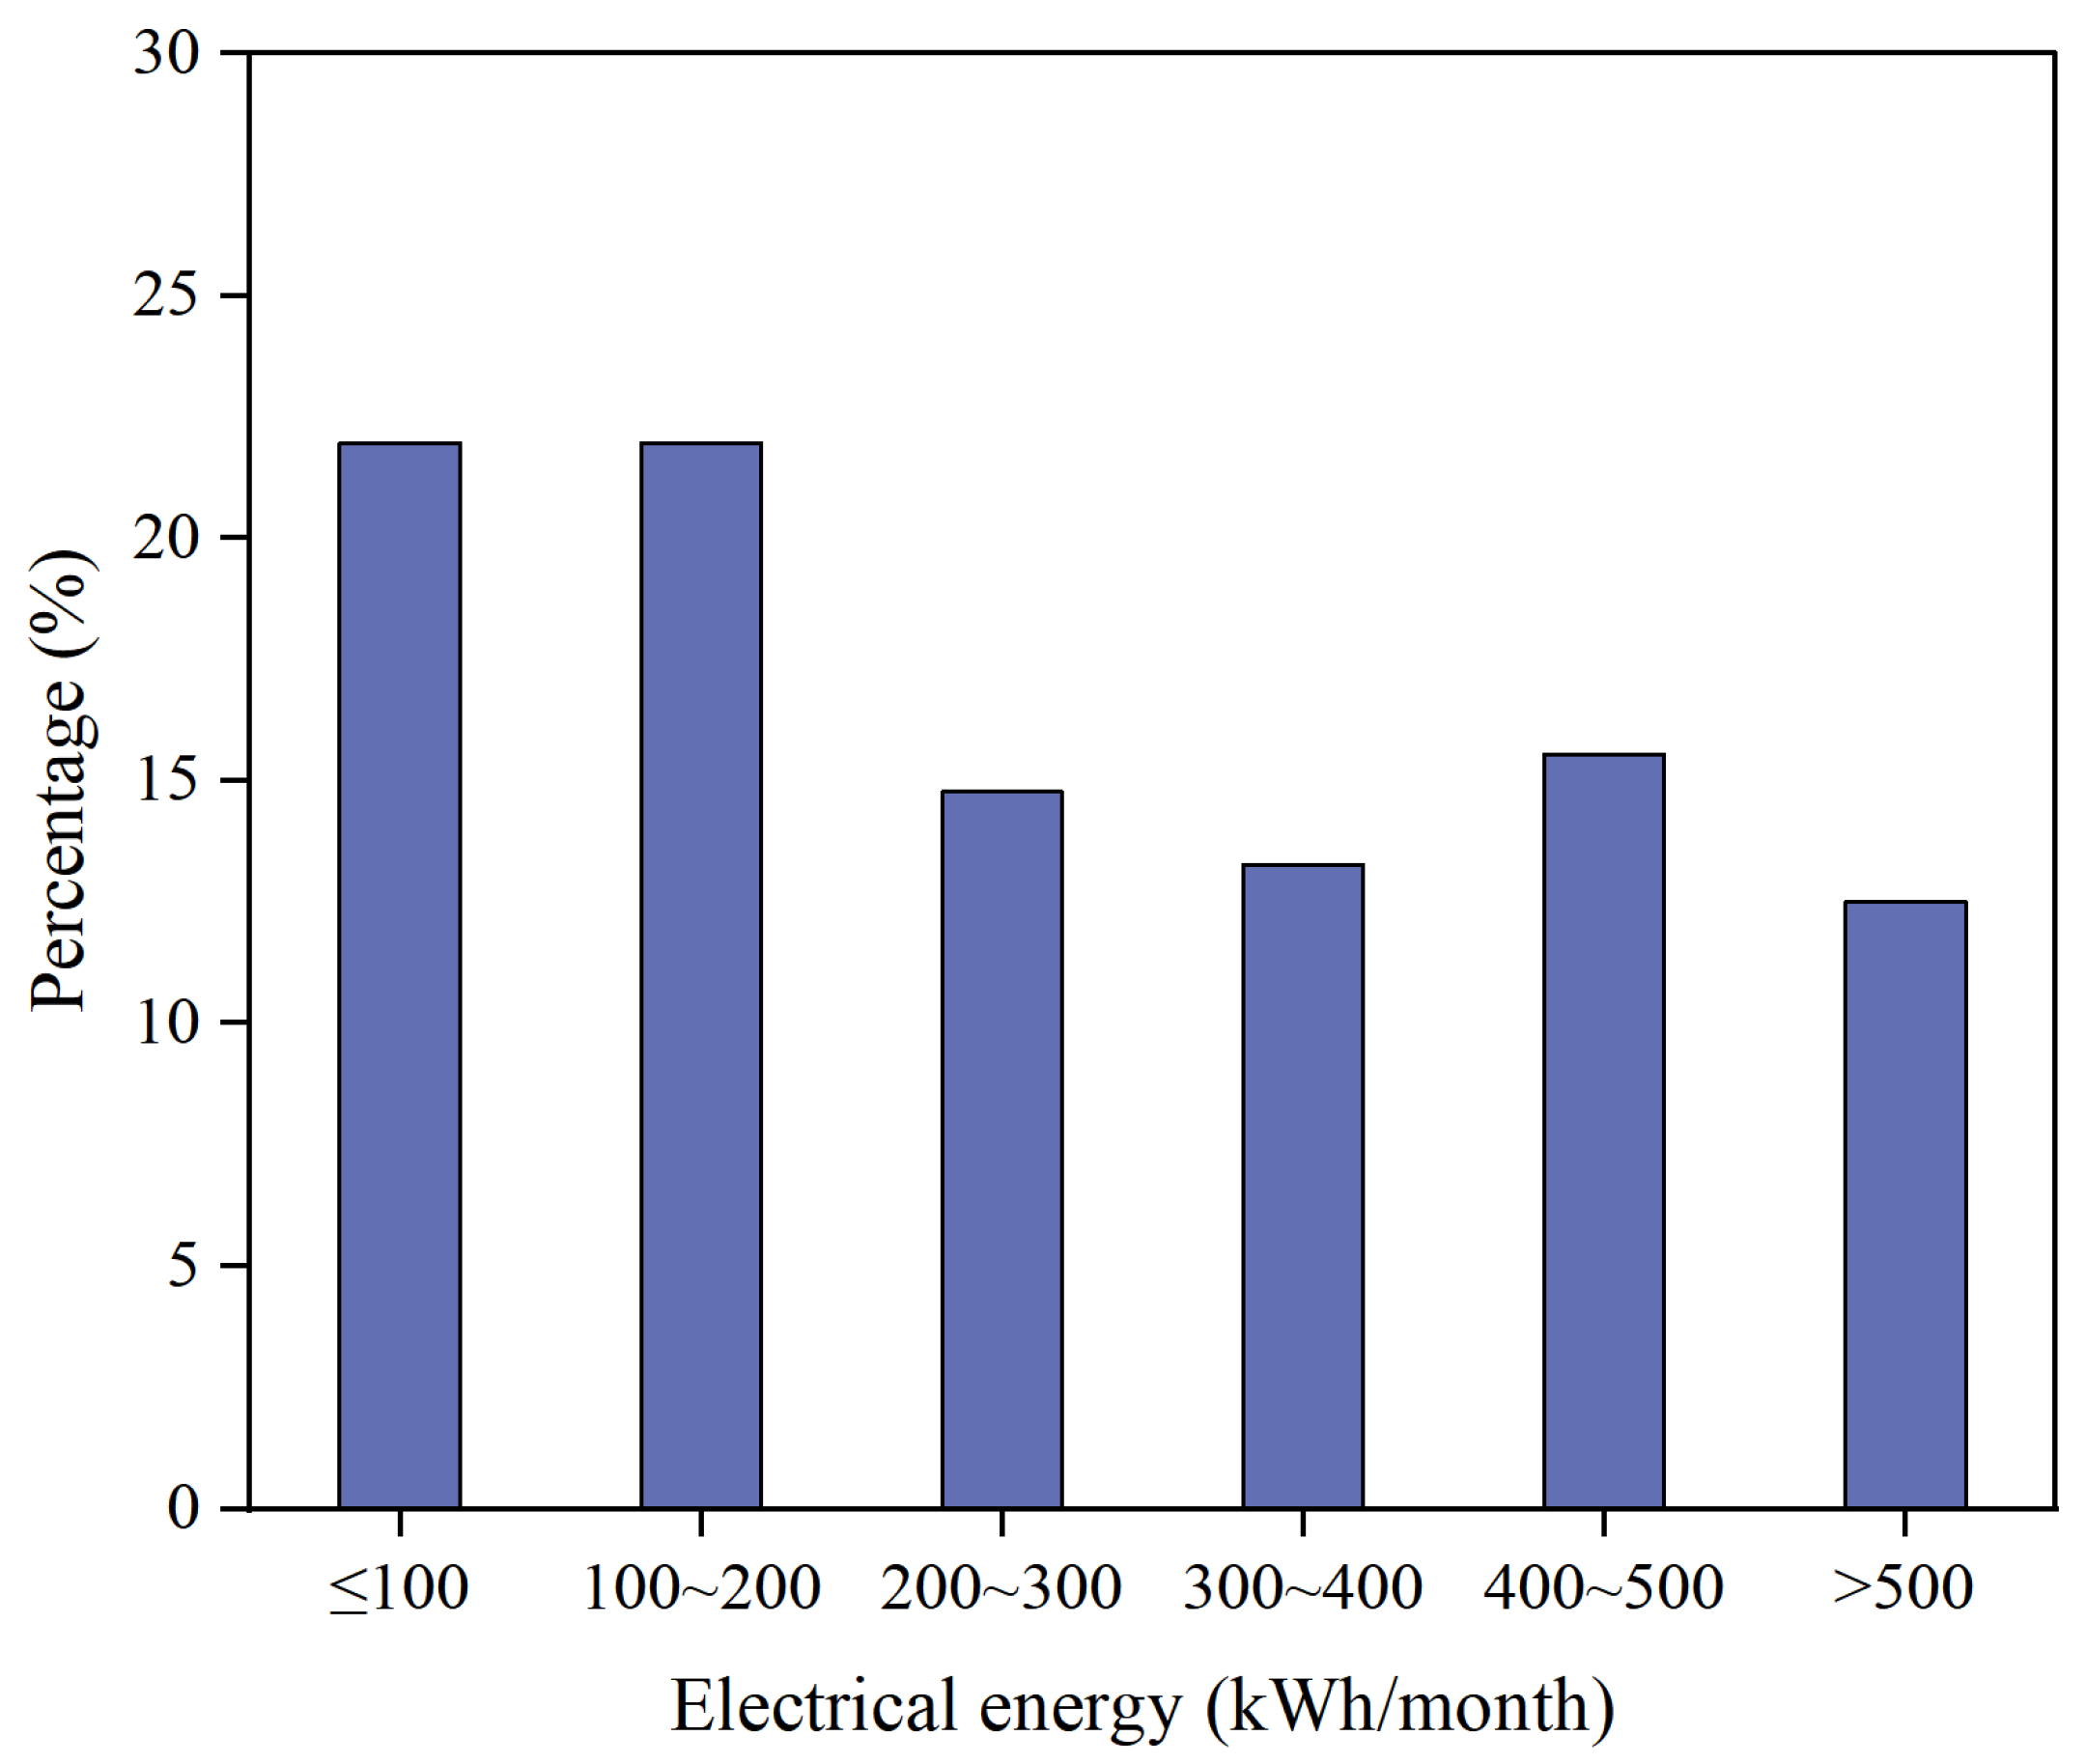
3.4. Statistics on Residential Energy Use

The utilities used by rural residents are generally water, gas, and electricity. As shown in Figure 12, the proportion of residents’ monthly water consumption varies greatly, with up to 45% of residents using less than 10 cubic meters of water per month, while the number of residents using 10–15 cubic meters of water per month and those using more than 30 cubic meters of water per month are similar, accounting for about 18% of the total, and the proportion of the number of people who use 15–20 cubic meters of water per month and those who use 25–30 cubic meters of water per month are on a decreasing trend, accounting respectively for 10% and 8%. The smallest proportion is the residents who use 20–25 cubic meters of water per month, accounting for only about 3% of the total.
From Figure 13, it can be seen that the number of people whose monthly gas usage is 10–15 m3 accounted for about 25% of the surveyed households, the number of people who use 20–30 m3 accounted for about 19%, and the number of households whose gas usage is more than 30 m3 is fewer than 30%. Close to 30% of the households are using less than 10 m3 of gas, probably because in rural areas it is possible to use firewood to boil water for bathing or to use more electricity for cooking.
Residents’ monthly electricity consumption varies according to individual household situations, seasons, family members, and living habits. Here are some general references: For a small household, the monthly electricity consumption is usually between 100–300 kWh. For a medium-sized household, the monthly electricity consumption may range from 300–800 kWh. For large households or households with energy-intensive equipment (e.g., air conditioners, swimming pool heaters, etc.), monthly electricity consumption may exceed 800 kWh. As can be seen from Figure 14, about 60% of the residents use less than 300 kWh of electricity per month, and this segment is dominated by small households. About 40% of the residents use more than 300 kWh of electricity per month, and this segment consists mainly of medium and large households.

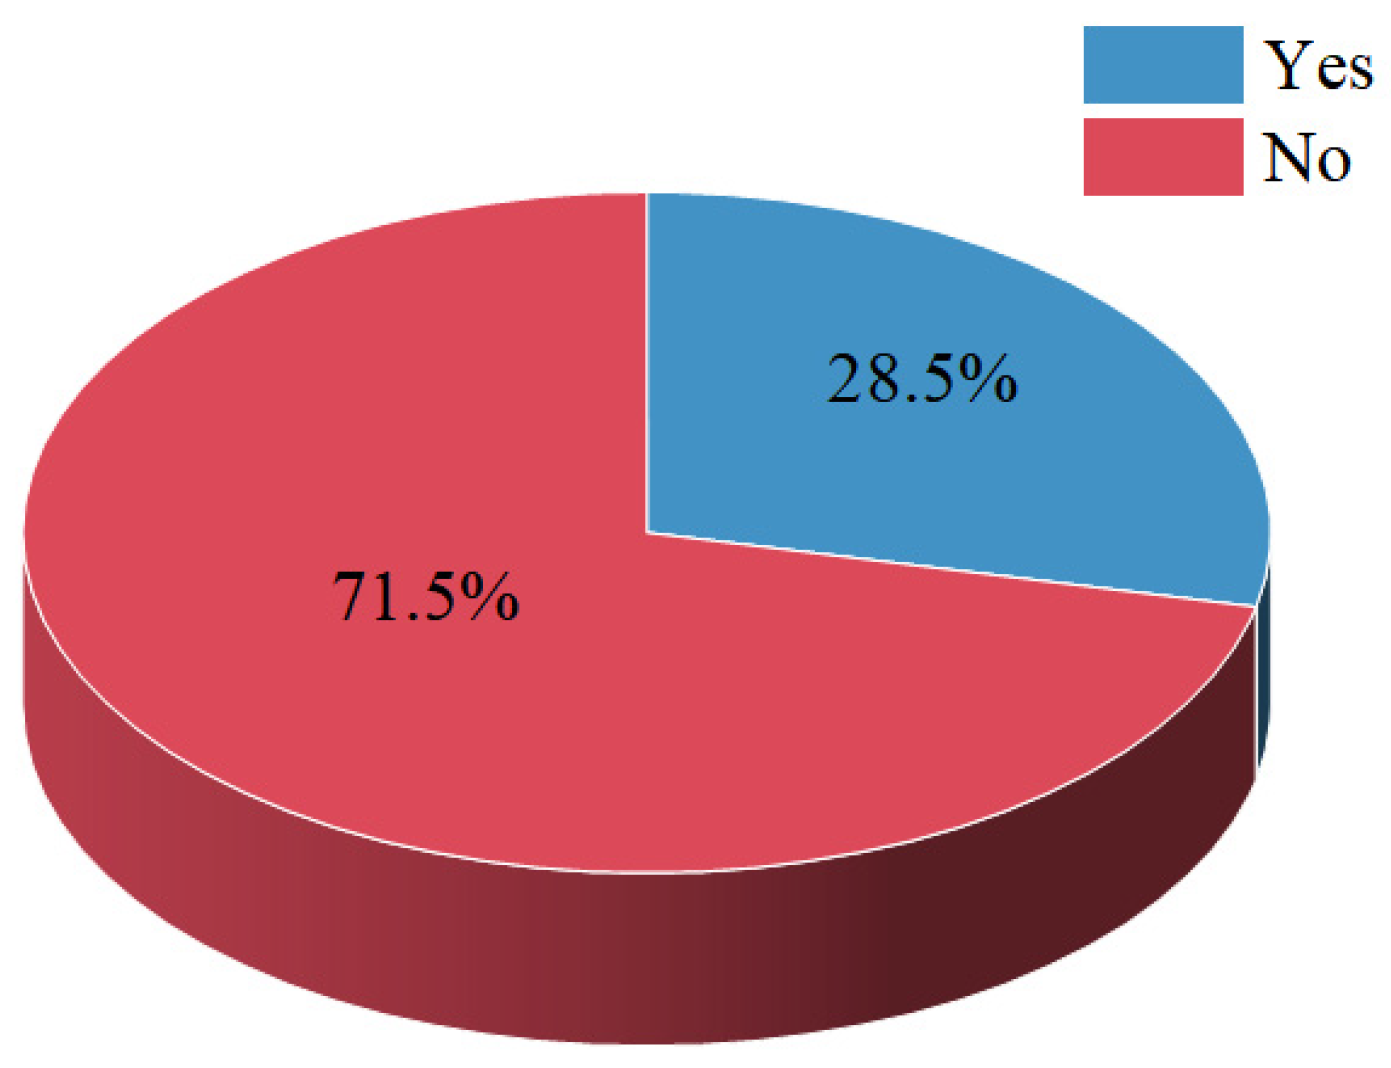
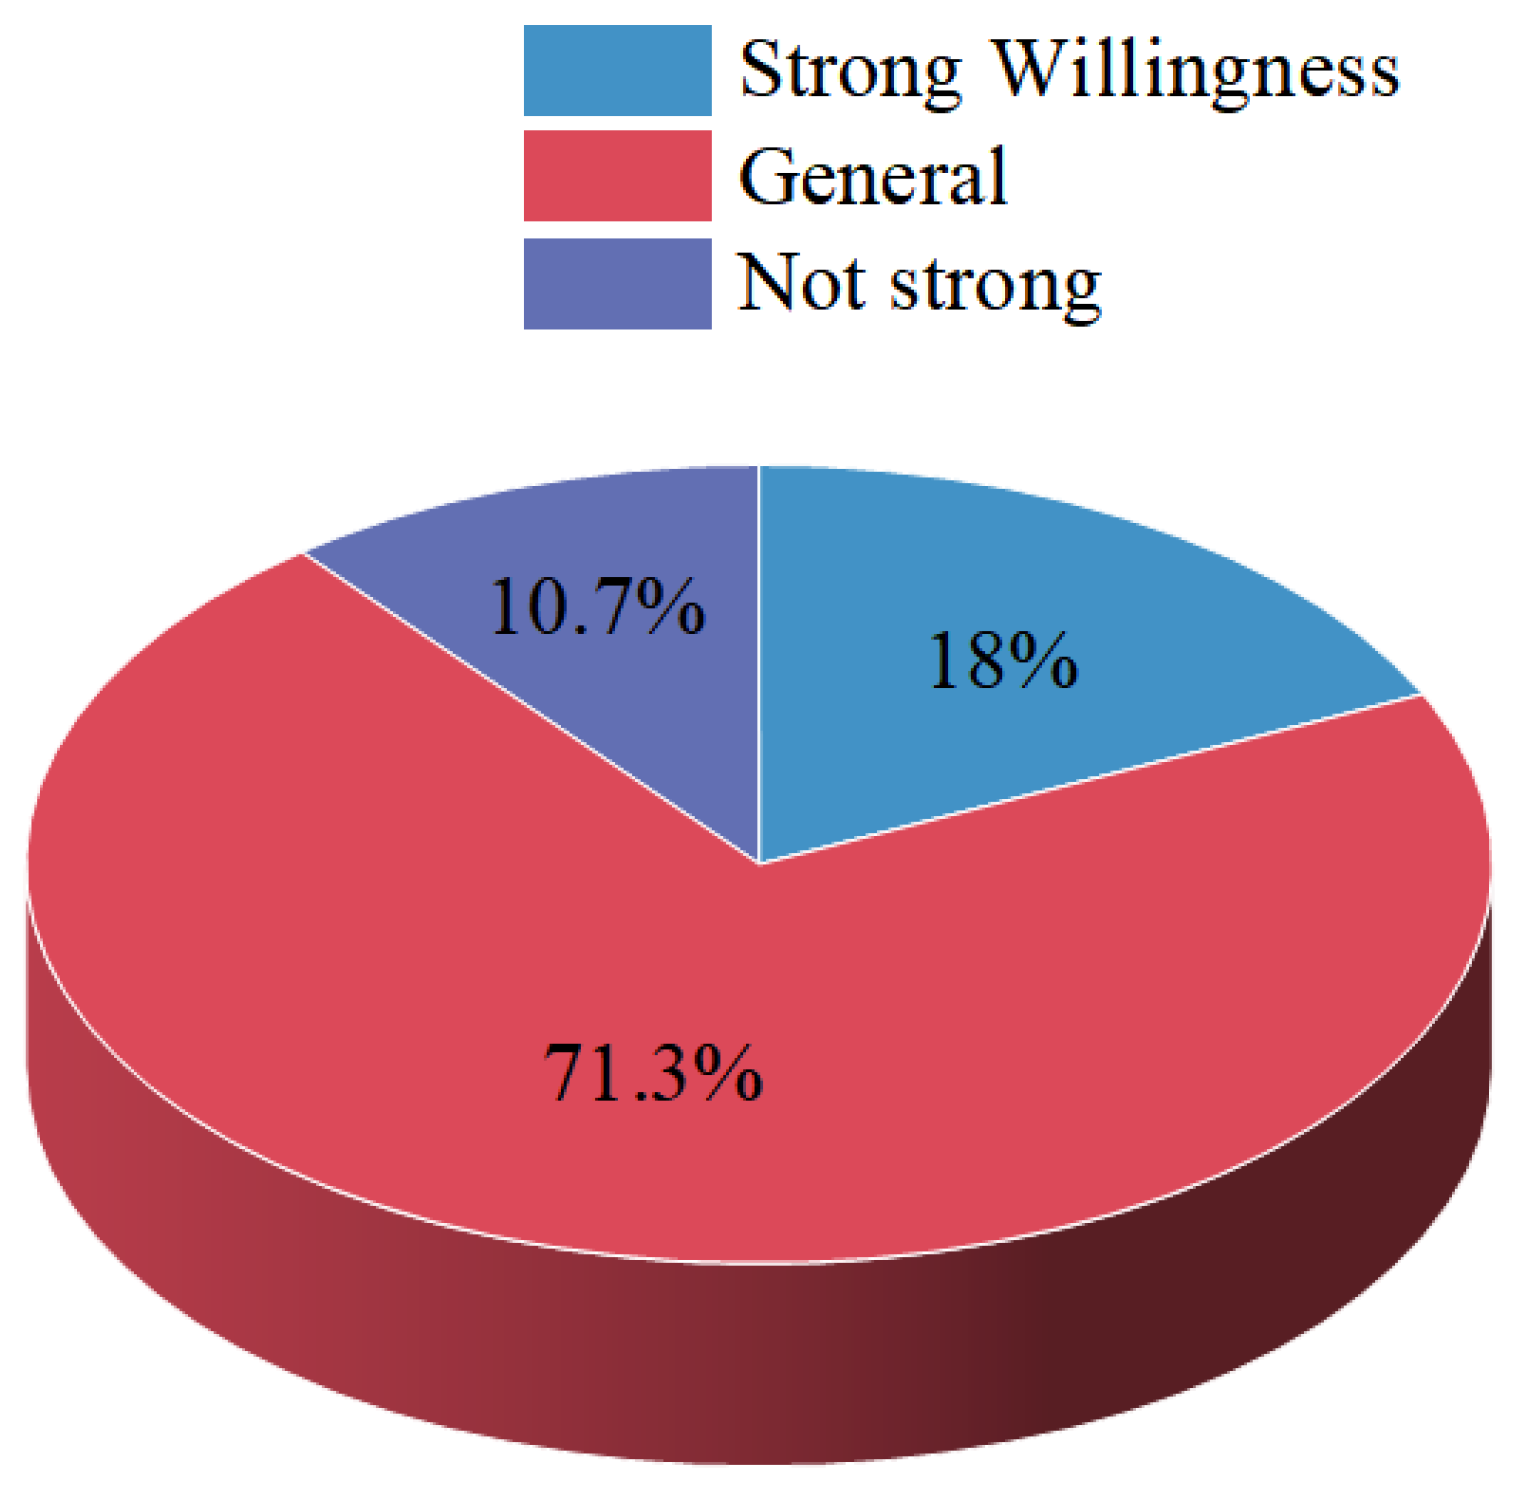
3.5. Degree of Willingness to Adopt Solar PV Technology

Solar energy is generally utilized by households for solar water heaters, and although the penetration rate of solar water heaters is relatively low, this clean and efficient energy source should never be ignored. Land in rural areas is cheaper than in urban areas and is vast, without too many installation limitations. The use of solar energy can improve rural sanitation and reduce the consumption of conventional energy. Figure 15 shows that most people’s willingness to adopt solar PV is not strong (71.3%) because of insufficient knowledge of solar energy as an energy source or because the use of solar energy does not save more money. Wang et al. [38] found that the potential of rooftop power generation in China is 3.27 × 10⁹ MWh per year, which means that the annual CO2 emissions will be reduced by 2.41 × 10⁹ tons. It can be seen that rooftop solar PV utilizes the building roof resources to design distributed PV power plants, which not only can effectively help to reduce the emission of greenhouse gases but also offer a good way to accelerate the transition to green energy in order to achieve the goal of sustainable development.

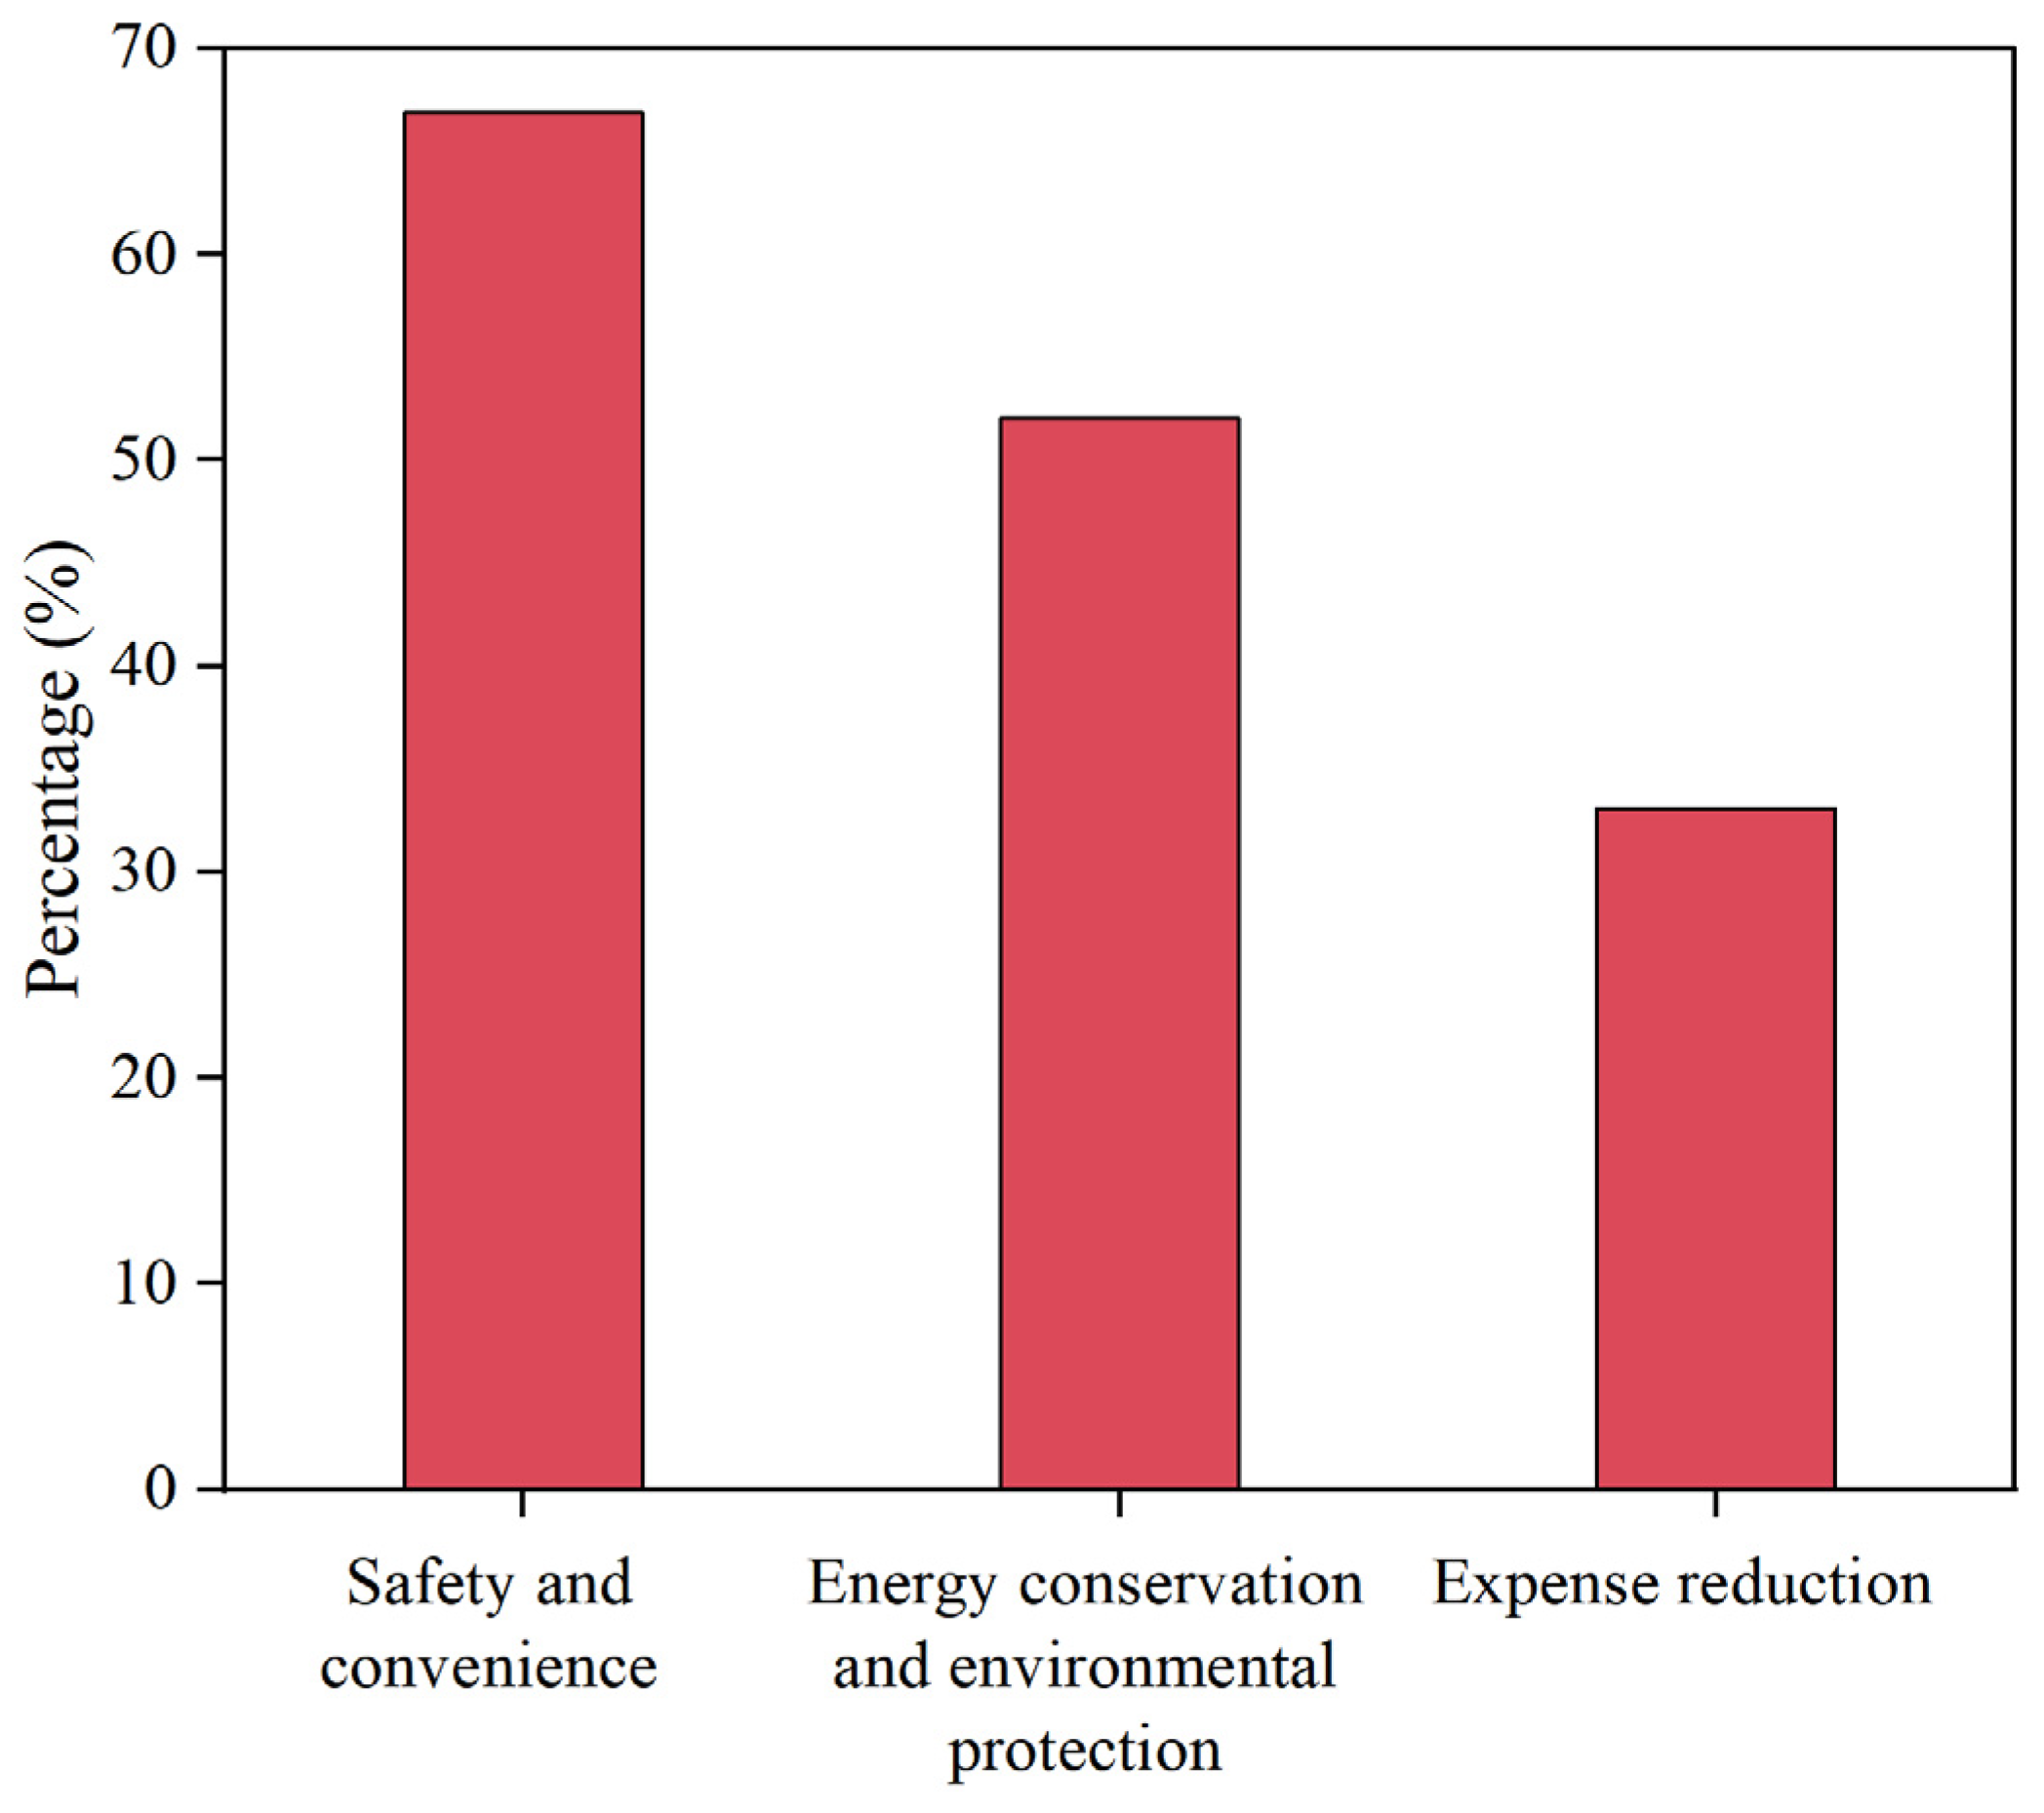
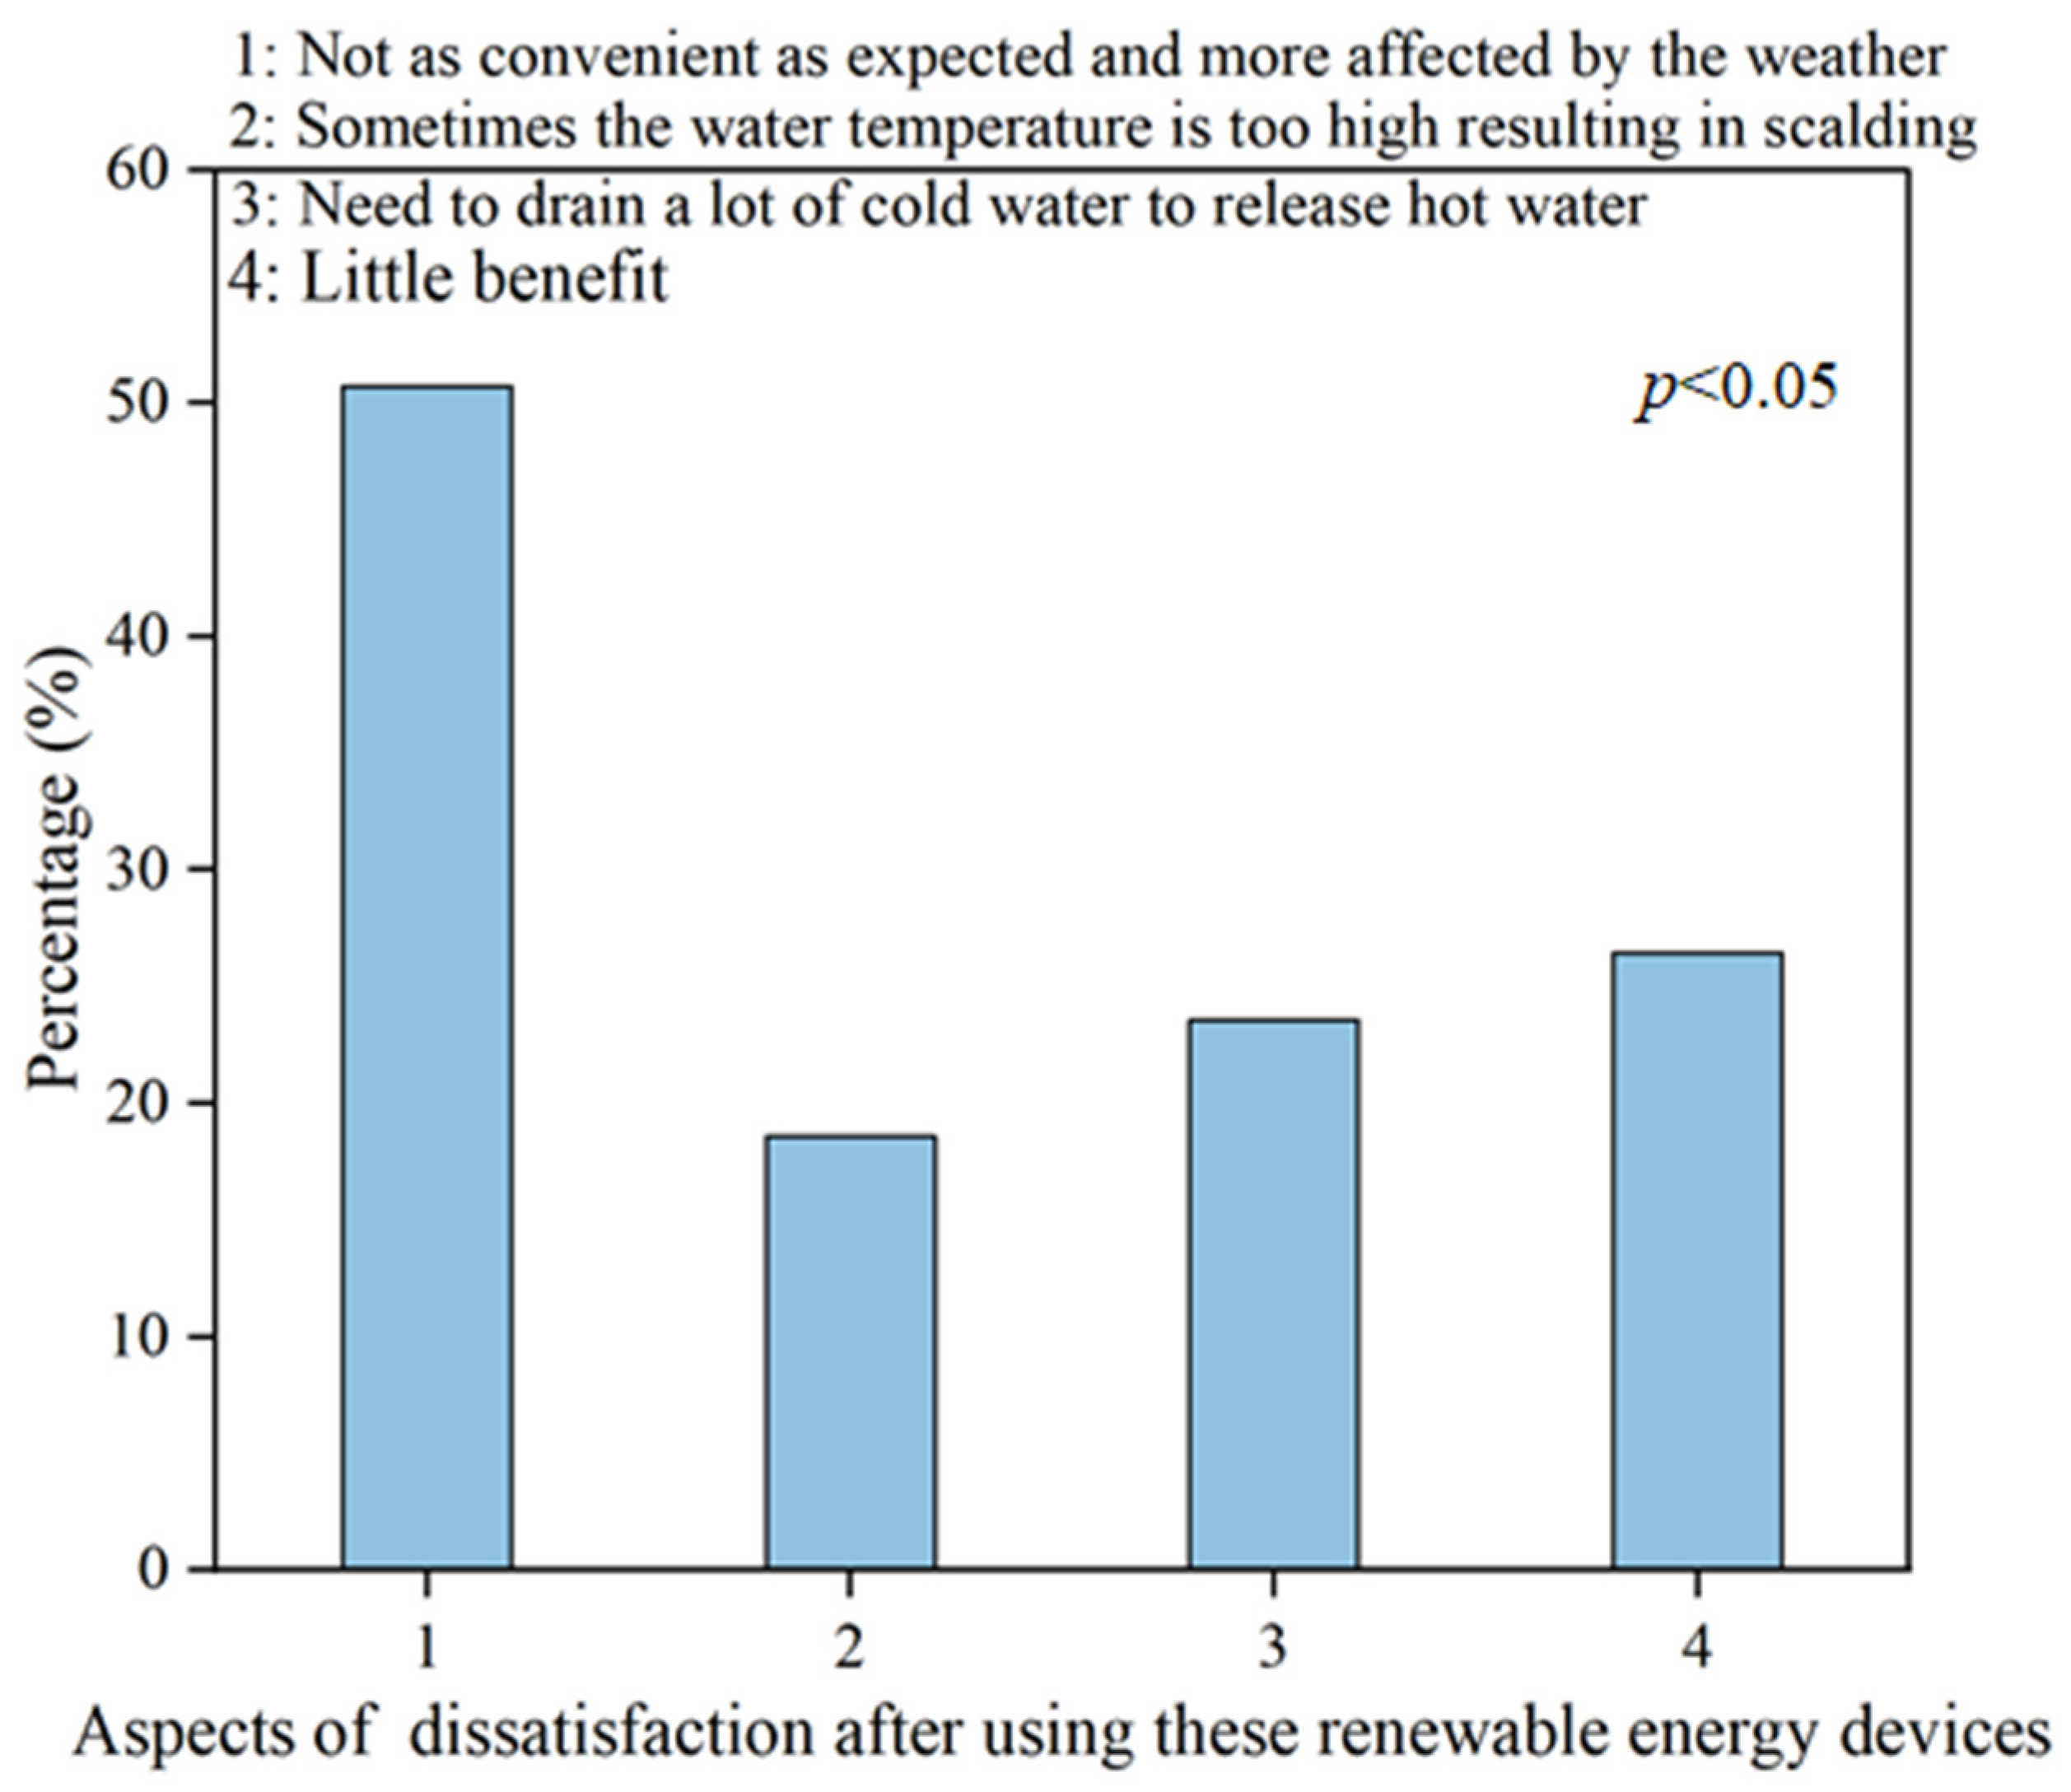
3.6. Analysis of Advantages and Disadvantages After Adoption of Renewable Energy Equipment

As a clean and free renewable energy source, solar photovoltaic (PV) technology has been increasingly adopted in developing countries in recent years. Improvements in PV technology and reductions in PV construction costs have made it an important tool for promoting rural electrification [39], reducing energy poverty [40], and even achieving a low-carbon energy transition to combat climate change [41,42]. So this research analyzed the advantages and disadvantages of renewable energy equipment. As shown in Figure 16, most of the people who are more satisfied with the use of renewable energy equipment found it to be safe and convenient, and some also believe that the use of renewable energy can be a very environmentally friendly way of saving energy and reducing expenses. With the advancement of technology, the performance and reliability of renewable energy devices have continuously improved. For example, the efficiency of solar panels and wind turbines has increased, their lifespan has extended, and maintenance costs have decreased. Although the initial cost of renewable energy devices may be relatively high, their operating costs are comparatively low. For instance, solar and wind energy require almost no fuel costs, and the maintenance expenses are also low. In the long term, these devices can significantly reduce energy expenditures, achieving energy savings and expense reduction.
As shown in Figure 17, most of the residents who use renewable energy and are dissatisfied with it believe that it is not as convenient as expected and the equipment is affected by the weather, which is a major disadvantage of the promotion of the use of renewable energy. The key to solving this problem is through the storage of energy, to reduce the impact of rain and other inclement weather on the residents’ use of energy. Therefore, the construction of rural energy needs to be based on rural reality. Some residents also believe that the use of renewable energy sometimes produces too high water temperatures, leading to scalding and the economic benefits are not very high. At the same time, because there is no installation of circulating pipes, there is a need to drain a lot of water in order to release hot water. All these situations cause a lot of inconvenience to the residents in the process of use.
Figure 18 shows that the main obstacle to the promotion of renewable energy in rural areas is that the economic situation does not allow it. Residents believe that the use of renewable energy cannot save them money and the initial investment is relatively high. These issues affect the use of renewable energy and it can be seen that the way to solve the problem is the development of the rural economy and the development of renewable energy equipment technology. There is also a need to continue to improve the production of renewable energy equipment technology, reduce the price of equipment so that residents can use renewable energy, and improve the technology. It is important to reduce the price of the equipment so that the population can afford to use it. Because energy behavior and energy use policies are influenced by the perception of the population, some of the research subjects said that they do not use renewable energy equipment because they do not understand the equipment, and the development of renewable energy in rural areas with rich land resources is more advantageous, which shows that we need to strengthen the promotion of renewable energy equipment.

4. Discussion

In the process of urbanization, high levels of economic development in rural areas have enabled China to complete urbanization more quickly due to relatively well-developed infrastructure and public services and higher levels of industrial development. Rural areas with higher levels of economic development have a higher proportion of clean energy consumption than rural areas that rely heavily on low-quality energy sources, such as biomass and bulk coal, and that are lagging behind in their level of economic development [43]. Despite this, as the world’s largest developing country, 44% and 24% of rural households in China still use firewood and coal as their main household energy source, respectively [42]. In this study, the share of natural gas use in rural Guangdong was found to be close to 50%, but the use of solar energy, LPG, and biogas is less than 20%, along with about 20% of firewood use. In addition, rural residents are economically rational, and the cost of purchasing and using clean energy equipment increases for individuals with low incomes. This perception affects their willingness to use clean energy [34]. Although Guangdong province has a higher level of economic development than most other provinces in China, there is still great potential for the promotion of renewable energy. In addition, consumer selectivity, attribution of responsibility, corresponding awareness, and environmental consequences determine the intended clean energy technology adopted by the rural population [44]. The research found that rural residents in Guangdong province do not have a strong desire to use solar photovoltaic technology, with less than 30% of residents having the desire to use it. Although more than 70% of residents believe that solar energy technology can save energy and convenience and more than 50% of residents believe that the use of solar energy can protect the environment, considering some of the problems that may arise in the process, less than 20% use it.
Similarly, the older the head of the household, the lower the likelihood of the household transitioning to clean energy [45]. The higher the education level of the household head and the higher the income, the higher the likelihood of the household transitioning to clean energy [46]. However, some studies have arrived at the opposite conclusion [47,48], suggesting that the effect of household member distribution on household energy composition requires further research. In addition, clean energy use is also associated with better housing conditions [49,50,51], mainly responding to the household income and the conditions of the related energy in-home construction.
The statistics in Figure 8 show that electricity and LPG are the main sources of cooking energy in rural Guangdong, and a previous study has indicated that it is more convenient to use these two sources of energy for cooking [23]. In addition, although most households have natural gas pipelines installed, it is more often applied for hot water. Thus, the transition from the traditional use of firewood to electricity to natural gas will also require policy support and expenditure relief to ensure its adoption and affordability by the population. Compared to other parts of China, Guangdong’s rural areas have better economic development, higher levels of education, and overall lower rates of non-renewable energy use. However, the use of solar photovoltaic technology still needs to be improved, the technical challenges to its use in daily life still need to be solved, and policies supporting the cost of purchase need to be implemented.

5. Conclusions

In this study, we conducted a survey in rural areas of Guangdong Province to analyze the composition of local energy consumption, assess indoor air quality and thermal environment levels, and investigate the willingness to adopt renewable energy. We also evaluated the advantages and disadvantages of renewable energy adoption in relation to household size and income. Finally, the feasibility of renewable energy promotion was assessed, and directions for improvement were identified. The main conclusions are as follows:
(1)
Rural energy consumption is rich and varied, with electricity and liquefied petroleum gas as the main sources of cooking energy. Hot water is mainly obtained by heating with electricity and natural gas.
(2)
Rural residents generally experience a warm, humid indoor environment with sufficient airflow. While most were satisfied with bedroom and living room air quality, poor kitchen ventilation led to dissatisfaction. Many preferred lower temperatures, and humidity preferences varied.
(3)
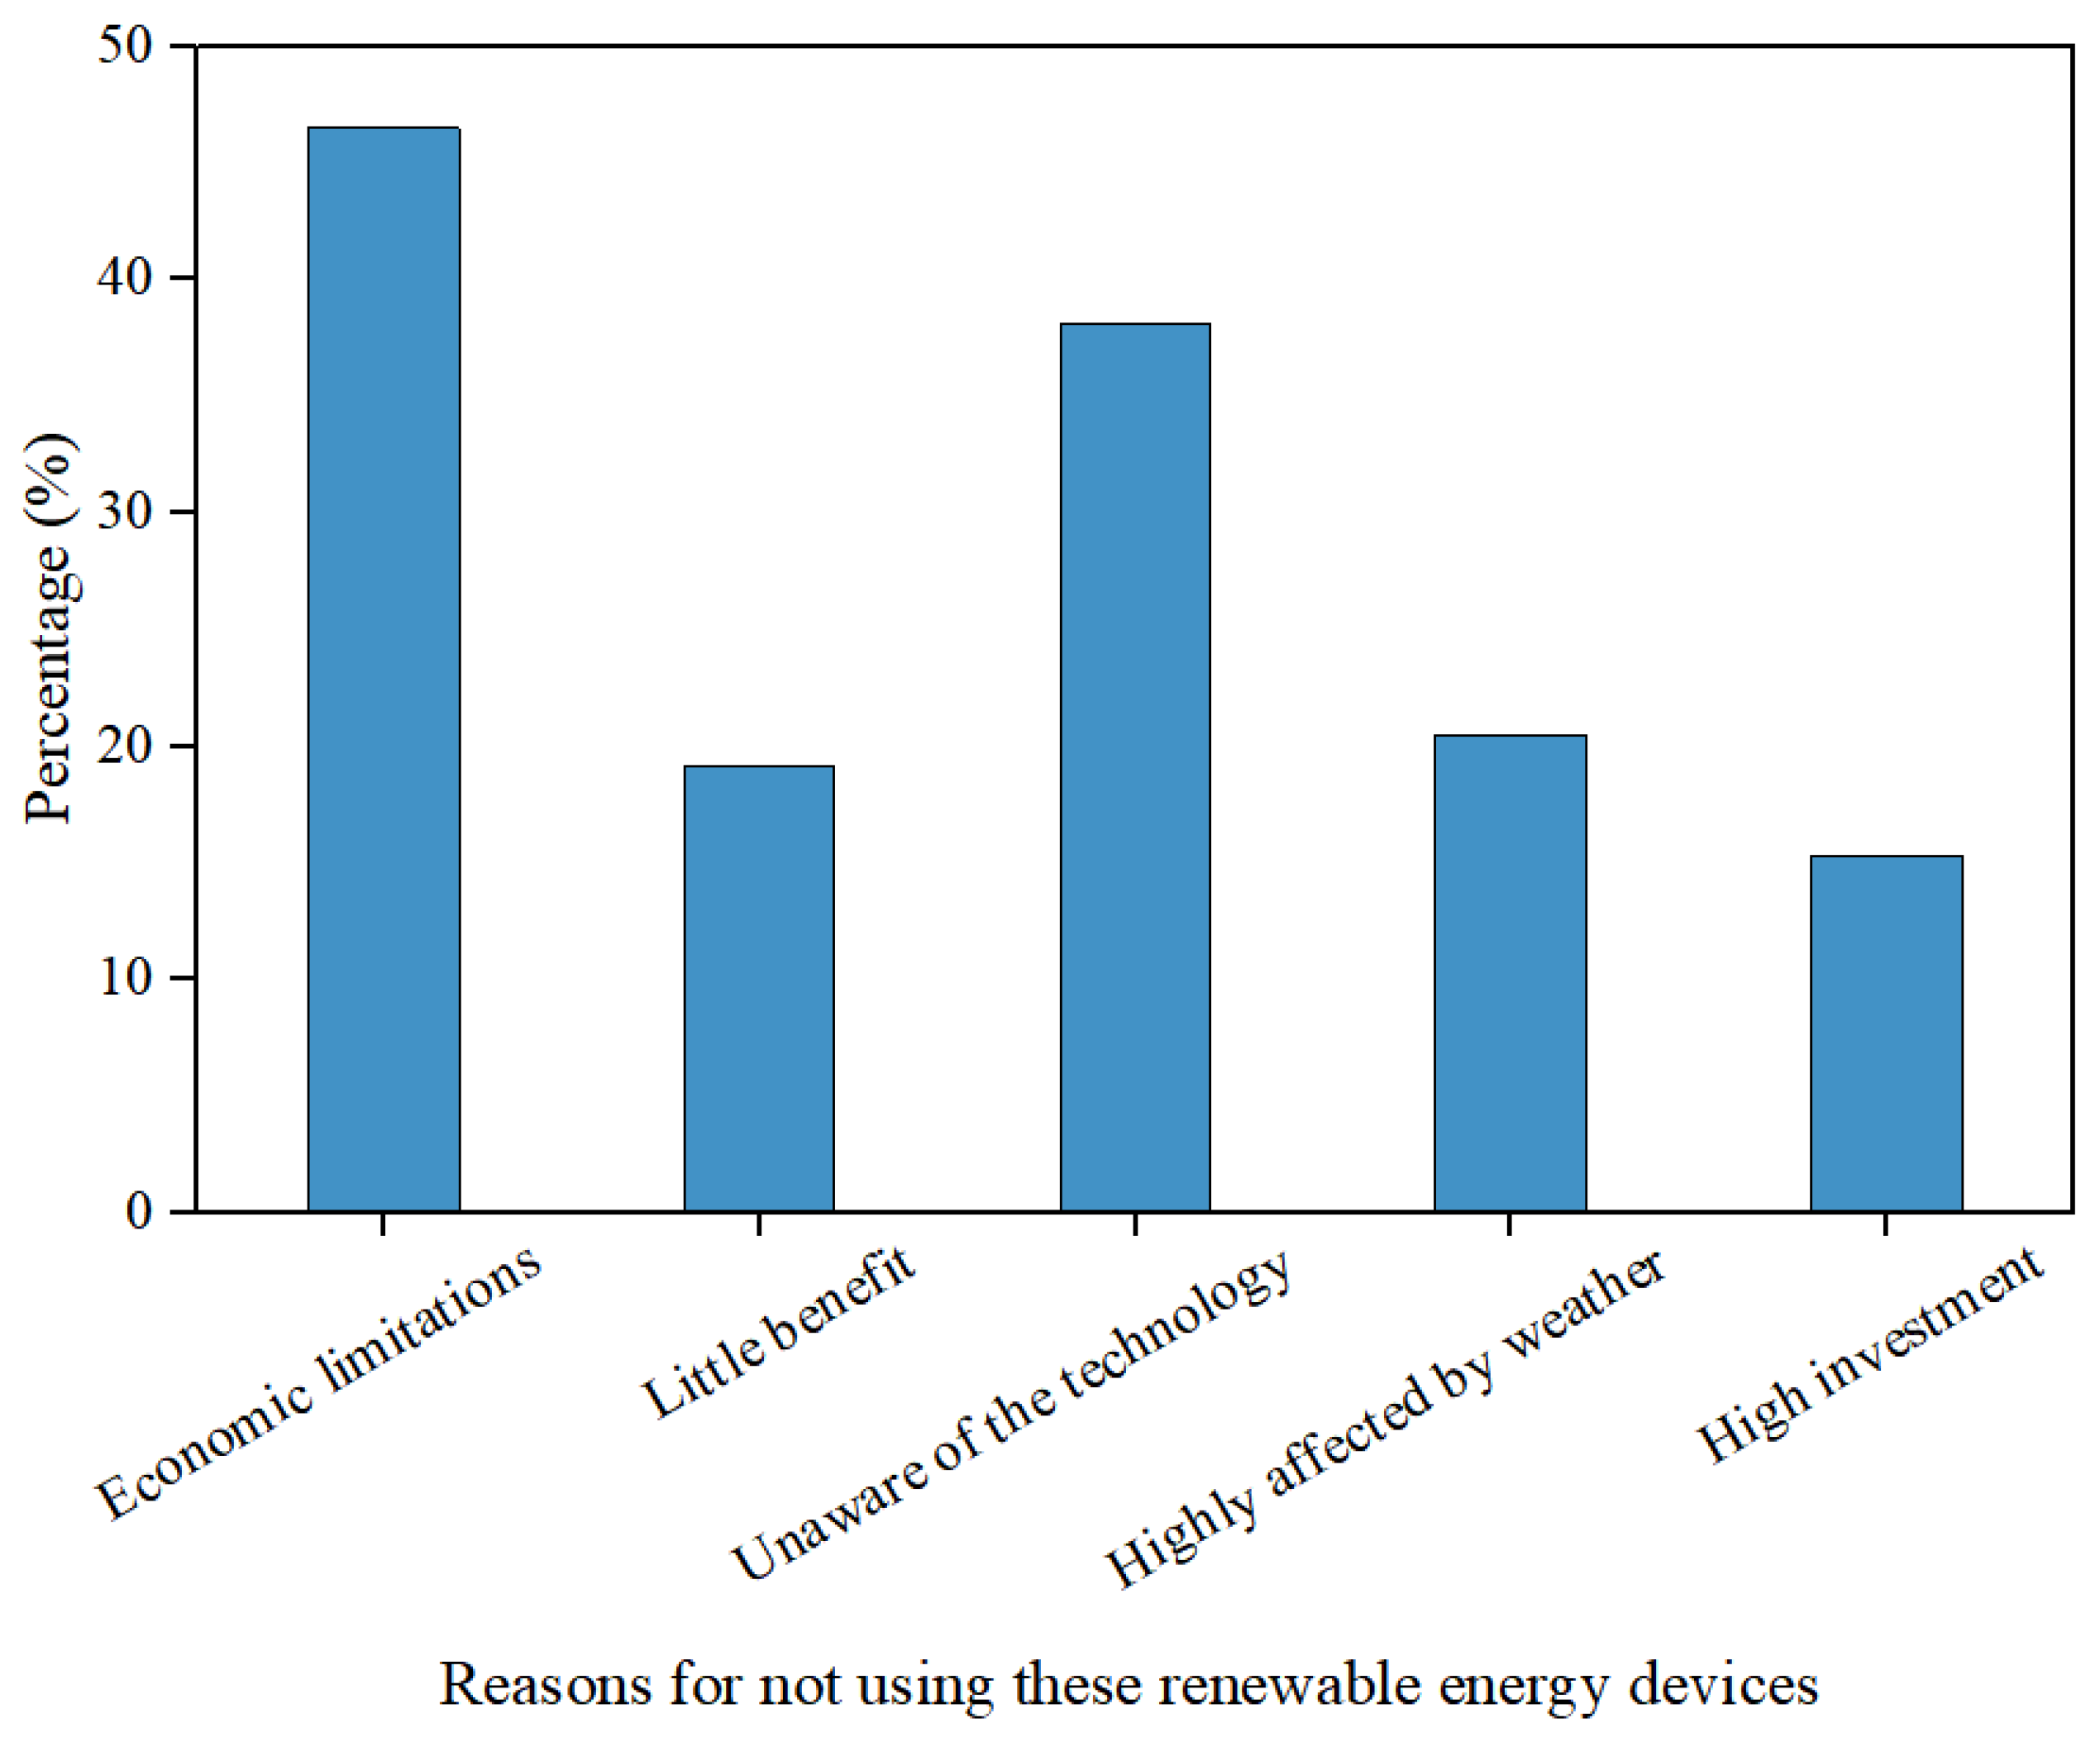
For rural residents, renewable energy is too expensive to adopt, affected by the environment and weather, and often not convenient to use.
(4)
Renewable energy technologies still need to be improved and costs reduced. In addition, the government needs to increase publicity to raise awareness of renewable energy among rural residents. The government can promote awareness and acceptance among rural residents by organizing lectures, distributing informational brochures, and setting up demonstration projects for educational outreach; leveraging television, radio, and social media for widespread dissemination; publicizing subsidy policies and success stories to encourage participation; collaborating with village committees to train local advocates; integrating local culture and festivals to enhance appeal; and emphasizing the economic benefits, environmental advantages, and long-term sustainability of renewable energy.
Due to the uneven distribution of the study population, there may be bias. In addition, some data, such as electricity and other specific data, will have some discrepancies because they cannot be accurately obtained. Therefore, there is a need to analyze the energy situation in specific areas of Guangdong and to contact the Bureau of Electricity Statistics to carry out a more in-depth investigation. Therefore, in future research, considering the linkage between household composition, education level, economic income, and energy consumption structure, a more in-depth study can be carried out.

Author Contributions

Conceptualization, H.L. and Y.Y. (Yukang Yuan); Methodology, M.Q., T.T. and Y.Y. (Yukang Yuan); Formal analysis, M.Q.; Investigation, H.L., M.Q., T.T., Y.Y. (Yanping Yang) and Y.Y. (Yukang Yuan); Data curation, Y.Y. (Yanping Yang); Writing—original draft, Y.Y. (Yukang Yuan); Writing—review & editing, T.T. and Y.Y. (Yukang Yuan); Visualization, Y.Y. (Yanping Yang); Supervision, H.L.; Project administration, H.L.; Funding acquisition, H.L. All authors have read and agreed to the published version of the manuscript.

Funding

This research was funded by Special Research Team of guangzhou city polytechnic: A Research Team for the Inheritance and Innovation of Guangfu Traditional Architectural Culture Based on VR Technology grant number [KYTD2023005] and Guangdong Higher Vocational Colleges’ Production-Education Integration Innovation Platform: Guangdong-Hong Kong-Macao Greater Bay Area Intelligent Construction Production-Education Integration Innovation Platform Project number grant number [2022CJPT017].

Data Availability Statement

The data presented in this study are available on request from the corresponding author. The data are not publicly available due to privacy.

Conflicts of Interest

The authors declare that they have no known competing financial interests or personal relationships that could have appeared to influence the work reported in this paper.

References

  1. Szczepanik-Scislo, N.; Scislo, L. Comparison of CFD and Multizone Modeling from Contaminant Migration from a Household Gas Furnace. Atmosphere 2021, 12, 79. [Google Scholar] [CrossRef]
  2. Jiang, A.; Zhong, Q.; Wang, Y.; Ao, Y.; Chen, C. Influencing Factors of Commercial Energy Consumption Intention of Rural Residents: Evidence from Rural Chengdu. Energies 2021, 14, 1010. [Google Scholar] [CrossRef]
  3. Long, H.; Fu, X.; Kong, W.; Chen, H.; Zhou, Y.; Yang, F. Key Technologies and Applications of Rural Energy Internet in China. Inf. Process. Agric. 2024, 11, 277–298. [Google Scholar] [CrossRef]
  4. Zhang, X.; Xu, K.; He, M.; Wang, J. A Review on the Rural Household Energy in China From 1990s—Transition, Regional Heterogeneity, Emissions, Energy-Saving, and Policy. Front. Energy Res. 2022, 10, 907803. [Google Scholar] [CrossRef]
  5. Ou, J.; Liu, X.; Li, X.; Chen, Y. Quantifying the Relationship between Urban Forms and Carbon Emissions Using Panel Data Analysis. Landscape Ecol. 2013, 28, 1889–1907. [Google Scholar] [CrossRef]
  6. Han, J.; Zhang, L.; Li, Y. Spatiotemporal Analysis of Rural Energy Transition and Upgrading in Developing Countries: The Case of China. Appl. Energy 2022, 307, 118225. [Google Scholar] [CrossRef]
  7. Yang, Y.; Yifang, L.; Wei, Z. Energy Consumption in Rural China: Analysis of Rural Living Energy in Beijing. IOP Conf. Ser. Earth Environ. Sci. 2017, 81, 012063. [Google Scholar] [CrossRef]
  8. Wu, S.; Han, H. Energy Transition, Intensity Growth, and Policy Evolution: Evidence from Rural China. Energy Econ. 2022, 105, 105746. [Google Scholar] [CrossRef]
  9. Miao, X. On the Current Rural Energy Consumption and the Solutions in the Background of Urbanization—Analysis of the Rural Domestic Energy Use in Beijing. People’s Forum Acad. 2017, 10, 92–95. [Google Scholar]
  10. Zhang, D.; Li, J.; Han, P. A Multidimensional Measure of Energy Poverty in China and Its Impacts on Health: An Empirical Study Based on the China Family Panel Studies. Energy Policy 2019, 131, 72–81. [Google Scholar] [CrossRef]
  11. Krause, A.; Rotter, V.S. Linking Energy-Sanitation-Agriculture: Intersectional Resource Management in Smallholder Households in Tanzania. Sci. Total Environ. 2017, 590–591, 514–530. [Google Scholar] [CrossRef]
  12. Manos, B.; Bartocci, P.; Partalidou, M.; Fantozzi, F.; Arampatzis, S. Review of Public–Private Partnerships in Agro-Energy Districts in Southern Europe: The Cases of Greece and Italy. Renew. Sustain. Energy Rev. 2014, 39, 667–678. [Google Scholar] [CrossRef]
  13. Karami Dehkordi, M.; Kohestani, H.; Yadavar, H.; Roshandel, R.; Karbasioun, M. Implementing Conceptual Model Using Renewable Energies in Rural Area of Iran. Inf. Process. Agric. 2017, 4, 228–240. [Google Scholar] [CrossRef]
  14. Streimikiene, D.; Baležentis, T.; Kriščiukaitienė, I. Promoting Interactions between Local Climate Change Mitigation, Sustainable Energy Development, and Rural Development Policies in Lithuania. Energy Policy 2012, 50, 699–710. [Google Scholar] [CrossRef]
  15. Kitchen, L.; Marsden, T. Creating Sustainable Rural Development through Stimulating the Eco-Economy: Beyond the Eco-Economic Paradox? Sociol. Rural. 2009, 49, 273–294. [Google Scholar] [CrossRef]
  16. Sovacool, B.K.; Hess, D.J.; Amir, S.; Geels, F.W.; Hirsh, R.; Rodriguez Medina, L.; Miller, C.; Alvial Palavicino, C.; Phadke, R.; Ryghaug, M.; et al. Sociotechnical Agendas: Reviewing Future Directions for Energy and Climate Research. Energy Res. Soc. Sci. 2020, 70, 101617. [Google Scholar] [CrossRef]
  17. Winther, T.; Westskog, H.; Sæle, H. Like Having an Electric Car on the Roof: Domesticating PV Solar Panels in Norway. Energy Sustain. Dev. 2018, 47, 84–93. [Google Scholar] [CrossRef]
  18. Kloppenburg, S.; Smale, R.; Verkade, N. Technologies of Engagement: How Battery Storage Technologies Shape Householder Participation in Energy Transitions. Energies 2019, 12, 4384. [Google Scholar] [CrossRef]
  19. Ryghaug, M.; Toftaker, M. A Transformative Practice? Meaning, Competence, and Material Aspects of Driving Electric Cars in Norway. Nat. Cult. 2014, 9, 146–163. [Google Scholar] [CrossRef]
  20. Skjølsvold, T.M.; Jørgensen, S.; Ryghaug, M. Users, Design and the Role of Feedback Technologies in the Norwegian Energy Transition: An Empirical Study and Some Radical Challenges. Energy Res. Soc. Sci. 2017, 25, 1–8. [Google Scholar] [CrossRef]
  21. Frantzeskaki, N.; Avelino, F.; Loorbach, D. Outliers or Frontrunners? Exploring the (Self-) Governance of Community- Owned Sustainable Energy in Scotland and the Netherlands. Lect. Notes Energy 2013, 23, 101–116. [Google Scholar] [CrossRef]
  22. Zhang, Y.; Zhi, G.; Jin, W.; Xu, P.; Li, Z.; Kong, Y.; Zhang, H.; Shen, Y.; Hu, J. Identifying the Fundamental Drives behind the 10-Year Evolution of Northern China’s Rural Household Energy and Emission: Implications for 2030 and Beyond. Sci. Total Environ. 2023, 865, 161053. [Google Scholar] [CrossRef]
  23. Zou, B.; Luo, B. Rural Household Energy Consumption Characteristics and Determinants in China. Energy 2019, 182, 814–823. [Google Scholar] [CrossRef]
  24. Li, S.; Zhang, L.; Su, L.; Nie, Q. Exploring the Coupling Coordination Relationship between Eco-Environment and Renewable Energy Development in Rural Areas: A Case of China. Sci. Total Environ. 2023, 880, 163229. [Google Scholar] [CrossRef]
  25. Ong, C. Choice of Energy Paths: Its Implications for Rural Energy Poverty in Less Developed Countries. Soc. Nat. Resour. 2015, 28, 733–748. [Google Scholar] [CrossRef]
  26. Naumann, M.; Rudolph, D. Conceptualizing Rural Energy Transitions: Energizing Rural Studies, Ruralizing Energy Research. J. Rural. Stud. 2020, 73, 97–104. [Google Scholar] [CrossRef]
  27. Kadian, R.; Dahiya, R.P.; Garg, H.P. Energy-Related Emissions and Mitigation Opportunities from the Household Sector in Delhi. Energy Policy 2007, 35, 6195–6211. [Google Scholar] [CrossRef]
  28. Nguyen, K.Q. Alternatives to Grid Extension for Rural Electrification: Decentralized Renewable Energy Technologies in Vietnam. Energy Policy 2007, 35, 2579–2589. [Google Scholar] [CrossRef]
  29. Cong, H.; Zhao, L.; Wang, J.; Yao, Z. Current Situation and Development Demand Analysis of Rural Energy in China. Trans. Chin. Soc. Agric. Eng. 2017, 33, 224–231. [Google Scholar]
  30. Zhang, Y.; Bai, X.; Mills, F.P. Characterizing Energy-Related Occupant Behavior in Residential Buildings: Evidence from a Survey in Beijing, China. Energy Build. 2020, 214, 109823. [Google Scholar] [CrossRef]
  31. Lewis, J.; Severnini, E. Short- and Long-Run Impacts of Rural Electrification: Evidence from the Historical Rollout of the U.S. Power Grid. J. Dev. Econ. 2020, 143, 102412. [Google Scholar] [CrossRef]
  32. Salmon, C.; Tanguy, J. Rural Electrification and Household Labor Supply: Evidence from Nigeria. World Dev. 2016, 82, 48–68. [Google Scholar] [CrossRef]
  33. Slough, T.; Urpelainen, J.; Yang, J. Light for All? Evaluating Brazil’s Rural Electrification Progress, 2000–2010. Energy Policy 2015, 86, 315–327. [Google Scholar] [CrossRef]
  34. Li, L.; Guo, R.; Yang, J. The Deviation between the Behavior and Willingness of Rural Residents to Use Clean Energy and Its Influencing Factors in China. Energy Sustain. Dev. 2023, 77, 101324. [Google Scholar] [CrossRef]
  35. Ma, W.; Zheng, H.; Gong, B. Rural Income Growth, Ethnic Differences, and Household Cooking Fuel Choice: Evidence from China. Energy Econ. 2022, 107, 105851. [Google Scholar] [CrossRef]
  36. Szczepanik-Scislo, N.; Scislo, L. Dynamic Real-Time Measurements and a Comparison of Gas and Wood Furnaces in a Dual-Fuel Heating System in Order to Evaluate the Occupants’ Safety and Indoor Air Quality. Buildings 2023, 13, 2125. [Google Scholar] [CrossRef]
  37. Huber, M.T.; McCarthy, J. Beyond the Subterranean Energy Regime? Fuel, Land Use and the Production of Space. Trans. Inst. Br. Geogr. 2017, 42, 655–668. [Google Scholar] [CrossRef]
  38. Wang, L.; Xu, S.; Gong, Y.; Ning, J.; Zhang, X.; Zhao, Y. High Resolution Photovoltaic Power Generation Potential Assessments of Rooftop in China. Energy Rep. 2022, 8, 14545–14553. [Google Scholar] [CrossRef]
  39. Grimm, M.; Munyehirwe, A.; Peters, J.; Sievert, M. A First Step up the Energy Ladder? Low Cost Solar Kits and Household’s Welfare in Rural Rwanda. World Bank Econ. Rev. 2017, 31, 631–649. [Google Scholar] [CrossRef]
  40. Li, Y.; Chen, K.; Ding, R.; Zhang, J.; Hao, Y. How Do Photovoltaic Poverty Alleviation Projects Relieve Household Energy Poverty? Evidence from China. Energy Econ. 2023, 118, 106514. [Google Scholar] [CrossRef]
  41. Breyer, C.; Koskinen, O.; Blechinger, P. Profitable Climate Change Mitigation: The Case of Greenhouse Gas Emission Reduction Benefits Enabled by Solar Photovoltaic Systems. Renew. Sustain. Energy Rev. 2015, 49, 610–628. [Google Scholar] [CrossRef]
  42. Liu, Y.; Chen, J.; Zhao, L.; Liao, H. Rural Photovoltaic Projects Substantially Prompt Household Energy Transition: Evidence from China. Energy 2023, 275, 127505. [Google Scholar] [CrossRef]
  43. Han, J.; Yang, Q.; Zhang, L. What Are the Priorities for Improving the Cleanliness of Energy Consumption in Rural China? Urbanisation Advancement or Agriculture Development? Energy Sustain. Dev. 2022, 70, 106–114. [Google Scholar] [CrossRef]
  44. Wang, Z.; Ali, S.; Akbar, A.; Rasool, F. Determining the Influencing Factors of Biogas Technology Adoption Intention in Pakistan: The Moderating Role of Social Media. Int. J. Environ. Res. Public Health 2020, 17, 2311. [Google Scholar] [CrossRef] [PubMed]
  45. Huang, F.; Liu, J.; Wang, Z.; Shuai, C.; Li, W. Of Jobs, Skills, and Values: Exploring Rural Household Energy Use and Solar Photovoltaics in Poverty Alleviation Areas in China. Energy Res. Soc. Sci. 2020, 67, 101517. [Google Scholar] [CrossRef]
  46. Alem, Y.; Beyene, A.D.; Köhlin, G.; Mekonnen, A. Modeling Household Cooking Fuel Choice: A Panel Multinomial Logit Approach. Energy Econ. 2016, 59, 129–137. [Google Scholar] [CrossRef]
  47. Tadesse, T. Environmental Concern and Its Implication to Household Waste Separation and Disposal: Evidence from Mekelle, Ethiopia. Resour. Conserv. Recycl. 2009, 53, 183–191. [Google Scholar] [CrossRef]
  48. Walekhwa, P.N.; Mugisha, J.; Drake, L. Biogas Energy from Family-Sized Digesters in Uganda: Critical Factors and Policy Implications. Energy Policy 2009, 37, 2754–2762. [Google Scholar] [CrossRef]
  49. Rahut, D.B.; Ali, A.; Mottaleb, K.A. Understanding the Determinants of Alternate Energy Options for Cooking in the Himalayas: Empirical Evidence from the Himalayan Region of Pakistan. J. Clean. Prod. 2017, 149, 528–539. [Google Scholar] [CrossRef]
  50. Rosenthal, J.; Quinn, A.; Grieshop, A.P.; Pillarisetti, A.; Glass, R.I. Clean Cooking and the SDGs: Integrated Analytical Approaches to Guide Energy Interventions for Health and Environment Goals. Energy Sustain. Dev. 2018, 42, 152–159. [Google Scholar] [CrossRef]
  51. Saksena, S.; Tran, C.C.; Fox, J. Household Cooking Fuel Use in Rural and Peri-Urban Viet Nam: A Multilevel Longitudinal Analysis of Supply Side Factors. Energy Sustain. Dev. 2018, 44, 47–54. [Google Scholar] [CrossRef]
Figure 1. Distribution of number of floors in a building.
Buildings 15 01129 g001
Figure 2. Distribution of number of buildings with or without insulation.
Buildings 15 01129 g002
Figure 3. Age distribution of subjects.
Buildings 15 01129 g003
Figure 4. Distribution of resident population statistics.
Buildings 15 01129 g004
Figure 5. Statistics on household appliances.
Buildings 15 01129 g005
Figure 6. Main rural energy use statistics.
Buildings 15 01129 g006
Figure 7. Statistical distribution of equipment used to heat water.
Buildings 15 01129 g007
Figure 8. Statistical distribution of equipment used for cooking.
Buildings 15 01129 g008
Figure 9. Air quality assessment: (a) bedroom, (b) living room, (c) kitchen. Air satisfaction evaluation: (d) bedroom, (e) living room, (f) kitchen.
Buildings 15 01129 g009
Figure 10. (a) Thermal sensation statistics, (b) wet sensation statistics, (c) airflow sensation statistics, (d) thermal expectation statistics, (e) wet expectation statistics, (f) airflow expectation statistics.
Buildings 15 01129 g010
Figure 11. Statistical distribution of monthly household income.
Buildings 15 01129 g011
Figure 12. Monthly residential water consumption.
Buildings 15 01129 g012
Figure 13. Monthly residential gas consumption.
Buildings 15 01129 g013
Figure 14. Monthly residential electricity consumption.
Buildings 15 01129 g014
Figure 15. Statistical distribution of willingness to adopt solar photovoltaic technology.
Buildings 15 01129 g015
Figure 16. Aspects of satisfaction with the use of these renewable energy devices.
Buildings 15 01129 g016
Figure 17. Aspects of dissatisfaction with the use of these renewable energy devices.
Buildings 15 01129 g017
Figure 18. Reasons for not using these renewable energy devices.
Buildings 15 01129 g018
Disclaimer/Publisher’s Note: The statements, opinions and data contained in all publications are solely those of the individual author(s) and contributor(s) and not of MDPI and/or the editor(s). MDPI and/or the editor(s) disclaim responsibility for any injury to people or property resulting from any ideas, methods, instructions or products referred to in the content.

