
The Relationship Between an Urban Neighborhood Block’s Spatial Form and Its Outdoor Thermal Environment: A Case Study of Changsha


Abstract
1. Introduction
2. Literature Review
3. Materials and Methods
3.1. Technical Approach
3.1.1. Technical Route
3.1.2. Data Source
3.1.3. Research Tools
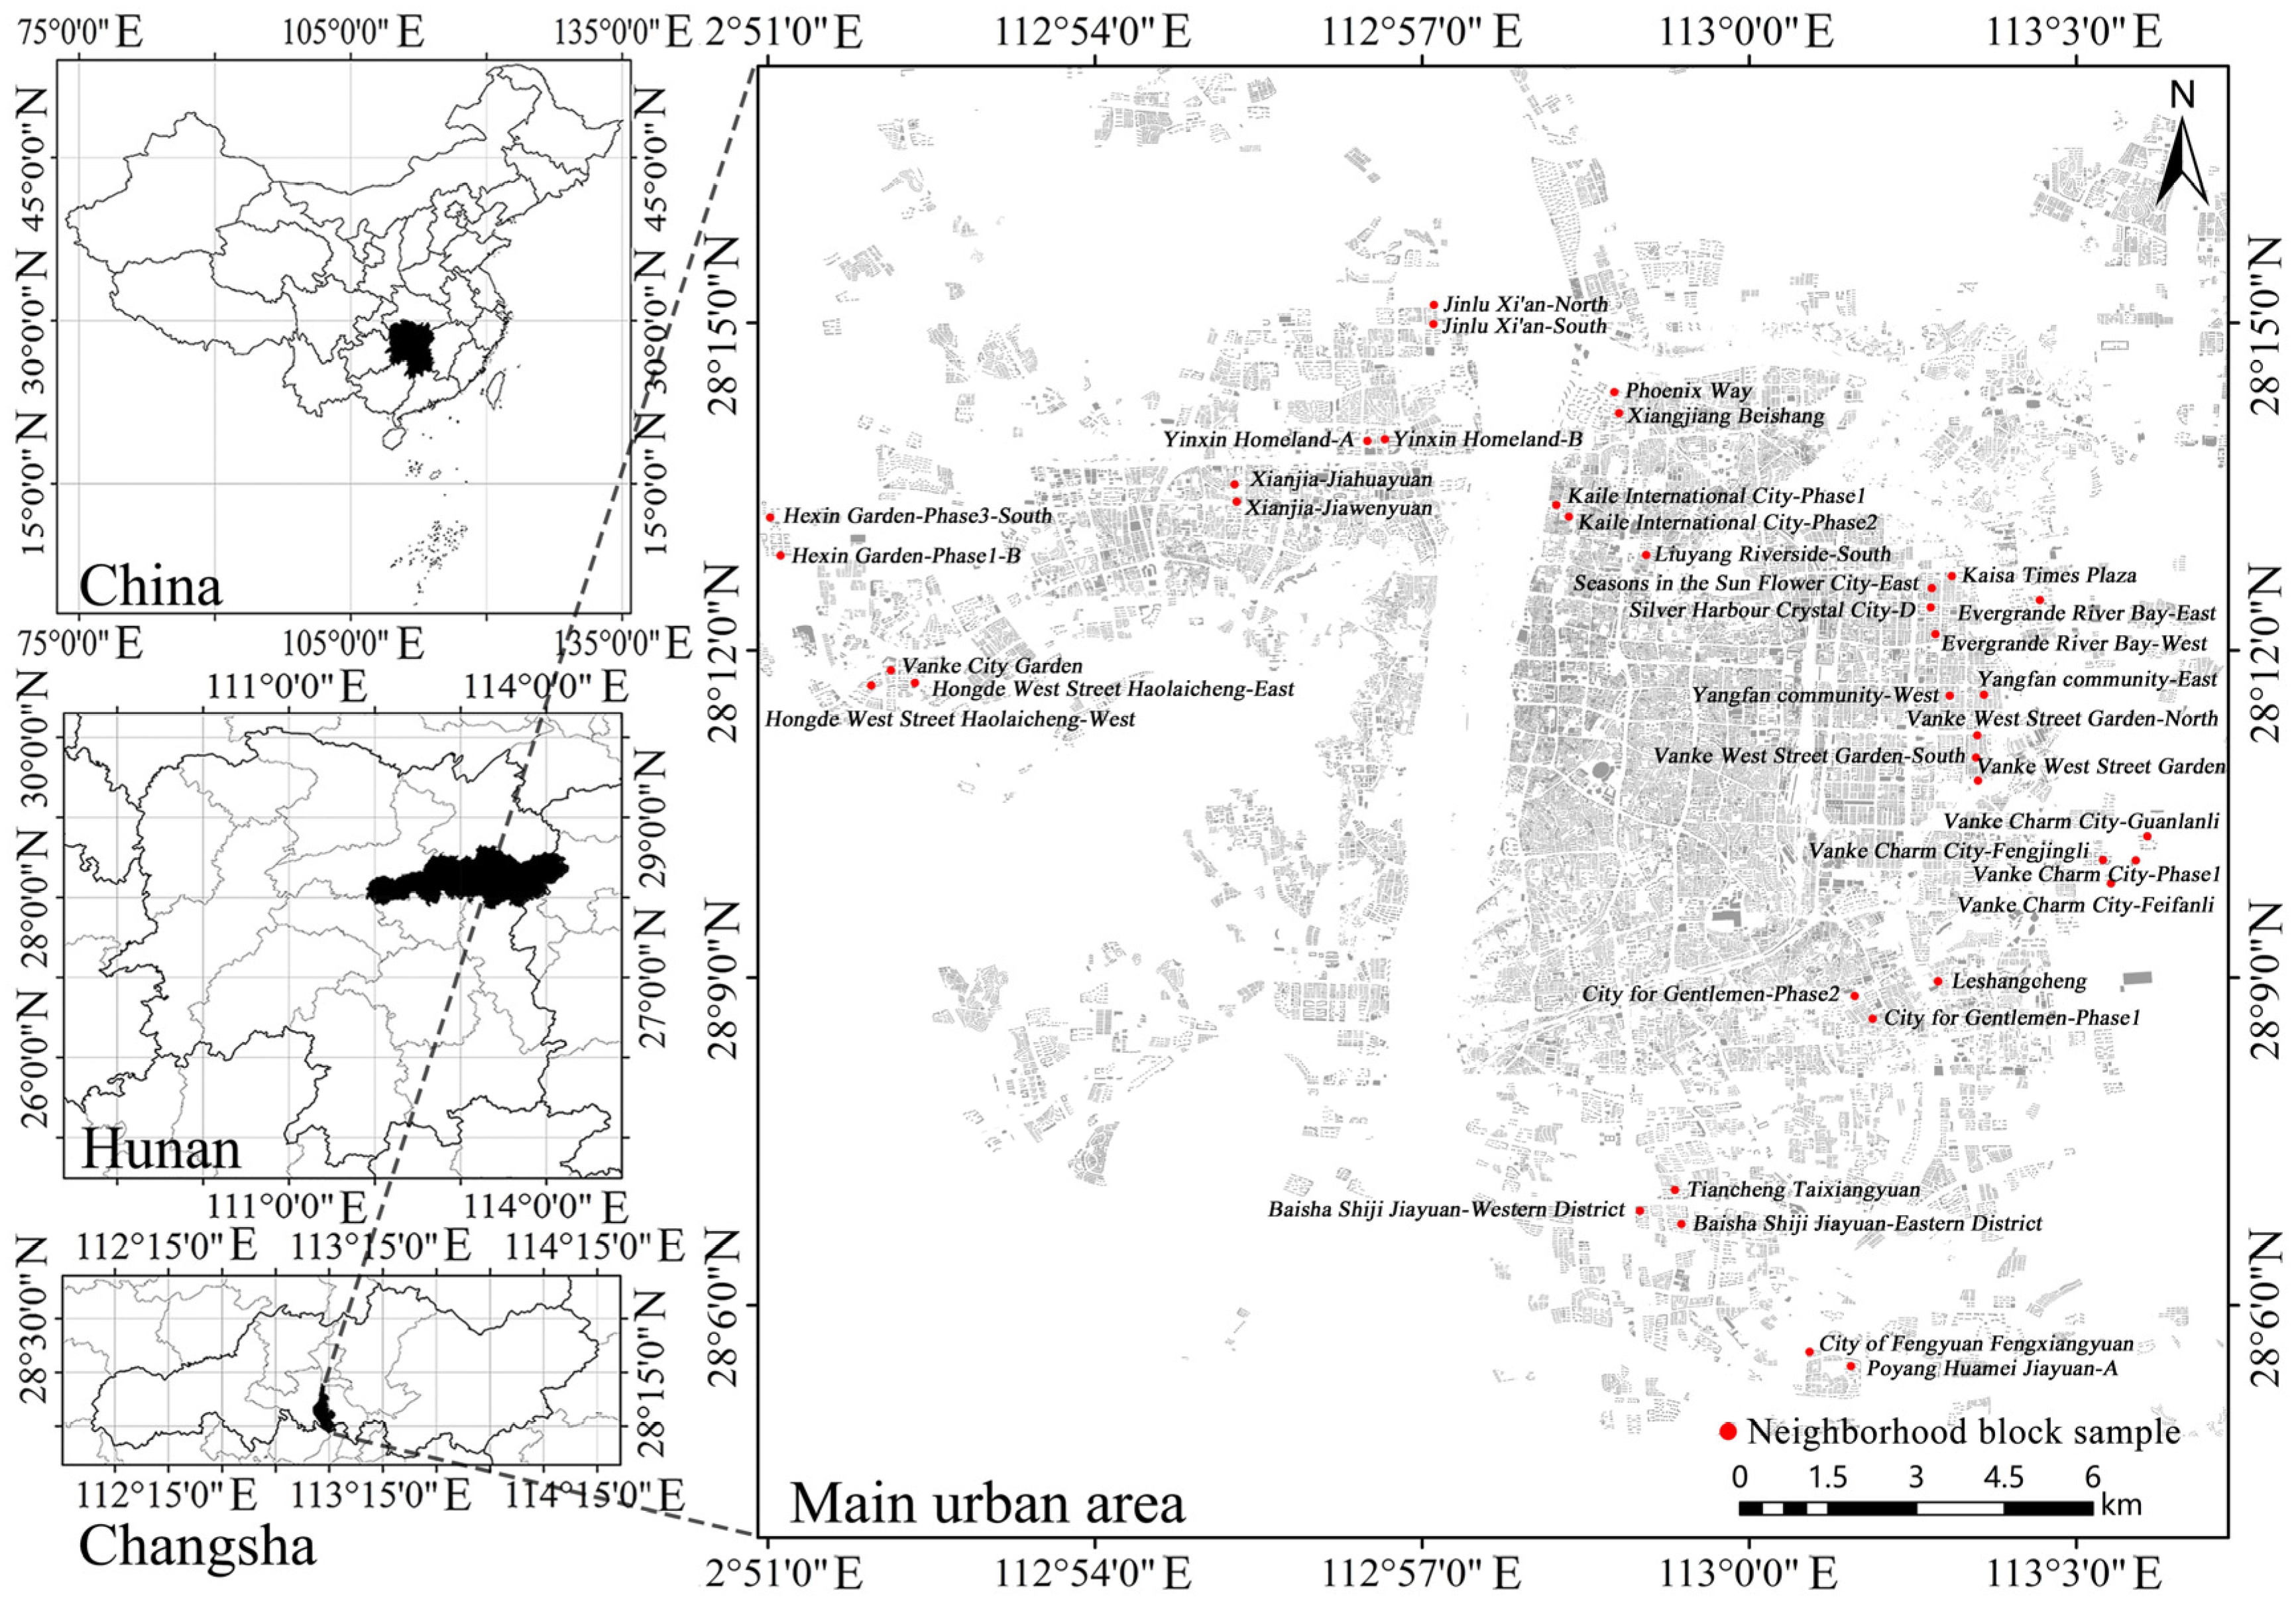
3.2. Study Area
3.3. Spatial Morphology Indicator System
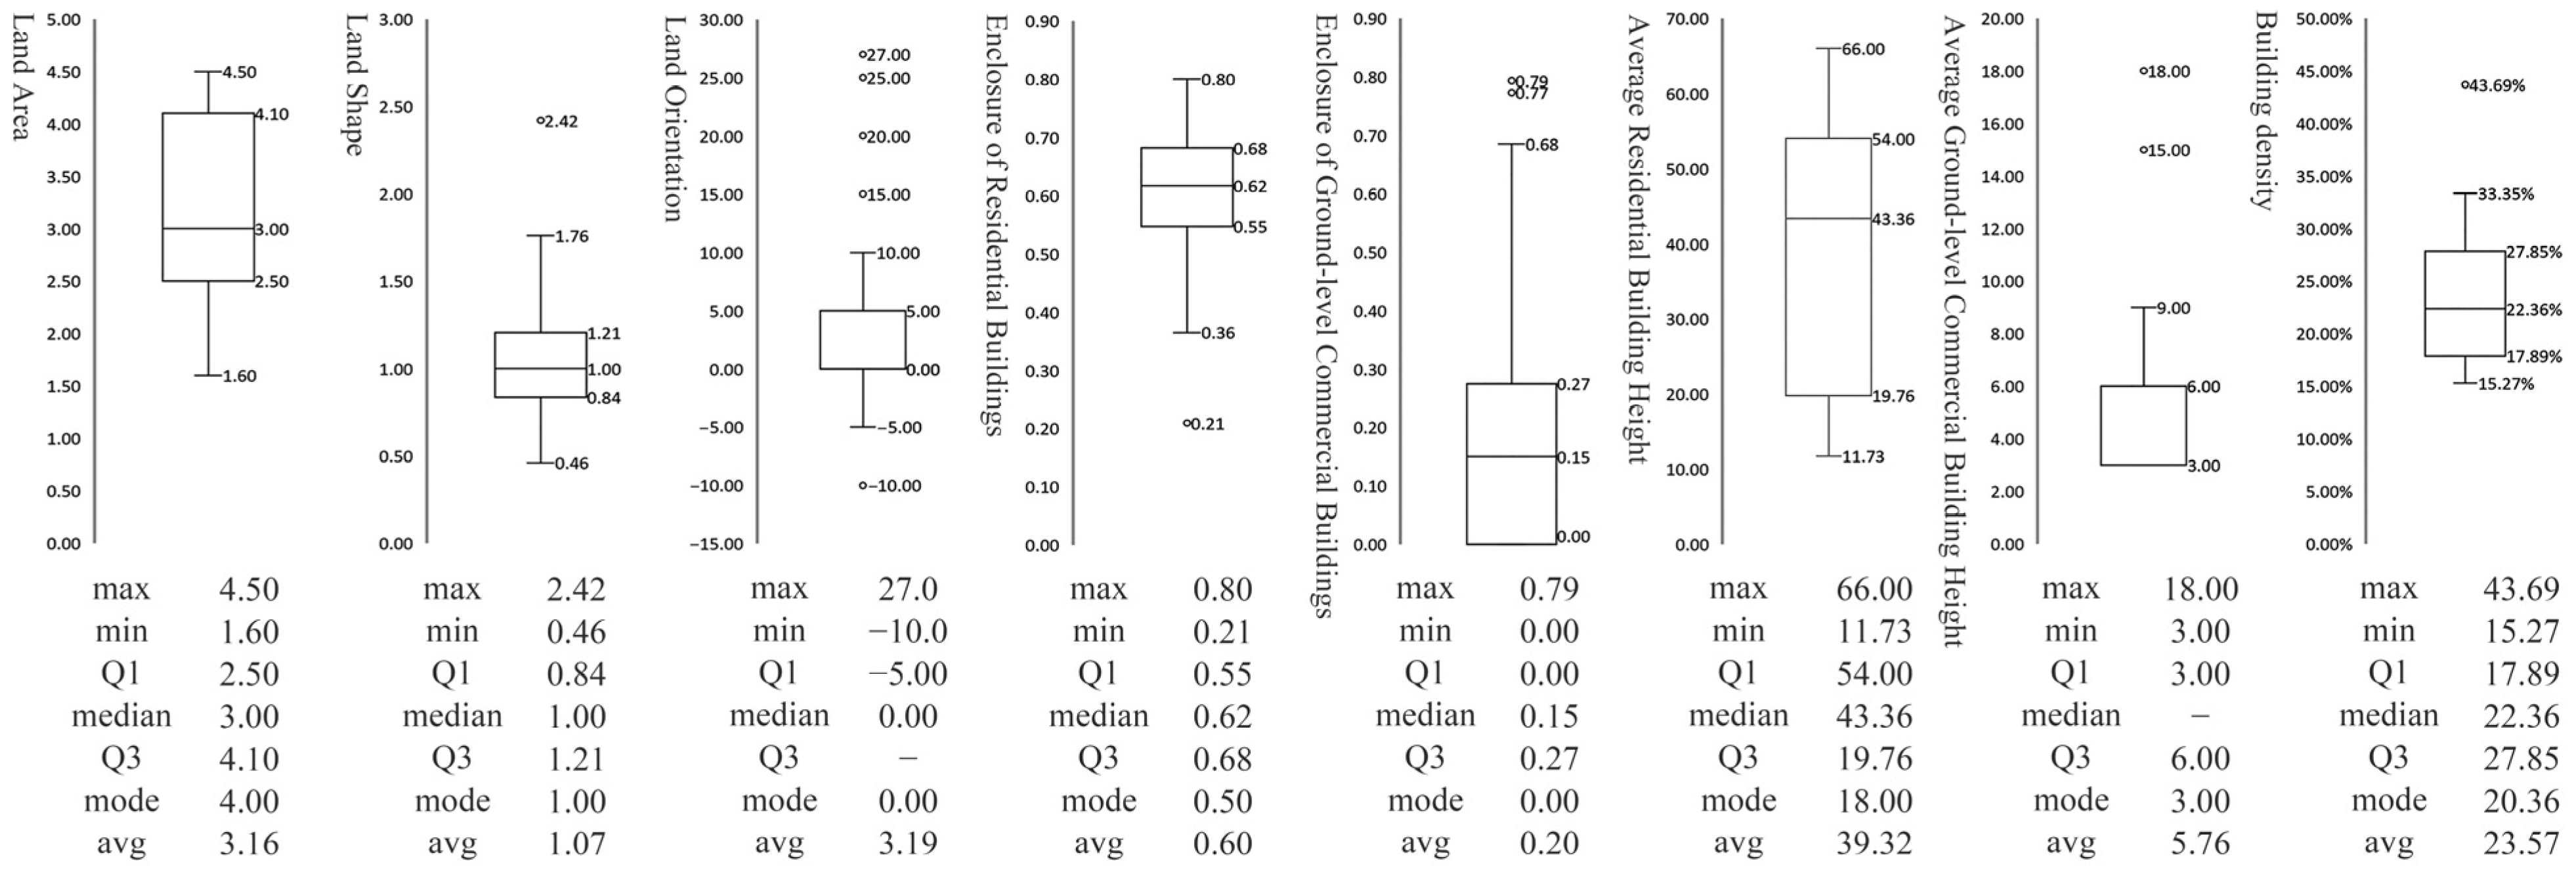
3.4. Quantification of Spatial Morphology Indicators
3.5. Establishment of the Ideal Model
3.5.1. Land Spatial Form Model
- (1)
- Land area
- (2)
- Land orientation
- (3)
- Land shape
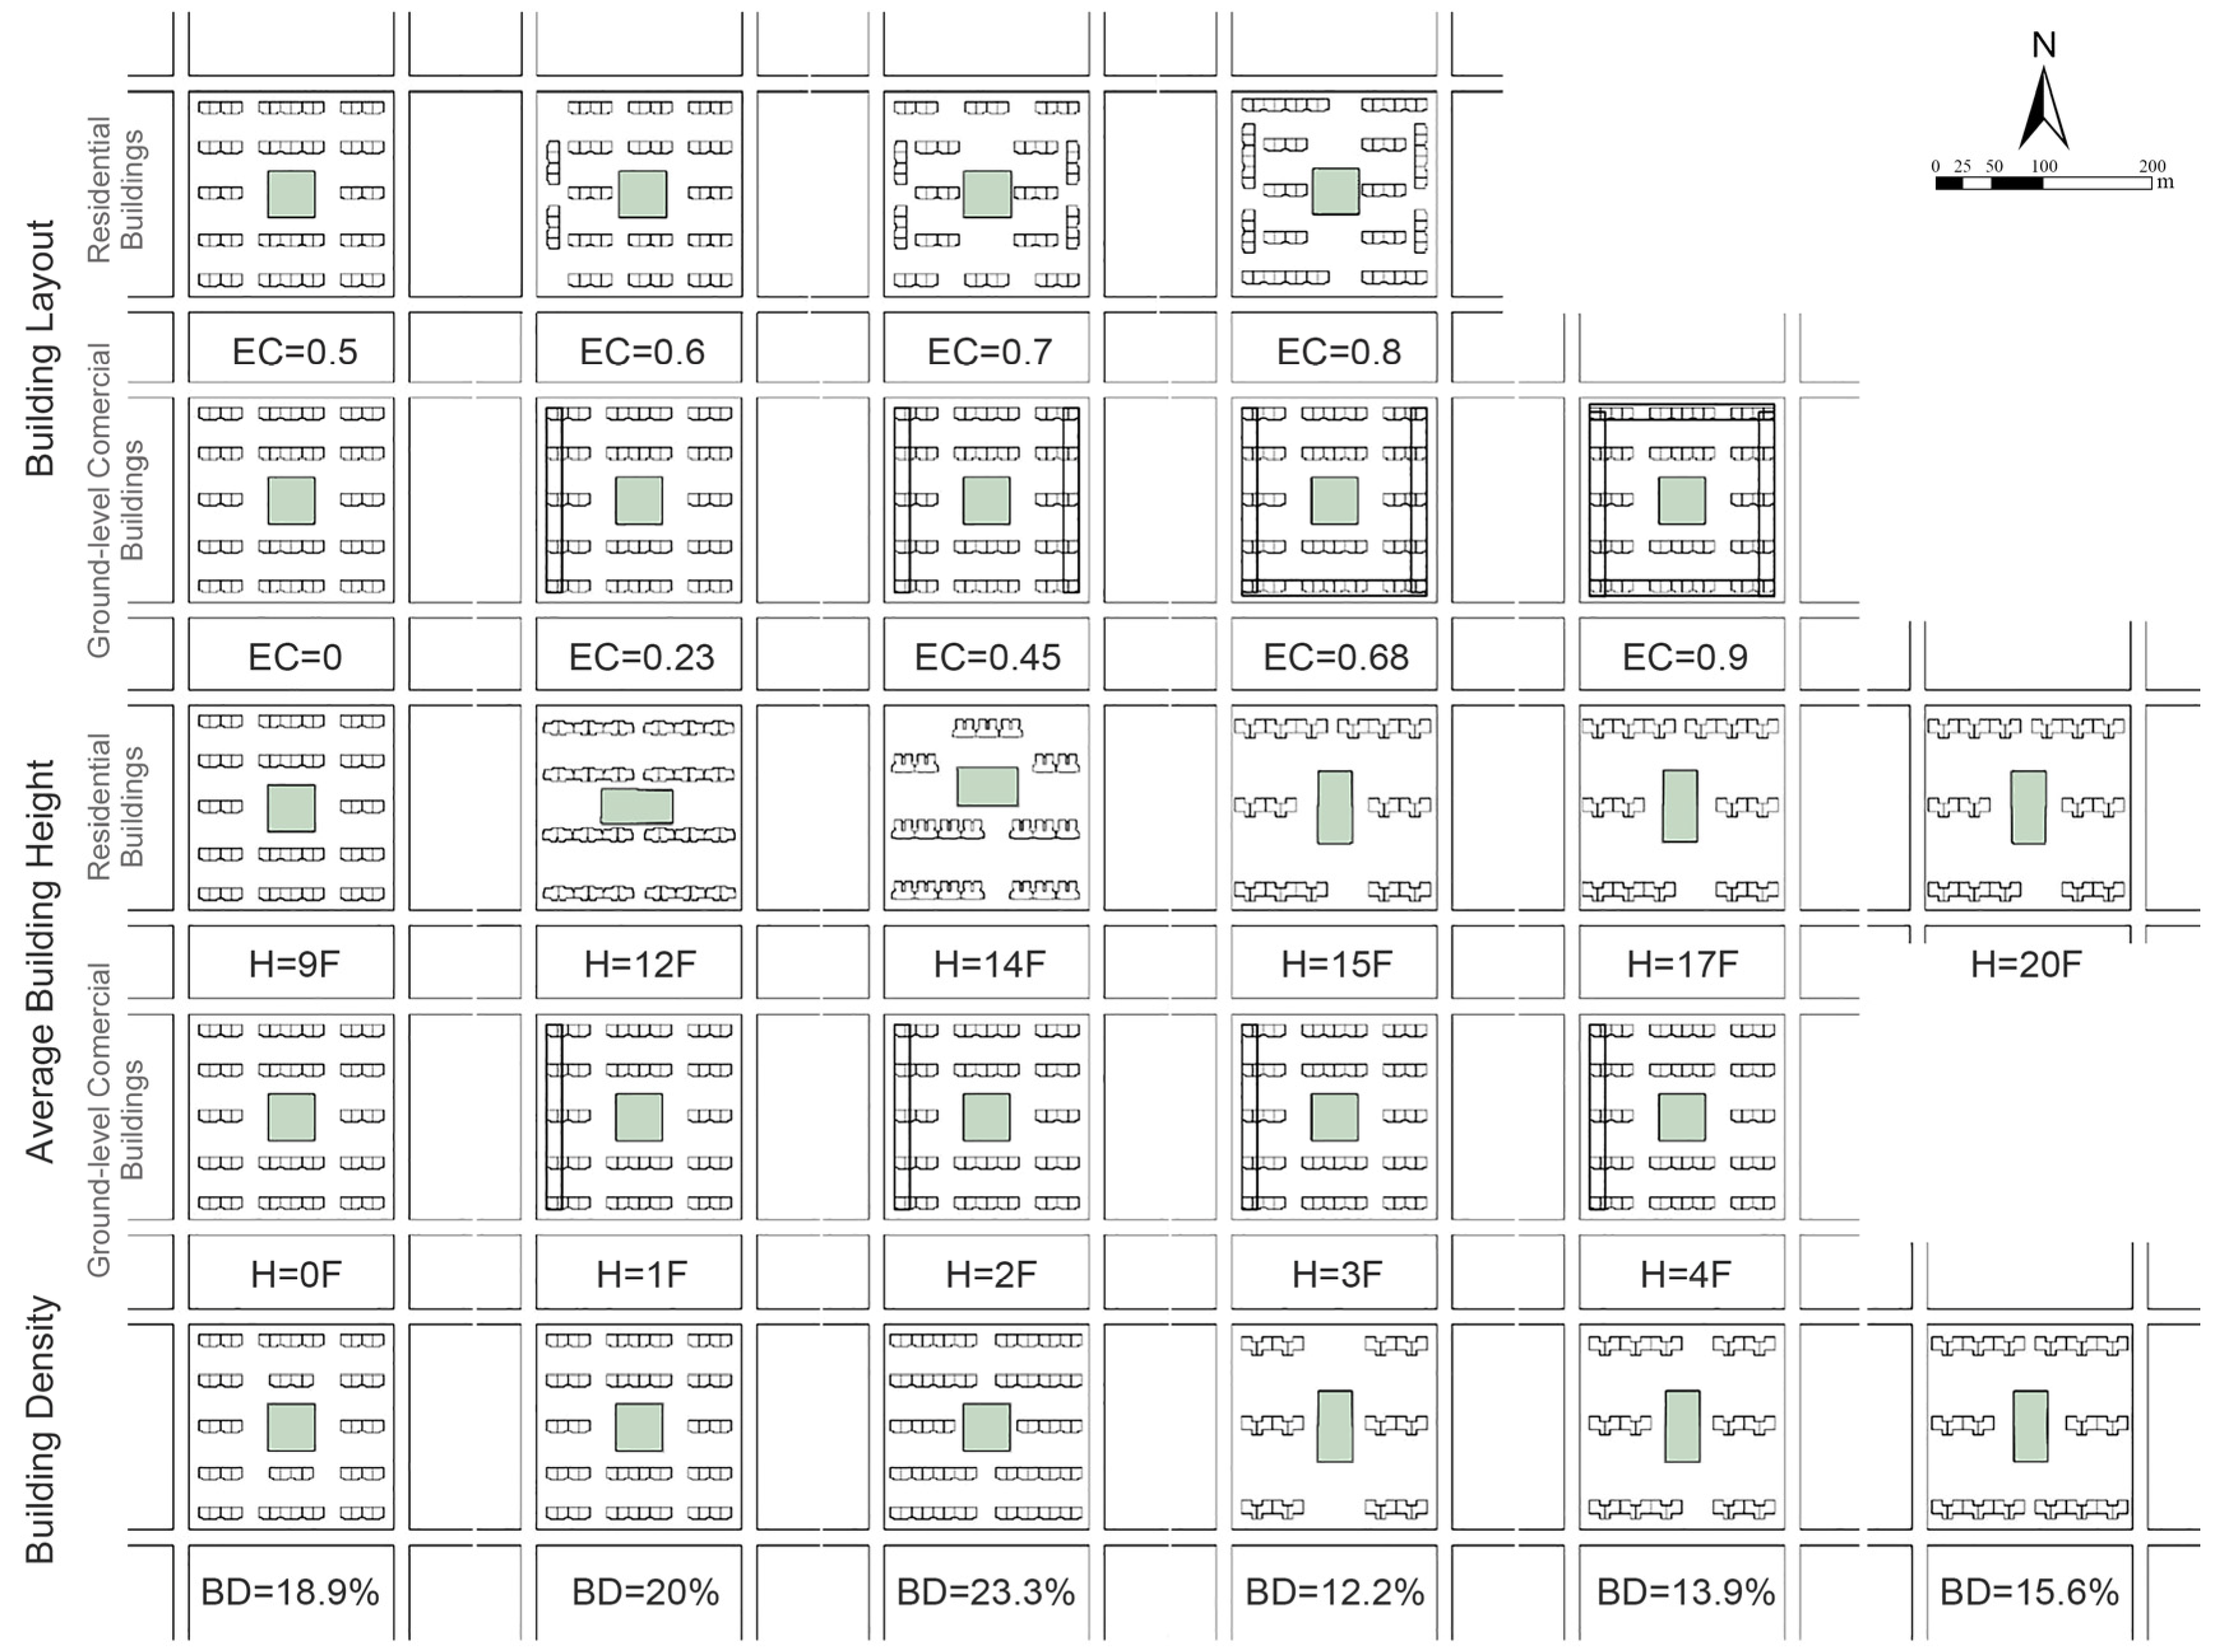
3.5.2. Building Combination Spatial Form Model
- (1)
- Building Layout
- (2)
- Average Building Height
- (3)
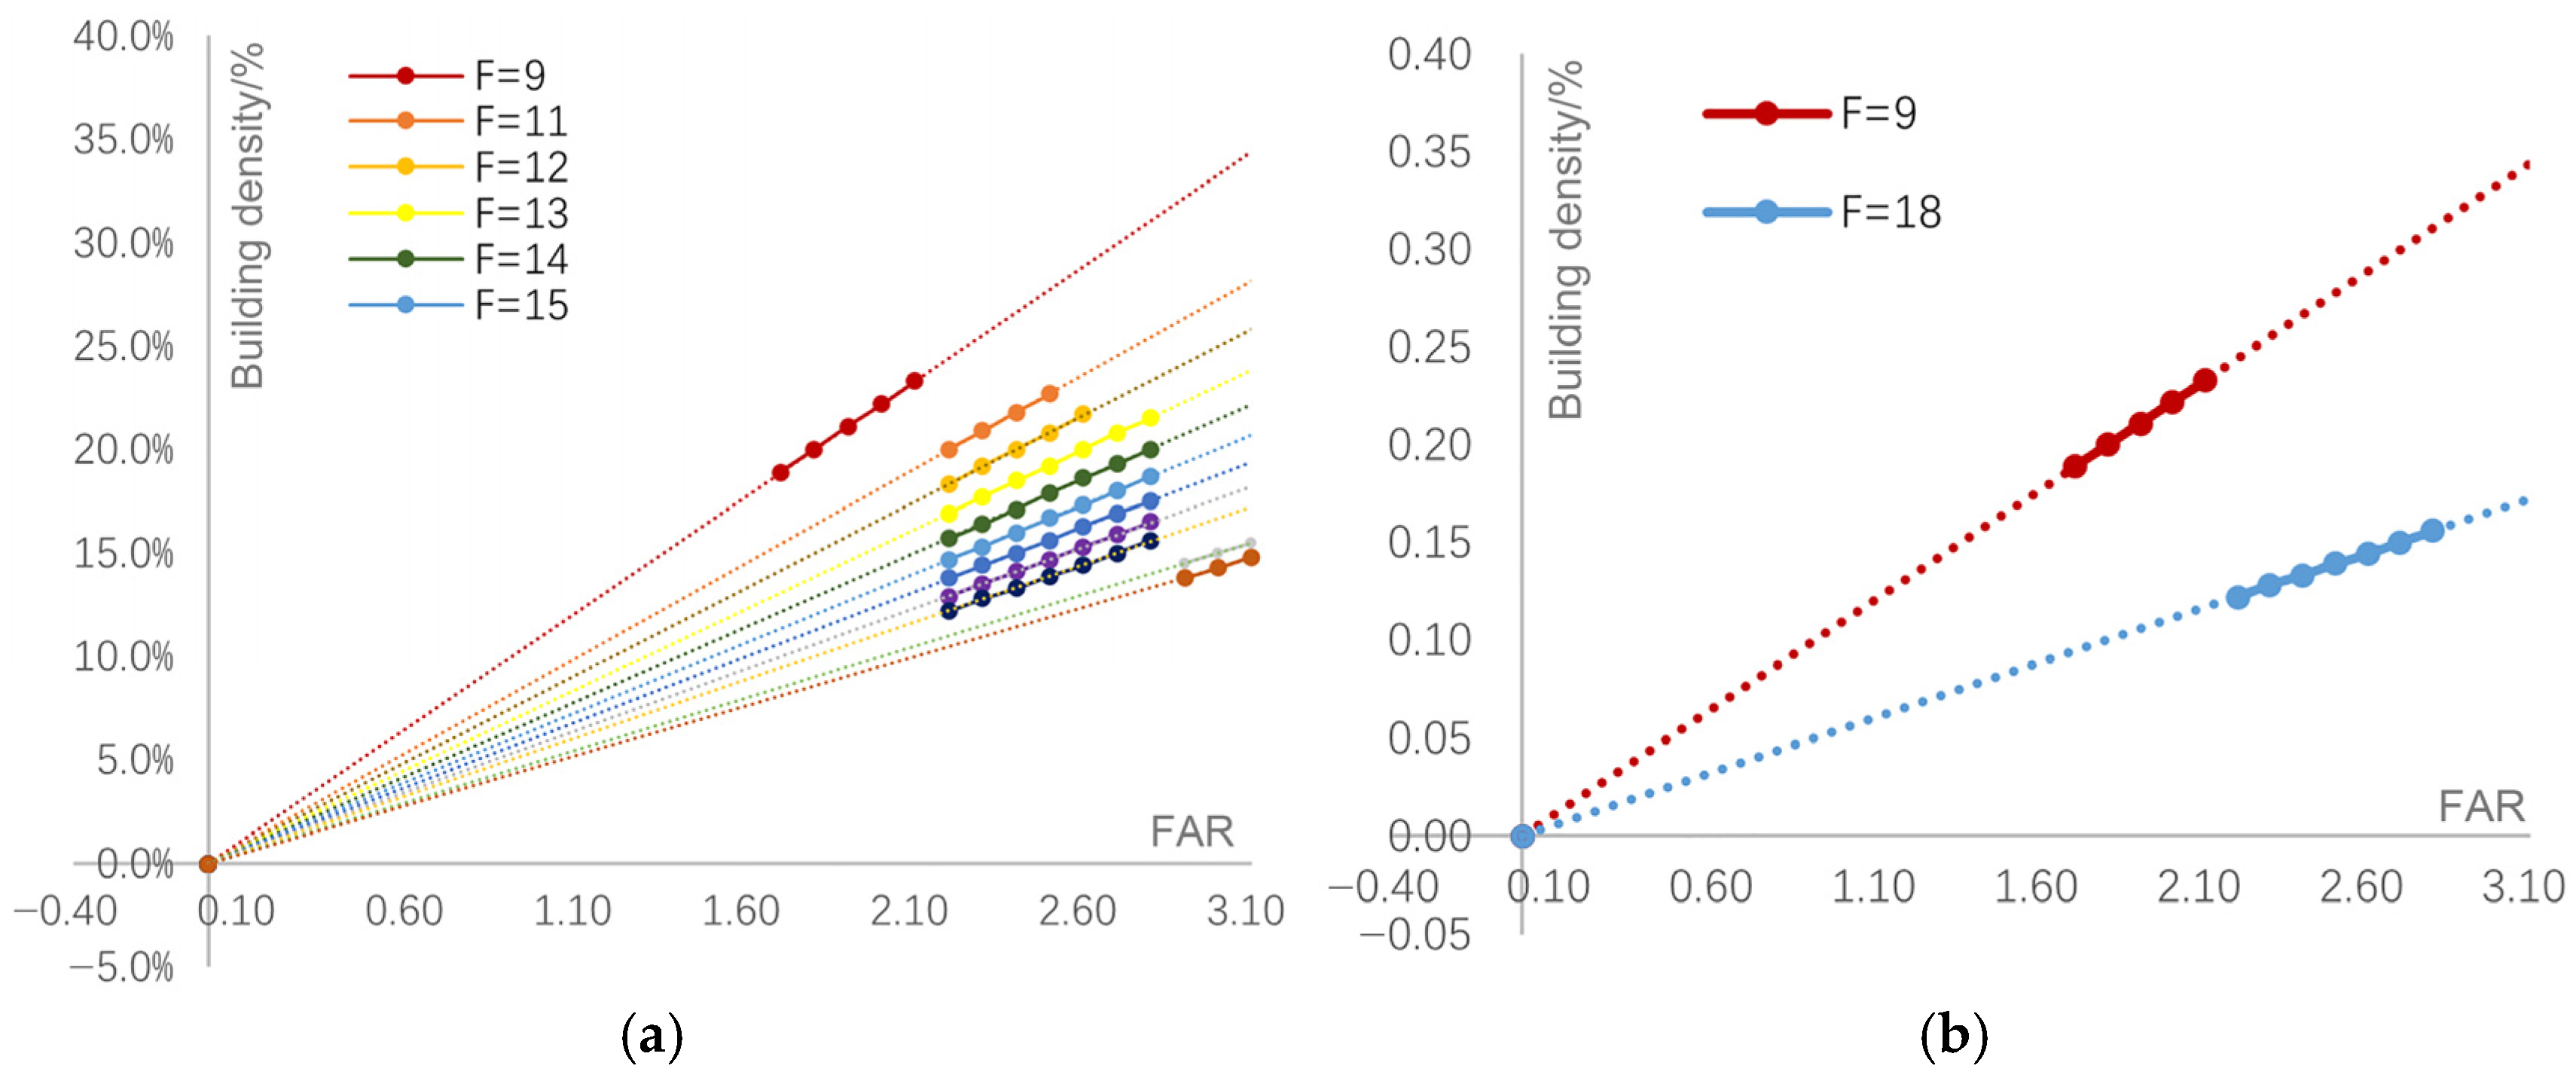
- Building Density
3.6. Description of Ideal Simulation Experiment and Parameter Setting
4. Results
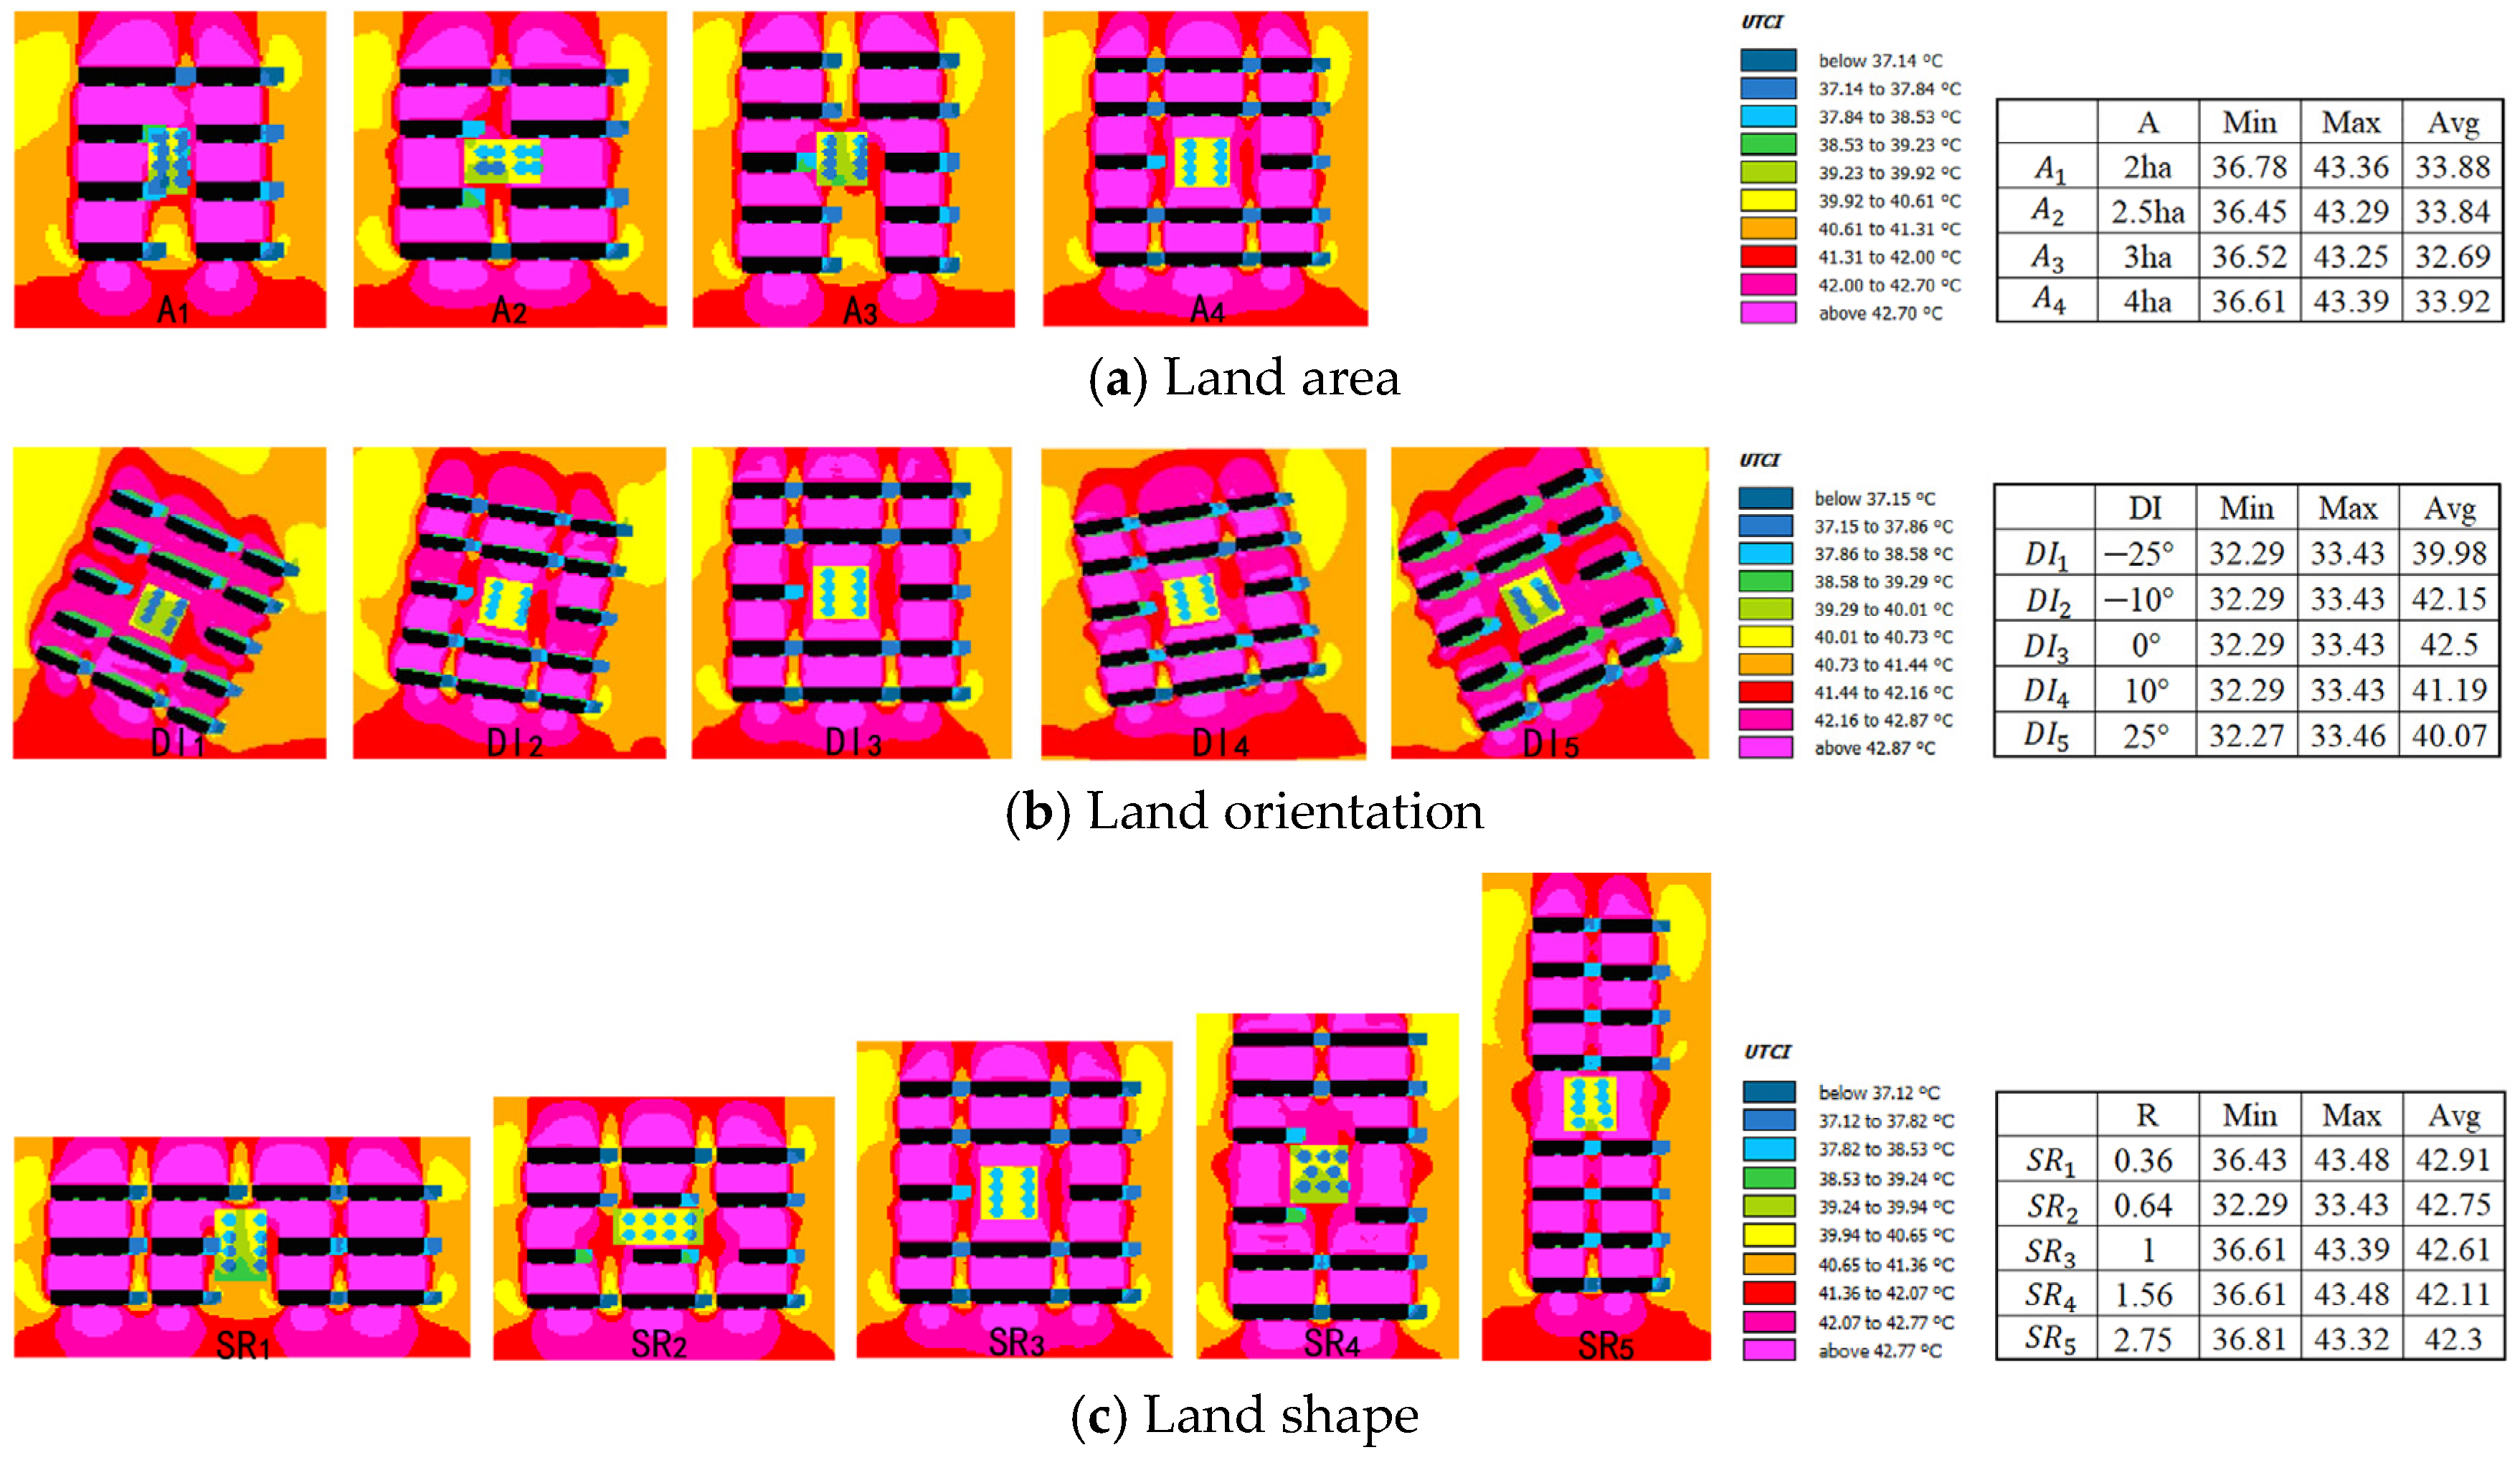
4.1. Relationship Between Land Spatial Form and Outdoor Thermal Environment
4.1.1. Relationship Between Land Area and Outdoor Thermal Environment
4.1.2. Relationship Between Land Orientation and Outdoor Thermal Environment
4.1.3. Relationship Between Land Shape and Outdoor Thermal Environment
4.2. Relationship Between Building Combination Spatial Form and Outdoor Thermal Environment
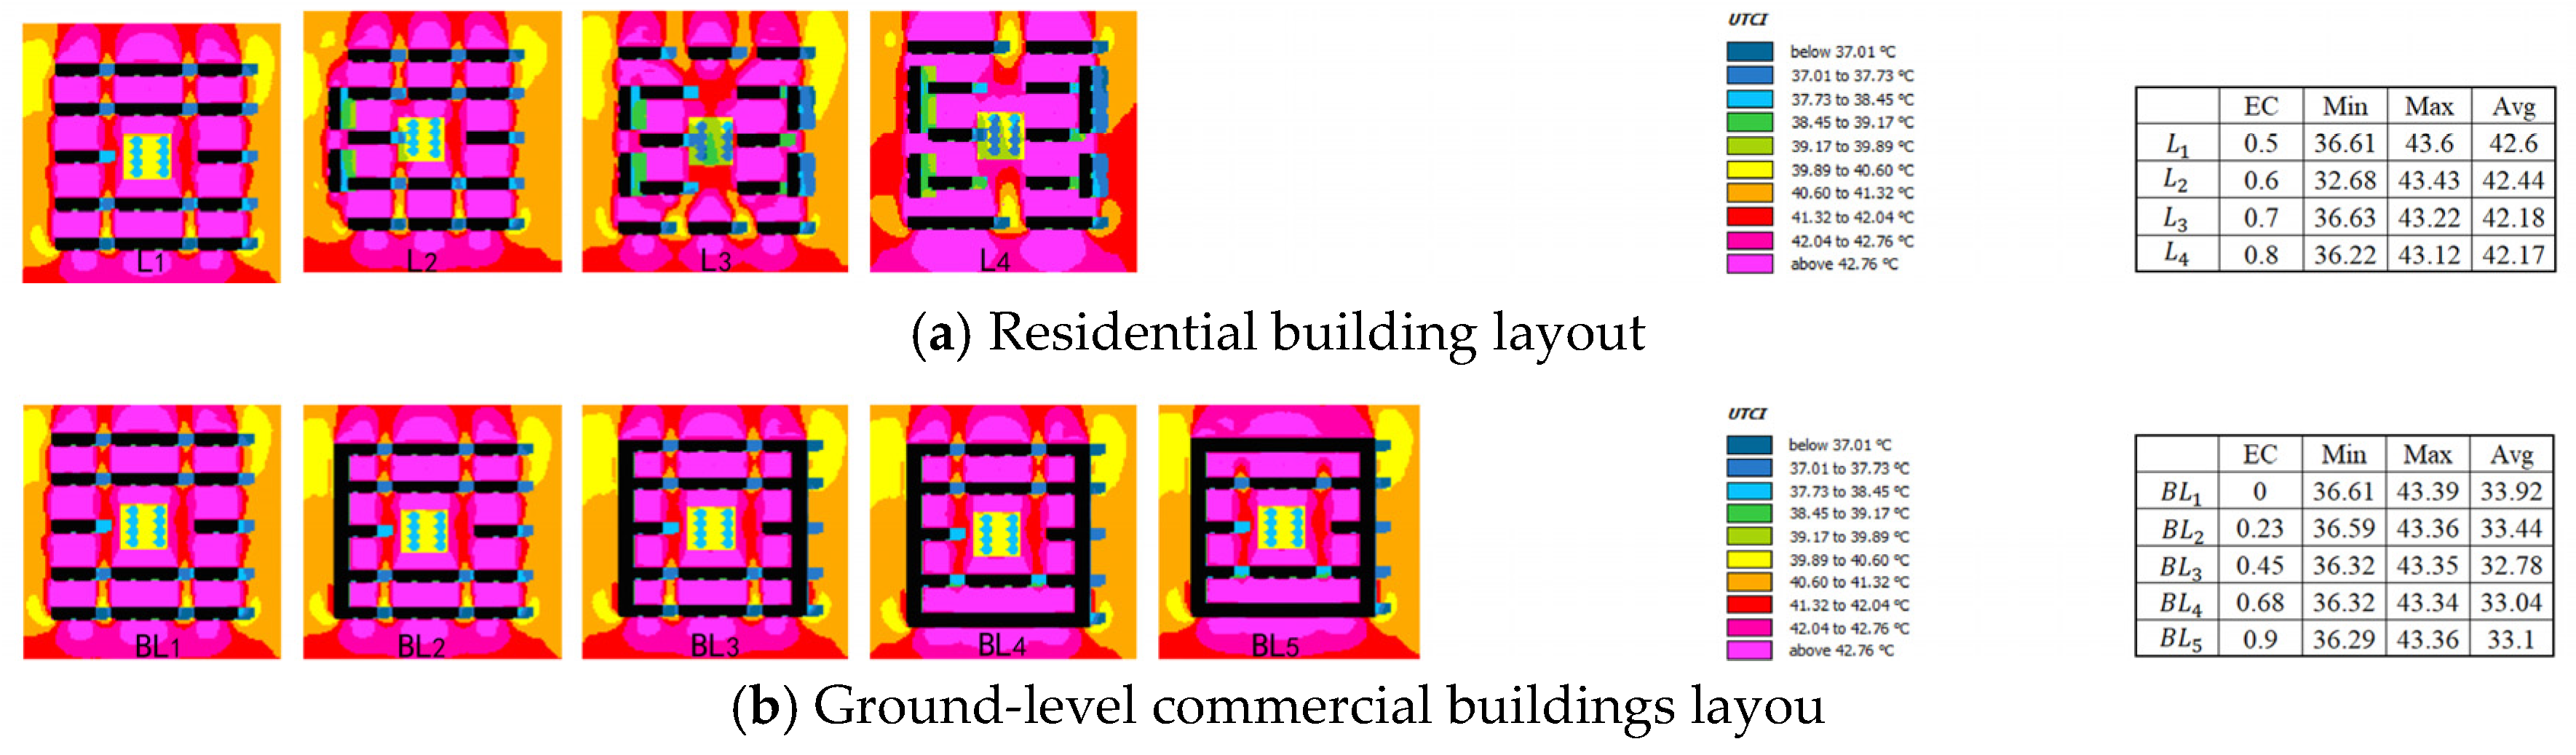
4.2.1. Relationship Between Building Layout and Outdoor Thermal Environment
- (1)
- Residential building layout
- (2)
- Ground-level commercial buildings layout
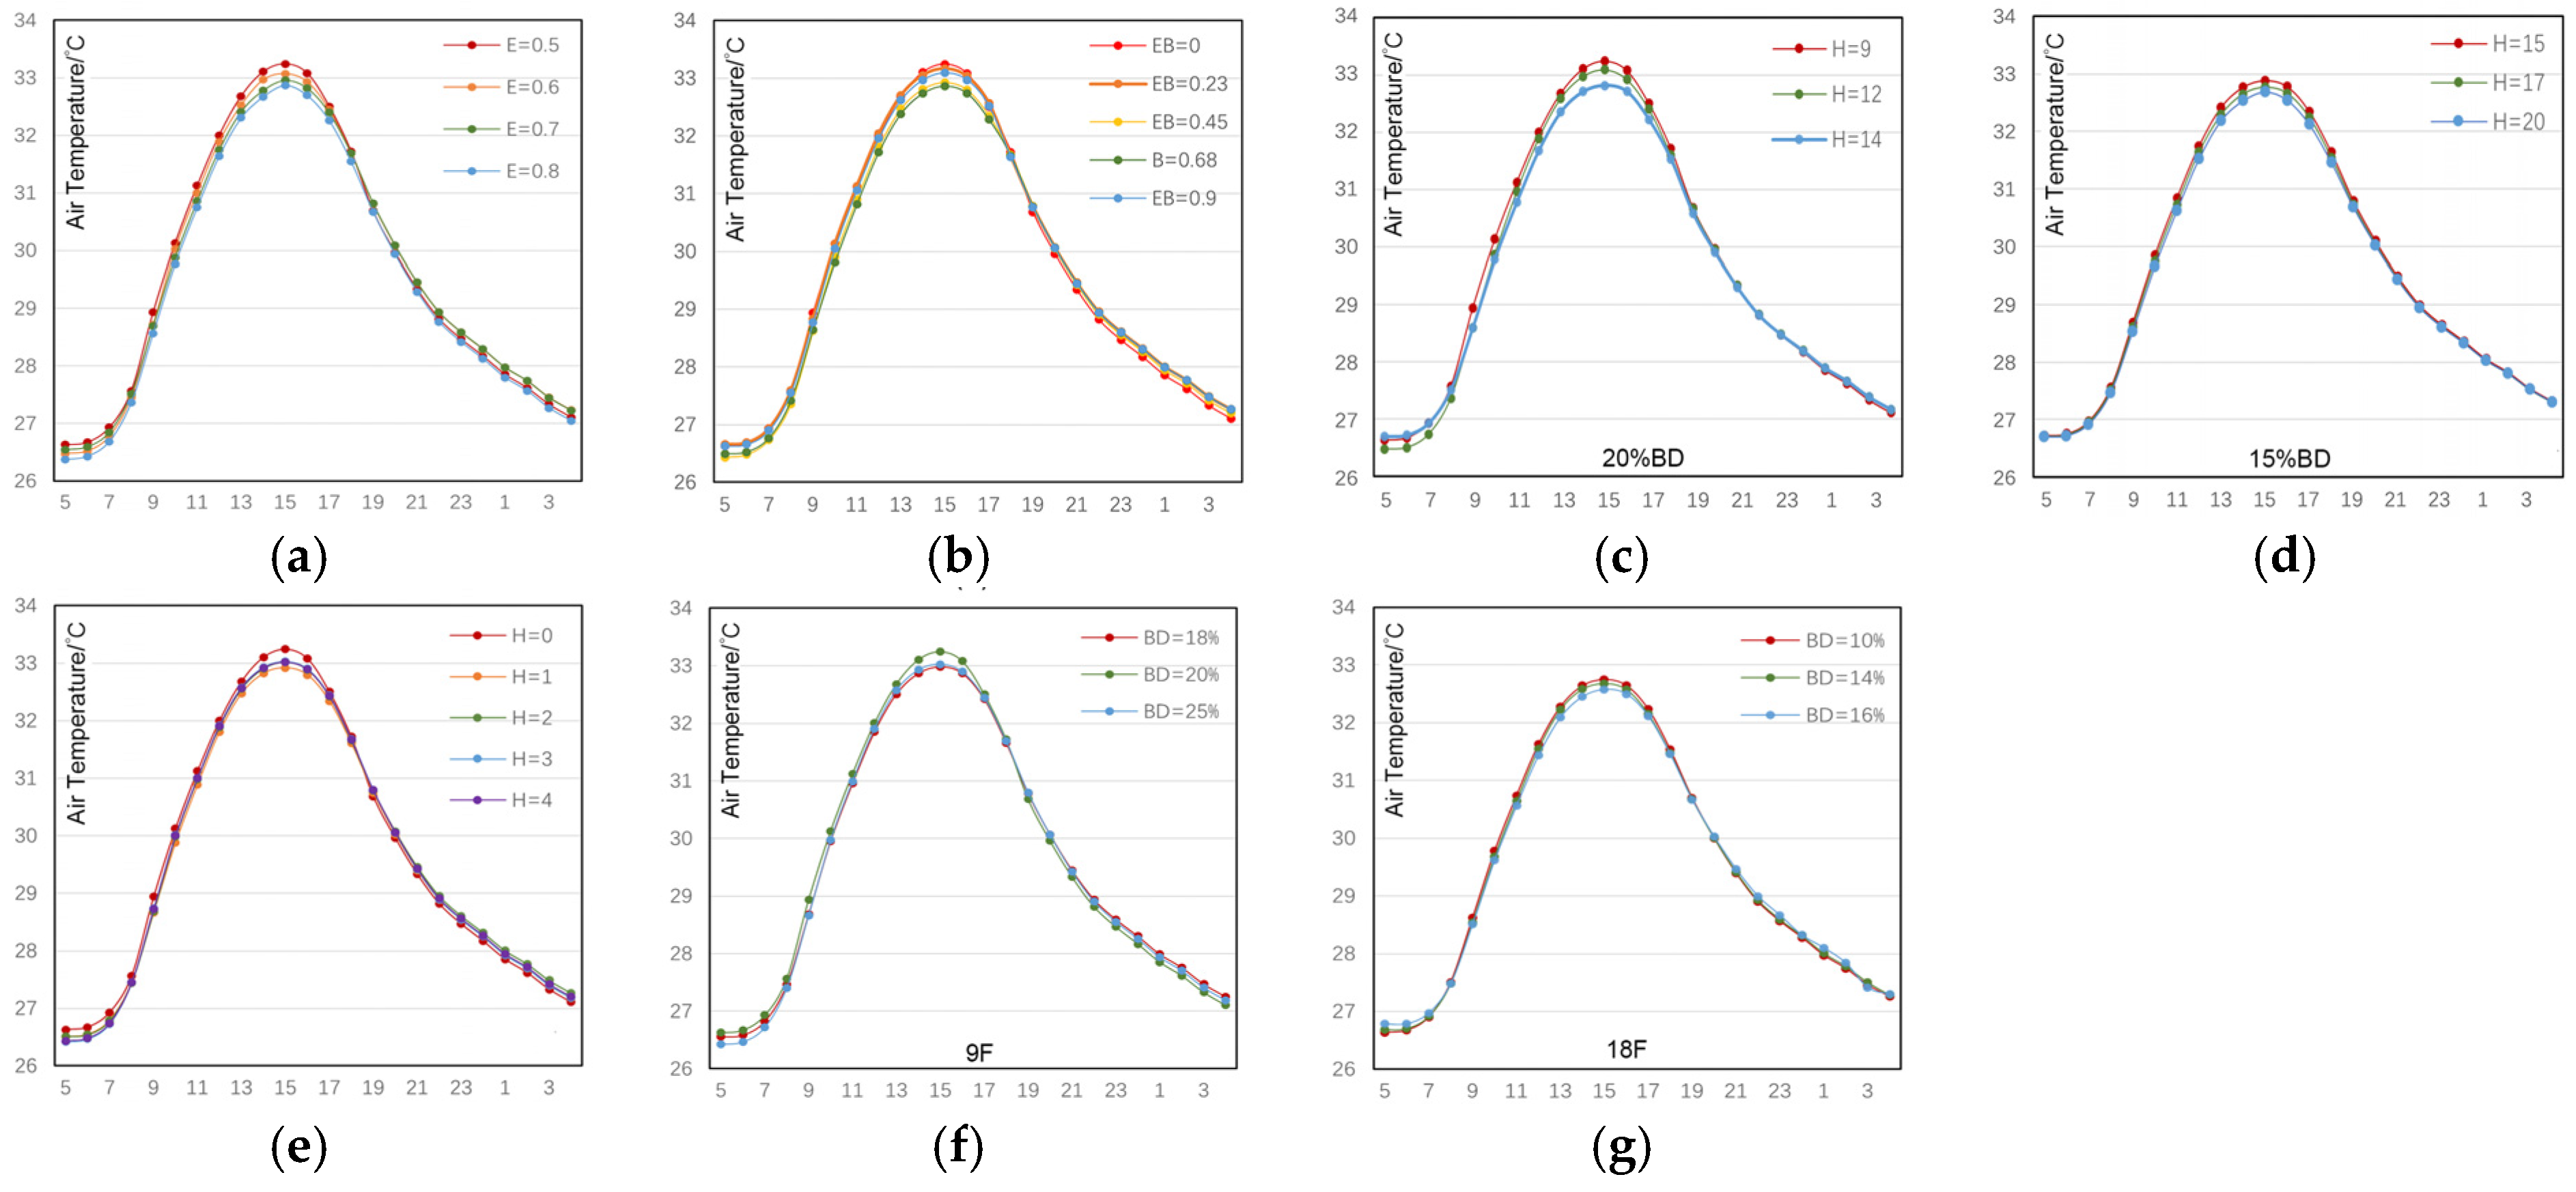
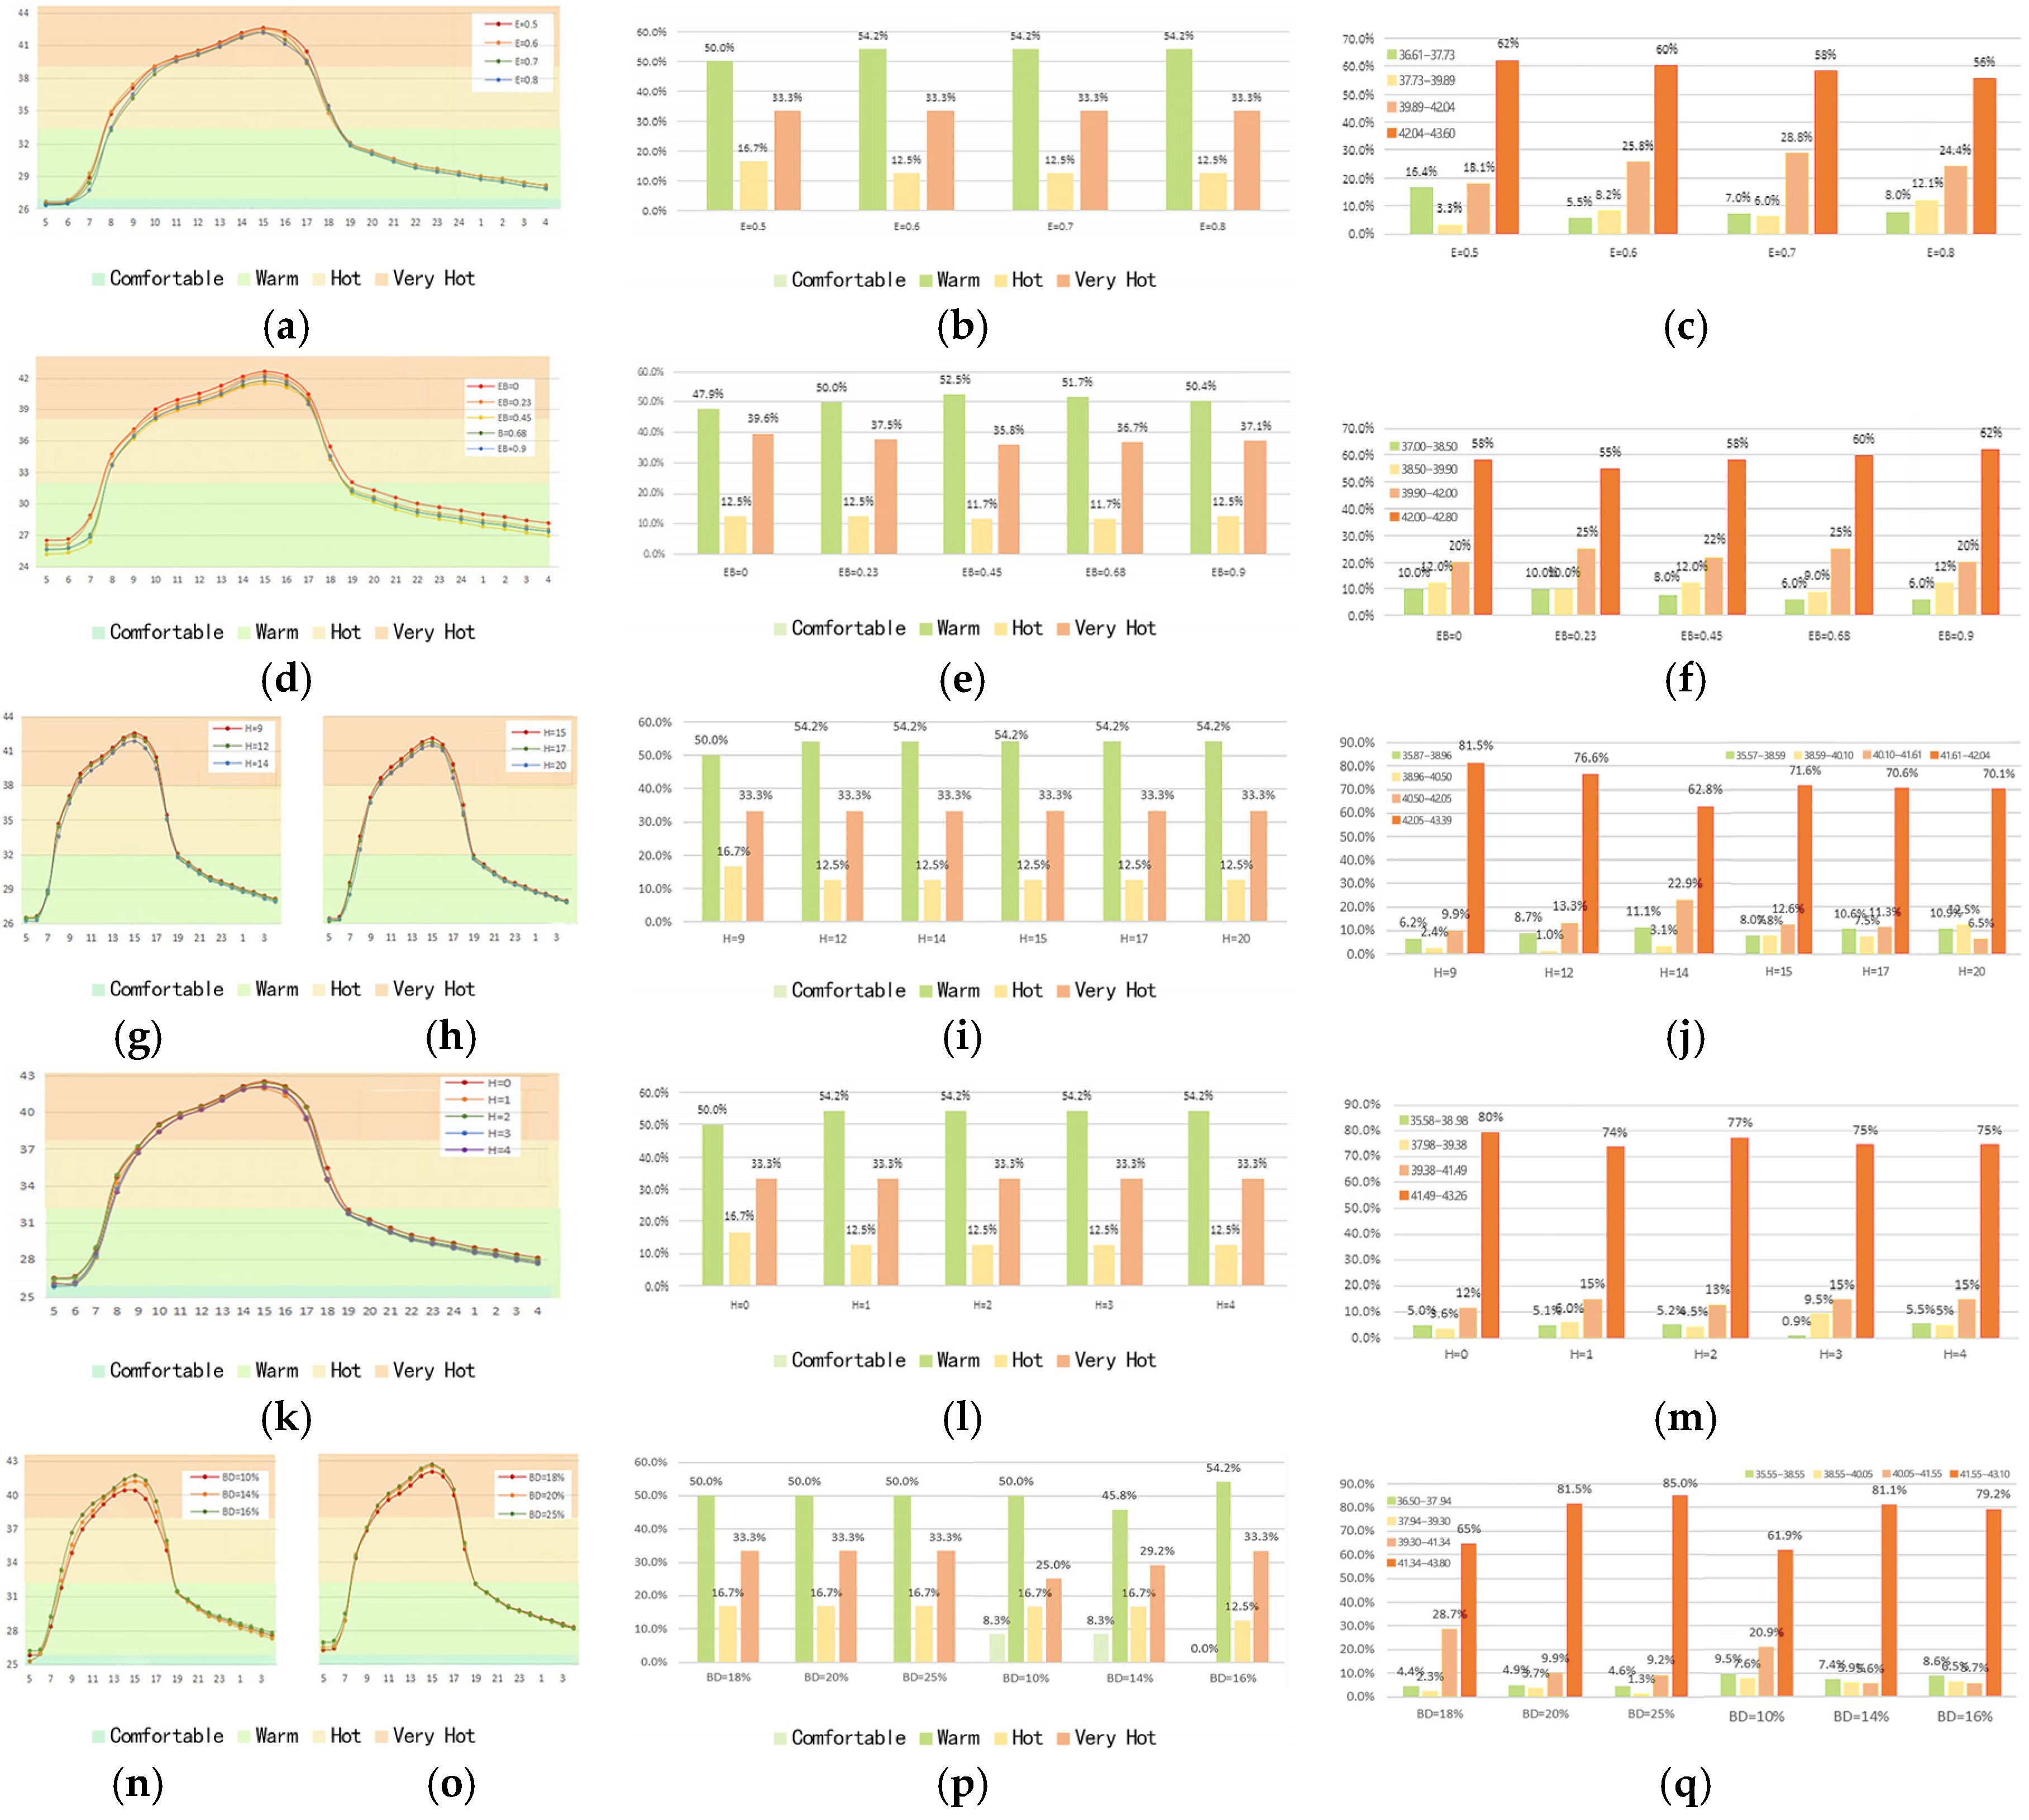
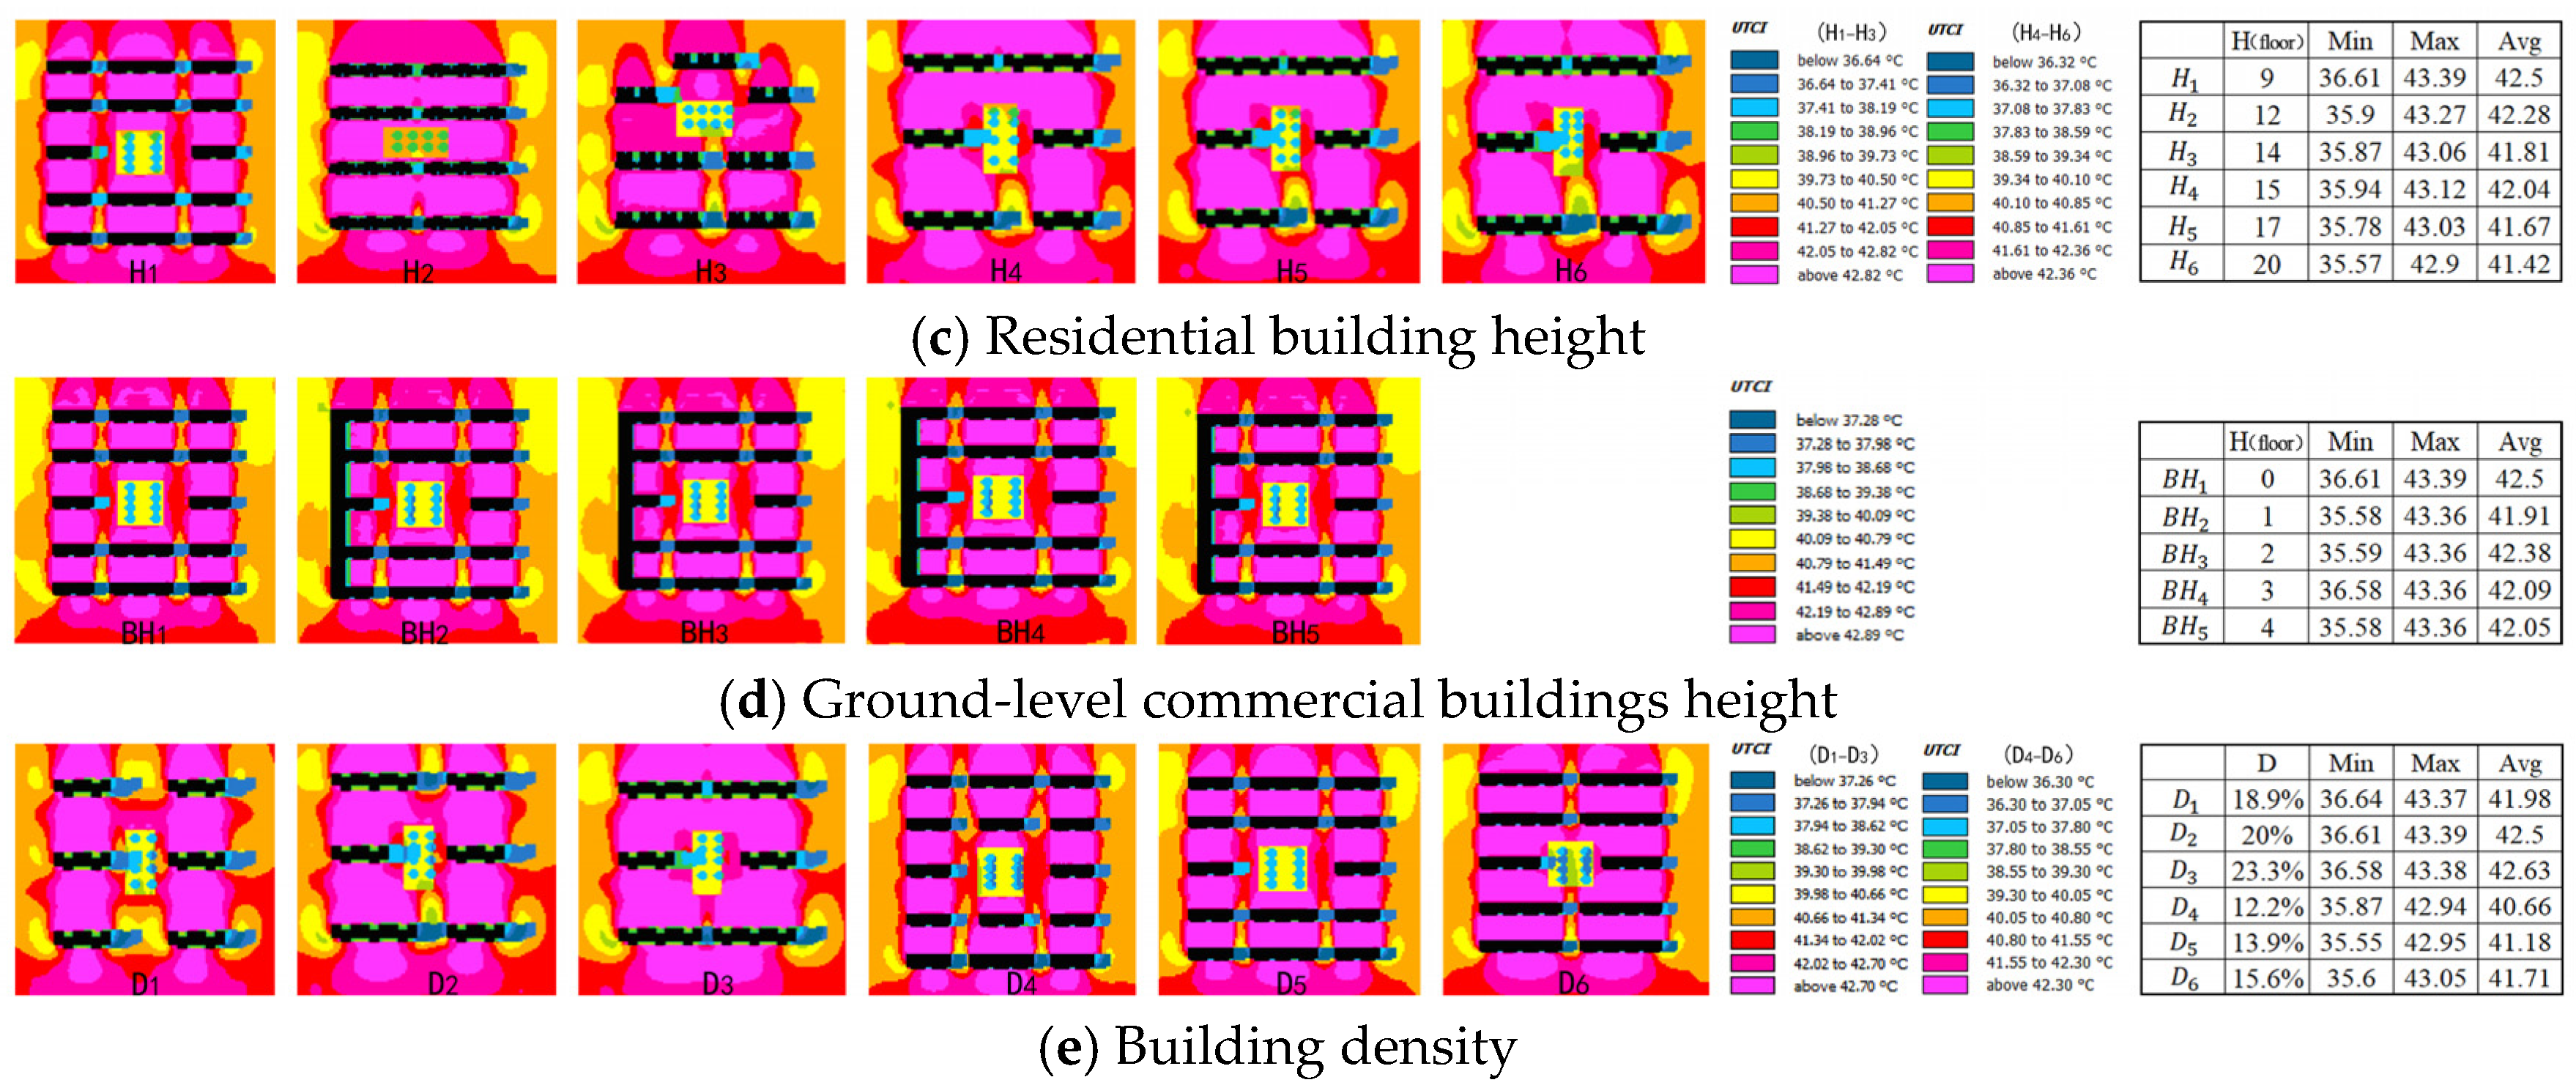
4.2.2. Relationship Between Average Building Height and Outdoor Thermal Environment
- (1)
- Residential building height
- (2)
- Ground-level commercial buildings height
4.2.3. Relationship Between Building Density and Outdoor Thermal Environment
4.3. Summary of Results
- Land Orientation: South-north-aligned orientations (0°) yielded the least favorable thermal environment. Thermal comfort improved with larger absolute deflection angles, with southeast-oriented layouts (negative angles) outperforming northwest-oriented counterparts in heat dissipation and UTCI reduction at equivalent angles.
- Building Layout: Increasing enclosure parallel to prevailing east-west winds enhanced thermal comfort, whereas perpendicular north-south enclosure restricted ventilation and degraded comfort.
- Building Height: Higher average residential building heights significantly reduced Ta and UTCI, indicating a positive correlation with thermal comfort and the outdoor thermal environment.
- Building Density: Increased building density negatively impacted thermal comfort by impeding airflow, particularly in high-rise scenarios.
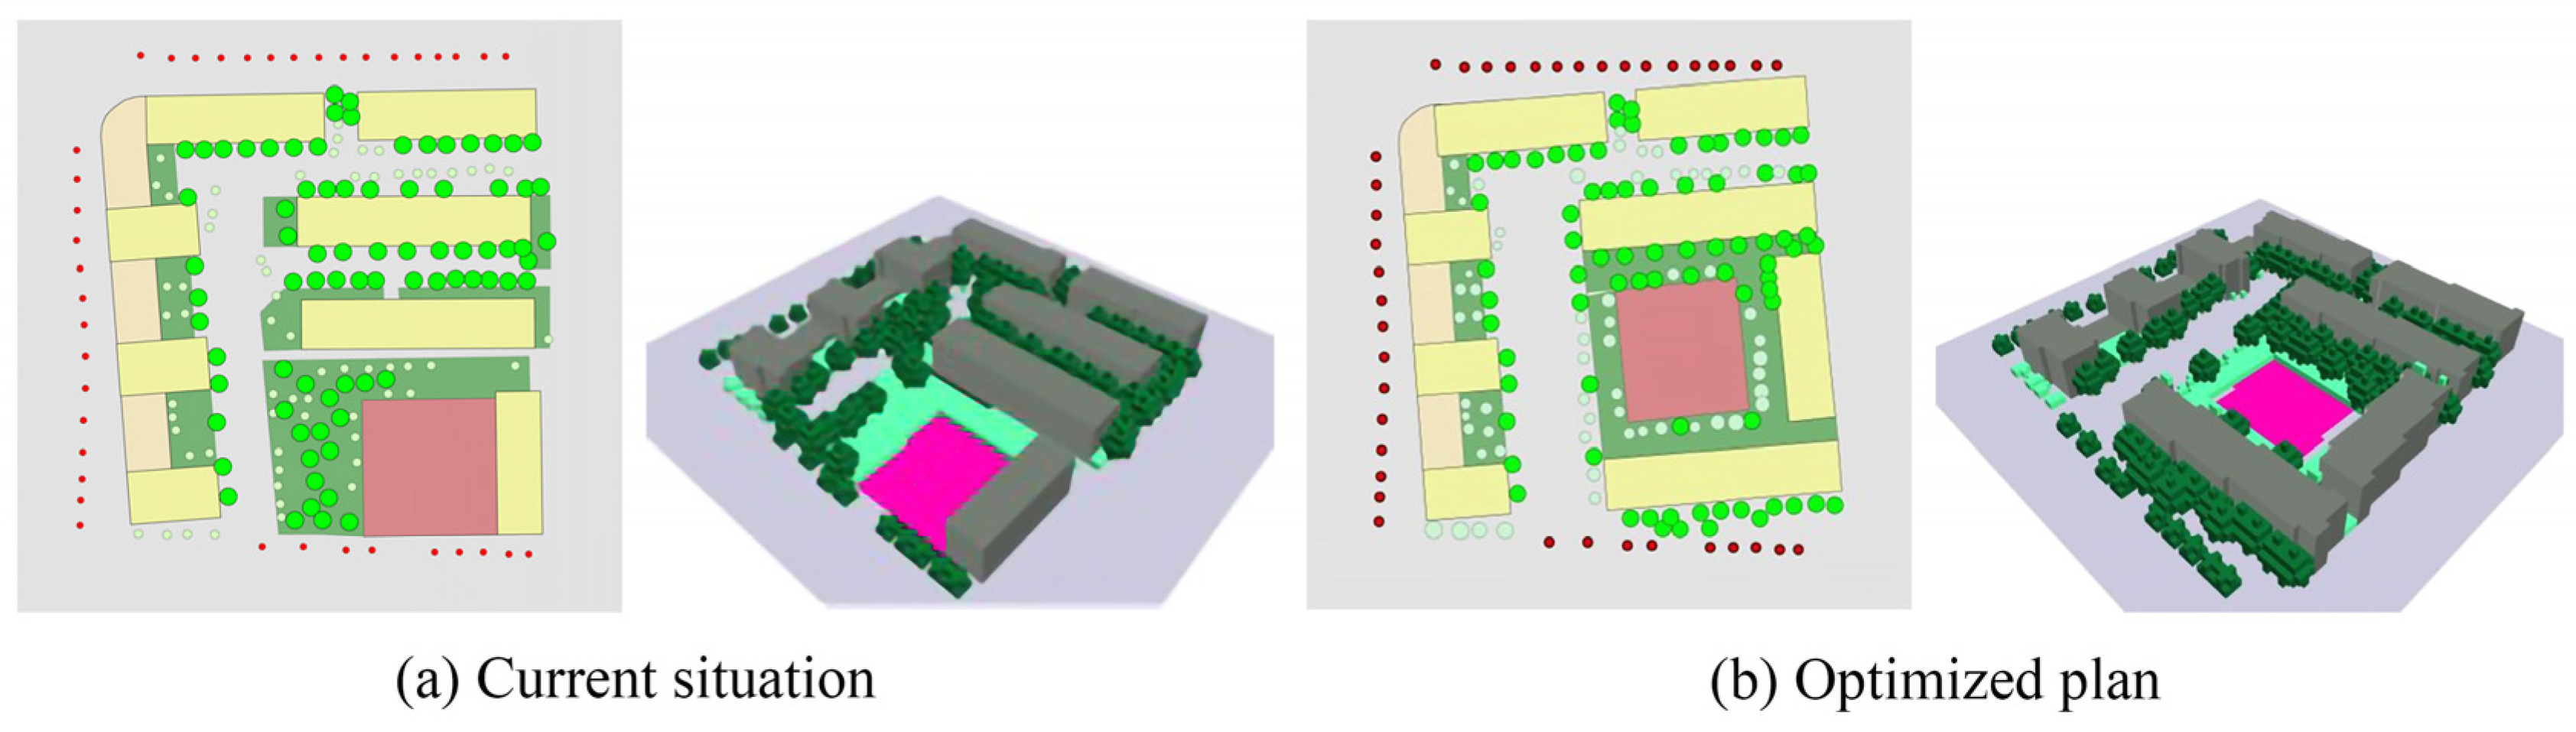
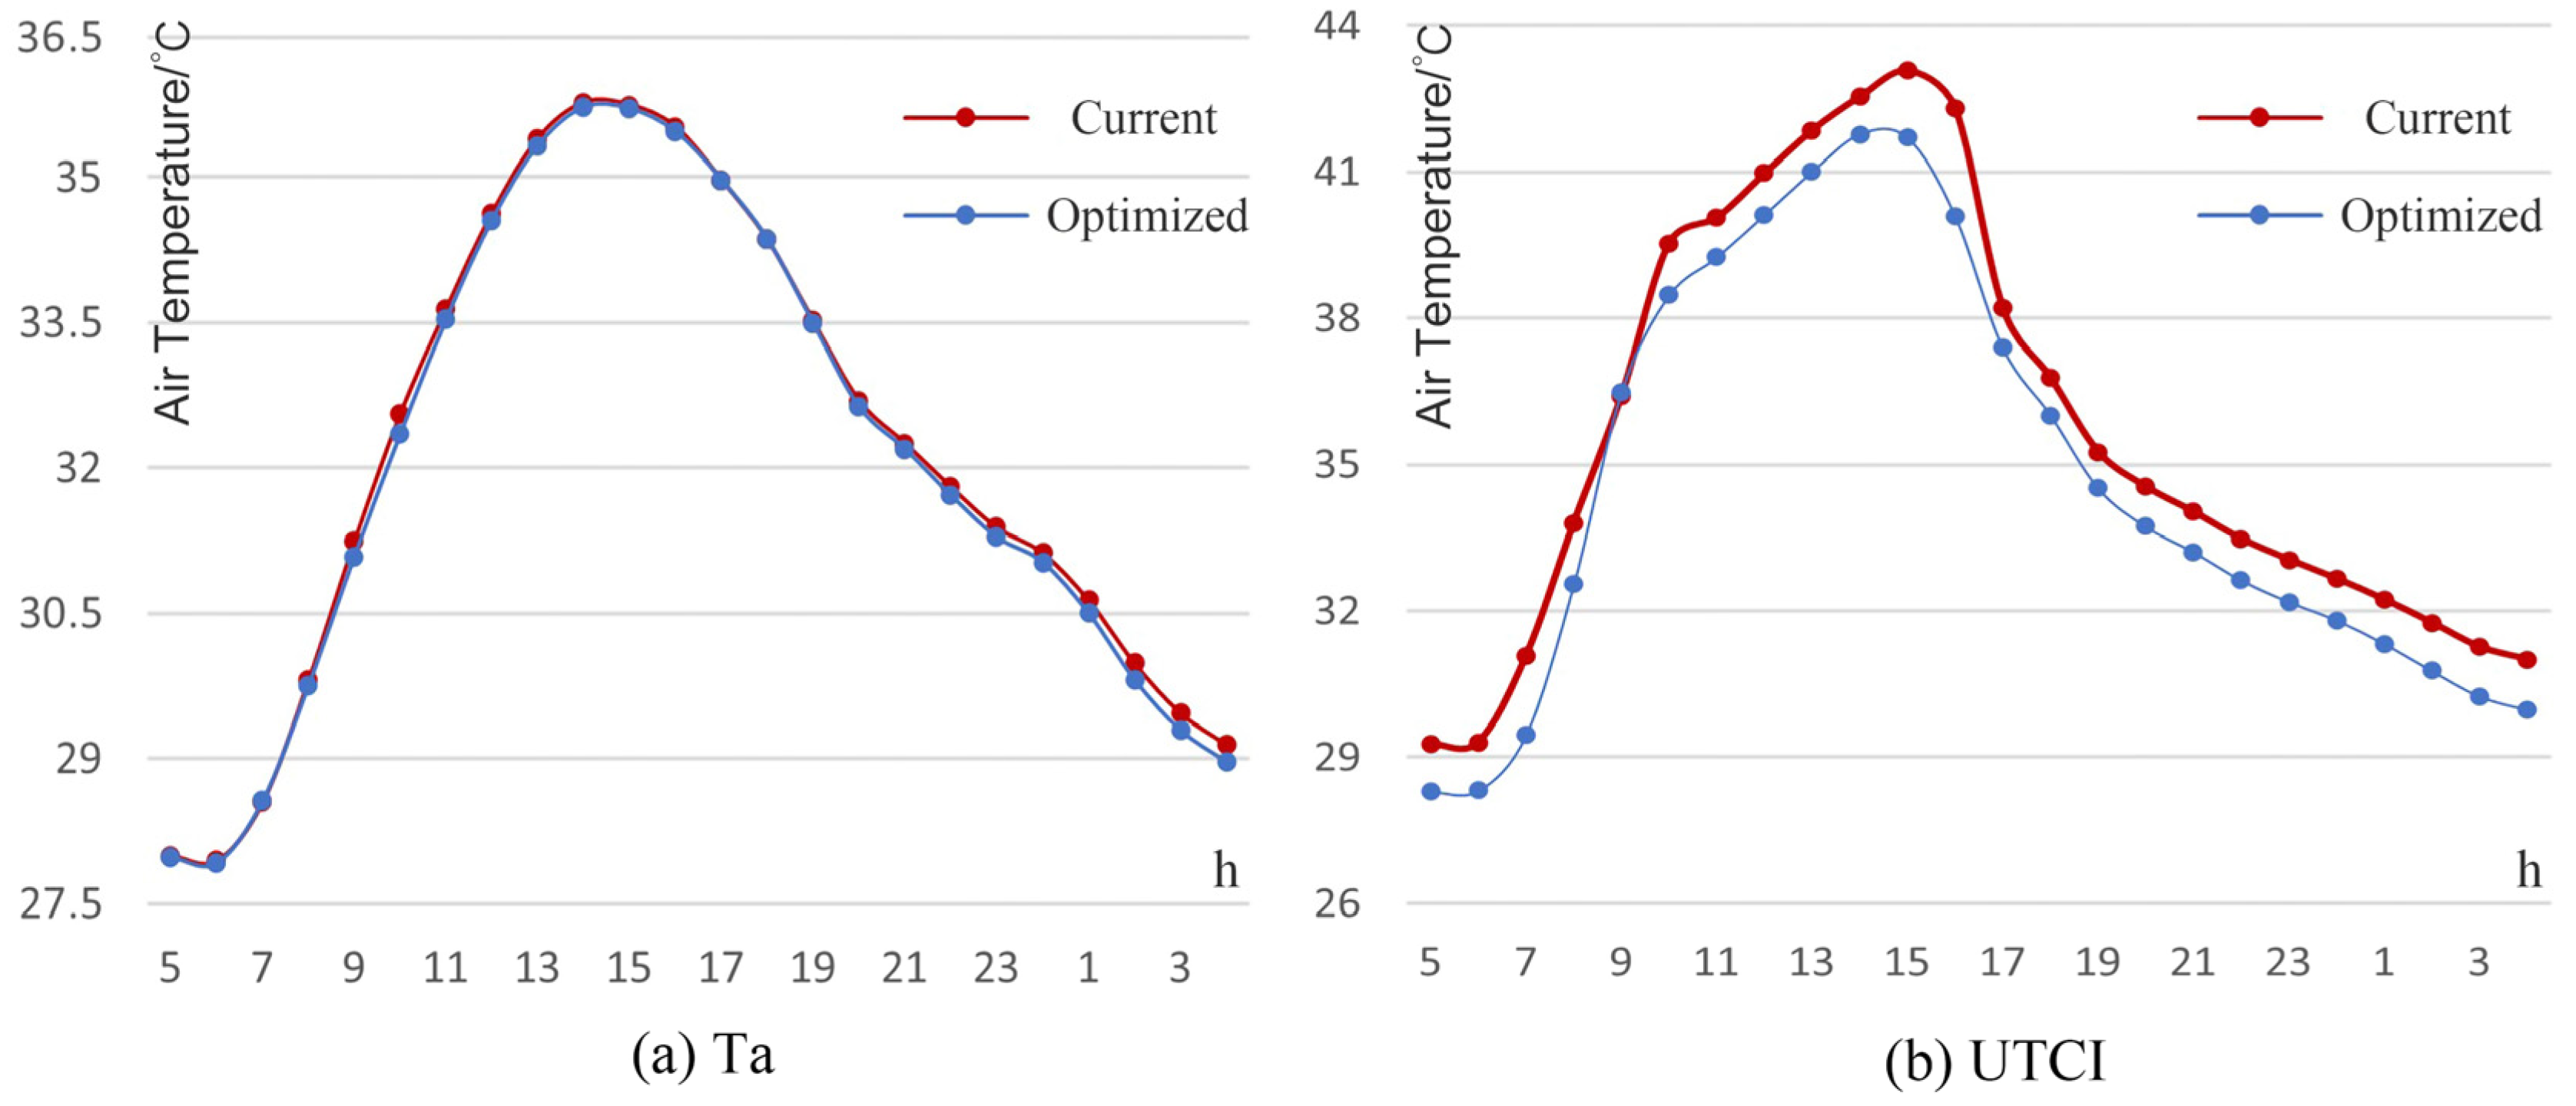
- Optimal Spatial Parameters: When the land area is 3 hm2, the land shape (aspect ratio) is 1.56 (250 m × 160 m), and when single-story ground-level commercial buildings were located on the west side of the block, the outdoor thermal environment was optimal.
5. Discussion
5.1. Strategies
- Detailed control planning level: In the construction of the urban road network, if the urban roads surrounding the neighborhood blocks are laid out in a south-north layout, the best thermal comfort is achieved by arranging the road network in a north-south direction with a scale of approximately 250 m and 150 m in an east-west direction; if the scale of the local block is fixed, the road network and the north-south direction can be oriented at a moderate north-west or south-east angle, which can effectively improve the thermal environment. Where the direction of the road network is constrained by objective geographical factors, the same optimization effect can be achieved by changing the overall orientation of buildings to the north. In terms of connecting urban wind corridors, the layout of neighborhood blocks should be designed to align with the wind corridor. The streets formed by the layout of neighborhood blocks should be connected to the wind corridor, allowing cold air from the suburbs to flow into the interior of the settlements. Simultaneously, the thermal environment of the settlements can be effectively improved by incorporating permeable pavements and street greening.
- Block design level: In the control of indicators, to create a better thermal environment, the joint control of building density, average building height and land ratio is considered. For the pursuit of economic benefits in actual development, the highest possible land ratio is adopted. A combination of a larger average building height and smaller building density, along with correspondingly increased green area ratio requirements, can be chosen. In terms of spatial layout, the “GB50180-2018 Standard“ mentions that buildings can be moderately enclosed to form residential courtyard spaces with a certain sense of enclosure and pleasant scale. However, the scale should be controlled to avoid negative spatial effects, such as a patio style. Subject to compliance with standards, the building enclosure parallel to the prevailing wind direction should be increased as much as possible. Where enclosing residential buildings is not appropriate, lower-level commercial buildings can be reasonably located to improve the overall enclosure of residential areas, thereby creating a suitable thermal environment. In Changsha, a ground-floor-level commercial building can be placed on the east and west sides of the neighborhood block to optimize the outdoor thermal environment.
5.2. Limitations
5.3. Future Research Directions
6. Conclusions
Author Contributions
Funding
Data Availability Statement
Conflicts of Interest
References
- Chen, K.; Tang, Y. Identification of Urban Areas Vulnerable to Heat Waves and Coping Strategies: A Case Study of Beijing Central City. City Plan. Rev. 2019, 43, 37–44. [Google Scholar]
- National Bureau of Statistics. China Statistical Yearbook 2021; China Statistics Press: Beijing, China, 2021. [Google Scholar]
- GB 50180-2018; Ministry of Housing and Urban-Rural Development of the People’s Republic of China. Standard for Urban Residential Area Planning and Design. China Construction Industry Press: Beijing, China, 2018; p. 102.
- Zhang, Y. From “Regulations” to “Standards”: A Comparative Study of Technical Standards for Residential Area Planning and Design and Their Implementation. Master’s Thesis, Shandong Jianzhu University, Jinan, China, 2022. [Google Scholar]
- Cui, X. The Evolution of Western Neighborhood Block Systems and Their Implications. Urban Rural. Dev. 2018, 63, 27–31. [Google Scholar] [CrossRef]
- Yan, Z. Closing or Opening Block: European and American Experiences and Lessons. J. Xi’an Jiaotong Univ. (Soc. Sci.) 2018, 38, 93–98. [Google Scholar] [CrossRef]
- Yi, L. The Implications of “New Urbanism” for China’s Implementation of the “Small Blocks, Dense Road Networks” Urban Spatial Pattern. Inn. Mong. Sci. Technol. Econ. 2017, 36, 15–16. [Google Scholar] [CrossRef]
- Berghauser Pont, M.; Haupt, P. Spacemate: The Spatial Logic of Urban Density; Delft University Press: Delft, The Netherlands, 2004. [Google Scholar]
- Dalel, K. Towards a morpho-environmental neighbourhood optimization method: MENOM. Sustain. Cities Soc. 2021, 70, 102880. [Google Scholar] [CrossRef]
- Fangfang, M.; Shengjun, L. Quantification and Measurement of Compact High-Density Residential Forms: A Case Study of the Changbai District in Shenyang. Shanghai Urban Plan. 2021, 4, 79–84. [Google Scholar]
- Nannan, S. Research on the Optimization of Urban Residential Block Spatial Form Planning under Low-Carbon Guidance. Master’s Thesis, Xi’an University of Architecture and Technology, Xi’an, China, 2021. [Google Scholar]
- Dong, H.; Li, C.; Chen, S. Study on the Index and Management of Space Form under the Living Mode of Life Circle. J. Hebei Inst. Archit. Eng. 2021, 39, 83–90. [Google Scholar] [CrossRef]
- Zhu, X. Simulation Study of the Thermal Environment of Small Neighborhoods in Hot Summer and Warm Winter Regions. Master’s Thesis, Harbin Institute of Technology, Harbin, China, 2012. [Google Scholar]
- Middel, A.; Häb, K.; Brazel, A.J.; Martin, C.A.; Guhathakurta, S. Impact of urban form and design on mid-afternoon microclimate in Phoenix Local Climate Zones. Landsc. Urban Plan 2014, 122, 16–28. [Google Scholar] [CrossRef]
- Allegrini, J.; Dorer, V.; Carmeliet, J. Influence of morphologies on the microclimate in urban neighbourhoods. J. Wind. Eng. Ind. Aerodyn. 2015, 144, 108–117. [Google Scholar] [CrossRef]
- Zhang, L. Research on the Optimization of Urban Residential Space Form in Lhasa Based on Microclimate. Master’s Thesis, Southwest Jiaotong University, Chengdu, China, 2019. [Google Scholar]
- Liu, Z. Study on Spatial Shape Optimization of Urban Residential Area in Cold Area Based on Thermal Environment and Energy Saving. Ph.D. Thesis, Harbin University of Technology, Harbin, China, 2020. [Google Scholar]
- Li, K.; Jiang, D.; Hao, P. Research Progress of numerical Simulation Technology of Outdoor Wind Environment at Home and abroad. Green Build. 2014, 4, 9–12. [Google Scholar] [CrossRef]
- ANSI/ASHRAE 55P-2004; Thermal Environmental Conditions for Human Occupancy. ASHRAE: Atlanta, GA, USA, 2004.
- Simiu, E.; Scanlan, R.H. Wind effects on structures: An introduction to wind engineering. In Proceedings of the Institution of Mechanical Engineers; Wiley: New York, NY, USA, 1978; p. 185. [Google Scholar]
- Zheng, Y.; Yin, J.; Wu, R. The applicability of Thermal Climate Index in the Prediction of Human comfort. J. Appl. Meteorol. Sci. 2010, 21, 709–715. [Google Scholar] [CrossRef]
- Zheng, Y.; Yu, Y.; Tan, J. Study on the influence of Meteorological parameters on Human comfort. Meteorol. Sci. Technol. 2007, 35, 827–831. [Google Scholar] [CrossRef]
- Blazejczyk, K.; Epstein, Y.; Jendritzky, G.; Staiger, H.; Tinz, B. Comparison of UTCI to selected thermal indices. Int. J. Biometeorol. 2012, 56, 515–535. [Google Scholar] [CrossRef]
- Xu, G. Study on Microclimate Construction Strategy of Outdoor Public Space in Residential Area with Hot Summer and Warm Winter. Master’s Thesis, Xi’an University of Architectural Science and Technology, Xi’an, China, 2018. [Google Scholar]
- Zhang, A.; Bokel, R.; van den Dobbelsteen, A.; Sun, Y.; Huang, Q.; Zhang, Q. An integrated school and schoolyard design method for summer thermal comfort and energy efficiency in Northern China. Build. Environ. 2017, 124, 369–387. [Google Scholar] [CrossRef]
- Gusson, C.S.; Duarte, D.H.S. Effects of Built Density and Urban Morphology on Urban Microclimate—Calibration of the Model ENVI-met V4 for the Subtropical Sao Paulo, Brazil. Procedia Eng. 2016, 169, 2–10. [Google Scholar] [CrossRef]
- Yang, X. Study on the Simulation Method of the Influence of Outdoor Microclimate on the Energy Consumption of Building Air conditioning. Ph.D. Thesis, South China University of Technology, Guangzhou, China, 2012. [Google Scholar]
- Chow, W.T.L.; Brazel, A.J. Assessing xeriscaping as a sustainable heat island mitigation approach for a desert city. Build. Environ. 2011, 47, 170–181. [Google Scholar] [CrossRef]
- Feng, S. Research on optimal Design Strategy of External Space Environment of Urban Residential Area. Master’s Thesis, Zhejiang University, Hangzhou, China, 2020. [Google Scholar]
- Guo, S.; Yang, F. Study on Climatic adaptability Design of Open Block in Hot Summer and Cold Winter area. Build. Energy Effic. 2019, 47, 102–105. [Google Scholar] [CrossRef]
- Zhao, Q.; Sailor, D.J.; Wentz, E.A. Impact of tree locations and arrangements on outdoor microclimates and human thermal comfort in an urban residential environment. Urban For. Urban Green. 2018, 32, 81–91. [Google Scholar] [CrossRef]
- Xie, Z. Preliminary Study on Layout of High-Rise Residential Area in Xiamen Based on Outdoor Thermal Environment Optimization. Master’s Thesis, Xiamen University, Xiamen, China, 2018. [Google Scholar]
- Declet-Barreto, J.; Brazel, A.J.; Martin, C.A.; Chow, W.T.L.; Harlan, S.L. Creating the park cool island in an inner-city neighborhood: Heat mitigation strategy for Phoenix, AZ. Urban Ecosyst. 2013, 16, 617–635. [Google Scholar] [CrossRef]
- JGJ286-2013; Design Standard for Thermal Environment of Urban Residential Areas. China Construction Industry Press: Beijing, China, 2013; p. 30.
- Zheng, B.; Wu, M.; Dai, P. Research on the Regulation of Urban Thermal Environment Planning: A case study of the Control Plan of Chenzhou East New Town. J. Railw. Sci. Eng. 2021, 18, 1661–1670. [Google Scholar] [CrossRef]
- Meng, S.; Lin, G.; Wang, Y. Research on the Influence Mechanisms of Urban Built Environment Factors on Thermal Environment: A Case Study of Tianjin Downtown Area. J. Tianjin Univ. Urban Constr. 2024, 30, 434–442. [Google Scholar] [CrossRef]
- Marvi, H.; Kalwar, S.; Talpur, M.A.H.; Memon, I.A.; Soomro, M.; Ahsan, N. Cultivating Community: Addressing Social Sustainability in Rapidly Urbanizing Hyderabad City, Pakistan. Societies 2024, 14, 161. [Google Scholar] [CrossRef]


| Research Focus | Author | Year | Spatial Pattern Indicators Selection | Thermal Environment Indicators Selection | Key Findings |
|---|---|---|---|---|---|
| Neighborhood block spatial patterns | M. Berghauser Pont [8] | 2004 | Floor area ratio, building coverage, average floor count, open space ratio, etc. | − | Developed correlation charts to evaluate settlement pattern indicators. |
| Dalel Kaoula [9] | 2021 | Settlement perimeter, building heights, street widths, etc. | − | Street width and settlement perimeter significantly impacted environmental performance in European settlements. | |
| Fangfang Ma et al. [10] | 2021 | Average floor count, floor area ratio, building coverage and open space ratio | − | Mid-rise buildings dominated the study area; an average land ratio of 2.51 optimized spatial capacity. | |
| Nannan Song [11] | 2021 | Site size, building density, floor area ratio, neighborhood physical form factor, etc. | − | Identified spatial indicators highly correlated with carbon emissions through quantitative analysis. | |
| Hongjie Dong [12] | 2021 | Floor area ratio, building coverage, average floor count, open space ratio, etc. | − | Analyzed spatial features of the “circle of life” living pattern and proposed livability strategies. | |
| Spatial morphology of neighborhood block based on thermal environment simulation | Xinwei Zhu [13] | 2012 | Neighborhood scale, site function, land development intensity, building form and spacing, etc. | Ta, PMV | Small-scale neighborhood blocks optimized thermal environments; open spaces in ventilation corridors enhanced thermal environment. |
| Ariane Middel et al. [14] | 2014 | Building height, building density, sky visibility factor, imperviousness Surface fraction | Ta, V, Tg | Dense urban configurations formed afternoon cool islands. | |
| Jonas Allegrini et al. [15] | 2015 | Street aspect ratios, building orientation, etc. | Ta, V | Surface temperatures of building facades were primarily affected by building spacing | |
| Li Zhang [16] | 2019 | Building layout, land ratio, building orientation, building density, building height, etc. | Ta, V, Tmrt, PET | Average building height most significantly impacted thermal environment, and increased building density improved summer thermal environment. | |
| Zheming Liu [17] | 2020 | site size, boundary shape, floor area ratio, building group plan configuration, building group orientation, building density, plan enclosure, maximum building height, building height relief and dispersion | Ta, V, PET, UTCI | Identified sensitivity of cold-region settlements to thermal environment in winter and summer seasons nature; established quantitative relationships for seasonal variations. |
| Element Type | Element | Condition |
|---|---|---|
| Geographical Aspect | Construction year | 2000 |
| Geographical scope | Five districts within the Third Ring Road of Changsha | |
| Spatial Aspect | Block side length | 150–250 m |
| Land scale | 2–4 hm2 | |
| Block boundary | Urban branch road enclosure | |
| Social Aspect | Public space | Moderately open, public spaces belong to the entire residential area or city. |
| Functional configuration | Functionally diverse, with abundant low-rise commercial establishments. |
| Spatial Morphological Elements | Specific Indicators | Indicator Quantification | Unit | ||
|---|---|---|---|---|---|
| Meaning of the Indicator | Abbreviation of the Indicator | ||||
| Spatial Form of the Land | Land Area | Use Area of the Land | A | m2 | |
| Land Shape | Ratio of the Side Lengths of the Land | SR | / | ||
| Land Orientation | Direction of the Longest Side of the Land | DI | ° | ||
| Spatial Form of Building Combination | Building Layout | Residential Building | Qualitative Analysis of Residential Building Layout Combinations and Quantitative Analysis of Enclosure Degree | EC | / |
| Commercial Building | Qualitative Analysis of Commercial Building Layout Combinations and Quantitative Analysis of Enclosure Degree | ||||
| Average Building Height | Residential Building | The Base Area of Residential Buildings in the Neighborhood Strengthens the Average Height | AH | m | |
| Commercial Building | The Base Area of Commercial Buildings in the Neighborhood Strengthens the Average Height | ||||
| Building Density | The Ratio of the Total Base Area of Buildings in the Neighborhood to the Neighborhood Area | BD | % | ||
| Spatial form Elements | Specific Indicators | Calculation Method | |||
|---|---|---|---|---|---|
| Index Abbreviation | Calculation Formula | Calculation Description | |||
| 1 Spatial form of the land | 1 Land Area | A | A = a × b | A is the land area (m2), a is the length of the neighborhood land (m), and b is the width of the neighborhood land (m). | |
| 2 Land Shape | Sr | Sr = a/b | Sr is the ratio of the side length of the land, a is the north-south side length (m) of the land, and b is the east-west side length of the land. | ||
| 3 Land Orientation | DI | The direction that forms the longest side of the land is the direction of the land, with a range of −90 ° ≤ DI ≤ 90 °, 0 ° indicating due east (E), 90 ° indicating due north (N), and −90 ° indicating due south (S), indicating the degree of deviation from due east. | |||
| 2 Spatial Form of Building Combination | 4 Building Layout | Residential Building | EC | EC = | EC is the degree of enclosure, P is the circumference of the neighborhood (m), and P subscript i is the length of the facade of the building i on a certain side of the neighborhood (m). The smaller the degree of enclosure, the building interface on the periphery of the neighborhood is not continuous, and the degree of enclosure is close to 1, indicating that the peripheral interface is more complete. |
| Commercial Building | |||||
| 5 Average Building Height | Residential Building | AH | AH = | AH is the average height of the building (m), A is the area of the residential neighborhood (land area) (m2), Ai is the base area of the building i (m2), and H subscript i is the building (m). | |
| Commercial Building | |||||
| 6 Building Density | BD | BD = | BD is the building density (%), A is the residential neighborhood land area (land area) (m2), and Ai is the base area of building i (m2). | ||
| Time | Dry-Bulb Temperature (°C) | Relative Humidity (%) | Wind Speed (m/s) | Dominant Wind Direction |
|---|---|---|---|---|
| 0 | 27.3 | 84 | 1.8 | South |
| 1 | 26.9 | 85 | 1.8 | |
| 2 | 26.7 | 86 | 1.7 | |
| 3 | 26.3 | 87 | 1.7 | |
| 4 | 26.1 | 87 | 1.7 | |
| 5 | 26.0 | 87 | 1.7 | |
| 6 | 26.2 | 87 | 1.8 | |
| 7 | 26.6 | 85 | 2.0 | |
| 8 | 27.3 | 82 | 2.1 | |
| 9 | 28.4 | 78 | 2.5 | |
| 10 | 29.5 | 73 | 2.8 | |
| 11 | 30.4 | 69 | 3.1 | |
| 12 | 31.2 | 66 | 3.3 | |
| 13 | 31.7 | 65 | 3.4 | |
| 14 | 32.0 | 63 | 3.6 | |
| 15 | 32.2 | 63 | 3.4 | |
| 16 | 32.2 | 63 | 3.3 | |
| 17 | 31.8 | 64 | 3.1 | |
| 18 | 31.1 | 67 | 2.8 | |
| 19 | 30.2 | 71 | 2.4 | |
| 20 | 29.3 | 76 | 2.0 | |
| 21 | 28.5 | 79 | 2.0 | |
| 22 | 27.9 | 81 | 1.9 | |
| 23 | 27.6 | 83 | 1.8 | |
| Daily average | 28.9 | 76 | 2.4 |
Disclaimer/Publisher’s Note: The statements, opinions and data contained in all publications are solely those of the individual author(s) and contributor(s) and not of MDPI and/or the editor(s). MDPI and/or the editor(s) disclaim responsibility for any injury to people or property resulting from any ideas, methods, instructions or products referred to in the content. |
© 2025 by the authors. Licensee MDPI, Basel, Switzerland. This article is an open access article distributed under the terms and conditions of the Creative Commons Attribution (CC BY) license (https://creativecommons.org/licenses/by/4.0/).
Share and Cite
Zheng, B.; Zhang, J.; Zhao, Y.; Liu, H.; Liu, P. The Relationship Between an Urban Neighborhood Block’s Spatial Form and Its Outdoor Thermal Environment: A Case Study of Changsha. Buildings 2025, 15, 889. https://doi.org/10.3390/buildings15060889
Zheng B, Zhang J, Zhao Y, Liu H, Liu P. The Relationship Between an Urban Neighborhood Block’s Spatial Form and Its Outdoor Thermal Environment: A Case Study of Changsha. Buildings. 2025; 15(6):889. https://doi.org/10.3390/buildings15060889
Chicago/Turabian StyleZheng, Bohong, Jiahui Zhang, Yue Zhao, Huaping Liu, and Peng’ao Liu. 2025. "The Relationship Between an Urban Neighborhood Block’s Spatial Form and Its Outdoor Thermal Environment: A Case Study of Changsha" Buildings 15, no. 6: 889. https://doi.org/10.3390/buildings15060889
APA StyleZheng, B., Zhang, J., Zhao, Y., Liu, H., & Liu, P. (2025). The Relationship Between an Urban Neighborhood Block’s Spatial Form and Its Outdoor Thermal Environment: A Case Study of Changsha. Buildings, 15(6), 889. https://doi.org/10.3390/buildings15060889