Abstract
Improving indoor air quality (IAQ) in daycare centers is essential due to children’s vulnerability to pollutants and prolonged indoor exposure. To address these challenges, energy recovery ventilators (ERVs) with varying filtration efficiencies were evaluated through field measurements and CONTAM simulations. Baseline assessments of CO2 and PM2.5 levels revealed significant impacts from outdoor pollutant infiltration. ERVs successfully reduced CO2 concentrations, maintaining levels below 1000 ppm during most occupancy periods. However, low-efficiency filters (MERV 8 or lower) permitted outdoor particulate matter infiltration, increasing indoor PM2.5 levels. High-performance filters (MERV 13 or higher) reduced indoor PM2.5 concentrations by up to 50%, significantly improving air quality. Findings emphasize the necessity of combining high-efficiency filtration with ERVs to mitigate pollutant infiltration and ensure healthy indoor environments. Policymakers and practitioners are urged to implement ventilation systems equipped with MERV 13 or higher filters, particularly in regions with high outdoor pollution. These strategies are critical for safeguarding children’s health and meeting IAQ standards in daycare facilities.
1. Introduction
Recently, the global deterioration in air quality, represented by fine particulate matter, has become a significant social issue. The World Health Organization (WHO) revised its “WHO Air Quality Guidelines” in 2021, tightening the annual average concentration standards for PM10 (particulate matter with a diameter of 10 µm or less) and PM2.5 (particulate matter with a diameter of 2.5 µm or less) to 5 µg/m3 for both [1].
Children are particularly vulnerable to pollutant exposure compared to adults, necessitating special attention. During childhood, when pulmonary functions are still developing, exposure to pollutants can negatively impact lung function even into adulthood [2]. Furthermore, prolonged exposure to airborne pollutants increases the risk of respiratory diseases such as pediatric asthma [3].
Daycare centers are essential spaces where children from infancy to school age spend much of their time indoors, participating in various activities that play a vital role in their development but may also expose them to indoor pollutants [4,5,6]. Therefore, special attention is required to address these exposures [7,8,9]. Winifred et al. recognized the issue of indoor air quality (IAQ), and reviewed measurement data and studies on daycare centers. The findings revealed that the concentrations of pollutants were the highest in the following order: particulate matter, carbon dioxide, formaldehyde, carbon monoxide, and total volatile organic compounds [10]. As a result, IAQ in daycare centers requires significantly more attention compared to those in other building types.
In South Korea, to improve IAQ, the installation of ventilation facilities became mandatory for newly constructed buildings starting in 2009. After this regulation came into effect, indoor particle pollution emerged as a major social issue, leading to the widespread adoption of air purifiers and stricter standards for ventilation facility filters. Daycare centers are subject to the following two regulations related to ventilation facilities: (1) Ventilation system and airflow standards: Daycare centers with a gross floor area of 430 m2 or more are required to install ventilation systems with a minimum airflow of 36 m3/h per person; (2) Indoor air quality standards: PM10 must not exceed 100 µg/m3, PM2.5 must not exceed 50 µg/m3, and CO2 concentrations must remain below 1000 ppm [11]. Most daycare centers built before the implementation of these regulations use medium-level filters with a Minimum Efficiency Reporting Value (MERV) rating of 14 or lower. Under such conditions, insufficient filter performance allows outdoor particles to enter easily, potentially worsening IAQ [12,13,14].
The majority of existing daycare centers predominantly depends on natural ventilation due to the lack of dedicated ventilation systems [15,16]. With the escalation of fine particulate matter pollution, the widespread adoption of air purifiers has provided partial relief for IAQ issues in daycare centers. However, significant challenges persist. Daycare centers are critical environments where children spend extensive periods indoors, engaging in various activities such as cooking, sleeping, playing, and cleaning, which collectively contribute to the generation of diverse pollutants. Consequently, the IAQ at daycare centers is intricately linked to children’s health [17,18,19,20].
Kim et al. conducted extensive long-term measurements in daycare centers, revealing that PM2.5 and CO2 concentrations frequently exceeded acceptable thresholds, presenting potential risks for infectious diseases among children [7]. Zheng et al. demonstrated the viability of using low-cost sensors for monitoring IAQ in daycare centers, particularly in tracking the deterioration caused by various events [21]. Furthermore, Kim et al. investigated artificial neural network (ANN) models to measure and predict CO2 and PM2.5 concentrations, highlighting that pollutant concentrations not only surpassed permissible limits but also surged significantly during peak activity periods, necessitating careful management and intervention [22].
While numerous studies have examined children and daycare centers, there remains a critical gap in research addressing practical solutions and actionable strategies to improve IAQ. In many countries, including South Korea, aging infrastructure and inadequate facilities in existing daycare centers pose significant challenges, underscoring the urgent need for targeted interventions. Enhancing IAQ is paramount to safeguarding children’s health.
The primary objective of this study is to substantially improve the IAQ of daycare centers by implementing energy recovery ventilators (ERVs). This research systematically analyzed the indoor environment of existing daycare centers and employed CONTAM simulations to evaluate annual variations in indoor conditions under changing external environmental factors. By focusing on critical indicators such as indoor PM2.5 and CO2 levels, this study aims to propose robust, evidence-based solutions for effectively addressing IAQ challenges in daycare centers, contributing to healthier environments for children.
2. Materials and Methods
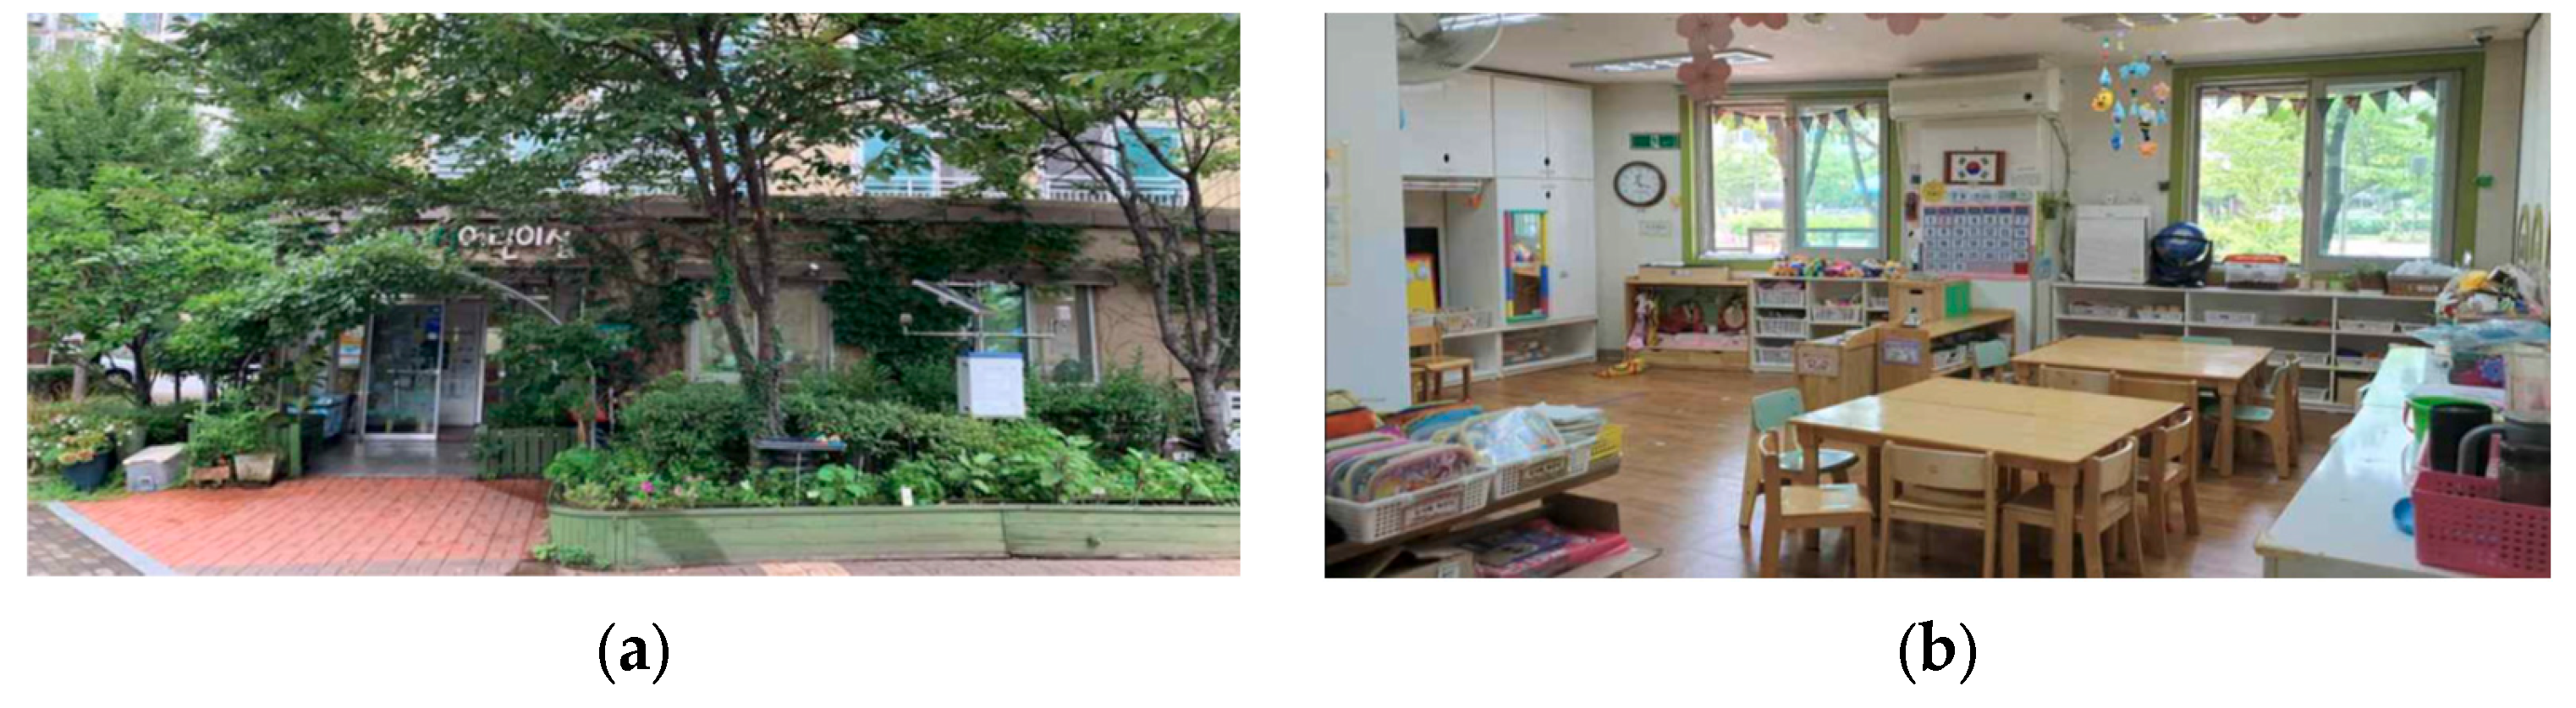
2.1. Description of Daycare Center
The daycare center selected for the field experiment is located in Goyang, Gyeonggi Province, South Korea. Constructed in 2008, it is a single-story facility situated within an apartment complex (Figure 1). The total area of the building is 155 m2, with a ceiling height of 2.3 m.
Figure 1.
Experimental daycare center: (a) is a front view figure of the experimental daycare center building; (b) is an indoor photo of the classroom.
In this study, non-conditioned spaces such as the main entrance, storage rooms, and kitchen were excluded. The analysis focused solely on areas actively used by children and staff. The daycare center accommodates up to 28 children and 8 staff members. Unlike typical buildings, daycare centers involve a wide range of occupancy activities, including cooking, dining, educational activities, and sleeping. However, this study did not account for particulate matter generated during cooking activities. Cooking-related emissions vary significantly depending on the activity and require specific ventilation strategies or systems in the kitchen to mitigate their impact [23,24,25].
The occupancy factor of children was analyzed in advance through on-site measurements and surveys (Table 1). Variations in occupancy schedules were observed based on daily routines and activities. These schedules were averaged arithmetically and used as input data, as shown in Figure 2. The calculated occupancy factor was utilized to estimate indoor PM2.5 and CO2 emissions.
Table 1.
Schedule of targeting daycare center. This table outlines the daily schedule of the activities and the number of occupants.
Figure 2.
Occupancy factor of target building.
2.2. Field Measurement in Daycare Center
To evaluate changes in the indoor environment, this study employed CONTAM simulations, as illustrated in Figure 3. The simulations incorporated the following two primary components: (1) network simulation and (2) particle simulation. Key influencing factors for the simulations were derived from on-site measurements, referred to as experimental factors. These factors were obtained through rigorous field-based data collection.
Figure 3.
Schematic diagram of CONTAM simulation.
A blower door test was conducted during non-occupancy periods (weekends) using a Retrotec 6100 device (Retrotec, Everson, WA, USA). The test adhered to the standards outlined in ASTM E779 and ISO9972: Europe [26,27]. The results indicated an equivalent leakage area (eqLA) of 1.29 cm2/m2 and an air change rate at 50 Pa (ACH50) of 5.36 h−1, reflecting suboptimal airtightness. The daycare center, originally remodeled from the first floor of an apartment building, demonstrated inadequate air-sealing performance. This lack of airtightness likely facilitates infiltration and increases the risk of outdoor particulate matter penetrating the indoor environment.
To calculate the particulate matter-related coefficients of the target building (deposition rate and penetration factor), indoor and outdoor concentrations of particulate matter and CO2 were simultaneously measured at 1-min intervals. Particulate matter was measured using optical particle counters (OPS, model 3330, TSI Inc., Shoreview, MN, USA), and CO2 levels were monitored with a CO2 logger (TR-76Ui, T&D Inc., Matsumoto, Japan).
The penetration factor (P) represents the ratio of particles in infiltrating air that penetrate the building envelope. Under well-mixed conditions, and assuming no internal particle generation, the penetration factor can be calculated using the following mass balance equation [28,29,30]:
where , is the indoor and outdoor particle concentration (µg/m3), is the air exchange rate, is the penetration factor, k is the deposition rate (1/h), V is the volume of indoor space (m3), and t is the time (h).
In the Equation (1), is the rate at which outdoor particles are penetrated into the indoor spaces, and represents the particle loss rate coefficient, with which indoor particles are discharged to the outside through exfiltration (AER), and the deposition rate . and can be calculated according to the indoor particle concentration and decay rate that reached steady states. This can be expressed as shown in Equation (2) [30]:
where is the indoor particle concentration at time 0, is the concentration at time t, and is the indoor particle number equilibrium concentration.
When the natural log of the indoor concentration and time in Equation (2) is plotted, the slope is given as . The slope becomes the particle deposition rate, which is estimated by excluding the influence of the AER.
The penetration factor was estimated using Equation (3), which is given as follows:
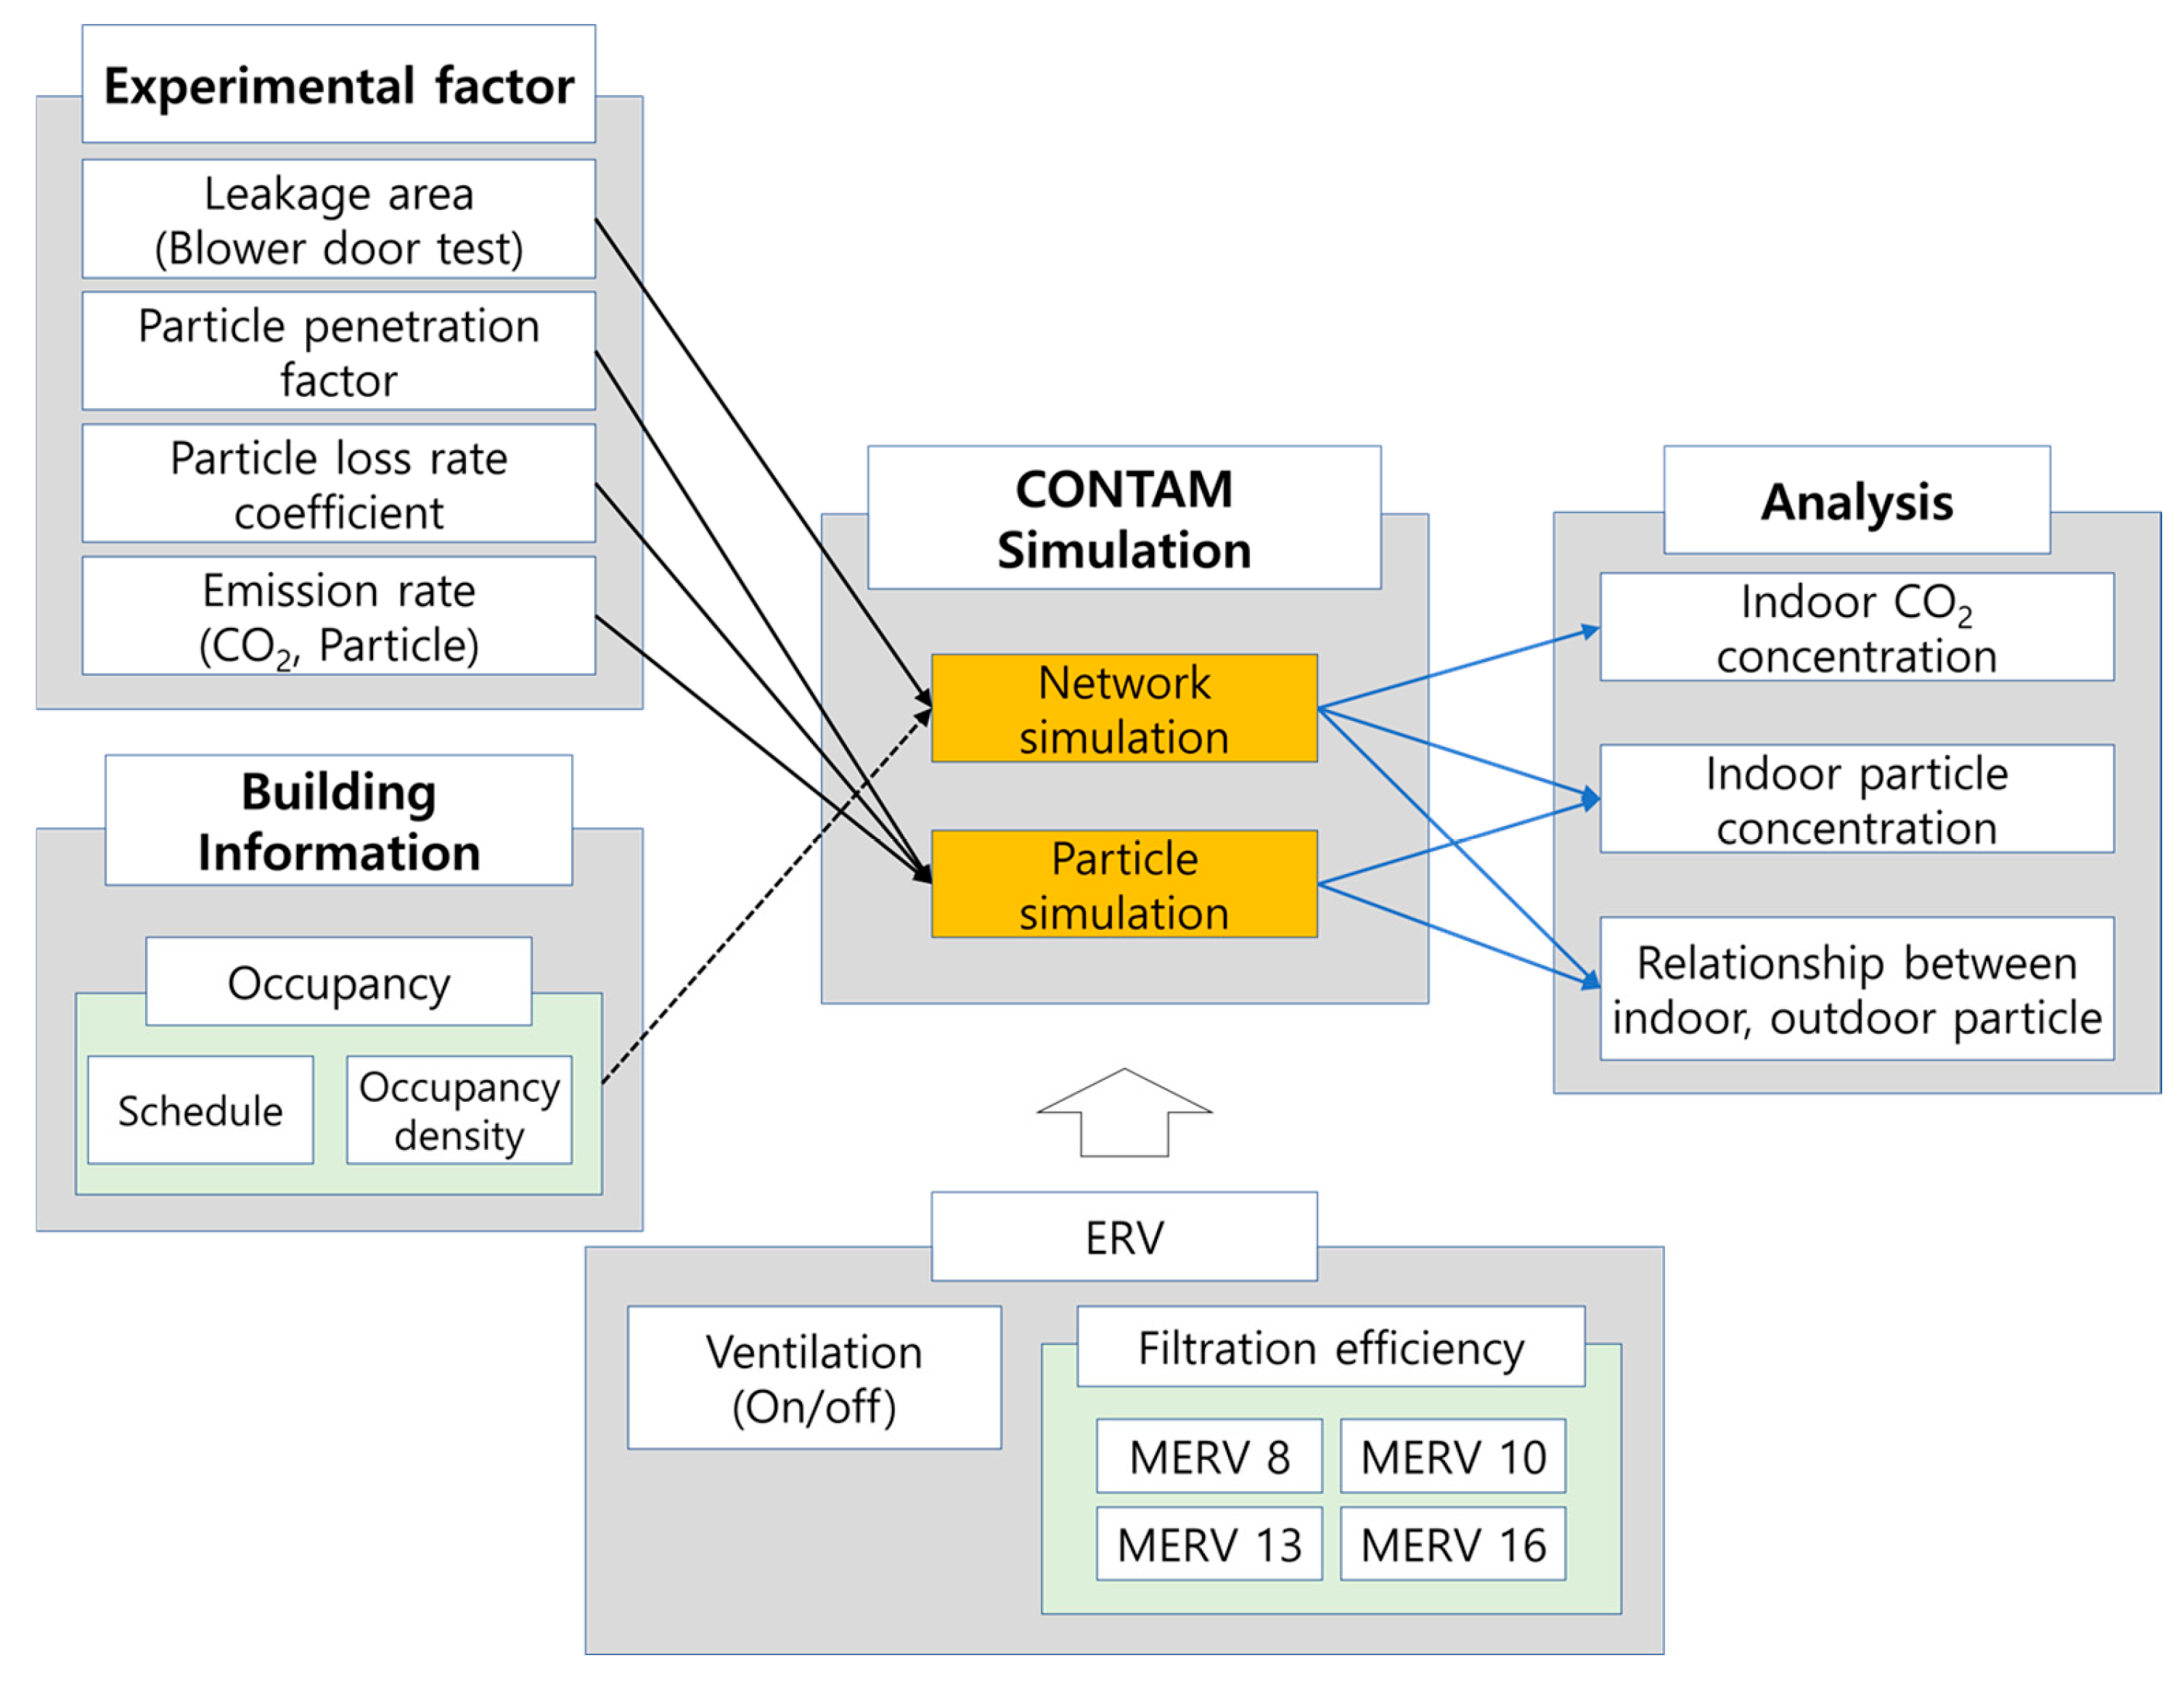
2.3. CONTAM Simulation
In this study, CONTAM was utilized to model the daycare center and to compare and analyze the changes in the indoor environment based on the application of ventilation systems and variations in the filter performance. CONTAM was developed by the National Institute of Standards and Technology (NIST) and is extensively used as a simulation program to analyze indoor airflow and pollutant distribution [31,32,33].
The network simulation in CONTAM used for the airflow paths is based on the empirical relationship between the airflow and the pressure difference across a building crack in the building envelope [34], as follows:
where is the volumetric flow rate (kg/s), is the discharge coefficient, is the leakage (orifice) area of the airflow paths (m2), is the pressure difference between zones (Pa), and ρ is the air density.
In CONTAM, the contaminant concentration is calculated using the following equation [34]:
where is the mass of contaminant in control volume (kg), is the rate of air mass flow from control volume to (kg/s), is the filtration efficiency in the airflow path, is the mass concentration of contaminant in control volume (kg/kg), is the contaminant generation rate (emission rate) in control volume (kg/s), is the kinetic reaction coefficient in control volume i between contaminant α and contaminant , is the mass concentration of contaminant in control volume , is the rate of air mass flow from control volume to is the mass concentration in control volume , and is removal rate of contaminant in control volume (kg/s).
Before performing CONTAM modeling, experimental factors and building information were collected. The input data for the simulation are summarized in Table 2.
Table 2.
Input data for CONTAM simulation.
3. Results and Discussion
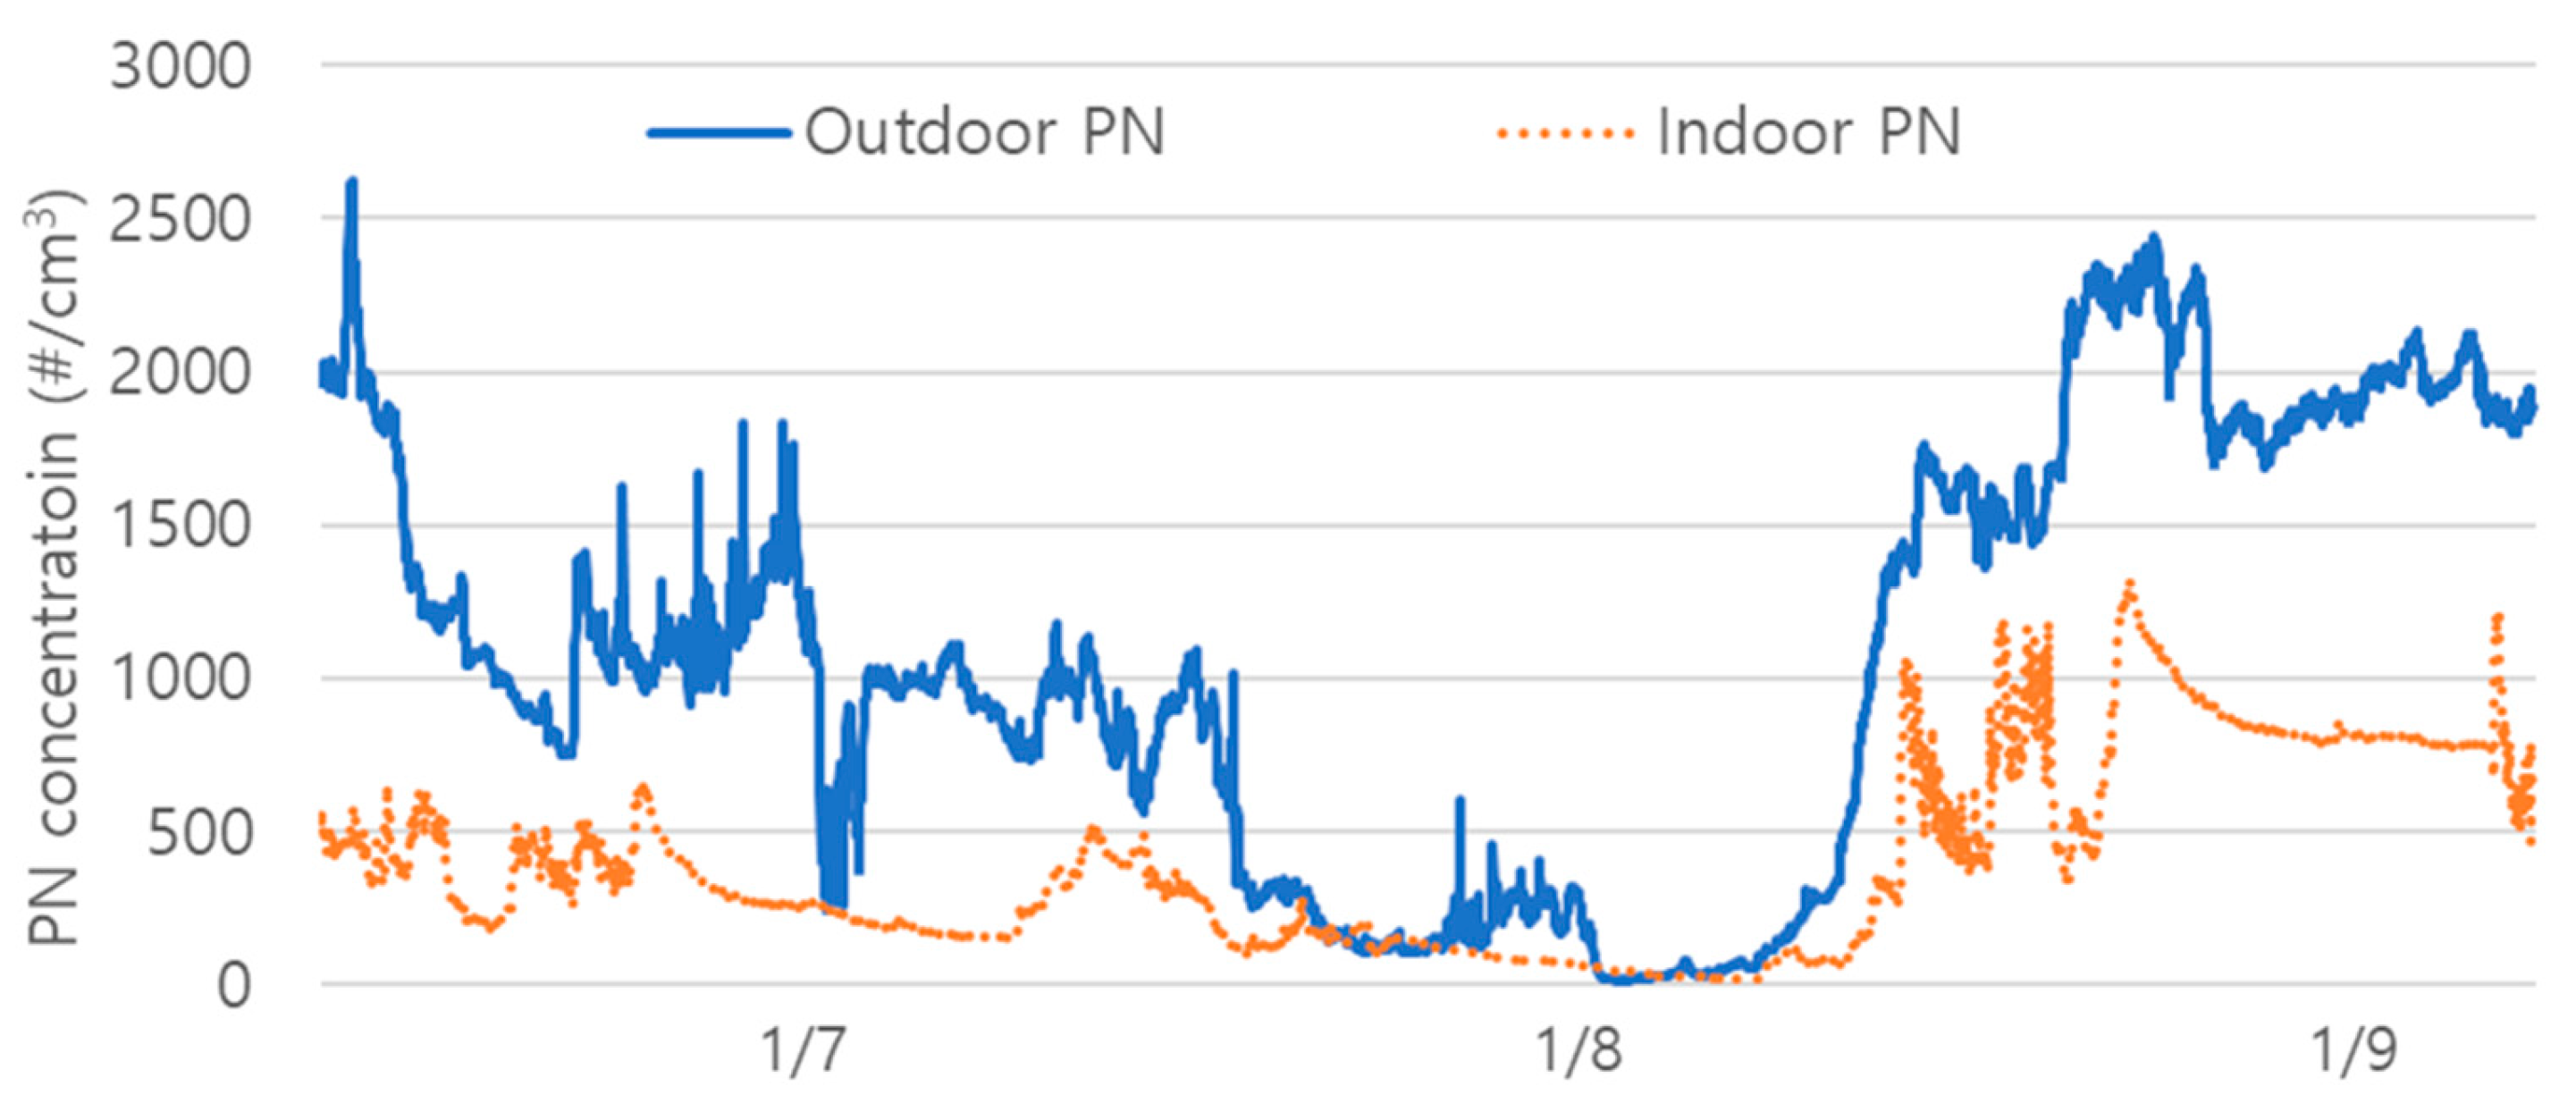
3.1. Indoor Air Quality in Target Building by Field Measurements
To assess the indoor environment, CO2 concentrations were continuously measured over approximately 133 h. January 4 and 5 were weekend days (Figure 4). The results showed significant differences in CO2 levels between occupied and unoccupied periods. During unoccupied periods, the CO2 concentration averaged 514.6 ± 61.5 ppm, whereas the average concentration during occupied periods was 945.4 ± 439.6 ppm, indicating a strong correlation between the occupancy density and indoor CO2 levels.
Figure 4.
Indoor CO2 concentration in daycare center.
CO2 concentrations during occupied periods increased up to 2347 ppm. This trend aligned with occupancy patterns, with peaks observed during periods of high occupancy, such as late mornings, lunchtime, naptime, and afternoon activities. Following these peak periods, active natural ventilation during cleaning or before leaving significantly reduced CO2 concentrations, with a decline rate exceeding 10 h−1.
Carbon dioxide (CO2) is a critical indicator of indoor air quality (IAQ). As stated in the introduction, South Korea recommends maintaining indoor CO2 concentrations below 1000 ppm. Additionally, several international standards emphasize specific thresholds for CO2 levels to ensure acceptable indoor environments [35,36,37]. Among high-occupancy facilities, daycare centers warrant special attention, as they are spaces where children spend a significant amount of time and are highly susceptible to adverse air quality conditions.
Previous studies assessing IAQ in South Korean daycare centers have reported similar patterns. Kim et al. investigated low-cost sensors to monitor indoor particulate matter and CO2 concentrations over a year, presenting seasonal variations in their findings [7]. Although the annual average CO2 concentration remained below 1000 ppm, elevated levels frequently exceeding 2000 ppm were observed during the fall and winter seasons. Similarly, Hwang et al. conducted IAQ measurements in daycare centers and found that, while the average indoor CO2 concentration was 638.3 ppm, the maximum levels exceeded 1500 ppm [38]. These consistent trends across studies suggest that operational and ventilation conditions in daycare centers are similar, despite differences in building configurations and occupancy densities. Seasonal factors significantly influence IAQ, particularly during the winter season, when outdoor temperatures are low, resulting in limited natural ventilation. This study observed that natural ventilation typically occurred only once in the morning and evening, with sporadic, irregular ventilation during cleaning activities. Consequently, reduced ventilation frequency led to significant increases in indoor CO2 concentrations.
Indoor particulate matter levels were continuously measured over approximately 72 h from January 6 to January 9. While indoor particulate matter concentrations were partly influenced by occupancy, they were found to be more significantly affected by outdoor particle levels (Figure 5). The indoor/outdoor (I/O) ratio analysis revealed a value of 0.74 during occupied periods and 0.51 during unoccupied periods. These results indicate that, while various indoor factors contribute to increased indoor particulate matter concentrations, the influx of outdoor particulate matter has a more substantial impact compared to indoor particle generation.
Figure 5.
Indoor particle concentration in a daycare center.
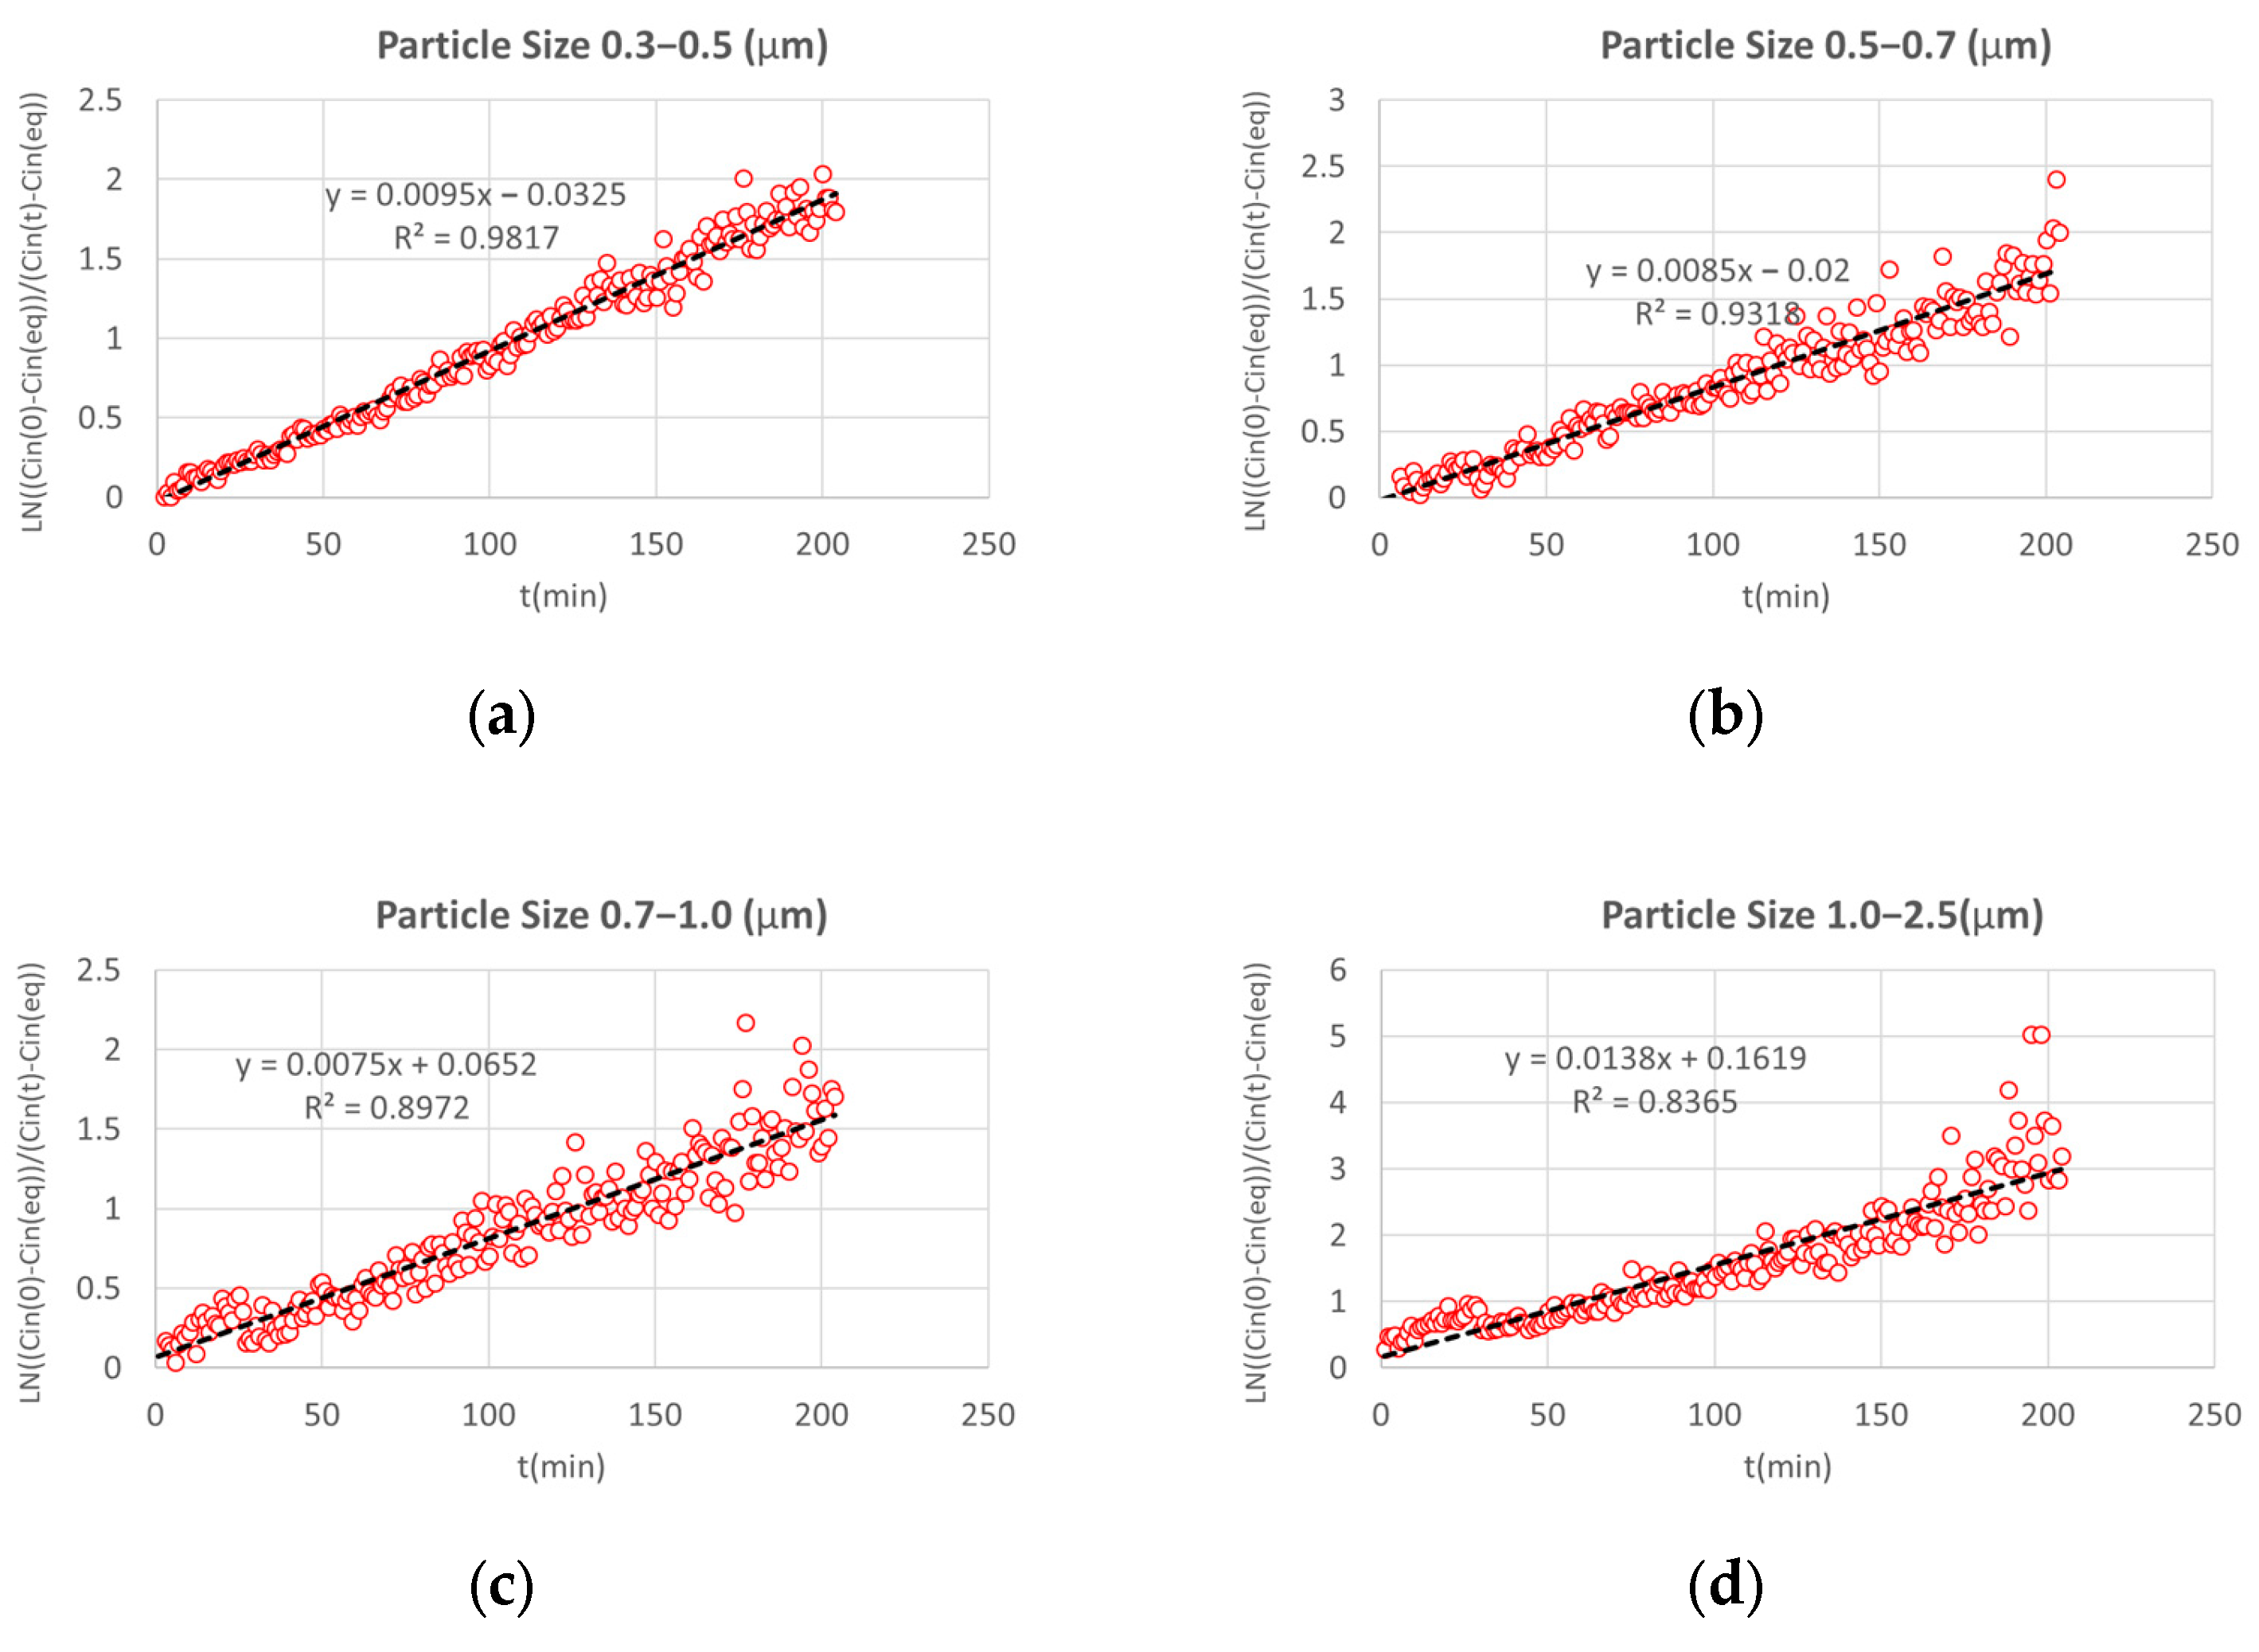
3.2. Measurment of Building Characteristics for Particles
The deposition rate and penetration factor are the most influential parameters affecting indoor particulate matter concentrations. These parameters vary depending on building conditions and particulate matter characteristics. Therefore, the values obtained through field measurements were utilized as input data for the CONTAM simulation.
Size-resolved analysis was performed to evaluate the decay rate of elevated particulate matter concentrations under unoccupied conditions, considering natural ventilation or previous occupant activities (Figure 6).
Figure 6.
Size-resolved indoor particle loss rate coefficient by manipulation. (a) 0.3–0.5 µm; (b) 0.5–0.7 µm; (c) 0.7–1.0 µm; (d) 1.0–2.5 µm.
Table 3 summarizes the results obtained from the measurements. The deposition rate increased with the particle size, indicating a higher deposition rate for larger particles. The penetration factor varied depending on the building conditions, but the measured values showed trends consistent with previous studies [28,39]. Using these values, the particle number concentration was converted to the mass concentration to derive the PM2.5 deposition rate and penetration factor, which were calculated as 0.40 and 0.63, respectively. While these values showed slight differences compared to prior studies, they exhibited similar trends [13,17,40,41].
Table 3.
Summary of size-resolved particle penetration and deposition rate (0.3–2.5 µm).
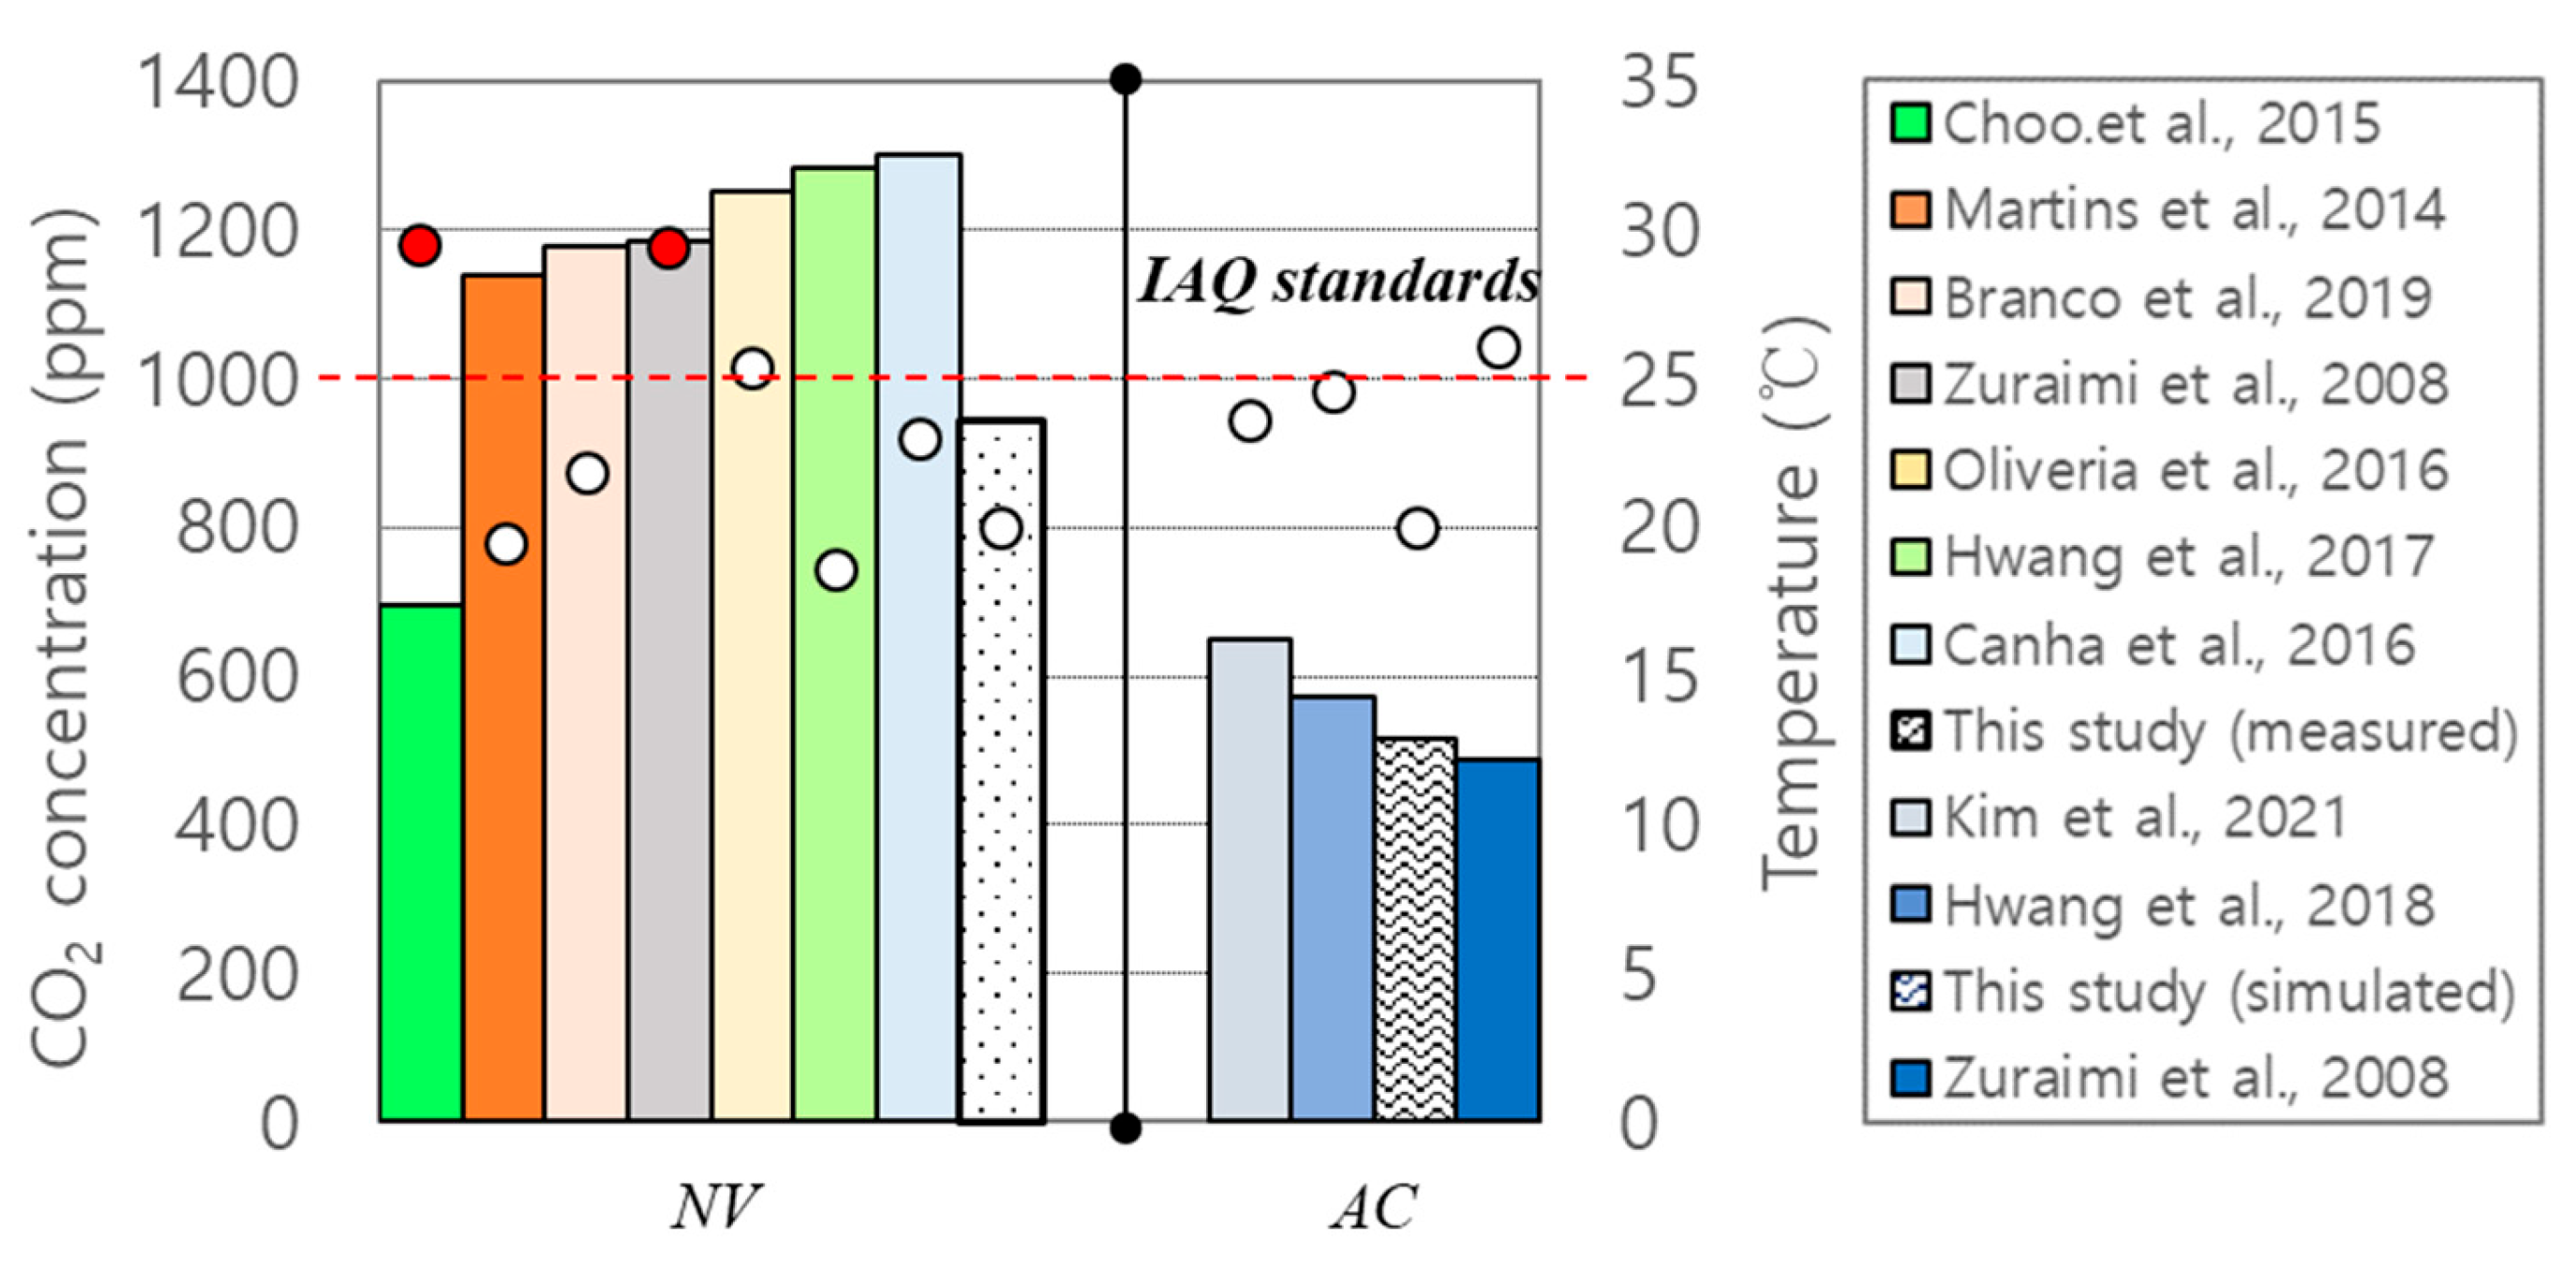
3.3. CO2 Reduction Impact by ERV Operation
Ventilation plays a critical role in reducing CO2 concentrations, particularly in high-occupancy spaces, including to daycare centers. The operation of ERVs in such environments not only enhances the indoor air quality, such as CO2, but also significantly contributes to building energy efficiency, underscoring its importance in sustainable building management [42]. The CONTAM simulation was used to compare indoor CO2 concentrations with and without the application of an ERV. The “No vent” scenario represented conditions where CO2 reduction occurred solely through natural ventilation and infiltration without the operation of a mechanical ventilation system. Since CO2 concentrations are not influenced by filter performance, the simulation specifically compared CO2 levels in scenarios with and without ERV application (Figure 7).
Figure 7.
Result of indoor CO2 concentration.
The simulation applied an ERV with a capacity of 300 m3/h, which reflects the typical capacity of energy recovery ventilators commonly manufactured in South Korea. When the ERV was operational, the average indoor CO2 concentration decreased to 517 ppm. Based on both field measurements and simulation results, the continuous introduction of outdoor air significantly reduced indoor CO2 concentrations to levels below the standard threshold. However, during certain periods, CO2 concentrations exceeded 1000 ppm, particularly between 12:00 and 15:00 when the occupancy density reached its maximum. This suggests that additional ventilation might be necessary during peak occupancy periods. However, for most of the occupancy duration, the ERV effectively kept the indoor CO2 concentrations below the standard threshold.
With a maximum occupancy of 12 people, the legal ventilation rate requirement is 432 m3/h. However, considering the children’s activity levels and respiration rates, it appears feasible to maintain indoor CO2 levels below 1000 ppm with a ventilation rate of 300 m3/h.
Figure 8 denotes the indoor CO2 concentration and temperature from previous studies on daycare centers, showing that many studies have identified high CO2 levels as a significant issue (Figure 8). In most of the previous studies, the indoor CO2 concentrations exceeded the IAQ standard of 1000 ppm, which can be attributed to the following two main factors: (1) a high occupancy density and (2) low ventilation rates.
Figure 8.
Comparison of indoor CO2 concentration and temperature [6,7,18,38,43,44,45,46,47]. NV (natural ventilation); AC (air conditioning). Red dot denotes overheating cases.
In particular, many daycare centers utilizing natural ventilation (NV) recorded CO2 concentrations ranging between 945 and 1300 ppm, with peak indoor levels frequently exceeding 3000 ppm. This indicates that natural ventilation alone is not effective in controlling CO2 levels in daycare centers. Although natural ventilation can rapidly remove indoor pollutants when applied properly, the infrequent use of ventilation leads to repeated CO2 buildup during enclosed periods. On the other hand, daycare centers equipped with mechanical ventilation (AC) consistently maintained CO2 levels below 1000 ppm. This suggests that, if existing daycare centers undergo remodeling, it is essential to integrate mechanical ventilation systems, such as energy recovery ventilators (ERVs). Most of the previous studies reported minimal indoor temperature fluctuations (20–25 °C) due to HVAC operation. However, some of the studies observed high indoor temperatures (30 °C and 29.4 °C), mainly in tropical climates. Nevertheless, no strong correlation was found between the CO2 concentration and indoor temperature variations based on climate differences.
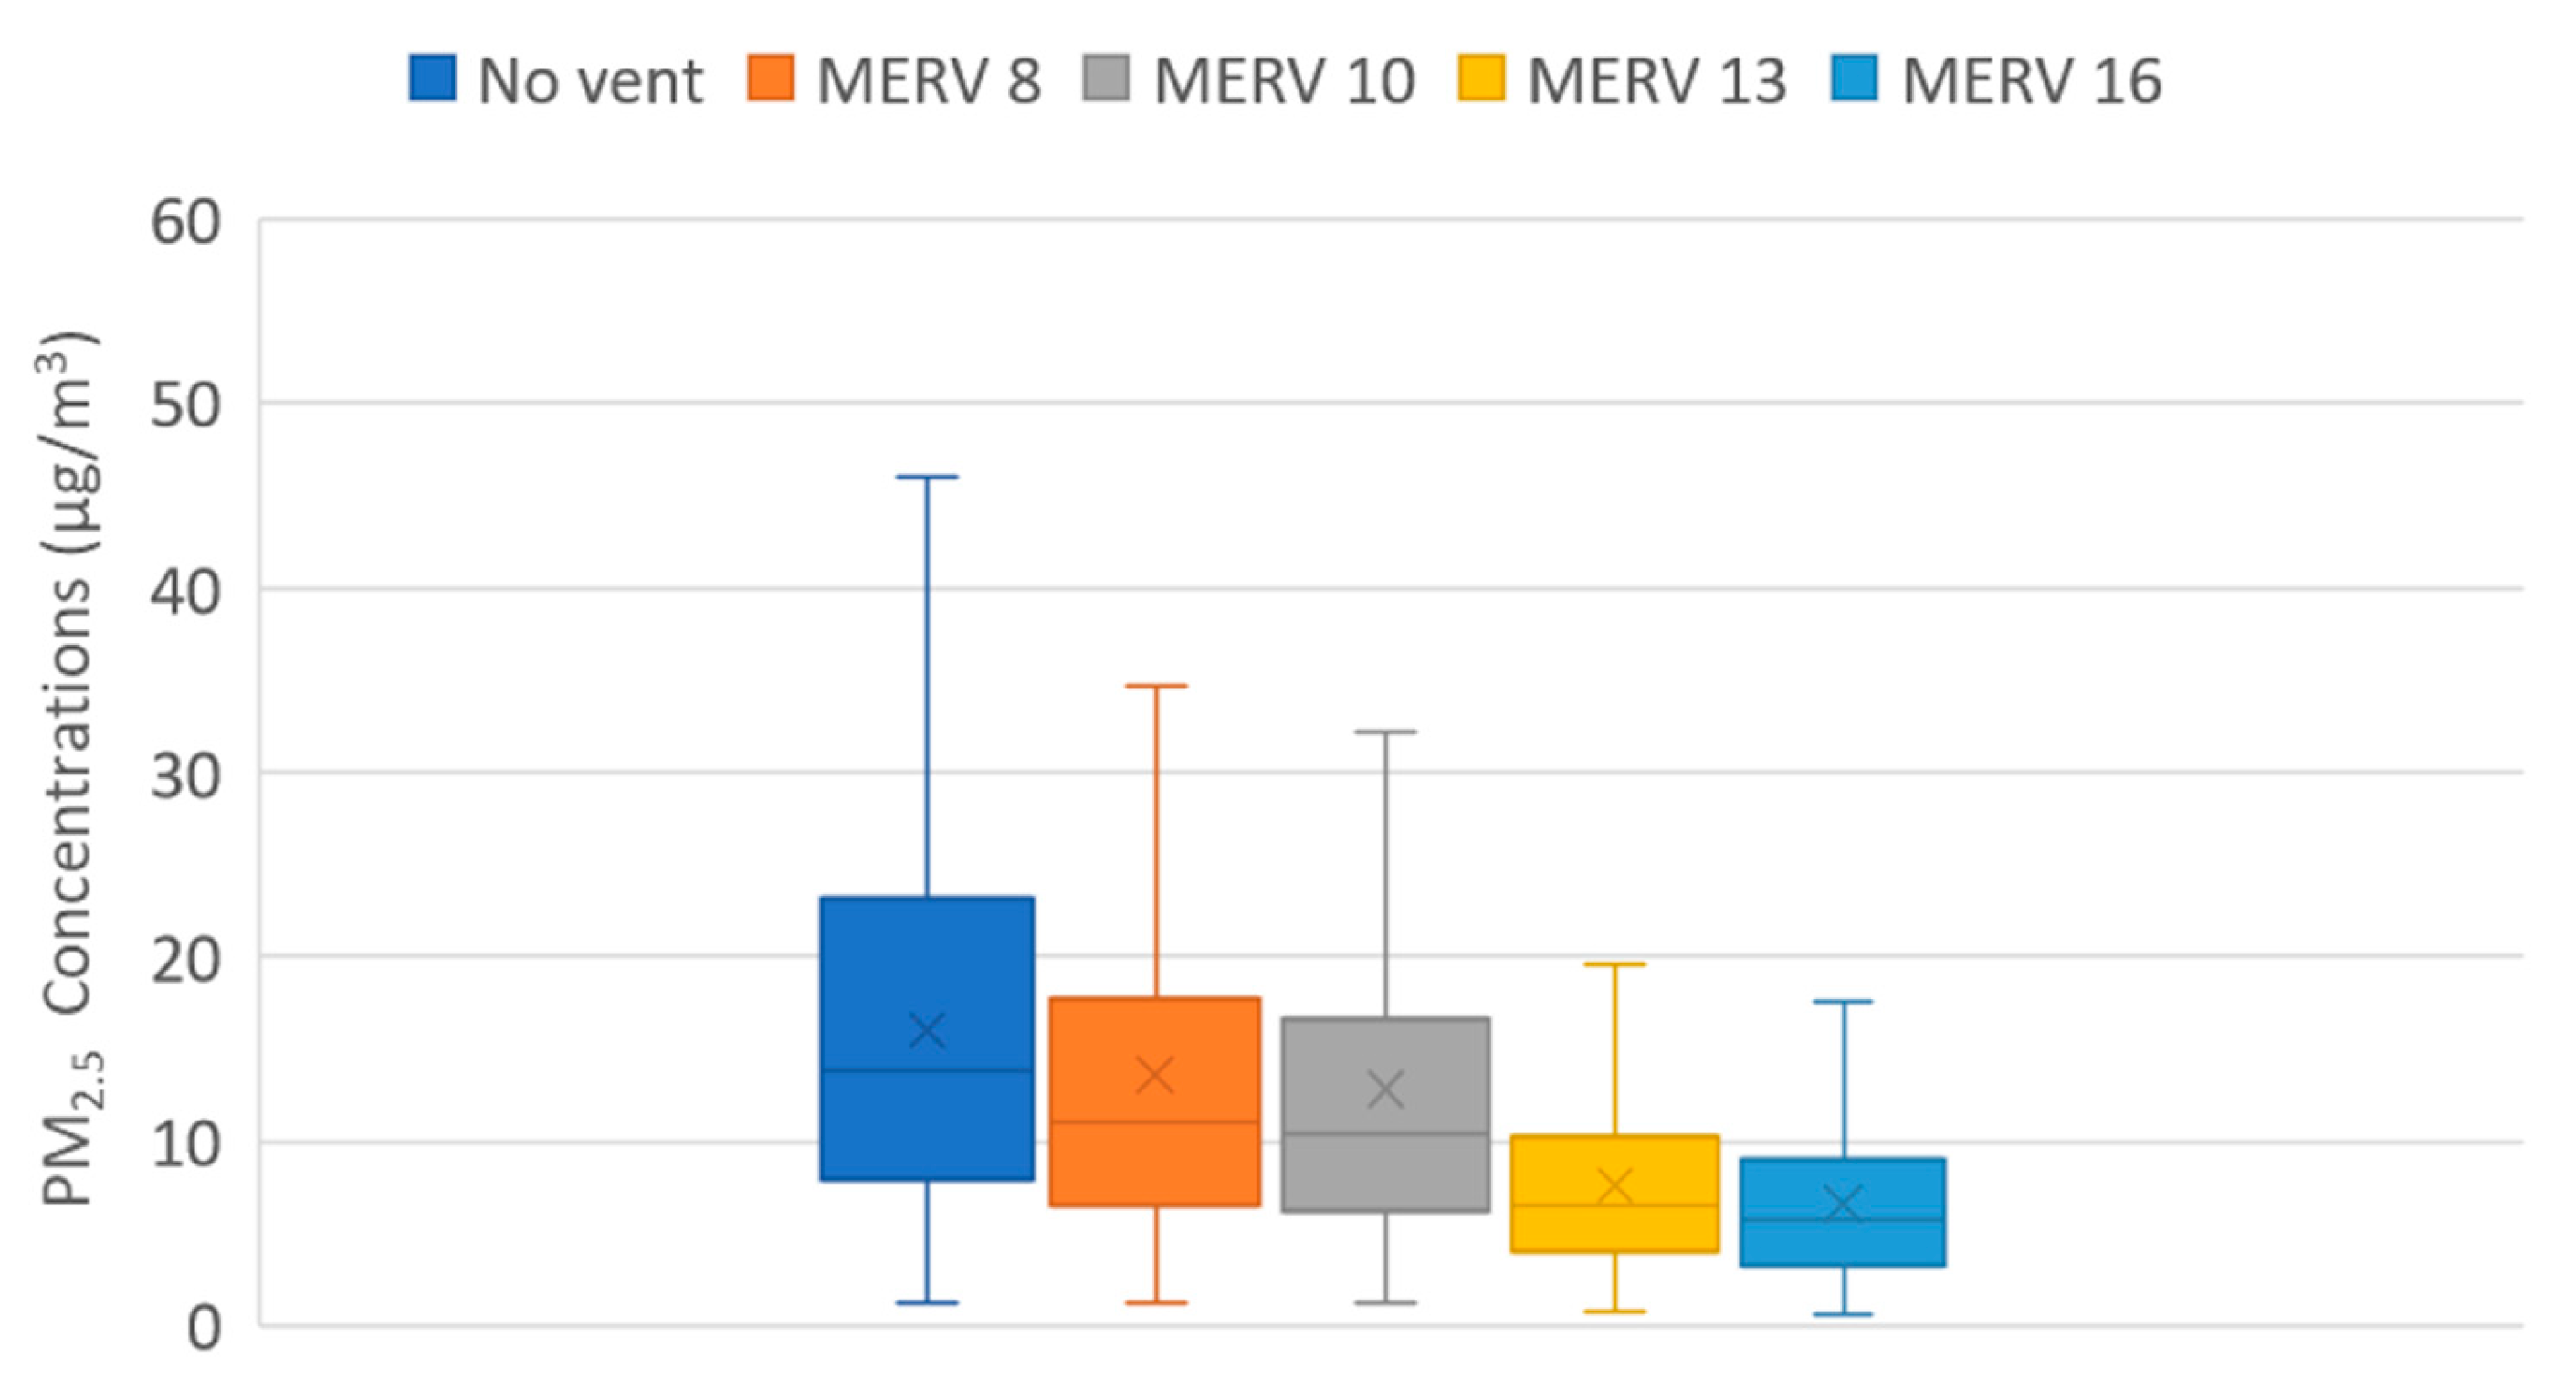
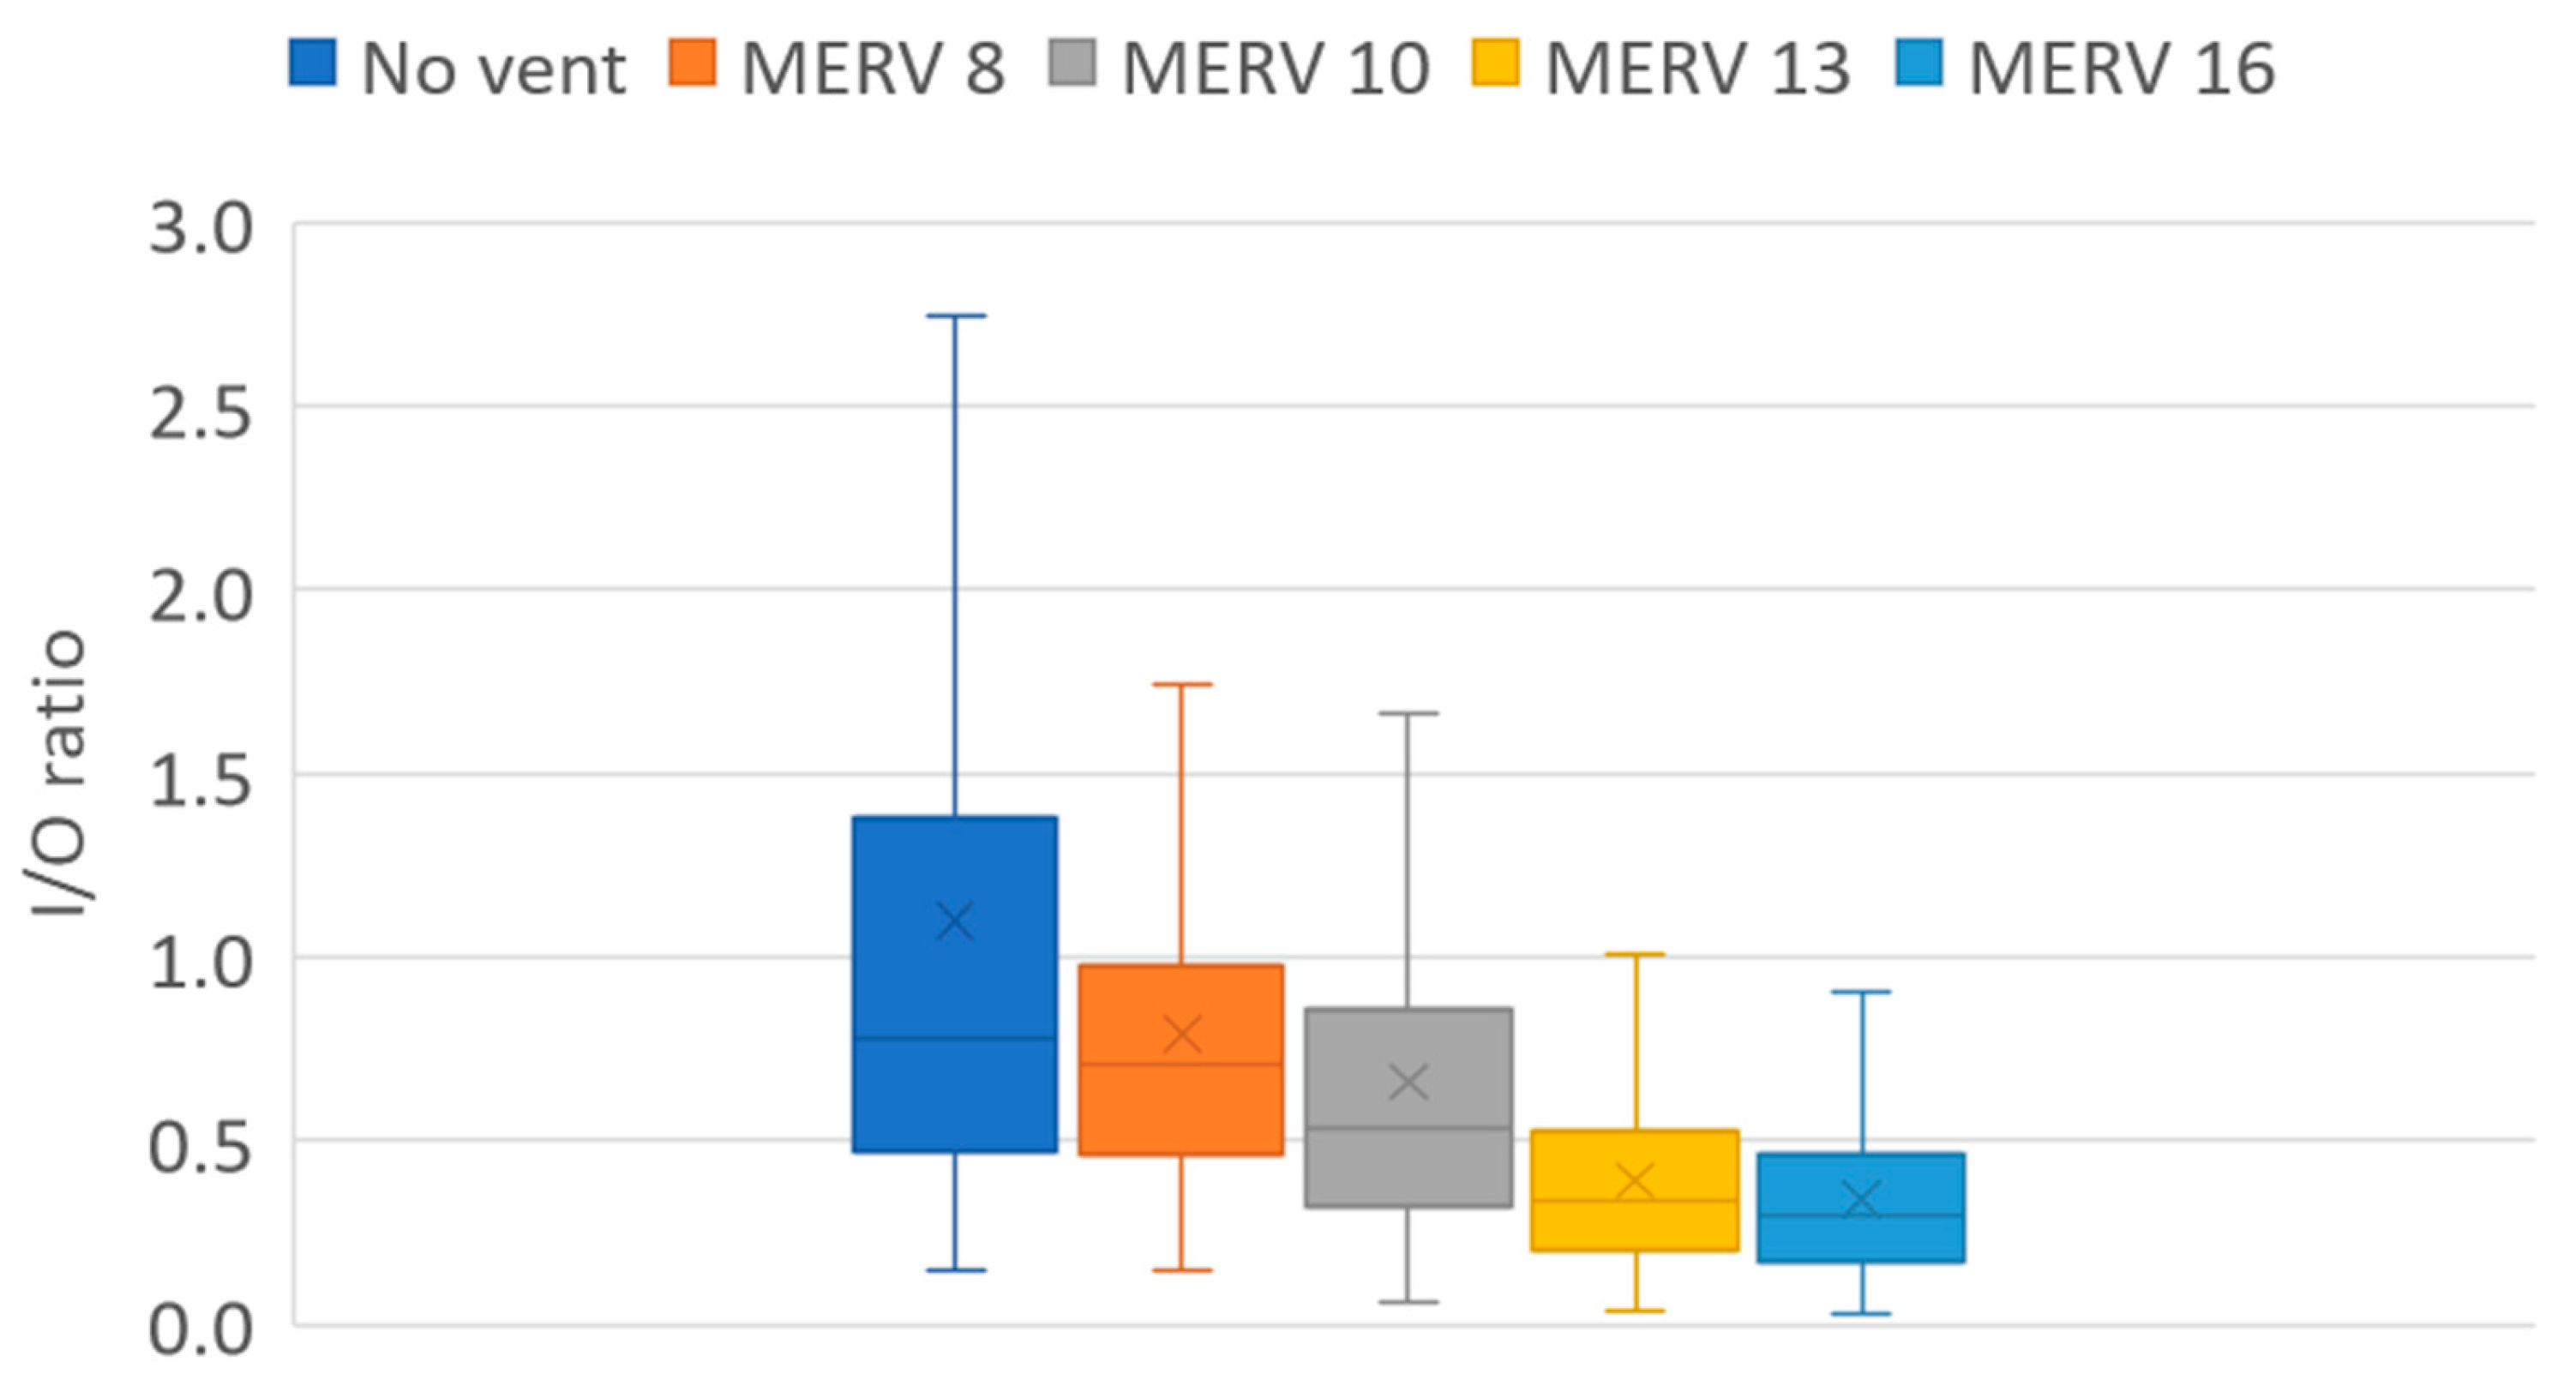
3.4. Filtration Efficiency and Indoor Particle Concentrtaion
When applying an ERV to daycare centers, a case study was conducted by categorizing filtration efficiency into MERV 8 to MERV 16 levels (Table 4). Since particulate matter can enter with the outdoor air introduced by the ERV, filters were installed on the outdoor duct side.
Table 4.
Case study in the CONTAM simulation.
The simulation results revealed differences in indoor particulate matter concentrations based on filter levels (Figure 9). In the absence of ventilation (No vent), the annual average indoor PM2.5 concentration was 24.4 µm/m3. When MERV 8 filters were applied, the concentration slightly decreased to 23.6 µm/m3, and, with MERV 10 filters, it further reduced to 22.3 µm/m3. These findings suggest that using filters rated at MERV 8–10 or lower in mechanical ventilation systems allows for the infiltration of outdoor particulate matter into the indoor environment. In contrast, applying a MERV 13 filter significantly reduced the annual average indoor PM2.5 concentration to 14.6 µm/m3. When a MERV 16 filter was used, the concentration further decreased to 12.4 µm/m3, demonstrating a substantial improvement in air quality.
Figure 9.
Result of indoor particle concentration.
These changes were also evident through the analysis of the indoor/outdoor (I/O) ratio. Without ventilation systems, the I/O ratio was 1.10, indicating a significant contribution from indoor particle generation. In contrast, the application of an ERV resulted in a substantial reduction in the I/O ratio. With MERV 8 and MERV 10 filters, the I/O ratio decreased to 0.79 and 0.66, respectively. However, with MERV 13 and MERV 16 filters, the I/O ratio was significantly reduced further to 0.39 and 0.34 (Figure 10).
Figure 10.
Result of the I/O ratio.
The simulation results demonstrated that applying an ERV appropriate for the occupancy density could simultaneously reduce the indoor particulate matter and CO2 concentrations. However, achieving the effective removal of indoor particulate matter requires the use of high-performance filters rated MERV 13 or higher to filter outdoor air before it enters the indoor environment. The appropriate filter level may vary depending on factors such as the extent of outdoor air pollution and trends in indoor pollutant generation.
The correlation between indoor and outdoor particulate matter concentrations varied depending on the ventilation system and filter performance (Figure 11). In the absence of a ventilation system, the indoor–outdoor correlation coefficient was r2 = 0.39. In contrast, with ERV operation, the correlation increased to 0.48–0.66.
Figure 11.
Scatter plots showing the correlation of indoor and outdoor PM2.5 concentrations: (a) No vent; (b) ERV + MERV8; (c) ERV + MERV10; (d) ERV + MERV13; (e) ERV + MERV16.
The indoor PM2.5 concentrations are heavily influenced by outdoor levels, as evidenced by the linear relationships in Figure 10. However, the slope of the regression lines and the R2 values indicate that the degree of this influence varies with the filtration efficiency. Without filtration (Figure 11a), the high slope and low R2 suggest poor IAQ control and a strong reliance on outdoor conditions. As filtration efficiency increases (from MERV 8 to MERV 16, as shown in Figure 11b–e), the slopes decrease and the indoor PM2.5 levels become less sensitive to outdoor fluctuations. This demonstrates the efficiency of high-performance filters in mitigating outdoor pollution’s impact on indoor environments.
This improvement can be attributed to the continuous ventilation provided by the ERV, which removes outdoor particulate matter before introducing air indoors, compared to reliance on natural ventilation. Additionally, scatter plots illustrated the changes in indoor particulate matter concentrations as influenced by varying outdoor particulate matter levels and the filter performance. These plots provide a clear visualization of how filtration efficiency affects the indoor environment.
The indoor particle concentration in daycare centers from previous studies revealed a wide variation (46.1 ± 34.7 µg/m3) [6,7,43,45,46,47,48]. The following two primary factors were identified as the reasons for this large variation: (1) differences in occupant behavior (e.g., ventilation patterns, cooking activities, and cleaning) and (2) variations in outdoor particulate matter concentrations. Among these, occupant behavior generally has a minor impact during regular activities. However, daycare centers often face high-intensity PM generation due to cooking and cleaning activities, which have been repeatedly reported as significant sources of indoor pollution. In this study, PM resuspended due to general occupancy was incorporated into the simulation, but indoor peak events such as cooking and intensive cleaning were not considered. This suggests the need for further research on South Korean daycare centers to better understand the impact of these activities on indoor PM levels.
Additionally, differences in outdoor PM concentrations had a significant effect on indoor levels. The indoor/outdoor (I/O) ratio from previous studies was 0.80 ± 0.15, indicating that outdoor PM significantly contributes to indoor air pollution. As discussed earlier, most daycare centers rely on natural ventilation, making them highly susceptible to outdoor PM infiltration. Therefore, careful consideration is needed to manage outdoor pollutant exposure in these facilities.
Additionally, beyond ERVs, most heating, ventilation, and air conditioning (HVAC) systems use filters when introducing outdoor air. The disparity in average annual PM2.5 concentrations between countries further highlights the need for appropriate filtration standards. While the United States reports an annual average PM2.5 concentration of 8 µm/m3 [49], South Korea’s average is significantly higher at 27 µm/m3, making it one of the highest among OECD countries [50]. This discrepancy underscores the necessity for higher filter levels in regions like South Korea.
Stephens et al. investigated MERV levels in HVAC filters across residential buildings in Texas, finding that most filters ranged from MERV 6 to 8 [29]. Similarly, Alavy et al. conducted a study on residential HVAC filters in Toronto, Canada, reporting MERV levels between 8 and 14 [51]. Both studies provide insight into typical North American filtration practices, though ASHRAE has recently recommended MERV 13 or higher due to the COVID-19 pandemic [52]. The WHO has also endorsed MERV 14 filters as part of its 2021 guidelines [53].
In South Korea, daycare centers often employ filters with MERV 14 [15], while residential buildings commonly use MERV 11 [54]. Schools, which share similar requirements, recommend filters between MERV 12 and 15 [55]. Recently, some new daycare centers in South Korea have adopted MERV 16 or HEPA-level filters in response to severe particulate matter issues.
4. Conclusions
This study aimed to improve the IAQ of daycare centers in an energy-efficient manner by combining field measurements and simulations to identify appropriate solutions for applying energy recovery ventilators (ERVs). The conclusions can be summarized as follows:
- Applying ERVs is an energy-efficient solution for removing indoor CO2. It facilitates the introduction of outdoor air, effectively eliminating gaseous pollutants generated indoors and maintaining CO2 concentrations below 1000 ppm.
- Daycare centers, where various occupant activities occur, generate indoor pollution sources. However, due to poor airtightness, they are more vulnerable to outdoor pollution sources. Applying ERVs reduces penetration and introduces filtered, clean outdoor air into indoor spaces, emphasizing the importance of this approach.
- During periods of heightened particulate matter pollution, the use of ERVs requires careful consideration of filter performance. Low-performance filters can worsen indoor particulate matter concentrations compared to sealed conditions without ventilation. Therefore, it is crucial to use filters with a minimum performance of MERV 13 or higher to maintain IAQ during ventilation.
Given the findings of this study, daycare centers should implement filters with a minimum MERV rating of 13 to ensure optimal indoor air quality (IAQ), particularly for CO2 and PM2.5, and to protect children’s health. However, this study was limited to winter conditions and did not account for seasonal variations in filtration efficiency, ERV performance, or indoor environmental factors affecting CO2 concentrations. Considering South Korea’s significant seasonal fluctuations in air pollution and climate, future research should explore these variables to develop a more comprehensive approach to IAQ management in daycare centers.
Additionally, a thorough assessment of indoor PM emissions is essential to better understand their impact on air quality. Future studies should focus on the long-term monitoring of daycare centers in South Korea, combined with experimental analyses under various conditions, to refine and enhance IAQ management strategies.
Author Contributions
Conceptualization, K.K. and D.D.K.; methodology, D.D.K.; software, D.D.K.; validation, K.K. and D.D.K.; resources, D.D.K.; writing—original draft preparation, K.K.; writing review and editing, K.K. and D.D.K. All authors have read and agreed to the published version of the manuscript.
Funding
This research was supported by the Daejin University Research Grant in 2025.
Data Availability Statement
Data are available upon request from the authors.
Acknowledgments
This paper, along with the accompanying data analysis, was originally created entirely by the human author. The English text of the manuscript was later proofread and corrected for grammar by using ChatGPT.
Conflicts of Interest
The authors declare no conflicts of interest.
Abbreviations
| ERV | Energy recovery ventilator |
| MERV | Minimum Efficiency Reporting Value |
| ASHRAE | American Society of Heating, Refrigerating, and Air-Conditioning Engineers |
| ISO | International Organization for Standardization |
| PM | Particulate matter |
| IAQ | Indoor air quality |
| ACH50 | Air changes per hour at 50 pascals |
| eqLA | Equivalent leakage area |
| CMH | Cubic meter per hour |
| CO2 | Carbon dioxide |
| HVAC | Heating, ventilation, and air conditioning |
References
- World Health Organization. WHO Global Air Quality Guidelines: Particulate Matter (PM2. 5 and PM10), Ozone, Nitrogen Dioxide, Sulfur Dioxide and Carbon Monoxide; World Health Organization: Geneva, Switzerland, 2021. [Google Scholar]
- Um, C.Y.; Zhang, N.; Kang, K.; Na, H.; Choi, H.; Kim, T. Occupant behavior and indoor particulate concentrations in daycare centers. Sci. Total Environ. 2022, 824, 153206. [Google Scholar] [CrossRef] [PubMed]
- Ferrante, G.; La Grutta, S. The Burden of Pediatric Asthma. Front. Pediatr. 2018, 6, 186. [Google Scholar] [CrossRef] [PubMed]
- Mainka, A.; Fantke, P. Preschool children health impacts from indoor exposure to PM(2.5) and metals. Environ. Int. 2022, 160, 107062. [Google Scholar] [CrossRef]
- Rim, D.; Gall, E.T.; Kim, J.B.; Bae, G.N. Particulate matter in urban nursery schools: A case study of Seoul, Korea during winter months. Build. Environ. 2017, 119, 1–10. [Google Scholar] [CrossRef]
- Branco, P.T.B.S.; Alvim-Ferraz, M.C.M.; Martins, F.G.; Sousa, S.I.V. Quantifying indoor air quality determinants in urban and rural nursery and primary schools. Environ. Res. 2019, 176, 108534. [Google Scholar] [CrossRef]
- Kim, C.; Choi, D.; Lee, Y.G.; Kim, K. Diagnosis of indoor air contaminants in a daycare center using a long-term monitoring. Build. Environ. 2021, 204, 108124. [Google Scholar] [CrossRef]
- Clausen, G.; Høst, A.; Toftum, J.; Bekö, G.; Weschler, C.; Callesen, M.; Buhl, S.; Ladegaard, M.B.; Langer, S.; Andersen, B.; et al. Children’s health and its association with indoor environments in Danish homes and daycare centres-methods. Indoor Air 2012, 22, 467–475. [Google Scholar] [CrossRef]
- Branco, P.T.B.S.; Alvim-Ferraz, M.C.M.; Martins, F.G.; Sousa, S.I.V. Indoor air quality in urban nurseries at Porto city: Particulate matter assessment. Atmos. Environ. 2014, 84, 133–143. [Google Scholar] [CrossRef]
- Anake, W.U.; Nnamani, E.A. Indoor air quality in day-care centres: A global review. Air Qual. Atmos. Health 2023, 16, 997–1022. [Google Scholar] [CrossRef]
- Ministry of Environment of South Korea. Indoor Air Quality Control in Publicly Used Facilities; Ministry of Environment of South Korea: Sejong-si, Republic of Korea, 2016; Volume 14486. [Google Scholar]
- Kang, K.; Kim, T.; Shin, C.W.; Kim, K.; Kim, J.; Lee, Y.G. Filtration efficiency and ventilation performance of window screen filters. Build. Environ. 2020, 178, 106878. [Google Scholar] [CrossRef]
- Ruan, T.; Rim, D. Indoor air pollution in office buildings in mega-cities: Effects of filtration efficiency and outdoor air ventilation rates. Sustain. Cities Soc. 2019, 49, 101609. [Google Scholar] [CrossRef]
- Stephens, B. Evaluating the sensitivity of the mass-based particle removal calculations for HVAC filters in ISO 16890 to assumptions for aerosol distributions. Atmosphere 2018, 9, 85. [Google Scholar] [CrossRef]
- Park, J.; Yoo, J.; Jeong, J.W. Impact of ventilation methods on indoor particle concentrations in a daycare center. Indoor Air 2022, 32, e13150. [Google Scholar] [CrossRef]
- Woo, S.; Kang, K.; Lee, S. Analysis of Energy-Saving Effect of Green Remodeling in Public Welfare Facilities for Net Zero: The Case of Public Daycare Centers, Public Health Centers, and Public Medical Institutions. Buildings 2024, 14, 949. [Google Scholar] [CrossRef]
- Mleczkowska, A.; Strojecki, M.; Bratasz, Ł.; Kozłowski, R. Particle penetration and deposition inside historical churches. Build. Environ. 2016, 95, 291–298. [Google Scholar] [CrossRef]
- Hwang, S.H.; Lee, G.B.; Kim, I.S.; Park, W.M. Formaldehyde and carbon dioxide air concentrations and their relationship with indoor environmental factors in daycare centers. J. Air Waste Manag. Assoc. 2017, 67, 306–312. [Google Scholar] [CrossRef]
- Noguchi, M.; Mizukoshi, A.; Yanagisawa, Y.; Yamasaki, A. Measurements of volatile organic compounds in a newly built daycare center. Int. J. Environ. Res. Public Heath 2016, 13, 736. [Google Scholar] [CrossRef]
- Gabriel, M.F.; Felgueiras, F.; Feliciano, M. Children’s Exposure to Volatile Organic Compounds: A Comparative Analysis of Assessments in Households, Schools, and Indoor Swimming Pools. Atmosphere 2024, 15, 1471. [Google Scholar] [CrossRef]
- Zheng, H.; Krishnan, V.; Walker, S.; Loomans, M.; Zeiler, W. Laboratory evaluation of low-cost air quality monitors and single sensors for monitoring typical indoor emission events in Dutch daycare centers. Environ. Int. 2022, 166, 107372. [Google Scholar] [CrossRef]
- Kim, J.; Hong, Y.; Seong, N.; Kim, D.D. Assessment of ANN Algorithms for the Concentration Prediction of Indoor Air Pollutants in Child Daycare Centers. Energies 2022, 15, 2654. [Google Scholar] [CrossRef]
- Kim, H.; Kang, K.; Kim, T. CFD Simulation Analysis on Make-up Air Supply by Distance from Cookstove for Cooking-Generated Particle. Int. J. Environ. Res. Public Health 2020, 17, 7799. [Google Scholar] [CrossRef] [PubMed]
- Kang, K.; Kim, T.; Kim, D.D. An Investigation of Concentration and Health Impacts of Aldehydes Associated with Cooking in 29 Residential Buildings. Indoor Air 2023, 2023, 2463386. [Google Scholar] [CrossRef]
- Eom, Y.S.; Kang, D.H.; Rim, D.; Yeo, M. Particle dispersion and removal associated with kitchen range hood and whole house ventilation system. Build. Environ. 2023, 230. [Google Scholar] [CrossRef]
- ASTM E779-19; Standard Test Method for Determining Air Leakage Rate by Fan Pressurization. ASTM International West Conshohocken: Conshohocken, PA, USA, 2019.
- ISO 9972; Thermal Performance of Buildings, Determination of Air Permeability of Buildings, Fan Pressurization Method. ISO: Geneva, Switzerland, 2015.
- Chen, C.; Zhao, B. Review of relationship between indoor and outdoor particles: I/O ratio, infiltration factor and penetration factor. Atmos. Environ. 2011, 45, 275–288. [Google Scholar] [CrossRef]
- Stephens, B.; Siegel, J.A. Penetration of ambient submicron particles into single-family residences and associations with building characteristics. Indoor Air 2012, 22, 501–513. [Google Scholar] [CrossRef] [PubMed]
- Tran, D.T.; Alleman, L.Y.; Coddeville, P.; Galloo, J.C. Indoor particle dynamics in schools: Determination of air exchange rate, size-resolved particle deposition rate and penetration factor in real-life conditions. Indoor Built Environ. 2017, 26, 1335–1350. [Google Scholar] [CrossRef]
- Kim, S.; Kang, K.; Park, D.; Kim, T. Assessment of PM2.5 penetration based on airflow paths in Korean classrooms. Build. Environ. 2024, 248. [Google Scholar] [CrossRef]
- Lee, B.H.; Yee, S.W.; Kang, D.H.; Yeo, M.S.; Kim, K.W. Multi-zone simulation of outdoor particle penetration and transport in a multi-story building. Build. Simul. 2017, 10, 525–534. [Google Scholar] [CrossRef]
- Park, S.; Cai, Y.; Lim, H.; Song, D. Analysis of vertical movement of particulate matter due to the stack effect in high-rise buildings. Atmos. Environ. 2022, 279, 119113. [Google Scholar] [CrossRef]
- Dols, W.S.; Polidoro, B.J. CONTAM User Guide and Program Documentation Version 3.4. 2020. Available online: https://nvlpubs.nist.gov/nistpubs/TechnicalNotes/NIST.TN.1887r1.pdf (accessed on 30 December 2024).
- ASHRAE. Ventilation for Acceptable Indoor Air Quality; American Society of Heating, Refrigerating and Air-Conditioning Engineers: Atlanta, GA, USA, 2019; Volume 62. [Google Scholar]
- Persily, A. Please Don’t Blame Standard 62.1 for 1000 ppm CO2. ASHRAE J. 2021, 63, 1. [Google Scholar]
- REHVA. How to Operate HVAC and Other Building Service Systems to Prevent the Spread of the Coronavirus (SARS-CoV-2) Disease (COVID-19) in Workplaces; REHVA Federation of European Heating, Ventilation and Air Conditioning Association: Brussels, Belgium, 2020. [Google Scholar]
- Hwang, S.H.; Roh, J.; Park, W.M. Evaluation of PM(10), CO(2), airborne bacteria, TVOCs, and formaldehyde in facilities for susceptible populations in South Korea. Environ. Pollut. 2018, 242 Pt A, 700–708. [Google Scholar] [CrossRef]
- Nazaroff, W.W. Indoor particle dynamics. Indoor Air 2004, 14 (Suppl. 7), 175–183. [Google Scholar] [CrossRef] [PubMed]
- Li, A.; Ren, T.; Yang, C.; Lv, W.; Zhang, F. Study on particle penetration through straight, L, Z and wedge-shaped cracks in buildings. Build. Environ. 2017, 114, 333–343. [Google Scholar] [CrossRef]
- Zhao, H.; Stephens, B. Using portable particle sizing instrumentation to rapidly measure the penetration of fine and ultrafine particles in unoccupied residences. Indoor Air 2017, 27, 218–229. [Google Scholar] [CrossRef]
- Franco, A.; Leccese, F. Measurement of CO2 concentration for occupancy estimation in educational buildings with energy efficiency purposes. J. Build. Eng. 2020, 32, 101714. [Google Scholar] [CrossRef]
- Choo, C.P.; Jalaludin, J.; Hamedon, T.R.; Adam, N.M. Preschools’ Indoor Air Quality and Respiratory Health Symptoms among Preschoolers in Selangor. Procedia Environ. Sci. 2015, 30, 303–308. [Google Scholar] [CrossRef]
- Carreiro-Martins, P.; Viegas, J.; Papoila, A.L.; Aelenei, D.; Caires, I.; Araujo-Martins, J.; Gaspar-Marques, J.; Cano, M.M.; Mendes, A.S.; Virella, D.; et al. CO2 concentration in day care centres is related to wheezing in attending children. Eur. J. Pediatr. 2014, 173, 1041–1049. [Google Scholar] [CrossRef]
- Zuraimi, M.S.; Tham, K.W. Indoor air quality and its determinants in tropical child care centers. Atmos. Environ. 2008, 42, 2225–2239. [Google Scholar] [CrossRef]
- Canha, N.; Mandin, C.; Ramalho, O.; Wyart, G.; Ribéron, J.; Dassonville, C.; Hänninen, O.; Almeida, S.M.; Derbez, M. Assessment of ventilation and indoor air pollutants in nursery and elementary schools in France. Indoor Air 2016, 26, 350–365. [Google Scholar] [CrossRef]
- Oliveira, M.; Slezakova, K.; Delerue-Matos, C.; Pereira, M.C.; Morais, S. Assessment of air quality in preschool environments (3–5 years old children) with emphasis on elemental composition of PM10 and PM2.5. Environ. Pollut. 2016, 214, 430–439. [Google Scholar] [CrossRef]
- Gaspar, F.W.; Maddalena, R.; Williams, J.; Castorina, R.; Wang, Z.M.; Kumagai, K.; McKone, T.E.; Bradman, A. Ultrafine, fine, and black carbon particle concentrations in California child-care facilities. Indoor Air 2018, 28, 102–111. [Google Scholar] [CrossRef] [PubMed]
- OECD Environmental Performance Reviews. OECD Environmental Performance Reviews UNITED STATES 2023; OECD: Tokyo, Japan, 2023. [Google Scholar]
- OECD. OECD Environmental Performance Reviews: Korea 2017. 2017. Available online: https://www.oecd.org/en/publications/oecd-environmental-performance-reviews-korea-2017_9789264268265-en.html (accessed on 30 December 2024).
- Alavy, M.; Siegel, J.A. In-situ effectiveness of residential HVAC filters. Indoor Air 2020, 30, 156–166. [Google Scholar] [CrossRef] [PubMed]
- ASHRAE, Filtration/Disinfection. ASHRAE, Ed. 2021. Available online: https://www.ashrae.org/technical-resources/filtration-disinfection (accessed on 30 December 2024).
- World Health Organization. Roadmap to Improve and Ensure Good Indoor Ventilation in the Context of COVID-19; World Health Organization: Geneva, Switzerland, 2021. [Google Scholar]
- Park, J.S.; Jee, N.Y.; Jeong, J.W. Effects of types of ventilation system on indoor particle concentrations in residential buildings. Indoor Air 2014, 24, 629–638. [Google Scholar] [CrossRef]
- Kim, S.; Kang, K.; Park, D.; Na, H.; Kim, T. Balance point concentration: An indicator for classroom performance against outdoor PM2.5. Build. Environ. 2024, 266, 112021. [Google Scholar] [CrossRef]
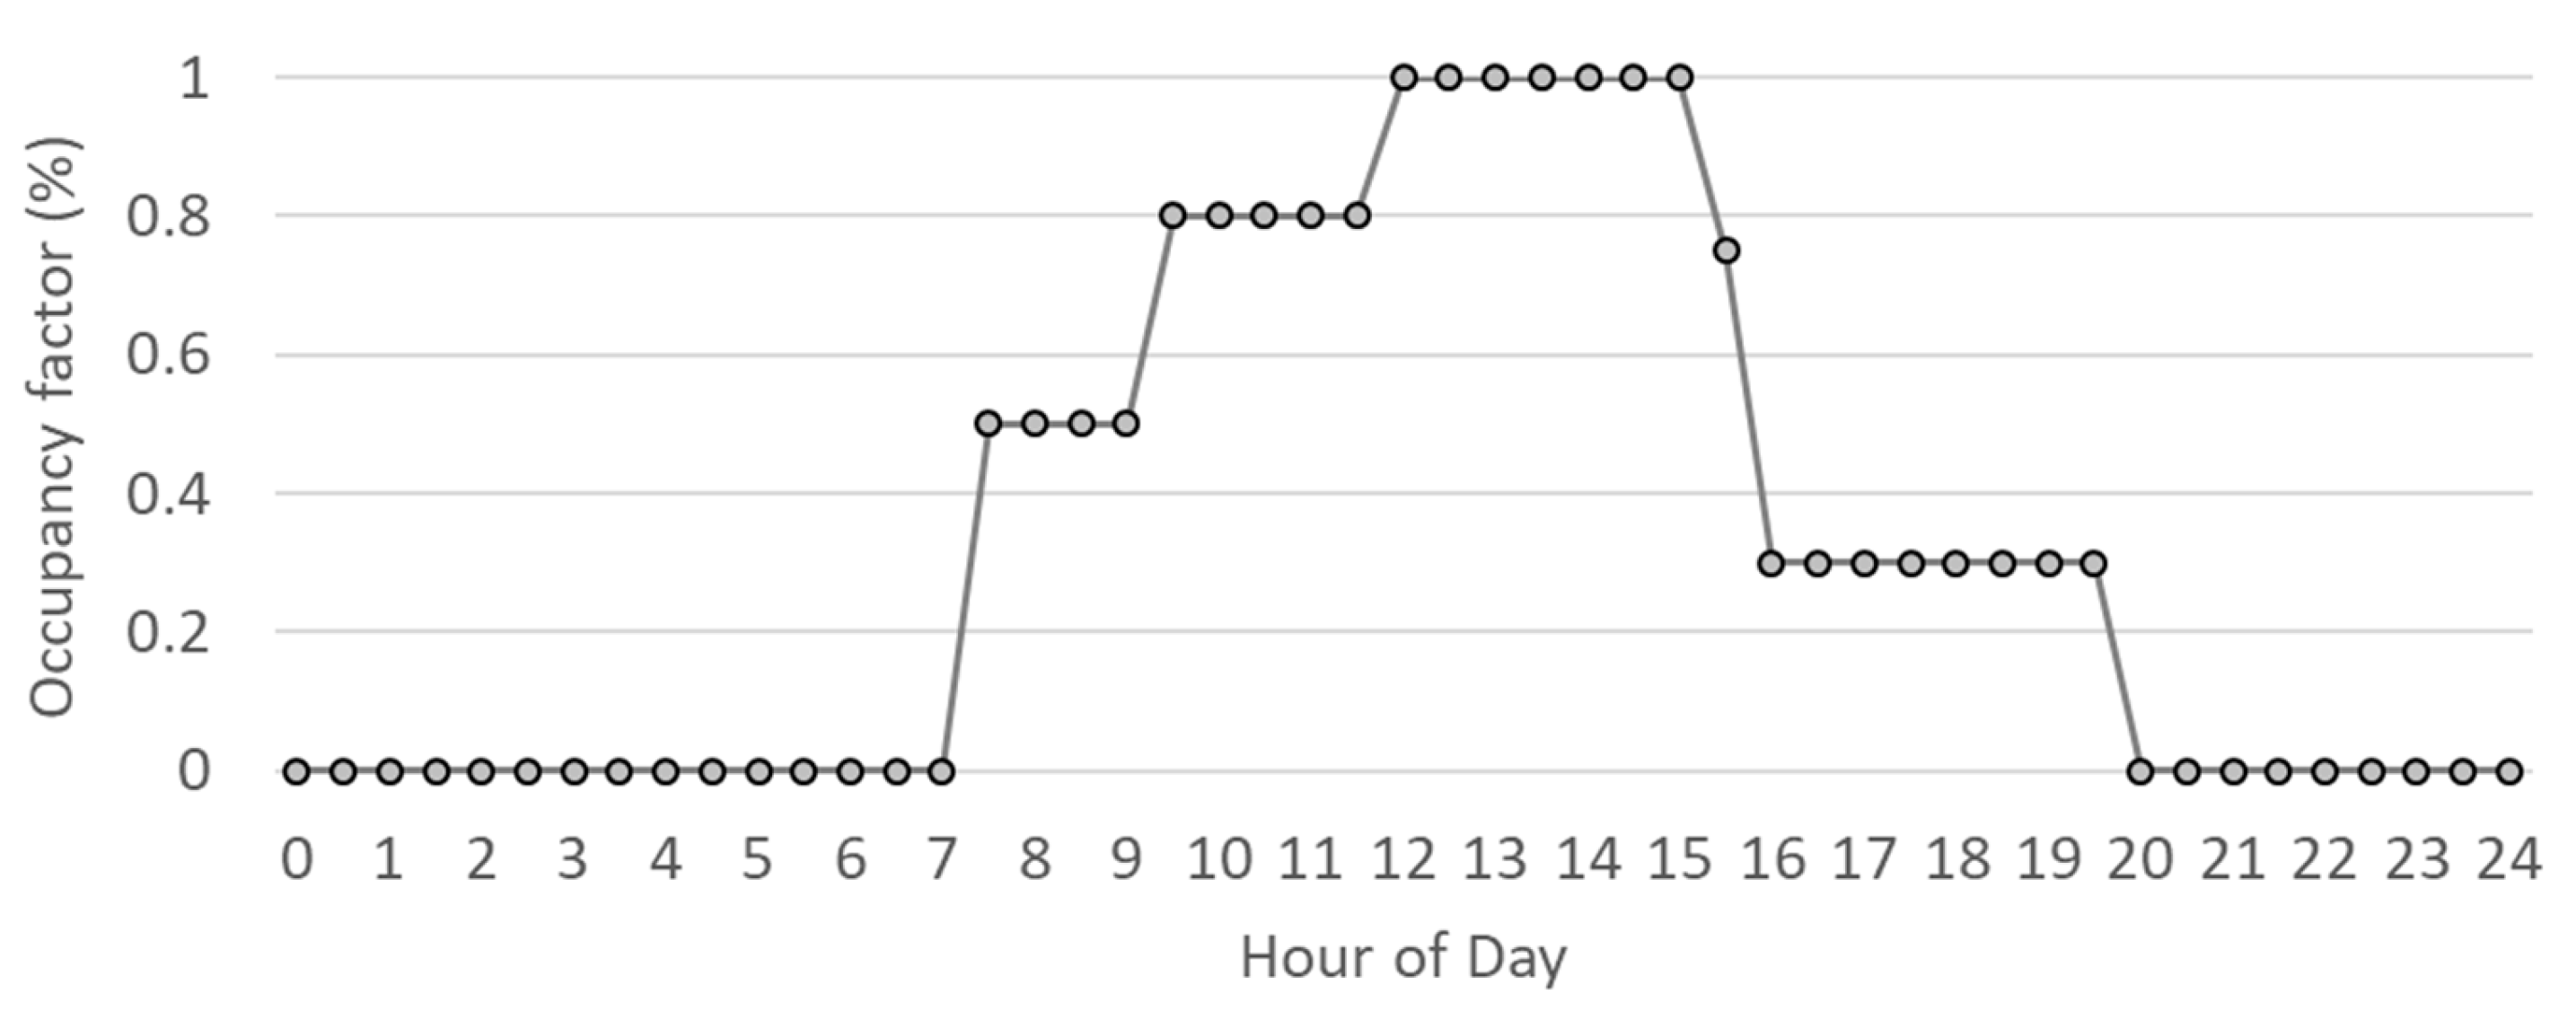
Disclaimer/Publisher’s Note: The statements, opinions and data contained in all publications are solely those of the individual author(s) and contributor(s) and not of MDPI and/or the editor(s). MDPI and/or the editor(s) disclaim responsibility for any injury to people or property resulting from any ideas, methods, instructions or products referred to in the content. |
© 2025 by the authors. Licensee MDPI, Basel, Switzerland. This article is an open access article distributed under the terms and conditions of the Creative Commons Attribution (CC BY) license (https://creativecommons.org/licenses/by/4.0/).