
A Deep Learning Framework for Corrosion Assessment of Steel Structures Using Inception v3 Model

Abstract
1. Introduction
2. Related Works
2.1. Inception
2.2. AlexNet
2.3. ResNet
2.4. SegNet
3. Methodology
3.1. Datasets
3.1.1. Salt Fog Test
- (1)
- Prepare the reagents and add a sufficient amount to the salt fog chamber.
- (2)
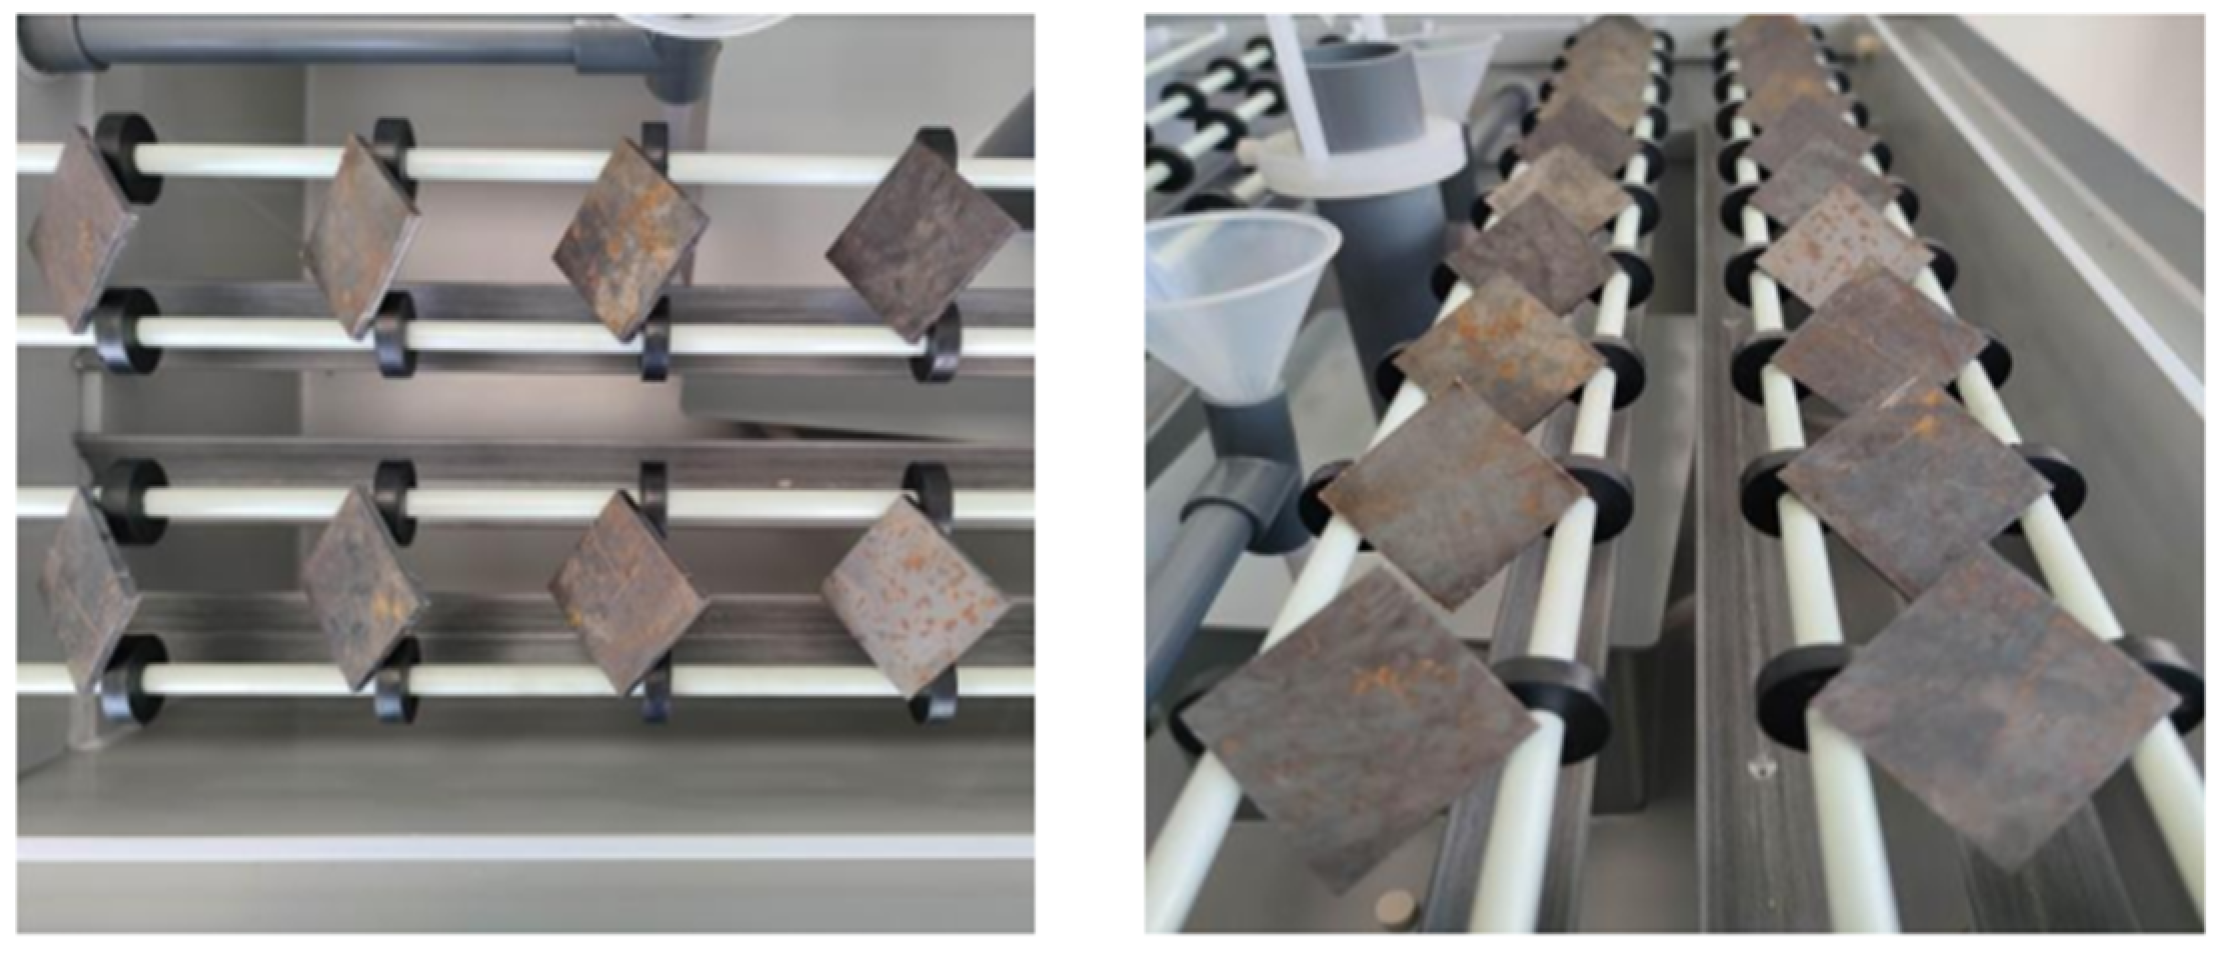
- Open the salt fog chamber, place the specimens inside as shown in Figure 5, and adjust the working environment (temperature, air pressure, etc.).
- (3)
- After the first experimental cycle, remove the fog from the salt fog chamber, take out the specimens, and rinse the surface of the specimens with distilled water to remove salt.
- (4)
- Place all specimens in the constant temperature drying oven to dry.
- (5)
- Take photographs to obtain images of the corrosion on the specimens’ surfaces.
- (6)
- Remove the specimens (do not return them to the salt fog chamber), use an ultrasonic acid cleaning machine to remove surface corrosion, and dry them.
- (7)
- Weigh the cleaned specimens, record the data, and determine the corrosion level based on mass loss and the proportion of the corrosion area.
- (8)
- Repeat steps (2)–(7) until the full cycle experiment is completed.
3.1.2. Classification Dataset
- Judgment Criteria
- 2.
- Dataset
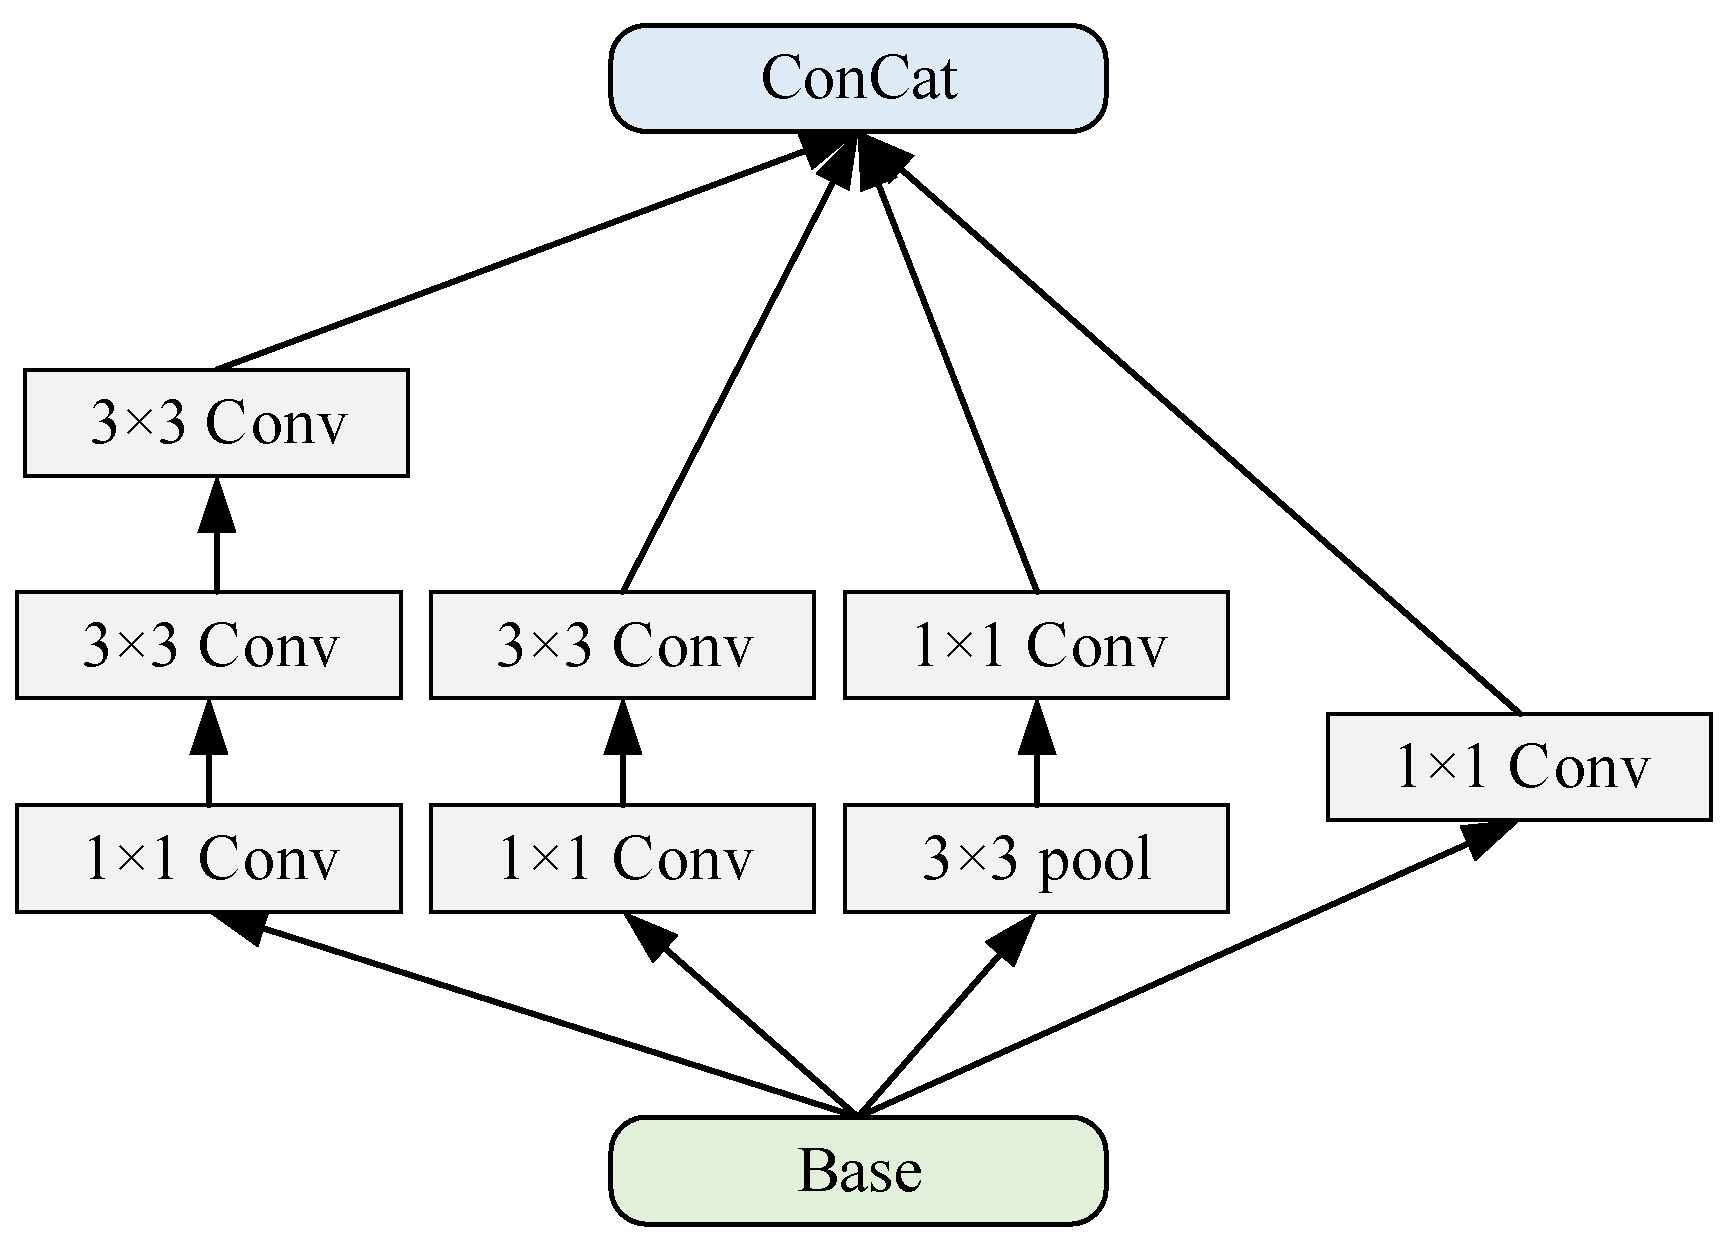
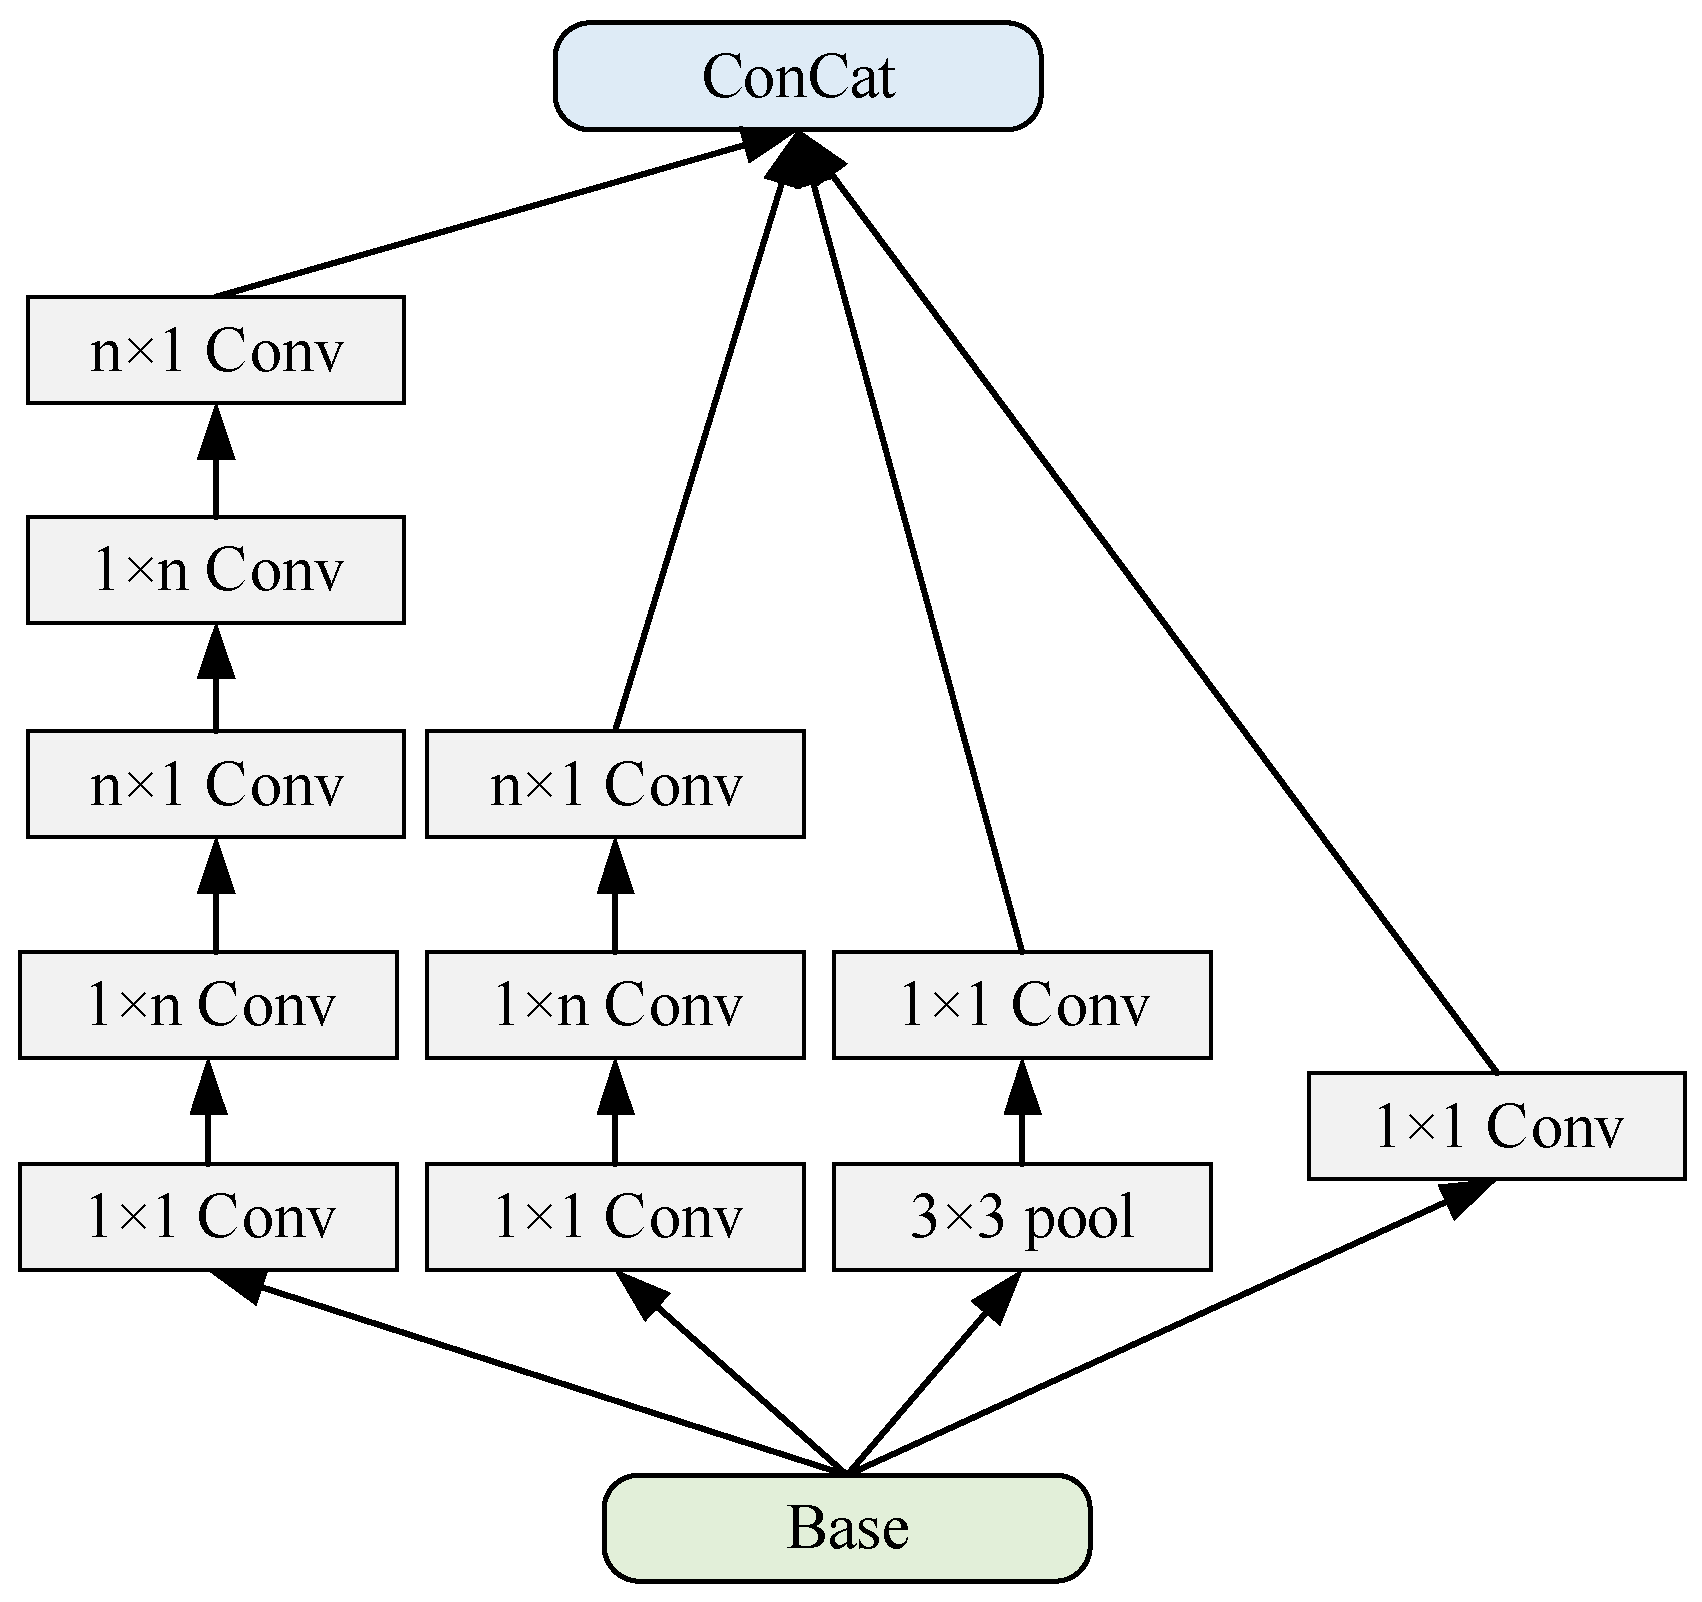
3.2. Inception Module Lightweight
3.3. Inception v3
4. Experiments and Results
4.1. Training and Finetuning
4.2. Results and Analysis
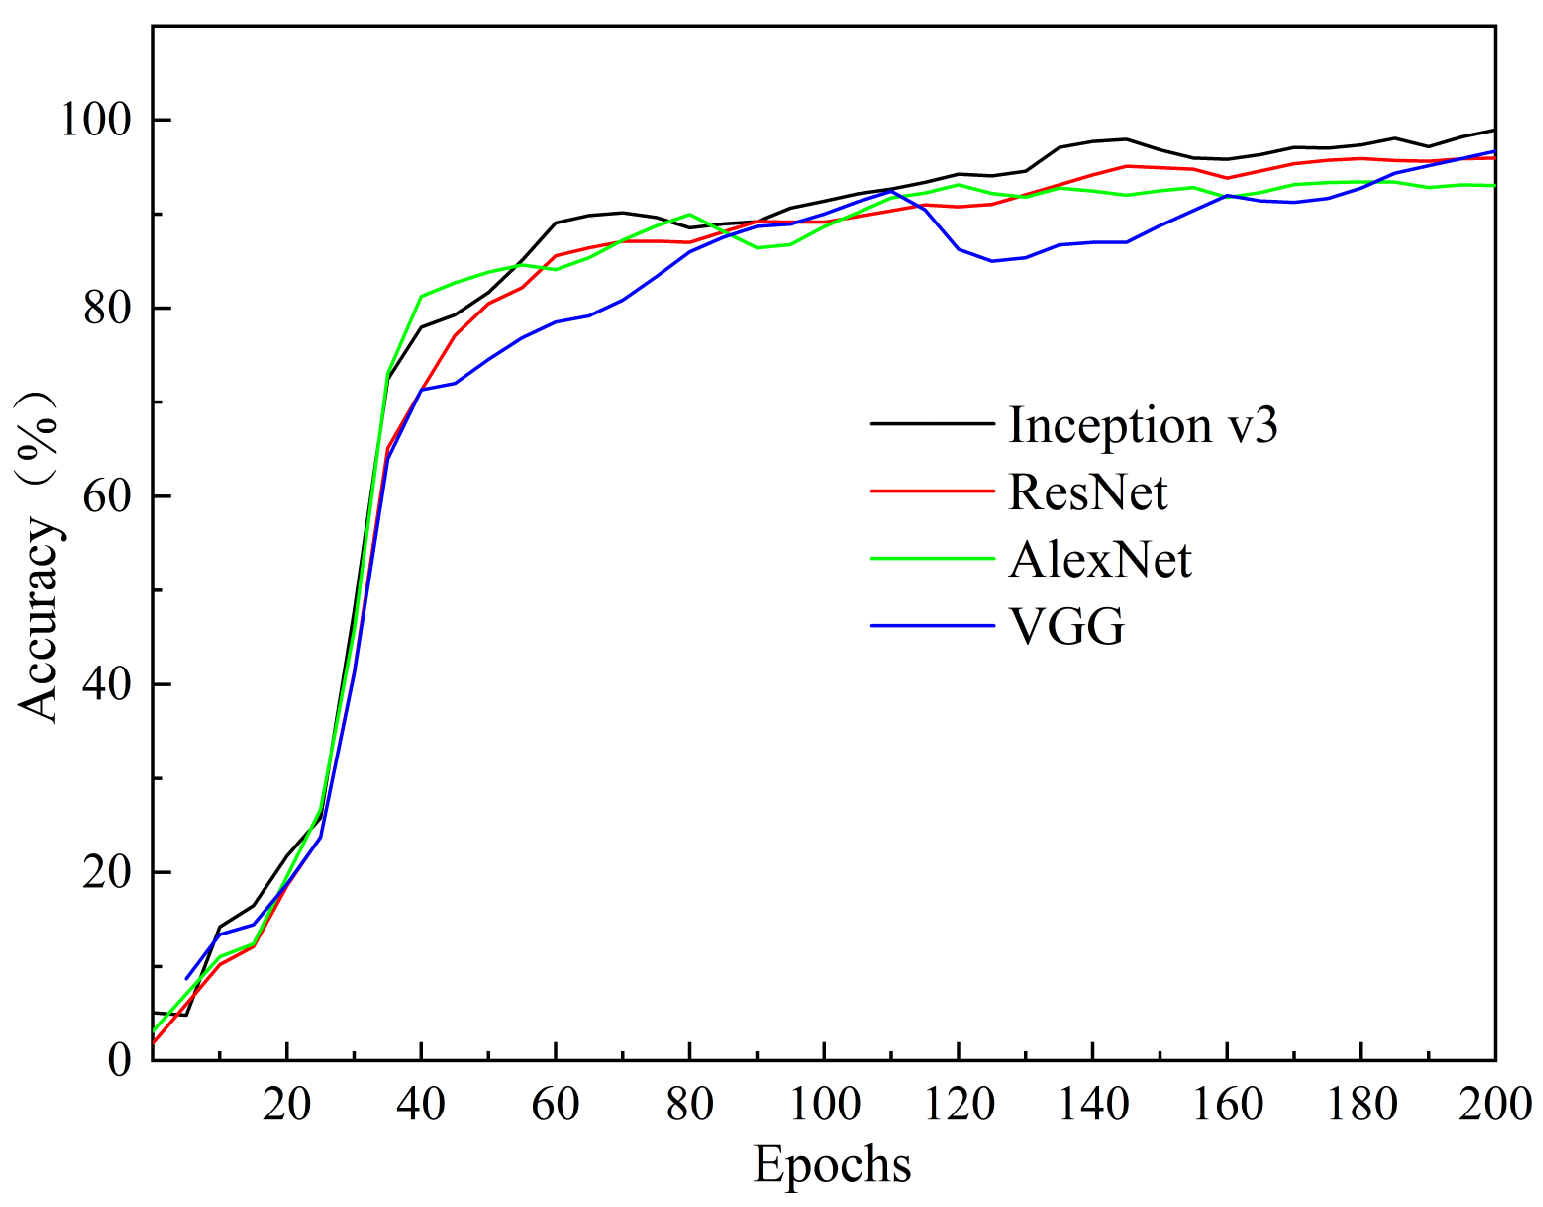
4.2.1. Accuracy Analysis
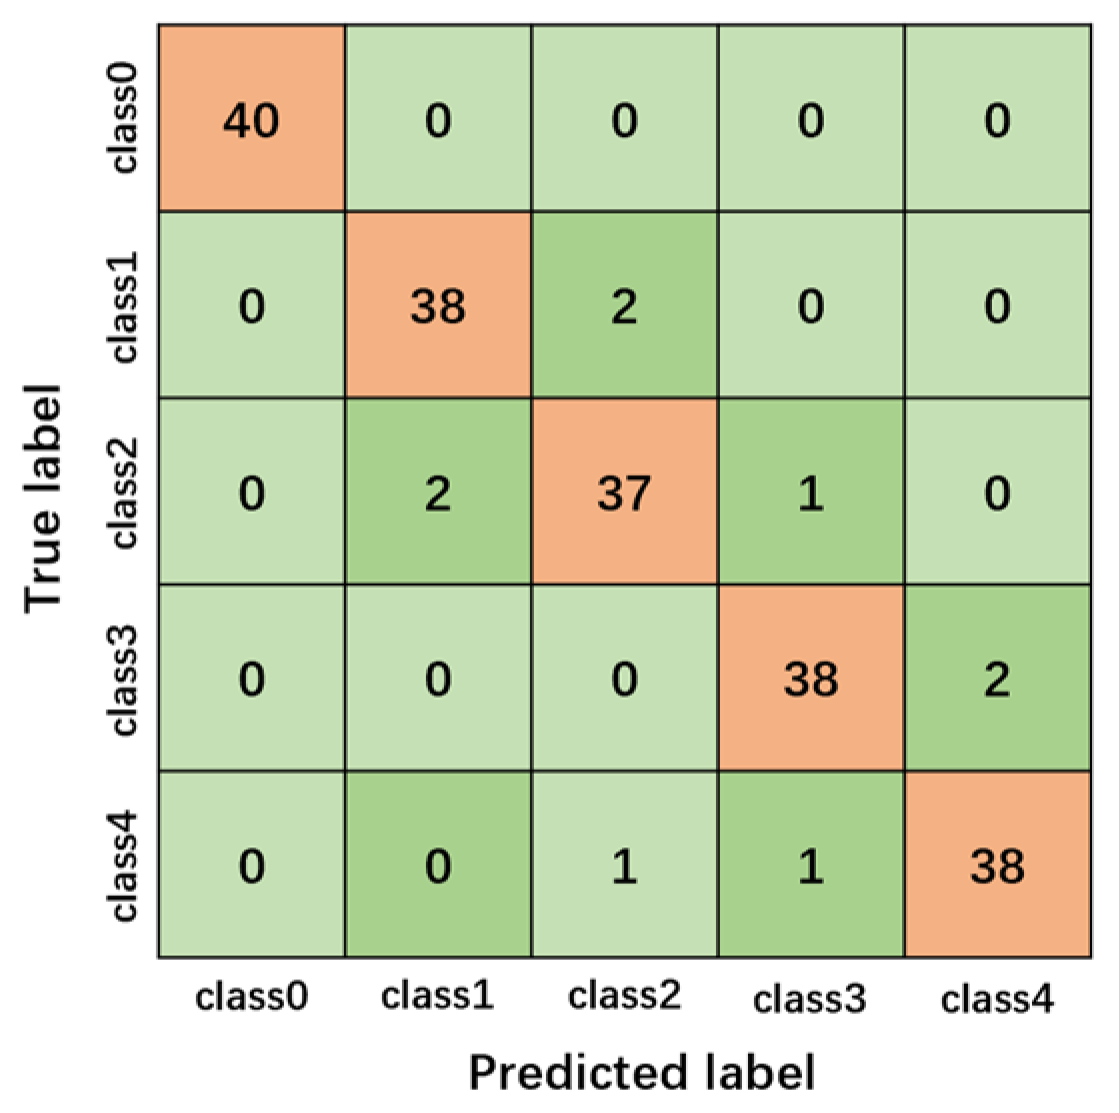
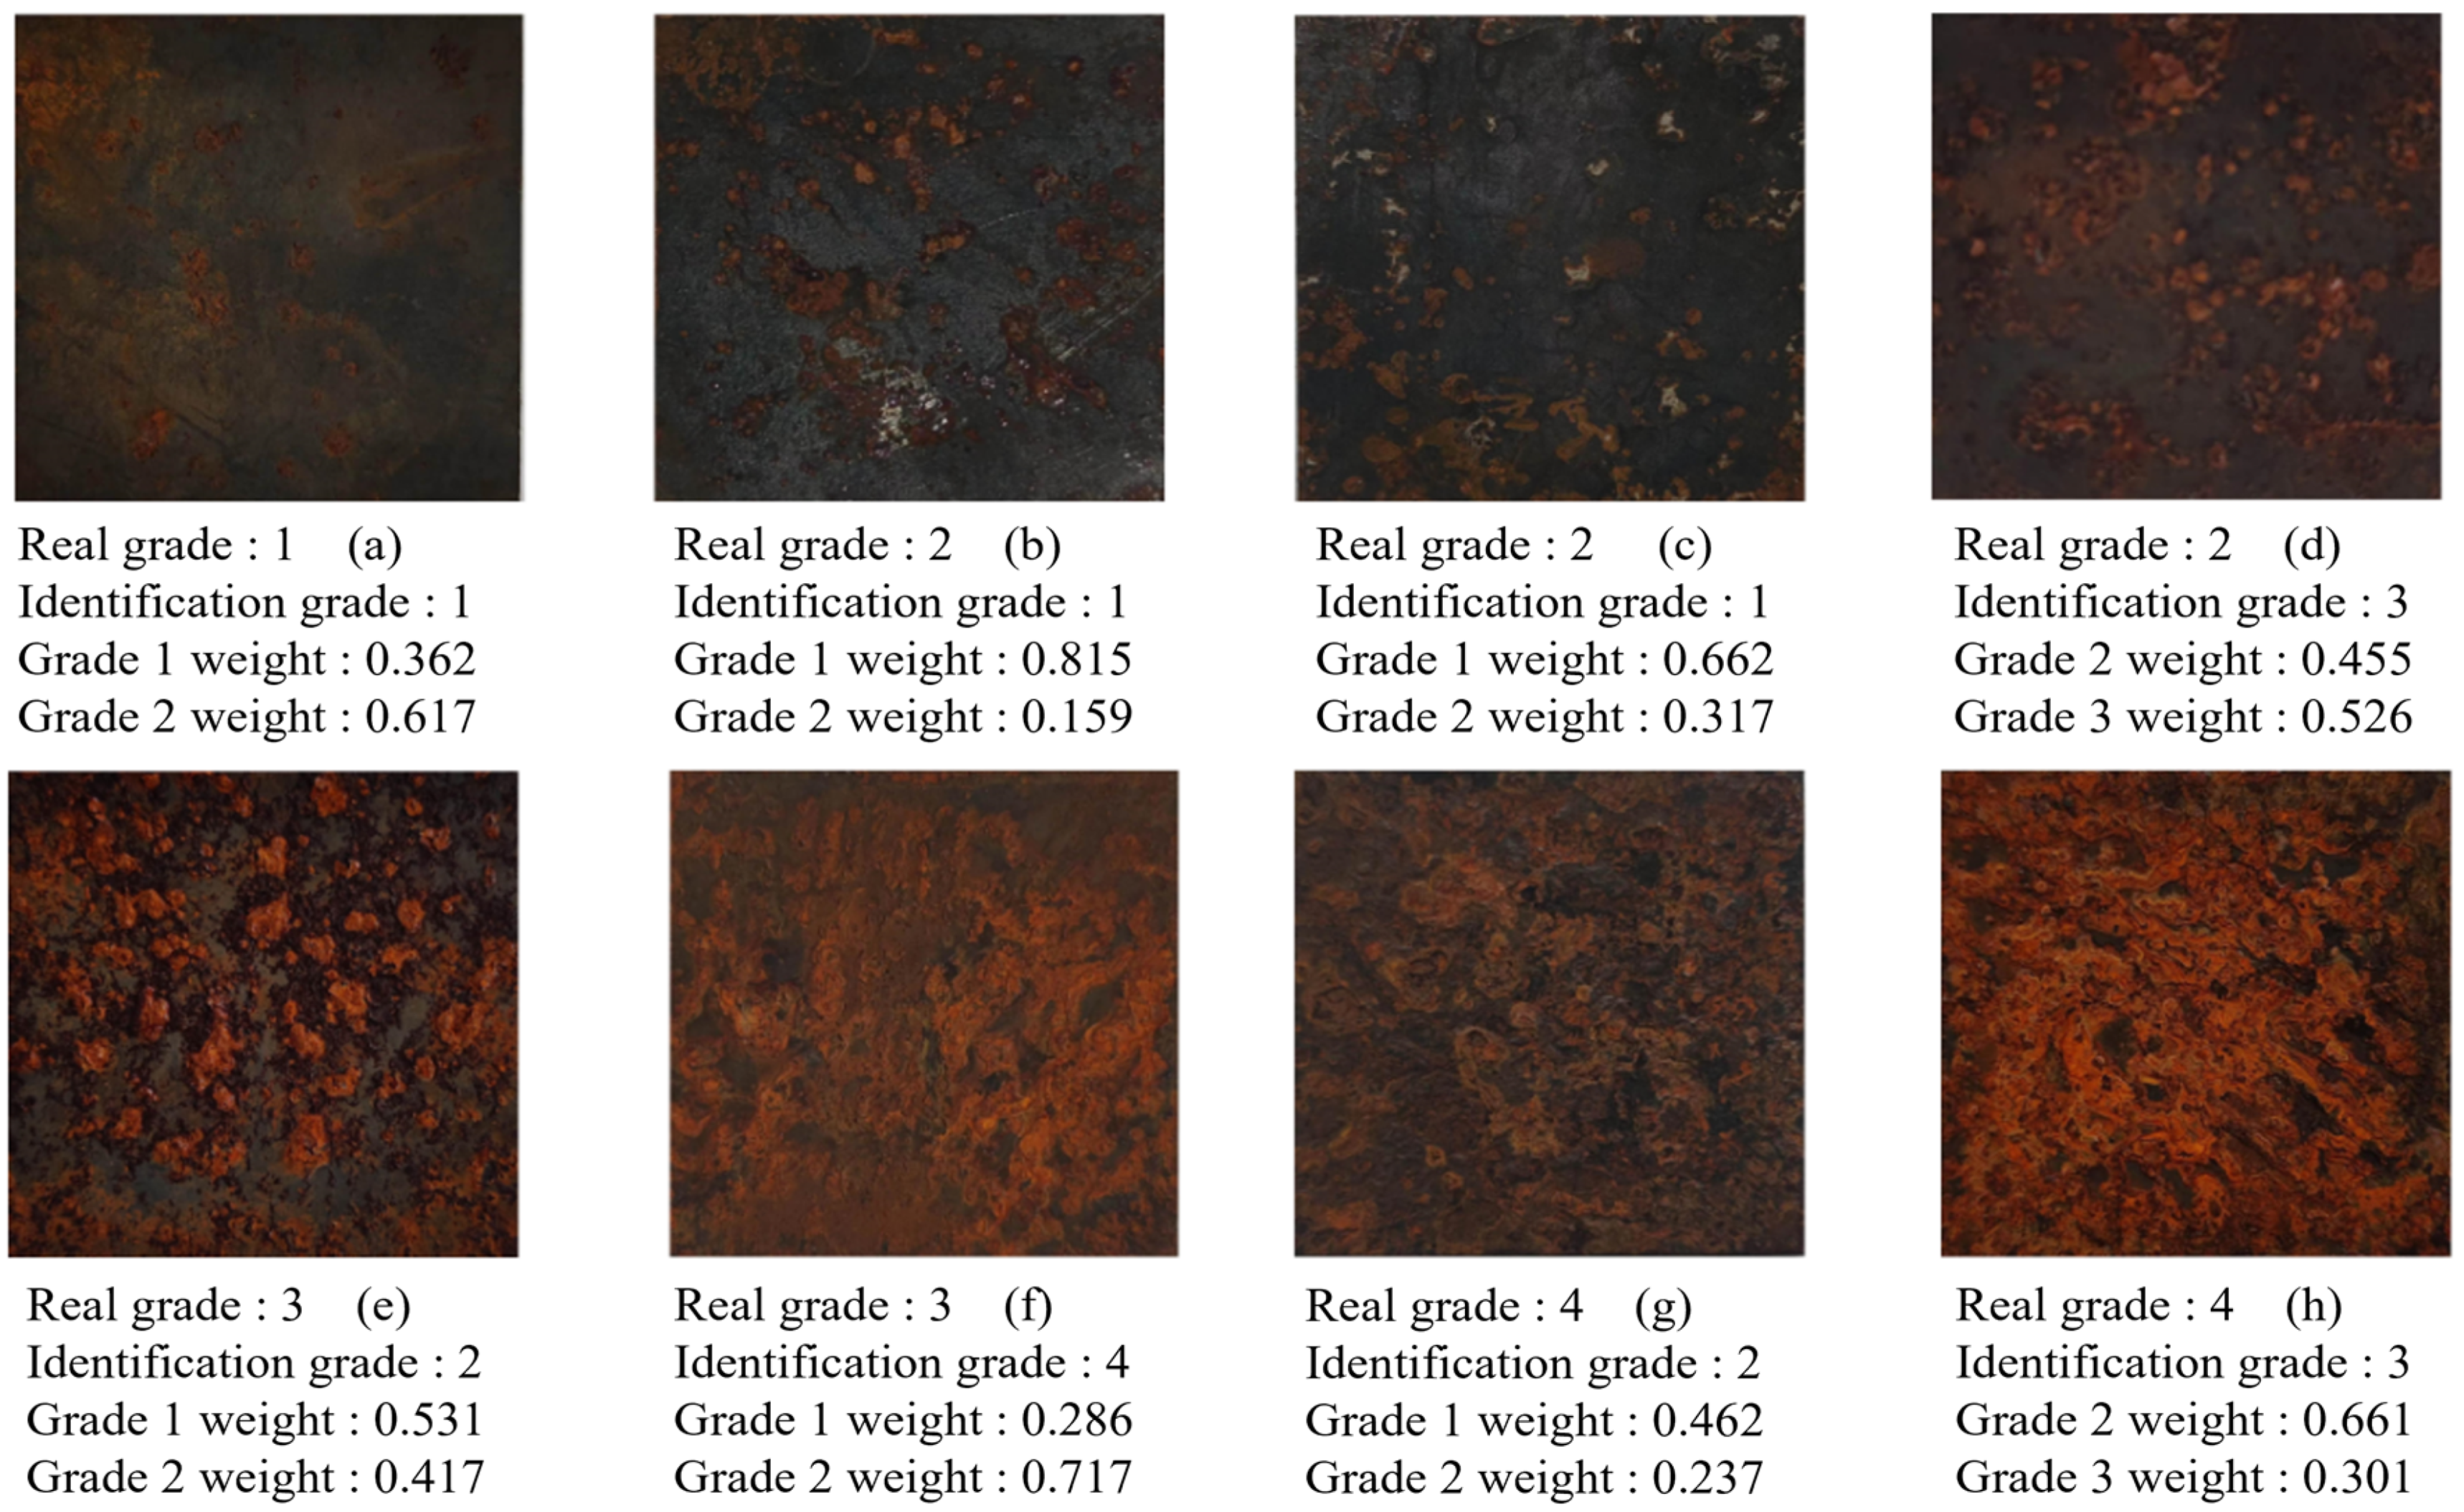
4.2.2. Error Analysis
5. Conclusions
Author Contributions
Funding
Data Availability Statement
Conflicts of Interest
References
- Khayatazad, M.; Honhon, M.; De Waele, W. Detection of corrosion on steel structures using an artificial neural network. Struct. Infrastruct. Eng. 2023, 19, 1860–1871. [Google Scholar] [CrossRef]
- Khayatazad, M.; De Pue, L.; De Waele, W. Detection of corrosion on steel structures using automated image processing. Dev. Built Environ. 2020, 3, 12. [Google Scholar] [CrossRef]
- Han, Q.H.; Liu, X.; Xu, J. Detection and Location of Steel Structure Surface Cracks Based on Unmanned Aerial Vehicle Images. J. Build. Eng. 2022, 50, 14. [Google Scholar] [CrossRef]
- Imran, M.M.H.; Jamaludin, S.; Ayob, A.F.M.; Ali, A.; Ahmad, S.; Akhbar, M.F.A.; Suhrab, M.I.R.; Zainal, N.; Norzeli, S.M.; Mohamed, S.B. Application of Artificial Intelligence in Marine Corrosion Prediction and Detection. J. Mar. Sci. Eng. 2023, 11, 25. [Google Scholar] [CrossRef]
- Han, Q.H.; Zhao, N.; Xu, J. Recognition and location of steel structure surface corrosion based on unmanned aerial vehicle images. J. Civ. Struct. Health Monit. 2021, 11, 1375–1392. [Google Scholar] [CrossRef]
- Han, S.X.; Li, B.D.; Li, W.; Zhang, Y.; Liu, P.Y. Intelligent analysis of corrosion characteristics of steel pipe piles of offshore construction wharfs based on computer vision. Heliyon 2024, 10, 14. [Google Scholar] [CrossRef]
- Xu, Z.C.; Cai, B.Y.; Yan, L.C.; Pang, X.L.; Gao, K.W. Statistical analysis of metastable pitting behavior of 2024 aluminum alloy based on deep learning. Corros. Sci. 2024, 233, 14. [Google Scholar] [CrossRef]
- Yang, L.Y.; Huang, X.B.; Ren, Y.C.; Han, Q.; Huang, Y.C. Steel plate surface defect classification technology based on image enhancement and combination feature extraction. Eng. Comput. 2023, 40, 1305–1329. [Google Scholar] [CrossRef]
- Yu, Q.F.; Han, Y.D.; Lin, W.G.; Gao, X.J. Detection and Analysis of Corrosion on Coated Metal Surfaces Using Enhanced YOLO v5 Algorithm for Anti-Corrosion Performance Evaluation. J. Mar. Sci. Eng. 2024, 12, 19. [Google Scholar] [CrossRef]
- Liu, T.T.; Kang, K.; Zhang, F.; Ni, J.L.; Wang, T.Y. A Corrosion Detection Algorithm Via the Random Forest Model. In Proceedings of the 17th International Conference on Optical Communications and Networks (ICOCN), Zhuhai, China, 16–19 November 2018. [Google Scholar]
- Atha, D.J.; Jahanshahi, M.R. Evaluation of deep learning approaches based on convolutional neural networks for corrosion detection. Struct. Health Monit. 2018, 17, 1110–1128. [Google Scholar] [CrossRef]
- Chen, S.K.; Huang, I.F.; Chen, P.H. Applying fully convolutional neural networks for corrosion semantic segmentation for steel bridges: The use of U-Net. In Proceedings of the 10th International Conference on Bridge Maintenance, Safety and Management (IABMAS), Sapporo, Japan, 11–18 April 2021; pp. 341–346. [Google Scholar]
- Xu, J.; Gui, C.Q.; Han, Q.H. Recognition of rust grade and rust ratio of steel structures based on ensembled convolutional neural network. Comput.-Aided Civil Infrastruct. Eng. 2020, 35, 1160–1174. [Google Scholar] [CrossRef]
- Barakbayeva, T.; Demirci, F.M. Fully automatic CNN design with inception and ResNet blocks. Neural Comput. Appl. 2023, 35, 1569–1580. [Google Scholar] [CrossRef]
- Li, X.; Hao, T.X.; Li, F.; Zhao, L.Z.; Wang, Z.H. Faster R-CNN-LSTM Construction Site Unsafe Behavior Recognition Model. Appl. Sci. 2023, 13, 16. [Google Scholar] [CrossRef]
- Mannem, K.R.; Mengiste, E.; Hasan, S.; de Soto, B.G.; Sacks, R. Smart audio signal classification for tracking of construction tasks. Autom. Constr. 2024, 165, 13. [Google Scholar] [CrossRef]
- Meng, Q.H.; Zhu, S.Y. Construction Activity Classification Based on Vibration Monitoring Data: A Supervised Deep-Learning Approach with Time Series RandAugment. J. Constr. Eng. Manag. 2022, 148, 11. [Google Scholar] [CrossRef]
- Zou, G.F.; Fu, G.X.; Gao, M.L.; Shen, J.; Yin, L.J.; Ben, X.Y. A novel construction method of convolutional neural network model based on data-driven. Multimed. Tools Appl. 2019, 78, 6969–6987. [Google Scholar] [CrossRef]
- Jiang, X.; Qi, H.; Qiang, X.H.; Zhao, B.S.; Dong, H. A Convolutional Neural Network-Based Corrosion Damage Determination Method for Localized Random Pitting Steel Columns. Appl. Sci. 2023, 13, 21. [Google Scholar] [CrossRef]
- Li, Z.J.; Shao, P.; Zhao, M.H.; Yan, K.; Liu, G.X.; Wan, L.; Xu, X.L.; Li, K.L. Optimized deep learning for steel bridge bolt corrosion detection and classification. J. Constr. Steel Res. 2024, 215, 13. [Google Scholar] [CrossRef]
- Cui, Y.; Lei, D.F. Optimizing Internet of Things-Based Intelligent Transportation System’s Information Acquisition Using Deep Learning. IEEE Access 2023, 11, 11804–11810. [Google Scholar] [CrossRef]
- Panmatharit, A.; Jiraraksopakun, Y.; Siripanichgorn, A.; Siricharoen, P. Bolt Looseness Identification using Faster R-CNN and Grid Mask Augmentation. In Proceedings of the 14th Annual Summit and Conference of the Asia-Pacific-Signal-and-Information-Processing-Association (APSIPA ASC), Chiang Mai, Thailand, 7–10 November 2022; pp. 1632–1637. [Google Scholar]
- Zhao, D.B.; Li, H. Forward Vehicle Detection Based on Deep Convolution Neural Network. In Proceedings of the 3rd International Conference on Advances in Materials, Machinery, Electronics (AMME), Wuhan, China, 19–20 January 2019. [Google Scholar]
- Wang, H.; Cao, G.M.; Liu, J.J.; Wu, S.W.; Li, Z.F.; Liu, Z.Y. Development and application of automatic identification methods based on deep learning for oxide scale structures of iron and steel materials. J. Mater. Sci. 2023, 58, 17675–17690. [Google Scholar] [CrossRef]
- Zhang, M.Y.; Wang, W.L. Deep learning-based extraction and quantification of features in XCT images of steel corrosion in concrete. Case Stud. Constr. Mater. 2024, 20, 18. [Google Scholar] [CrossRef]
- Zhou, G.; Sun, H.Y. Defect Detection Method for Steel Based on Semantic Segmentation. In Proceedings of the IEEE 5th Information Technology and Mechatronics Engineering Conference (ITOEC), Chongqing, China, 12–14 June 2020; pp. 975–979. [Google Scholar]
- Jafari, F.; Dorafshan, S.; Kaabouch, N. Segmentation of fatigue cracks in ancillary steel structures using deep learning convolutional neural networks. In Proceedings of the IEEE/ASME International Conference on Advanced Intelligent Mechatronics (AIM), Seattle, WA, USA, 28–30 June 2023; pp. 872–877. [Google Scholar]
- Santos, R.; Ribeiro, D.; Lopes, P.; Cabral, R.; Calcada, R. Detection of exposed steel rebars based on deep-learning techniques and unmanned aerial vehicles. Autom. Constr. 2022, 139, 17. [Google Scholar] [CrossRef]
- Zhu, Z.L.; Liang, Y.L. Prediction of Residual Stress of Carburized Steel Based on Machine Learning. Appl. Sci. 2020, 10, 16. [Google Scholar] [CrossRef]
- Bao, N.X.; Zhang, T.; Huang, R.Z.; Biswal, S.; Su, J.Y.; Wang, Y. A Deep Transfer Learning Network for Structural Condition Identification with Limited Real-World Training Data. Struct. Control Health Monit. 2023, 2023, 8899806. [Google Scholar] [CrossRef]
- Ali, R.; Cha, Y.J. Subsurface damage detection of a steel bridge using deep learning and uncooled micro-bolometer. Constr. Build. Mater. 2019, 226, 376–387. [Google Scholar] [CrossRef]
- Chi, Y.L.; Cai, C.Z.; Ren, J.H.; Xue, Y.F.; Zhang, N. Damage location diagnosis of frame structure based on wavelet denoising and convolution neural network implanted with Inception module and LSTM. Struct. Health Monit. 2024, 23, 57–76. [Google Scholar] [CrossRef]
- Liu, Z.; Wang, X.S.; Chen, X. Inception Dual Network for steel strip defect detection. In Proceedings of the 16th IEEE International Conference on Networking, Sensing and Control (ICNSC), Banff, AB, Canada, 9–11 May 2019; pp. 409–414. [Google Scholar]
- Ren, J.H.; Cai, C.Z.; Chi, Y.L.; Xue, Y.F. Integrated Damage Location Diagnosis of Frame Structure Based on Convolutional Neural Network with Inception Module. Sensors 2023, 23, 418. [Google Scholar] [CrossRef]
- Bouguettaya, A.; Zarzour, H. CNN-based hot-rolled steel strip surface defects classification: A comparative study between different pre-trained CNN models. Int. J. Adv. Manuf. Technol. 2024, 132, 399–419. [Google Scholar] [CrossRef]
- Ivo, R.F.; Rodrigues, D.D.; Bezerra, G.M.; Freitas, F.N.C.; de Abreu, H.F.G.; Rebouc, P.P. Non-grain oriented electrical steel photomicrograph classification using transfer learning. J. Mater. Res. Technol-JMRT 2020, 9, 8580–8591. [Google Scholar] [CrossRef]
- Sundarrajan, K.; Rajendran, B.K. Explainable efficient and optimized feature fusion network for surface defect detection. Int. J. Adv. Manuf. Technol. 2023, 126, 1–18. [Google Scholar] [CrossRef]
- Ahmed, S.; Cho, S.H. Hand Gesture Recognition Using an IR-UWB Radar with an Inception Module-Based Classifier. Sensors 2020, 20, 18. [Google Scholar] [CrossRef] [PubMed]
- Baixo, S.; Ribeiro, T.; Lopes, G.; Ribeiro, A.F. 3D Face Recognition using Inception Networks for Service Robots. In Proceedings of the IEEE International Conference on Autonomous Robot Systems and Competitions (ICARSC), Santa Maria da Feira, Portugal, 29–30 April 2022; pp. 47–52. [Google Scholar]
- Chavan, S.; Nair, L.; Nimbalkar, N.; Solkar, S. Karyotyping of human chromosomes in metaphase images using faster R-CNN and inception models. Int. J. Imaging Syst. Technol. 2024, 34, 24. [Google Scholar] [CrossRef]
- Huang, Q.Q.; Cai, Q.; Chen, Y.; Huang, J.B. Single image dehazing network based on inception module. In Proceedings of the 3rd International Conference on Electronics and Communication; Network and Computer Technology (ECNCT), Xiamen, China, 3–5 December 2021. [Google Scholar]
- Liu, F.L.; Qin, D.B.; Yang, S.; Du, R.Y. WS-ICNN algorithm for robust adaptive beamforming. Wirel. Netw. 2024, 30, 5201–5210. [Google Scholar] [CrossRef]
- Wang, J.K.; He, X.H.; Faming, S.; Lu, G.L.; Cong, H.; Jiang, Q.Y. A Real-Time Bridge Crack Detection Method Based on an Improved Inception-Resnet-v2 Structure. IEEE Access 2021, 9, 93209–93223. [Google Scholar] [CrossRef]
- Yong, L.; Bo, Z. An Intrusion Detection Model Based on Multi-scale CNN. In Proceedings of the IEEE 3rd Information Technology, Networking, Electronic and Automation Control Conference (ITNEC), Chengdu, China, 15–17 March 2019; pp. 214–218. [Google Scholar]
- Zhai, Z.L.; Feng, S.; Yao, L.Y.; Li, P.H. Retinal vessel image segmentation algorithm based on encoder-decoder structure. Multimed. Tools Appl. 2022, 81, 33361–33373. [Google Scholar] [CrossRef]
- Zhang, C.Z.; Zhang, Y.Z.; Huang, Z.Y.; Lv, C.; Hao, D.; Liang, C.; Deng, C.H.; Chen, J.R. Real-Time Optimization of Energy Management Strategy for Fuel Cell Vehicles Using Inflated 3D Inception Long Short-Term Memory Network-Based Speed Prediction. IEEE Trans. Veh. Technol. 2021, 70, 1190–1199. [Google Scholar] [CrossRef]
- Zheng, G.Y.; Han, G.H.; Soomro, N.Q. An Inception Module CNN Classifiers Fusion Method on Pulmonary Nodule Diagnosis by Signs. Tsinghua Sci. Technol. 2020, 25, 368–383. [Google Scholar] [CrossRef]
- Chandankhede, C.; Sachdeo, R. Offline MODI script character recognition using deep learning techniques. Multimed. Tools Appl. 2023, 82, 21045–21056. [Google Scholar] [CrossRef]
- Jeyakumar, J.P.; Jude, A.; Henry, A.G.P.; Hemanth, J. Comparative Analysis of Melanoma Classification Using Deep Learning Techniques on Dermoscopy Images. Electronics 2022, 11, 11. [Google Scholar] [CrossRef]
- Liu, K.; Yu, S.T.; Liu, S.D. An Improved InceptionV3 Network for Obscured Ship Classification in Remote Sensing Images. IEEE J. Sel. Top. Appl. Earth Observ. Remote Sens. 2020, 13, 4738–4747. [Google Scholar] [CrossRef]
- Mputu, H.S.; Abdel-Mawgood, A.; Shimada, A.; Sayed, M.S. Tomato Quality Classification Based on Transfer Learning Feature Extraction and Machine Learning Algorithm Classifiers. IEEE Access 2024, 12, 8283–8295. [Google Scholar] [CrossRef]
- Pravin, S.C.; Rohith, G.; Kiruthika, V.; Manikandan, E.; Methelesh, S.; Manoj, A. Underwater Animal Identification and Classification Using a Hybrid Classical-Quantum Algorithm. IEEE Access 2023, 11, 141902–141914. [Google Scholar] [CrossRef]
- Singh, N.; Tripathi, P. An efficient model for detecting real-time facemask based on different Classification Algorithms. Multimed. Tools Appl. 2023, 83, 55175–55198. [Google Scholar] [CrossRef]
- Sriraam, N.; Srinivasulu, A. Performance evaluation of convolution neural network models for detection of abnormal and ventricular ectopic beat cardiac episodes. Multimed. Tools Appl. 2024, 83, 65149–65188. [Google Scholar] [CrossRef]
- Thentu, S.; Cordeiro, R.; Park, Y.; Karimian, N. ECG biometric using 2D Deep Convolutional Neural Network. In Proceedings of the IEEE International Conference on Consumer Electronics (ICCE), Las Vegas, NV, USA, 10–12 January 2021. [Google Scholar]
- Abd Almisreb, A.; Jamil, N.; Din, N.M. Utilizing AlexNet Deep Transfer Learning for Ear Recognition. In Proceedings of the 4th International Conference on Information Retrieval and Knowledge Management (CAMP), Sabah, Malaysia, 26–28 March 2018; pp. 8–12. [Google Scholar]
- Revathi, M.; Raghuraman, G. Kidney Stone Detection from CT Images Using ALEXNET and Hybrid ALEXNET-RF Models. J. Circuits Syst. Comput. 2024, 33, 16. [Google Scholar] [CrossRef]
- Toliupa, S.; Tereikovskyi, I.; Tereikovskyi, O.; Tereikovska, L.; Nakonechnyi, V.; Akov, Y.K. Keyboard Dynamic Analysis by Alexnet Type Neural Network. In Proceedings of the 15th International Conference on Advanced Trends in Radioelectronics, Telecommunications and Computer Engineering (TCSET), Lviv, Ukraine, 25–29 February 2020; pp. 416–420. [Google Scholar]
- Xiao, L.S.; Yan, Q.; Deng, S.Y. Scene Classification with Improved AlexNet Model. In Proceedings of the 12th International Conference on Intelligent Systems and Knowledge Engineering (IEEE ISKE), Nanjing, China, 24–26 November 2017. [Google Scholar]
- Yang, M.Y.; Xie, K.; Li, T.; Ye, Y.H.; Yang, Z.P. Color Constancy Using AlexNet Convolutional Neural Network. In Proceedings of the 6th International Workshop on Pattern Recognition (IWPR), Beijing, China, 25–27 June 2021. [Google Scholar]
- Zhang, Y.M.; Chang, F.L.; Li, N.J.; Liu, H.B.; Gai, Z.D. Modified AlexNet for Dense Crowd Counting. In Proceedings of the 2nd International Conference on Computer Engineering, Information Science and Internet Technology (CII), Sanya, China, 11–12 November 2017; pp. 351–357. [Google Scholar]
- Ge, Y.F.; Liu, G.; Tang, H.M.; Zhao, B.B.; Xiong, C.R. Comparative analysis of five convolutional neural networks for landslide susceptibility assessment. Bull. Eng. Geol. Environ. 2023, 82, 26. [Google Scholar] [CrossRef]
- Lu, G.Y.; Cao, B.; Zhu, X.D.; Lin, Z.S.; Bai, D.X.; Tao, C.Y.; Li, Y.N. Identification of rock mass discontinuity from 3D point clouds using improved fuzzy C-means and convolutional neural network. Bull. Eng. Geol. Environ. 2024, 83, 18. [Google Scholar] [CrossRef]
- Wang, Z.J.; Zhao, W.L.; Du, W.H.; Li, N.P.; Wang, J.Y. Data-driven fault diagnosis method based on the conversion of erosion operation signals into images and convolutional neural network. Process Saf. Environ. Protect. 2021, 149, 591–601. [Google Scholar] [CrossRef]
- Xie, G.B.; Shi, B.H.; Su, Y.X.; Wu, X.R.; Zhou, G.; Shi, J.F. Research on the Vanishing Point Detection Method Based on an Improved Lightweight AlexNet Network for Narrow Waterway Scenarios. J. Mar. Sci. Eng. 2024, 12, 17. [Google Scholar] [CrossRef]
- Yuan, X.; Ren, J.W.; Cheng, G.F.; Xu, J. Toward Alleviating the Data Sparsity Problem of Deep Learning Based Underwater Target Classification. In Proceedings of the OCEANS Conference, San Diego, CA, USA, 20–23 September 2021. [Google Scholar]
- Yang, S.; Xue, L.Z.; Hong, X.; Zeng, X.Y. A Lightweight Network Model Based on an Attention Mechanism for Ship-Radiated Noise Classification. J. Mar. Sci. Eng. 2023, 11, 17. [Google Scholar] [CrossRef]
- Zecchetto, S.; Zanchetta, A. Validation of high resolution SAR winds fields obtained by Deep Learning. In Proceedings of the IEEE International Workshop on Metrology for the Sea Learning to Measure Sea Health Parameters (MetroSea), Milazzo, Italy, 3–5 October 2022; pp. 501–505. [Google Scholar]
- Zhang, P.Y.; Jiang, W.L.; Zheng, Y.F.; Zhang, S.Q.; Zhang, S.; Liu, S.Y. Hydraulic-Pump Fault-Diagnosis Method Based on Mean Spectrogram Bar Graph of Voiceprint and ResNet-50 Model Transfer. J. Mar. Sci. Eng. 2023, 11, 31. [Google Scholar] [CrossRef]
- Dai, Z.Z.; Liang, H.; Duan, T. Small-Sample Sonar Image Classification Based on Deep Learning. J. Mar. Sci. Eng. 2022, 10, 22. [Google Scholar] [CrossRef]
- Luo, X.W.; Zhang, M.H.; Liu, T.; Huang, M.; Xu, X.G. An Underwater Acoustic Target Recognition Method Based on Spectrograms with Different Resolutions. J. Mar. Sci. Eng. 2021, 9, 20. [Google Scholar] [CrossRef]
- Xie, J.L.; Shi, W.F.; Xue, T.; Liu, Y.H. High-Resistance Connection Fault Diagnosis in Ship Electric Propulsion System Using Res-CBDNN. J. Mar. Sci. Eng. 2024, 12, 17. [Google Scholar] [CrossRef]
- Chen, Y.N.; Tian, Z.G.; Wei, H.T.; Dong, S.H. Reliability analysis of corroded pipes using MFL signals and Residual Neural Networks. Process Saf. Environ. Protect. 2024, 184, 1131–1142. [Google Scholar] [CrossRef]
- Lin, K.S.; Zhao, Y.C.; Wang, L.A.; Shi, W.J.; Cui, F.F.; Zhou, T. MSWNet: A visual deep machine learning method adopting transfer learning based upon ResNet 50 for municipal solid waste sorting. Front. Env. Sci. Eng. 2023, 17, 12. [Google Scholar] [CrossRef]
- Peng, L.G.; Zhang, J.C.; Lu, S.Q.; Li, Y.Q.; Du, G.F. One-dimensional residual convolutional neural network and percussion-based method for pipeline leakage and water deposit detection. Process Saf. Environ. Protect. 2023, 177, 1142–1153. [Google Scholar] [CrossRef]
- Chen, L.S.; Peng, H.Y.; Yang, D.D.; Wang, T.Z. An attachment recognition method based on semi-supervised video segmentation for tidal stream turbines. Ocean Eng. 2024, 293, 17. [Google Scholar] [CrossRef]
- Dong, X.R.; Li, J.S.; Li, B.; Jin, Y.Q.; Miao, S.F. Marine Oil Spill Detection from Low-Quality SAR Remote Sensing Images. J. Mar. Sci. Eng. 2023, 11, 20. [Google Scholar] [CrossRef]
- Kim, K.; Kim, J. Semantic Segmentation of Marine Radar Images using Convolutional Neural Networks. In Proceedings of the OCEANS—Marseille Conference, Marseille, France, 17–20 June 2019. [Google Scholar]
- O’Byrne, M.; Pakrashi, V.; Schoefs, F.; Ghosh, B. Semantic Segmentation of Underwater Imagery Using Deep Networks Trained on Synthetic Imagery. J. Mar. Sci. Eng. 2018, 6, 15. [Google Scholar] [CrossRef]
- Yu, F.; He, B.; Li, K.G.; Yan, T.H.; Shen, Y.; Wang, Q.; Wu, M.H. Side-scan sonar images segmentation for AUV with recurrent residual convolutional neural network module and self-guidance module. Appl. Ocean Res. 2021, 113, 14. [Google Scholar] [CrossRef]
- Nunes, A.; Gaspar, A.R.; Matos, A. Comparative Study of Semantic Segmentation Methods in Harbour Infrastructures. In Proceedings of the OCEANS Conference, Limerick, Ireland, 5–8 June 2023. [Google Scholar]
- Nunes, A.; Matos, A. Improving Semantic Segmentation Performance in Underwater Images. J. Mar. Sci. Eng. 2023, 11, 26. [Google Scholar] [CrossRef]
- Zhou, H.X.; Tao, G.X.; Nie, Y.X.; Yan, X.Y.; Sun, J. Outdoor thermal environment on road and its influencing factors in hot, humid weather: A case study in Xuzhou City, China. Build. Environ. 2022, 207, 15. [Google Scholar] [CrossRef]
- ASTM B117-19; Standard Practice for Operating Salt Spray (Fog) Apparatus. ASTM International: West Conshohocken, PA, USA, 2019.
- ASTM G1-03; Standard Practice for Preparing, Cleaning, and Evaluating Corrosion Test Specimens. ASTM International: West Conshohocken, PA, USA, 2017.


| Experiment Number | Specimen Material | Quantity (Pieces) |
|---|---|---|
| 1 | Q235 | 40 |
| 2 | Q235 | 40 |
| 3 | Q235 | 40 |
| 4 | Q235 | 40 |
| 5 | Q235 | 40 |
| Equipment Name | Model | Purpose |
|---|---|---|
| Electronic Salt Fog Chamber (JITAI Corporation, Beijing, China) | JiTai 90 | Indoor accelerated salt fog laboratory |
| Silent Air Compressor (AOTUSI Corporation, Taizhou, China) | ZhiPu 1490W-30L | Supplying air pressure to the salt fog chamber |
| Constant Temperature Drying Oven (SUBO Corporation, Shaoxing, China) | SuBo 101-00B | Drying specimens |
| Ultrasonic Cleaning Machine (SHANGPU Corporation, Shanghai, China) | ShangYi SN-QX-08E | Cleaning corrosion sites |
| Precision Electronic Scale (YOUKEWEITE Corporation, Kunshan, China) | LeQi 0.001 g | Weighing specimens |
| Title 1 | Title 2 | Title 3 | Title 4 |
|---|---|---|---|
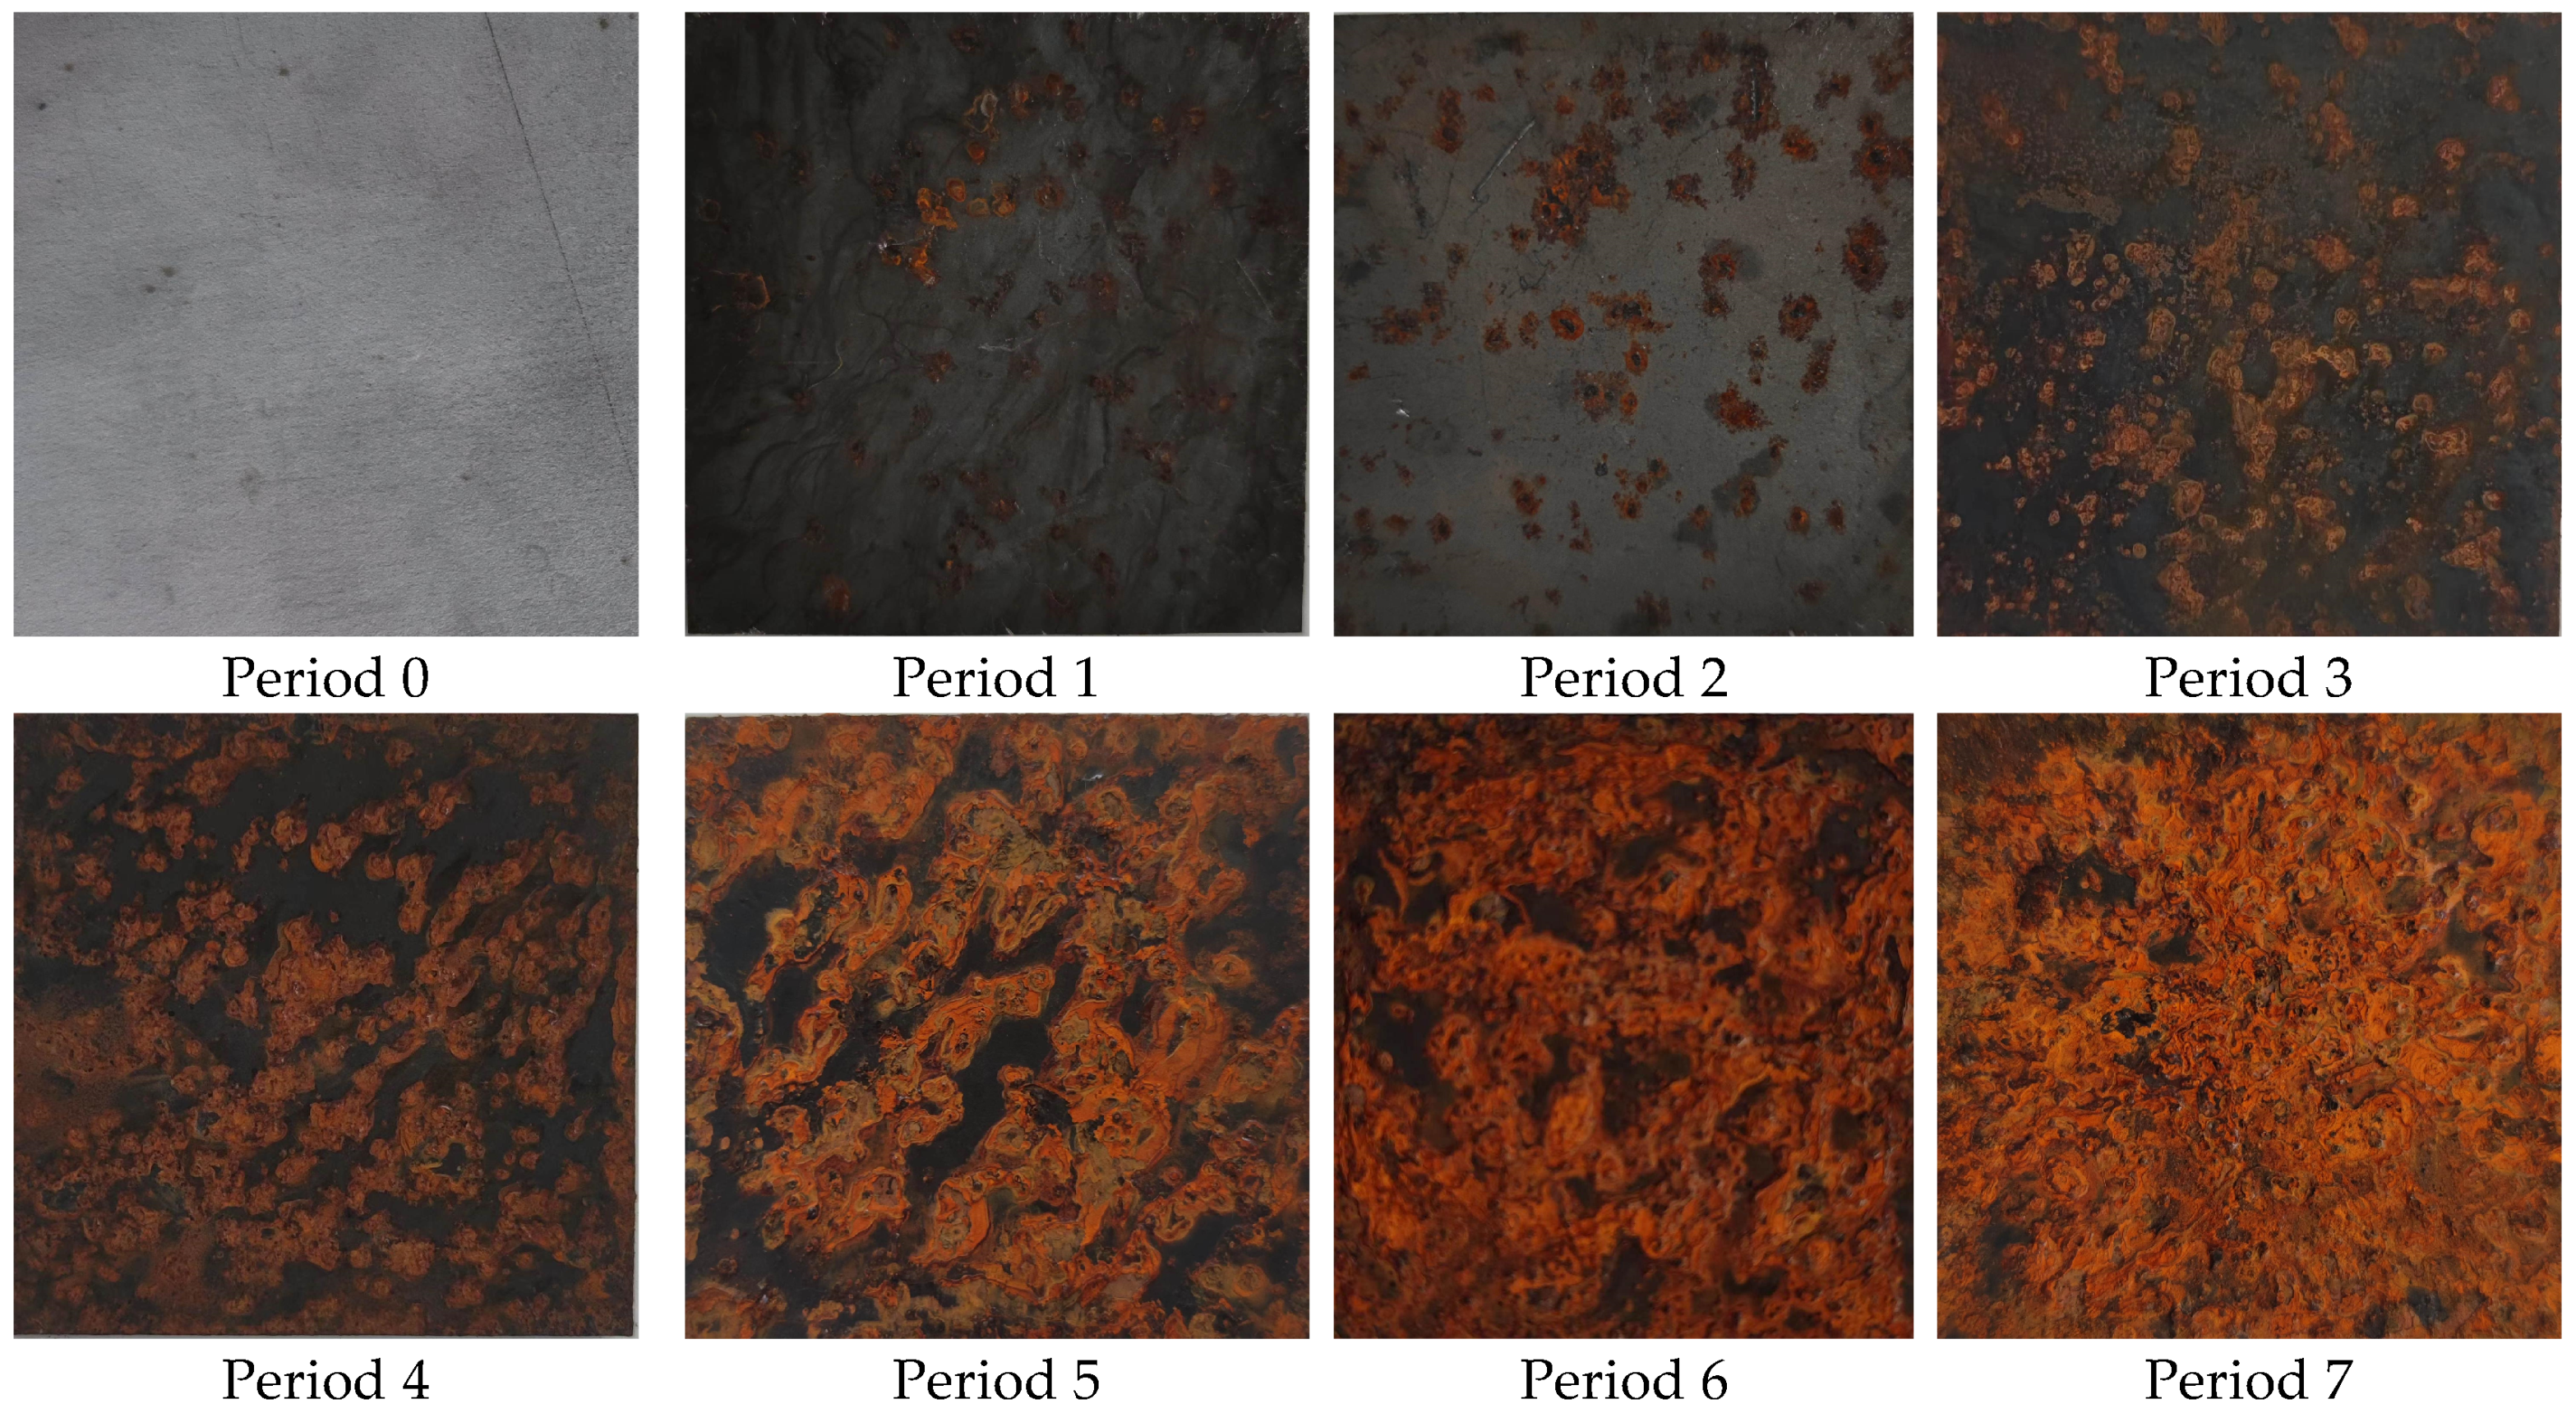
| 1 | 4 h | 4 h | Pitting corrosion observed |
| 2 | 8 h | 4 h | Pitting corrosion intensifies and spreads further |
| 3 | 12 h | 4 h | Spot corrosion appears |
| 4 | 24 h | 12 h | Extensive corrosion observed |
| 5 | 48 h | 24 h | Corrosion almost fully covered |
| 6 | 72 h | 24 h | Corrosion fully covered with deepened color |
| 7 | 96 h | 24 h | Deepened corrosion color and beginning to flake off |
| Corrosion Level | Corrosion Cycle | Mass Loss | Surface Corrosion Condition |
|---|---|---|---|
| 0 | Initial | 0% | Smooth surface, no corrosion |
| 1 | 1 | 0–0.5% | Pitting, corrosion at scratches |
| 2 | 2, 3 | 0.5–2% | Patches of corrosion, strip corrosion |
| 3 | 3, 4, 5 | 2–5% | Extensive corrosion, full coverage |
| 4 | 5, 6, 7 | >5% | Complete coverage, uneven surface, deepened color |
| Dataset | Level 0 | Level 1 | Level 2 | Level 3 | Level 4 | Total |
|---|---|---|---|---|---|---|
| Training Set | 320 | 320 | 320 | 320 | 320 | 1600 |
| Validation Set | 40 | 40 | 40 | 40 | 40 | 200 |
| Testing Set | 40 | 40 | 40 | 40 | 40 | 200 |
| Type | Receptive Field/Stride | Input Size |
|---|---|---|
| conv | 3 × 3/2 | 299 × 299 × 3 |
| conv | 3 × 3/1 | 149 × 149 × 32 |
| conv padded | 3 × 3/1 | 147 × 147 × 32 |
| pool | 3 × 3/2 | 147 × 147 × 64 |
| conv | 3 × 3/1 | 73 × 73 × 64 |
| conv | 3 × 3/2 | 71 × 71 × 80 |
| conv | 3 × 3/1 | 53 × 53 × 192 |
| 3 × Inception | Figure 8 | 35 × 35 × 288 |
| 5 × Inception | Figure 10 | 17 × 17 × 768 |
| 2 × Inception | Figure 11 | 8 × 8 × 1280 |
| pool | 8 × 8 | 8 × 8 × 2048 |
| linear | logits | 1 × 1 × 2048 |
| softmax | classifier | 1 × 1 × 1000 |
| Component | Title 3 | |
|---|---|---|
| Hardware | CPU | Intel(R) Core(TM) i7-10700 CPU @290 GHz (Intel Corporation, Santa Clara, CA, USA) |
| GPU | NVIDIA GeForce RTX 3060 (NVIDIA Corporation, Santa Clara, CA, USA) | |
| RAM | DDR4 16 GB (Samsung Electronics, Suwon, Republic of Korea) | |
| Software | Cuda | Cuda 10.0 |
| IDE | PyCharm Community Edition 2017.2.2 | |
| Programming Language | Python 3.8 | |
| Framework | PyTorch 1.2.0 | |
| Predicted Positive | Predicted Positive | |
|---|---|---|
| Actual Positive | True Positive (TP) | False Negative (FN) |
| Actual Negative | False Positive (FP) | True Negative (TN) |
Disclaimer/Publisher’s Note: The statements, opinions and data contained in all publications are solely those of the individual author(s) and contributor(s) and not of MDPI and/or the editor(s). MDPI and/or the editor(s) disclaim responsibility for any injury to people or property resulting from any ideas, methods, instructions or products referred to in the content. |
© 2025 by the authors. Licensee MDPI, Basel, Switzerland. This article is an open access article distributed under the terms and conditions of the Creative Commons Attribution (CC BY) license (https://creativecommons.org/licenses/by/4.0/).
Share and Cite
Huang, X.; Duan, Z.; Hao, S.; Hou, J.; Chen, W.; Cai, L. A Deep Learning Framework for Corrosion Assessment of Steel Structures Using Inception v3 Model. Buildings 2025, 15, 512. https://doi.org/10.3390/buildings15040512
Huang X, Duan Z, Hao S, Hou J, Chen W, Cai L. A Deep Learning Framework for Corrosion Assessment of Steel Structures Using Inception v3 Model. Buildings. 2025; 15(4):512. https://doi.org/10.3390/buildings15040512
Chicago/Turabian StyleHuang, Xinghong, Zhen Duan, Shaojin Hao, Jia Hou, Wei Chen, and Lixiong Cai. 2025. "A Deep Learning Framework for Corrosion Assessment of Steel Structures Using Inception v3 Model" Buildings 15, no. 4: 512. https://doi.org/10.3390/buildings15040512
APA StyleHuang, X., Duan, Z., Hao, S., Hou, J., Chen, W., & Cai, L. (2025). A Deep Learning Framework for Corrosion Assessment of Steel Structures Using Inception v3 Model. Buildings, 15(4), 512. https://doi.org/10.3390/buildings15040512