Abstract
High-density cities face increasing pressure to curb the rapid growth of building-sector carbon emissions, yet the specific impacts of China’s dual-control policy—regulating both total emissions and emission intensity—remain insufficiently understood. To address this gap, this study aims to quantify how dual-control constraints shape urban building-emission trajectories by developing a dynamic scenario model that integrates both operational and embodied emissions while accounting for technological progress, energy-structure adjustments, and socioeconomic change. The model is applied to Guangzhou, a representative high-density metropolis in China’s low-carbon transition. Three policy scenarios are evaluated: a baseline pathway reflecting existing trends, an energy-conservation pathway emphasizing efficiency improvements, and a deep-decarbonization pathway that combines enhanced efficiency with accelerated clean-energy adoption. The results show that rising residential energy demand is the primary driver of emission growth, whereas technological advancement provides the strongest mitigation potential. Under the energy-conservation scenario, emissions are projected to peak around 2029, consistent with China’s national carbon-peaking target for 2030. Overall, the findings offer clear empirical evidence and actionable policy insights for accelerating urban decarbonization in high-density contexts under dual-control constraints.
1. Introduction
1.1. Background
The accelerating pace of global climate change has prompted countries to intensify efforts to reduce carbon emissions. In 2020, China announced its strategic goal of peaking carbon emissions before 2030 and achieving carbon neutrality before 2060. As one of the major sources of national energy consumption and carbon output, the construction industry has therefore become a critical sector for achieving the “dual carbon” targets [1]. Recent studies indicate that the building sector accounts for approximately 37–40% of global energy-related CO2 emissions, underscoring its central role in the net-zero transition [2,3]. Within China, life-cycle emissions from buildings—including both operational and embodied emissions—contribute more than 40% of total national carbon emissions. In 2020 alone, operational emissions reached 2.16 billion tons of CO2, representing 22% of the national total [4]. Moreover, embodied carbon generated during material production and transportation constitutes a substantial portion of life-cycle emissions and has increasingly attracted scholarly attention [5,6].
High-density urban areas—characterized by clustered building forms, intensive equipment loads, and significant heating and cooling demand—exhibit strong spatial aggregation and persistent growth inertia in carbon emissions [7]. Empirical research further confirms pronounced spatial clustering in China’s urban construction emissions, particularly within megacity clusters such as the Pearl River Delta [8]. In response to these challenges, China has shifted its regulatory focus from “dual control of energy consumption” to “dual control of carbon emissions,” emphasizing coordinated management of both total emissions and emission intensity [9]. According to the 2023 Work Plan for Accelerating the Establishment of a Carbon Emission ‘Dual Control’ System issued by the Ministry of Ecology and Environment, a comprehensive carbon monitoring and accounting framework is expected to be in place by 2025, prioritizing carbon-intensity control while supplementing it with total-emission regulation [10]. Provincial and municipal initiatives, including the Guangzhou Carbon-Peaking Implementation Roadmap, also call for more refined city-level scenario simulation [11].
Despite rising academic interest in building-sector decarbonization, several research gaps remain. Existing studies predominantly focus on operational energy use or evaluate the effects of single-policy instruments, while limited attention has been given to dynamic scenario modeling under dual-control constraints [12]. Furthermore, insufficient exploration exists regarding embodied carbon, energy-structure optimization, electrification pathways, green-technology adoption, and financial coordination mechanisms. These gaps are particularly pronounced in high-density cities, where emission characteristics and mitigation potentials differ substantially from those of low-density regions.
To address these deficiencies, this study selects Guangzhou—a representative high-density metropolis—as the case city. By integrating both operational and embodied carbon characteristics within the dual-control policy framework, this research develops a dynamic scenario analysis model to examine potential carbon-peaking pathways for the building sector. The objective is to provide theoretical insights and practical guidance to support the low-carbon transformation of high-density urban environments.
1.2. Literature Review
Global decarbonization efforts following the Paris Agreement have accelerated the restructuring of national climate governance frameworks. In China, the policy shift from an energy-consumption dual-control system to a carbon-emissions dual-control mechanism marks a substantial institutional transformation, reshaping the regulatory environment for urban and sectoral emission management [12,13]. International studies on ESG governance and circular-economy principles further demonstrate that integrated regulatory systems are essential for guiding high-emission sectors—especially buildings—toward long-term carbon neutrality [2,14]. The establishment of China’s national MRV system reinforces this direction by embedding carbon-intensity and total-emission constraints into local planning and compliance processes [15]. As a result, evaluating how these evolving policy instruments influence the decarbonization of high-density urban buildings has become increasingly important. Recent regional studies, including system-dynamics assessments in Fujian Province [16] and differentiated urban peak-prediction analyses in Shandong [17], highlight the pivotal role of policy intensity in shaping emission trajectories, underscoring the need for dynamic and policy-responsive modeling approaches.
Within this broader policy context, the building sector remains a central contributor to national emissions, with operational and embodied emissions together accounting for over 40% of China’s total carbon output [18,19,20]. High-density cities present even more complex emission dynamics due to concentrated building stocks, intensive cooling and heating loads, and rapidly expanding service sectors. Empirical evidence from the Pearl River Delta demonstrates pronounced spatial clustering of building-related emissions [21,22,23,24], suggesting that urban form and spatial structure critically influence energy demand. Moreover, studies show that the interaction among urban form, energy structure, and infrastructure modernization significantly shapes long-term emission pathways [25,26]. System-dynamics simulations in dense districts further indicate persistent energy-demand inertia, reinforcing the need for coordinated planning across residential, commercial, and public-service buildings [27]. Comparative analyses across Chinese city clusters reveal that economically diversified cities tend to reach emission peaks earlier, benefiting from stronger policy capacity and a broader mix of clean-energy options [24,28]. Together, these findings point to a clear conclusion: the decarbonization of high-density cities cannot be fully understood without a framework that incorporates spatial heterogeneity, structural characteristics, and local policy execution capacity.
To better capture these dynamics, analytical approaches for modeling building-sector emissions have expanded considerably. Traditional decomposition methods such as the Kaya identity, STIRPAT, and LMDI provide valuable insights into structural drivers—population, economic growth, and technological efficiency—but their static nature limits their ability to simulate long-term system feedback [14,29,30]. Consequently, scenario-based frameworks such as LEAP–SD and system dynamics have been widely adopted for medium- and long-term forecasting [31,32,33,34]. Integrating operational and embodied emissions within these models has been shown to improve peak-prediction accuracy and reveal cumulative mitigation benefits under coordinated policy measures [35,36,37]. With the growing availability of urban data, machine-learning approaches have emerged to capture regional heterogeneity and enhance predictive stability [38,39], while scenario analyses focusing on electrification and renewable-energy integration highlight the centrality of power-sector decarbonization in shaping bottom-up building emissions [40]. However, despite these methodological advancements, dual-control policy intensity has rarely been incorporated as an explicit variable in dynamic models. Empirical assessments of policy shocks remain limited, leading to uncertainties about how tightening regulatory constraints affects emission intensity, energy-structure adjustments, and peaking timelines [28,40]. This gap reveals a methodological disconnect between evolving national policy frameworks and existing analytical tools.
Beyond policy and methodology, the transition toward low-carbon buildings relies on the combined progress of technology, finance, and institutional design. Technological improvements in digitalization, high-efficiency HVAC systems, and automated building control have demonstrated substantial potential to reduce operational energy demand [41]. Life-cycle assessments highlight further opportunities to reduce embodied emissions through material optimization and low-carbon construction processes [5,42]. Financial mechanisms—including green credit, green bonds, and fiscal incentives—can lower the upfront costs of retrofitting and renewable deployment, thereby enabling broader adoption [23,37,38]. Moreover, coordinated governance that integrates planning, regulation, and innovation policy has shown positive effects across both operational and embodied dimensions, particularly in rapidly urbanizing areas [43,44]. Nevertheless, existing research seldom examines how technological innovation, financial instruments, and policy intensity interact with one another [45,46,47]. As a result, many analytical models fail to capture the multi-mechanism nature of emission-reduction dynamics in high-density cities. Additionally, although scholars increasingly emphasize the distinctive characteristics of megacities, simulation-based studies often simplify or omit these localized features [27,28], limiting their usefulness for city-specific policy design.
Given these unresolved issues in the current literature, this study proposes a dynamic scenario-analysis model that explicitly embeds China’s dual-control policy mechanisms and conceptually integrates operational and embodied-emission considerations. This design reflects the need for analytical tools that are both policy-responsive and capable of capturing the structural features of high-density cities. By incorporating technological progress, financial incentives, and urban-density characteristics, the model provides a more realistic representation of how multiple drivers jointly influence emission trajectories. Guangzhou is selected as the empirical case because it exemplifies the challenges faced by rapidly growing, high-density metropolitan areas, as shown in Figure 1. In line with this framework, the study aims to (1) quantify the impact of different policy intensities on carbon-peaking pathways, (2) reveal the combined effects of structural, technological, and financial factors, and (3) offer targeted policy insights to support coordinated low-carbon transitions. Through this contribution, the study bridges the gap between national policy evolution, urban-scale emission behavior, and practical decision-making for the building sector.
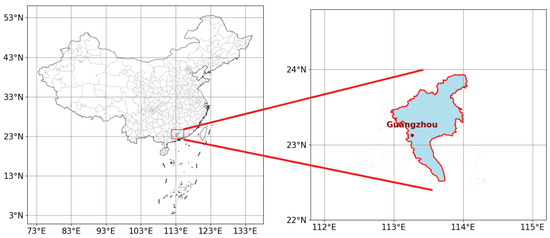
Figure 1.
Location map of the case city Guangzhou.
2. Methodology
2.1. Building Carbon Emissions Accounting Model
Carbon emissions throughout the entire building process: It refers to the total amount of carbon emissions from all types of energy consumption consumed by buildings as final products throughout their entire life cycle, including carbon emissions from the production and transportation of building materials, construction, operation and use of buildings, and demolition and disposal of buildings. The carbon peaking plan of the Ministry of Housing and Urban-Rural Development refers to carbon emissions in the construction sector. Carbon emissions in the construction sector include carbon emissions during the operation stage and carbon emissions from the construction industry. Among them, carbon emissions during the operation stage can be divided into direct carbon emissions and indirect carbon emissions. Direct carbon emissions refer to the carbon emissions caused by the direct consumption of fossil fuels during the operation stage of buildings. Indirect carbon emissions refer to the carbon emissions brought about by the consumption of electricity and heat during the operation stage of buildings. This study takes carbon emissions during the operation stage of buildings as the accounting boundary.
This study focuses on the carbon emissions during the operation stage of buildings and calculates them based on the energy balance sheet splitting model [48]. To accurately project future emission trends, the operational stage is divided into three categories according to building type: urban residential buildings, rural residential buildings, and public buildings. To ensure methodological transparency and robustness, parameter choices—including energy efficiency coefficients, technology improvement rates, electrification pathways, and emission factors—are based on authoritative sources such as national energy statistical guidelines, IPCC emission factor recommendations, and prior empirical studies. Following the Kaya identity and established building energy accounting literature, carbon emissions for each building type are calculated using the following equations.
where
- represents Carbon emissions from urban residential buildings,
- represents Carbon emissions from rural residential buildings,
- represents Carbon emissions from public buildings
- represents Total operational carbon emissions
- P represents population size,
- U is the urbanization rate,
- A denotes per capita building area by building type,
- EC is energy consumption per unit area,
- EF is the carbon emissions per unit of energy consumption.
The emission factor EF is calculated as:
where si denotes the share of each fossil fuel type, EFelec is the electricity emission factor, and Relec is the electrification ratio. The coefficients 2.66, 1.73 and 1.56, respectively, represent the emission factors of coal, oil and natural gas (unit: kgCO2/kgce), referring to the “Guidelines for the Compilation of Provincial Greenhouse Gas Inventories” [49] or the China Energy Statistical Yearbook [50].
Energy consumption per unit area is expressed as:
where
- kt is the terminal energy proportion,
- gt is the demand growth coefficient,
- it is the technology improvement coefficient.
This model follows established energy balance sheet decomposition methods widely used in building-sector carbon accounting. The selection basis for the base year 2020, because 2020 was the final year of the 13th Five-Year Plan. The energy consumption data was complete and officially verified, and the technical parameters were representative [50,51]. kt is set in reference to GB/T 51161-2016 “Standard for Energy Consumption of Civil Buildings” [52]. gt according to the research on the per capita income and energy consumption elasticity in Guangzhou area by Zhang et al. (2022), 0.8–1.5% per year was adopted [53]. it according to the “14th Five-Year Plan for Building Energy Conservation and Green Building Development”, the average annual improvement rate of equipment efficiency is set at 1.2% to 2.0% [54].
Because Guangzhou lacks a centralized heating system, total building-sector emissions are defined as the sum of direct fossil fuel emissions and indirect emissions from electricity use:
where Ai represents fossil fuel consumption, EFi denotes the corresponding emission factors, Ae is terminal electricity use, and EFe is the regional electricity emission coefficient.
The power emission factor adopts the benchmark value of 0.5810 tCO2/MWh of China Southern Power Grid in 2020, and the fossil energy emission factor is derived from the IPCC 2006 guidelines [55].
2.2. Construction Industry Carbon Emission Projection Model Based on IPAT
To assess long-term emission trajectories, an extended IPAT model is used. The model incorporates both socioeconomic drivers and technological parameters relevant to the building sector.
This subsection identifies the drivers of construction industry carbon emissions from both demand and supply perspectives. It adopts the IPAT framework and aligns each component with building sector characteristics. The variable P denotes population size. In the context of construction, population affects emissions indirectly by stimulating new building demand, which raises energy use and emissions in both the building sector and its upstream industries. Because urbanization reflects the spatial distribution and intensity of population, this study uses the urbanization rate to represent P.
The variable A captures economic scale and the degree of value creation, transformation, and realization. Per capita GDP reflects regional economic development and is used to quantify A. The variable T represents technology. Consistent with the accounting model presented earlier, T covers both direct and indirect emissions. For direct emissions, technology is proxied by energy intensity and energy composition in the construction sector. Building energy intensity reflects the dependence of economic activity on energy. Technological progress reduces energy consumption, improves efficiency, and lowers emissions.
Based on sector characteristics, the model incorporates two groups of parameters. The first group contains technology parameters, including the combined emission factor of the building sector and the energy intensity per unit floor area. The second group contains economic and social parameters, including per capita building area, population size, and the urbanization rate. The basic specification is:
where
- C: Total carbon emissions,
- E: Total energy consumption,
- A: Total building area,
- P: Population size
- EF is the combined energy emission factor for the building sector, it is determined by the energy structure. Refer to Formula (5)
- EC is energy consumption per unit building area, refer to Formula (6)
- AS is per capita building area covering urban residential, rural residential, and public buildings. Future values of per capita building area and population are obtained through trend extrapolation with reference to relevant reports.
The comprehensive emission factor of the construction sector is related to the energy structure of the construction sector: (1) Direct energy consumption, mainly the direct consumption of coal, oil and natural gas; (2) Indirect energy consumption, mainly electricity consumption, is thus related to the proportion of electrification in the building sector and the proportion of clean power generation.
where
- EF: Comprehensive energy emission factor for building sector (tCO2/tce),
- β_j: Share of j-th fossil energy type (coal, oil, natural gas),
- EF_fossil,j: Emission factor of j-th fossil energy type (tCO2/tce),
- Θ: Electrification rate (share of electricity in terminal energy consumption),
- λ: Clean power generation ratio (share of non-fossil energy in total generation),
- EF_thermal: Thermal power (fossil fuel electricity) emission factor (tCO2/MWh).
- Formula Component Breakdown:
- Σ_(j = 1)^3: missions from direct fossil fuel combustion
- θ × (1 − λ) carbon emissions from electricity consumption (accounting only for thermal power generation.
Drawing on the geographic and climatic characteristics of Guangzhou, along with data on energy consumption in the local building sector, this study constructs a historical time series of carbon emissions using the energy balance sheet decomposition method. A terminal technology model of carbon emissions in Guangzhou’s building sector is then developed to identify dual control targets for both the total amount and intensity of emissions. On this basis, the study proposes technical implementation pathways and supporting policy recommendations for energy conservation and emission reduction in the building sector.
2.3. Scenario Design and Parameter Setting
Based on Guangzhou’s geographical and climatic characteristics, building energy consumption data quality, and policy planning system, this study constructs historical emission time series and designs three development scenarios. All parameter settings are based on publicly available policy documents, statistical yearbooks, or peer-reviewed academic literature to ensure the transparency and reproducibility of model inputs.
This study uses historical data as a foundation, with 2020 data as the baseline year, to establish three scenarios: a baseline Scenario, an energy-saving scenario, and a decarbonization scenario. The baseline scenario projects emission trends under current policies and technologies. The energy conservation scenario builds on the baseline by incorporating expected improvements in building energy efficiency, including accelerated adoption of high-efficiency equipment and enhanced building envelope performance. The decarbonization scenario extends the energy conservation scenario by additionally accounting for accelerated decarbonization in the power sector and an increased share of clean electricity.
Across all three scenarios, building terminal energy demand is categorized into five end uses: heating, cooling, hot water and cooking, appliances, and lighting. Technological progress is represented in six categories corresponding to improvements in the efficiency of equipment and the performance of building envelopes across these five demand types. Scenario design draws upon policy targets and planning documents, including the Special Plan for Green Building Development in Guangzhou (2021–2035) and the Implementation Plan for Carbon Peaking in Urban and Rural Construction in Guangdong Province. Based on the expected targets set in planning documents such as the “Guangzhou Carbon Peak Implementation Plan”, “Guangzhou Energy Development ‘14th Five-Year Plan’”, “Guangzhou Urban Master Plan (2021–2035)”, “Guangdong Provincial Urban and Rural Construction Carbon Peak Implementation Plan”, and “Guangzhou Green Building Development Special Plan”, and referring to the situation of other cities and relevant literature, the prediction time range is also extended to 2040 [49,50,51,52,53,55,56,57,58,59].
This study employs a triple verification method for parameter setting: “policy objective anchoring + literature calibration + historical data,” as detailed below. Base year (2020) data are from the Guangzhou Statistical Yearbook or Energy Balance Sheet. The growth rate is set with reference to the binding target of “a 14% reduction in energy consumption per unit of GDP by 2025” in the “Guangzhou Carbon Peak Implementation Plan”.
Population projections based on the Guangzhou City Master Plan (2017–2035), adjusted for historical trends from the Guangzhou Municipal Bureau of Statistics. The data sources in Table 1 are as follows: Per Capita Building Area: Adjusted for Guangzhou’s actual situation, referencing the per capita building area growth trend in the *China Building Energy Conservation Annual Development Research Report*. The per capita area of urban residential buildings increased from 34.37 m2 in 2020 to 55 m2 in 2040, an average annual increase of approximately 1.2%; rural areas increased from 50.41 m2 to 70 m2, an average annual increase of approximately 0.9%; and public buildings increased from 14.9 m2 to 18.5 m2, an average annual increase of approximately 0.6%. Electrification Level: Electrification rate targets were set with reference to the *Guangzhou Energy Development “14th Five-Year Plan”*, combined with research on the electrification process in the building sector. The 2020 electrification rate referenced data from Guangzhou’s energy balance sheet; the 2030 and 2040 values were set based on planning targets and the accelerating electrification trend. Clean power generation ratio and coal consumption for power generation: Based on the clean energy development goals in the “14th Five-Year Plan for Energy Development of Guangdong Province” and the “14th Five-Year Plan for Energy Development of Guangzhou City”, and combined with research literature on decarbonization in the power industry, the following parameters were set [59,60,61,62,63,64].

Table 1.
Socioeconomic Parameters for Key Future Years.
Technical parameters (Table 2) are set based on the following: Demand Growth Coefficient: ** Set based on Guangzhou’s economic development expectations, the trend of improving living standards, and the historical growth patterns of energy demand in various buildings. Under the baseline scenario, heating and cooling demand grows rapidly, reflecting the increasing demands for indoor thermal environments in Guangzhou.
Table 2.
Technical Parameters for Future Requirements of the Building Sector.
Technical Efficiency Coefficient: ** Set based on the energy efficiency improvement targets in the “Guangzhou Green Building Development Special Plan” and with reference to the expected popularization of advanced technologies both domestically and internationally. The energy-saving scenario and decarbonization scenario represent moderate and positive energy efficiency improvement paths, respectively.
Building Envelope Performance Coefficient: ** Reflects improvements in the thermal performance of building envelope structures such as exterior walls and windows, and is set with reference to Guangzhou’s green building and ultra-low energy consumption building development goals.
Relative Energy Intensity Value: ** Calculated using 2020 as a baseline (1.0), taking into account the impact of demand growth and technical efficiency improvements, reflecting the trend of energy consumption per unit area.
3. Results and Discussion
3.1. Analysis of the Historical Evolution of Carbon Emissions from Building Operations in Guangzhou
According to estimates, a total of 10.747 million tons of standard coal equivalent of energy was consumed in the operation phase of buildings in Guangzhou in 2021, resulting in 29.3487 million tons of carbon dioxide emissions. Of this total, direct carbon emissions from fossil fuel use accounted for 9.4724 million tons of carbon dioxide, or 32 percent, while indirect emissions from electricity consumption accounted for 19.8763 million tons of carbon dioxide, or 68 percent.
As shown in Figure 1, carbon emissions from building operations in Guangzhou increased significantly from the period of the Eleventh Five-Year Plan through the Fourteenth Five-Year Plan. Total emissions rose from 11.7503 million tons in 2005 to 29.3487 million tons in 2021, an overall increase of about 149.74 percent. During this period, emissions grew by 23.5 percent in the Eleventh Five-Year Plan period, a much higher rate than the 8.8 percent growth during the Twelfth Five-Year Plan and the 12.8 percent growth during the Thirteenth Five-Year Plan.
Although a clear peak in building operation emissions has not yet been observed, the trend suggests that emissions began approaching a plateau during the Twelfth Five-Year Plan period. Between 2005 and 2019, operational emissions exhibited an overall upward trend, with a particularly sharp increase from 2016 to 2019. This growth likely reflects the expansion of total building floor area, the rise in energy demand, and the influence of continued economic development. The marked increase in 2020 and 2021 may also be related to behavioral changes during the COVID-19 pandemic, when more residents stayed at home and energy use in residential buildings increased.
Figure 2 shows the distribution of operational emissions by building type in 2021. Public buildings produced 12.1558 million tons of carbon dioxide, accounting for 41.4 percent of total emissions. Urban residential buildings emitted 11.6013 million tons, or 39.5 percent, and rural residential buildings emitted 5.5916 million tons, or 19 percent. The historical data indicate that the share of rural residential building emissions has remained relatively stable, fluctuating between 18 and 21 percent of total emissions. By contrast, the composition of emissions between public and urban residential buildings has shifted notably. The proportion from public buildings declined from 45 percent in 2005 to 41 percent in 2021, while that from urban residential buildings rose from 36 percent to 40 percent over the same period.
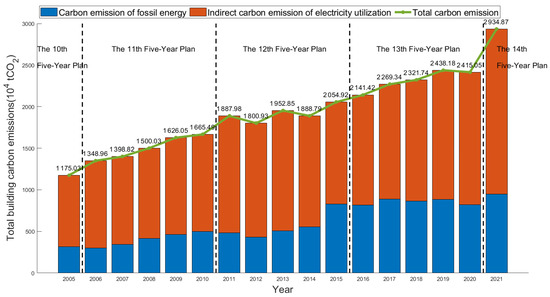
Figure 2.
Carbon emissions from building operations in Guangzhou City.
3.2. Energy Structure for Carbon Emissions from Building Operation in Guangzhou
3.2.1. Trends of Direct/Indirect Carbon Emissions from Building Operation in Guangzhou
As shown in Figure 3, both direct fossil fuel emissions and indirect electricity-related emissions from building operations in Guangzhou have exhibited a clear upward trend. In 2021, direct carbon emissions from fossil fuels amounted to 9.4724 million tons of carbon dioxide, while indirect emissions from electricity consumption reached 19.8762 million tons. Electricity-related emissions remain the dominant contributor, accounting for more than 60 percent of total building operation emissions.
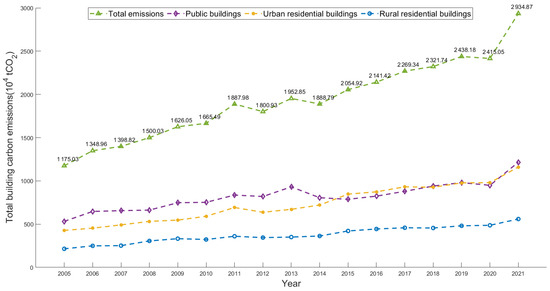
Figure 3.
Carbon emissions from building operations in Guangzhou—by building type.
During the Twelfth Five-Year Plan period, Guangzhou advanced the optimization of its energy structure by reducing coal consumption and increasing the share of cleaner energy sources. The city implemented a series of policies to promote energy conservation and improve efficiency, particularly in the power sector. These policies likely contributed to reducing the carbon intensity of electricity generation. Key measures included the promotion of energy-efficient technologies and equipment, improvements in grid operation and management, and the enhancement of overall energy utilization efficiency. However, the continued dependence of the industrial and transportation sectors on fossil fuels still contributed to a persistent rise in direct emissions.
During the Thirteenth Five-Year Plan period, Guangzhou further reduced its reliance on coal-fired power generation and expanded the use of natural gas, photovoltaic, and biomass energy. These changes indicate a transition toward a cleaner and more sustainable energy mix. As shown in Figure 3, the city’s power generation structure underwent significant adjustments. The share of coal power declined from 77.4 percent in 2015 to 45 percent in 2020, while the share of gas power increased from 19.3 percent to 41.7 percent during the same period. Photovoltaic power rose from 0.5 percent in 2015 to 6.8 percent in 2020, and biomass power increased from 0.5 percent to 4.3 percent. These shifts reflect Guangzhou’s gradual progress toward energy diversification and a lower-carbon electricity supply system.
3.2.2. Analysis of Energy Structure for Carbon Emissions from Building Operation in Guangzhou
As illustrated in Figure 4, Guangzhou has achieved considerable progress in optimizing its energy structure during the building operation phase. At present, the electrification rate of terminal energy consumption in buildings exceeds 50 percent. Coal accounts for less than 5 percent of total building energy use, natural gas for less than 10 percent, and oil for approximately 37 percent. Over the long term, the most notable trend has been the decline in coal use and the gradual rise in natural gas consumption, which together indicate a steady transition toward cleaner energy sources for building operations.
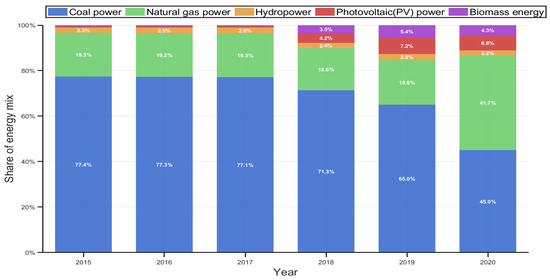
Figure 4.
Chart of energy structure proportion of carbon emissions from building operation in Guangzhou.
Between 2005 and 2021, both the total volume and the share of electricity in terminal energy consumption increased steadily. Electricity consumption rose from 1.4712 million tons of standard coal equivalent to 5.4481 million tons, representing an average annual growth rate of 12.7 percent. During the same period, the building electrification rate increased from 46 percent to 51 percent, a rise of five percentage points. However, despite ongoing efforts to decarbonize electricity generation, the rapid growth in electricity demand has outweighed the gains from cleaner energy sources. As a result, electricity-related carbon emissions continued to rise, increasing from 8.5734 million tons of carbon dioxide in 2005 to 19.8763 million tons in 2021.
3.2.3. Analysis of Electricity Carbon Emissions
As shown in Figure 5, the electricity carbon emission coefficient of Guangzhou has remained consistently higher than the national average since 2010. While the national electricity emission factor has exhibited a generally fluctuating downward trend, Guangzhou’s trajectory differs. In 2021, the city’s electricity carbon emission coefficient was 0.6772 kg of carbon dioxide per kilowatt hour, representing a reduction of about 7 percent compared with 2005. However, beginning in 2015, the coefficient in Guangzhou began to rise, moving in the opposite direction of the national trend and remaining above the national average level.
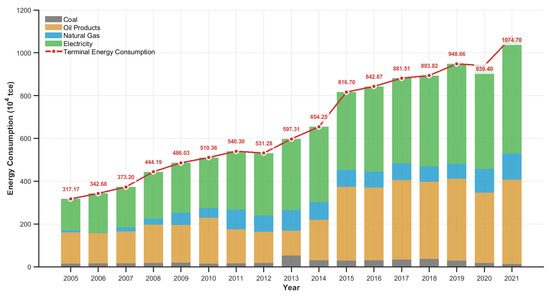
Figure 5.
Changes in the energy structure of carbon emissions from building operations in Guangzhou. Note: To better reflect terminal energy consumption, data are calculated using the electrothermal equivalent method rather than the coal-equivalent method for power generation. Caution should be taken when comparing these figures with coal-based calculations.
This divergence can be attributed to Guangzhou’s regional power mix and its heavy reliance on imported electricity from provinces with higher thermal power proportions. Although local measures have been introduced to increase the share of natural gas and renewable energy in power generation, the rapid expansion of building electricity demand has offset part of the emission reduction benefits. Among all building types, public buildings have been the largest contributors to indirect electricity-related emissions, reflecting their high energy intensity and continuous growth in service demand.
3.3. Future Projections of Carbon Emissions from Building Operations
3.3.1. Forecast of Future Peak of Carbon Emissions from Building Operations in Guangzhou
Based on the parameter settings and targets described in Table 1 and Table 2, and in line with current policies and market penetration trends, Figure 6 illustrates the projected carbon emission trajectories for Guangzhou’s building operations under three scenarios. Under the baseline scenario, emissions are expected to continue rising and reach a peak of 31.1479 million tons of carbon dioxide in 2040. This projected timeline falls significantly behind China’s national carbon peaking target of 2030, indicating that existing measures and technologies alone are insufficient to achieve timely emission stabilization in the building sector.
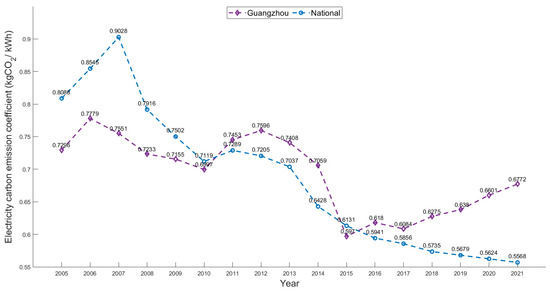
Figure 6.
National/Guangzhou electricity carbon emission coefficient.
To meet Guangzhou’s objective of peaking building-sector emissions by 2030, it is essential to accelerate improvements in terminal energy efficiency and expand the share of clean energy in the building energy mix. Key measures include promoting both active and passive energy-saving technologies, such as high-efficiency electromechanical systems (for example, heat pumps and LED lighting), renewable energy integration in buildings, stricter energy-efficiency standards for new constructions, and large-scale retrofitting of existing buildings.
As shown in Figure 7, under the energy conservation scenario, building operation emissions in Guangzhou are projected to peak at 26.5728 million tons of carbon dioxide in 2029, meeting the national target timeline. In contrast, under the decarbonization scenario, which assumes accelerated clean energy substitution and deeper technological improvements, the city’s building operation emissions are projected to peak earlier, in 2026, at 24.4866 million tons of carbon dioxide. These results indicate that achieving the 2030 carbon peak requires following an energy conservation or decarbonization pathway during the building operation phase, supported by strong technological innovation and policy enforcement.
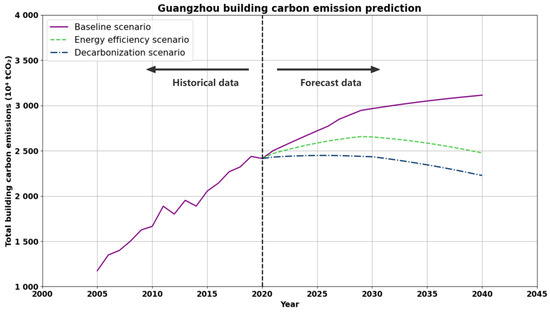
Figure 7.
Prediction of carbon peaking during the building operation phase.
3.3.2. Future Analysis of Energy-Saving Scenarios
Under the energy conservation scenario, the average annual growth rate of carbon emissions from building operations in Guangzhou is projected to decline notably during the upcoming planning periods. Specifically, the growth rate is expected to fall from 2.19 percent during the Fourteenth Five-Year Plan period and 1.66 percent during the Fifteenth Five-Year Plan period to 1.10 percent and 0.41 percent, respectively. This deceleration reflects the combined effects of energy-efficiency improvements, technological innovation, and the gradual optimization of the city’s energy structure.
In alignment with the goal of achieving carbon neutrality in the building sector, policy efforts should not only enhance the efficiency of electrical and mechanical systems but also promote low-carbon and green lifestyles among residents. At the same time, improving the level of intelligent building management and adopting smart energy systems can effectively reduce terminal energy demand across residential, public, and commercial buildings.
To achieve carbon neutrality in the construction industry, policy pathways need to be precisely designed based on the emission reduction leverage effects revealed by models. Table 2 shows that under the energy-saving scenario, the equipment efficiency coefficient (heating/cooling) in 2040 will increase by an average of 25% compared to the baseline scenario (from 0.886 to 0.6), reducing total building energy consumption from 26.5728 million tons of CO2 generated in the baseline scenario to 24.4866 million tons of CO2 in the decarbonization scenario, with a 21% reduction in peak carbon emissions. This directly verifies the core role of improving the efficiency of electrical and mechanical systems. This is consistent with the research conclusions of Cai et al. (2023) on the diffusion of building technologies in the Greater Bay Area [56].
Studies have shown that in energy-saving scenarios, if residents reduce their final energy demand through energy-saving habits, efficient use of home appliances, and green consumption, they can contribute an additional 6% of emission reduction potential. This aligns with the finding by Lin & Chen (2023) that smart meter feedback mechanisms can increase residents’ awareness of energy conservation [65].
Under the energy conservation scenario, the corresponding total and intensity control targets for energy consumption and Total and Intensity Dual Control Targets for energy consumption and emissions in the building sector. Table 3 shows the total energy consumption and intensity control targets for three building types (urban residential, rural residential, and public buildings) in Guangzhou from 2020 to 2040.
Table 3.
Dual control targets for total energy consumption and intensity emissions in the building sector.
Table 3 illustrates the peak carbon emission characteristics under the dual control targets. Total carbon emissions from building operations will peak at 26.534 million tCO2 in 2030, meeting the requirements of Guangzhou’s carbon peaking plan. Between 2030 and 2040, emissions will decrease to 24.767 million tCO2, a reduction of 6.7%, indicating a downward trend after reaching the peak. Total energy consumption will peak at 10.416 million tce in 2025, earlier than carbon emission peaks, reflecting the energy structure optimization effect.
By building type, for urban residential buildings: total energy consumption will peak in 2025 and then decline continuously, decreasing by 10.6% in 2040 compared to 2020. Energy intensity will decrease from 7.9 kgce/m2 to 4.0 kgce/m2, a reduction of 49%, indicating significant improvements in energy efficiency. Total carbon emissions will peak in 2030 (11.167 million tCO2) and then decline. Carbon emission intensity will decrease from 17.7 to 10.3 kgCO2/m2, a reduction of 42%, reflecting the effects of electrification and cleaner electricity. This data is consistent with the technical parameters in Table 2. In 2040, the heating/cooling efficiency coefficient for urban residential buildings will be 0.6 (a 40% improvement compared to 2020), and the building envelope coefficient will be 0.7 (a 30% performance improvement), with technological improvements directly translating into a reduction in intensity. Therefore, urban residential buildings are a key area for improving energy efficiency and reducing carbon emissions, and the implementation of electrification, energy-saving renovations, and green building standards has yielded significant results.
Rural residential buildings: Total energy consumption will peak in 2025 and then decline slowly but will still be 5.9% higher in 2040 than in 2020. Energy intensity will remain relatively stable at 14–15 kgce/m2, with a limited decrease (3.6%). Total carbon emissions will peak in 2030 and then decline slightly but will still be 8.7% higher in 2040 than in 2020. Carbon emission intensity will remain at 36–37 kgCO2/m2, with almost no change. Rural buildings have 3.5 times the carbon emission intensity of urban buildings (36.3 vs. 10.3 in 2040), but their reduction is the slowest, requiring specific policy intervention (such as biomass energy substitution and energy-saving renovation of rural houses). At the same time, progress in improving energy efficiency and transforming the energy structure of rural buildings is slow, representing a challenge and potential area for future emission reduction, requiring strengthened clean energy substitution and energy-saving renovation.
Public buildings: Total energy consumption will peak in 2030 and then decline, with a 6.0% increase in 2040 compared to 2020. Energy intensity will decrease from 11.2 kgce/m2 to 8.6 kgce/m2, a 23% reduction. Total carbon emissions will peak in 2030 and then continue to decline, with a 5.8% decrease in 2040 compared to 2020. Carbon emission intensity will decrease from 34.0 kgCO2/m2 to 23.2 kgCO2/m2, a 32% reduction. Public buildings have already achieved a total reduction in carbon emissions. The demand coefficient for electrical appliances in public buildings has decreased from 1.0 in 2020 to 0.99 in 2040 (energy-saving scenario), reflecting the demand reduction effect brought about by intelligent control. This is mainly due to improved energy efficiency and a cleaner power structure, making it a pioneering sector in the low-carbon transition.
4. Conclusions
4.1. Conclusions and Policy Pathways
Based on scenario simulations conducted from 2020 to 2040, this study identifies a differentiated peaking trajectory for Guangzhou’s building sector: total carbon emissions peak in 2030 at 2653.4 million tCO2 under the energy-saving scenario, declining to 2476.7 million tCO2 by 2040 (a 6.7% reduction), while energy consumption peaks earlier in 2025 at 1041.6 million tce (Table 3). The analysis reveals that public buildings achieve the most substantial intensity reduction (↓32% in emission intensity), whereas rural residential buildings remain a critical policy gap with minimal improvement (↓1.4% in emission intensity). The following targeted pathways integrate these model-derived insights with actionable policy measures.
- (1)
- Establish a Low-Carbon Standards and Technology System Tailored to Building Typologies. Develop a comprehensive low-carbon standard framework that defines differentiated carbon emission control targets for urban residential, rural residential, and public buildings, reflecting their distinct emission profiles as identified in the simulations. For instance, rural buildings—which showed the slowest decline in carbon intensity—require strengthened standards for envelope performance and clean energy integration. Establish a green and low-carbon indicator system to monitor progress and ensure alignment with national and provincial targets. Strengthen statistical systems for energy consumption, expand the coverage of building energy monitoring, and improve data accuracy through optimized supervision platforms. Create a green and low-carbon management mechanism that includes periodic assessments for urban areas and tailored evaluation systems for rural construction.
- (2)
- Promote Digital and Intelligent Building Operations with a Focus on High-Impact Systems. Accelerate the construction of digital buildings and promote the application of Internet of Things-based technologies. Utilize digital tools such as big data analytics and artificial intelligence to achieve real-time monitoring, data-driven analysis, and optimal regulation of building energy use, environmental conditions, and occupant needs. Strengthen the operational management of energy systems by implementing energy consumption monitoring, quota management, and efficiency assessments. In line with the energy-saving potential shown in the “energy-saving scenario,” prioritize the efficiency improvement of air conditioning, lighting, and elevator systems in public and large commercial buildings, with the goal of increasing the energy efficiency of electromechanical systems in public buildings by 15% by 2030. Promote building energy labeling and conduct regular low-carbon performance evaluations.
- (3)
- Advance Clean Building Energy and Renewable Integration Guided by Scenario-Based Pathways. Accelerate the development of clean energy projects and expand the application of renewable energy in suitable areas, in accordance with the “decarbonization scenario”, which highlights the importance of grid cleanliness. Introduce mandatory measures to ensure high-quality implementation and promote large-scale adoption of renewable technologies in buildings. Explore the use of local hydropower resources and technologies such as heat pumps, electric cold-storage air conditioning, and electric heat-storage boilers in large commercial and office buildings. Promote efficient electrification technologies—especially in rural areas where electrification rates are projected to rise—to achieve clean, low-carbon, and high-efficiency energy use in building operations.
- (4)
- Strengthen Financial and Fiscal Policy Support with Differentiated Incentives. Improve fiscal and financial mechanisms to support carbon reduction in the construction sector, with incentives aligned to the varying decarbonization challenges across building types. Implement fiscal incentives, including subsidies and tax benefits for projects contributing to carbon peaking in urban and rural construction. Reward green and ultra-low-energy buildings and establish government procurement mechanisms that prioritize green and low-carbon products. Expand access to green finance by encouraging financial institutions to develop innovative credit products and preferential loan policies for energy-saving projects, particularly for rural building upgrades and public building retrofits. Establish a low-carbon building development fund, attract social capital into the urban infrastructure investment market, and guide private investment toward sustainable construction initiatives.
- (5)
- Build an integrated mechanism for collaboration among industry, academia, and research institutions to promote green innovation, especially in technologies that address the slow carbon-intensity reduction in rural buildings and the further optimization of public building systems. Encourage joint efforts in basic research, technological breakthroughs, and commercialization of research outcomes. Develop high-level innovation teams and platforms and support leading enterprises in forming innovation consortia. Increase investment in science and technology within construction enterprises, formulate technical standards, and establish specialized research centers. Promote green technology incubators, expand education and training programs related to low-carbon construction, and cultivate a professional workforce capable of advancing sustainable building practices.
Through these coordinated, scenario-informed efforts, Guangzhou can accelerate the realization of dual control objectives in the construction sector, ensuring that the building operation phase transitions toward an energy-efficient, low-carbon, and innovation-driven model consistent with the city’s broader carbon neutrality goals.
4.2. Limitations and Future Research
The analysis is primarily based on historical energy balance data and projected parameters, which are subject to uncertainties in future socioeconomic trends, technology adoption rates, and policy implementation effectiveness. The scope of this study is limited to the operational phase of buildings in Guangzhou; embodied carbon from construction materials and processes is not included. Additionally, the predictive scenarios rely on assumptions regarding energy intensity improvements, electrification rates, and grid decarbonization, which may vary in practice. These limitations suggest that the results should be interpreted as indicative rather than deterministic, and future updates with real-time data and broader system boundaries are recommended.
Author Contributions
Conceptualization, H.H.; Data curation, L.H.; Funding acquisition, H.H.; Investigation, S.H. and X.C.; Methodology, Y.H.; Resources, X.C.; Software, L.H.; Formal analysis and visualization X.C.; Writing—original draft, H.H. and S.H.; Writing—review and editing X.C. All authors have read and agreed to the published version of the manuscript.
Funding
This work was funded by the Humanities and Social Science Fund of Guangdong Province (Grant No. GD24CYJ45). The Social Science Fund of Fujian Province (Grant No. FJ2024BF015). The Education and Research Project for Middle-aged and Young Teachers in Fujian Province (Grant No. JAT231077). The Social Science Fund of Fuzhou City (Grant No. 2025FZC050).
Data Availability Statement
The original contributions presented in this study are included in the article. Further inquiries can be directed to the corresponding author.
Conflicts of Interest
All authors declare that the research was conducted in the absence of any commercial or financial relationships that could be construed as a potential conflict of interest.
References
- Hou, F. Study of the carbon neutral path in China: A literature review. World Sci. 2023, 11, 2350008. [Google Scholar] [CrossRef]
- Magaletti, N. Decarbonizing the building sector: The integrated role of ESG and circular economy in sustainable construction. Buildings 2025, 15, 675. [Google Scholar] [CrossRef]
- Zhao, Q.; Zhang, L.; Wang, D. Exploring carbon emissions in the construction industry: Accounting framework and mitigation strategies. Buildings 2025, 15, 158. [Google Scholar]
- Xia, Y.; Lu, H.; Zhang, Y. The road to carbon neutrality in China’s building sector. Cell Rep. Sustain. 2024, 27, 110664. [Google Scholar] [CrossRef]
- Hu, M. Embodied carbon emissions of the residential building: A comparative study of design optimization and material substitution. Climate 2022, 10, 132. [Google Scholar]
- Hu, M. The status of embodied carbon in building practice: Challenges and opportunities. Sustainability 2021, 13, 12964. [Google Scholar] [CrossRef]
- Yan, R.; Zhang, W.; Guo, J. Decarbonization patterns of residential building operations in China and India. Energy Build. 2023, 299, 113489. [Google Scholar]
- Song, M.; Guo, J.; Ren, X. Spatial and temporal characteristics of carbon emissions in China’s construction industry: Empirical analysis and policy implications. Sustainability 2024, 16, 3821. [Google Scholar]
- Zhang, T.; Wang, Y.; Chen, S. Green finance and urban carbon emission dual control in China. Front. Environ. Sci. 2025, 13, 1503735. [Google Scholar]
- Ministry of Ecology and Environment (MEE). Work Plan for Accelerating the Establishment of a Dual-Control System for Carbon Emissions; MEE: Beijing, China, 2023.
- Jiang, X.; Liu, H.; Zhao, Y. Prediction of the peak path of building carbon emissions in Guangzhou under the dual control policy. Energies 2025, 18, 944. [Google Scholar]
- Gu, X.; Wei, J.; Fang, L. Building Carbon Emissions (2016–2025): A PRISMA-based review. J. Clean. Prod. 2025, 450, 141076. [Google Scholar]
- Karakosta, C. Decarbonizing the construction sector: Strategies, barriers, and policy directions. Energies 2025, 18, 1197. [Google Scholar] [CrossRef]
- Wai, M.T.; Chung, A.W.L. Carbon-Neutrality Research in China—Trends and Bibliometric Analysis. Carbon Neutrality 2023, 4, 31. [Google Scholar]
- Li, W.; Zhou, S.; Yang, C. From energy to carbon dual control: Policy evolution and implementation in China. Energy Policy 2024, 185, 113549. [Google Scholar]
- Li, X.; Lin, C.; Lin, M.; Jim, C.Y. Drivers, scenario prediction and policy simulation of the carbon emission system in Fujian Province (China). J. Clean. Prod. 2024, 420, 138456. [Google Scholar] [CrossRef]
- Wang, Z.; Li, M.; Zhou, Q. Peak prediction of urban differentiated carbon emissions: A case study of Shandong Province, China. Energy Policy 2024, 184, 113912. [Google Scholar]
- International Energy Agency (IEA). Global Status Report for Buildings and Construction 2024; IEA: Paris, France, 2024. [Google Scholar]
- Xu, J.; Huang, Y.; Zhao, T. Technical pathways of dual-carbon control in China’s building sector. Energy Build. 2022, 274, 112473. [Google Scholar] [CrossRef]
- Wang, J.; Li, M. Integration of operational and embodied carbon accounting for low-carbon buildings. Build. Res. Inf. 2024, 52, 341–359. [Google Scholar]
- Yang, H.; Li, Q.; Wang, R. Urban density and spatial carbon emission performance of megacities in China. Sci. Rep. 2024, 14, 75163. [Google Scholar] [CrossRef]
- Song, X.; Li, H.; Zhao, J. The carbon emissions from public buildings in China: A systematic analysis. Sustainability 2024, 16, 6622. [Google Scholar] [CrossRef]
- Song, M.; Zhang, R.; Zhou, Q. Pearl River Delta urban agglomeration carbon emissions estimation using remote sensing inversion. Remote Sens. 2024, 16, 2240. [Google Scholar]
- Huang, H.; Liao, F.; Liu, Z.; Cao, S.; Zhang, C.; Yao, P. Peak assessment and driving factor analysis of residential building carbon emissions in China’s urban agglomerations. Buildings 2025, 15, 333. [Google Scholar] [CrossRef]
- Chen, Z.; Li, Y.; Xu, T. Urban building carbon emissions under multi-policy synergy: Evidence from Chinese megacities. Sustain. Cities Soc. 2025, 104, 105645. [Google Scholar]
- Liu, Z.; Wang, Y.; Zhang, X. A Review of the Impact of Urban Form on Building Carbon Emissions. Buildings 2025, 15, 2604. [Google Scholar] [CrossRef]
- Xu, J.; Qian, Y.; He, B.; Xiang, H.; Ling, R.; Xu, G. Strategies for Mitigating Urban Residential Carbon Emissions: A System Dynamics Analysis of Kunming, China. Buildings 2024, 14, 982. [Google Scholar] [CrossRef]
- Zhou, Y.; Yu, X.; Zhang, X. Lifecycle Carbon Footprints of Buildings and Sustainability Pathways in China. 2024. Available online: https://www.oaepublish.com/articles/cf.2024.06 (accessed on 3 November 2025).
- Fan, Y.; Liu, H. Decomposition analysis of China’s building carbon emissions based on Kaya and STIRPAT models. Energy Rep. 2022, 8, 7724–7738. [Google Scholar]
- Liu, K.; Ma, Y.; Zhou, P. Quantitative research on embodied carbon emissions in China’s building sector. J. Asian Archit. Build. Eng. 2022, 21, 2853–2866. [Google Scholar] [CrossRef]
- Du, Y. A life-cycle approach based on LEAP-SD model for carbon emission pathways in China’s construction industry. Energies 2024, 17, 2445. [Google Scholar] [CrossRef]
- Guo, R.; Li, T.; Zhang, Y. Energy conservation and carbon emission reduction of household appliances: A LEAP model approach. Buildings 2025, 15, 799. [Google Scholar]
- Zheng, L.; Luo, Q.; He, K. Operational carbon emission prediction of residential buildings in Guangzhou based on behavior-parameterized simulation. Buildings 2024, 14, 505. [Google Scholar] [CrossRef]
- Lu, H.; Xia, Y.; Liu, K. Dynamic simulation of China’s building carbon emission pathway. Energy Build. 2024, 298, 113841. [Google Scholar]
- Lu, H.; Zhang, Y. Building sector carbon reduction potential through 2050. Energy Policy 2024, 118, 429–439. [Google Scholar]
- Wang, L.; Zheng, Q.; Cao, D. A comprehensive review of building lifecycle carbon emissions and reduction approaches. Environ. Syst. Res. 2024, 33, 44–59. [Google Scholar] [CrossRef]
- Li, X.; Wang, J. Machine learning-based prediction of urban building carbon emissions. J. Clean. Prod. 2025, 460, 142765. [Google Scholar]
- Mai, Y.; Yu, K.; Zhang, X. Enhancing corporate carbon performance through green innovation and digital transformation: Evidence from China. Int. Rev. Econ. Financ. 2024, 96, 103630. [Google Scholar] [CrossRef]
- Akyol, B.C.; Arslan, M.; Tuncer, S. Machine Learning Based Prediction of Long-Term Energy Use and Overheating Risk in Residential Buildings. Energy Build. 2025, 312, 114100. [Google Scholar]
- Hong, T.; Chen, Y.; Lee, S.H.; Piette, M.A. Informing Electrification Strategies of Residential Buildings: Impacts of Heat Pump Retrofits and Efficiency Upgrades in an Urban Neighborhood. Build. Simul. 2025, 18, 3–18. [Google Scholar] [CrossRef]
- Huo, J.; Wei, L.; Zheng, P. Dynamic scenario simulation of building carbon peak from the perspective of urbanization. Energy Policy 2024, 182, 113456. [Google Scholar]
- Lyu, Y.; Liu, M.; Zhao, Z.; Zhu, C.; Lu, Y.; Bu, C. Life Cycle Carbon Emission Analysis of Buildings with Photovoltaic Curtain Walls Based on BIM. Buildings 2025, 15, 138. [Google Scholar] [CrossRef]
- Wen, J.; Li, X.; Zhang, Y. Evaluating Carbon Emissions Reduction Compliance of Chinese Provinces under the Du-al-Control Policy of Energy Consumption and Intensity. J. Environ. Manag. 2024, 352, 120877. [Google Scholar]
- Sun, H.; Hao, Y.; Long, X. Government Environmental Governance, Fiscal Decentralization, and Carbon Intensity of the Construction Industry. Sci. Rep. 2024, 14, 80599. [Google Scholar] [CrossRef]
- Huang, Y.; Yu, K.; Huang, C. Green finance engagement: An empirical study of listed companies on Chinese main board. Green Financ. 2023, 5, 1–17. [Google Scholar] [CrossRef]
- Hou, Z.; Xu, X.; Zhao, P. Green credit policy and energy transition in China’s construction industry. Energy Econ. 2025, 128, 107935. [Google Scholar]
- Huang, Z.; Zhou, H.; Miao, Z.; Tang, H.; Lin, B.; Zhuang, W. Life-Cycle Carbon Emissions (LCCE) of Buildings: Implications, Calculations, and Reductions. Engineering 2024, 35, 115–139. [Google Scholar] [CrossRef]
- Tsinghua University Building Energy Research Center. Annual Report on China Building Energy Efficiency 2022; China Architecture & Building Press: Beijing, China, 2022. [Google Scholar]
- National Development and Reform Commission of China. Provincial Greenhouse Gas Inventory Preparation Guidelines (Trial); NDRC: Beijing, China, 2011.
- Guangzhou Municipal Bureau of Statistics. Guangzhou Energy Statistical Yearbook 2021; Guangzhou Municipal Bureau of Statistics: Guangzhou, China, 2022.
- Guangzhou Municipal Bureau of Housing and Urban-Rural Development. Guangzhou Building Energy Consumption Statistical Yearbook; Guangzhou Municipal Bureau of Housing and Urban-Rural Development: Guangzhou, China, 2021.
- GB/T 51161-2016; Standard for Energy Consumption of Civil Buildings. China Architecture & Building Press: Beijing, China, 2016.
- Zhang, Y.; Wang, Z.; Wu, J. Income elasticity of residential energy demand in Guangzhou: Evidence from household survey data. Energy Policy 2022, 165, 112985. [Google Scholar]
- Guangdong Provincial Department of Housing and Urban-Rural Development. 14th Five-Year Plan for Building Energy Conservation and Green Building Development in Guangdong Province; Guangdong Provincial Department of Housing and Urban-Rural Development: Guangzhou, China, 2021.
- IPCC. 2006 IPCC Guidelines for National Greenhouse Gas Inventories; IPCC: Geneva, Switzerland, 2006. [Google Scholar]
- Cai, W.; Zhang, C.; Su, M. Technology diffusion in building energy efficiency: A case study of the Greater Bay Area. Appl. Energy 2023, 335, 120698. [Google Scholar]
- Guangzhou Municipal People’s Government. Guangzhou Carbon Peaking Implementation Plan; Guangzhou Municipal People’s Government: Guangzhou, China, 2022.
- People’s Government of Guangdong Province. Guangdong New Urbanization Plan (2021–2035); People’s Government of Guangdong Province: Guangzhou, China, 2021.
- Guangzhou Municipal Bureau of Housing and Urban-Rural Development. Special Plan for Green Building Development in Guangzhou (2021–2035); Guangzhou Municipal Bureau of Housing and Urban-Rural Development: Guangzhou, China, 2022.
- Guangdong Provincial Energy Administration. 14th Five-Year Energy Development Plan of Guangdong Province; Guangdong Provincial Energy Administration: Guangzhou, China, 2022.
- Guangdong Provincial Department of Housing and Urban-Rural Development. Implementation Plan for Carbon Peaking in the Urban–Rural Construction Sector of Guangdong Province; Guangdong Provincial Department of Housing and Urban-Rural Development: Guangzhou, China, 2022.
- Guangzhou Municipal People’s Government. Guangzhou Master Plan (2017–2035); Guangzhou Municipal People’s Government: Guangzhou, China, 2018.
- GB/T 51350-2019; Technical Standard for Nearly Zero Energy Buildings. China Architecture & Building Press: Beijing, China, 2019.
- Lu, Y.; Cui, Y.; Li, D. Embodied vs. operational carbon in Chinese buildings: A systematic review. Build. Environ. 2021, 206, 108376. [Google Scholar]
- Lin, B.; Chen, Y. Penetration path of heat pumps in Guangdong buildings: A logistic model analysis. Renew. Energy 2023, 205, 334–345. [Google Scholar]
Disclaimer/Publisher’s Note: The statements, opinions and data contained in all publications are solely those of the individual author(s) and contributor(s) and not of MDPI and/or the editor(s). MDPI and/or the editor(s) disclaim responsibility for any injury to people or property resulting from any ideas, methods, instructions or products referred to in the content. |
© 2025 by the authors. Licensee MDPI, Basel, Switzerland. This article is an open access article distributed under the terms and conditions of the Creative Commons Attribution (CC BY) license (https://creativecommons.org/licenses/by/4.0/).