Abstract
With the advancement of construction development, urban renewal, and urbanization, engineering appraisal and structural reinforcement will become crucial tasks in the construction industry, thus presenting both significant challenges and long-term responsibilities. The concept of “partial strengthening and replacement composite shear walls without support roof” refers to a structural system that utilizes the existing load-bearing capacity of RC shear walls. In this method, high-performance materials are used to locally remove and replace critical load-bearing sections of the wall to be strengthened, resulting in a “composite shear wall” structure composed of both strengthened replacement areas and non-replaced sections. This study proposes the concept of composite shear walls, conducts simulation analysis and exploratory research on their bearing performance, and explores engineering applications based on engineering examples. The research conclusions include the following: Compared to only one batch of replacement reinforcement, partial strengthening and replacement in batches can significantly improve the bearing performance of composite shear walls. The use of steel-reinforced concrete for local strengthening and replacement can significantly improve the bearing performance of composite shear walls, and the magnitude of the improvement in bearing performance decreases with the increase in the initial vertical stress level of the components. The overall structural stress condition after local strengthening and replacement reinforcement is good, and its vertical and horizontal bearing capacity can meet the original design requirements (after reinforcement, the vertical bearing capacity of the overall structure increased by about 6.3% compared to the original design, and the horizontal ultimate bearing capacity is about 1.4 times larger compared to the elastic–plastic “large earthquake” effect of the original design). Compared with conventional replacement methods, the unsupported-roof local reinforcement replacement method has the advantages of using high-performance materials, reducing reinforcement engineering, minimizing resource waste, and simplifying construction procedures, and has good application prospects.
1. Introduction
As construction years become more distant, national construction standards gradually increase (including seismic fortification requirements, structural reliability indicators, etc.), design reference periods (design service life) are exceeded, and the natural environment takes its toll, the material performance of many buildings has deteriorated, and their structural functionality and reliability can no longer meet the requirements for normal use or current national standards. Additionally, due to design errors, construction defects, improper usage management, or changes in building functionality, the load-bearing capacity of some building structures no longer complies with regulatory requirements. With the advancement of urban renewal and urbanization, engineering appraisal and structural reinforcement will become a highly significant task in the construction engineering field, presenting both great importance and long-term challenges. Currently, reinforcement methods widely applied in engineering practice include carbon fiber reinforced polymer (CFRP) bonding, grouting reinforcement, concrete replacement reinforcement, section enlargement reinforcement, post-installed rebar reinforcement, and bonded or wrapped steel reinforcement. Among these, the replacement reinforcement method is widely adopted in engineering due to its simple construction process, ease of operation, strong adaptability, and the advantages of not increasing the cross-sectional dimensions of components after reinforcement, not affecting the usable space of the building, ensuring the integrity of the concrete structure, and enhancing the load-bearing capacity of structural components.
The literature on structural reinforcement is extensive, both domestically and internationally, culminating in a wealth of engineering experience. In addition, the national reinforcement standard system is significantly improving. However, due to the complexity and high technical requirements of engineering reinforcement projects, simplifying construction methods and applying high-performance materials have become important considerations and have driven innovation in optimizing structural reinforcement schemes. The partial strengthening and replacement composite shear walls without support roof is a “composite shear wall” structure composed of reinforced replacement areas and non-replacement areas, which utilizes the self-bearing capacity of the existing RC shear wall (without additional unloading supports) and uses high-performance materials [,,,,] (such as high-strength concrete, steel-reinforced concrete) to locally remove and replace important stress sections of the proposed reinforced shear wall (such as the end area of the wall (edge components), and the boundary area between longitudinal and transverse walls). The method involving locally strengthening and replacing RC shear walls without a support roof only requires the removal of a partial area of the replacement shear wall. Compared with conventional replacement methods, it has the advantages of utilizing high-performance materials, reducing the amount of reinforcement work, and shortening the construction period; this method also leaves a non-replacement area for safe construction and minimal resource waste. Further advantages include no additional unloading support and simplified construction procedures. However, the load-bearing performance of the composite shear wall formed via this reinforcement method is affected by factors such as stress redistribution during the replacement process [,], stress hysteresis between the replacement area (including multiple batches of replacement) and the non-replacement area [], cooperation between high-performance materials and ordinary concrete [], the constraint effect of high-performance materials on ordinary concrete [], and the overall integrity of the new and old interfaces between the replacement and non-replacement areas. The structural stress is extremely complex. The research team introduced the concept of this “composite shear wall” based on practical engineering and conducted exploratory studies. Analysis and research on the horizontal hysteretic behavior of composite shear wall components indicated that the initial vertical stress level is one of the main factors influencing its effective enhancement. When the initial vertical stress level does not exceed 0.3, the composite shear wall exhibits good performance. When the initial vertical stress level is too high, the bearing capacity can be further improved through batch-by-batch (multiple) replacement or steel-reinforced concrete strengthening replacement []. Through the analysis and research of the vertical bearing performance of composite shear wall components, it is concluded that the strength utilization coefficient of high-performance materials (high-strength concrete or steel sections) in the replacement area decreases with the increase in the initial vertical stress level. Additionally, a calculation formula for axial compressive bearing capacity with good predictive accuracy has been fitted []. Wang Xin et al. [] conducted experimental studies on the seismic performance of four scaled concrete shear walls (including two locally strengthened replacement shear walls—one specimen was replaced with modified concrete and one with high-strength concrete and two non-replacement shear walls—one “defective” and one originally designed). Although the study did not investigate the stress lag phenomenon of new materials in the replacement area, the experimental results showed that the material interface exhibits no significant effect on the structural response of the shear wall. This conclusion provides a reference for the current research. In practical engineering, most shear wall components requiring reinforcement (such as those in residential shear wall structures) are under relatively low vertical stress levels. This is especially true for shear wall components in under-construction projects where permanent and live loads have mostly not yet been applied. They generally exhibit a lower initial vertical stress level, or specifically, a lower axial compression ratio (e.g., the initial vertical stress levels of the shear walls in the reinforcement cases discussed in this paper are all below 0.3). Therefore, it is believed that the reinforcement method studied in this paper still has broad applicability. For shear wall components with higher initial vertical stress levels, measures such as batch-by-batch (multiple) replacement, local enhancement in non-replacement areas (e.g., adding “core columns” or “steel plate” bracing), and the use of new high-performance materials can further expand the application scope of this method. Thus, in-depth research on the mechanical performance and engineering application of unsupported locally strengthened replacement composite shear walls holds significant scientific and practical value.
In order to verify the operability and practicality of the unsupported local reinforcement replacement method, this paper begins with a study of individual components (as components are the fundamental units of a structure) and then extends to the overall structure (if the components are adequate and the joints are reasonable, the structure will be safe), progressing step by step. Based on the concept of partial strengthening and replacement composite shear walls without support roof and combined with engineering examples, an attempt is made to summarize the phased work of simulating, analyzing, and researching the load-bearing performance of this type of composite shear wall. This provides reference and guidance for related academic research and engineering applications of the unsupported replacement reinforcement method.
2. Analysis of Horizontal Hysteresis Performance of Partial Reinforced Replacement Composite Shear Walls Without Support Roof
2.1. Analysis Method and Case Study Verification
Due to its unique advantages, ABAQUS software is widely used by numerous scholars in simulating the horizontal hysteretic behavior of partially reinforced replacement composite shear walls without a support roof. In such simulations, the definition of concrete tensile and compressive plastic damage is primarily derived from the Code for Design of Concrete Structures (GB50010-2010) []; the constitutive model of steel reinforcement adopts a bilinear model; a rebar slip subroutine [] is introduced to simulate the bond–slip between steel reinforcement and concrete using the Clough reinforcement model. The construction sequence is simulated by setting up multiple analysis steps: in the initial step, vertical loads are applied and stabilized; in subsequent steps, the “Model Change” module is utilized to “deactivate” and “reactivate” elements in the replacement area of the shear wall segment, simulating the removal and re-pouring processes during construction. During the replacement process, the software automatically performs stress redistribution calculations based on the current stress state. Finally, cyclic displacements are applied via quasi-static analysis, and accurate force-displacement hysteresis curves are obtained by integrating the concrete damage plasticity model and the constitutive model of steel reinforcement. This enables a comprehensive evaluation of the structure’s energy dissipation capacity, strength, and stiffness degradation.
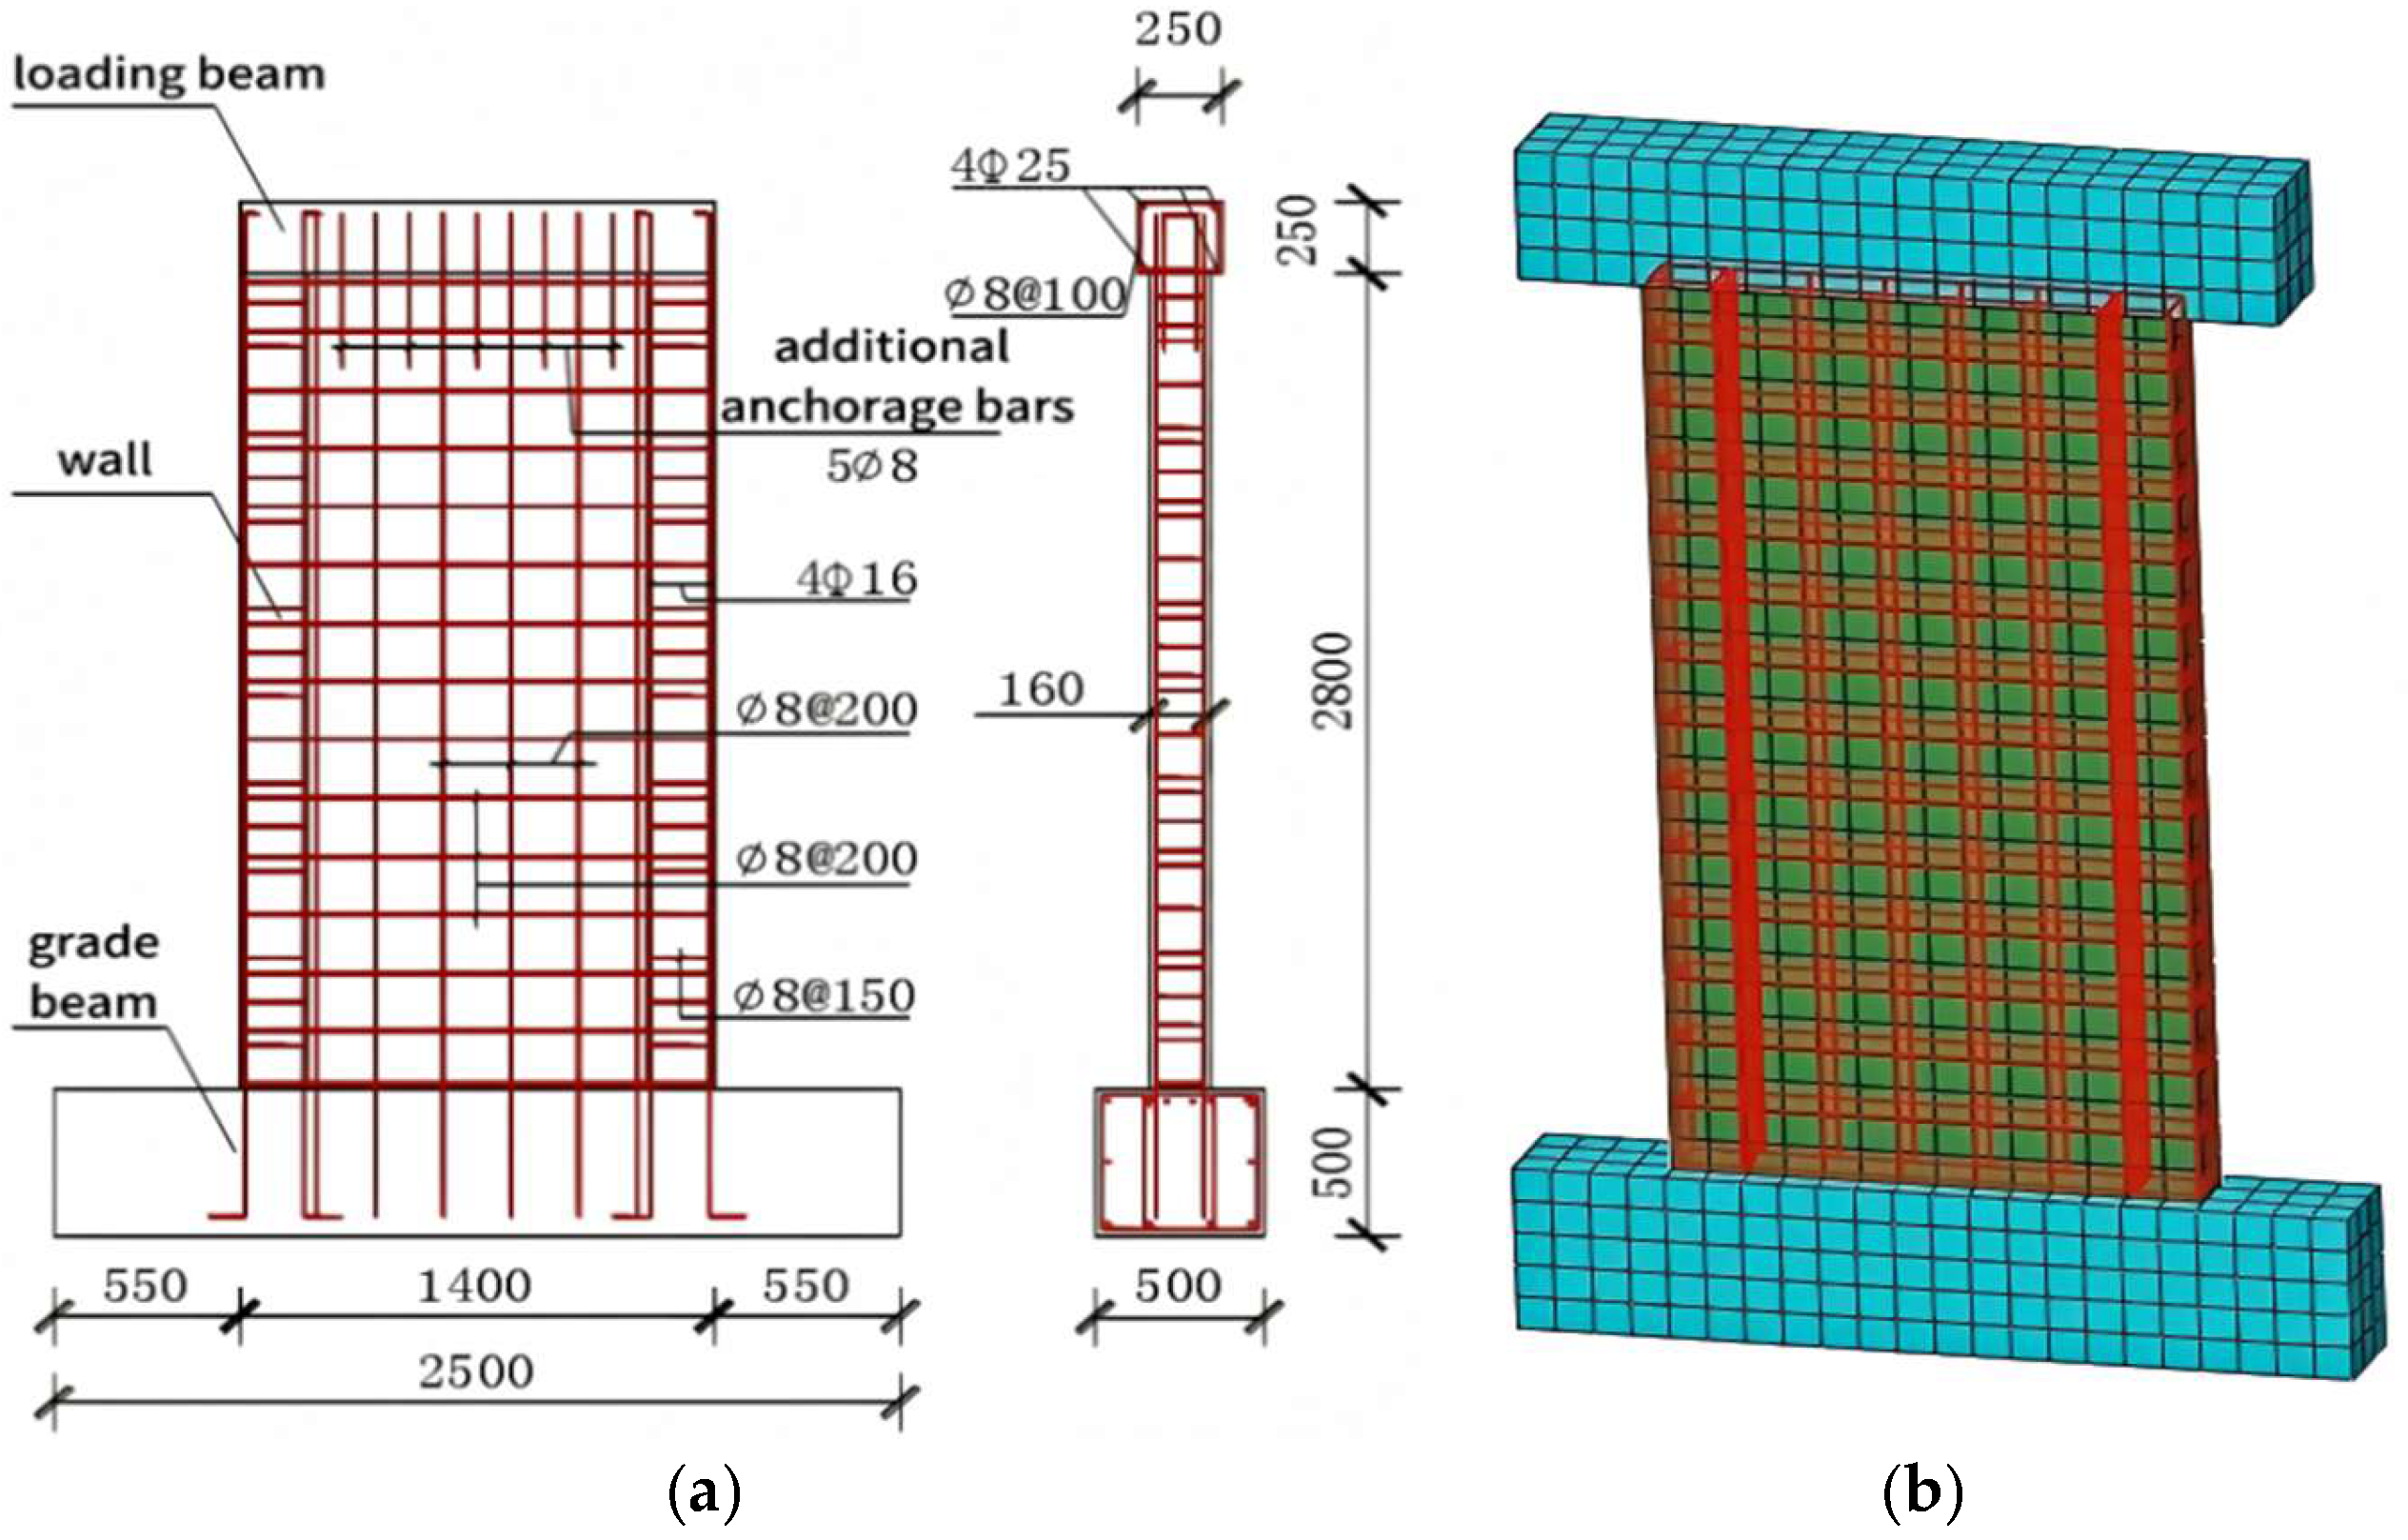
Using shear wall test data [] ABAQUS (Version 2020) was used to simulate and analyze the horizontal hysteresis performance. The simulation results were compared with the experimental results to verify the applicability and accuracy of the simulation analysis method. The model information is as follows: the cross-sectional size of the wall is 1400 mm × 160 mm, the wall height is 2800 mm, and it is equipped with a double-layer bidirectional spacing of 200 mm and a diameter of 8 mm HPB300 steel mesh. There are hidden columns at both ends with the same wall thickness and a width of 200 mm. The hidden columns are equipped with 4 HRB335 longitudinal steel bars with a diameter of 16 mm and HPB300 stirrups with a spacing of 150 mm and a diameter of 8 mm. The measured cube compressive strength is 43.1 MPa, the density is 2500 kg/m3, the elastic modulus is 3.15 × 10⁴ MPa, Poisson’s ratio is 0.2, the expansion angle is 30°, the flow potential offset value is 0.1, the ratio of biaxial ultimate compressive strength to uniaxial ultimate compressive strength is 0.667, the ratio of the second stress invariant of the tensile meridian plane and the compressive meridian plane is 1.116, and the viscosity coefficient is 0.001. The steel bar density is 7.85 g/cm3, the elastic modulus is 2 × 10⁵ MPa, Poisson’s ratio is 0.3, the measured yield stress of HPB300 steel bar is 398.14 MPa, and the ultimate stress is 475.27 MPa. The measured yield stress of HRB335 steel bar is 503.9 MPa, and the ultimate stress is 603 MPa. Set a grade beam at the lower end and a loading beam at the upper end to simulate their constraint methods (lower end consolidation, upper end cantilever). The reinforcement configuration of the wall and the mesh and finite element mesh division of the reinforcement are shown in Figure 1.
Figure 1.
(a) Wall reinforcement diagram; (b) wall grid division and steel mesh distribution.
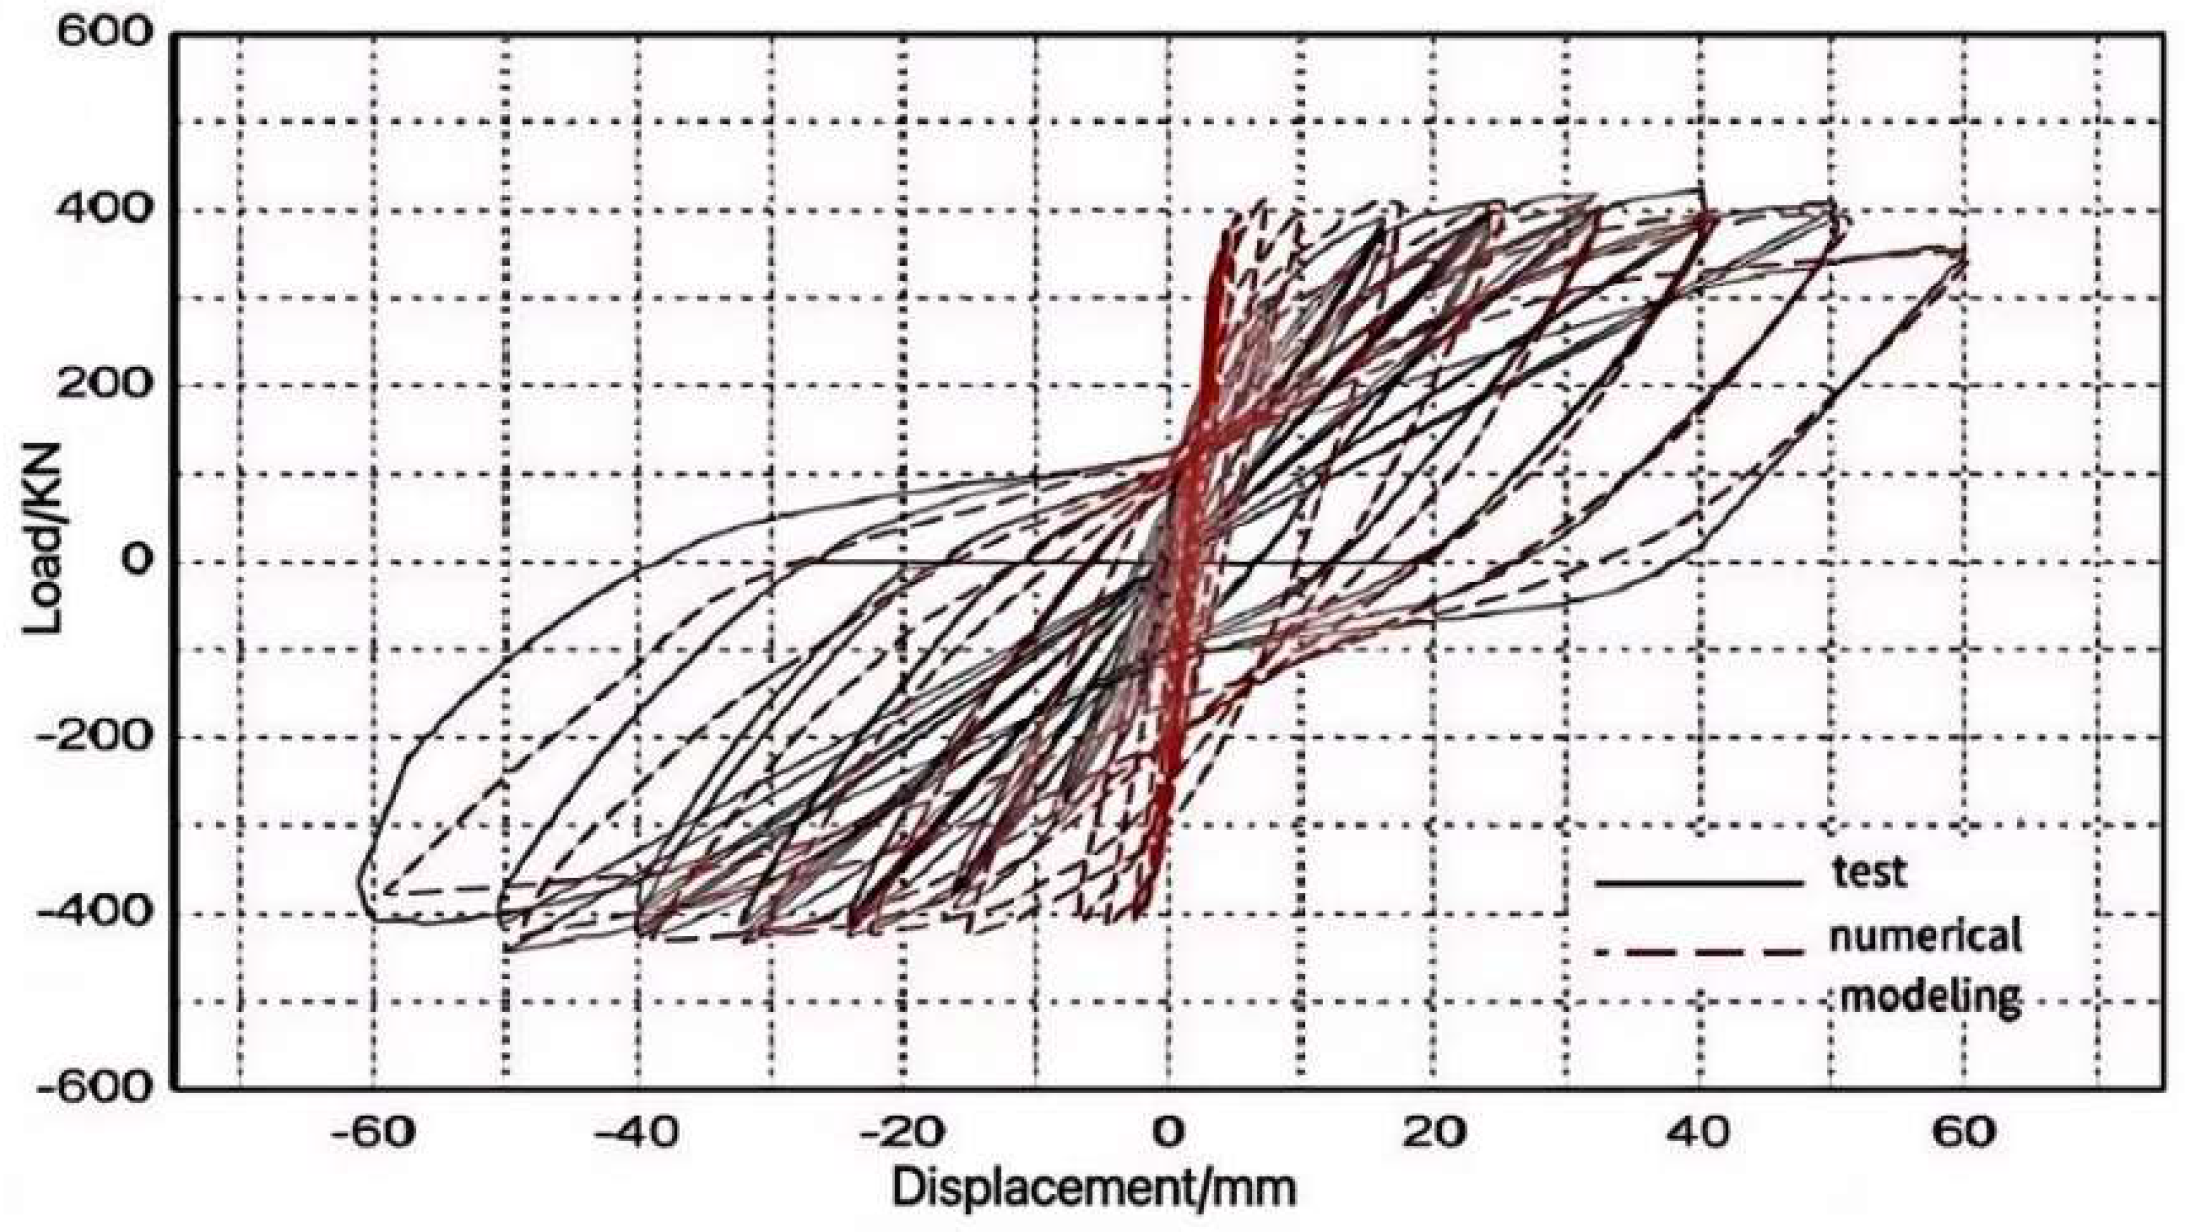
The axial compression ratio in this example is 0.15, and a vertical pressure of 650 kN is applied at one time. To ensure the convergence of numerical analysis, the horizontal load in the example is only loaded through displacement control (only loaded according to the displacement control section of the original experiment; the displacement loading system is used in the horizontal direction at 1 mm, 2 mm, 3 mm, 4 mm, 6 mm, 8 mm, 16 mm, 24 mm, 32 mm, 40 mm, 50 mm, and 60 mm, in sequence, with 16 mm, 24 mm, 32 mm, and 40 mm for each level of load cycling, twice). The simulated hysteresis curve is shown in Figure 2. As shown in the figure, the peak load of the finite element simulation curve of the RC shear wall is close to the experimental curve []. The yield load of the hysteresis curve calculated via the Park method [], as shown in Table 1. Comparing the yield load and peak load in the table, it can be seen that the error observed between the load simulated using the finite element software package and the experimental results is relatively small, especially in the peak load stage, which is very close to the experimental results. The introduction of the steel slip subroutine considers the slip between the internal steel bars and concrete, thereby “pinching” the hysteresis curve. Due to the higher initial stiffness of the component compared to the test, the hysteresis loop is relatively full, but the yield load error does not exceed 11.4%, and the peak load error is controlled to within 5%. From the above, it can be concluded that the simulation method proposed in this article is feasible and accurate.
Figure 2.
Comparison of load– displacement hysteresis curves.
Table 1.
Comparison of loads between experiments and numerical simulations.
2.2. Analysis Model
To further investigate the influence of various factors on the horizontal hysteretic performance of the partially reinforced replacement composite shear walls without a support roof, the finite element software ABAQUS was employed to simulate the entire construction process of the aforementioned shear wall using the high-strength concrete unsupported local strengthening replacement method. Specifically, the study considered factors such as different initial vertical stress levels, the defect grade of the original concrete strength before replacement, the strength grade of the replacement concrete, and the replacement area on both sides, to analyze their impact on the strengthening performance of the shear wall. Based on the principle of orthogonal experimental design, a test matrix with four parameters and three levels was developed to determine the number of simulated component groups. Due to space limitations, five representative components were selected for detailed analysis. The analysis model used in this chapter is shown in Table 2. The dimensions, reinforcement parameters, and other software settings of the shear wall model are the same as those in the aforementioned example, fc is the axial compressive strength of concrete, A is the cross-sectional area of the shear wall, and displacement loading system is adopted in the horizontal direction: 6 mm, 16 mm, 24 mm, 32 mm, 40 mm, and 50 mm are sequentially loaded and cycled once, respectively. The sequential nature of the replacement process leads to a phenomenon where sections replaced in earlier phases exhibit a lag in stress accumulation under subsequent loading when compared to the non-replaced sections. This “stress lag” effect is faithfully replicated in ABAQUS through its precise archival of the stress and deformation history at every step of the analysis.
Table 2.
Basic model information.
2.3. Analysis of Destruction Process and Mechanism
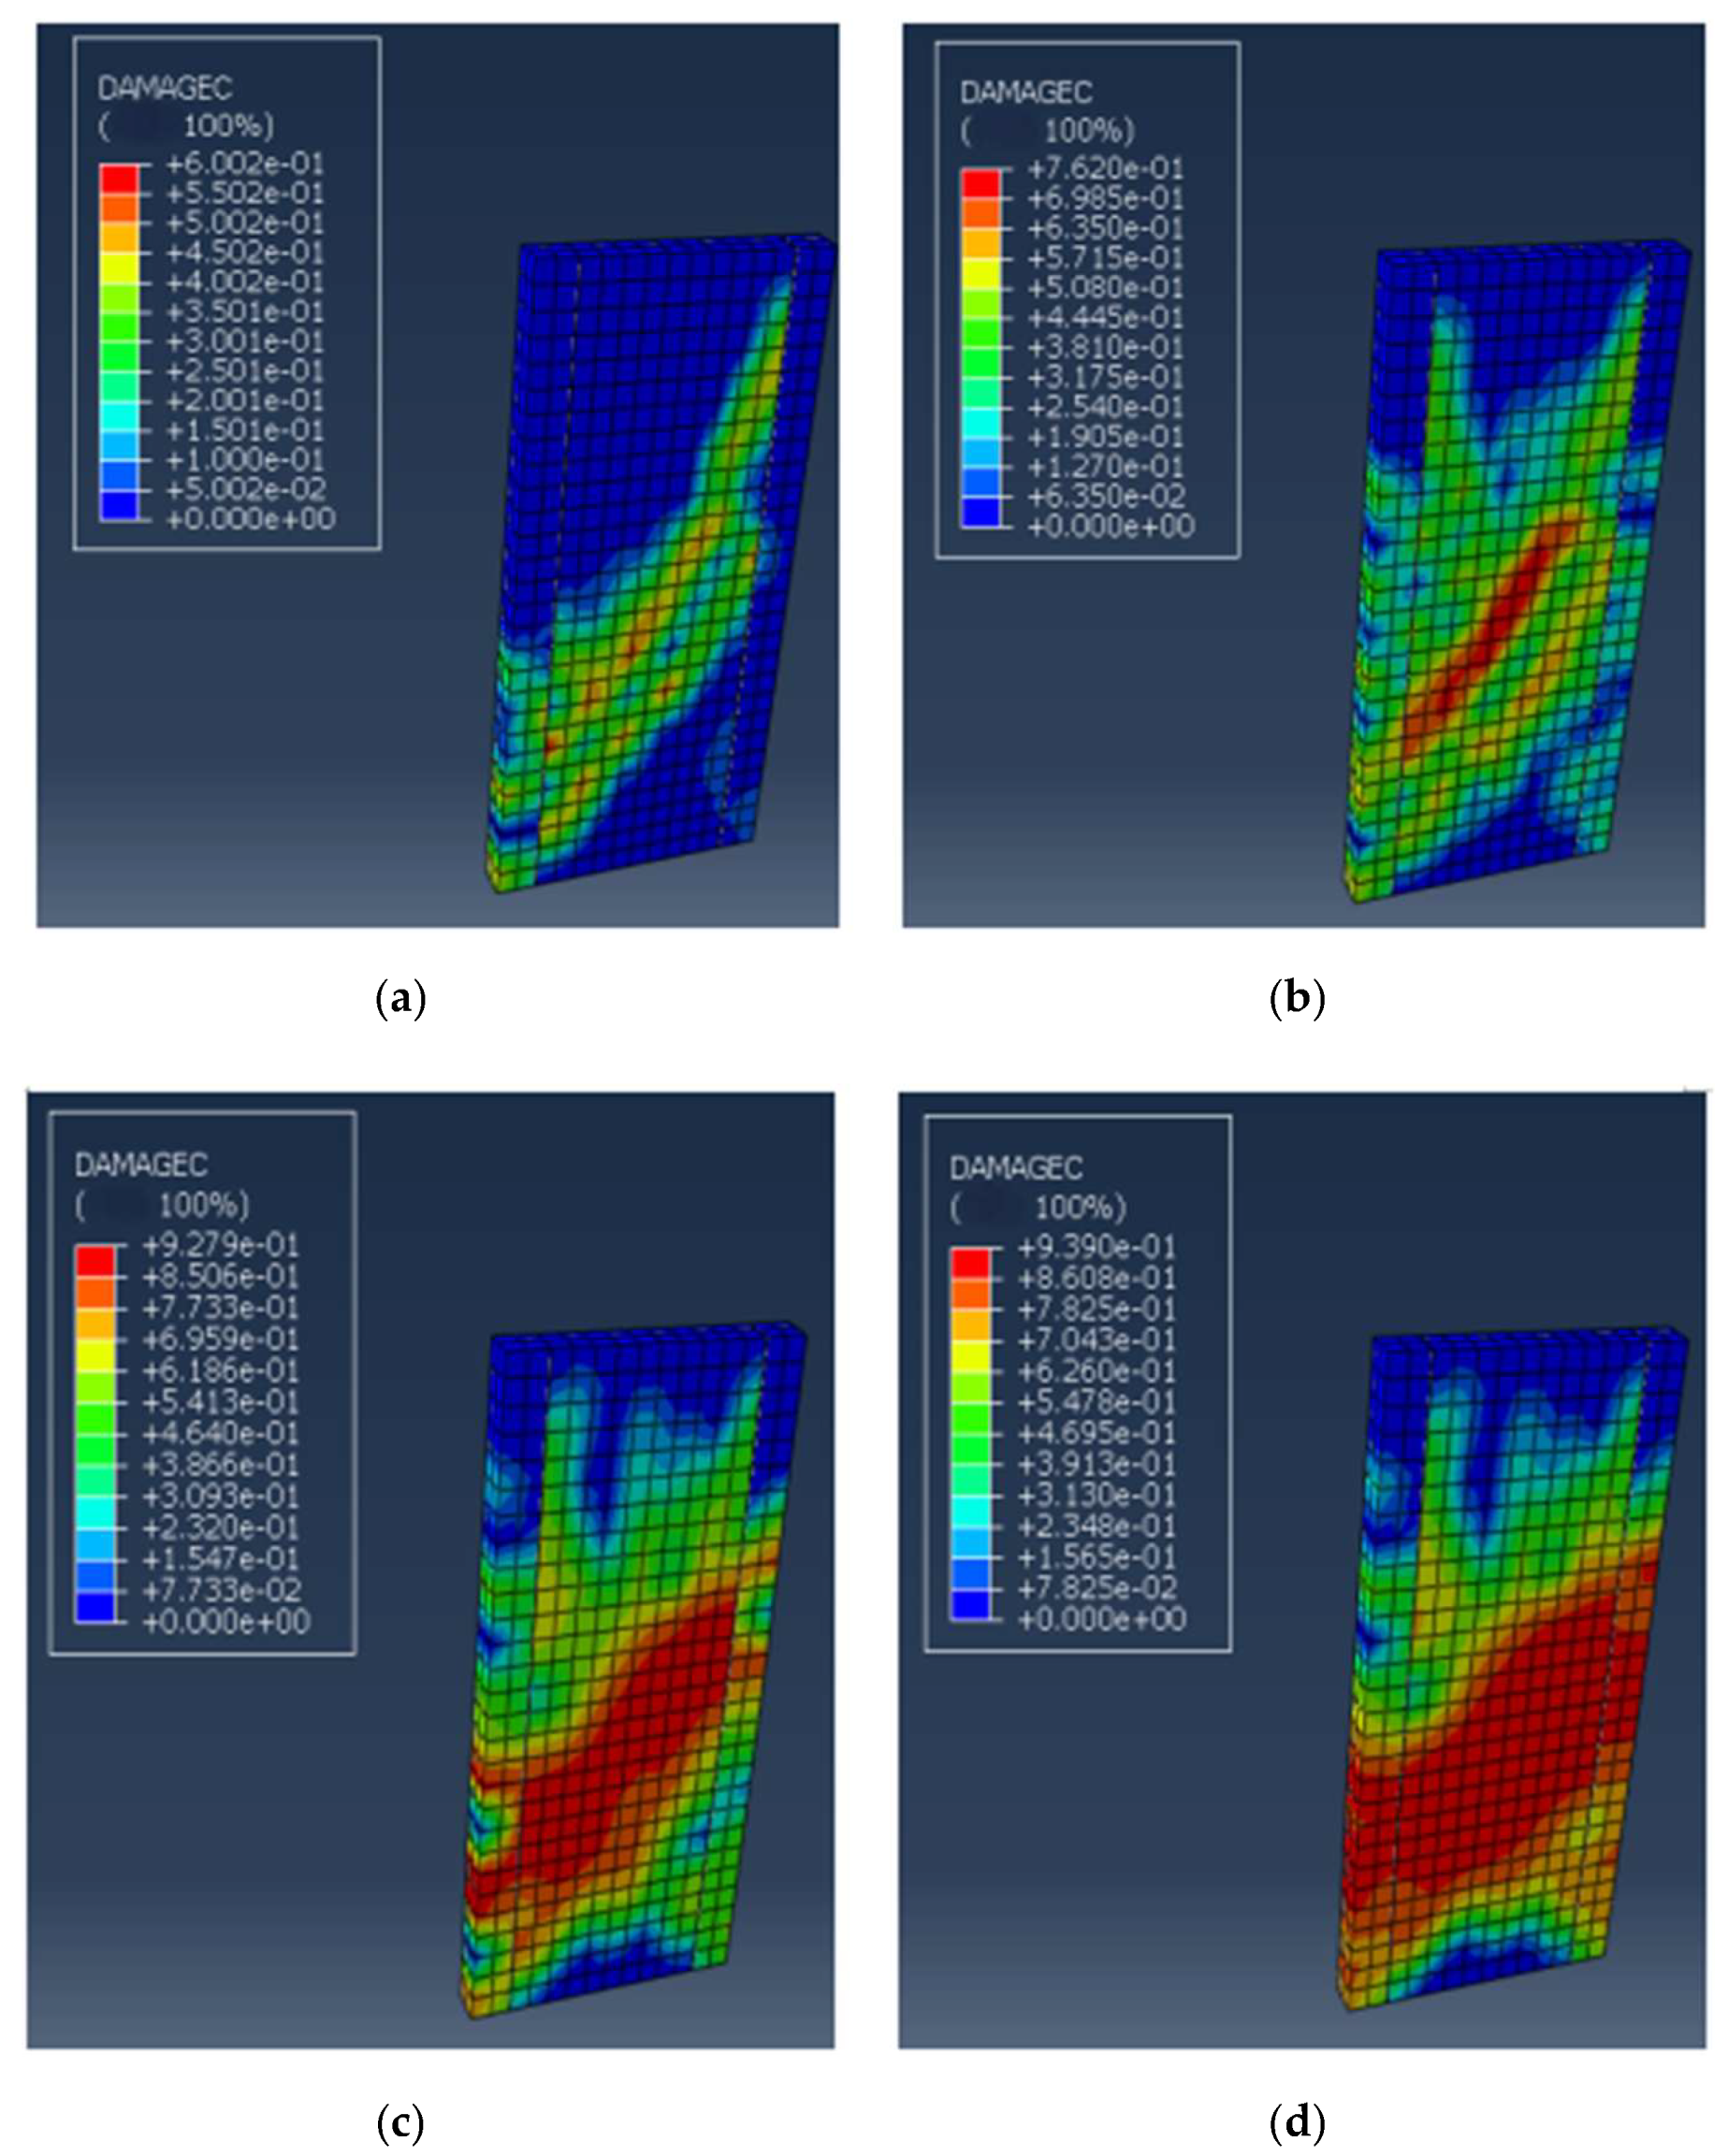
Taking the higher initial vertical stress model as an example, under a one-time 0.45 * fc A initial vertical load (stress, fc, is the axial compressive strength of the original defective concrete) and gradually applied horizontal displacement, the compression damage distribution cloud map of the composite shear wall (model ZH1) after local reinforcement replacement was obtained (see Figure 3) through software hysteresis simulation. Figure 3 shows the first damaged area is the defective concrete in the middle non-replacement area; as the horizontal displacement increases, the defect concrete damage in the central non-replacement area develops; as the horizontal displacement further increases, damage to the concrete begins to appear in the replacement area (the tension side is slightly more severe than the compression side), and the damage range of the concrete in the non-replacement area expands; when reaching the limit state, the composite shear wall comprising the replacement and non-replacement areas fails as a whole and exits work.
Figure 3.
(a) Damage to the central wall that has not been replaced has occurred; (b) further development of damage to the central wall without replacement; (c) the concrete in the replacement area on one side has been crushed; (d) wall exits work due to damage.
Under the initial vertical load (stress) of the original shear wall, after local strengthening and replacement at both ends, the concrete in the non-replacement area of the middle part increases its vertical stress due to bearing the load unloaded from the replacement areas at both ends, while the concrete in the replacement areas at both ends is still in a zero vertical stress state (ignoring the influence of micro expansion effects). This is the “vertical stress hysteresis phenomenon” that exists in the cross-section of the locally strengthened replacement composite shear wall. The higher the initial vertical stress level of the original shear wall, the greater the stress hysteresis effect of locally reinforced replacement composite shear walls. Under the influence of horizontal displacement, the composite shear wall composed of reinforced concrete in the replacement area and non-replacement area (interface treated with chiseling or teeth, horizontally distributed reinforcement, and micro expansion effect of high-strength concrete in the end replacement area) is strengthened for synergistic resistance. When the horizontal displacement is small, the concrete in the non-replacement area is prone to enter the elastic–plastic stage earlier due to the presence of initial vertical stress, and is easily damaged due to its low strength. As the horizontal displacement increases, due to the high strength of the concrete in the end replacement area and the low vertical stress level, its large elastic stiffness and good mechanical properties form a strong “frame constraint” on the concrete in the non-replacement area, forming an “internal force redistribution effect” of shear wall collaborative resistance. As the horizontal displacement further increases, the concrete in the end replacement area is located in either the tension or compression area of the eccentrically compressed composite shear wall component (with alternating tension and compression areas during horizontal hysteresis), playing an important bearing role. Its material stiffness also gradually deteriorates with the increase in horizontal displacement. However, compared with the concrete in the non-replacement area, the stiffness degradation degree of the concrete in the end replacement area is much lower due to its high strength and low initial vertical stress. At this time, the resistance mechanism of the composite shear wall can be compared to the “vertical cantilever truss” mechanical model, the reinforced concrete in the two replacement areas plays a role as tension and compression chord members, and the reinforced concrete in the upper undamaged area (including the non-replacement area and replacement area) and the top crossbeam form the top horizontal abdominal member of the cantilever truss. The lower part of the replacement area (with the damaged area) can be considered a double diagonal compression web member of a cantilever truss (intersecting in two directions). When the ultimate displacement is reached, the reinforced replacement area at the end (tension and compression chord members) will experience tensile or compressive failure (steel bars yielding under tension or compression, concrete crushing), while the concrete in the non-replacement area (truss double diagonal web members) will reach the ultimate deformation state.
2.4. Load-Bearing Performance Analysis
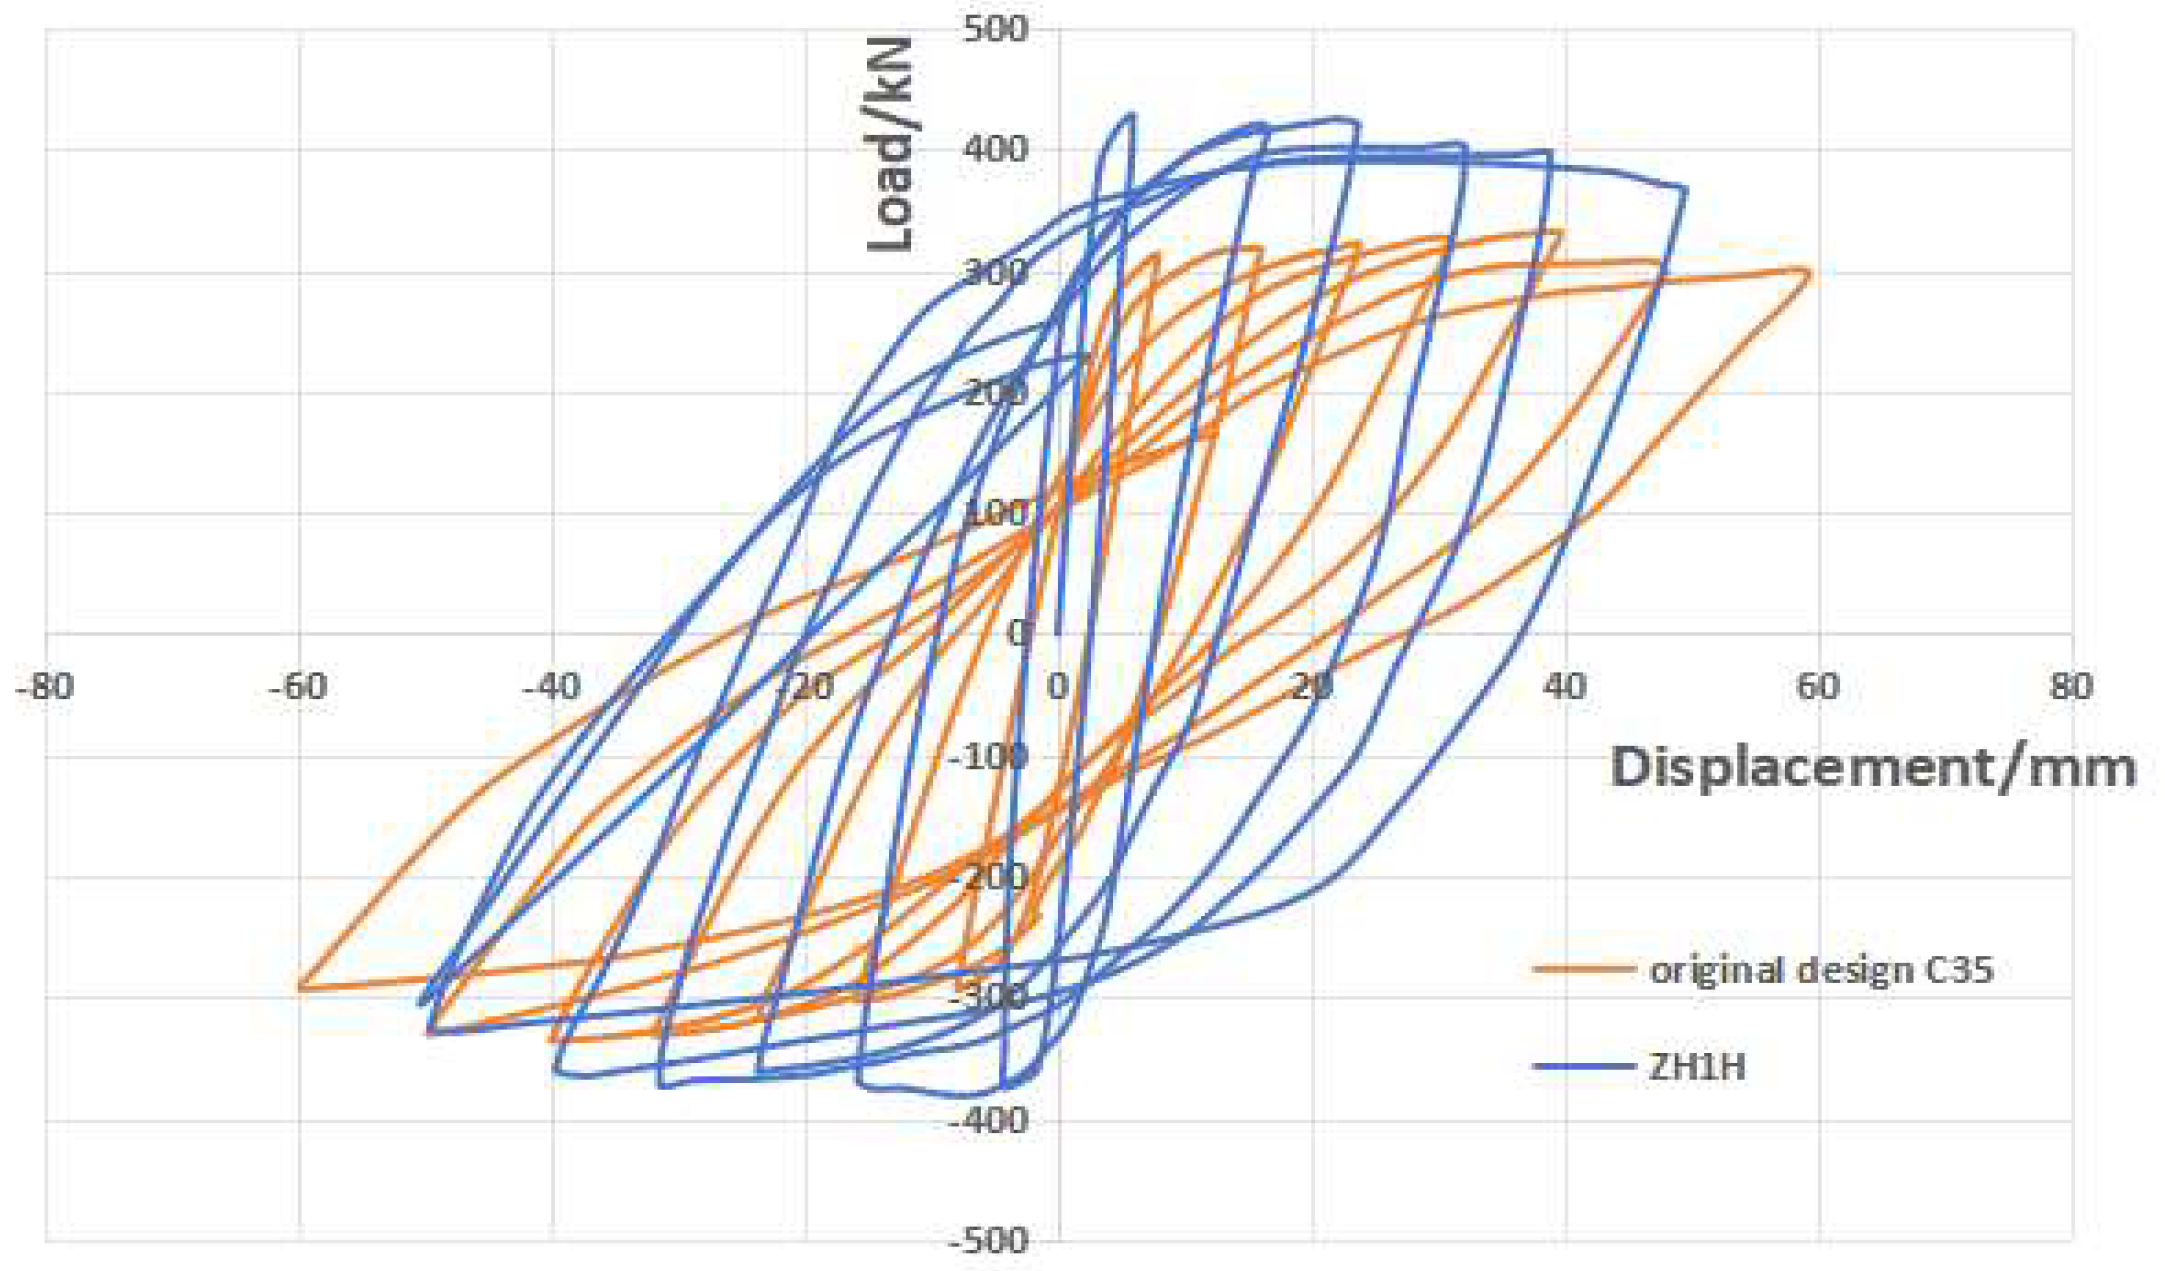
Figure 4 shows the hysteresis curve of ZH1H and the original design defect-free shear wall (concrete strength grade C35). The figure shows that by using steel-reinforced concrete for local replacement reinforcement of shear walls, the stiffness of the component model is significantly increased, the ultimate bearing capacity is improved, the hysteresis loop is fuller, and the ductility of the component is significantly improved.
Figure 4.
Horizontal displacement reflection diagram of ZH1H and the original design defect-free shear wall.
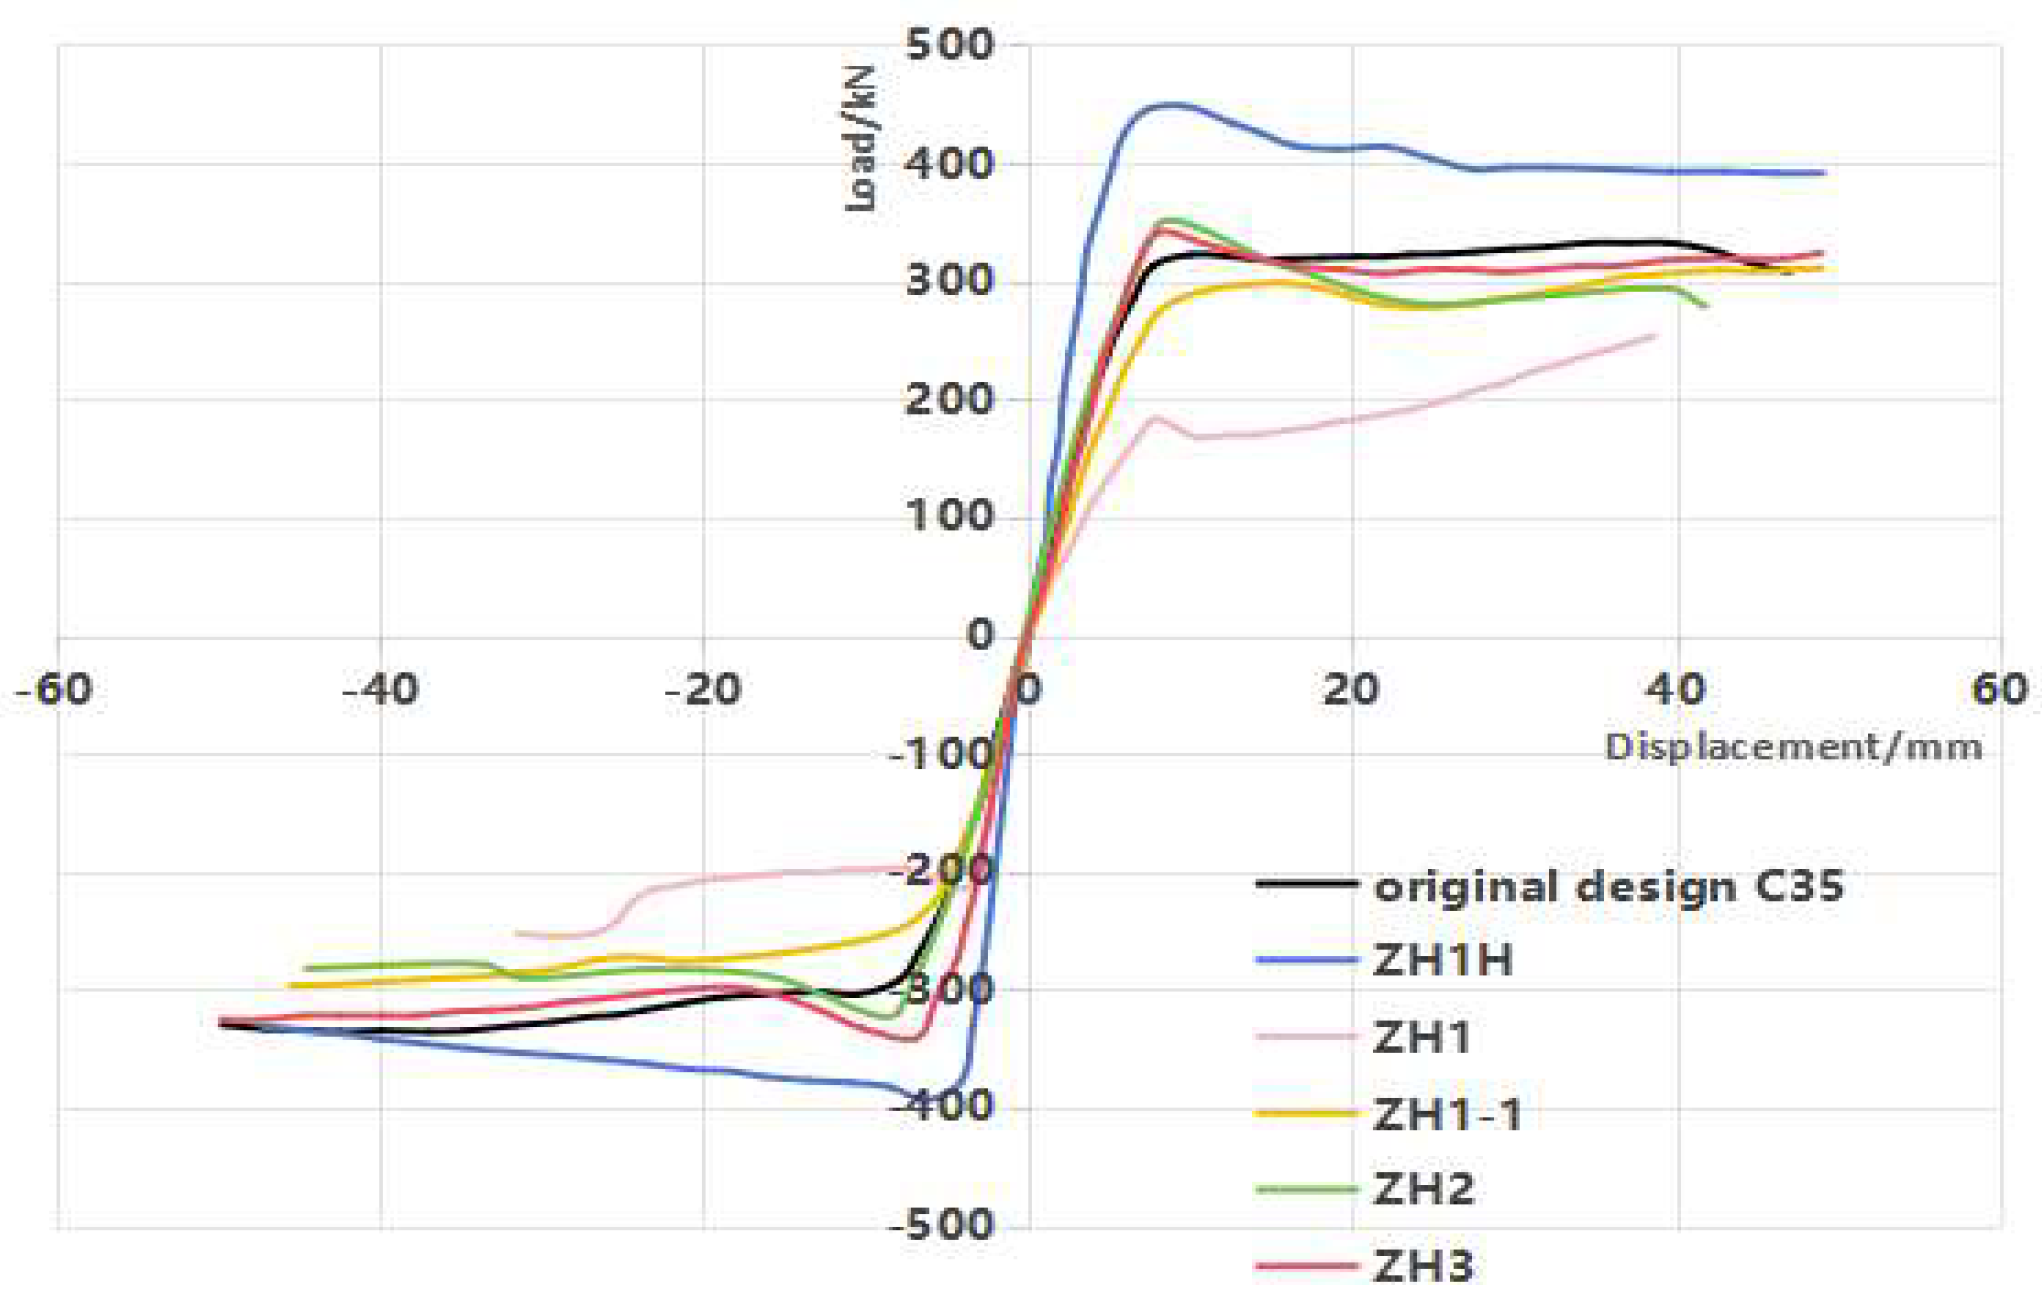
The extraction of the skeleton curves ZH1H, ZH1, ZH1-1, ZH2, and ZH3 and the original defect-free shear wall curve (concrete strength grade C35) is shown in Figure 5:
Figure 5.
Skeleton curves of ZH1H, ZH1, ZH1-1, ZH2, and ZH3 and the original design C35 shear wall.
- (1)
- The skeleton curve of the strengthened replacement composite shear wall model often exhibits a characteristic of initial peak degradation followed by subsequent enhancement. Analysis suggests that this results from the delayed vertical stress effect in the end replacement areas, which gradually becomes active as the non-replacement areas experience stiffness degradation due to the initial vertical stress. From the above figure, it can also be seen that the higher the initial vertical stress level of the model, the greater the amplitude of the skeleton curve’s decrease after passing the peak value and then increasing again. The original design of the shear wall model did not have stress hysteresis, while the end section of the section steel/concrete-reinforced composite shear wall had a relatively high stiffness in the section steel/concrete area, so the characteristic of the skeleton curve of the first two decreasing and then increasing was not obvious.
- (2)
- Comparing the skeleton curves of ZH1, ZH2, ZH3 and the original design C35 shear wall, note that the higher the initial vertical stress level, the lower the ultimate bearing capacity (the highest value of the skeleton curve) of the locally reinforced replacement composite shear wall. This indicates that when the initial vertical stress level is too high, the reinforced composite shear wall will be affected by premature stiffness degradation and the damage to the concrete in the non-replacement area, which will affect the overall reinforcement effect (ZH1).
- (3)
- Comparing the skeleton curves of ZH1 and ZH1H, it can be seen that the use of unsupported local section steel–concrete reinforcement and replacement method not only increases the initial stiffness of the wall, but also maintains high ductility and a relatively full hysteresis loop after reaching the peak bearing capacity. The minimum peak horizontal bearing capacity of composite shear walls is not less than 422 kN, which is greater than the peak horizontal load of defective concrete at 242 kN, and also greater than the original design’s concrete strength of C35 at 327 kN. It can be seen therefore that the reinforcement of RC shear walls via unsupported-roof steel-reinforced concrete local strengthening and replacement can significantly improve the bearing performance of composite shear walls and the collaborative working performance between replacement and non-replacement areas by increasing the bearing capacity on both sides of the end to achieve the ability of composite shear walls to continue bearing even after the concrete damage and softening in the non-replacement area.
- (4)
- Comparing the skeleton curves of ZH1 and ZH1-1, after using batch replacement reinforcement, the vertical stress of the concrete in the middle non-replacement area of ZH1-1 is reduced, which delays the compressive failure of the middle non-replacement concrete. The concrete that was replaced earlier mitigated the stress, reducing the vertical stress on the walls in the non-replacement area and providing stress support for the stress redistribution during the second batch of replacement concrete. At this point, the horizontal ultimate bearing capacity of the specimen is 309 kN, which is 37.6% higher than that of ZH1. In summary, the partial strengthening replacement method without support roof in batches reduces the vertical stress of the middle concrete by increasing the number of replacement and ensuring that the replacement wall participates in the stress, avoiding premature damage and degradation of the concrete in the middle non-replacement area due to excessive vertical stress, and effectively improving the horizontal bearing capacity of the composite shear wall.
3. Vertical Bearing Performance Analysis of Partial Reinforced Replacement Composite Shear Walls Without Support Roof
3.1. Analysis Method and Case Study Verification
To better investigate the vertical bearing capacity of partial reinforced replacement composite shear walls without a support roof, and to ensure consistency between the numerical examples in this study and the programs used for subsequent simulation analysis of engineering cases, the VFEAP—which enables highly efficient analysis of large-scale structural models through a three-dimensional degenerated virtual laminated element approach—is employed in this paper. This choice addresses the limitation of ABAQUS finite element software, which, while offering high mesh refinement when modeling with solid elements, demonstrates relatively low computational efficiency in simulating entire large-scale engineering structures. Using VFEAP (Version 2020), simulations are conducted on the vertical bearing behavior and practical engineering applications of the composite shear walls, with comprehensive consideration given to both component behavior and the full construction process (For validation, both ABAQUS (Version 2020) and VFEAP (Version 2020) were used to simulate the example presented in this study, and the results from the two programs showed close agreement. However, due to space limitations, only the detailed analysis results from the foundation–soil VFEAP are described herein.).
Due to the limited experimental research on the vertical bearing performance of partial reinforced replacement composite shear walls without support roof, factors such as stress redistribution, stress hysteresis between replacement areas (including multiple batches of replacement) and non-replacement areas, synergy between high-performance materials and ordinary concrete, constraint effects of high-performance materials on ordinary concrete, and overall integrity of new and old interfaces between replacement and non-replacement areas during the local replacement process are under-explored. This section, therefore, simulates the vertical bearing performance of reinforced frame columns using the enlarged section method by using the three-dimensional solid degradation virtual laminated element finite analysis program (VFEAP). The simulation results are compared with the experimental results [] to verify the applicability and accuracy of the program. The theory and program of three-dimensional solid degradation virtual laminated element finite analysis can simultaneously consider the material nonlinearity and geometric nonlinearity of the structure. Regarding geometric nonlinearity, the T.L method [] is used to analyze the ultimate bearing capacity of the structure; regarding material nonlinearity, the constitutive model used for concrete materials is Ohtani and Chen’s multi-axis reinforced plastic model []. The crack model of concrete adopts an orthogonal distribution model; the failure criteria for concrete are defined by Ohtani and Chen’s three-parameter reinforced plastic model, which requires the concrete to reach its ultimate strain value. If the concrete is in three-dimensional cracking, it is considered to have failed. The shape and displacement of each section of steel reinforcement in the unit are described using a three-node one-dimensional equal-parameter element; the load is applied using the “stiffness parameter method of this step” []; and the nonlinear equation system is solved using the incremental solution method of mN-R iteration [].
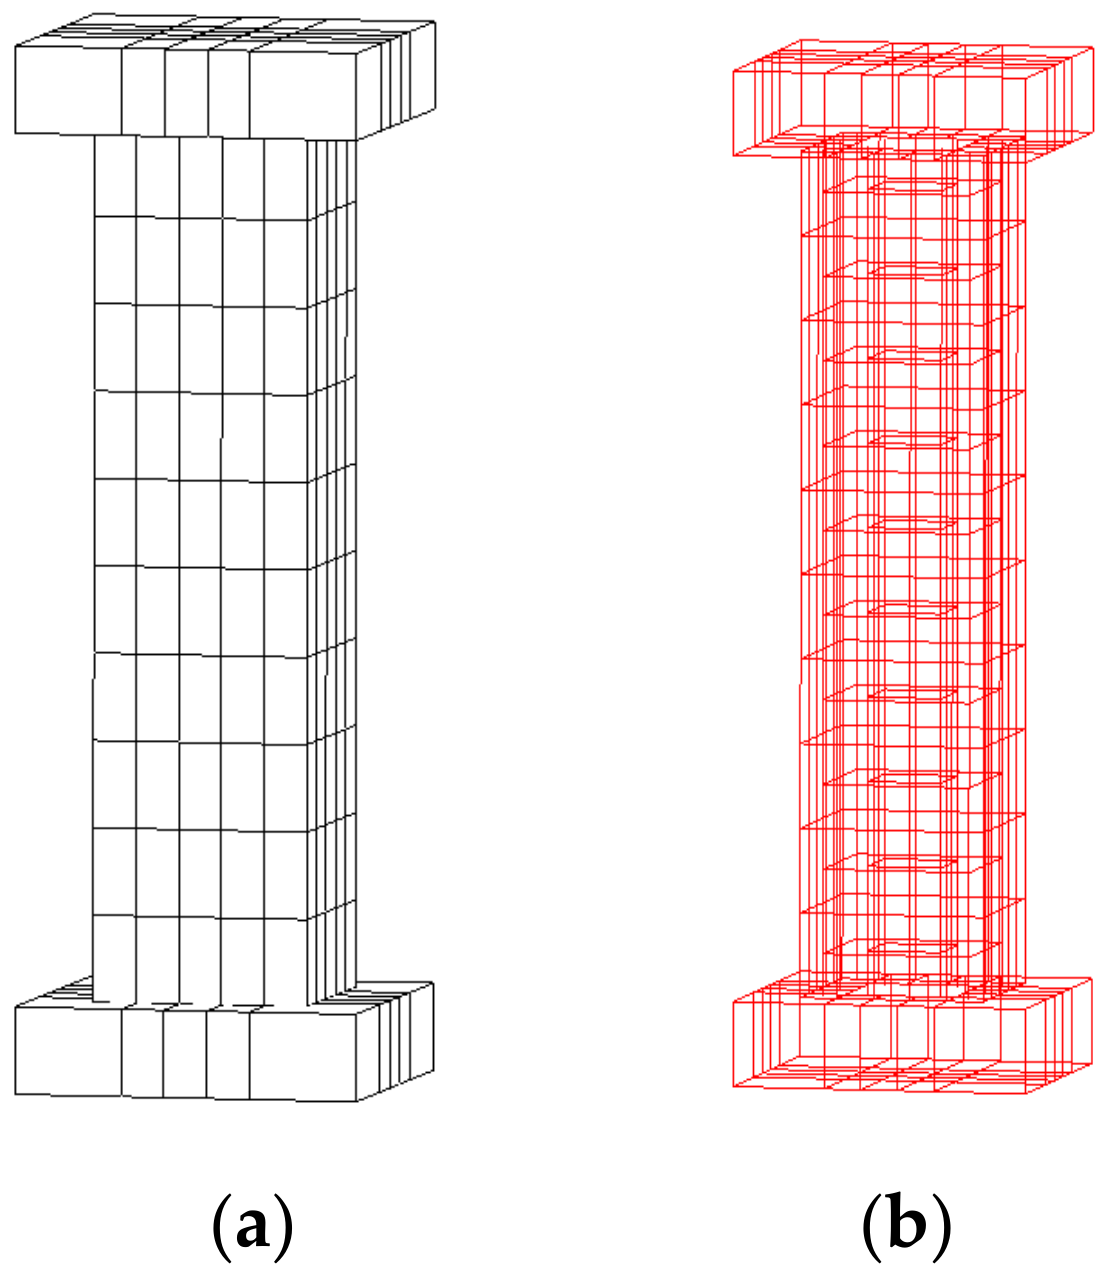
Due to the lack of data on replacement reinforcement tests considering stress hysteresis, this article compares the experimental results of reinforced RC columns using the increased cross-section method []. The strength grade of the original column concrete is C20, the longitudinal reinforcement ratio of the original column is 1.53% (four corner bars with a diameter of 14 mm), the hoop ratio is 0.301% (hoop spacing of 150 mm, diameter of 6 mm), the column section size is 200 mm × 200 mm, and the loading form is one-time force (no external load applied). The newly reinforced concrete has a thickness of 60 mm, and the cross-sectional size after reinforcement is 320 mm × 320 mm. The strength grade of the reinforced concrete is C35. Four steel bars with a diameter of 12 mm and stirrups with a diameter of 6 mm and a spacing of 150 mm are added for reinforcement. The loading method is secondary force (after the maintenance is completed, a prestressing force of 341.2 kN is applied through non-bonded external prestressing using prestressed steel strands). To prevent stress concentration at the bottom of the concrete components in the early stage and then terminate the calculation, rigid pads are established at both ends of the column for force transmission. The finite element division is shown in Figure 6 below:
Figure 6.
(a) Concrete and support unit; (b) reinforcement unit.
Through simulation analysis of the experimental model, it was found that the failure process and deformation of the finite element simulation were basically consistent with the experimental process. Compare the finite element analysis results with the experimental results (Figure 7): the ultimate axial compressive bearing capacity of the specimen before reinforcement in finite element simulation is 1175 kN, and the experimental value is 1241 kN, with a difference of 5.3% between the two; the ultimate value of the axial compressive bearing capacity of the reinforced specimen in finite element simulation is 3684 kN, while the test value is 3795 kN, with a difference of 3.01% between the two. From this, the finite element analysis program (VFEAP) for three-dimensional solid degradation virtual laminated elements is thus feasible for simulating and analyzing the vertical bearing performance of reinforced components while considering stress hysteresis.
Figure 7.
The N-εc relationship curve between the original column of the reinforced specimen and the newly added concrete.
3.2. Analysis Model
Considering that the proposed reinforced shear walls are vertically connected to the shear walls of the upper and lower floors, and are also cast-in-place as a whole with the beams and slabs of the upper and lower floors, to simplify the analysis, the initial vertical stress of each wall limb section of the building structure under vertical load is calculated approximately according to a uniform distribution. Considering the overall integrity of the building structure and the embedded effect of shear walls and cast-in-place floor slabs on the upper and lower floors, in the process of implementing local strengthening replacement (demolition–pouring–hardening) in sections (batches) of a certain wall limb, the vertical load originally shared by each section of the wall limb is redistributed to the new remaining section that the wall limb can bear (including non-replacement sections and hardened sections replaced in previous batches), considering the “vertical eccentricity effect” of multi-batch replacement of wall limb sections (when dismantling wall limb sections, the stress experienced by the dismantling section before dismantling will be transmitted to the remaining wall limbs, resulting in load eccentricity), the vertical stress of each section of the wall limb is calculated in batches according to the replacement order. Values are accumulated to analyze the stress hysteresis phenomenon of the cross-section.
To further investigate the influence of different factors on the vertical bearing capacity of partial strengthening and replacement composite shear walls without a support roof, the finite element analysis program VFEAP was employed to simulate the entire construction process of strengthening an L-shaped shear wall using the unsupported multi-stage local replacement method []. The study considered factors such as different initial vertical stress levels and the strength grade of the replacement concrete to analyze their effects on the strengthening performance of the shear wall. Comparative analysis of the results revealed that under the same initial stress level, higher concrete strength in the replacement material led to a greater ultimate load capacity of the shear wall, while lower concrete strength resulted in a smaller ultimate load capacity. Similarly, under the same replacement concrete strength, a lower initial stress level corresponded to a higher ultimate load capacity, whereas a higher initial stress level led to a lower ultimate load capacity. Due to space limitations, this chapter will focus solely on a detailed discussion of the influence of different initial vertical stress levels on the vertical bearing capacity of partial-strengthening and replacement composite shear walls without a support roof.
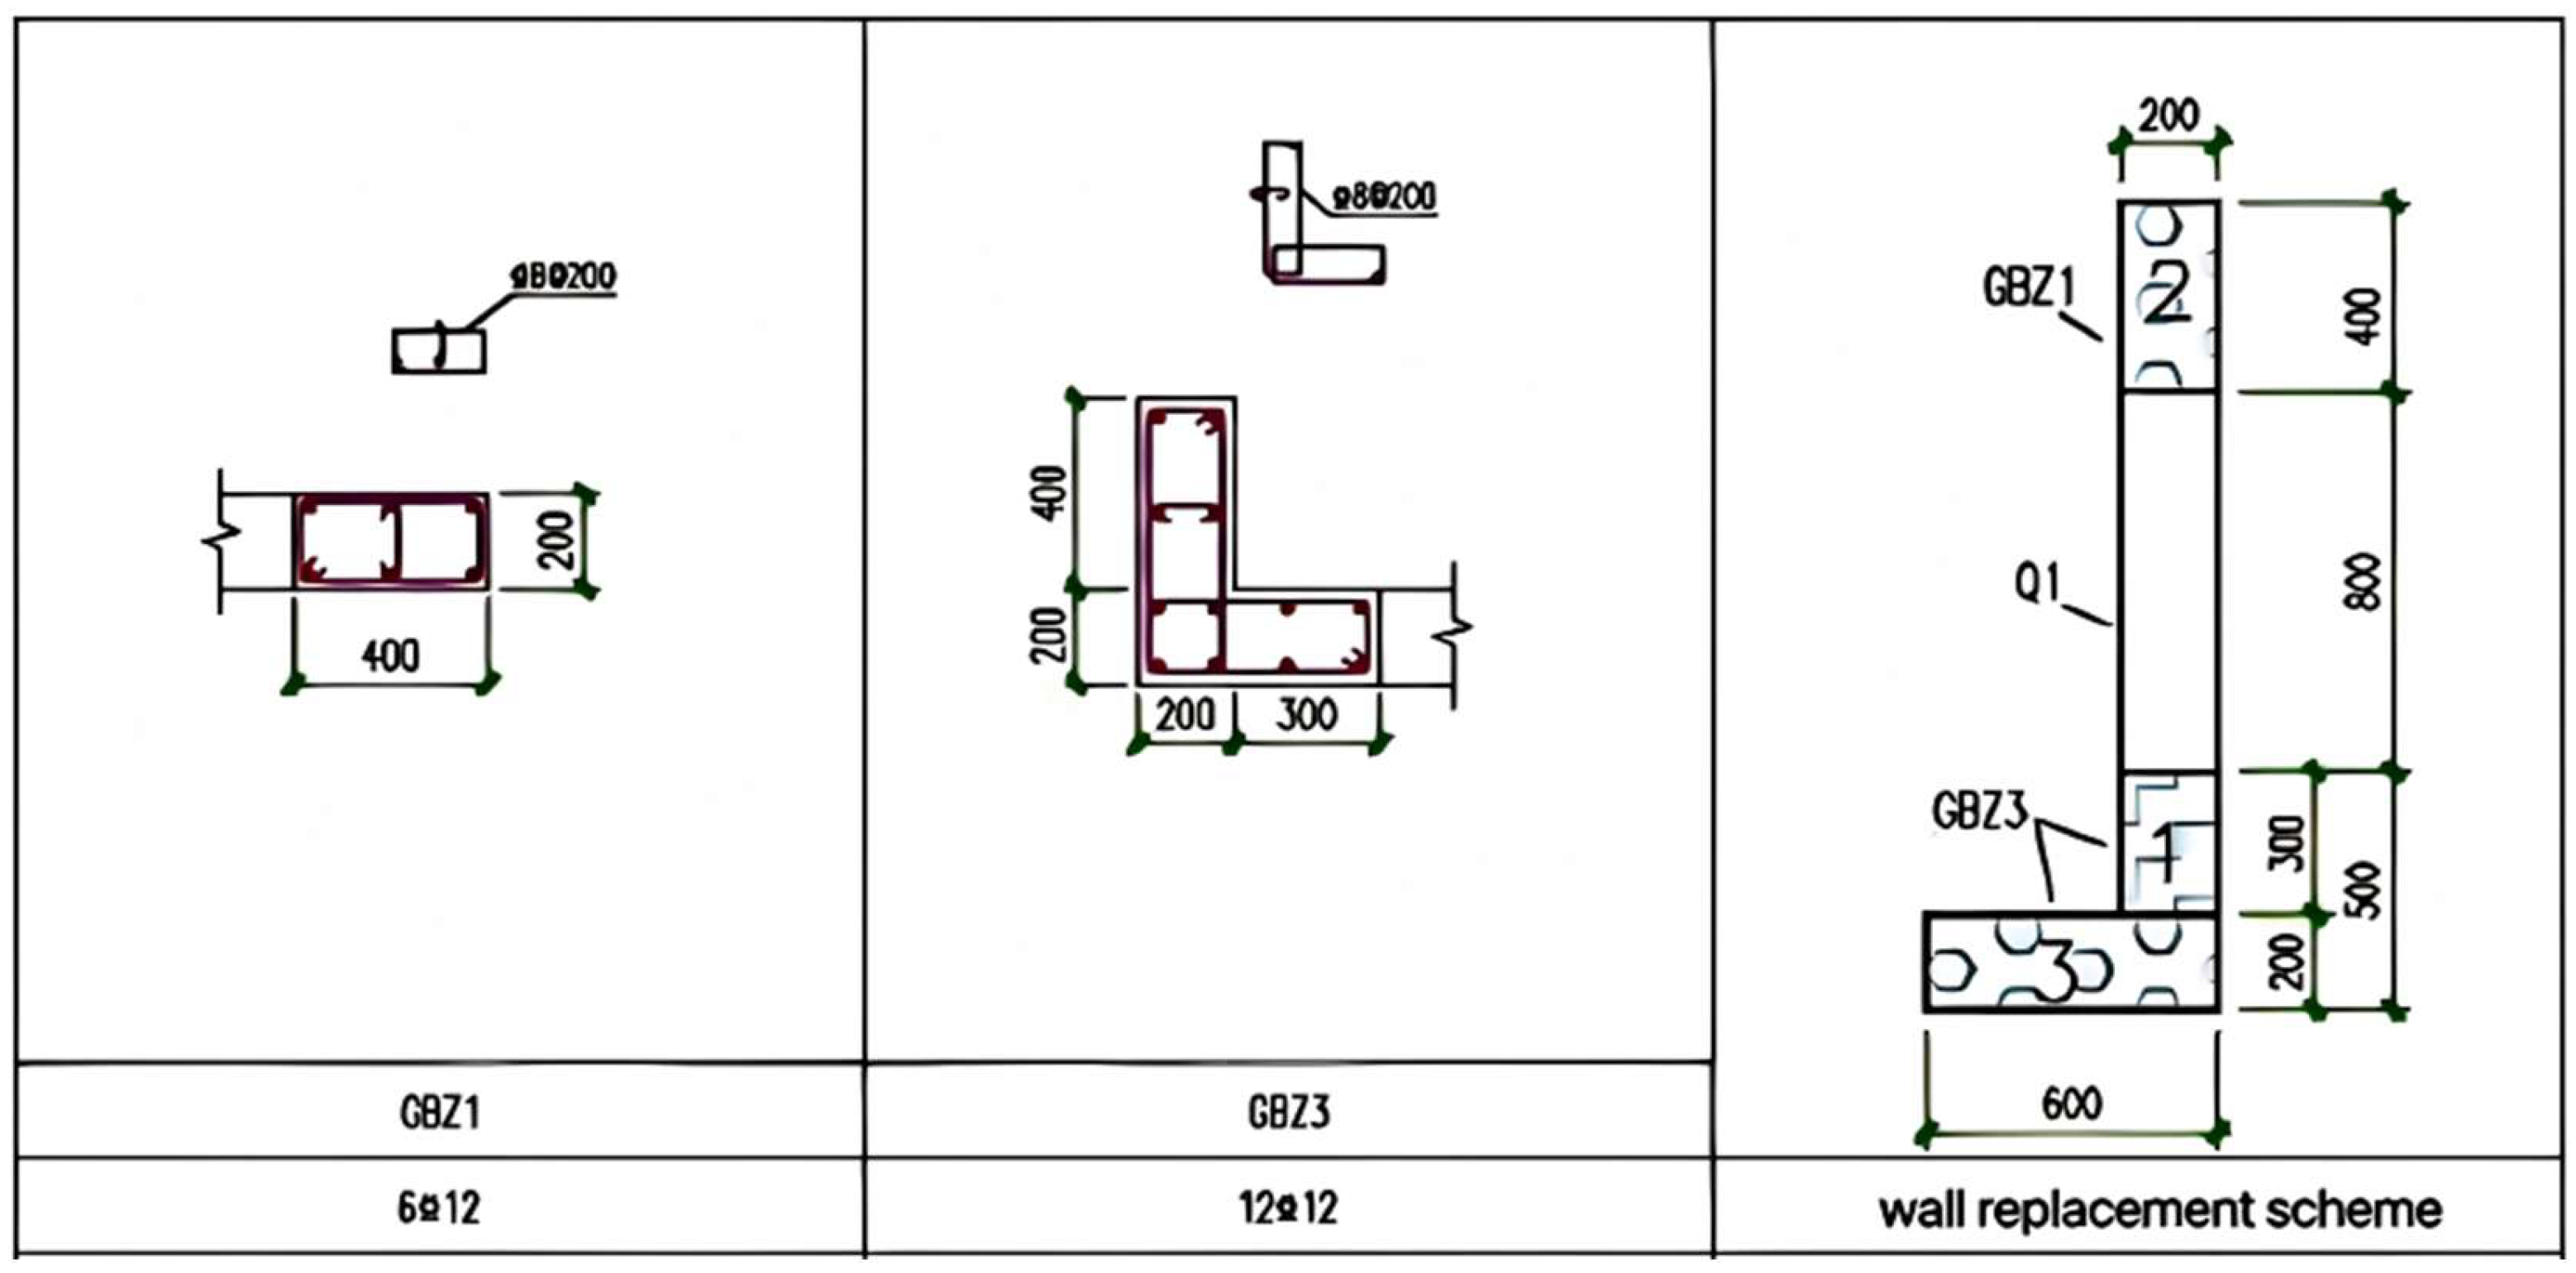
The model’s basic information is shown in Table 3, and the model dimensions and replacement sequence are shown in Figure 8. The entire cross-section of the shear wall is divided into four sections: non-replacement area, first batch replacement area, second batch replacement area, and third batch replacement area. The finite element model of the L-shaped shear wall and the finite element mesh of the steel reinforcement are shown in Figure 9. Add a concrete elastic block at the bottom and the top of the shear wall to simulate the test loading device, which is only used for force transmission and does not unload during the entire loading replacement process. Simulate the effect of dismantling and filling (hardening) in the area to be replaced by changing the elastic modulus, Poisson’s ratio, and self-weight of the concrete and internal reinforcement materials. Set the elastic modulus of the concrete and its internal reinforcement to zero, and apply the self-weight of the reinforcement and concrete in the opposite direction to simulate the dismantling effect; set the elastic modulus of concrete and its internal steel bars to normal values, and then add the self-weight of the steel bars and concrete in the area to simulate the filling (hardening) effect.
Table 3.
Basic model information.
Figure 8.
Reinforcement and replacement sequence of L-shaped shear walls.
Figure 9.
Finite element mesh and steel reinforcement mesh for shear walls.
3.3. Analysis of Destruction Process and Mechanism
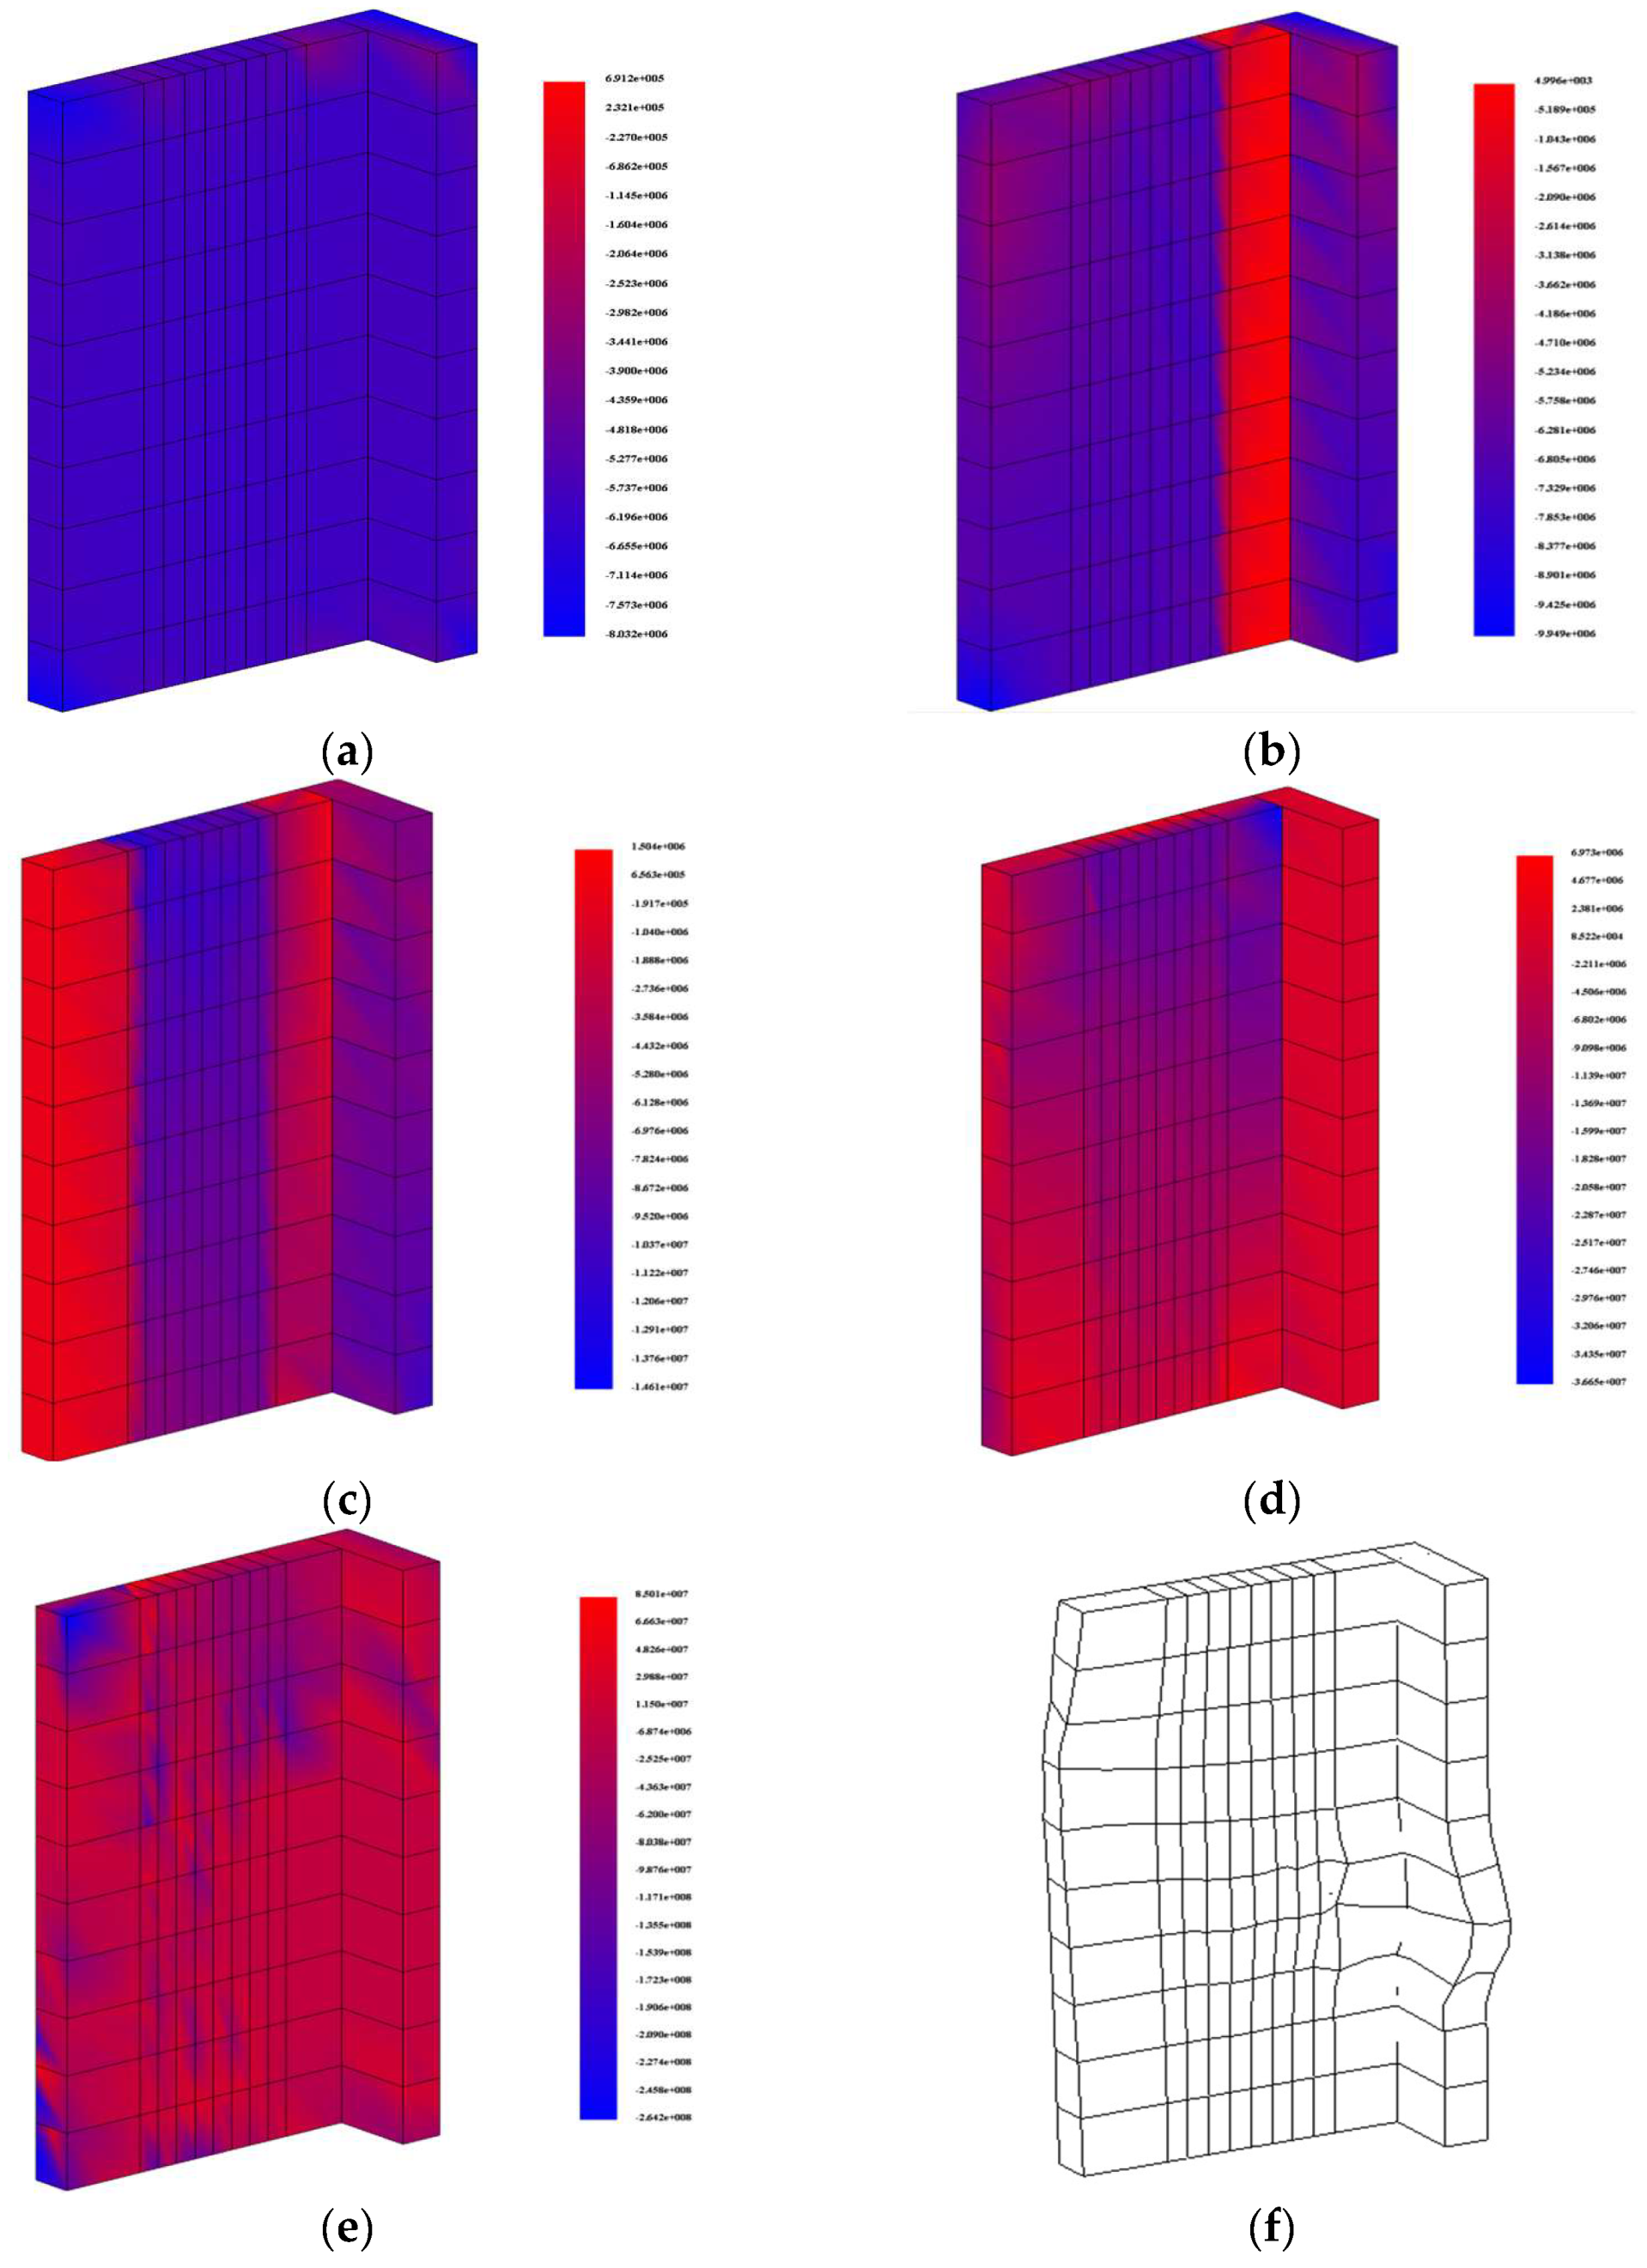
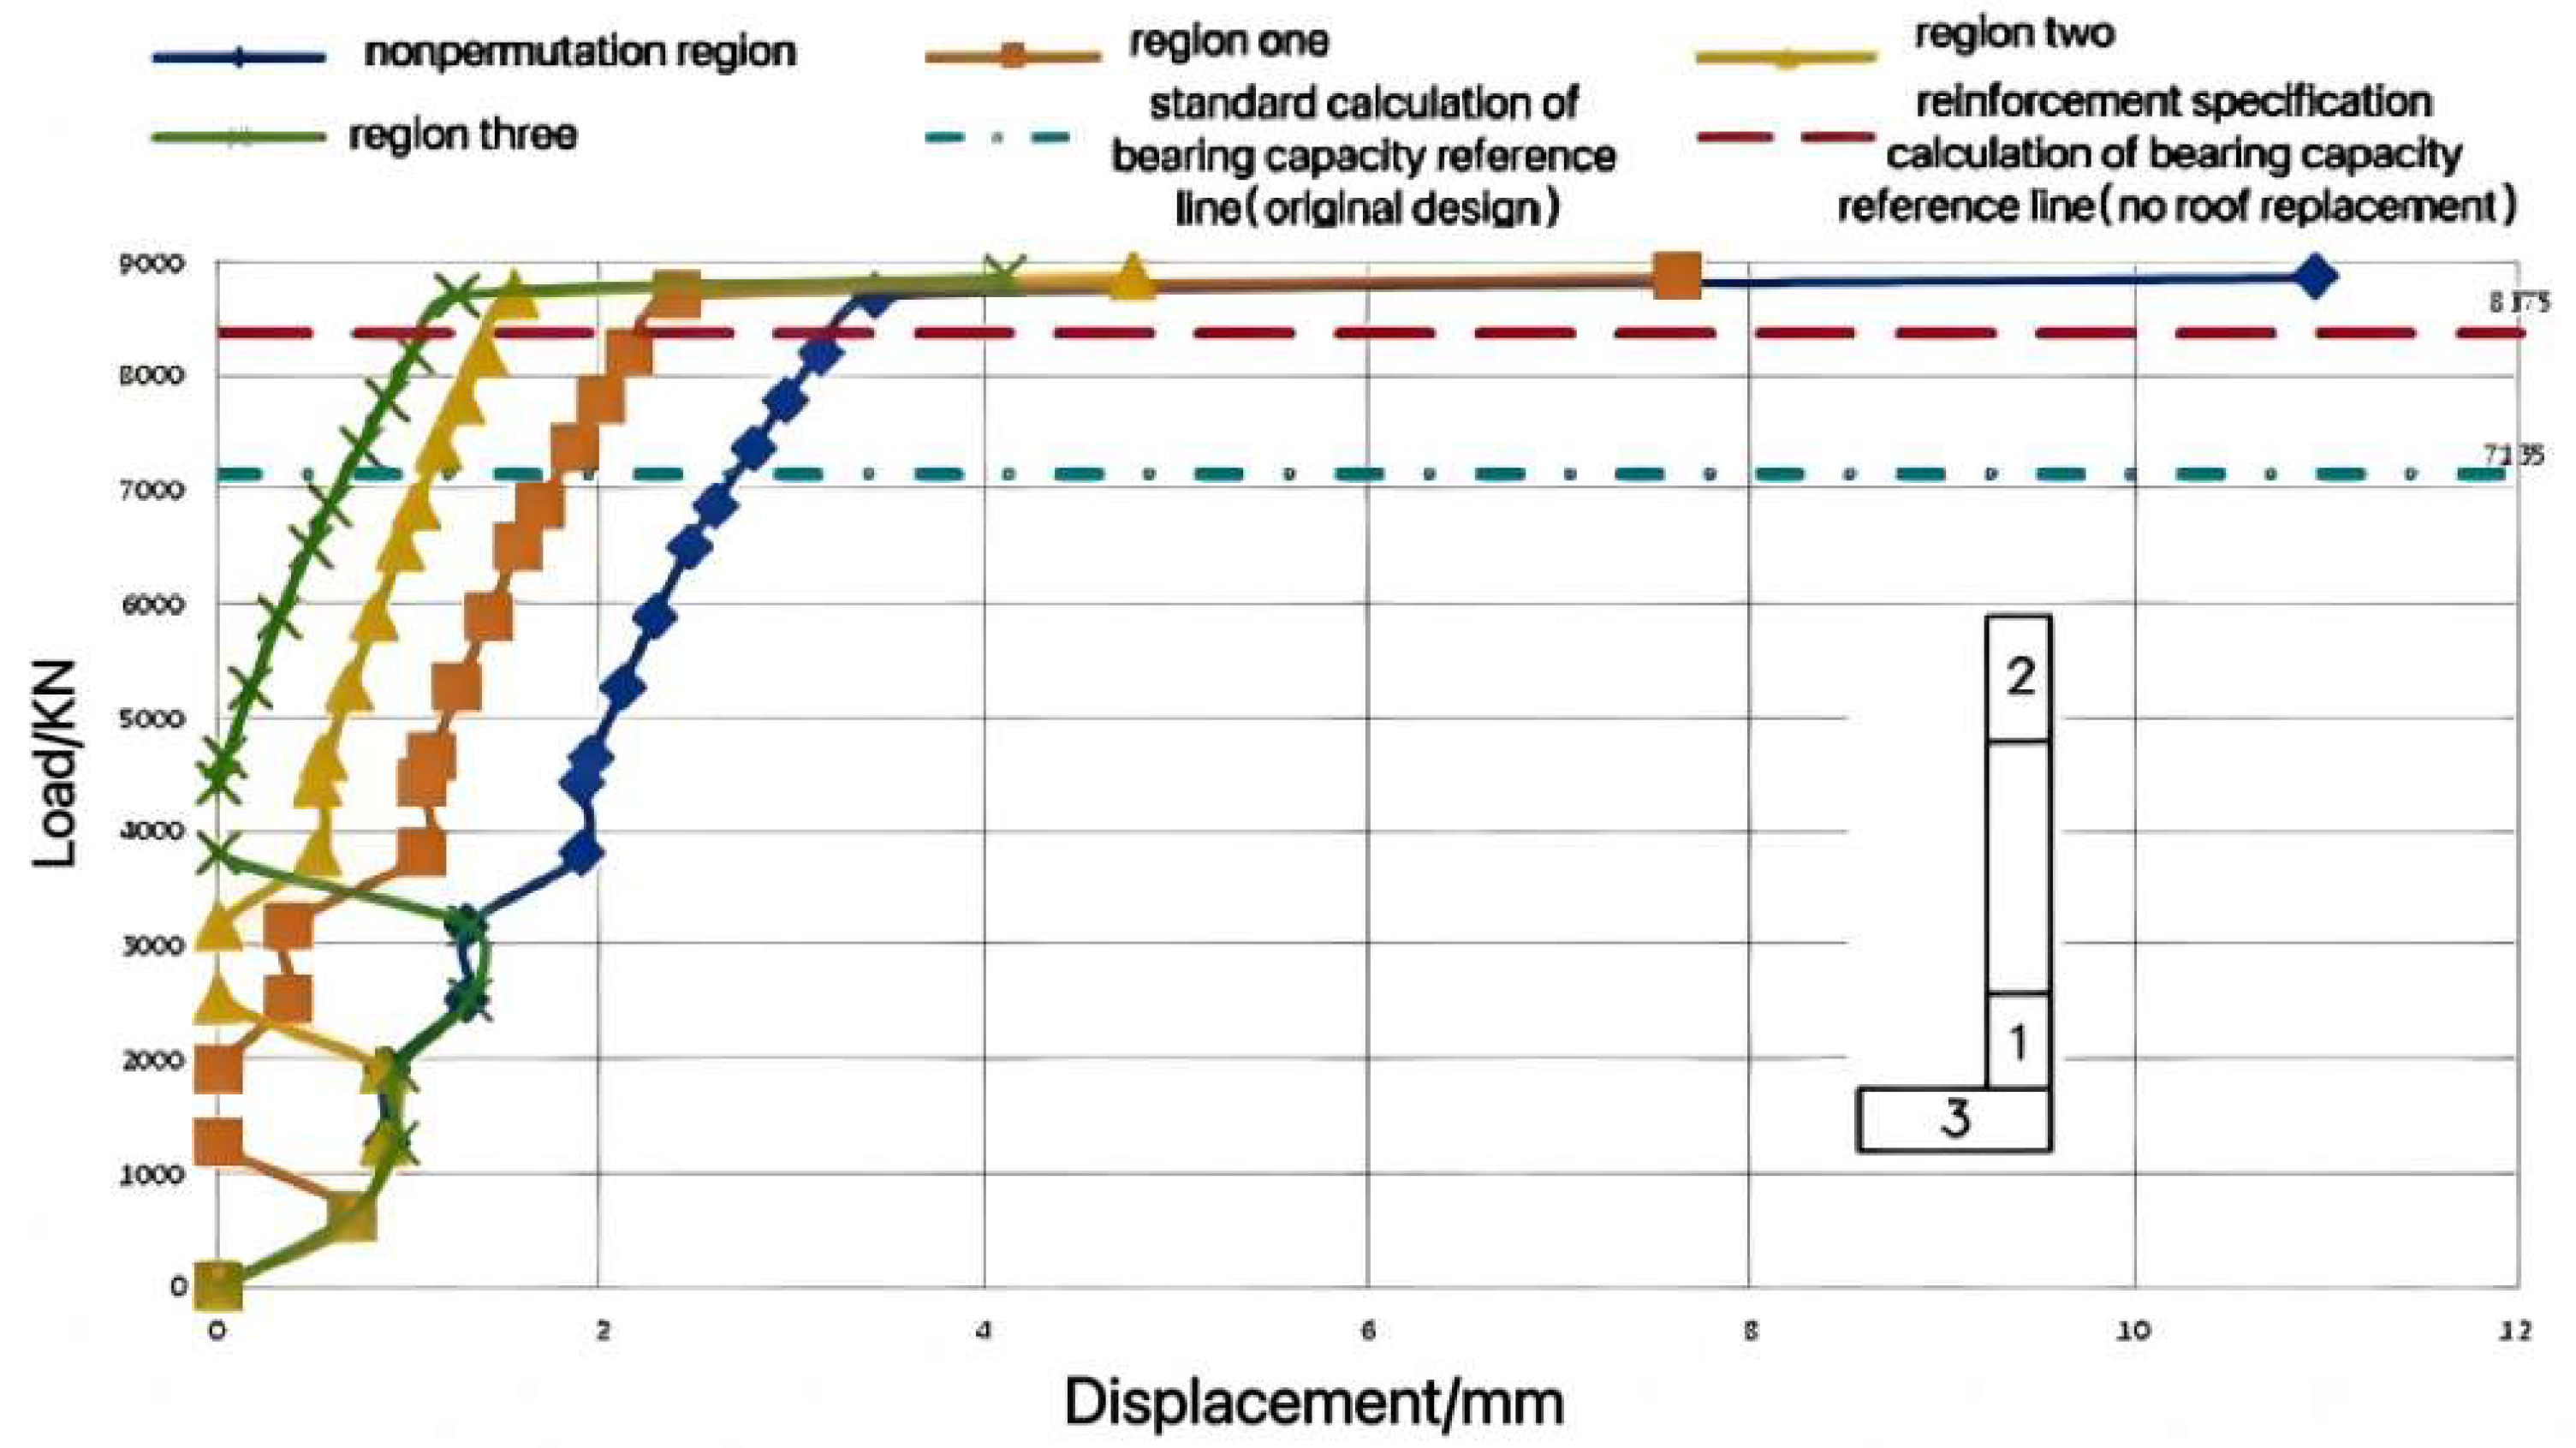
Taking the 0.4fco model as an example, the stress distribution and deformation throughout the calculation process of strengthening and gradually applying vertical loads using the local reinforcement replacement method are shown in Figure 10. Under the initial vertical stress, the vertical stress distribution inside the shear wall is relatively uniform ((a)). After dismantling the concrete in area one, the original vertical stress in area one is distributed to other areas. After the newly poured concrete in area one hardens, it will participate in the overall work of the entire section ((b)). After dismantling the concrete in area two, the original vertical stress in area two (including its initial vertical stress and the accumulated vertical stress transferred and shared during the dismantling of area one) is distributed to other areas of the section. After the newly poured concrete in area two hardens, it participates in the overall work of the entire section ((c)). Similarly, after dismantling the concrete in area three, the original vertical stress in area three (including its initial vertical stress and the accumulated vertical stress transferred and shared during the dismantling of areas one and two) is distributed to other areas of the section. After the newly poured concrete in area three hardens, a composite shear wall component with stress hysteresis is formed ((d)). Considering the interface between the reinforced replacement area and the non-replacement area, as well as the interface between the reinforced replacement area and the reinforced replacement area (which is treated with chiseling or teeth, and has horizontally distributed reinforcement and tension), and the micro expansion effect of high-strength concrete in the reinforced replacement area, it can be considered that the composite shear wall is subjected to coordinated force throughout the entire section during simulation analysis []. For the composite shear walls with stress hysteresis mentioned above, the stiffness method of this step is used to continue simulating the application of vertical loads until the ultimate bearing capacity is reached ((e)~(f)). At this point, after local strengthening and replacement in three areas, the stress development of L-shaped shear walls starts from initial uniform stress, stress transfer during the replacement process, and collaborative stress on the entire section of the shear wall under new vertical loads (non-replacement area concrete softens first, due to the constraint effect of replacement area concrete, the bearing capacity of the previous batch of replacement area concrete, and the bearing capacity of the subsequent batch of replacement area concrete). As the vertical load continues to increase, the non-replacement area concrete enters the descending section of the stress–strain curve first and gradually “releases” the vertical internal forces. Due to its high strength (large deformation modulus), the replacement area concrete “actively bears” the new vertical load and gradually “absorbs” the “transferred internal forces” released from the non-replacement area. When the non-replacement area concrete reaches its ultimate deformation in its constrained state, local damage occurs in the composite shear wall, but due to the high-performance characteristics of the replacement area concrete, the composite shear wall can still withstand a certain amount of load until significant damage occurs in the non-replacement area concrete; meanwhile, the replacement area concrete is under different levels of stress and deformation states depending on the replacement batch and location. The load–displacement curves of the replacement and non-replacement areas in each batch are shown in Figure 11. The ultimate load is 9647 kN, which is higher than the calculated value of 8375 kN according to the reinforcement code (calculated from the “Code for Design of Strengthening Concrete Structure” GB50367-2013) [] and the original design requirement value of 7135 kN (calculated from the “Code for Design of Concrete Structures” GB50010-2010) [].
Figure 10.
Vertical stress cloud map: (a) initial state; (b) area one replacement completed; (c) area two replacement completed; (d) area three replacement completed; (e) ultimate load; (f) ultimate load deformation of composite shear walls.
Figure 11.
Load–displacement relationship curve.
3.4. Influence of Initial Vertical Stress Level
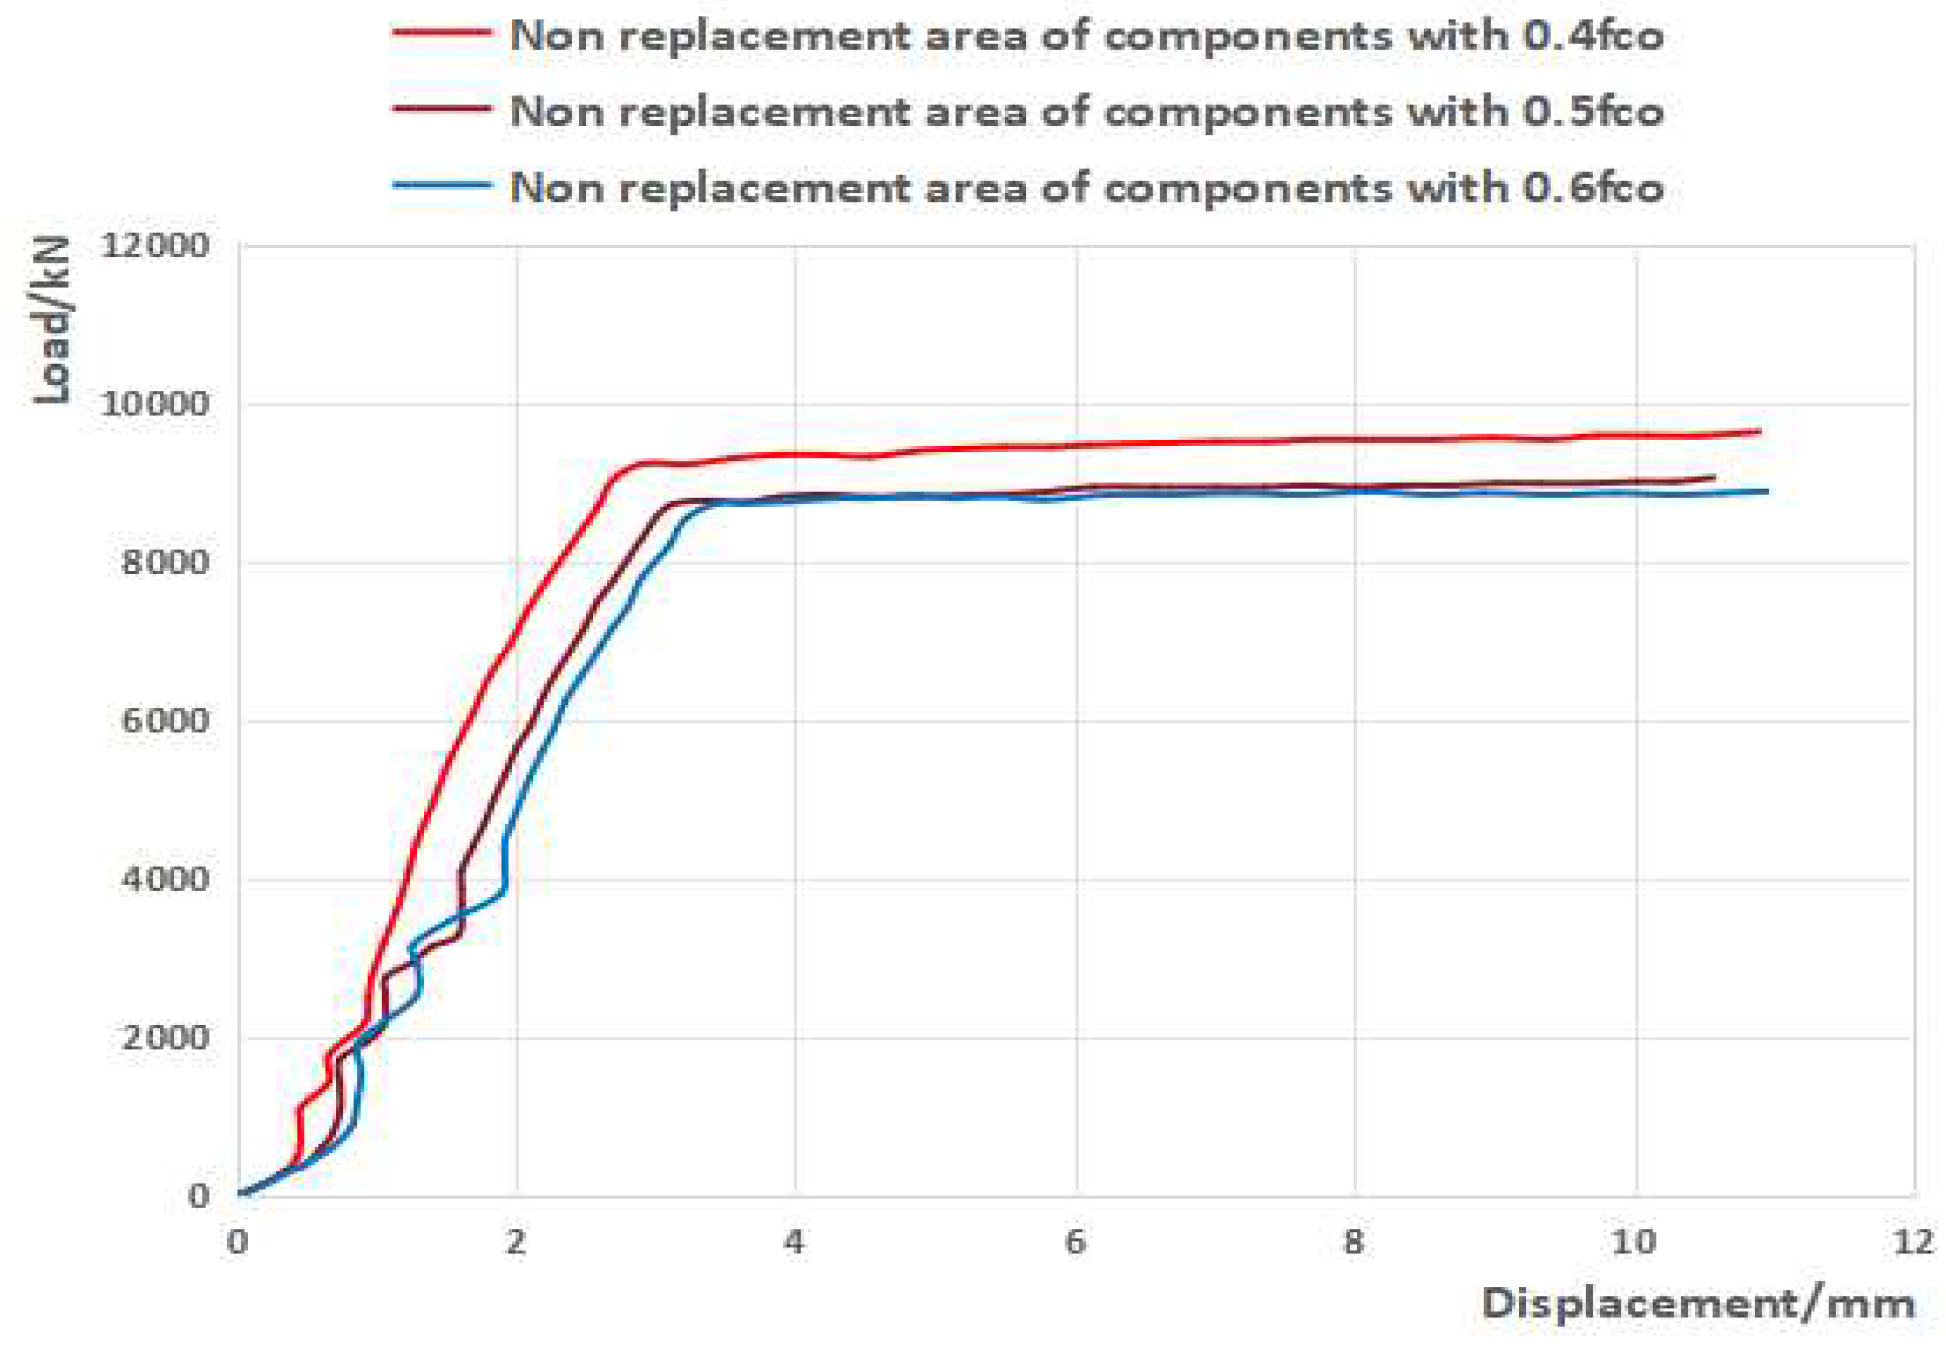
According to the local reinforcement replacement process and the stress failure process of the composite shear wall, it can be known that the initial vertical stress size affects the initial vertical stress of the concrete in each area (non-replacement area and each batch of replacement area) before the formal loading of the composite shear wall. The higher the initial vertical stress level, the greater the initial vertical stress of the concrete in each area (the cumulative initial vertical stress and the “load transfer” stress during the replacement process). The higher the stage of the stress–strain curve corresponding to the initial stress of the non-replacement area concrete, the higher the nonlinear level (the more replacement batches there are and the larger the area of the replacement area, the less the initial vertical stress of the non-replacement area can be reduced). Although the confinement effect of the replacement area on the non-replacement area concrete can improve the mechanical properties (strength and ductility) of the non-replacement area concrete under the new vertical load of the composite shear wall, and despite the high-performance material characteristics of the replacement area (high concrete strength, large deformation modulus, such as the use of section steel–concrete, which has high stiffness and bearing capacity) being more favorable for the “internal force redistribution” of the non-replacement area concrete (less sharing of vertical load), in most cases, the non-replacement area is still the starting point of damage to the composite shear wall. The higher the initial vertical stress level of the component, the earlier damage will occur to the non-replacement area concrete, and the lower the strength utilization efficiency of the replacement area concrete. The initial vertical stress level of the wall limbs, therefore, has a significant impact on the vertical bearing capacity of the composite shear wall. The higher the initial vertical stress level, the lower the bearing capacity of the composite shear wall. Figure 12 shows the variation curves depicting the vertical displacement of non-replacement area concrete with increasing vertical load under the three different initial vertical stress levels (0.4fco, 0.5fco, 0.6fco) mentioned above. The curves show that as the initial vertical stress level increases, the vertical ultimate bearing capacity of the composite shear wall decreases (9647 kN, 8988 kN, 8861 kN, respectively). Compared with the vertical ultimate bearing capacity of the composite shear wall with an initial vertical stress level of 0.4fco, the vertical ultimate bearing capacity of the composite shear wall with an initial vertical stress level of 0.5fco has decreased 6.8%, and that with an initial vertical stress level of 0.6fco has decreased 8.1%.
Figure 12.
Vertical load–displacement relationship curve of non-replacement area (0.4fco, 0.5fco, 0.6fco).
4. Nonlinear Simulation Analysis of Reinforced RC Shear Wall Engineering Case Using Unsupported-Roof Local Strengthening and Replacement Method
4.1. Project Overview
The G35# building—a high-rise building under construction—is a cast-in-place concrete shear wall structure with 18 floors above ground and 1 floor underground. The first floor has a height of 3.2 m, and the remaining 2–18 floors have a height of 2.95 m. The total height of the building is 53.35 m, with a total construction area of 7771.68 m2. The shear wall’s wall thickness is 200 mm, incorporating horizontal and vertical HRB400 steel bars with a diameter of 8 mm and arranged at 200 mm intervals. The tension bars are made from HRB400 steel bars and have a diameter of 6 mm, being arranged at 600 mm intervals. According to the original design data, the project has a design service life of 50 years, the seismic fortification intensity is 6 degrees, the safety level of the building structure is level 2, the site category in the area is class II, the ground roughness is class C, and the basic wind pressure and basic snow pressure are both taken as 0.45 kN/m2. The seismic design is divided into the first group, with a seismic fortification category of Class C and seismic grade of Level 4. The characteristic period T of the site is 0.35 s. The concrete strength grade of the shear walls on the 1st to 3rd floors is C35, with a C30 grade for those on the 4th to 6th floors, and C25 on the 7th to 18th floors. Except for the concrete strength grade of the beam and slab on the 1st floor, which is C30, the concrete strength grade of the beam and slab on the 2nd to 18th floors is C25. After the construction of the building reached the 10th floor, the rebound method was used to detect the concrete strength of most of the shear walls on the bottom 1–3 floors, which was far below the design value. After on-site sampling and core testing, it was confirmed that the concrete strength of the shear walls was too low, only 16.3 MPa, far below the design strength grade C35, and reinforcement treatment was urgently needed.
As previously mentioned, the initial vertical stress level significantly influences the load-bearing performance of the partially strengthened composite shear wall. When the initial vertical stress is excessively high, it can diminish the “effective” enhancement effect and applicability (e.g., excessive deformation or premature visible cracks may occur in the non-replaced concrete areas, affecting normal use). The original design of this project was for an 18-story structure. However, issues were identified during construction up to the 10th floor, at which point the upper 8 stories had not yet been built, and both finishing loads and live loads had not been applied. Structural analysis indicated that the vertical stress levels in the shear walls of the 1st to 3rd floors remained below 0.3. Therefore, the non-propped local reinforcement replacement method is considered for strengthening the shear walls from the first to the third floors. Under the premise of ensuring structural safety and reliability, this method can demonstrate multiple advantages in terms of economy, construction period, and construction safety, thereby achieving significant comprehensive benefits for the project.
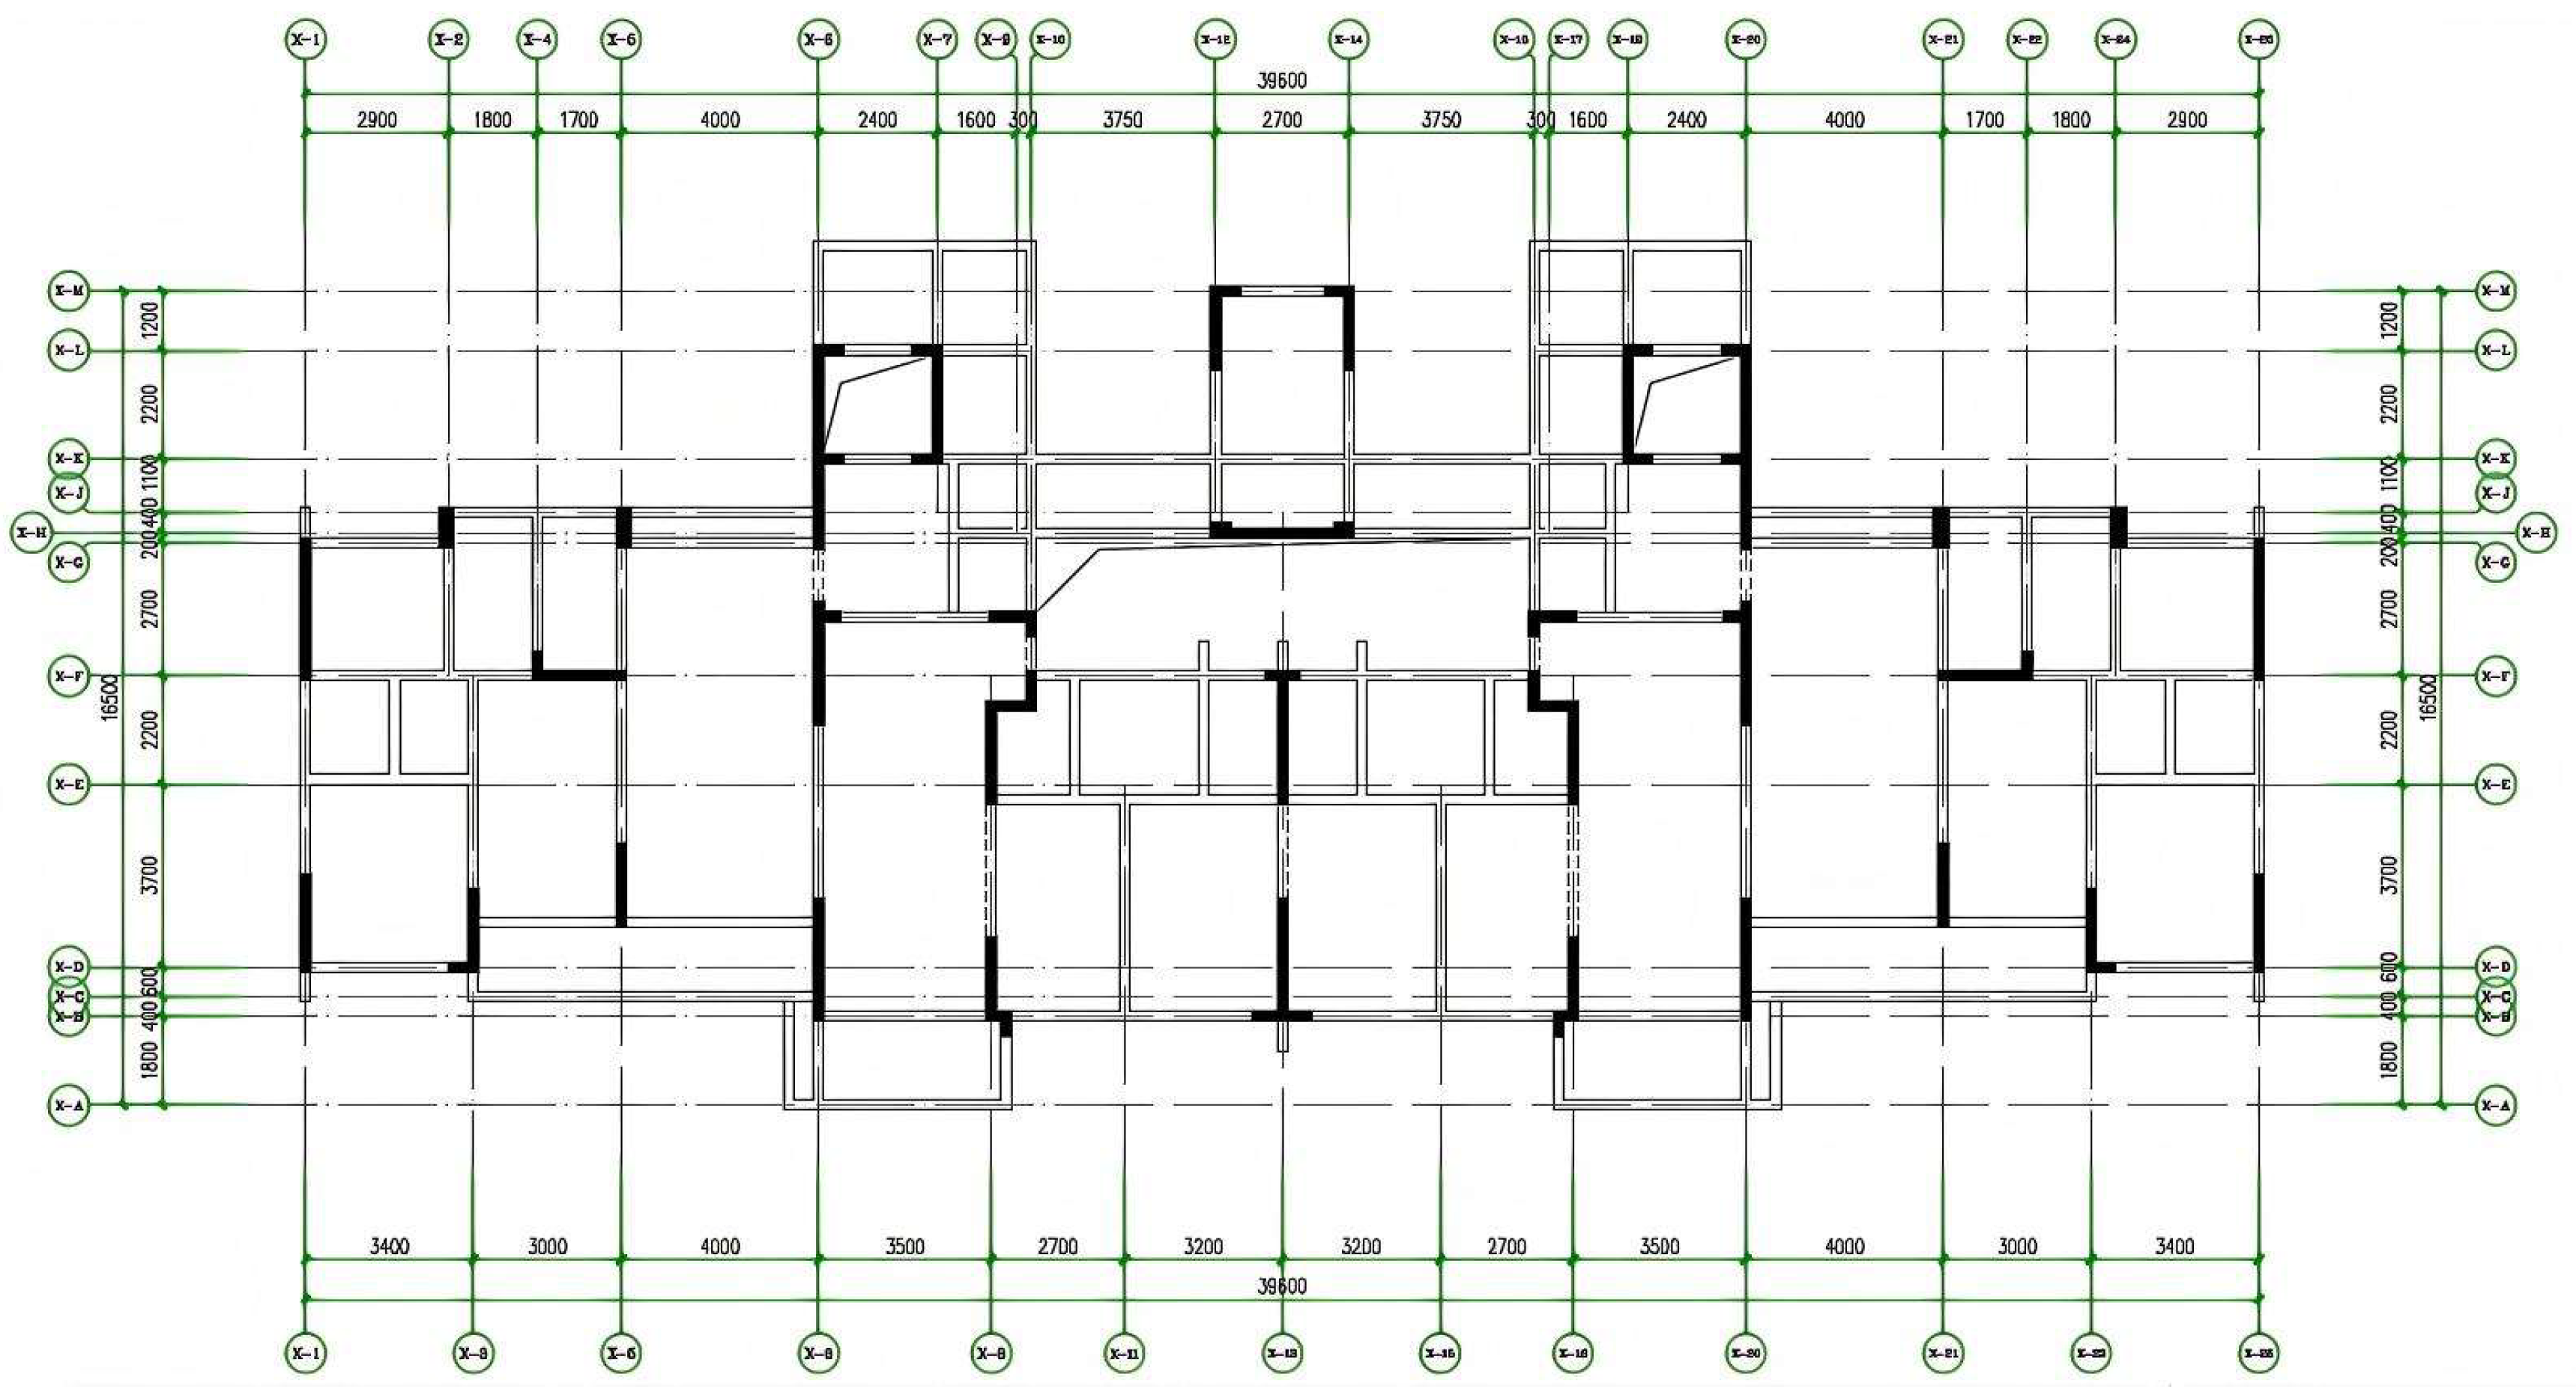
The structural layout plan of the first floor of a high-rise building under construction is shown in Figure 13.
Figure 13.
First-floor structural layout plan.
4.2. Reinforcement Construction and Simulation Loading Steps
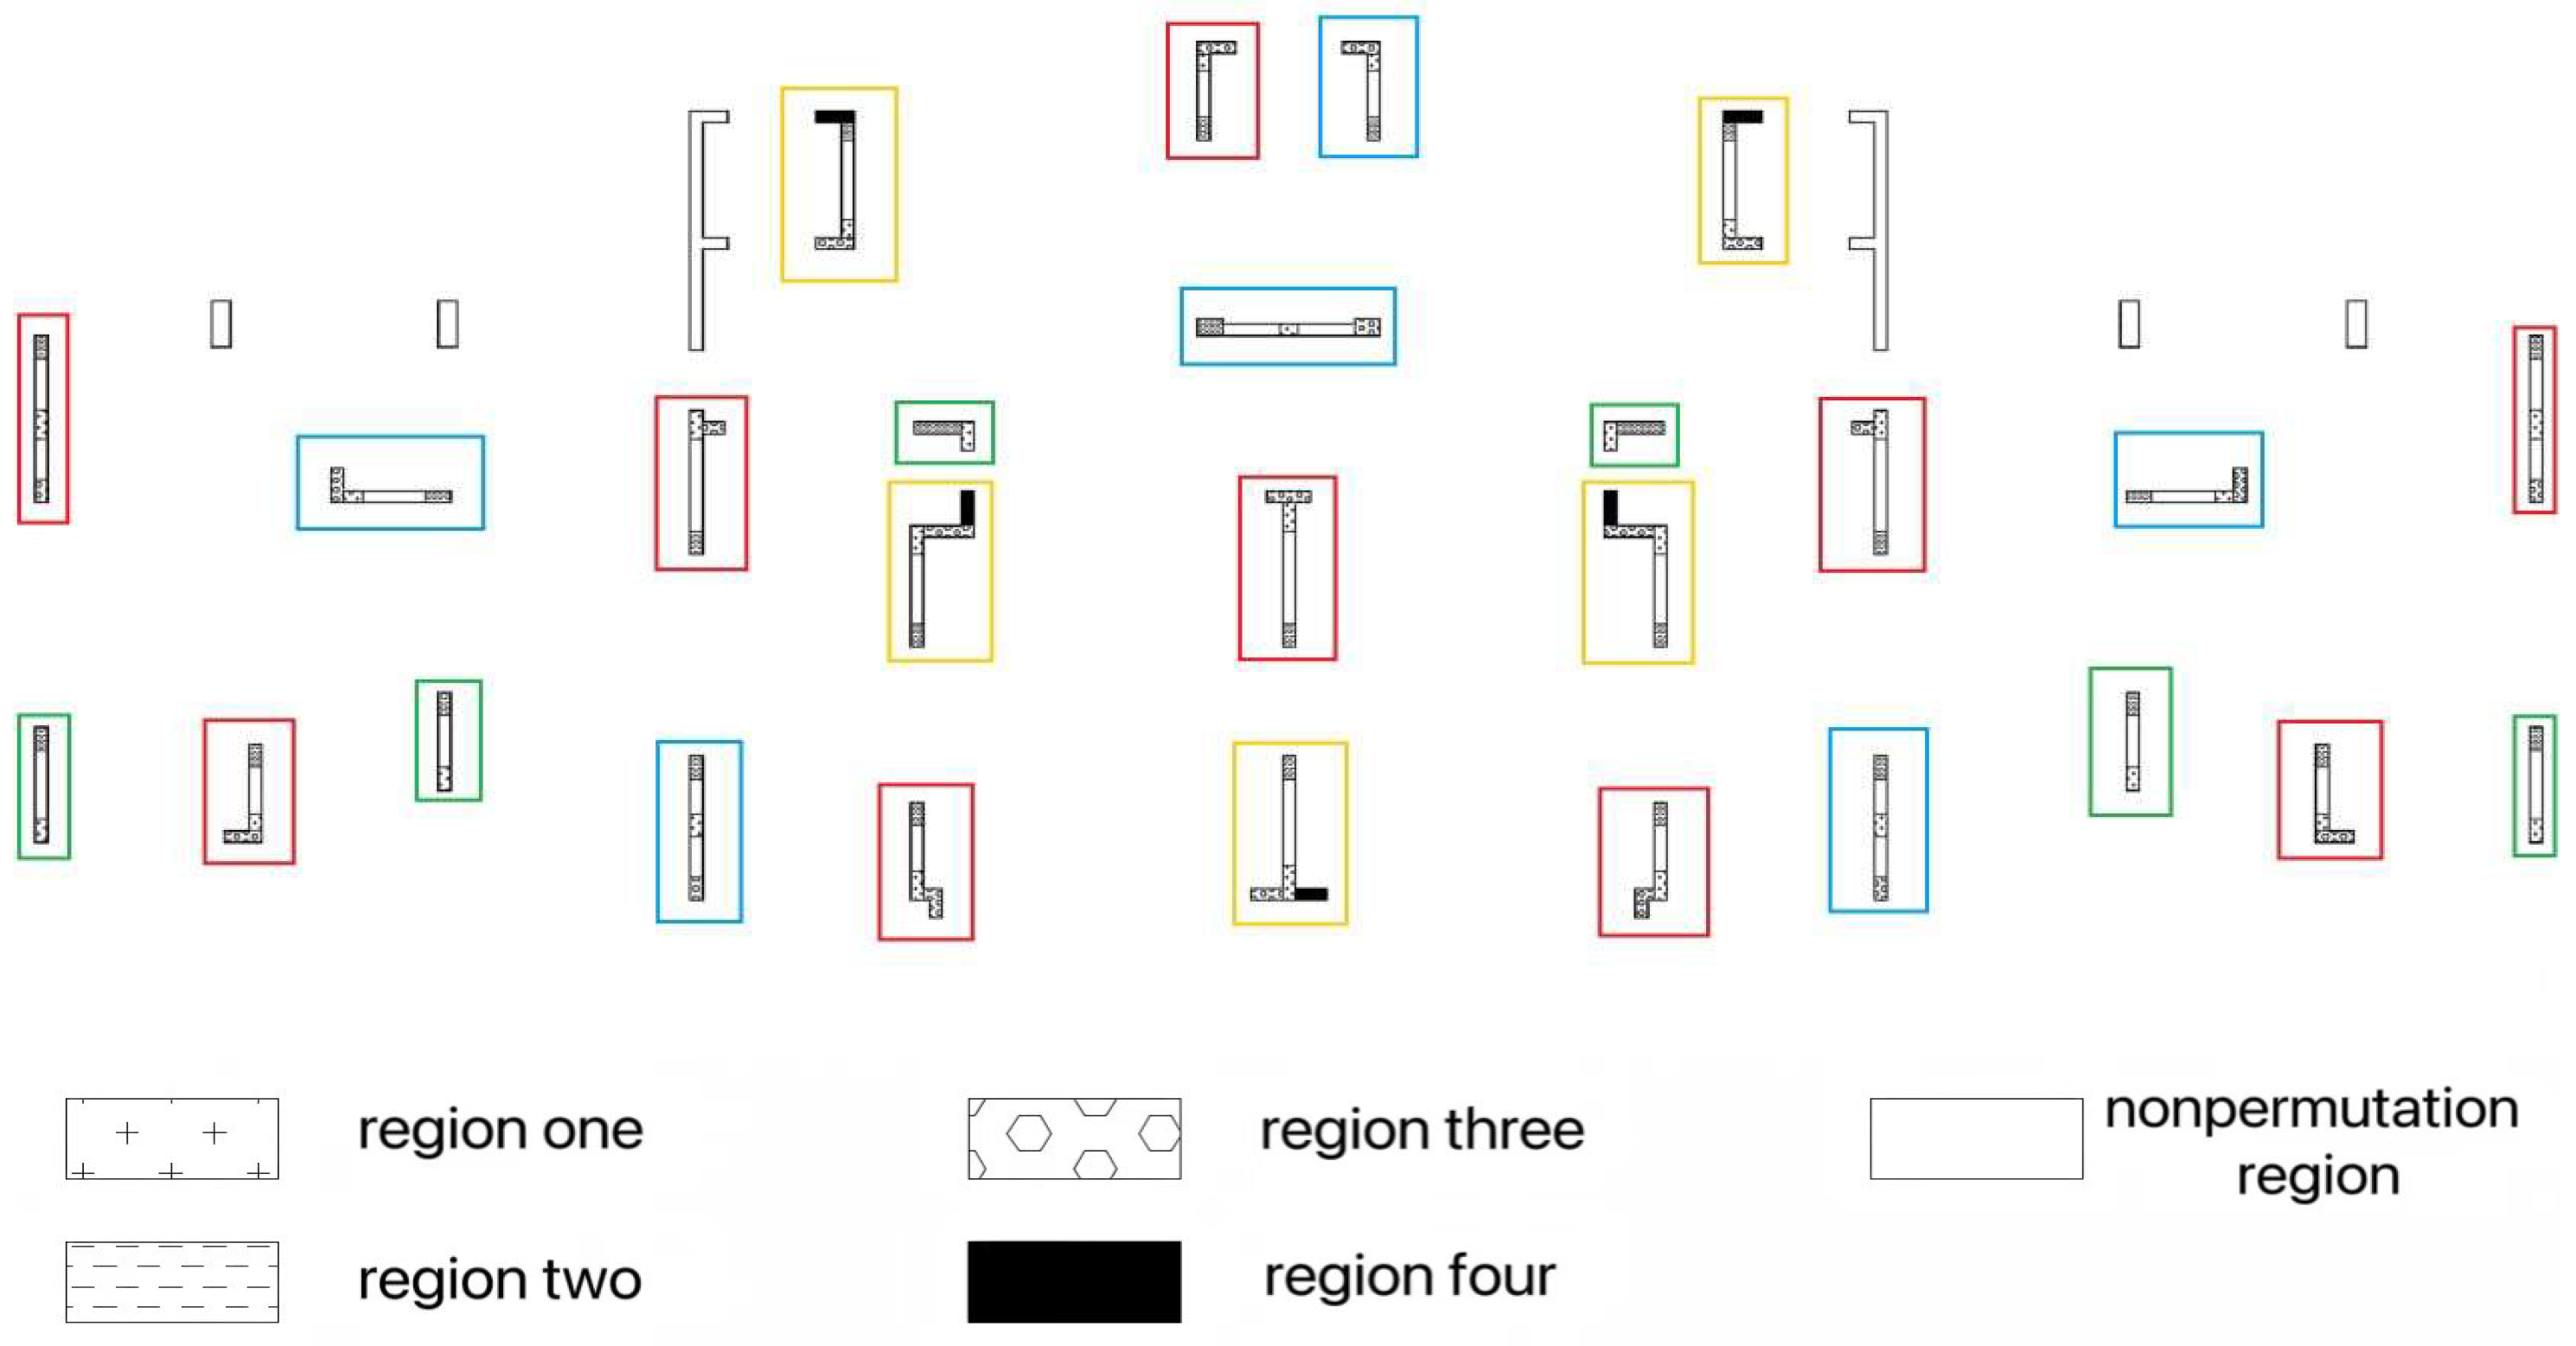
Due to the many shear walls that need to be reinforced on each of the bottom 3 floors, and the fact that construction has reached the 10th floor, safety risks should be avoided when performing the replacement reinforcement of shear walls. This plan divides the 27 shear walls to be reinforced on the same floor into four component replacement batches (red, yellow, blue, and green in Figure 14) according to the principle of spacing and the number of areas that need to be replaced in each wall. Each component is replaced in batches of two to four wall segments. To shorten the construction period, multiple batches (crossing the first, second, and third floors) can be conducted simultaneously within the limit of the axial compression ratio of the wall segments. The construction simulation model is divided into three stages: replacement and reinforcement of the first to third floors, construction of the eleventh to eighteenth floors, and loading of the main structure, with a total of 24 “construction loading simulation steps”.
Figure 14.
Batch and regional distribution replacement map for each section of shear wall.
4.3. Overall Model Establishment
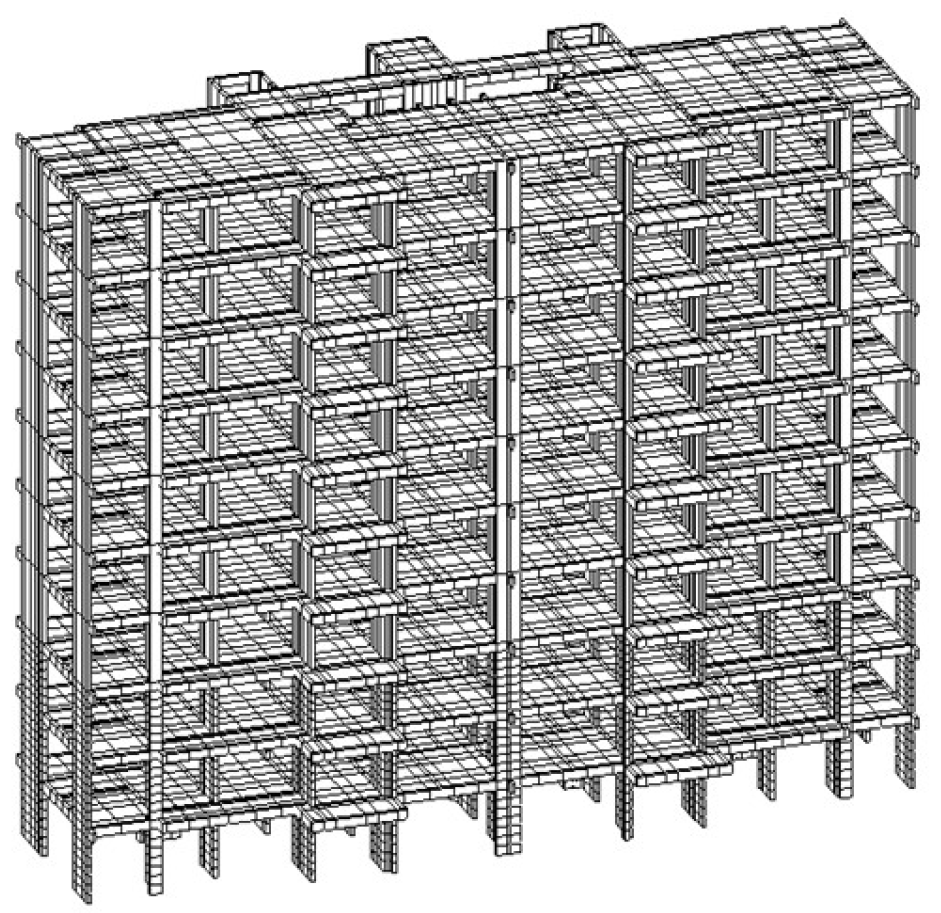
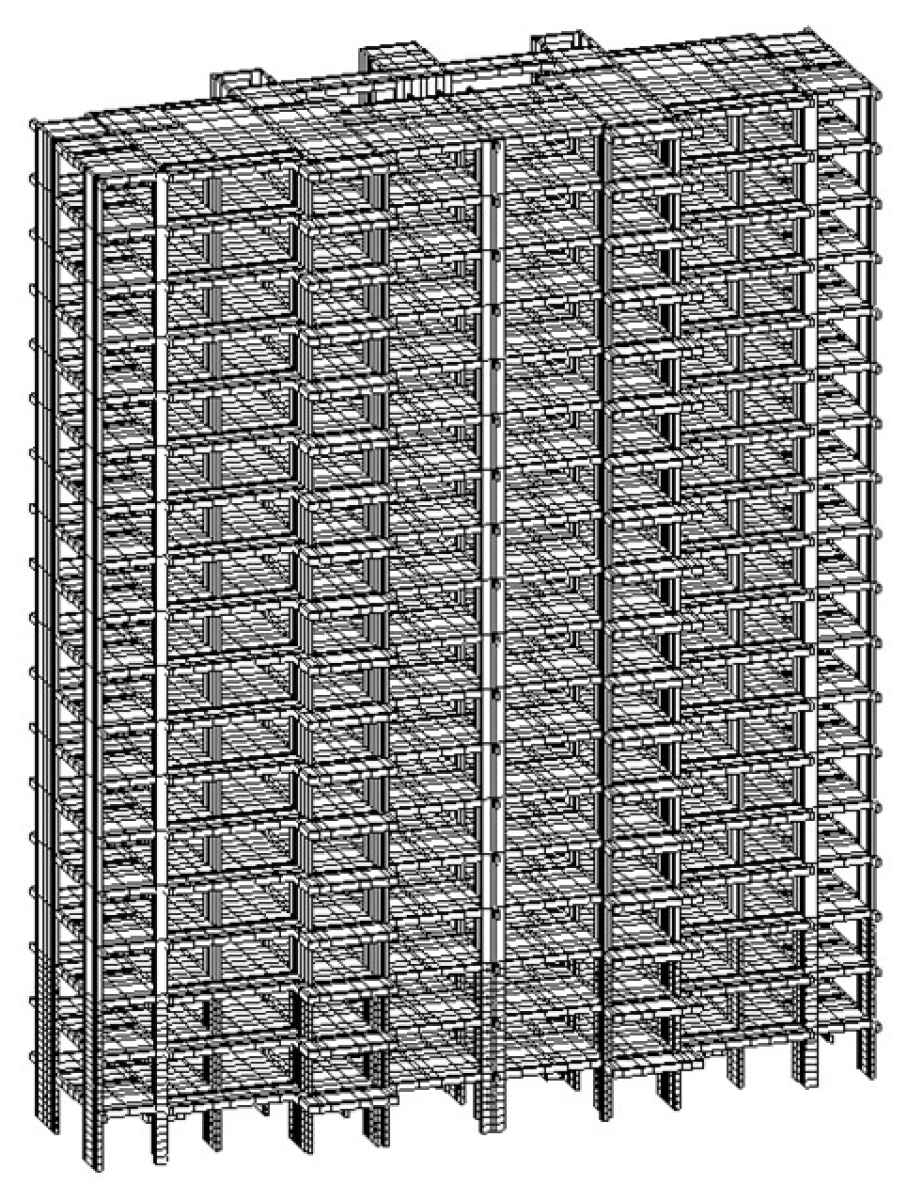
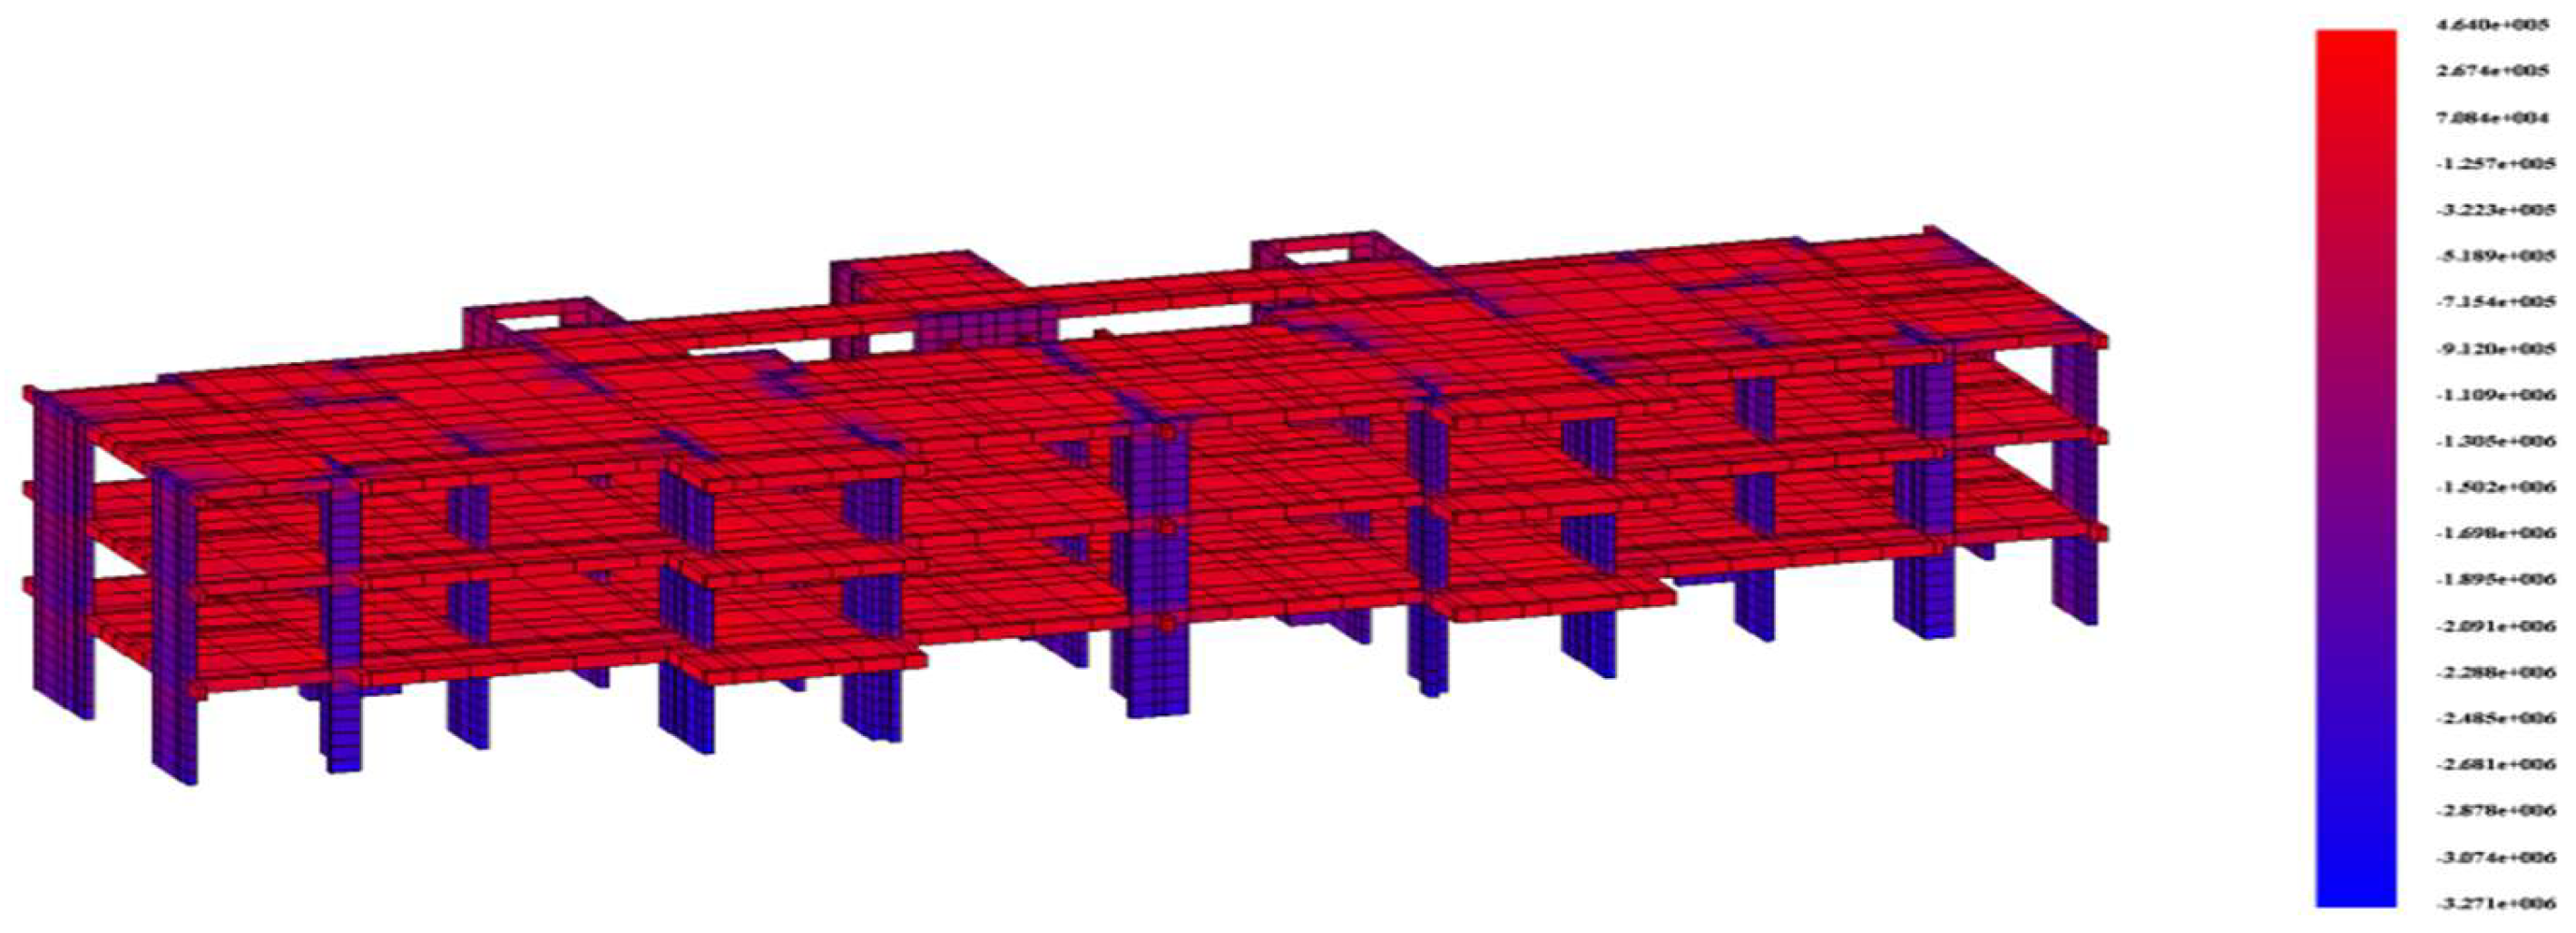
The three-dimensional solid degradation virtual laminated element nonlinear finite element analysis program VFEAP, is used to calculate and analyze the overall structure. After the demolition of the replacement area, C60 high-strength concrete will be used for filling treatment. Divide the bottom 1–3 floors of the structure into eight units from bottom to top, and divide each shear wall into three and four units along the section based on the number of blocks that need to be locally replaced. According to the permutation order, divide the shear wall units into sizes such as 200 mm × 700 mm × 800 mm, 1400 mm × 600 mm × 800 mm, and 600 mm × 950 mm × 800 mm; for beam and slab units, according to the division rules of shear wall units, sizes such as 600 mm × 800 mm × 400 mm, 1100 mm × 1300 mm × 400 mm, and 850 mm × 800 mm × 400 mm are used. To improve calculation efficiency, while ensuring calculation accuracy, the bottom three layers of the shear wall structure of the model are reinforced according to actual reinforcement, and the 4th to 18th layers of the model are set as elastic material structural layers. After construction reached the 10th floor, the insufficient strength of the bottom three layers of shear walls was discovered, so in the reinforcement construction simulation, no additional load was applied to the shear wall structure, and only the self-weight of the structure was considered. The finite element mesh distribution of the model is shown in Figure 15. To study the mechanical state of the 1–3 floors shear wall at the bottom of the structure during the subsequent structural construction to the top and during use, and even under ultimate load, the structure needs to be constructed on top of the 10th floor model foundation to the 18th floor. The actual loads of the project are read from the engineering design program SATWE (Version 2020), and the dead and live loads are applied to the top surface nodes of each floor slab. The node loads are multiplied to simulate the state of the structure under ultimate load, and the “local stiffness method” is used to load the model. The specific unit division of the model is shown in Figure 16 and Figure 17, and the actual steel mesh of the model is shown in Figure 18.
Figure 15.
Finite element mesh plan.
Figure 16.
Stereoscopic diagram showing 1–10F finite element mesh.
Figure 17.
Stereoscopic diagram showing 1–18F finite element mesh.
Figure 18.
Stereoscopic drawing showing finite element steel mesh on the bottom three layers.
4.4. Simulation Analysis Results
During the replacement and reinforcement process, only the shear walls in the stairwell showed cracks, which were in the form of single-axis tensile damage cracks and were relatively minor cracks. There were no cracks on the other walls.
- (1)
- The initial state of the structure is a shear wall structure that has been built up to the 10th floor; the finite element software calculation results for this state are shown in Figure 19. At this point, except for the stress deviation caused by structural irregularity away from the stairwell shear walls, the stress distribution in each area of the shear walls is homogeneous.
Figure 19. Vertical stress cloud diagram for step 0 of the construction loading simulation.
- (2)
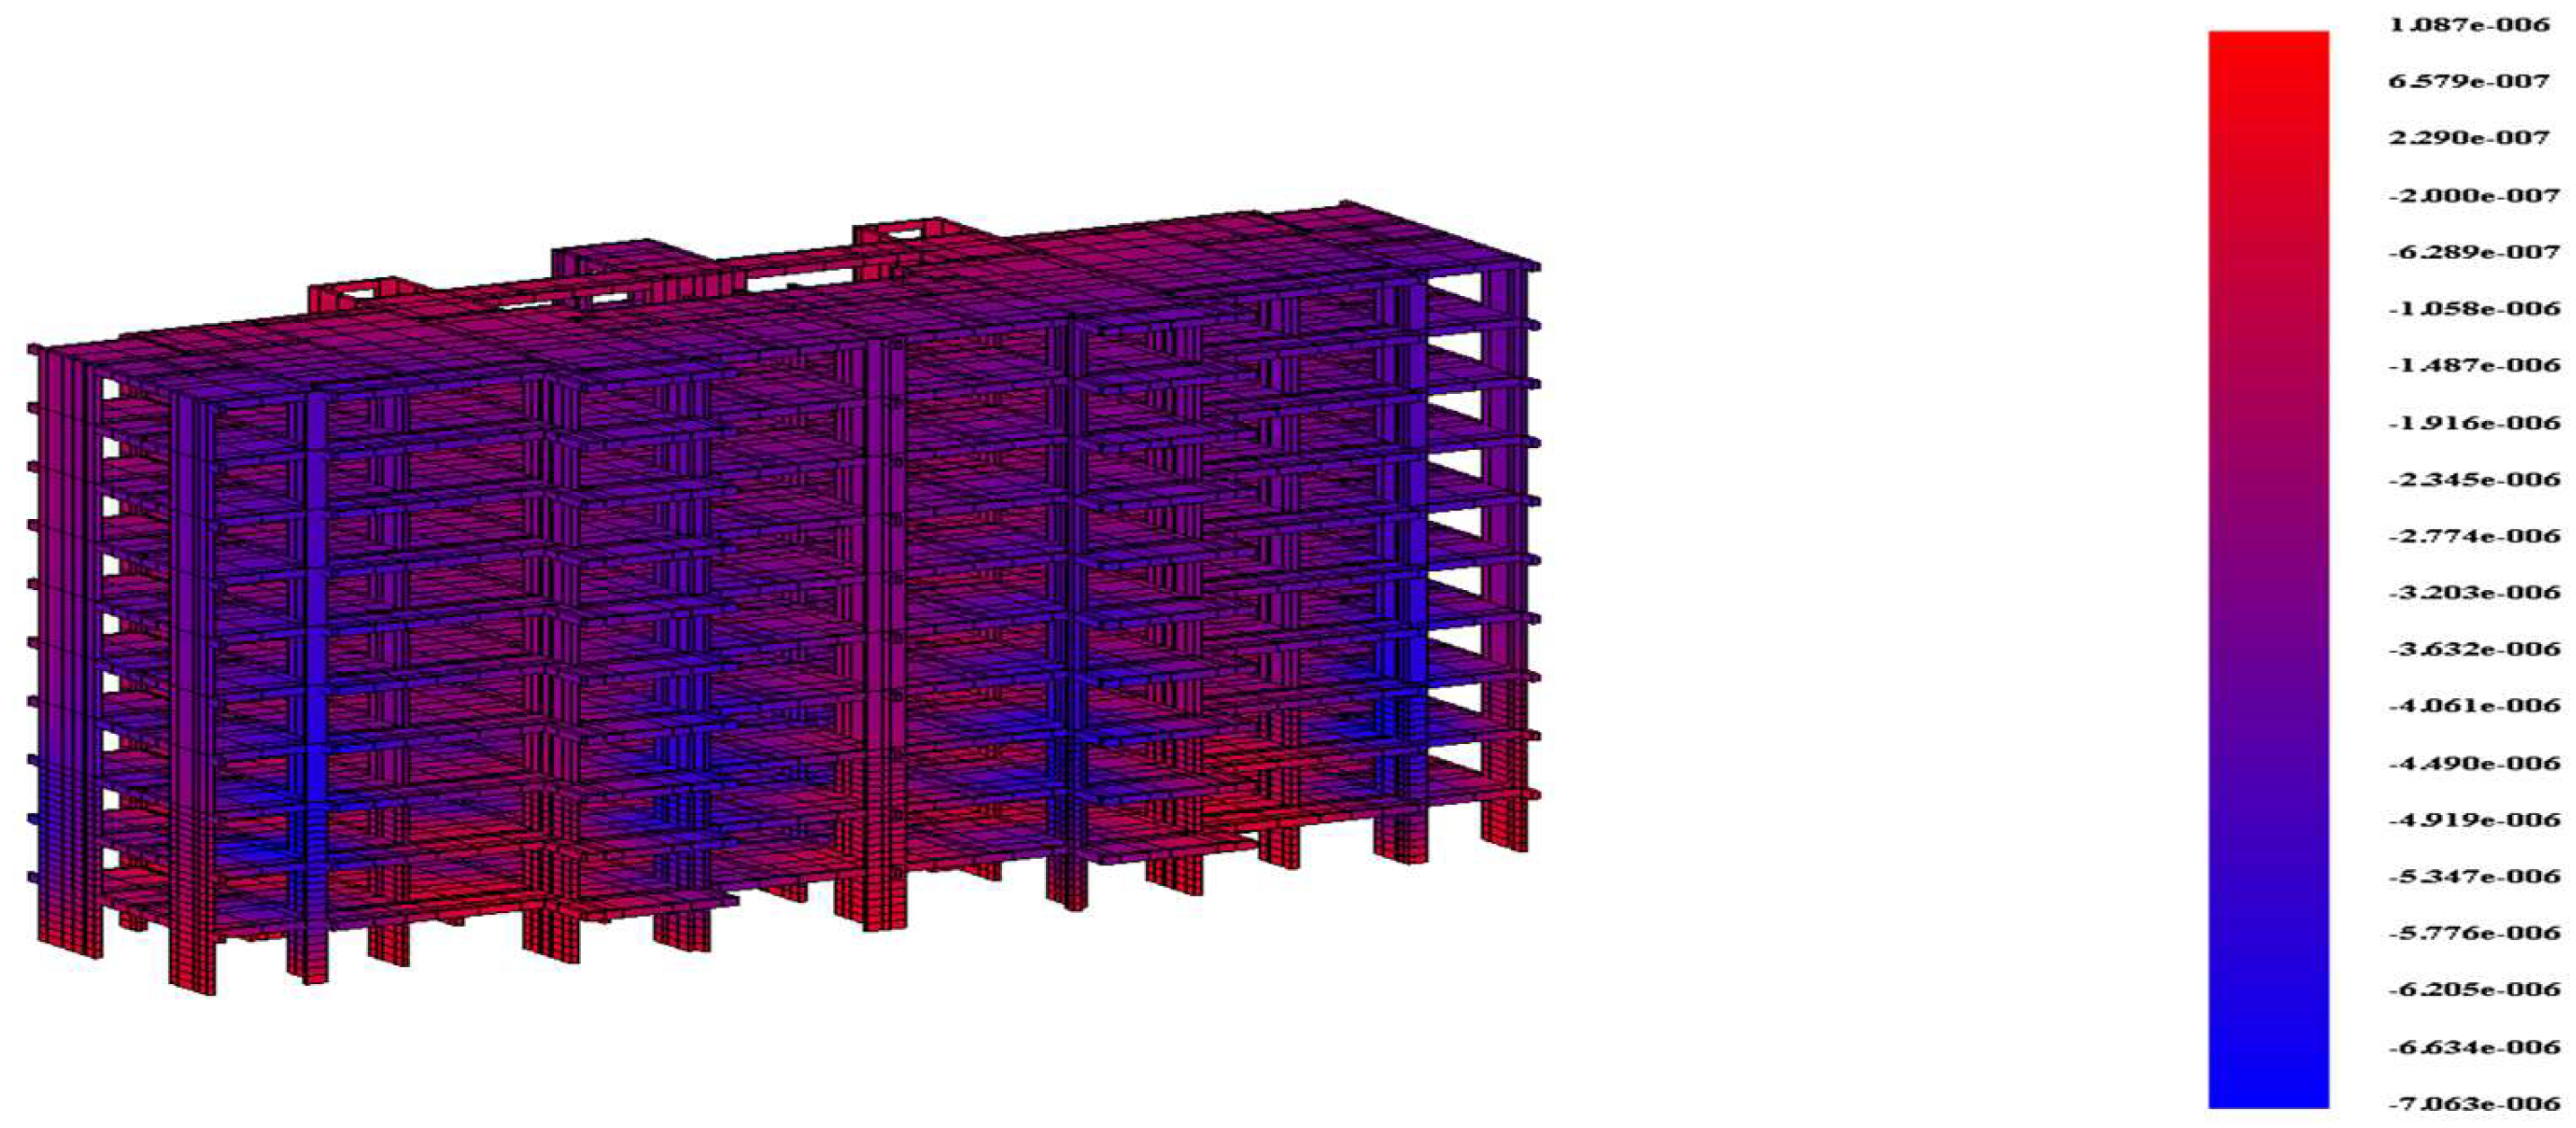
- When the replacement area 2 of the composite shear wall with the red box of 1–3F is filled with high-strength concrete without shrinkage and reaches the design strength, the finite element software calculation results are shown in Figure 20. At this stage, the composite shear wall has already been replaced in area 1, and the vertical displacement of replacement area 2 is reduced compared to replacement area 1, indicating that area 1 has entered work at this stage.
Figure 20. Step 8: Vertical displacement cloud color map of construction loading simulation.
- (3)
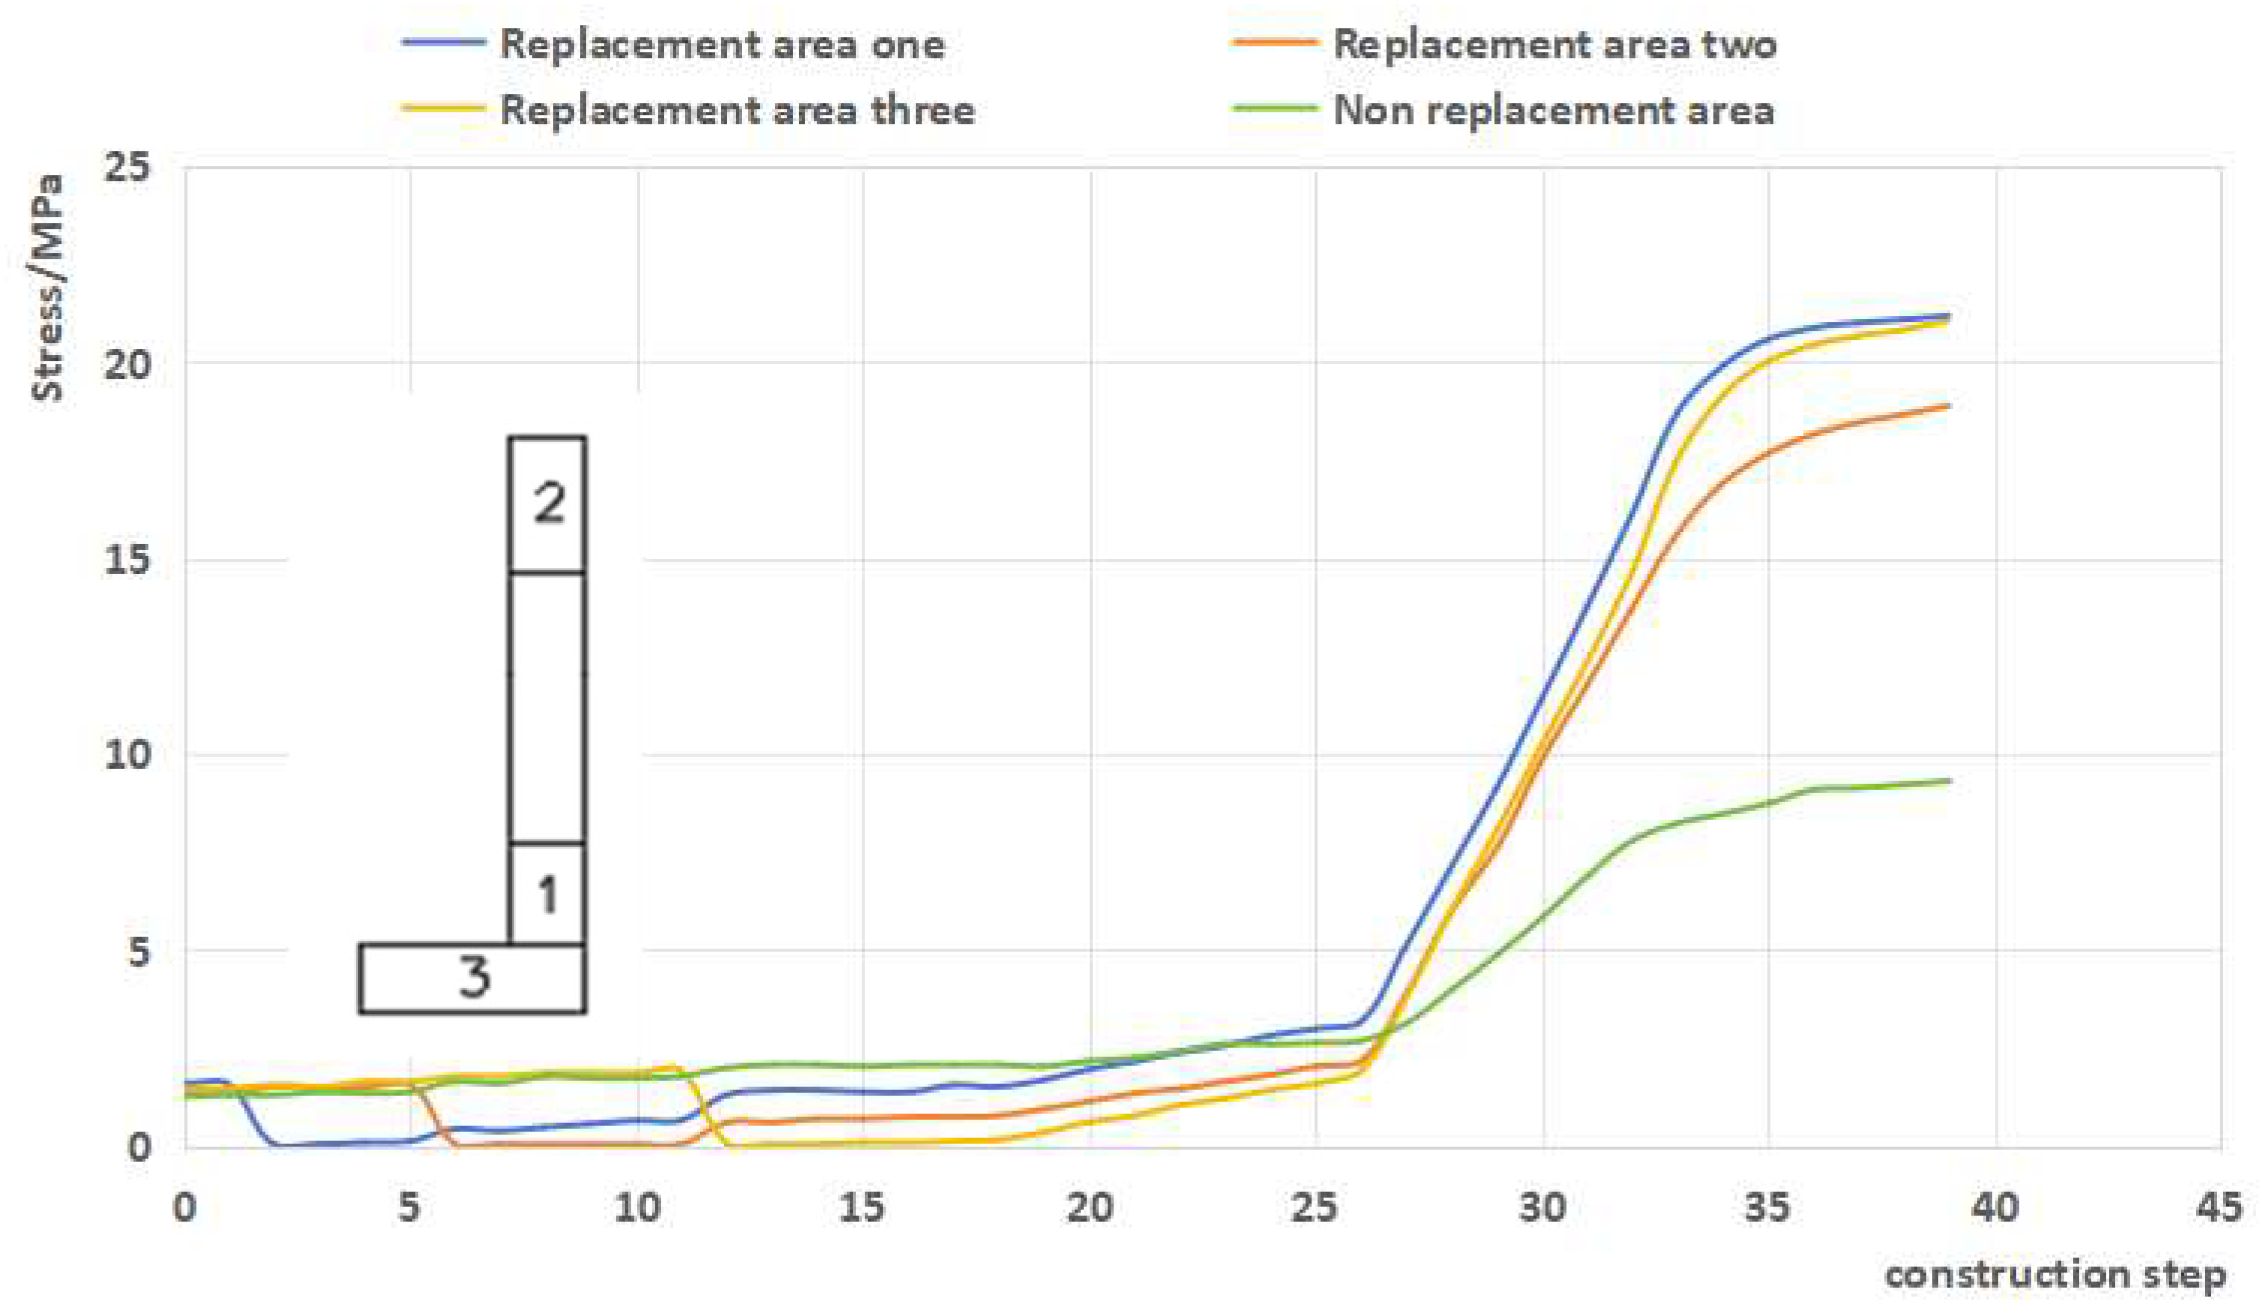
- Due to space limitations, we select an L-shaped wall in the structure (located on the lower left wall in Figure 14) to analyze the stress changes in each section of the wall limbs during the entire construction loading process. Figure 21 shows the vertical stress variation in the wall in different replacement areas throughout the entire process; during the replacement stage, the vertical stress in the non-replacement area remains at a high level. In replacement areas one and two, the vertical stress in area three is slightly higher than that in the non-replacement area, which is mainly due to the uneven deformation of the overall structure. The overall change pattern during the replacement phase is that the area that has been replaced first experiences high stress, while the area replaced later experiences low stress and is added to the overall work. During the construction phase of floors 11–18, the vertical stress in each area steadily increases; under the action of the ultimate load, the non-replacement area is unable to bear higher stress due to the influence of material strength. As the load gradually increases, the stress level in the non-replacement area is the lowest, and the replaced area mainly participates in the stress, playing the role of non-shrinkage high-strength concrete; until the structural loading is completed, the vertical stress in region one is 21 MPa, being 18.9 MPa in region two, and 21 MPa in region three, while the vertical stress in the non-replacement region is only 9.3 MPa.
Figure 21. Stress changes in different replacement areas of the wall.
- (4)
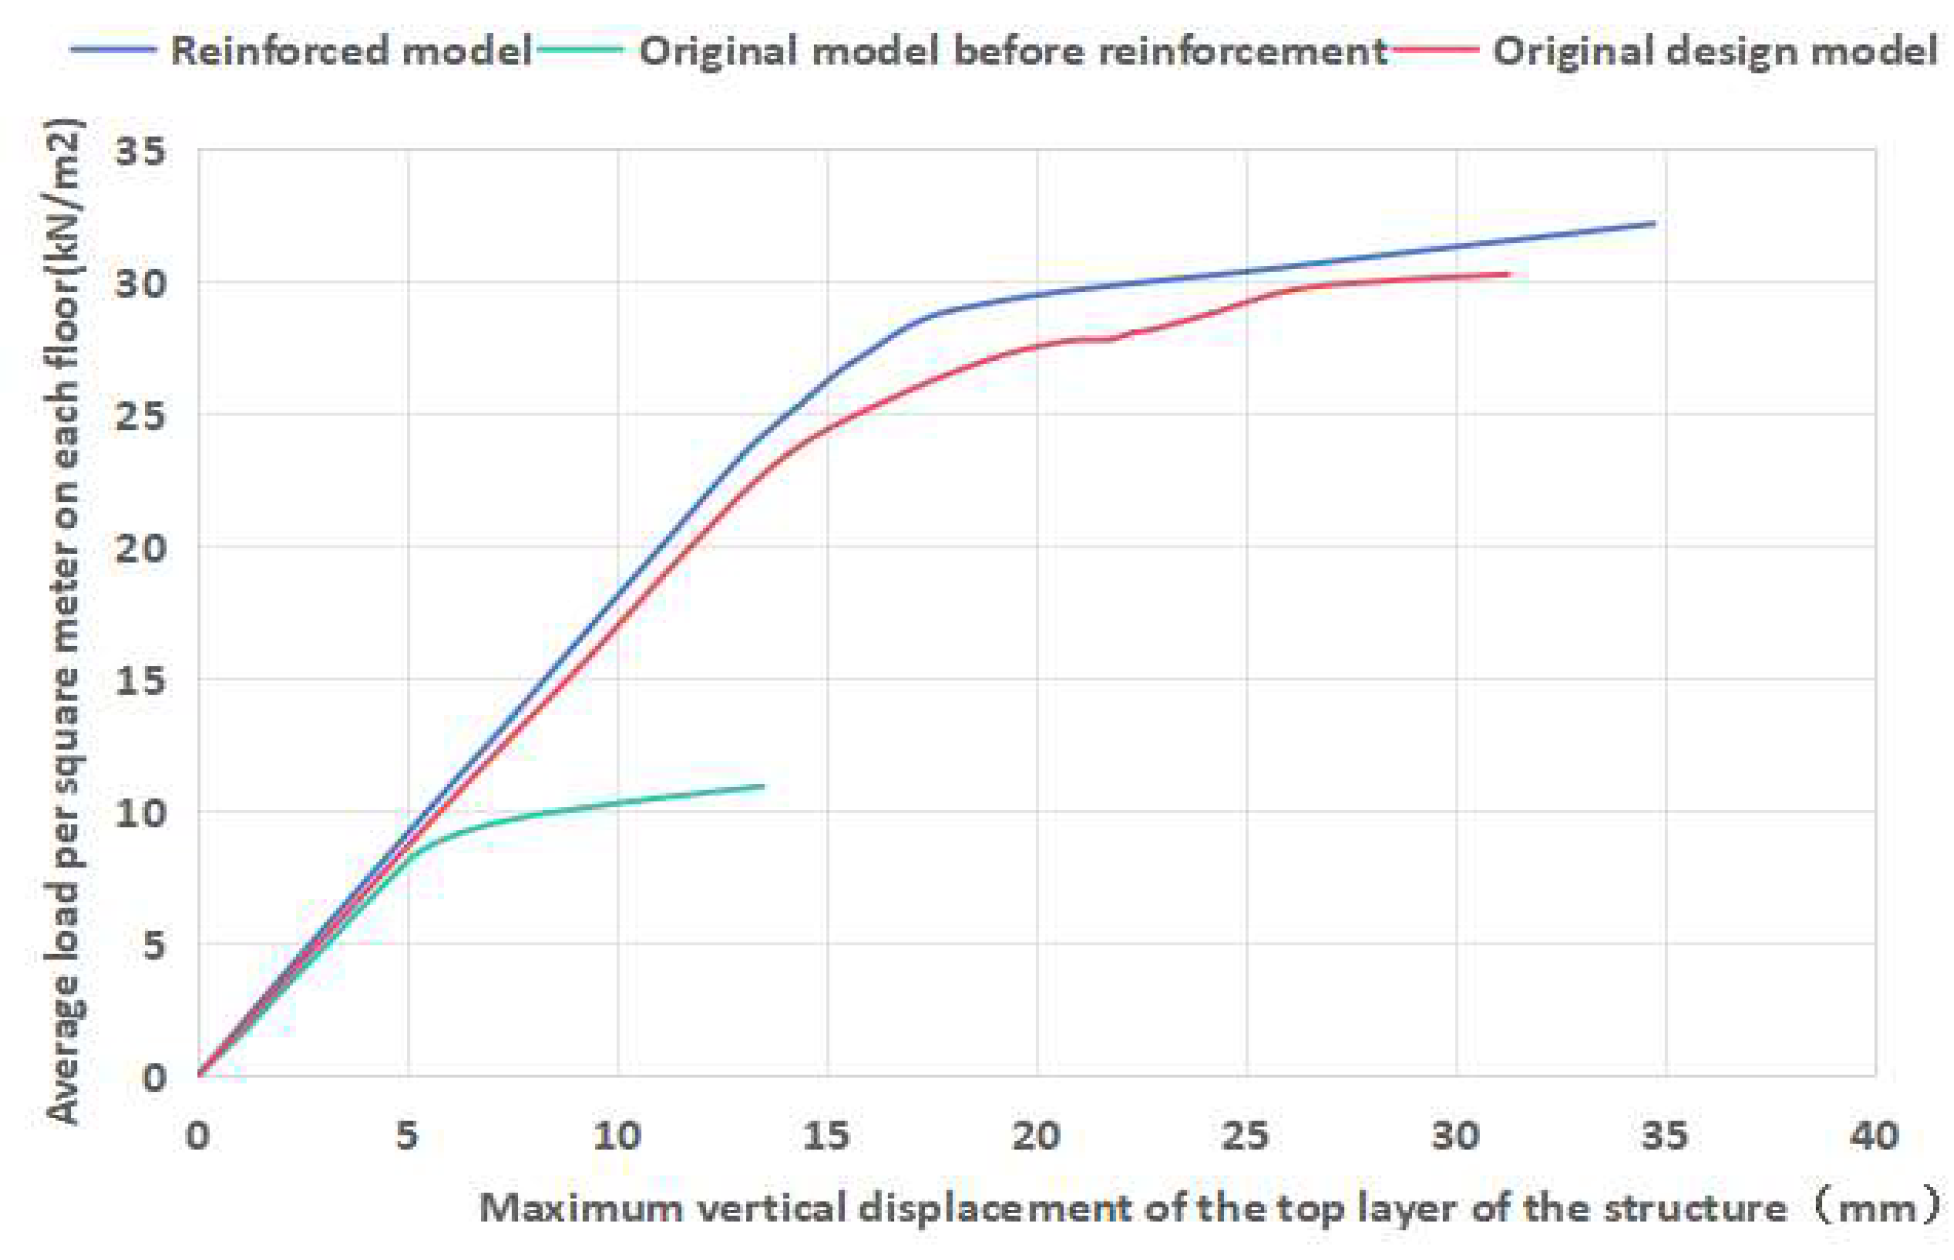
- The vertical ultimate load was applied to the nodes of each floor surface of the original problem structure on the 18th floor (the strength of the shear walls on the 1st–3rd floors did not meet the design requirements). Under the action of the ultimate load, the curve depicting the maximum vertical displacement of the top layer of the structure before and after reinforcement with the change in the load per square meter of the floor surface is shown in Figure 22. It can be seen that the ultimate load of the structure before reinforcement was 10.87 kN/m2, and the maximum vertical displacement of the structure at the time of failure was 13.48 mm; the ultimate load of the original design model was 30.24 kN/m2, and the maximum vertical displacement of the structure at the time of failure was 31.25 mm; meanwhile, the ultimate load of the structure after reinforcement reached 32.15 kN/m2, and the maximum vertical displacement at the time of failure reached 34.73 mm. Compared with the original design and the structure before reinforcement, the bearing capacity and deformation resistance of the reinforced structure have been improved.
Figure 22. Vertical load–displacement curve.
- (5)
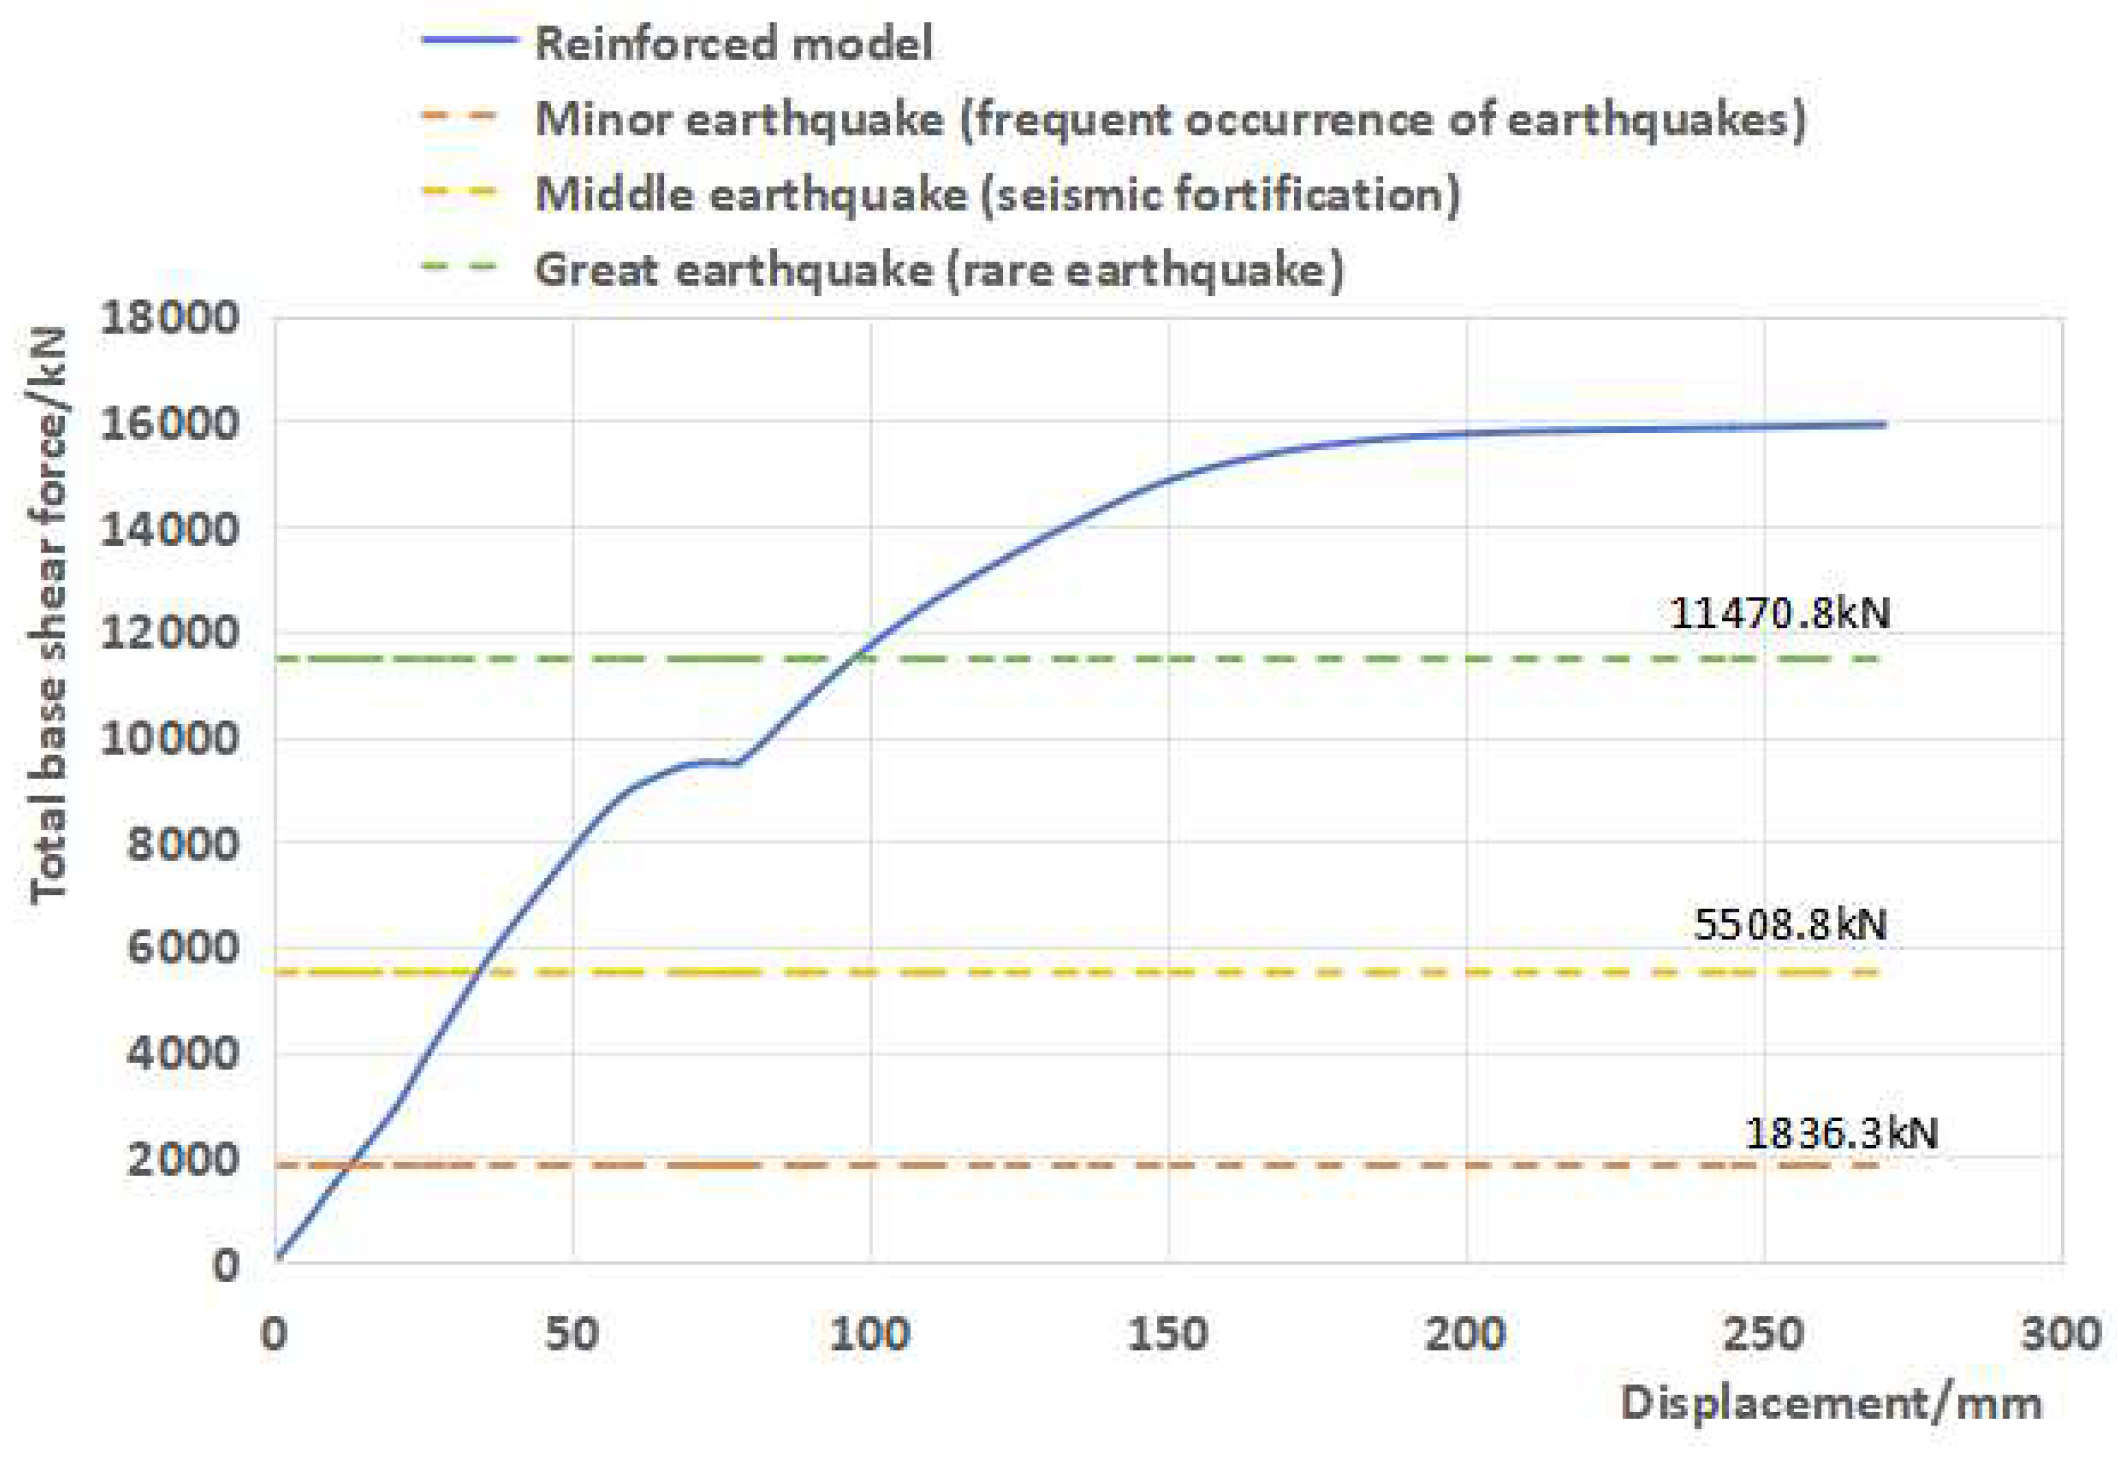
- Figure 23 shows the load–displacement curve of the reinforced overall structure obtained by applying horizontal loads (vertical loads applied at once, horizontal loads applied step by step) according to the “prescribed horizontal force” (seismic code). As shown in the figure, in the early stage of loading, the load–displacement curve roughly changes linearly, and the structure is in the stage of elastic deformation; when the total horizontal load of the structure is applied to 8800 kN, the structure enters the stage of elastic–plastic deformation, and the displacement accelerates with the increase in load. The horizontal ultimate bearing capacity of the reinforced structure can reach 15,906.36 kN, which is about 8.7 times larger compared with the elastic “small earthquake” result of 1836.3 kN (calculated using the PKPM software (Version2020) package), 2.9 times larger compared with the elastic “medium earthquake” result of 5508.8 kN, and 1.4 times larger compared with the elastic–plastic “large earthquake” result of 11,470.8 kN. This indicates that the reinforced overall structure meets the seismic bearing capacity requirements.
Figure 23. Horizontal load–displacement curve.
5. Conclusions
Through simulation analysis and exploratory research on the bearing performance and engineering application examples of the “composite shear wall”-reinforced RC shear wall via the local strengthening and replacement method without a support roof, the following main conclusions are drawn:
- (1)
- Compared with only one batch of replacement reinforcement, the reinforcement of RC shear walls using the method of partial strengthening and replacement without support roof can improve the bearing performance of composite shear walls by delaying the damage and softening the defective concrete in non-replacement areas. The degree of improvement is affected by the initial vertical stress level, whereby it decreases with the increase in the initial vertical stress level.
- (2)
- The reinforcement of RC shear walls with unsupported roof via the section steel–concrete local strengthening and replacement method can significantly improve the bearing performance of the composite shear wall and the collaborative working performance between the replacement area and the non-replacement area by increasing the material strength and stiffness of important load-bearing parts (such as the end of the shear wall and the junction of the longitudinal and transverse walls) to enable the composite shear wall to continue bearing after concrete damage and softening in the non-replacement area.
- (3)
- The VFEAP finite element program was used to simulate and analyze the entire process of replacement reinforcement construction, continuation construction, and daily use (loading) of the actual project by using the unsupported-roof local strengthening replacement method. It was found that the overall structural stress condition of the reinforced structure was good, and the coordination between the wall replacement area and the non-replacement area was good. The vertical and horizontal bearing capacities of the reinforced structure could meet the original design requirements and had a considerable safety reserve (after reinforcement, the vertical bearing capacity of the overall structure increased by about 6.3% compared to the original design, and the horizontal ultimate bearing capacity was about 1.4 times larger compared to the original design’s elastic–plastic “large earthquake” effect).
The unsupported local reinforcement replacement method proposed in this paper demonstrates multiple advantages in terms of structural performance, material savings, and construction convenience. It is primarily a novel reinforcement technique for the upper structure of shear wall structures with quality defects during the construction process. In subsequent research, a geotechnical and structural perspective will be introduced to conduct targeted studies, focusing on the potential key influences of foundation–soil interaction [,] in improving the behavior of shear wall structures. The “high-performance materials” involved in this study mainly refer to high-strength concrete (or self-compacting cement-based grouting materials) and steel-reinforced concrete within the scope of national codes. This research references and utilizes (compares) relevant existing tests, with preliminary results primarily derived from numerical simulation analysis and theoretical research. The research team has scheduled follow-up experiments to further investigate the effects of aspect ratio, multi-stage replacement, and local reinforcement in non-replacement zones on the mechanical performance of partial-strengthening and replacement composite shear walls without a support roof, as well as the reasonable limits of initial vertical stress levels. By continuously refining the theoretical framework and expanding its application scope, it aims to develop more comprehensive and universally applicable research outcomes for reference and adoption in engineering practice.
Author Contributions
Conceptualization, Y.J., G.W., and N.K.; methodology, G.W. and N.K.; investigation, N.K.; formal analysis, N.K., Y.L., Z.Y., J.D. and X.W.; validation, Y.J. and G.W.; data curation, N.K.; writing—original draft preparation, N.K.; writing—review and editing, N.K., Y.J., and G.W.; supervision, Y.J. and G.W.; project administration, Y.J. All authors have read and agreed to the published version of the manuscript.
Funding
The authors gratefully acknowledge the research grant provided by the National Natural Science Foundation of China (No. 51268004(2013.01-2016.12), No. 52268050(2023.01-2026.12).
Data Availability Statement
All data are contained within this article.
Conflicts of Interest
The authors confirm that there are no conflicts of interest.
References
- Wang, J.; Ma, G.; Hwang, H.-J. Numerical Analysis for Cyclic Performance Evaluation of Novel Precast Partial UHPC Shear Walls. J. Build. Eng. 2025, 108, 112896. [Google Scholar] [CrossRef]
- Ding, Y.; Zeng, B.; Zhou, Z.; Wei, Y. Seismic Behavior of Shear Walls Partially Strengthened with UHPC in Boundary Element. Eng. Struct. 2023, 293, 116660. [Google Scholar] [CrossRef]
- Ding, Y.; Zhou, Z.; Wei, Y.; Zhou, S. Experimental Study and Efficient Shear-Flexure Interaction Model of Reinforced Concrete Shear Walls with UHPC Boundary Columns. Case Stud. Constr. Mater. 2024, 20, e03059. [Google Scholar] [CrossRef]
- Hu, R.; Fang, Z.; Benmokrane, B. Nonlinear Finite-Element Analysis for Predicting the Cyclic Behavior of UHPC Shear Walls Reinforced with FRP and Steel Bars. Structures 2023, 53, 265–278. [Google Scholar] [CrossRef]
- Xu, B.; Wang, R.; Zhou, K.; Zhou, X.; Xu, T.; Bian, Q. Research on the Physical Characteristics of a Novel Modified Foamed Cement Slurry with Non-Foamed PVA Material. Constr. Build. Mater. 2025, 459, 139710. [Google Scholar] [CrossRef]
- Jia, Y.; Wei, X.; Wu, G.; Yao, Z.; Deng, J.; Li, A.; Yuan, Z. Simulation analysis of unsupported local strengthening replacement method for RC shear wall. J. Nanchang Univ. 2023, 47, 69–77. [Google Scholar] [CrossRef]
- Lei, T.; Liu, Y.; Li, K.; Jiang, D.; Dong, J. Stress redistribution of Shear Wall Structure with Replacement Reinforcement. J. Archit. Civ. Eng. 2020, 37, 132–141. [Google Scholar] [CrossRef]
- Liu, Y.; Deng, J.; Jia, Y.; Wu, G.; Ke, N.; Wei, X. A Study on the Bearing Performance of an RC Axial Compression Shear Wall Strengthened by a Replacement Method Using Local Reinforcement with an Unsupported Roof. Buildings 2024, 14, 2926. [Google Scholar] [CrossRef]
- Wang, X.; Li, J.; Hu, S.; Li, S.; Xu, Y. Experimental study on seismic performance of partial displacement concrete of shear wall. Build. Struct. 2023, 53, 55–62. [Google Scholar] [CrossRef]
- GB50010-2010; Code for Design of Concrete Structures. Ministry of Housing and Urban-Rural Development of the People’s Republic of China, China Architecture & Building Press: Beijing, China, 2015.
- Fang, Z.; Zhou, H.; Lai, S.; Xie, Q. ABAQUS bond-slip element of reinforced concrete under cyclic loads. Eng. J. Wuhan Univ. 2014, 47, 527–531. [Google Scholar]
- Zhang, X.; Han, P.; Li, Y.; Wang, J.; Ling, G. Seismic behavior of prefabricated alveolar type RC shear walls with cast-in-place embedded columns. J. Build. Struct. 2014, 35, 88–94. [Google Scholar] [CrossRef]
- Park, R. Evaluation of Ductility of Structures and Structural Assemblages from Laboratory Testing. Bull. N. Z. Soc. Earthq. Eng. 1989, 22, 155–166. [Google Scholar] [CrossRef]
- Zhang, Z. The Compressive Bearing Capacity of Normal Section of RC Short Column Reinforced by Section-Increased Method Considering Secondary Loading. Master’s Thesis, Fuzhou University, Fuzhou, China, 2016. [Google Scholar]
- Wang, M.; Shao, M. Basic Principles and Numerical Methods of Finite Element Method; Tsinghua University Press: Beijing, China, 1995. [Google Scholar]
- Chen, H.; Sapri, A.F. The Constitutive Equations of Concrete and Soil; China Architecture&Building Press: Beijing, China, 2004. [Google Scholar]
- Bergan, P.; Holand, I.; Soreide, T. Use of Current Stiffness Parameter in Solution of Nonlinear Problems. In Energy Methods in Finite Element Analysis; Wiley-Interscience: Chichester, UK, 1979; pp. 265–282. [Google Scholar]
- Dong, J.; Lei, T.; Liu, Y. Stress analysis and construction optimization design of unsupported replacement reinforcement of concrete shear wall. Build. Struct. 2023, 53, 122–129. [Google Scholar] [CrossRef]
- GB50367-2013; Code for Design of Strengthening Concrete Structure. Ministry of Housing and Urban-Rural Development of the People’s Republic of China, China Architecture & Building Press: Beijing, China, 2013.
- Bagheri, M.; Jamkhaneh, M.E.; Samali, B. Effect of Seismic Soil–Pile–Structure Interaction on Mid- and High-Rise Steel Buildings Resting on a Group of Pile Foundations. Int. J. Geomech. 2018, 18, 04018103. [Google Scholar] [CrossRef]
- Bagheri, M.; Ranjbar Malidarreh, N.; Ghaseminejad, V.; Asgari, A. Seismic Resilience Assessment of RC Superstructures on Long–Short Combined Piled Raft Foundations: 3D SSI Modeling with Pounding Effects. Structures 2025, 81, 110176. [Google Scholar] [CrossRef]
Disclaimer/Publisher’s Note: The statements, opinions and data contained in all publications are solely those of the individual author(s) and contributor(s) and not of MDPI and/or the editor(s). MDPI and/or the editor(s) disclaim responsibility for any injury to people or property resulting from any ideas, methods, instructions or products referred to in the content. |
© 2025 by the authors. Licensee MDPI, Basel, Switzerland. This article is an open access article distributed under the terms and conditions of the Creative Commons Attribution (CC BY) license (https://creativecommons.org/licenses/by/4.0/).