Abstract
Public perception of traditional villages’ streetscape is a crucial link for unlocking their benefits in promoting physical and mental health and realizing environmental value transformation. Current studies on the influence mechanisms of rural streetscape characteristics on perception largely rely on subjective ratings and mostly depend on linear models. To address this, this study takes a traditional village in eastern China, which is rich in natural and cultural conditions, as an example and constructs an evaluation framework comprising 29 streetscape feature indicators. Based on multimodal data including electroencephalography (EEG), image segmentation, color, and spatial depth computation, XGBoost-SHAP was employed to reveal the nonlinear influence mechanisms of streetscape features on neurophysiological indicators (alpha-band power spectral density, α PSD) in the traditional rural context, which differs from the blue–green spaces and residential, campus, and urban environments in previous studies. The results indicate that (1) the dominant factors affecting α PSD in traditional villages are tree, color consistency, architectural aesthetics, spatial enclosure index, P_EBG, and road, in descending order. (2) Threshold effects and interaction effects that differ from previous studies on campuses, window views, and other contexts were identified. The positive effect of tree view index on α activity peaks at the threshold of 0.09, beyond which diminishing returns occur. Color complexity, including high color difference from the primary village scheme (i.e., low color consistency, color diversity, and visual entropy), inhibits α activity. The effect of spatial enclosure index (SEI) on α activity exhibits an inverted U-shape, peaking at 0.35. Tree–VE_nats, road–SEI, and building–SEI show antagonistic effects. Road–sky and SEI–P_FG display conditional interaction effects. (3) Based on k-means clustering analysis, the “key factor identification—threshold effect management—multi-factor synergy optimization” design can directionally regulate α PSD, promoting relaxed and calm streetscape schemes. This approach can be applied to urban and rural environment assessment and design, providing theoretical and technical support for scientific decision-making.
1. Introduction
One of the current challenges in the built environment is shifting its focus from purely spatial and physical construction to how to create public spaces that actively promote public physical and mental health [1]. In this context, traditional villages’ streetscape, rich in natural elements and local cultural expressions, demonstrates unique value [2] and holds potential for alleviating psychological stress and enhancing mental well-being [3]. This potential restorative benefit largely depends on individuals’ perception of traditional villages’ streetscape, a daily and frequently encountered environmental feature [4]. Therefore, investigating the perception mechanisms of traditional villages’ streetscape is of urgent practical significance for uncovering its unique value as an inclusive psychological healing resource and improving public mental welfare.
Recent advances in cutting-edge technologies have driven significant progress in streetscape research. In data acquisition, high-resolution satellite remote sensing and low-altitude unmanned aerial vehicle (UAV) mapping now provide a complementary macro and micro observational system [5]. At the core technology level, deep learning-based computer vision methods can now automate and scale the identification and quantification of visual elements in streetscape images, such as building façades, vegetation, and street infrastructure [6]. At the data integration and analysis level, geographic information systems (GISs) provide a platform for the spatial integration and visualization of multi-source streetscape data, while big data technologies enable the efficient management, cleaning, and mining of massive streetscape datasets [7]. Furthermore, machine learning prediction models can be trained on multi-source big data. These models can forecast how streetscape changes might affect crowd behavior, social activities, and real estate value [8]. This capability offers forward-looking evaluations for urban renewal strategies. In the emerging interactive domain, virtual reality (VR) and augmented reality (AR) technologies enable immersive streetscape experiences. These technologies have driven a paradigm shift in streetscape research, moving from qualitative descriptions to quantitative analysis and from material form to social perception. This shift provides scientific support for precisely diagnosing and intelligently optimizing living environments [9]. However, despite the increasing sophistication of technological methods, current streetscape research still faces certain limitations in exploring rural streetscape perception and its impact mechanisms.
First, one of the current limitations in streetscape perception research in urban and rural areas is that the acquisition of perception data involves a certain degree of subjectivity. Most studies rely on traditional surveys and questionnaire scoring methods. For example, studies commonly obtain streetscape perception data through methods like Scenic Beauty Estimation [7], the Analytic Hierarchy Process [10] and Semantic Differential [11]. Although these approaches are simple and convenient, they are inherently subjective. In recent years, with the development of neuroscience and brain science technologies, neuro-monitoring methods represented by EEG, eye tracking, functional Magnetic Resonance Imaging (fMRI) have provided support for obtaining objective streetscape perception data [12]. EEG offers millisecond-level temporal resolution and is non-invasive. It can capture the brain’s rapid neural oscillations in response to stimuli, thereby providing reliable physiological evidence for streetscape perception [13]. Applications of EEG in landscape perception mainly include stress recovery [14], emotion perception [15], comfort preference [16], visual attraction mechanisms [17], and landscape fatigue [18,19]. However, most of these studies focus on urban blue-green spaces [14,18], campuses [15], and urban residential landscapes [20]. Few have combined EEG with quantitative analysis of streetscape big data. In particular, rural streetscape contexts have been rarely addressed.
Second, the current streetscape feature indicator systems are mostly based on observable physical attributes of the external environment [21,22], such as green view index, building visibility, building enclosure index, natural index, and grey index [7]. However, there is limited research exploring the neuro-cognitive processing of streetscape visual stimuli in the brain and its association with streetscape features. This gap means that vision-based streetscape perception research lacks a solid physiological and cognitive science foundation, potentially undermining the interpretive accuracy of perception measurement models. Although some studies have integrated natural and artificial streetscape feature indicators based on physiological visual processes [23], they often fail to consider the cultural dimension.
Research in environmental psychology and landscape studies has demonstrated that regional culture shapes people’s perception of space [24]. This is particularly true for traditional villages, where culture forms the core framework of both the landscape characteristics and perceptual significance [25]. Current streetscape research typically uses cultural indicators such as architectural style [21] and semantically segmented elements like people, fountains, and street clothing [26]. These indicators are not suitable for traditional villages. Therefore, a comprehensive streetscape feature indicator system is needed. Such a system should integrate neural cognition with natural, artificial, and cultural dimensions to fully capture streetscape perception mechanisms.
Third, current methodological approaches for examining the relationship between rural streetscape features and human perception still require further advancement. In recent years, interdisciplinary research bridging neurocognition and the built environment (including streetscapes) has developed rapidly. Theoretically, this field is primarily grounded in the Attention Restoration Theory (ART), Stress Reduction Theory (SRT), Arousal Theory, and Prospect & Refuge Theory [15]. Methodologically, it has expanded to include virtual reality (VR)-based immersive environments, along with simultaneous recordings of fMRI, EEG, and ERP, as well as eye tracking, electrodermal activity (EDA), and heart rate variability (HRV) data. Through specific case studies, these approaches reveal how different built environment conditions affect neural activity and physiological responses. Existing empirical studies have demonstrated that, in comparisons between natural and urban environments, exposure to natural landscapes [27] and biophilic design [28] reduces α-band activity, thereby enhancing visual attention. Research has also examined how street friendliness and perceived pressure influence α-band responses during female cycling [29]. Green spaces and vegetation have been found to increase α power, indicating attentional restoration and relaxation [30,31,32]. Regarding luminance, excessively high brightness suppresses α activity, whereas comfortable luminance levels help maintain a higher α power spectral density, promoting relaxation [33]. Other studies have explored the combined effects of light color and luminance on α modulation [34]. In terms of material and form, wooden interiors and curvilinear shapes elevate α activity, corresponding to more relaxed and pleasant visual experiences [35]. At the spatial level, open and legible spatial layouts are associated with higher α activation [36], whereas enclosed or geometrically complex environments elicit greater alertness and spatial cognitive load. Despite the advancement of EEG integration in built environment studies, most research on streetscape-perception relationships still relies on linear models. For example, Pearson correlation analysis [1,3,21,23,37,38,39,40,41], multiple linear regression [3,42,43,44,45,46,47], and principal component analysis (PCA) [6,22,48] are widely used. Although linear models are widely used for their simplicity and interpretability, their assumption of a linear relationship between variables fails to capture U-shaped curves, marginal diminishing effects, and interactions [49].
Machine learning models, such as Random Forests and Gradient Boosting algorithms, offer powerful tools for revealing nonlinear relationships between streetscape features and perception. Unlike traditional linear models, these methods do not require predefined linear or independence assumptions. They are capable of capturing complex threshold effects, synergistic and antagonistic interactions [50]. Moreover, these models are robust to multicollinearity, offer high predictive accuracy, and can reveal underlying driving mechanisms through feature importance or SHAP interpretability analysis [51]. As a result, they have been widely applied in various fields, such as urban heat island effects [52], urban vitality [53], and urban landscape evaluation [49], offering a new research avenue for exploring the nonlinear coupling mechanisms between environment and human perception or emotion.
Currently, a small number of studies based on EEG have explored the nonlinear effects of streetscape features on α PSD, but these studies have primarily focused on environments dominated by multi-story buildings with structured forms, such as campus settings [54] and window views [55]. These study environments differ from the low-rise, organically grown, and culturally rich streetscape features of traditional villages. As such, existing findings may not be applicable to traditional villages. Therefore, it is necessary to investigate the nonlinear impact mechanisms of streetscape features on perception within the context of traditional villages, using EEG and machine learning. By comparing with existing research, this can help identify the commonalities and specificities of streetscape perception mechanisms across different environments, thereby deepening our understanding of the mechanisms of perception formation.
Furthermore, research on rural streetscapes is currently limited compared to urban streetscapes. This is primarily due to the limited availability of rural streetscape data from mapping platforms such as Baidu and Google. Existing rural streetscape studies often rely on manually captured photographs, with datasets typically consisting of fewer than 100 images [4,41,56,57,58]. While these small-sample studies can reflect some local features, they fail to comprehensively capture the diversity and complexity of rural streetscapes. Therefore, there is an urgent need for systematic research on rural streetscapes at the village-wide scale.
In summary, this study selected Shecun, a provincial-level traditional village in Jiangning District, Nanjing, Jiangsu Province, China, as the research subject. Shecun has become a typical rural cultural and tourism destination due to its excellent natural and cultural resources, making it highly representative. We used multimodal data to quantify Shecun’s streetscape features, including color features computation and spatial depth computation, image semantic segmentation, space syntax, machine learning, and expert scoring, as independent variables, and employed EEG-derived alpha-band Power Spectral Density (α PSD) as the dependent variable. The nonlinear influence mechanisms between the above variables were investigated using XGBoost-SHAP. The innovations of this study are as follows:
- (1)
- This study introduced EEG-derived α PSD into streetscape big data analysis. By objectively quantifying physiological responses to streetscape perception through EEG, it provides an effective breakthrough to overcome the subjectivity limitations inherent in traditional questionnaire-based measurements. Furthermore, the significant correlation between subjective questionnaires and objective physiological data (α PSD) validates the effectiveness of α PSD in perception assessment.
- (2)
- Based on neural cognitive mechanisms, we constructed a streetscape feature index system integrating natural, artificial, and cultural dimensions, encompassing 29 indicators. This streetscape indicator system can be applied to the construction of independent variables for both urban and rural built environments. It represents an advancement over existing frameworks of streetscape feature indicators, which have rarely integrated neural–cognitive mechanisms and regional cultural dimensions.
- (3)
- This study successfully addressed the challenge of nonlinear modeling in traditional EEG-based landscape perception research caused by small sample sizes (e.g., n = 3 [59], 4 [12], 10 [16,57], 20 [60], 36 [61]). By increasing the sample size to 346, the study leveraged larger datasets as a foundation for nonlinear modeling. We employed Support Vector Regression (SVR) and eXtreme Gradient Boosting (XGBoost) alongside linear models (OLS) for comparison. The XGBoost model, selected for its optimal predictive performance, revealed the nonlinear mechanisms linking traditional village streetscape features and perception (α PSD). This approach overcomes the limitation of conventional linear models in streetscape research, which primarily identify correlations or variable importance.
2. Materials and Methods
2.1. Research Area
The case study of this research, Shecun Village, is a traditional village located in the southeastern part of Zijin Mountain, about 13 km from the city center of Nanjing, in Jiangsu Province (Figure 1). The village has a subtropical humid monsoon climate and is geographically surrounded by Qinglong Mountain and Huanglong Mountain, providing a favorable ecological environment. Founded at the end of the Yuan Dynasty and the beginning of the Ming Dynasty, the village is approximately 640 years old and has a rich historical and cultural heritage. Shecun is well-known for its “Seven Ancient Sites” and the existing Pan family ancestral hall, ancient wells, and old round cypress trees. The architectural style of the village combines the Huizhou style with the local characteristics of Nanjing. Since 2017, Shecun has leveraged the ecological advantages of Qinglong Mountain to successfully transform from a mining village into a model for urban–rural integration in agriculture, tourism, and culture through its unique pastoral landscape construction.
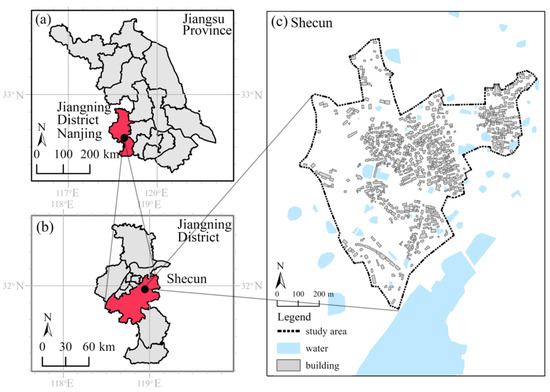
Figure 1.
Study area: (a) Jiangsu Provence; (b) Jiangning District, Nanjing; (c) Shecun.
In this context, it is necessary to take such a Chinese Jiangnan traditional village, which possesses superior natural and cultural conditions and mature tourism development, as an example to explore the influence mechanisms of streetscape features on perception and to identify intrinsic patterns that enhance streetscape perception. The research outcomes can offer practical references for rural landscape management, streetscape design, and sustainable development strategies.
2.2. Research Framework
Figure 2 presents the research flowchart, as detailed below.
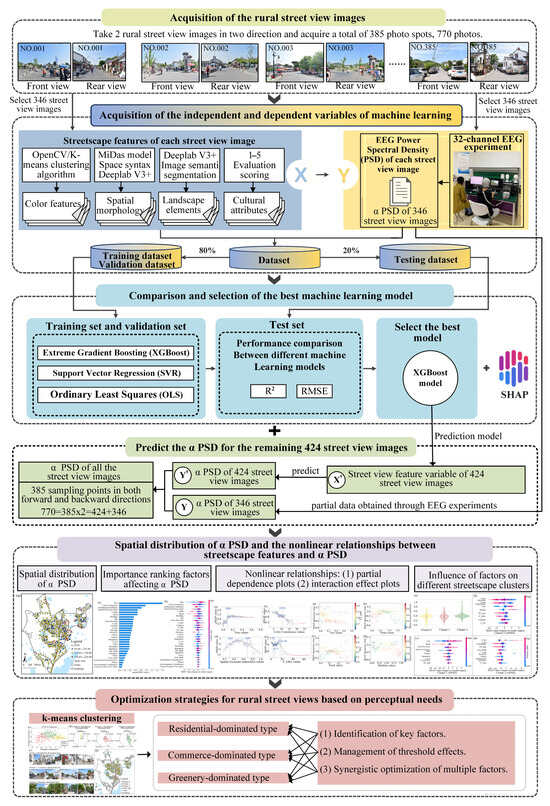
Figure 2.
Research flowchart.
- (1)
- Streetscape image collection
A total of 770 streetscape images were collected from 385 acquisition points in Shecun, capturing both forward and backward directions, serving as the research dataset.
- (2)
- Acquisition of independent and dependent variables for machine learning
The independent variable X consisted of streetscape feature data derived from 346 selected images. The dependent variable Y was the α PSD for each streetscape image obtained from electroencephalography experiments.
- (3)
- Machine learning model construction and nonlinear mechanism analysis
Two machine learning models and a linear model were evaluated, with XGBoost identified as the best-performing model. SHAP values were then used to reveal the nonlinear mechanisms by which rural streetscape features influence α PSD.
- (4)
- Prediction of rural streetscape α PSD based on machine learning
Using a random forest algorithm with proven predictive performance [38], a prediction model was trained on 346 datasets obtained from EEG experiments and used to predict the α PSD of the remaining 424 streetscape images.
- (5)
- K-means clustering and streetscape optimization strategies
Streetscapes were classified into three types using K-means clustering. Based on SHAP analysis and K-means clustering results, optimization strategies were proposed for different streetscape types to regulate α PSD, promoting relaxation and calmness.
2.3. Integration of Streetscape Features
Previous research [26] has demonstrated the rationality of constructing a streetscape indicator system based on the three dimensions of natural, artificial, and cultural elements. Building on this foundation, the present study integrates these three dimensions with neurocognitive mechanisms to develop a streetscape feature indicator system (Figure 3). The specific process is as follows:
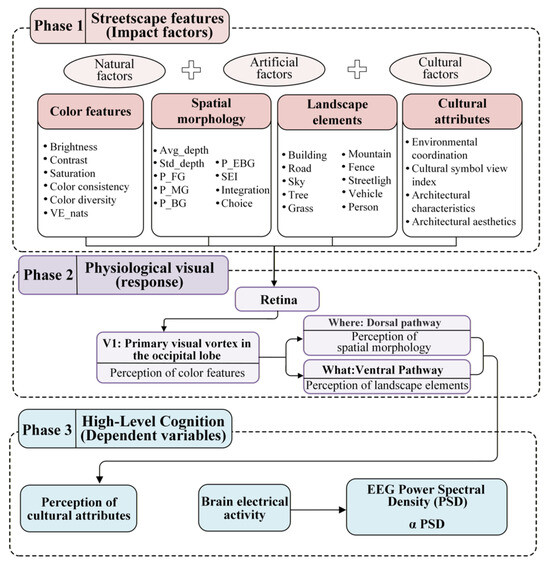
Figure 3.
The coupling mechanism between streetscape features and neurocognition.
- 1.
- Perception of color features
In the real world, light and color information are transmitted through the retina and converted into neural electrical signals. These signals are relayed through the lateral geniculate nucleus (LGN) (for related concepts, see Appendix A) to the primary visual cortex (V1) in the occipital lobe [62]. During this process, fundamental color features such as hue, brightness, and contrast in the streetscape are preliminarily decoded and perceived.
- 2.
- Perception of space morphology
Visual information in V1 is further divided into two pathways, one of which is transmitted to the parietal lobe and ultimately to the frontal lobe. This process constitutes the “where” pathway, which is responsible for identifying spatial features [63]. Accordingly, we have constructed space morphology-related indicators, which include spatial depth, spatial enclosure index, and indicators related to integration and choice. The spatial morphology forms the basis of perceived scene order and openness. The proportional relationships among the foreground, midground, background, and far ground provide a quantitative representation of spatial depth. The spatial enclosure index (SEI) represents the degree of enclosure along both sides of a street and is determined by the image proportion of façade buildings, vegetation, and other elements [64]. Integration and choice are metrics derived from space syntax, representing global accessibility and traversability, respectively.
- 3.
- Perception of landscape elements
The other pathway of visual information in V1 travels through the fusiform gyrus and perirhinal cortex before reaching the frontal lobe. This process is known as the “what” pathway, which is responsible for recognizing object contours and specific attributes [65]. Accordingly, we have constructed the landscape elements within the streetscape feature indicator system. The landscape elements have been proven to be key factors influencing streetscape perception [39,49].
- 4.
- Cultural attributes and streetscape perception (α PSD)
After initial processing, the prefrontal association cortex plays a crucial role in higher cognitive functions. This part of the brain is responsible for integrating visual information with memory and emotional experiences, enabling complex cognitive activities such as cultural recognition, aesthetic evaluation, and behavioral decision-making [62]. This process corresponds to the dependent variable EEG PSD in this study and to the cultural attributes among the streetscape feature indicators. The secondary indicators for cultural attributes include environmental coordination, cultural symbol view index, architectural characteristics, and architectural aesthetics.
In summary, this study integrates the aforementioned neurocognitive mechanisms with the natural, artificial, and cultural dimensions to construct a framework of rural streetscape feature indicators, as shown in Table 1. The indicator system is divided into four components. Among them, color features are shared across the natural, artificial, and cultural categories, as all streetscape features are inherently expressed through color. Space morphology, which involves spatial depth, enclosure, and accessibility, is defined through streetscape characteristics across the natural, artificial, and cultural dimensions, and therefore encompasses all three aspects. In the proposed streetscape feature indicator system, the natural dimension represents the fundamental natural landscape components of a place, consisting of sky, trees, grass, and mountains. The artificial dimension reflects human-constructed elements within the streetscape, such as buildings, roads, fences, streetlights, and vehicles. The cultural dimension refers to the cultural connotations that can be interpreted from the streetscape, and in this study specifically includes environmental coordination, cultural symbol view index, architectural characteristics, and architectural aesthetics. It is important to emphasize that the aforementioned artificial indicators quantify only streetscape elements visual proportion within the image, without assessing their cultural connotations. For example, in Table 1, the “building” item under the landscape elements category merely represents the visual proportion of buildings in the image, without quantifying their cultural attributes. In contrast, the four indicators under the cultural attributes category constitute a systematic assessment of cultural connotations. Therefore, the artificial and cultural dimensions are fundamentally distinct.

Table 1.
Rural streetscape feature indicators.
- (1)
- Brightness, contrast and saturation
This study calculated image brightness, contrast, and saturation using the OpenCV library in Python (v 3.9). The brightness value was calculated from Equation (1):
where B represents the average brightness, N is the total number of pixels in the image, and pi is the brightness of the i-th pixel, calculated as the average of its RGB values.
The contrast was calculated from Equation (2):
where C denotes the contrast, pi is the brightness of the i-th pixel, and represents the mean brightness of all pixels.
The saturation value was calculated from Equation (3):
where S represents the average saturation, pi is the saturation level of the i-th pixel calculated through the HSV color model, and N is the total number of colors.
- (2)
- Color Consistency and color diversity
To quantify color consistency, this study calculated the difference between the dominant colors of each streetscape image and the dominant colors of all other images. First, the k-means clustering algorithm was used to extract the four dominant colors with the largest area proportions from each streetscape image. This number was determined based on research findings that the human eye can effectively memorize and recognize approximately four colors in a scene [7]. Subsequently, the four dominant colors from a single image were paired with all dominant colors from all other streetscape images. The Euclidean distance between each pair was computed in RGB color space, and the pair with the shortest distance was selected as the matching result. Finally, the color difference (Euclidean distance) between each matched pair was multiplied by its corresponding area proportion weight, and the weighted mean of all pairs was used as the color consistency [66] (Figure 4). The color consistency was calculated from Equation (4):
where CC denotes the color consistency of a single panoramic image; (i, j) represents the pair of dominant colors between images with the shortest Euclidean distance; is the dominant color among all images; Cj is the dominant color in the target image; Pi and Qⱼ are the area proportion weights of the respective dominant colors. k represents the total number of dominant colors, which was set to four in this study.
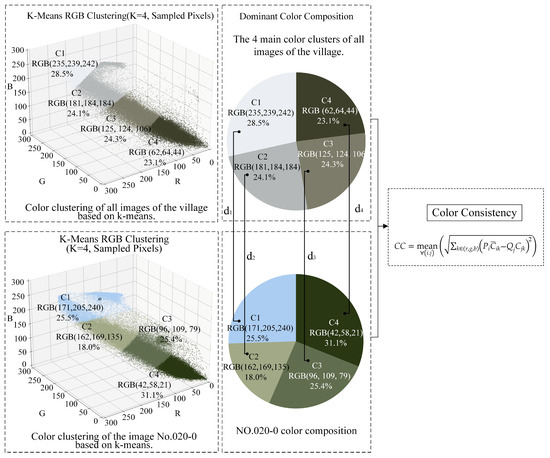
Figure 4.
Schematic diagram of color consistency and diversity calculation based on Euclidean distance.
The color diversity was calculated based on the RGB vector spatial distribution of the four dominant colors in each streetscape image, combined with their area proportion weights. It was expressed as the square root of the weighted sum of squared Euclidean distances between each dominant color and the mean RGB vector of all streetscape images. The color diversity was calculated from Equation (5):
where K denotes the total number of dominant colors (set to four in this study), Ci is the RGB vector of the i-th dominant color in a single panoramic image, is the average RGB vector of all dominant colors across images, and Qi is the area proportion of the i-th dominant color.
Visual entropy (VE_nats) is an information theory–based metric used to quantify the complexity of an image. The visual entropy was calculated from Equation (6):
where Pᵢ represents the proportion of pixels belonging to the i-th color category relative to the total number of pixels.
- (3)
- Spatial depth
This study calculated six spatial morphology parameters (mean depth, depth standard deviation, and the proportions of foreground, midground, background, and far background) based on the MiDaS deep learning model [67]. The calculation process was as follows. A convolution–Transformer hybrid network was applied to encode multiscale features of each image. A scale-invariant loss function and geometric constraints were used to optimize the depth estimation, producing pixel-level relative depth maps. The estimated depth values were normalized into 0–255 grayscale depth maps. According to depth thresholds, the space was divided into four regions, and the pixel proportions of each region were calculated to quantify their composition (Figure 5). The four spatial types were calculated from Equations (7)–(10):
where PFG, PMG, PBG, and PEBG represent the proportions of the four spatial types (foreground, midground, background, and far background, based on the depth value di of image i; 1 condition (di) is an indicator function that equals 1 when the condition is met and 0 otherwise.
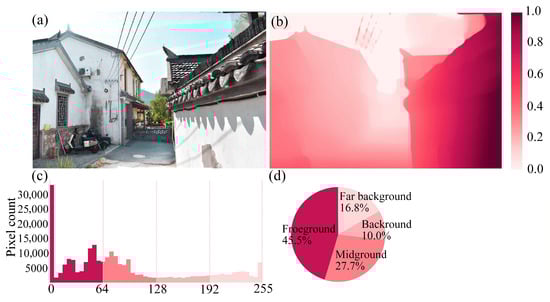
Figure 5.
Depth calculation and spatial form classification: (a) Streetscape; (b) Depth map of the streetscape; (c) Histogram of pixel count for depth values; (d) Spatial form classification pie chart.
- (4)
- Spatial enclosure index
The spatial enclosure index refers to the degree of spatial enclosure formed by elements on both sides of the street. This index is defined as the proportion of pixels classified as building, tree, and streetlight to the total number of pixels in the streetscape image.
- (5)
- Integration and choice
Integration and choice are two core indicators in space syntax theory used, respectively, to measure the accessibility of a spatial unit to the overall network and its frequency or mediating potential of being traversed along the shortest paths. Both indicators were calculated using Depthmap (v X0.8.0).
- (6)
- Image semantic segmentation
This study utilizes the DeepLabV3+ model and the ADE20 K dataset to perform semantic segmentation of streetscape images, extracting the pixel proportions of various landscape elements within the images (Figure 6). The DeepLabV3+ model employs an encoder–decoder architecture, incorporating the atrous spatial pyramid pooling (ASPP) module, which effectively captures multi-scale contextual information. Additionally, the model leverages the decoder to integrate low-level features, enhancing boundary segmentation accuracy [68]. The ADE20K dataset covers over 150 complex scene and semantic categories, enabling the model to demonstrate excellent scene generalization and understanding capabilities [69]. It has shown high accuracy, robustness, and strong transfer adaptability in multi-class semantic recognition tasks, such as those involving urban and rural built environments and natural landscapes, making it highly suitable for streetscape feature extraction [68].
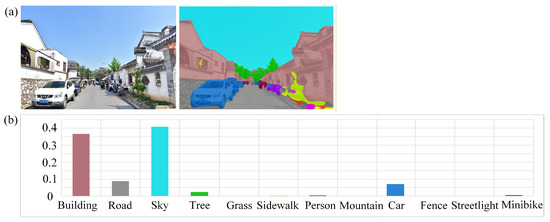
Figure 6.
Image semantic segmentation and streetscape element illustration: (a) Rural streetscape panorama; (b) DeeplabV3+ semantic segmentation result.
- (7)
- Cultural attributes
To assess the reliability of expert ratings, the intraclass correlation coefficient (ICC) method, consistent with Cloquell-Ballester [56], Quang Hoai Le [70], Klakk [71], was applied to examine the inter-rater reliability of 32 experts’ evaluations across four cultural attribute dimensions. The ICC (2, k) values, calculated using a two-way random-effects model with absolute agreement, were 0.896, 0.919, 0.909, and 0.937 for the four dimensions, respectively (all greater than 0.75). These results indicate a high level of inter-rater reliability among experts across all dimensions.
2.4. Rural Streetscape Image Collection
Given that open data platforms such as Baidu and Google Street View have not yet covered internal village streets, this study used streetscape images of Shecun obtained through on-site photography as the data source. The images were captured on 20 and 27 April 2025, under clear weather conditions. Photography simulated pedestrian perspectives using a 24 mm focal length lens, with the camera set at a height of 1.5 m. Images were captured along the road centerline at intervals of 30 m with a horizontal 4:3 aspect ratio. At each collection point, images were taken in both forward and backward directions, resulting in a total of 770 images covering 385 collection points. This placement strategy covers all built-up areas of Shecun and effectively reflects the pedestrian visual experience in the real environment.
2.5. EEG Experiment and Data Processing
2.5.1. Experimental Procedure
A total of 30 healthy university students (15 males and 15 females, aged 20–30 years, mean age = 24.1 years) participated in this study. All participants self-reported no history of major physical or neurological disorders. The study protocol was approved by the institutional review board of the authors’ university. Before the experiment, the procedure was explained in detail, and written informed consent was obtained from each participant, stating that the collected data would be used for scientific research and publication. After the collection of basic demographic information, the EEG acquisition device was fitted to each participant.
To reduce fatigue and maintain attention during the experiment, the total duration for each participant was approximately 32 min. The EEG experimental procedure was as follows: a fixation cross (“+”) appeared at the center of the screen for 500 ms, followed by the presentation of a streetscape image for 3000 ms. After the image disappeared, a blank screen was shown for 1500 ms. All 346 streetscape images were evenly divided into four experimental sessions, with a 1 min eyes-closed rest period between consecutive sessions (Figure 7).
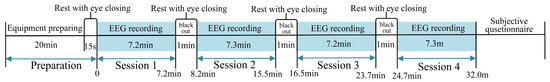
Figure 7.
Experimental procedure.
The frequency range of 8 Hz–13 Hz is defined as the alpha band, which is prominent during relaxed states but diminishes or disappears when attention or concentration increases [12]. The PSD of the alpha band has been recognized as a physiological indicator of brain relaxation [72]. However, whether this indicator can consistently reflect subjective relaxation remains to be empirically validated. Therefore, after the EEG experiment, participants rated the perceived relaxation induced by each of the 346 images using a 5-point Likert scale based on three items: “I feel calm,” “I feel relaxed,” and “I feel tense.” Each item was rated from 1 (“strongly disagree”) to 5 (“strongly agree”), with the third item reverse-coded. The mean score across the three items represented the perceived relaxation level, where higher scores indicated greater relaxation. Correlation analysis between relaxation scores and α PSD showed a significant positive relationship (p < 0.01).
2.5.2. EEG Data Recording
The experiment was developed using E-Prime 3.0 software and displayed on a 17-inch CRT monitor. EEG signals were recorded with a 32-channel BrainAmp amplifier system (Brain Products, Gilching, Germany) at a 1000 Hz sampling rate. The reference electrode was placed at FCz, and the ground electrode was positioned at the frontal center. Horizontal (HEOG) and vertical electrooculograms (VEOGs) were recorded to monitor eye movements, with impedance levels maintained below 10 kΩ for all electrodes throughout the experiment.
2.5.3. Power Spectrum Density Analysis
EEG preprocessing and spectral analysis were performed in Python using MNE-Python (v1.10.0). Continuous BrainVision recordings were imported together with EOG channels and registered to the 10-10 (EasyCap-M1) montage. Signals were downsampled to 250 Hz, band—pass filtered at 1–45 Hz using a zero-phase FIR filter, and re-referenced to the common average of EEG channels. Ocular artifacts were removed with ICA (FastICA implementation, 1000 iterations). ICA components associated with eye activity were automatically identified by correlating component time courses with VEOG/HEOG and rejected using an outlier threshold of 2.0 applied to the z-scored correlation scores. EOG channels were removed prior to epoching and spectral analysis.
Task events were segmented into epochs spanning −500 to 3000 ms relative to stimulus onset, with baseline correction applied over the −500–0 ms interval. An automated trial-level artifact screen excluded any epoch with a peak-to-peak amplitude exceeding 150 uV in any EEG channel. For each retained epoch, power spectral density (PSD) was estimated with Welch’s method (MNE defaults, DC offset removed) for frequencies ranging from 8 to 13 Hz (Alpha). Band-limited power was computed for the canonical alpha frequency range (8–13 Hz). For regional analyses, channel-wise PSD was averaged within a predefined frontal cluster including Fp1, Fp2, F3, F4, Fz, F7, and F8. These brain regions collectively constitute the frontal network, which is involved in higher-order cognitive processes, including emotion regulation, executive function, and decision-making.
2.6. Machine Learning Models
This study compared the performance of two machine learning models—support vector regression (SVR) and eXtreme Gradient Boosting (XGBoost)—and a linear model (ordinary least squares, OLS) to identify the optimal model for exploring nonlinear mechanisms. A combination of Bayesian optimization and five-fold cross-validation was employed for hyperparameter tuning. Specifically, the dataset was divided into a training-validation set (80%) and a testing set (20%). A nested cross-validation framework was then constructed within the training-testing process. The inner loop used Bayesian optimization based on five-fold cross-validation to search for optimal hyperparameters, while the outer loop evaluated the generalization performance of candidate models on the testing set. By setting the number of iterations to n, n candidate models were generated and ranked according to predefined evaluation criteria, with the top ten models retained. These ten models were further tested on the testing set to assess predictive performance, retaining only those with superior generalization ability and excluding models exhibiting poor performance or overfitting tendencies. Finally, the model with the optimized hyperparameters was retrained on the full dataset to obtain the most stable parameter estimates and predictive performance.
2.7. SHAP
SHAP (Shapley Additive exPlanations) is a game-theory-based method for enhancing the interpretability of machine learning models. It works by calculating the marginal contribution of each feature to the model’s predictions, providing an attribution-based explanation for individual predictions [73]. The core advantage of SHAP lies in its solid mathematical foundation, which ensures fairness and consistency in the allocation of feature contributions. This method offers both global and local model transparency, making it a crucial tool for interpreting complex black-box models [74]. Therefore, this study employs the XGBoost-SHAP model to explore the nonlinear impact mechanisms of streetscape perception in traditional villages.
3. Results
We compared the regression performance of two machine learning models, XGBoost and SVR, with that of the linear model (OLS). The regression results on the testing set showed that XGBoost achieved the highest R2 and the lowest RMSE, confirming its superior predictive performance (Table 2). XGBoost, as a typical gradient boosting algorithm, introduces an objective function containing both L1 and L2 regularization terms, which effectively control model complexity and significantly enhance generalization performance [75,76].
Table 2.
Performance comparison of different machine learning models.
3.1. EEG PSD and Spatial Distribution
The best-performing model, XGBoost, was selected to predict the α PSD values of the remaining 424 streetscape images. A total of 385 data collection points across Shecun were analyzed in both forward and backward directions to obtain the α PSD distribution across the entire village. The α PSD data from these 385 points were spatially visualized using ArcGIS Pro 3.0 (Figure 8).
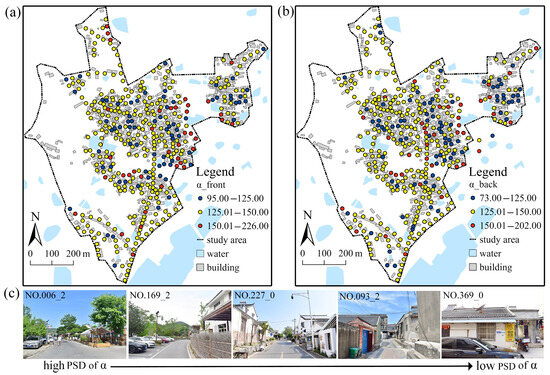
Figure 8.
Spatial distribution of α PSD and representative streetscapes: (a) α PSD of front direction; (b) α PSD of back direction; (c) Streetscape.
High α PSD values were mainly distributed along the village periphery or in relatively open interior areas, forming scattered spatial patterns often associated with a higher proportion of the tree view index. In contrast, low α PSD values were concentrated in densely built-up areas within the village, typically forming small clusters characterized by a higher building view index (Figure 8).
3.2. Influence of Streetscape Features on EEG PSD
Evaluating the relative importance of streetscape features that influence α PSD helps identify the key factors driving its variation [9], addressing the second research question: which streetscape features most strongly affect α PSD? The SHAP-based feature importance ranking visualizes each variable’s mean contribution to model predictions through the length of corresponding bars. As shown in Figure 9a, the key streetscape features influencing α PSD, ranked by importance, were tree, color consistency, architectural aesthetics, spatial enclosure index, P_EBG, and road. These features collectively cover the four indicator dimensions proposed in this study: color features, spatial morphology, landscape elements, and cultural attributes. Among them, tree was the most influential feature, confirming the positive psychological and restorative effects of greenery. Color consistency and architectural aesthetics followed closely in importance.
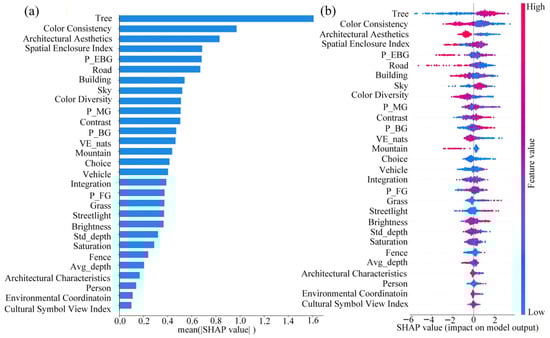
Figure 9.
Feature importance ranking of streetscape attributes influencing α PSD: (a) Feature importance ranking; (b) Beeswarm plot.
Based on the four categories of primary indicators (Table 1) associated with the 29 factors, the average absolute SHAP value (|SHAP value|) was calculated for each category. Comparison of these averages revealed the ranking of primary indicators influencing α PSD as follows: landscape elements > spatial morphology > color features > cultural attributes. This indicates that landscape elements (such as tree view index) and spatial morphology (such as spatial enclosure index) play a critical role in inducing α-wave activity and promoting mental relaxation. Although color features and cultural attributes contributed less overall, certain key factors within these categories (e.g., color consistency and architectural aesthetics) exhibited significant influence on the model output, ranking second and third, respectively.
Landscape elements constitute the material foundation of a streetscape. As tangible components that shape visual perception, they directly determine whether an environment possesses the resources necessary to support relaxation, representing one of the most significant factors influencing α PSD. For instance, natural elements—such as trees—are widely recognized as key positive stimuli that elicit relaxation responses, whereas excessive building density tends to induce a sense of oppression, thereby weakening the restorative effect. Indicators related to space morphology are closely associated with the perception of spatial safety. Overly open spaces may evoke subconscious feelings of insecurity, prompting heightened vigilance and suppressing α activity. In contrast, moderately enclosed spaces create a sense of refuge and convey safety signals to the brain, reducing perceived potential risk and enhancing relaxation [77]. Collectively, landscape elements and space morphology, as the primary sources of material structure and perceived safety, jointly constitute essential preconditions for mental relaxation. The importance of color features ranks below these two dimensions, suggesting that color primarily serves a modulatory role once the material composition and sense of safety are established. Color information is transmitted through the visual system to the brain and, via its connections with the limbic system, directly influences emotional responses [78]. The overall impact of cultural attributes on α activity is the weakest, indicating that higher-order cognitive processes involving cultural recognition and semantic interpretation exert a more indirect and limited influence on α PSD compared with more immediate environmental stimuli.
Figure 9b presents a beeswarm plot illustrating the density distribution and structural characteristics of high-dimensional feature data. The results show that among the top three key factors influencing α PSD, tree contributed positively to α PSD, whereas color consistency and architectural aesthetics contributed negatively. The SHAP value distributions of all streetscape features followed three general patterns: (1) SHAP values increased with higher feature values, as observed for tree, sky, P_BG, and grass; (2) SHAP values decreased as feature values increased, as seen for color consistency, architectural aesthetics, and road; (3) the maximum or minimum SHAP values appeared at intermediate feature levels, indicating nonlinear effects on model output, such as those observed for SEI, P_EBG, building, and Avg_depth.
The spatial visualization of the top four factors influencing α PSD is shown in Figure 10. Points with higher tree view index values are mainly distributed along the village periphery. It is noteworthy that the overall tree view index of Shecun remains low, indicating an urgent need for improvement. The difference in color consistency between the front and rear directions is the most pronounced, with high and low value areas located on the western and eastern sides, respectively. This suggests that the dominant hue on the west side is more consistent with the overall color tone of the village, while the east side shows the opposite pattern. Figure 10 indicates that the village exhibits high aesthetic value, with low-value clusters appearing only in the eastern group. The spatial distribution of SEI values shows a clear spatial aggregation pattern, where the main north–south roads and peripheral areas present open spaces, while the interior high-density residential blocks are characterized by strong spatial enclosure.
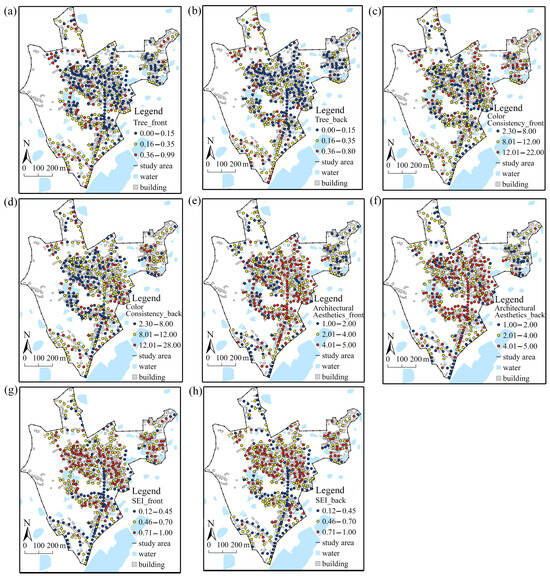
Figure 10.
Spatial distribution of key factors influencing α PSD: (a,b) Tree (front and back); (c,d) Color consistency (front and back); (e,f) Architectural aesthetics (front and back); (g,h) SEI (front and back).
3.3. Nonlinearity and Interactions
Figure 11 presents the partial dependence plots, and Figure 12 shows the interaction plots. Based on these two figures, we discuss the nonlinear influence mechanisms between streetscape feature variables and α PSD, covering key thresholds, marginal diminishing effects, and interaction patterns.
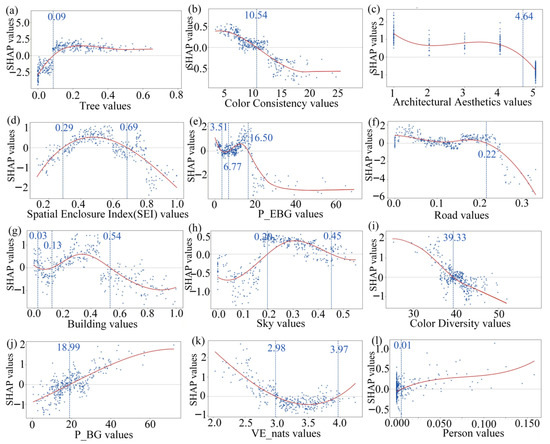
Figure 11.
Key dependence plots of α PSD: (a) Tree; (b) Color consistency; (c) Architectural aesthetics; (d) Spatial Enclosure Index (SEI); (e) P_EBG; (f) Road; (g) Building; (h) Sky; (i) Color diversity; (j) P_BG; (k) VE_nats; (l) Person.
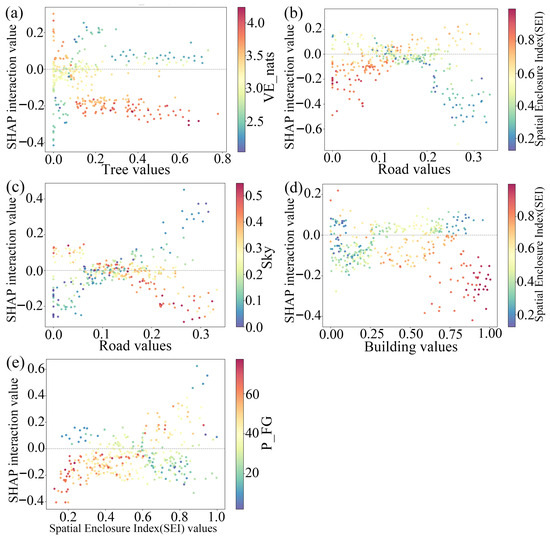
Figure 12.
Partial interaction effects influencing α PSD: (a) Tree—VE_nats; (b) Road—Spatial Enclosure Index (SEI); (c) Road—Sky; (d) Building—Spatial Enclosure Index (SEI); (e) Spatial Enclosure Index (SEI)—P_FG.
3.3.1. Nonlinear Effects of Color Features
In terms of color features, color consistency and color diversity are two important variables influencing α PSD. The former is the second most significant factor affecting α PSD. A higher value of color consistency indicates a greater deviation from the dominant hue of the village streetscape, while a lower value indicates greater alignment. As shown in Figure 11b, α PSD increases as the streetscape hue becomes more consistent with the dominant tone. This suggests that a coherent and harmonious color environment is more conducive to inducing relaxation and psychological comfort. A unified color tone reduces the need for the visual system to allocate resources towards resolving conflicts or filtering information. This allows the brain to transition more smoothly into a low-energy, relaxed state, thereby promoting relaxation and psychological soothing effects [79]. Similarly, color diversity negatively influences on α PSD. Excessive color richness may disperse visual interest and increases attentional load [80]. This requires the brain to devote more resources to visual information processing, which weakens the relaxation effect.
3.3.2. Nonlinear Effects of Space Morphology
Within the space morphology category, SEI and P_EBG are key factors influencing α PSD. SEI exhibits an inverted U-shaped relationship with α PSD, reaching a peak (turning point) at approximately SEI ≈ 0.5 (Figure 11d). This indicates that semi-enclosed spaces contribute to relaxation, whereas overly low values can evoke a sense of emptiness and unease [81], and excessively high values may induce a feeling of oppression, weakening α activity. This finding aligns with previous studies on healing spaces [82]. P_EBG is the second most influential space morphology indicator affecting α PSD. When P_EBG < 16.5%, its effect on α PSD is predominantly positive; however, excessively high values suppress α activity. Overly expansive far backgrounds may reduce spatial detail and visual richness, thereby diminishing perceived safety and privacy [81]. The effects of space morphology on α PSD can be explained from the perspective of the sense of safety provided by spatial enclosure. When the degree of enclosure is too low or the proportion of distant views is excessively high, the resulting openness may evoke a feeling of emptiness. According to evolutionary psychology, such open and unshielded environments may activate humans’ primitive alert mechanisms—a subconscious fear of predators and threats—thereby suppressing the relaxation effect [83].
3.3.3. Nonlinear Effects of Streetscape Elements
Within the category of streetscape elements, the key variables affecting α PSD are tree, road, building, and sky. Tree exerts a positive influence on α PSD (Figure 11a), indicating that, similar to indoor environments [84] and urban residential areas [85], trees in rural streetscapes also enhance the activity of α rhythms. This aligns with humans’ innate tendency to connect with the natural environment. As a natural element, trees can evoke biophilic affinity, enhance psychological comfort, and promote increased α-wave activity. The tree view index, as the most important factor influencing α PSD, exhibits a threshold effect rather than a linear relationship. When the tree view index falls below approximately 0.09, SHAP values become negative, indicating that tree-scarce scenes weaken α rhythm power. Road has a negative effect on α PSD, which may result from its directional guidance that captures visual attention and increases cognitive load, thereby reducing relaxation. This finding is consistent with previous conclusions regarding campus environments [54]. Notably, the critical value for the road view index influencing α PSD is 0.22, beyond which the effect turns negative.
The influence of building on α PSD reaches a peak at approximately 0.35 and becomes negative beyond 0.54 (Figure 11g). This suggests that a moderate building view index enhances relaxation, promoting α activity. However, when the index increases further, visual pressure emerges, suppressing relaxation and decreasing α activity [85]. A moderate building view index exerts a dual positive effect on relaxation by providing the necessary degree of spatial enclosure to enhance the sense of safety while avoiding the oppressive feeling associated with excessive building density. This finding offers crucial data support and threshold reference for managing the building view index in rural streetscape planning. Similarly, sky exhibits a comparable pattern, peaking at 0.30. A moderate increase in the sky view index helps alleviate the sense of oppression caused by overly dense streetscape elements, thereby enhancing relaxation. However, when the index exceeds 0.45, excessive sky exposure induces a feeling of emptiness, reduces the perceived sense of safety, and consequently dampens psychological restoration [83].
Although person ranks relatively low in the feature importance hierarchy, its dependence plot indicates a positive effect on α PSD (Figure 11i). Interestingly, this result contrasts with findings from urban studies, where people are often perceived as negative elements due to visual clutter caused by crowding [86]. In rural settings, however, moderate pedestrian presence fosters a calm and relaxing perception. This likely occurs because the population density in rural streetscapes is much lower than in urban areas, thereby avoiding the sense of congestion and disorder typically associated with crowded environments.
3.3.4. Nonlinear Effects of Cultural Attributes
Within the category of cultural attributes, only architectural aesthetics demonstrates a strong influence on α PSD. The effect of architectural aesthetics remains positive at low to moderate levels but turns negative at high levels, suggesting that excessively high architectural aesthetics suppress α rhythms. This may be because highly aesthetic buildings, characterized by rhythm, proportion, and texture, tend to attract aesthetic attention and cognitive engagement [87].
3.3.5. Interactions
We computed interaction values between features using XGBoost (v 2.1.4)-SHAP (v 0.48.0) and ranked them by their mean absolute interaction strength. The top 10% of feature pairs were selected as key interactions. Based on the sign and distribution of SHAP interaction values, the interactions influencing α PSD were classified into three types: synergistic, antagonistic, and conditional. Synergistic interactions occur when SHAP interaction values are significantly greater than zero within specific ranges, indicating that the joint contribution of two features exceeds the sum of their independent effects. Antagonistic interactions are characterized by SHAP interaction values less than zero across most intervals, implying that the joint occurrence of the two features weakens or offsets their individual influences. Conditional interactions change direction with feature values, showing synergy under certain conditions and antagonism under others. The results show that among the interactions influencing α PSD, three feature pairs—tree-VE_nats, road-SEI, and building-SEI—mainly exhibit antagonistic effects. For instance, in Figure 12a, the SHAP interaction values between tree and VE_nats are scattered and mixed in sign at low tree values but concentrate in the negative region at high tree values, indicating a progressively stronger antagonistic trend. This suggests that the relaxation benefits of trees depend on a visual prerequisite—namely, a relatively low level of environmental color complexity. Although trees themselves can positively enhance α-wave activity, when they are associated with or situated within a high color visual entropy environment (i.e., one characterized by excessive color complexity and disorder), the resulting increased cognitive load may weaken or even offset their relaxation effect.
Figure 12c,e display typical conditional interactions. Specifically, in Figure 12c, the SHAP interaction values between road and sky are predominantly negative in the low-road region, showing weak synergy. However, when road values exceed 0.2, the interaction values diverge markedly: samples with low sky values (blue dots) exhibit synergistic enhancement, whereas those with high sky values (orange-red dots) show antagonistic suppression. This indicates, when the visibility of both elements is high, they tend to amplify the perception of spatial openness, reducing the sense of safety and thereby inhibiting relaxation. In contrast, when the two exhibit a complementary pattern—with one element being highly visible and the other less so—they form a more balanced visual structure, effectively facilitating the emergence of relaxation effects.
3.4. Typical Streetscape Clustering
To identify typical rural streetscape types and compare α PSD and its key influencing factors under different conditions, we calculated the mean proportions of seven major landscape elements in both the front and rear streetscape images of 385 sampling points. Based on these landscape element data, we performed clustering analysis using the k-means algorithm. As an unsupervised clustering approach, k-means partitions data by minimizing within-cluster distances. The optimal number of clusters was determined as k = 3 using the elbow method. The Shapiro–Wilk test indicated that α PSD values in the three clusters deviated from normality, precluding the use of one-way ANOVA. Therefore, we applied the nonparametric Kruskal–Wallis test, which confirmed significant differences in α PSD among the three clusters (α PSD: p < 0.01, χ2 = 22.046, df = 2).
Radar chart analysis revealed significant differences in the composition of streetscape elements among clusters, allowing all samples to be classified into three distinct categories: cluster 0: residential-dominated type, cluster 1: commerce-dominated type and cluster 2: greenery-dominated type (Figure 13).
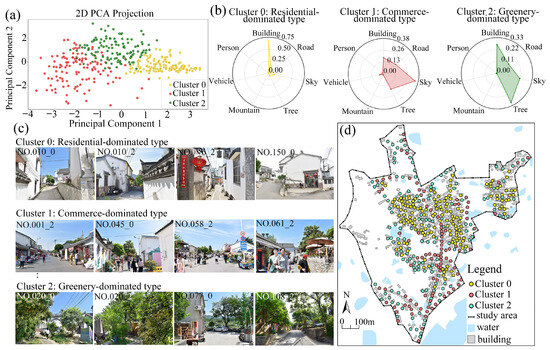
Figure 13.
Clustering results of typical streetscapes: (a) Distribution among clusters; (b) Radar chart of different clusters; (c) Representative streetscapes of each cluster; (d) Spatial distribution of different clusters.
Cluster 0: Residential-dominated type
This cluster is characterized by a substantially higher proportion of building than the other two clusters, while the proportions of all other landscape elements are generally low. It represents the streetscape of high-density residential areas. These streetscapes are mainly distributed within the inner parts of the village, spatially characterized by narrow alleys, compact housing, and a high floor area ratio. Both the median and mean α PSD values are the lowest among all clusters, indicating that this type of streetscape induces the weakest neural relaxation responses.
Cluster 1: Commerce-dominated type
This type represents the rural commercial streetscapes with the most favorable visual appearance. The main visual components include a high proportion of sky and road, along with the highest person and vehicle view index. Building and tree view index remain at moderate levels, producing an overall sense of spatial openness. The commerce-dominated type is primarily located along the north–south commercial main road and at the open peripheral areas of the village. Its α PSD median and mean values are moderate, suggesting a medium level of relaxation and soothing effect.
Cluster 2: Greenery-dominated type
This type is mainly characterized by a high tree view index, while other landscape element indices are relatively low. These streetscapes are concentrated along the village periphery and in open internal spaces. Both the median and mean α PSD values are the highest among all clusters, indicating a strong ability to induce relaxation and mental restoration.
3.5. Influence of Streetscape Features on EEG PSD Across Different Clusters
To explore how streetscape features influence α PSD within each category, we constructed feature importance interpretation models based on XGBoost-SHAP and analyzed the results separately for the three clusters (Figure 14). Tree and color consistency emerged as key factors in both the overall and cluster-specific models. However, distinct sensitivities to specific factors were observed across different streetscape types. For the residential-dominated type, color diversity, color consistency, and tree contributed most strongly to α PSD. In the commerce-dominated type, tree, road, and color diversity were the primary drivers. For the greenery-dominated type, background, color consistency, and visual entropy played the most critical roles.
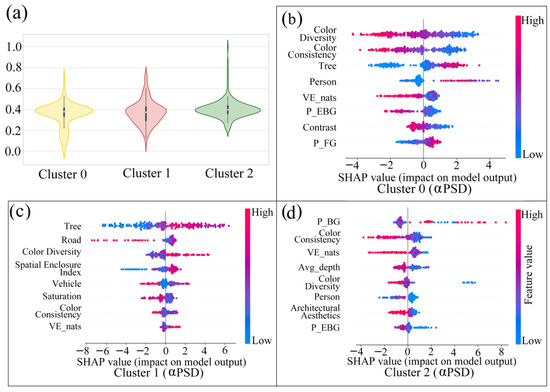
Figure 14.
Comparisons among different streetscape clusters: (a) Violin plots of α PSD; (b–d) Beeswarm plots of each cluster.
4. Discussion
4.1. Nonlinear Relationships Between Streetscape Features and α PSD
This study innovatively employed the XGBoost-SHAP model to systematically reveal the nonlinear mechanisms influencing α PSD. These mechanisms encompass feature importance ranking, threshold effects, and interaction patterns. Previous EEG studies in this domain have relied on limited image sets (for example, 3 [59], 4 [12], 10 [16,57], 20 [60], 36 [61]). In contrast, this study utilized EEG data collected from 346 streetscape images in Shecun. Benefiting from the significantly larger dataset, nonlinear modeling analysis was successfully conducted.
4.1.1. Threshold Effects
Research on the nonlinear effects of streetscape features on α PSD remains limited. Only a few studies [54,55] have applied traditional methods, such as cubic polynomial regression, to examine the nonlinear relationships between streetscape elements and EEG PSD. The following sections compare our threshold effects with those from previous research and highlight our unique findings.
- 1.
- Tree
This study found that tree increases α PSD. This phenomenon aligns with findings diverse settings, including high-density urban small green spaces [32], residential landscapes [20], parks [88], indoor environments [16,31,89], and scenes with varied plant types [90]. The above results attribute the effect to vegetation’s ability to reduce psychophysiological stress and promote relaxation [12,91]. However, the threshold effect of this feature has rarely been explored. The present study revealed that in rural environments, the index turns from negative to positive and stabilizes at 0.09. This value is significantly lower than the threshold (0.51) observed in campus environments characterized by three-story teaching buildings and surrounding landscapes [54]. This difference arises because rural buildings are typically single-story and low-density, whereas campus environments are dominated by multi-story teaching buildings, which require a higher threshold.
- 2.
- Road
The study confirmed the negative effect of road on α PSD, consistent with previous findings in campus environment [54]. However, the threshold of road view index associated with α PSD reduction (0.22) in rural environments was significantly higher than that in campus settings (0.1). This may stem from differences in road visual attributes. The rural roads in this study were often sunlit and bright (Figure 13c), providing weaker visual stimulation. In contrast, campus roads tended to be darker, which may produce stronger negative visual impacts and thus suppress α PSD at a lower threshold.
- 3.
- Color consistency and architectural aesthetics
Color consistency and architectural aesthetics emerged as key factors influencing α PSD, ranking second and third in importance, respectively. Notably, their influence exceeded that of factors related to space morphology and landscape elements. This finding underscores the necessity of constructing research frameworks based on neurocognitive mechanisms. Studies that focus primarily on streetscape elements while neglecting color features and cultural attributes may lead to structurally biased conclusions. When the colors of streetscape images are consistent with the dominant hues of the village, visual distractions are reduced, which positively contributes to relaxation and psychological restoration. This finding aligns with conclusions drawn from case studies of restorative spatial environments [79]. Moreover, the present study found that excessively high architectural aesthetics exert a negative effect on α PSD, consistent with previous architectural design research [87]. When architectural aesthetics reach overly elevated levels, they tend to capture aesthetic attention, thereby suppressing α-wave activity.
- 4.
- Sky
This study found that the effect of sky view index on α PSD follows an inverted U-shaped pattern, first increasing and then decreasing. This finding differs from previous results obtained under indoor conditions, where sky exposure was found to reduce psychological burden and enhance relaxation effects [31]. On one hand, this discrepancy may stem from differences in research subjects. On the other hand, the aforementioned indoor studies did not employ nonlinear modeling approaches; relying solely on repeated-measures ANOVA makes it impossible to capture the nonlinear relationship between these variables. Additionally, the α PSD peaked at a value of 0.30. It from window-view studies where α PSD reached its maximum at sky view index values between 0.60 and 0.71 [55]. This discrepancy likely stems from variations in experimental conditions: the present study considered multiple visual elements including building, tree, and road, whereas window-view studies primarily focused on the combination of sky and tree. Nevertheless, both suggest that the effect of the sky is not independent but rather modulated by the proportional composition of various visual elements within the overall environment.
- 5.
- Application of Thresholds in Design Practice
The thresholds identified in this study—including the critical points of diminishing marginal returns, the turning points where effects shift from positive to negative, and the optimal inflection points of inverted-U relationships—can all be translated into key design parameters. These thresholds provide quantitative and scientific references for planners and architects, enabling them to accurately balance multiple design factors, avoid potential risks, and maximize the positive environmental benefits. Specific design strategies applicable in practice include:
- (1)
- Prioritizing the incorporation of green vegetation
Elevating the tree view index to the saturation point of 0.09 can efficiently promote environmental relaxation and restorative effects. In particular, for densely built inner streets that generally lack greenery, increasing vegetation coverage represents the most feasible and effective optimization strategy.
- (2)
- Creating semi-enclosed, open spaces that offer both protection and relaxation
For spaces intended to foster a sense of relaxation, safety, and refuge, the spatial enclosure index (SEI) should be maintained around 0.5 to create semi-enclosed environments that combine territoriality and protection while avoiding feelings of oppression. Practically, this can be achieved by utilizing existing building walls, incorporating corridors; permeable screens; or a combination of trees, shrubs, and low vegetation to form semi-transparent lateral boundaries. These strategies reduce visual closure while maintaining adequate permeability, thereby stabilizing SEI at an optimal level. In densely built streets, partial openings of street corners or the addition of pocket green spaces can help reduce excessively high SEI values and prevent visual confinement. Conversely, in large plazas or resting areas, installing pergolas, shade structures, or vegetation can create a series of secondary resting points with SEI values near 0.5, providing users with psychologically safe “anchor points.”
- (3)
- Controlling road and sky view indices to mitigate feelings of emptiness and insecurity
In relaxation- and safety-oriented spaces, the road view index should be kept below 0.22. For overly wide streets, multi-layered green buffers consisting of trees, shrubs, and groundcover, along with landscape furniture or installations, can reduce road visibility and perceived openness. The optimal sky view index should be designed around 0.30. When this value is excessively high, medium-canopy trees, pergolas, or shading structures can be employed to lower sky visibility and mitigate the sense of exposure.
- (4)
- Harmonizing the relationship between buildings and nature
To construct rural streetscapes that foster relaxation and comfort, the ideal range for the building view index is 0.13–0.54. Within this range, buildings act as visual backdrops that provide the necessary sense of enclosure and safety. When building visibility becomes excessive, two strategies are recommended. First, planting street trees combined with shrub clusters or implementing vertical greening on building façades can effectively increase the green view index and enhance biophilic qualities. Second, employing natural materials—such as wood and locally sourced stone—in biophilic architectural design [28] can help soften building massing, introduce natural elements and textures, and thereby mitigate the visual pressure caused by excessive building visibility. These approaches collectively enhance the spatial affinity and restorative quality of the streetscape.
Furthermore, by analyzing the interactions among streetscape feature variables, this study further elucidated their nonlinear mechanisms. The results revealed that antagonistic and conditional interactions are the predominant modes affecting α PSD. These findings provide a feasible perspective for comprehensively understanding the complex influencing factors of α PSD and offer practical guidance for the diagnosis and optimization of rural streetscapes based on perceptual needs.
4.1.2. Nonlinear Influence Patterns
We summarized four types of influence patterns affecting α PSD as follows: (1) a marginal effect that first increases and then decreases, such as the effect of tree on α PSD; (2) a pattern showing no significant change within a certain interval, followed by a turning point beyond a specific threshold, where the effect becomes negative, as observed for architectural aesthetics and road; (3) a unimodal (inverted U-shaped) effect, such as that of SEI, building, sky, and P_FG on α PSD; and (4) a monotonic trend, either increasing or decreasing. For instance, color consistency and color diversity show a monotonically decreasing relationship with α PSD, whereas P_BG exhibits the opposite pattern.
4.2. Rural Streetscape Optimization Strategies Based on Perceptual Needs
To enhance the systematic and targeted optimization of rural streetscapes according to perceptual needs, this study established an integrated strategy framework at three levels. First, the feature importance ranking from both the overall and cluster models was combined to identify universal and context-specific key factors. Second, by incorporating dependency analysis, the effective thresholds or optimal ranges of these key factors were determined. Finally, antagonistic and conditional interactions among features were leveraged to design streetscape optimization schemes capable of directionally modulating α PSD—promoting relaxation and calmness.
For the residential-dominated type, increasing the tree view index to at least 0.09 should be prioritized. Given the typically low greenery levels in high-density residential areas, enhancing the green view index represents an effective intervention to quickly strengthen the environment’s capacity to induce relaxation. Meanwhile, reducing color consistency and color diversity can further increase α PSD and enhance relaxation effects. For the commerce-dominated type, raising the tree view index above 0.09, improving the road view index to exceed 0.22, and increasing color diversity through environmental renewal can effectively enhance α PSD. For the greenery-dominated type, scenes with higher P_BG values (a greater background proportion) are more likely to stimulate α rhythm activity. Additionally, reducing color consistency, VE_nats, and architectural aesthetics can further strengthen α PSD.
Moreover, interaction analysis revealed that streetscape configurations characterized by a high road view index (>0.2) and low sky view index (<0.1), as well as high SEI (>0.6) and moderate P_FG (40–50%), can effectively promote α rhythm activity, contributing to a relaxed perceptual experience. However, combinations that should be avoided, based on antagonistic and conditional interactions, include: high tree view index (>0.1)—high VE_nats (>3.5), high road view index (>0.2)—low SEI (<0.4), high road view index (>0.2)—high sky (>0.4), high building view index (>0.6)—high SEI (>0.7), and high SEI (>0.6)—low P_FG (<30%).
4.3. Research Contributions
At the level of theoretical innovation, this study constructed a novel neurocognitive framework integrating natural, artificial, and cultural dimensions, encompassing 29 streetscape feature indicators. The proposed indicator selection framework fills the gap in existing research concerning the integration of neural–cognitive mechanisms and regional cultural contexts. Also, the proposed framework for indicator selection provides neuroscientific support for precise EEG-based perception assessment and optimization of rural and urban streetscapes with distinct cultural identities. Based on this framework, the influence mechanisms of the extracted streetscape feature variables on perception (α PSD) are summarized in Figure 15.
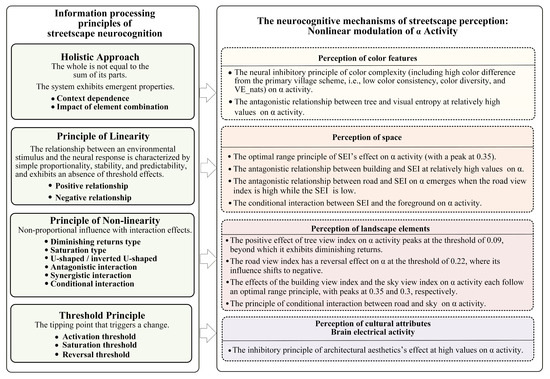
Figure 15.
Principles of streetscape feature variables affecting perception (α PSD).
Second, at the methodological innovation level, we innovatively integrated EEG with the XGBoost-SHAP interpretability model to establish a multimodal data-based paradigm for rural streetscape perception assessment, revealing the complex nonlinear mechanisms influencing brain activity. By using EEG, we achieved objective and precise measurement of streetscape perception, overcoming the subjective limitations of traditional questionnaire-based scoring methods (e.g., Scenic Beauty Estimation [7], Analytic Hierarchy Process [10] and Semantic Differential [11]) and obtaining reliable dependent variables.
Meanwhile, this approach successfully addressed two major limitations of traditional EEG-based perception research: first, the difficulty of fitting nonlinear relationships with small sample sizes, and second, the constraint of limited feature variables. Specifically, previous studies often employed only a small number of stimulus images (e.g., 3 [59], 4 [12], 10 [16,57], 20 [60], 36 [61]) and a limited set of independent variables (e.g., 3 [54,59], 5 [55], 9 [16,92]). In contrast, this study used EEG data collected from 346 rural streetscape images and systematically expanded the feature variables to 29. This breakthrough was primarily enabled by the excellent data-handling capability of the XGBoost-SHAP method, allowing robust fitting of complex nonlinear relationships even with a limited sample size. Although some studies have applied XGBoost to explore the nonlinear influence of 27 factors on emotional perception, their dependent variables were not based on EEG data, highlighting the uniqueness of this study. Using this advanced methodological framework, we identified key influencing factors, threshold effects, and interaction effects on Shecun α PSD (e.g., the effect of SEI on α activity follows an inverted U-shaped curve). This approach represents a significant advancement over traditional studies that predominantly use linear models (e.g., Pearson correlation analysis [1,3,21,23,37,38,39,40,41], multiple linear regression [3,42,43,44,45,46,47], PCA [6,22,48]), which can detect linear relationships but cannot capture complex nonlinear effects. This method can be applied to both rural and urban environment assessment and design, providing theoretical and technical support for scientific decision-making.
Third, at the application innovation level, there is a lack of research on the nonlinear impact mechanisms of rural streetscape perception using EEG and machine learning. Previous studies have largely focused on blue-green spaces, residential areas, campuses, and urban environments. This study, however, explores the thresholds and interaction effects of streetscape features on α PSD in the context of traditional villages. By comparing with existing case studies, we highlight the commonalities and specificities of streetscape perception mechanisms across different environmental types, thereby deepening our understanding of perception formation mechanisms. Based on k-means clustering analysis, a strategy of “key factor identification–threshold effect control–multi-factor synergistic optimization” is developed. This strategy enables targeted modulation of α PSD in streetscape design, thereby promoting a relaxed and calm psychological state. This method integrates both global and local perspectives. This pathway can advance landscape research from a “one-size-fits-all” approach toward “precision-guided” design.
This study proposes an EEG–machine learning integrated approach to investigate the nonlinear mechanisms underlying the influence of streetscape features on human perception. The proposed framework demonstrates broad applicability to both urban and rural streetscape studies. Moreover, the four-level indicator screening system, constructed based on neurocognitive mechanisms, provides a systematic paradigm for integrating independent variables in perception research concerning the built environment.
The findings reveal that the positive and negative associations between various streetscape features and relaxation effects are largely consistent with conclusions drawn from previous studies on urban, campus, park, residential, and indoor environments. For example, the tree view index shows a positive correlation with α PSD, the consistency between streetscape color and dominant hue also correlates positively with α PSD, whereas road view index and color diversity display negative correlations with α PSD. However, several relationship patterns identified in this study differ from prior findings: the person view index exhibits a positive correlation with α PSD, and the sky view index shows an inverted U-shaped relationship with α PSD, contrasting with previously reported linear positive trends. Furthermore, the nonlinear thresholds identified for elements such as trees, roads, and sky differ from those observed in campus environments dominated by multi-story buildings and window-view studies. Specifically, the threshold for diminishing marginal benefits of the tree view index in this study is significantly lower than that found in campus settings, the road view index threshold at which α PSD begins to decline is notably higher, and the peak influence of the sky view index on α PSD is lower than that observed in window-view contexts.
It is noteworthy that the study finds the relaxation effect peaks when the SEI equals 0.5, which aligns with findings from post-disaster recovery space research. However, given the limited range of comparable environmental types, further cross-context validation with additional case studies is necessary to determine whether this conclusion can be generalized to other forms of built environments.
4.4. Limitations and Future Research
This study employed EEG and the XGBoost-SHAP model to investigate the nonlinear influence of rural streetscape features on perception using multimodal data. Although meaningful progress was achieved, certain limitations remain. Firstly, our rural streetscape image collection was limited to the spring season. The selected time frame may pose challenges to the generalizability of the findings when extended to year-round conditions. Its impact is primarily reflected in the seasonal fluctuations of both the physical environment and the cultural landscape.
From the perspective of the physical environment, the phenological characteristics of vegetation are the primary source of seasonal landscape variation. The color features of spring vegetation examined in this study—dominated by light-green trees, shrubs, crops, and partially light-yellow rapeseed flowers—cannot represent the characteristics of other seasons. For instance, summer is characterized by dense canopies with dark-green foliage; in autumn, canopy density and color composition change due to leaf senescence and shedding; and in winter, deciduous species reveal their branch structures, the canopy becomes sparse, and the green view index reaches its annual minimum. These seasonal variations in vegetation color and morphology directly affect the accurate analysis of streetscape elements such as trees and buildings, including their visibility, color characteristics, and spatial morphology (e.g., canopy spread influencing perceived spatial depth and enclosure).
In terms of the cultural landscape, this study does not capture the seasonal distinctiveness of winter festivals. For example, during the Spring Festival, rural dwellings are typically decorated with red couplets and lanterns, forming distinctive color patterns and cultural symbols that differ substantially from the springtime streetscapes analyzed in this study. Future research should involve longitudinal, cross-seasonal tracking. This approach would reveal how natural rhythms and cultural activities jointly shape the perception of rural streetscapes. Such findings would provide a more comprehensive scientific foundation for landscape optimization.
Secondly, the sample size of participants in this study was relatively small (n = 30), which may limit the statistical robustness and generalizability of the results. Moreover, this study exhibits specific geographical and cultural focus, as all data were collected from tourism-oriented villages in China’s Yangtze River Delta. While this design allows for an in-depth, context-sensitive analysis of the study site, whether these findings are applicable to regions with different sociocultural contexts or developmental stages remains to be verified through further empirical research. Differences in natural, economic, and cultural conditions may influence both urban–rural streetscape characteristics and the mechanisms linking environmental features to psychophysiological responses.
Finally, regarding the quantification of cultural attributes, this study employed an expert evaluation approach. Although expert scoring can effectively interpret cultural context and quantify cultural traits, it inherently involves subjectivity, which may introduce potential bias into the measurements. Future research could address these limitations by expanding participant sample sizes, incorporating a more diverse range of geographical and cultural contexts, and training computer vision models capable of fine-grained identification and quantification of cultural symbols embedded within streetscape imagery.
5. Conclusions
This study developed a research paradigm for assessing the nonlinear influence of rural streetscape features on perception based on EEG and the XGBoost-SHAP model. The main conclusions are as follows:
- (1)
- The key streetscape features affecting rural streetscape α PSD, in order of importance, are tree, color consistency, architectural aesthetics, spatial enclosure index (SEI), P_EBG, and road.
- (2)
- In terms of color features, environments where colors are closer to the main village palette, with lower color diversity and visual entropy, are more conducive to promoting relaxation and calm perception (α PSD increases). We observed an antagonistic interaction between the tree view index and visual entropy on α PSD, but only when both variables had high values.
- (3)
- In terms of space morphology, SEI exhibits an inverted U-shaped effect on α PSD, peaking at SEI ≈ 0.50. When both the building view index and SEI are high, they interact antagonistically to influence α PSD. SEI also interacted with the foreground (P_FG) in a condition-specific manner on α PSD.
- (4)
- Regarding landscape elements, the tree view index shows diminishing marginal returns on α PSD. Building and sky view index have optimal intervals for α PSD, peaking at 0.35 and 0.30, respectively. We also found conditional interactions between road and sky on α PSD.
- (5)
- In terms of cultural attributes, architectural aesthetics exerts a negative effect on α PSD.
- (6)
- Finally, combining SHAP interpretability analysis with k-means clustering, we established an analytical paradigm integrating global explanation and cluster-specific differences. Based on the “key factor identification—threshold effect control—multi-factor synergistic optimization” approach, we proposed rural streetscape design strategies to modulate α PSD, promoting relaxation and calm responses.
This study reveals the nonlinear mechanisms through which streetscape features influence perception within the context of traditional rural environments, highlighting the distinctive contribution of EEG-based nonlinear analysis in such settings. Future research could advance this line of inquiry in two key directions. First, by incorporating virtual reality (VR) experimental paradigms, researchers may immerse participants in simulated rural streetscapes, enabling the synchronous collection of EEG and other physiological data combined with machine learning models to explore perception mechanisms under near-realistic environmental conditions. Second, future work should promote cross-cultural comparative studies by analyzing EEG responses elicited by streetscapes from villages with different regional and cultural backgrounds. Such comparisons would help to identify both the universal and culture-specific mechanisms underlying streetscape perception, thereby providing robust neuroscientific evidence for understanding the diversity and commonality of environmental perception.
Author Contributions
Conceptualization, L.R. and J.Z.; methodology, L.R. and J.Z.; software, L.R. and J.Z.; validation, L.R. and J.Z.; formal analysis, L.R. and J.Z.; investigation, L.R. and J.L.; resources, L.R. and J.Z.; data curation, L.R. and J.L.; writing—original draft preparation, L.R. and J.Z.; writing—review and editing, L.R. and J.Z.; visualization, L.R. and J.L.; supervision, J.Z.; project administration, J.Z.; funding acquisition, L.R. All authors have read and agreed to the published version of the manuscript.
Funding
This research was funded by the National Natural Science Foundation of China, grant number 52208019, and the General Project of Jiangsu Provincial Social Science Foundation, grant number 23YSB018.
Institutional Review Board Statement
The study was conducted in accordance with the Declaration of Helsinki, and approved by the Ethics Committee for Scientific Research of Shanghai University of Sport (protocol code 102772022RT079 and date of approval: 13 September 2022).
Informed Consent Statement
Informed consent was obtained from all subjects involved in the study.
Data Availability Statement
The data presented in this study are available on request from the corresponding author.
Conflicts of Interest
The authors declare no conflicts of interest.
Appendix A
Table A1.
Glossary of key academic terms.
Table A1.
Glossary of key academic terms.
| Term | Definition | Contextual Role in This Research |
|---|---|---|
| Electroencephalography (EEG) | A non-invasive neurophysiological method for recording brain electrical activity with high temporal resolution. | Used to objectively quantify the effects of streetscapes on brain relaxation and cognition. |
| Alpha-band Power Spectral Density (α PSD) | A physiological indicator reflecting the energy in the 8–13 Hz frequency band, which is associated with relaxed mental states. | Serves as the dependent variable representing perceptual responses. |
| Visual Cortex | Located in the occipital lobe, it refers to the overall brain region responsible for visual information processing, comprising multiple subregions such as V1, V2, V3, V4, and MT. | The starting point of neural processing for streetscape visual features. |
| V1 (i.e., the primary visual cortex) | A subregion of the visual cortex, it is the first cortical area to receive input from the retina, corresponding to Brodmann Area 17. It is responsible for the initial analysis of visual features such as edges, orientation, and contrast. | Responsible for the primary cortical processing of visual features during streetscape perception. |
| Lateral Geniculate Nucleus (LGN) | The visual relay nucleus in the thalamus, it receives input from the retina and transmits signals to the primary visual cortex (V1) in the occipital lobe. | Acts as the thalamic relay station transmitting retinal signals to the occipital cortex, forming the subcortical basis of visual perception. |
| Occipital Lobe | The rearmost lobe of the cerebral cortex, it contains both primary and higher-order visual areas (V1–V5/MT) and is responsible for the reception and initial processing of visual information. | Serves as the cortical hub for visual information processing, initiating neural encoding of streetscape stimuli. |
| “What” and “Where” Pathways | The two main processing pathways of the brain’s visual system: the former is responsible for object recognition (temporal lobe), while the latter is responsible for spatial localization (parietal lobe). | Used to explain the neural and cognitive division of labor involved in the processing of spatial morphology and landscape elements. |
| Fusiform Gyrus | Located in the inferior temporal lobe, it is a core region of the visual “What” Pathway, involved in the recognition and representation of faces and objects. | Responsible for the recognition of landscape elements within streetscape features. |
| Parietal Lobe | Located in the upper region of the cerebral cortex, it is involved in spatial localization, attentional allocation, and sensory integration, serving as a key brain region in the visual “Where” Pathway. | Responsible for spatial localization and attentional modulation of streetscape elements, supporting the neural basis of spatial cognition. |
| Perirhinal Cortex | Located in the medial temporal lobe, it connects the hippocampus and the fusiform gyrus, playing a key role in the integration of semantic features. | Integration and recognition of semantic features in streetscapes, whereby different streetscape elements are combined into a coherent perceptual representation of the overall streetscape. |
| Frontal Lobe/Prefrontal Cortex | An advanced cognitive region involved in decision-making, aesthetic evaluation, cultural judgment, and perceptual formation. | A key brain region involved in the cognition of cultural attributes—such as architectural aesthetics and environmental harmony—and in the generation of streetscape perception. |
| Visual Entropy (VE_nats) | An information-theoretic indicator reflecting the complexity of an image. | An objective indicator used to quantify the visual complexity of streetscape images. |
| Spatial Enclosure Index (SEI) | An indicator used to measure the degree of spatial enclosure formed by buildings, trees, and other elements on both sides of the street. | To assess the relationship between spatial enclosure and psychological relaxation. |
| DeepLabV3+ | A semantic segmentation model based on dilated convolution deep learning. | To extract the proportional composition of streetscape elements such as buildings, trees, and roads. |
| MiDaS Model | A deep computational model based on a convolution–Transformer hybrid architecture. | To compute spatial depth and to calculate the proportion of foreground, midground, background, and far background. |
| Spatial Enclosure Index (SEI) | An indicator used to measure the degree of enclosure on both sides of a street. | The proportion of pixels classified as buildings, trees, and streetlights relative to the total number of pixels in the streetscape image. |
| Space Syntax | A theoretical and methodological framework for quantifying spatial structure, which describes the relationship between human behavior and spatial morphology in architectural or urban environments through topological representations. | The Integration and Choice values were calculated using DepthMap (v X0.8.0) software. |
| Integration/Choice | Core indicators in space syntax, representing spatial accessibility and the probability of being traversed, respectively. | Serves as a sub-indicator of space morphology, reflecting the structural characteristics of street spaces. |
| Environmental Coordination | An indicator used to assess the environmental coordination of streetscapes, providing a comprehensive evaluation of the architectural coherence (in terms of scale, color, material, and style) and the environmental maintenance level (including cleanliness, sanitation, and degree of deterioration). | To measure the effect of environmental coordination of the streetscape on the dependent variable. |
| Cultural Symbol View Index | To quantify the proportion of cultural elements within the streetscape. | To measure the impact of the richness of cultural elements in streetscape images on the dependent variable. |
| Architectural Characteristics | A quantitative assessment of the regional characteristics and typicality of architecture. | To evaluate the effect of architectural regionality and typicality on the dependent variable. |
| Architectural Aesthetics | A comprehensive aesthetic evaluation of architectural form, proportion, and rhythm. | To assess the impact of architectural aesthetic quality on the dependent variable. |
References
- Shen, H.; He, X.; He, J.; Li, D.; Liang, M.; Xie, X. Back to the village: Assessing the effects of naturalness, landscape types, and landscape elements on the restorative potential of rural landscapes. Land 2024, 13, 910. [Google Scholar] [CrossRef]
- Wang, X.; Zhu, H.; Shang, Z.; Chiang, Y. The influence of viewing photos of different types of rural landscapes on stress in Beijing. Sustainability 2019, 11, 2537. [Google Scholar] [CrossRef]
- Jiang, S.; Ma, H.; Yang, L.; Luo, S. The influence of perceived physical and aesthetic quality of rural settlements on tourists’ preferences—A case study of Zhaoxing Dong Village. Land 2023, 12, 1542. [Google Scholar] [CrossRef]
- Fu, E.; Ren, Y.; Li, X.; Zhang, L. Research on the healing potential of rural community streets from the perspective of audiovisual integration: A case study of four rural communities in China. Front. Public Health 2022, 10, 861072. [Google Scholar] [CrossRef] [PubMed]
- Torkko, J.; Poom, A.; Willberg, E.; Toivonen, T. How to best map greenery from a human perspective? comparing computational measurements with human perception. Front. Sustain. Cities 2023, 5, 1160995. [Google Scholar] [CrossRef]
- Li, K. Research on the factors influencing the spatial quality of high-density urban streets: A framework using deep learning, street scene images, and principal component analysis. Land 2024, 13, 1161. [Google Scholar] [CrossRef]
- Fang, Y.-N.; Tian, J.; Namaiti, A.; Zhang, S.; Zeng, J.; Zhu, X. Visual aesthetic quality assessment of the streetscape from the perspective of landscape-perception coupling. Environ. Impact Assess. Rev. 2024, 106, 107535. [Google Scholar] [CrossRef]
- Li, M.; Fan, Z. Constructing High-Quality Livable Cities: A comprehensive evaluation of urban street livability using an approach based on human needs theory, street view images, and deep learning. Land 2025, 14, 1095. [Google Scholar] [CrossRef]
- Ye, Y.; Zeng, W.; Shen, Q.; Zhang, X.; Lu, Y. The visual quality of streets: A human-centred continuous measurement based on machine learning algorithms and street view images. Environ. Plan. B Urban Anal. City Sci. 2019, 46, 1439–1457. [Google Scholar] [CrossRef]
- Fang, Y.-N.; Namaiti, A.; Zhang, S.; Feng, T. Multimodal data-driven visual sensitivity assessment and planning response strategies for streetscapes in historic districts: A case study of Anshandao, Tianjin. Land 2025, 14, 1036. [Google Scholar] [CrossRef]
- Wang, L.; Zhuang, J.; Wang, M.; Adnan, R.M. Comprehensive assessment of spatial quality in traditional village landscapes of the Yuanshui River Basin using semantic differential and entropy weight methods. Front. Environ. Sci. 2025, 13, 1552489. [Google Scholar] [CrossRef]
- Li, J.; Wu, W.; Jin, Y.; Zhao, R.; Bian, W. Research on environmental comfort and cognitive performance based on EEG+VR+LEC evaluation method in underground space. Build. Environ. 2021, 198, 107886. [Google Scholar] [CrossRef]
- Wei, H.-L.; Guo, Y.; He, F.; Zhao, Y. EEG signal processing techniques and applications—2nd edition. Sensors 2025, 25, 805. [Google Scholar] [CrossRef]
- Shi, J.; Zhang, N.; Sun, Y.; Jiang, J.; Duan, H.; Gao, W. The impact of virtual images of coastal landscape features on stress recovery based on EEG. Sci. Rep. 2025, 15, 17369. [Google Scholar] [CrossRef]
- Asim, F.; Chani, P.S.; Shree, V.; Rai, S. Restoring the mind: A neuropsychological investigation of university campus built environment aspects for student well-being. Build. Environ. 2023, 244, 110810. [Google Scholar] [CrossRef]
- Qin, J.; Sun, C.; Zhou, X.; Leng, H.; Lian, Z. The effect of indoor plants on human comfort. Indoor Built Environ. 2014, 23, 709–723. [Google Scholar] [CrossRef]
- Grassini, S.; Revonsuo, A.; Castellotti, S.; Petrizzo, I.; Benedetti, V.; Koivisto, M. Processing of natural scenery is associated with lower attentional and cognitive load compared with urban ones. J. Environ. Psychol. 2019, 62, 1–11. [Google Scholar] [CrossRef]
- Lu, Y.; Liu, H.; Zhu, Y.; Zhu, Z.; Wang, H.; He, L.; Wang, J. Green relief: An exploration into the restorative effects of urban green spaces on eyestrain. Urban For. Urban Green 2025, 112, 128890. [Google Scholar] [CrossRef]
- Seiz, A.; Kweon, B.-S.; Ellis, C.D.; Oh, H.; Pietro, K. Exploring the psychophysiological effects of viewing urban nature through virtual reality using electroencephalography and perceived restorativeness scale measures. Sustainability 2023, 15, 13090. [Google Scholar] [CrossRef]
- Zhu, H.; Yang, F.; Bao, Z.; Nan, X. A study on the impact of visible green index and vegetation structures on brain wave change in residential landscape. Urban For. Urban Green 2021, 64, 127299. [Google Scholar] [CrossRef]
- Gong, S.; Zhang, L.; Zhang, J.; Duan, Y. Rural local landscape perception evaluation: Integrating street view images and machine learning. ISPRS Int. J. Geo Inf. 2025, 14, 251. [Google Scholar] [CrossRef]
- Zhang, X.; Xiong, X.; Chi, M.; Yang, S.; Liu, L. Research on visual quality assessment and landscape elements influence mechanism of rural greenways. Ecol. Indic. 2024, 160, 111844. [Google Scholar] [CrossRef]
- Cao, Y.; Yang, P.; Xu, M.; Li, M.; Li, Y.; Guo, R. A novel method of urban landscape perception based on biological vision process. Landsc. Urban Plan. 2025, 254, 105246. [Google Scholar] [CrossRef]
- Su, C.; Wang, X.; Wang, Y.; Chen, Y.; Dai, F.; Chen, X. Mediating roles of cultural perception and place attachment in the landscape–wellbeing relationship: Insights from historical urban parks in Wuhan, China. Land 2025, 14, 1176. [Google Scholar] [CrossRef]
- Hong, Z.; Cao, W.; Chen, Y.; Zhu, S.; Zheng, W. Identifying rural landscape heritage character types and areas: A case study of the Li River Basin in Guilin, China. Sustainability 2024, 16, 1626. [Google Scholar] [CrossRef]
- Gao, X.; Wang, H.; Zhao, J.; Wang, Y.; Li, C.; Gong, C. Visual comfort impact assessment for walking spaces of urban historic district in China based on semantic segmentation algorithm. Environ. Impact Assess. Rev. 2025, 114, 107917. [Google Scholar] [CrossRef]
- McDonnell, A.S.; LoTemplio, S.B.; Scott, E.E.; Strayer, D.L. Nature images are more visually engaging than urban images: Evidence from neural oscillations in the brain. Front. Hum. Neurosci. 2025, 19, 1575102. [Google Scholar] [CrossRef]
- Valentine, C.; Steffert, T.; Mitcheltree, H.; Steemers, K. Architectural neuroimmunology: A pilot study examining the impact of biophilic architectural design on neuroinflammation. Buildings 2024, 14, 1292. [Google Scholar] [CrossRef]
- Bidgoli, M.A.; Behmanesh, A.; Khademi, N.; Thansirichaisree, P.; Zheng, Z.; Tehrani, S.S.M.; Mazloum, S.; Kongsilp, S. Brain activity patterns reflecting security perceptions of female cyclists in virtual reality experiments. Sci. Rep. 2025, 15, 761. [Google Scholar] [CrossRef]
- Mavros, P.; JWälti, M.; Nazemi, M.; Ong, C.H.; Hölscher, C. A mobile EEG study on the psychophysiological effects of walking and crowding in indoor and outdoor urban environments. Sci. Rep. 2022, 12, 18476. [Google Scholar] [CrossRef]
- Rhee, J.H.; Schermer, B.; Han, G.; Park, S.Y.; Lee, K.H. Effects of nature on restorative and cognitive benefits in indoor environment. Sci. Rep. 2023, 13, 13199. [Google Scholar] [CrossRef]
- Naghibi, M.; Farrokhi, A.; Faizi, M. Small urban green spaces: Insights into perception, preference, and psychological well-being in a densely populated areas of Tehran, Iran. Environ. Health Insights 2024, 18, 11786302241248314. [Google Scholar] [CrossRef]
- Bagheri, S.; Good, J.; Alavi, H.S. Visual and acoustic discomfort: A comparative study of impacts on individuals with and without ADHD using electroencephalogram (EEG). Build. Environ. 2024, 264, 111881. [Google Scholar] [CrossRef]
- Li, X.; Wang, R.; Whang, M. Designing light for emotion: A neurophysiological approach to modeling affective responses to the interplay of color and illuminance. Biomimetics 2025, 10, 696. [Google Scholar] [CrossRef]
- Kim, S. Cognitive efficiency in VR simulated natural indoor environments examined through EEG and affective responses. Sci. Rep. 2025, 15, 33398. [Google Scholar] [CrossRef] [PubMed]
- Choi, T.; Ji, S.; Jun, H. Electroencephalogram-based analysis of attention in void and solid architectural spaces. J. Asian Archit. Build. Eng. 2025, 1–12. [Google Scholar] [CrossRef]
- Luo, J.; Zhao, T.; Cao, L.; Biljecki, F. Semantic riverscapes: Perception and evaluation of linear landscapes from oblique imagery using computer vision. Landsc. Urban Plan. 2022, 228, 104569. [Google Scholar] [CrossRef]
- Tao, Y.; Wang, Y.; Wang, X.; Tian, G.; Zhang, S. Measuring the correlation between human activity density and streetscape perceptions: An analysis based on Baidu Street View images in Zhengzhou, China. Land 2022, 11, 400. [Google Scholar] [CrossRef]
- Shao, Y.; Yin, Y.; Xue, Z.; Ma, D. Assessing and comparing the visual comfort of streets across four Chinese megacities using AI-based image analysis and the perceptive evaluation method. Land 2023, 12, 834. [Google Scholar] [CrossRef]
- Ma, X.; Ma, C.; Wu, C.; Xi, Y.; Yang, R.; Peng, N.; Zhang, C.; Ren, F. Measuring human perceptions of streetscapes to better inform urban renewal: A perspective of scene semantic parsing. Cities 2021, 110, 103086. [Google Scholar] [CrossRef]
- Adıgüzel, E.; Pirselimoğlu Batman, Z. Visual quality assessment in recreational and touristic landscape. Environ. Dev. Sustain. 2024, in press. [Google Scholar] [CrossRef]
- Ji, H.; Qing, L.; Han, L.; Wang, Z.; Cheng, Y.; Peng, Y. A new data-enabled intelligence framework for evaluating urban space perception. ISPRS Int. J. Geo Inf. 2021, 10, 400. [Google Scholar] [CrossRef]
- Zhang, X.; Lin, E.S.; Tan, P.Y.; Qi, J.; Waykool, R. Assessment of visual landscape quality of urban green spaces using image-based metrics derived from perceived sensory dimensions. Environ. Impact Assess. Rev. 2023, 102, 107200. [Google Scholar] [CrossRef]
- Yu, M.; Chen, X.; Zheng, X.; Cui, W.; Ji, Q.; Xing, H. Evaluation of spatial visual perception of streets based on deep learning and spatial syntax. Sci. Rep. 2025, 15, 18439. [Google Scholar] [CrossRef] [PubMed]
- Nathvani, R.; Cavanaugh, A.; Suel, E.; Bixby, H.; Clark, S.N.; Metzler, A.B.; Nimo, J.; Moses, J.B.; Baah, S.; Arku, R.E.; et al. Measurement of urban vitality with time-lapsed street-view images and object-detection for scalable assessment of pedestrian-sidewalk dynamics. ISPRS J. Photogramm. Remote Sens. 2025, 221, 251–264. [Google Scholar] [CrossRef]
- Kang, Y.; Abraham, J.; Ceccato, V.; Duarte, F.; Gao, S.; Ljungqvist, L.; Zhang, F.; Näsman, P.; Ratti, C. Assessing differences in safety perceptions using GeoAI and survey across neighbourhoods in Stockholm, Sweden. Landsc. Urban Plan. 2023, 236, 104768. [Google Scholar] [CrossRef]
- Wu, T.; Lin, D.; Chen, Y.; Wu, J. Integrating street view images, deep learning, and sDNA for evaluating university campus outdoor public spaces: A focus on restorative benefits and accessibility. Land 2025, 14, 610. [Google Scholar] [CrossRef]
- Xu, G.; Zhong, L.; Wu, F.; Zhang, Y.; Zhang, Z. Impacts of micro-scale built environment features on tourists’ walking behaviors in historic streets: Insights from Wudaoying Hutong, China. Buildings 2022, 12, 2248. [Google Scholar] [CrossRef]
- Zhao, X.; Lu, Y.; Lin, G. An integrated deep learning approach for assessing the visual qualities of built environments utilizing street view images. Eng. Appl. Artif. Intell. 2024, 130, 107805. [Google Scholar] [CrossRef]
- Ho, F.K.; Cole, T.J. Non-linear predictor outcome associations. BMJ Med. 2023, 2, e000396. [Google Scholar] [CrossRef]
- Li, B.; Wang, Z.; Xu, F. Exploring the effects of market-oriented reforms on industrial land use eco-efficiency in China: Evidence from a spatial and non-linear analysis. Environ. Impact Assess. Rev. 2023, 102, 107211. [Google Scholar] [CrossRef]
- Wang, Q.; Wang, H.; Ren, L.; Chen, J.; Wang, X. Hourly impact of urban features on the spatial distribution of land surface temperature: A study across 30 cities. Sustain. Cities Soc. 2024, 113, 105701. [Google Scholar] [CrossRef]
- Han, Y.; Qin, C.; Xiao, L.; Ye, Y. The nonlinear relationships between built environment features and urban street vitality: A data-driven exploration. Environ. Plan. B Urban Anal. City Sci. 2024, 51, 195–215. [Google Scholar] [CrossRef]
- Xiao, X.; Li, X.; Zhou, X.; Kang, J.; Luo, J.; Yin, L. Modulatory effects of the landscape sequences on pedestrians emotional states using EEG. Front. Archit. Res. 2024, 13, 1327–1341. [Google Scholar] [CrossRef]
- Jing, X.; Liu, C.; Li, J.; Gao, W.; Fukuda, H. Effects of window green view index on stress recovery of college students from psychological and physiological aspects. Buildings 2024, 14, 3316. [Google Scholar] [CrossRef]
- Cloquell-Ballester, V.-A.; Del Carmen Torres-Sibille, A.; Cloquell-Ballester, V.-A.; Santamarina-Siurana, M.C. Human alteration of the rural landscape: Variations in visual perception. Environ. Impact Assess. Rev. 2012, 32, 50–60. [Google Scholar] [CrossRef]
- Ren, H.; Wang, Y.; Zhang, J.; Zheng, Z.; Wang, Q. Evaluation of the impact of VR rural streetscape enhancement on relaxation–arousal responses based on EEG. Appl. Sci. 2024, 14, 2996. [Google Scholar] [CrossRef]
- Gao, H.; Abu Bakar, S.; Maulan, S.; Mohd Yusof, M.J.; Mundher, R.; Zakariya, K. Identifying visual quality of rural road landscape character by using public preference and heatmap analysis in Sabak Bernam, Malaysia. Land 2023, 12, 1440. [Google Scholar] [CrossRef]
- Gao, X.; Geng, Y.; Spengler, J.D.; Long, J.; Liu, N.; Luo, Z.; Kalantari, S.; Zhuang, W. Evaluating the impact of spatial openness on stress recovery: A virtual reality experiment study with psychological and physiological measurements. Build. Environ. 2025, 269, 112434. [Google Scholar] [CrossRef]
- Consalvi, L.; Ouwehand, K.; Paas, F. Effects of observing urban and natural scenes on working memory depletion and restoration: An EEG study. Educ. Sci. 2024, 14, 1204. [Google Scholar] [CrossRef]
- Yan, L.i.; Du, H. Research on the restorative benefits of sky gardens in high-rise buildings based on wearable biosensors and subjective evaluations. Build. Environ. 2024, 260, 111691. [Google Scholar] [CrossRef]
- Khanh, T.Q.; Bodrogi, P.; Zandi, B.; Vinh, T.Q. Brightness perception under photopic conditions: Experiments and modeling with contributions of S-Cone and ipRGC. Sci. Rep. 2023, 13, 14542. [Google Scholar] [CrossRef]
- Funahashi, S.; Bruce, C.J.; Goldman-Rakic, P.S. Mnemonic coding of visual space in the monkey’s dorsolateral prefrontal cortex. J. Neurophysiol. 1989, 61, 331–349. [Google Scholar] [CrossRef]
- Rui, Q.; Cheng, H. Quantifying the spatial quality of urban streets with open street view images: A case study of the main urban area of Fuzhou. Ecol. Indic. 2023, 156, 111204. [Google Scholar] [CrossRef]
- Haxby, J.V.; Mishkin, M.; Carson, R.E.; Herscovitch, P.; Schapiro, M.B.; Rapoport, S.I. Dissociation of object and spatial visual processing pathways in human extrastriate cortex. Proc. Natl. Acad. Sci. USA 1991, 88, 1621–1625. [Google Scholar] [CrossRef] [PubMed]
- Zhong, T.; Ye, C.; Wang, Z.; Tang, G.; Zhang, W.; Ye, Y. City-scale mapping of urban façade color using street-view imagery. Remote Sens. 2021, 13, 1591. [Google Scholar] [CrossRef]
- Izadmehr, Y.; Satizábal, H.F.; Aminian, K.; Perez-Uribe, A. Depth estimation for egocentric rehabilitation monitoring using deep learning algorithms. Appl. Sci. 2022, 12, 6578. [Google Scholar] [CrossRef]
- Yuan, H.; Zhu, J.; Wang, Q.; Cheng, M.; Cai, Z. An improved DeepLab V3+ deep learning network applied to the segmentation of grape leaf black rot spots. Front. Plant Sci. 2022, 13, 795410. [Google Scholar] [CrossRef]
- Zhou, B.; Zhao, H.; Puig, X.; Xiao, T.; Fidler, S.; Barriuso, A.; Torralba, A. Semantic understanding of scenes through the ADE20K dataset. Int. J. Comput. Vis. 2019, 127, 302–321. [Google Scholar] [CrossRef]
- Le, Q.H.; Moon, H.; Ho, J.; Ahn, Y. From seeing to hearing: A feasibility study on utilizing regenerated sounds from street view images to assess place perceptions. Build. Environ. 2025, 269, 112468. [Google Scholar] [CrossRef]
- Klakk, H.; Wester, C.T.; Olesen, L.G.; Rasmussen, M.G.; Kristensen, P.L.; Pedersen, J.; Grøntved, A. The development of a questionnaire to assess leisure time screen-based media use and its proximal correlates in children (SCREENS-Q). BMC Public Health 2020, 20, 664. [Google Scholar] [CrossRef]
- Kim, S.; Kim, N. Neurophysiological and psychological effects of color and ceiling height in learning spaces. Build. Environ. 2025, 282, 113296. [Google Scholar] [CrossRef]
- Yang, L.; Yang, H.; Yu, B.; Lu, Y.; Cui, J.; Lin, D. Exploring non-linear and synergistic effects of green spaces on active travel using crowdsourced data and interpretable machine learning. Travel Behav. Soc. 2024, 34, 100673. [Google Scholar] [CrossRef]
- Lan, H.; Gou, Z.; Lu, Y. Machine learning approach to understand regional disparity of residential solar adoption in Australia. Renew. Sustain. Energy Rev. 2021, 136, 110458. [Google Scholar] [CrossRef]
- Xie, H.; Liu, L.; Yue, H. Modeling the effect of streetscape environment on crime using street view images and interpretable machine-learning technique. Int. J. Environ. Res. Public Health 2022, 19, 13833. [Google Scholar] [CrossRef] [PubMed]
- Chen, J.; Cao, S.; Du, M.; Du, M.; Liu, X.; Song, W.; Liang, Y.; He, W.; Li, L.; Wang, N. Investigating the role of two-dimensional and three-dimensional urban structures in seasonal surface radiation budget. Build. Environ. 2025, 267, 112148. [Google Scholar] [CrossRef]
- Lee, D.-H.; Jang, K.-M.; Lim, H.K. Electroencephalography changes during cybersickness: Focusing on delta and alpha waves. Brain Topogr. 2025, 38, 37. [Google Scholar] [CrossRef]
- Roy, S.; Banerjee, A.; Roy, C.; Nag, S.; Sanyal, S.; Sengupta, R.; Ghosh, D. Brain response to color stimuli: An EEG study with nonlinear approach. Cogn. Neurodyn. 2021, 15, 1023–1053. [Google Scholar] [CrossRef]
- Li, W.; Ma, S.; Liu, Y.; Lin, H.; Lv, H.; Shi, W.; Ao, J. Environmental therapy: Interface design strategies for color graphics to assist navigational tasks in patients with visuospatial disorders through an analytic hierarchy process based on CIE color perception. Front. Psychol. 2024, 15, 1348023. [Google Scholar] [CrossRef]
- Nicolae, I.E.; Ivanovici, M. Color texture image complexity—EEG-sensed human brain perception vs. computed measures. Appl. Sci. 2021, 11, 4306. [Google Scholar] [CrossRef]
- Huang, Y.; Weng, Y.; Xu, W.; Lin, X.; Wang, M.; Dong, J. Relationship between Environmental Preferences and EEG Responses of Forest Park Visitors. Chin. Urban For. 2022, 20, 30–36. [Google Scholar]
- Li, J.; Jin, Y.; Zhao, R.; Han, Y.; Habert, G. Using the EEG+VR+LEC evaluation method to explore the combined influence of temperature and spatial openness on the physiological recovery of post-disaster populations. Build. Environ. 2023, 243, 110637. [Google Scholar] [CrossRef]
- Nesse, R.M. Anxiety disorders in evolutionary perspective. In Evolutionary Psychiatry; Abed, R., St John-Smith, P., Eds.; Cambridge University Press: Cambridge, UK, 2022; pp. 101–116. ISBN 978-1-009-03056-4. [Google Scholar]
- Zhang, N.; Liu, C.; Li, J.; Hou, K.; Shi, J.; Gao, W. A comprehensive review of research on indoor cognitive performance using electroencephalogram technology. Build. Environ. 2024, 257, 111555. [Google Scholar] [CrossRef]
- Fan, X.; Hu, D.; Fan, Y.; Yang, J.; Liang, H.; Gao, T.; Qiu, L. Urban restorative environments: The critical role of building density, vegetation structure, and multi-sensory stimulation in psychophysiological recovery. Build. Environ. 2025, 281, 113190. [Google Scholar] [CrossRef]
- Kuang, B.; Yang, H.; Jung, T. The impact of visual elements in street view on street quality: A quantitative study based on deep learning, elastic net regression, and Shapley additive explanations (SHAP). Sustainability 2025, 17, 3454. [Google Scholar] [CrossRef]
- Djebbara, Z.; King, J.; Ebadi, A.; Nakamura, Y.; Bermudez, J. Contemplative neuroaesthetics and architecture: A sensorimotor exploration. Front. Archit. Res. 2024, 13, 97–111. [Google Scholar] [CrossRef]
- Olszewska-Guizzo, A.; Sia, A.; Fogel, A.; Ho, R. Can exposure to certain urban green spaces trigger frontal alpha asymmetry in the brain?—Preliminary findings from a passive task EEG study. Int. J. Environ. Res. Public Health 2020, 17, 394. [Google Scholar] [CrossRef]
- Yeom, S.; Kim, H.; Hong, T. Psychological and physiological effects of a green wall on occupants: A cross-over study in virtual reality. Build. Environ. 2021, 204, 108134. [Google Scholar] [CrossRef]
- Kim, S.-H.; Lee, C.H.; Park, S.-A. Brain wave changes in the prefrontal cortex when exposed to varying plant types as visual stimuli. HortScience 2024, 59, 1413–1418. [Google Scholar] [CrossRef]
- Cruz-Garza, J.G.; Darfler, M.; Rounds, J.D.; Gao, E.; Kalantari, S. EEG-based investigation of the impact of room size and window placement on cognitive performance. J. Build. Eng. 2022, 53, 104540. [Google Scholar] [CrossRef]
- Chiang, Y.-C.; Li, D.; Jane, H.-A. Wild or tended nature? The effects of landscape location and vegetation density on physiological and psychological responses. Landsc. Urban Plan. 2017, 167, 72–83. [Google Scholar] [CrossRef]
Disclaimer/Publisher’s Note: The statements, opinions and data contained in all publications are solely those of the individual author(s) and contributor(s) and not of MDPI and/or the editor(s). MDPI and/or the editor(s) disclaim responsibility for any injury to people or property resulting from any ideas, methods, instructions or products referred to in the content. |
© 2025 by the authors. Licensee MDPI, Basel, Switzerland. This article is an open access article distributed under the terms and conditions of the Creative Commons Attribution (CC BY) license (https://creativecommons.org/licenses/by/4.0/).