Abstract
The energy-saving performance of the building envelope, which plays a pivotal role in energy conservation and thermal insulation, has been the subject of extensive research. In the context of China’s high-quality green development, this study proposes a building energy-saving strategy based on optimal thermal comfort. It analyzes the impact of factors such as regional dwell time and PMV types on energy-saving effects, summarizes the optimal comfort parameters under the highest energy efficiency rate, and sets relevant parameters in the DeST building energy simulation software to analyze a typical public building. The analysis examined the impact of changing the heat transfer coefficients of exterior walls and windows on the annual cumulative heating and cooling loads. It established the relationship between the thermal transmittance of building envelopes and energy consumption and assessed the carbon emissions during the building’s operation and maintenance phase. The results indicate that as building envelope thermal transmittance coefficient decreases, particularly that of external windows and walls, overall cumulative heating and cooling loads decline accordingly. Notably, the reduction in external windows’ thermal transmittance coefficient has the most significant impact on total building thermal load. Furthermore, as the envelope thermal transmittance coefficient decreases, seasonal heating and cooling demands decline simultaneously, with the most substantial effect on heating load reduction during winter. Total annual building carbon emissions also decrease with the reduction in envelope thermal transmittance coefficient, particularly external wall thermal transmittance coefficient. Based on the findings of this study, the building envelope of the public building was redesigned, taking into account construction costs, the owner’s requirements, and energy efficiency alongside the reduction in carbon emissions. Comparisons of the redesigned building’s envelope thermal performance, experimental testing, and in situ measurements confirmed that it fulfilled the engineering requirements. This study also demonstrates that DeST software provides reliable technological support for low-carbon building design, retrofitting, and operation.
1. Introduction
As global energy demand has undergone continuous expansion reflecting economic growth and modernization, China, a major energy-consumer nation, has remained predominantly reliant on fossil fuels, significantly constraining the transition of the Chinese energy system onto a green, low-carbon path. Addressing energy challenges, restructuring the energy system, and improving the current energy landscape are critical to achieving sustainable development. These issues have thus become pressing ones for China and most other countries. China’s 14th Five-Year Plan includes as a strategic imperative the acceleration of the comprehensive green transition of the economy and society, with a particular emphasis on enhancing the energy efficiency and reducing the carbon emissions of the building sector. The plan also emphasizes the improvement of carbon emissions management and of building energy performance as two measures critical to achieving the national carbon neutrality target [1,2,3,4].
In recent years, numerous studies on building energy efficiency have been performed. Research focusing on the thermal insulation performance of various building envelope components, included a study by M. Izquierdo which identified potential determinants of the appropriate thickness of insulation layers, including user behavior [5]. M. Bojic et al. investigated the energy consumption of buildings during the use of three different types of expanded polystyrene insulation in concrete walls (external, internal, and sandwich insulation). This revealed a strong correlation between building energy consumption and the thermal insulation materials used in the building envelope [6]. Nussbaume et al. examined the performance of buildings equipped with vacuum insulation panels (VIPs), concluding that these exhibit superior thermal insulation properties compared to conventional materials [7]. Deshmukh, Zhangabay N., and Kos Z. investigated the impact of the thermal performance of building envelopes on indoor energy saving and thermal comfort. The findings indicated that building envelopes designed without thermal bridges offer superior advantages in energy efficiency [8,9,10]. Lahoud, C. et al. investigated the application of phase change materials (PCMs) in Mediterranean coastal buildings to enhance energy efficiency, analyzing the performance of bio-based PCMs with different melting points in a typical Lebanese building model through simulation [11]. Xiong, J. et al. examined the energy-efficient design of a banquet hall in China with integrated tunnel ventilation, evaluating its performance during the transitional season through field monitoring and DeST simulation to explore its applicability and energy-saving potential in different climate zones [12].
Regarding the development of building energy-saving technologies in China, Wang Xiqin conducted a comprehensive review of international energy-saving policies and the emerging construction sector technologies [13]. Guo Dapeng analyzed the characteristics of energy-saving measures for existing residential buildings in cold climate regions [14]. Zhou Hui focused on optimizing the thermal performance design of residential building envelopes [15]. Li Fangde explored strategies for energy-efficient retrofitting of rural buildings, and of prefabricated construction, in hot-summer and warm-winter regions [16]. However, despite these valuable contributions, little research exists on the influence of the building envelope components’ thermal transmittance upon overall building energy loads and seasonal load indices, particularly as this relates to aspects such as exterior walls, external doors and windows, and roofs.
This study employs the DeST building energy consumption analysis software package, developed by Tsinghua University for application in China, in order to accurately and efficiently investigate the impact of the building envelope components′ thermal transmittance upon overall building thermal loads and seasonal load indicators. The reliability of DeST software simulation (version 20230713) has been widely validated. Yan Da analyzed its development and simulation techniques and demonstrated its applicability to energy consumption simulation [17]. Hu Shuaijun utilized DeST to analyze the annual energy load characteristics of metro stations and of equipment management areas within them (also determining the heat exchange capacity of buried pipes in energy-efficient metro stations), confirming the applicability of DeST not only to building energy modeling but also to infrastructure projects beyond the scope of conventional building applications via both simulation and empirical validation [18].
These existing studies confirm the reliability of DeST for simulation and analysis, and indeed, DeST is, alongside e-Quest and DOE-2, one of the most widely used energy consumption simulation software packages. However, of these three, DeST includes a materials database better suited to China’s climatic conditions and is composed of modules, including DeST-H and DeST-C, which are specifically designed for simulating the energy consumption of residential and public buildings, respectively. For these reasons, DeST was adopted in this study for redesigning the building envelope of a selected public building, and undertaking a systematic examination of the impact of different envelope materials on building energy loads.
2. Project Overview
This study is based on the Wugang City Civic Center construction project. This project has a total building area of 66,611.69 m2, a floor area ratio (FAR) of 0.6%, a building coverage ratio of 18.21%, a green space ratio of 32%, and maximum building height is 33.10 m. The six-story cultural exhibition hall of this project was selected for modeling as shown in Figure 1.
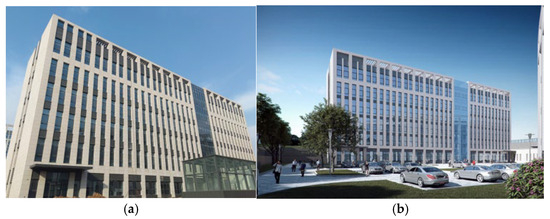
Figure 1.
Cultural Exhibition Hall. (a) On-site building photo, (b) architectural rendering.
The project is located in Wugang City, Henan Province, China, which is adjacent to Zhumadian City, Henan Province, China. The benchmark urban climate parameters for Zhumadian City, the nearest available location in the DeST database, were selected for use in the simulation. The building’s orientation is 8° East of due South.
The geographical information for the benchmark model was configured as shown in Table 1, while site-specific geographical information and meteorological data are presented in Figure 2.

Table 1.
Geographical Location Analysis of the Simulation.
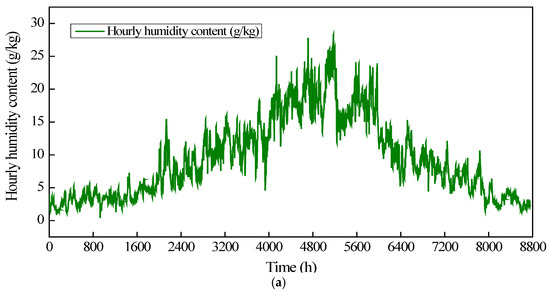
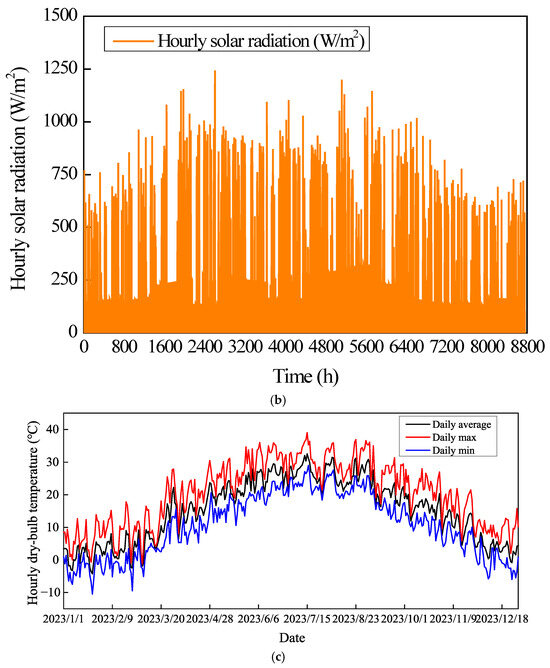
Figure 2.
Location geographical information and meteorological data. (a) Hourly humidity content, (b) hourly solar radiation, (c) hourly dry-bulb temperature.
The project location is classified as Cold Zone B according to the Chinese Standard for Design of Heating Ventilation and Air Conditioning of Civil Buildings (GB 50176-2016) [19], rather than a moderate climate zone. This climate zone is characterized by substantial seasonal variations with both significant winter heating and summer cooling requirements. Key climate parameters include: annual average temperature of 14.6 °C, extreme minimum temperature of −10.8 °C in winter, extreme maximum temperature of 41.2 °C in summer, heating season from 15 November to 15 April (5 months), cooling season from 15 June to 15 September (3 months), annual precipitation of 839 mm, and annual sunshine duration of 2230 h.
Cold Zone B was selected as the study location because it features both substantial winter heating demands typical of cold regions and significant summer cooling demands characteristic of hot regions, making it a representative climate zone for investigating the relationship between public building envelope thermal performance and energy consumption. This zone encompasses 17 provinces across China, covering approximately 320 million m2 of existing public building area, making the findings of this study broadly applicable to a substantial portion of China’s building stock. Future research will extend this methodology to other climate zones, including Hot Summer–Warm Winter regions (e.g., Guangzhou) and Severe Cold regions (e.g., Harbin), to verify the cross-climate applicability of the conclusions drawn in this study.
The building was originally constructed in 2020 as a standard public building meeting the baseline 65% energy-saving requirement under Chinese building codes. In 2022, to meet the requirements of a regional low-carbon pilot demonstration project, a comprehensive energy-efficient retrofit was undertaken to achieve an additional 20% energy savings (targeting an 85% total energy-saving rate). The retrofit focused on optimizing the building envelope thermal performance while maintaining the building’s operational functionality. The initial envelope configuration prior to retrofitting consisted of 150 mm concrete exterior walls with 40 mm inorganic fiber spray insulation (U = 0.83 W/(m2·K)) and standard thermal break aluminum windows with ordinary insulated glazing (U = 2.6 W/(m2·K)). Pre-retrofit monitoring indicated an annual heating and cooling load of 78.61 kWh/m2 with monthly average carbon emissions of 59.23 tCO2.
The project’s heating and cooling sources of this building is composed of screw-type air chiller and heat pump units combined with terminal air conditioning systems. The units are installed on the building roof with a dedicated pump room. The pump room is equipped with circulation pumps, an integrated water treatment system, water softener equipment, and a soft water storage tank. Each screw-type air chiller and heat pump unit are individually paired with a corresponding water pump in a one-to-one configuration. The cooling supply period runs from 15 June to 15 September, while the heating supply period runs from 15 November to 15 April. During cooling, the supply and return water temperatures are set at 7 °C and 12 °C, respectively. During heating, the supply and return water temperatures are maintained at 45 °C and 40 °C, respectively.
3. Model Establishment
3.1. Thermal Comfort Model
Currently, most office buildings suffer from excessive cooling and heating. While the scientifically recommended thermal comfort ranges are 26–28 °C in summer and 18–22 °C in winter, actual HVAC systems often overcool or overheat spaces, maintaining 25–27 °C (chilly) in summer and 26–29 °C (overly warm) in winter. This inefficient temperature control significantly increases energy consumption and severely undermines building energy efficiency goals.
The project owner required strict control of operational energy consumption after the building was commissioned to establish it as a regional low-carbon benchmark. Therefore, the design focuses on two key aspects: building envelope materials and indoor thermal comfort optimization.
In terms of building thermal comfort, a comprehensive analysis was conducted using both PMV and APMV standards. The following Equations (1) and (2) were used to conduct the analysis:
where M is the metabolic rate (indicating human activity intensity, measured in W/m2); S is thermal load on body, measured in W/m2 (for detailed parameters, refer to Reference [20]).
where λ is the adaptive coefficient [21], when PMV ≥ 0, λ = 0.24, and when PMV < 0, λ = −0.50.
This project innovatively integrated PMV and APMV strategies, implementing PMV-based control in air-conditioned zones while adopting APMV standards in public areas, with the air-conditioned zones set to a broader PMV = 0 ± 1 range to further reduce building loads and energy consumption (Table 2).
Table 2.
Assumptions on personnel satisfaction under different models.
By establishing a mathematical model of the building thermal comfort, the impact of parameters, such as functional room types and occupancy duration on occupant satisfaction rates and building energy consumption rates, was studied.
First, set the variables based on the actual dwell time in the area.
- x1: Time spent in the PMV = 0 ± 0.5 zone (h).
- x2: Time spent in the PMV = 0 ± 1 zone (h).
- x3: Time spent in the APMV zone (h).
Based on the PMV type settings for various types of indoor rooms, the following 20 mixed setting groups were divided as shown in Figure 3a. We performed Pareto optimization using Python libraries to analyze the sensitivity of the results to the time allocation in each area. Figure 3b shows the overall satisfaction rate of office workers and the overall energy consumption rate of buildings within 10 h for different groups. By taking into account both the overall satisfaction rate and the overall energy consumption rate, the optimal balance point was obtained: when x1 = 3, x2 = 4, x3 = 3, the satisfaction rate is ≥85% and the energy consumption is ≤65%.
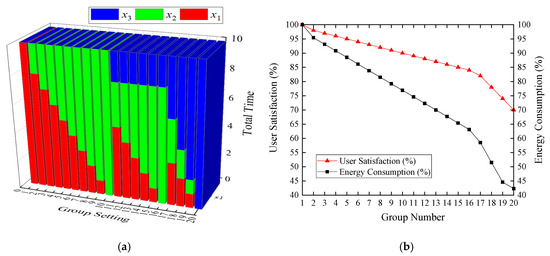
Figure 3.
DeST 3D and planar models. (a) 3D Model, (b) single-floor plan modeling.
Further analysis was conducted on the PMV type allocation for each functional room. The objective was to minimize the overall energy consumption, subject to the constraint that the overall satisfaction rate must be at least 85%. The following analytical Equation (3) and the data in Table 3 were obtained. As can be seen from Table 3, the optimal comfort level could be achieved. When the personnel satisfaction rate is 85%, the building energy consumption can be controlled at 58.5%, which can effectively control the energy consumption of the building.
Table 3.
Thermal comfort model settings for different building zones (project location).
Based on the analysis of the above model, in order to ensure the comfort and satisfaction of office workers while guaranteeing the low-energy operation and maintenance of the building, the warehouse, machine room, restrooms, and public areas were set according to the APMV standard, while the main office areas adopted a more relaxed PMV mode. Subsequent research on the building’s thermal load and carbon emissions will be based on this model.
3.2. DeST Model
To achieve the above comfort level settings, consider differentiated configurations in the DeST model’s room functions. First, in the Area Management of DeST, set functional types for different rooms (office, meeting room, break room). Then, proceed to the HVAC System Settings and manually calculate and configure temperature limits in the Temperature Control Strategy to meet the target PMV range:
PMV = 0 ± 1: Temperature fluctuation range: ±2–3 °C; APMV: Temperature fluctuation range: −6 °C~+4 °C.
Adopt zone-based control to categorize room comfort levels, ensuring independent HVAC control for each room. In the System Linkage Interface, bind different rooms to corresponding temperature control strategies, enabling energy consumption simulation analysis under varying comfort conditions.
This study used DeST software version 20230713, employing the DeST-C module for model construction and simulation. The building envelope consisted primarily of components such as concrete exterior walls, windows, external inorganic fiber insulation, stone cladding, doors and windows. After the completion of a standard floor layout, this was replicated for the remaining floors, as shown in Figure 4. The model took into account the pedestrian flow and ventilation rates for each floor, assigning material parameters for the various building envelope components taken from the materials database. The building parameters used in the numerical simulations are provided in Table 4.
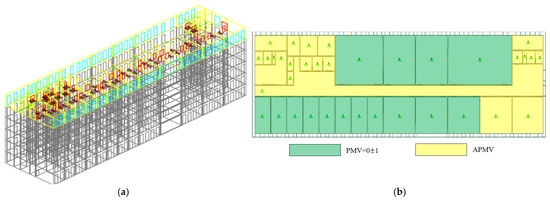
Figure 4.
DeST 3D and planar models. (a) 3D model, (b) single-floor plan modeling and thermal comfort zones.
Table 4.
Building parameter settings.
To ensure the accuracy of the DeST simulation and subsequent validation, a comprehensive temperature monitoring system was deployed throughout the building. A total of 64 PT1000 platinum resistance temperature sensors (accuracy: ±0.1 °C) were strategically installed in accordance with the Technical Standard for Building Environment Detection (JGJ/T 440-2018) [22]. The sensor deployment consisted of 16 outdoor sensors positioned at 1.5 m height around the building perimeter in unobstructed locations to avoid direct solar radiation and precipitation interference, and 48 indoor sensors distributed across functional zones as follows: 24 sensors in exhibition areas (1 sensor per 50 m2, positioned at 1.1 m height representing the human breathing zone, 0.5 m from windows, and 0.3 m from wall-roof junctions at 2.5 m height), 12 sensors in conference areas (1 sensor per 20 m2, evenly distributed at 1.1 m height), and 12 sensors in public corridors and stairwells (positioned every 10 m at 1.5 m height). All sensor data was cross-validated against an SK-FHRL1810W thermal performance detector (accuracy: ±0.05 °C), yielding a relative error of less than 2.5%, confirming the data’s suitability for use as DeST simulation input parameters.
4. Building Envelope Energy Consumption Analysis
To investigate the impact of the building envelope upon energy consumption and carbon emissions, the combined thermal conductivity effects of its various components, including walls, doors, windows, floors, and roofs, must be considered.
Due to the limited number of exterior doors, this study focused primarily on the impact of the building’s walls and windows. After constructing the model, it was necessary to simulate its natural daylight exposure, as shown in Figure 5. Following the energy consumption analysis, the DeST software generated numerical results for each room in the building, covering areas such as annual thermal load, total energy consumption, individual energy use, and other performance parameters. These detailed estimates of both overall and localized energy consumption facilitate the design optimization of building energy efficiency and carbon emission calculations.
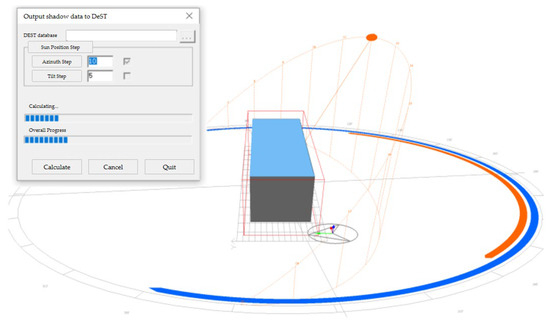
Figure 5.
Calculation of building natural daylight.
4.1. Energy Simulation Results
The exterior wall of the building, which consists of a concrete/masonry structure, a 40 mm inorganic fiber spray coating, and stone cladding, provided a design thermal transmittance coefficient of 0.83 W/(m2K). The first study was to investigate the impact of the exterior wall thermal transmittance coefficient on building energy consumption. The insulation layer thickness was increased to reduce this coefficient, and the energy consumption analysis was repeated, while holding the parameters for the roof and external windows constant.
The thermal transmittance coefficient of the building exterior wall varied over the range 0.43–0.83 W/(m2K) by altering the simulated thickness of the exterior wall insulation material, and the impact of exterior walls with different thermal transmittance coefficients on building energy consumption was assessed via simulation. The estimates obtained included the building annual cumulative cooling and heating loads and annual cumulative load indices. As shown in Table 5, as the exterior wall thermal transmittance coefficient gradually decreased from 0.83 W/(m2K) to 0.43 W/(m2K), the cumulative heating load decreased from 100% to 91.9%, 90.5%, 89.1% and 87.8%. Meanwhile, the cumulative cooling load decreased from 100% to 99.5%, 99.2%, 99.0% and 98.9%. These results indicate that a reduction in the thermal transmittance coefficient of the exterior wall alone can lead to a significant reduction in building heating load. Meanwhile, the impact on the cooling load is comparatively modest.
Table 5.
Heating and cooling loads under different thermal transmittance coefficients of exterior walls.
A further overall study of the building thermal load was conducted by varying the thermal transmittance coefficient of the exterior windows. As shown in Table 6, as the thermal transmittance coefficient of the exterior windows was decreased from 2.6 W/(m2K) to 2.2 W/(m2K), the cumulative heating load decreased from the original 100% to 96.8%, 95.1%, 93.6%, and 91.9%. Similarly, the cumulative cooling load decreased from 100% to 98.7%, 96.6%, 94.3%, and 92.4%. This demonstrated that a reduction in the thermal transmittance of the exterior windows substantially decreases both heating and cooling loads.
Table 6.
Heating and cooling loads under different thermal transmittance coefficients of exterior windows.
The result comparisons in Table 5 and Table 6 reveal that exterior windows have a larger impact on the overall building thermal load of the building than exterior walls. This primarily reflects the higher thermal conductivity of window materials, which allows for greater reductions in their thermal transmittance, and thus greater effects on building thermal performance. This phenomenon also reflects public buildings’ reliance on daylight, which leads them to possess relatively high window-to-wall ratios compared to typical traditional residential projects, further amplifying the impact of window thermal performance on overall thermal load.
4.2. Analysis of Energy Consumption with Different Thermal Transmittance Coefficients
In order to assess the relative impact of the exterior walls and windows on the building energy consumption, the relationship between reductions in the thermal transmittance coefficient and the building thermal load was estimated (See Figure 6). As successive reductions of the same magnitude (0.1 W/(m2K) were applied to the thermal transmittance coefficients of both exterior walls and windows, greater reductions in overall heating and cooling load occurred for windows, indicative of the more significant impact on building total thermal load of exterior windows’ thermal transmittance coefficient. The windows’ thermal transmittance coefficient should therefore be emphasized during the optimization of building design, along with other performance parameters.
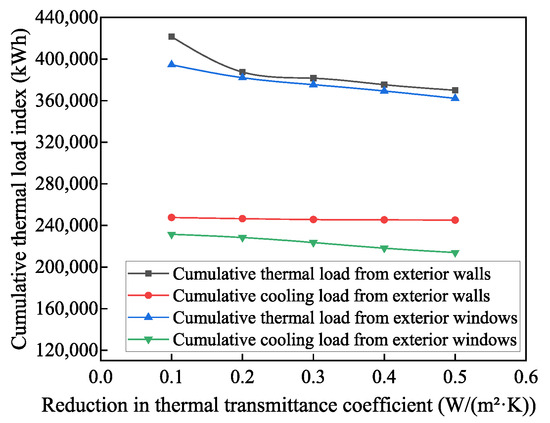
Figure 6.
Relationships between thermal transmittance coefficients and building thermal loads.
As illustrated in Figure 7 and Figure 8, as the thermal transmittance coefficients of the exterior walls and windows decreased, the building’s insulation performance improved significantly, reducing the seasonal heating and cooling loads. The reduction in heating load during the heating season was especially significant, while cumulative annual humidification remained relatively stable.
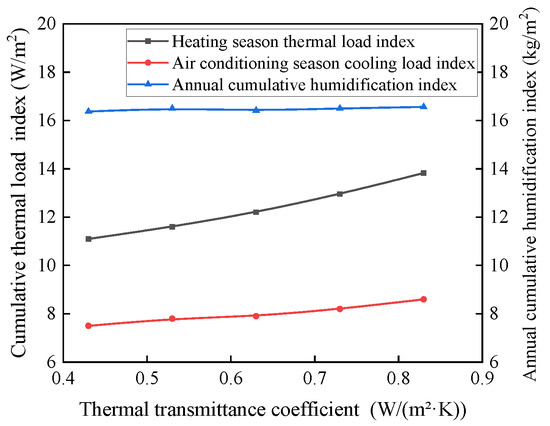
Figure 7.
Seasonal thermal load analysis of the building under different thermal transmittance coefficients of exterior walls.
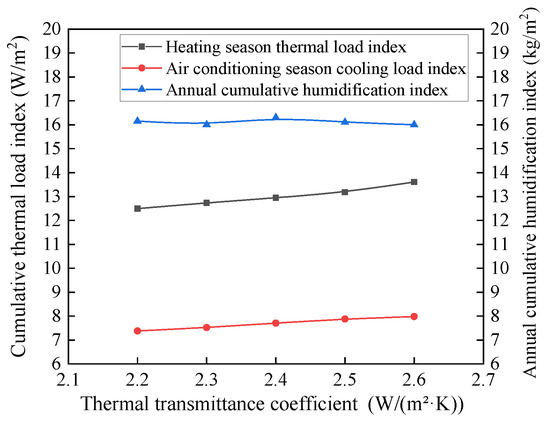
Figure 8.
Seasonal thermal load analysis of the building under different thermal transmittance coefficients of exterior windows.
4.3. Analysis of Building Carbon Emissions with Varying Thermal Transmittance
DeST provides an accurate and efficient approach for the calculation of carbon emissions during the building operation and maintenance phases. After conducting energy consumption analysis and simulation, DeST generates a detailed energy consumption inventory. Total energy consumption can then be calculated and converted into equivalent electrical energy. By applying the average CO2 emission factor of the regional electricity grid in China, the equivalent electrical energy can be converted to determine carbon emissions for each stage in the building’s operation and maintenance phase. This carbon emission calculation is in accordance with the Chinese standard, Carbon Emission Calculation of Buildings GB/T 51366-2019 [23]. The carbon emission factor for electricity applied was the average for the Central China Power Grid, 0.5257 kg CO2/kWh.
Figure 9 presents the monthly carbon emission calculations for the building. As shown in the figure, the higher thermal loads generated during the heating and cooling seasons result in higher carbon emissions during these times. In addition to energy use for heating and cooling, DeST can also, as required, estimate and calculate energy consumption for other building uses including ventilation, water supply and drainage, lighting, and elevators, all of which contribute significantly to overall carbon emissions of the building. These can then be used in carbon emission calculations based on such modeling. Thus, the DeST software can also provide data useful for low-carbon operations management during building maintenance. Figure 10 illustrates the estimated carbon emissions simulated based on varying thermal transmittance coefficient assumptions for the building envelope. These results demonstrate that modifications to the envelope thermal transmittance coefficient can lead to noticeable changes in annual carbon emissions. A reduction in the exterior wall thermal transmittance coefficient, from 0.83 W/(m2K) to 0.63 W/(m2K) and further down to 0.43 W/(m2K), resulted in a decrease in monthly average carbon emissions from 59.23 tCO2 to 50.12 tCO2. Estimates based on similar analysis indicated that a reduction in the exterior windows’ thermal transmittance from 2.6 W/(m2K) to 2.4 W/(m2K) and further to 2.2 W/(m2K) would reduce monthly average carbon emissions to 46.17 tCO2, a larger reduction than that achieved by the modification of the exterior walls. This emphasizes the substantial impact exterior windows have on building carbon emissions.
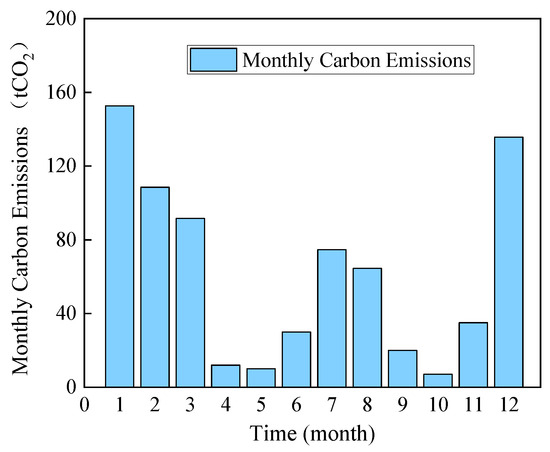
Figure 9.
Monthly carbon emission analysis of the building.
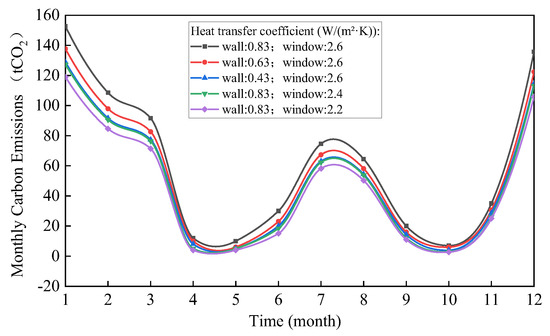
Figure 10.
Comparative analysis of building carbon emissions under varying thermal transmittance coefficients of the building envelope.
5. Comparison of Energy-Saving Retrofit Designs
Originally designed as a public building, the building was already compliant with the standard energy-saving rate of 65%. However, since the project was a carbon-neutral pilot, a further 20% saving was required. During the analysis of the energy-saving retrofit, this study considered not only factors such as building location, local climate, and energy efficiency requirements as a basis for modifications, but also the requirements of the client. These included continued reliance on inorganic fiber spray coating and ex-truded polystyrene (XPS) board insulation. Based on the above analysis of the building envelope thermal transmittance, a retrofit strategy based on using high-performance windows and doors was devised. This was also designed to ensure the timely procurement of materials and subcontracting. The original building envelope design is shown in Table 7; the proposed retrofit design is given in Table 8.
Table 7.
Original design of the building envelope.
Table 8.
Scheme comparison analysis.
The simulation provided estimates of the cumulative heating and cooling loads before and after retrofitting for each scheme and this data is presented in Table 9.
Table 9.
Energy efficiency analysis of the building under different retrofit schemes.
The effects of the different retrofit schemes are presented in terms of absolute and percentage changes in Table 10. The optimization of the building envelope materials significantly reduced both building heating and cooling loads. Specifically, Scheme 1 achieved an energy-saving rate of 15.6% relative to the original design baseline, with an incremental cost of 180,000 RMB and an estimated payback period of approximately 0.4 years. Scheme 2 achieved an energy-saving rate of 20.75%, with an incremental cost of 520,000 RMB and an estimated payback period of approximately 1 year. Scheme 3 further improved the energy-saving rate to 23.11%, with an incremental cost of 890,000 RMB and a payback period of around 2 years. Scheme 4 offered the highest energy-saving rate of 27.15%, but at a significantly higher incremental cost of 1.76 million RMB, prolonging the payback period to approximately 4 years. Based on these simulation results, Scheme 2, 3, and 4 all fulfill the required energy-saving standard; however, since Scheme 2 is very close to the threshold, it could not be recommended. Carbon emission estimates for the building derived from DeST simulations under the different retrofit schemes are shown in Figure 11. Based on the construction costs, client requirements, energy-saving standards, and effects on carbon emissions, Scheme 3 was ultimately selected for the final design.
Table 10.
Analysis of building energy-saving rates under different retrofit schemes.
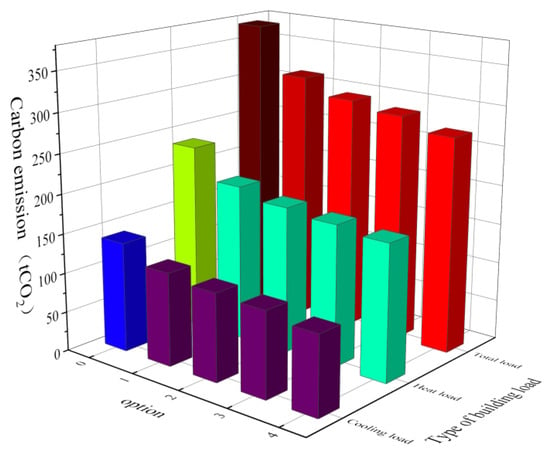
Figure 11.
Analysis of building carbon emissions under different retrofit schemes.
During the retrofit design process, several advanced materials and technologies were systematically evaluated to maximize thermal performance, including triple-glazed windows, vacuum insulation panels (VIPs), and aerogel-enhanced insulation systems. While these materials demonstrate superior thermal characteristics in laboratory conditions, their adoption was ultimately deemed inappropriate for this specific project context after comprehensive techno-economic analysis.
Triple-glazed window systems, capable of achieving U-values as low as 0.8–1.0 W/(m2·K), were extensively considered as alternatives to the high-performance double-glazed low-E windows (U = 2.2 W/(m2·K)) specified in Scheme 3. However, three primary factors precluded their selection. First, the premium cost for triple glazing would increase fenestration costs by 80–120%, extending the economic payback period beyond acceptable thresholds for public infrastructure projects. Second, the existing window frame structures could not accommodate the additional weight of triple-glazed units without extensive and costly structural reinforcement of the building envelope. Third, and perhaps most significantly, detailed energy modeling indicated that for Cold Zone B regions with moderate winter conditions, the marginal energy savings achievable through triple glazing (estimated at 3–5% additional reduction compared to high-performance double glazing) do not justify the substantial capital investment increase.
Similarly, advanced insulation materials including vacuum insulation panels and aerogel-based systems were evaluated but not incorporated into the final design. The decision against these technologies reflected multiple practical constraints. Installation complexity and long-term durability concerns in large-scale building applications remained inadequately resolved, particularly regarding edge effects and thermal bridge mitigation at panel joints. Local technical expertise for proper installation and maintenance of these specialized systems was limited in the project region, raising concerns about construction quality and long-term performance assurance. The building owner expressed preference for conventional, proven materials, specifically inorganic fiber spray coating and extruded polystyrene (XPS) insulation boards, based on their established performance records and extensive regional application experience. Furthermore, supply chain reliability considerations favored conventional materials for this public infrastructure project, requiring timely completion within prescribed budget and schedule constraints. The material selections ultimately adopted—inorganic fiber spray coating, XPS insulation boards, and low-E double-glazed windows—represent an optimal balance between thermal performance, economic viability, constructability, and long-term operational reliability within this specific project context. These decisions reflect the practical realities of retrofit implementation in existing buildings under construction, where theoretical performance optimization must be reconciled with economic constraints, technical feasibility, and stakeholder requirements. Future retrofit projects with different budget allocations, performance requirements, or access to specialized installation expertise may find these advanced materials economically justified, particularly as manufacturing costs decline and installation practices mature.
While Table 10 presents the baseline economic analysis with specific payback periods, it is important to note that these estimates are subject to variations in material costs, labor rates, and energy prices. The economic viability of each scheme depended on several market factors:
- (1)
- Material cost fluctuations: Insulation materials (inorganic fiber spray, XPS boards) and high-performance windows constitute the largest cost components. Regional price variations and bulk procurement options can significantly affect total investment costs. Based on market surveys in Henan Province, material costs can vary by 15–30% depending on supplier selection and project scale.
- (2)
- Energy price trends: China’s electricity prices have been subject to periodic adjustments linked to energy system reforms and carbon neutrality policies. Rising energy costs would shorten the calculated payback periods, improving the economic attractiveness of higher-performance schemes (Scheme 3 and Scheme 4). Historical data from the past five years show an average annual electricity price increase of 3–5% in Henan Province.
- (3)
- Carbon pricing mechanisms: Under China’s evolving carbon emissions trading system and potential carbon tax policies, buildings achieving higher energy-saving rates may benefit from carbon credits or tax incentives, further improving long-term financial returns. The current carbon trading price in China ranges from 40 to 60 RMB/tCO2, which could provide additional economic benefits estimated at 4400–6600 RMB annually for Scheme 3.
- (4)
- Labor cost considerations: Skilled labor for inorganic fiber spray application and thermal bridge detailing varies significantly across regions, impacting total retrofit costs by an estimated 15–25%. Coastal developed regions typically experience 30–40% higher labor costs compared to central provinces.
Based on these considerations, Scheme 3 was selected as it maintained reasonable economic viability under various market conditions while reliably meeting the 20% additional energy-saving target required for the carbon-neutral pilot project. The scheme demonstrated resilience to cost fluctuations: even if material costs increased by 20% and labor costs rose by 25%, the payback period would extend to approximately 2.5 years, which remains acceptable for public infrastructure projects. Decision-makers in other regions should conduct localized cost assessments and consider regional energy price trajectories before selecting specific retrofit schemes.
6. Thermal Testing of Building Envelope Structure
To ensure that the Scheme 3 energy-saving retrofit design would create the expected outcomes, a series of tests and validation procedures were conducted on envelope components based on their specific characteristics. These emphasized comparisons between the DeST design simulations and test results for thermal resistance and heat transfer coefficients. For the exterior walls, which are a critical influence on building energy consumption, and which, unlike prefabricated industrialized products such as windows and doors, are constructed in situ by workers, both experimental testing and in situ measurements were carried out and compared with the DeST design simulations. For the roof, the DeST design simulations and experimental results were compared. Industrialized products such as windows and doors were selected directly from the market based on their cost-effectiveness, and for energy-saving parameters closely matching the requirements of the Scheme 3 energy-saving retrofit design.
Laboratory tests were conducted using the IMWT-1515 intelligent steady-state heat transfer measurement system, produced by IMPAL (Tianjin) Instrument & Control Equipment Co., Ltd. This system’s primary components include a specimen rack, cold box, hot box, data acquisition system, and computer control system, as shown in Figure 12. The advantages of this system include short measurement times, high speed, high accuracy, high automation, low noise, and an interface capable of displaying real-time temperature and heat flux parameter measurements. The system’s specifications are given in Table 11.
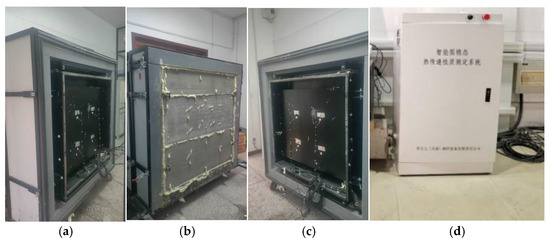
Figure 12.
Intelligent steady-state heat transfer measurement system. (a) Cold box, (b) specimen rack, (c) hot box, (d) data acquisition system and control system.
Table 11.
Instrument technical specifications.
The specimens tested are described in Table 12. During the steady-state heat transfer tests, these were placed between the hot and cold boxes, with the specimen positioned against the side of the hot box. The cold and hot boxes were then fixed in place, using threaded rods to ensure good contact between the specimen and both the hot and cold boxes. The perimeter was subsequently sealed with a colloidal substance to prevent heat loss. After assembly, the setup was left in the test environment for over 48 h, allowing the specimen to reach thermal and humidity equilibrium. Since the hot and cold boxes were equipped with temperature sensors, no external temperature sensors were required. Instead, the sensors were affixed to the surface of the specimen using aluminum foils. Each box had four sensors to monitor the temperature inside the box, while the remaining six sensors were used to measure temperature variations across locations at 40 cm intervals on the specimen surface. Before starting the test, airflow speed should be controlled to remain below 2 m/s. Each experiment included a preheating stage and an equilibrium stage. Once the output power of the system had reached equilibrium, the test data was collected; the specimen heat transfer coefficient was calculated automatically by the system.
Table 12.
Test specimens.
Figure 13 depicts the variation over time of the temperatures of the hot and cold boxes during the exterior wall and roof experiments, with ‘R’ and ‘W’ denoting the points at which the roof and exterior wall, respectively, reached thermal stability. The recorded stabilization times for the hot box were 153.81 min for the roof sample and 202.5 min for the in situ exterior wall sample; for the cold box these were 149.12 min and 207.62 min, respectively. These results indicate that the roof structure sample exhibited superior thermal stability to the wall sample during testing. The final measured thermal transmittance coefficients were summarized in Table 12.
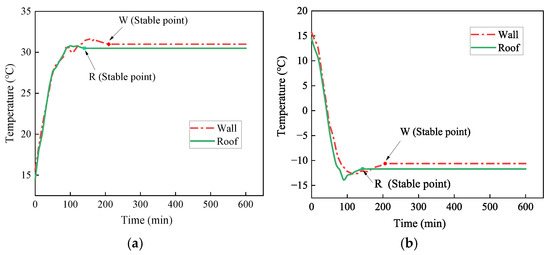
Figure 13.
Temperature variation inside the hot and cold boxes. (a) Temperature variation inside the hot box, (b) temperature variation inside the cold box.
In situ measurements of the exterior surface temperature and heat flux density of the wall were also conducted using the SK-FHRL1810W thermal performance detector, whose experimental principle is illustrated in Figure 14. The heat flux sensor was positioned between two parallel plates with a uniform temperature. These guaranteed a one-dimensional steady-state heat flow. Once the temperatures on the interior and exterior wall surfaces reach thermal equilibrium, the detector produces the thermoelectric potential. The thermal resistance and heat transfer coefficient of the in situ sample can then be determined by correlating the heat flux density with the average surface temperature difference, as described in Equation (4). Figure 15 shows the relevant observations; the technical specifications of the instrument are given in Table 13.
where U is the thermal transmittance coefficient (W/(m2K), Q is the heat flux density (W/m2), and ∆T (oC) is the temperature difference between the interior and exterior surfaces.
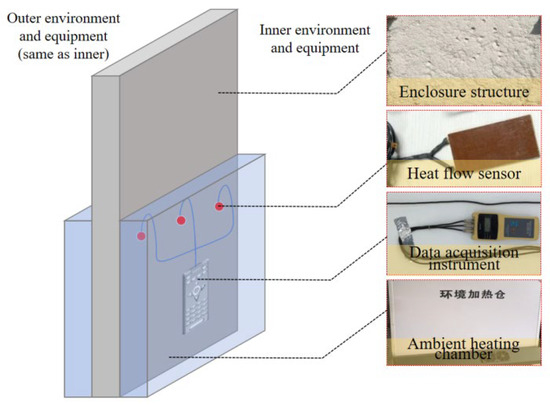
Figure 14.
Field test equipment and test principle of building envelope.
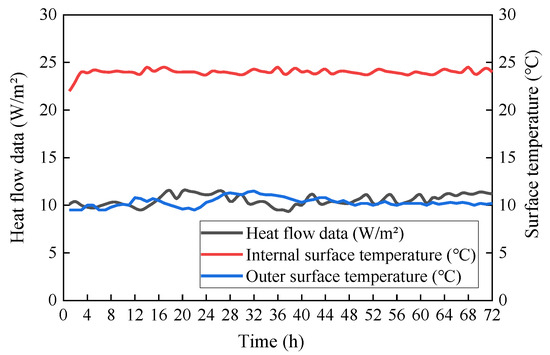
Figure 15.
Relationship between heat flux, internal and external surface temperature and acquisition time.
Table 13.
In situ instrument technical specifications.
To comprehensively verify the thermal performance of the retrofitted building envelope, infrared thermographic inspection was conducted in January 2023 under winter conditions with high thermal contrast (average outdoor temperature: −2.5 °C, indoor temperature: 23 °C). A FLIR T1040 infrared thermal imager was employed to systematically scan all exterior walls, window–wall junctions, door frames, and wall–roof connections. The thermographic analysis revealed no significant thermal anomalies in the retrofitted envelope structure. Specifically, the surface temperature difference at window–wall junctions decreased from 5.2 °C (pre-retrofitting baseline) to 1.8 °C post-retrofitting, while the temperature difference at wall–roof slab connections improved from 4.8 °C to 1.5 °C. The thermal images confirmed uniform temperature distribution across all interior spaces, with maximum temperature variations less than 2 °C, validating the effectiveness of the insulation enhancement and thermal bridge mitigation measures. These results corroborated the findings from the laboratory testing and in situ heat flux measurements presented in this section, providing comprehensive multi-method validation of the Scheme 3 retrofit design.
Table 14 reports the heat transfer coefficients of the envelope components as derived from both DeST design calculations and various testing methods (including experimental tests, in situ measurements, and product testing reports). The test methods were compliant with the Chinese Standard Testing Methods for Thermal Transmittance Coefficient of Building Envelope and Heating Supply Quantity GB/T 23483-2009 [24]. These data encompass the results from the exterior walls, roof, windows, and doors. Inspection of the table reveals that the measured values are lower than those used by DeST, with deviations of less than 10%. This implies that the thermal performance of the envelope structure constructed in situ was compliant with the Scheme 3 design requirements, and thus capable of achieving the energy-saving goals set for the carbon-neutral pilot project. Moreover, the project has passed review by a professionally certified third-party organization and has received energy-saving approval from government authorities.
Table 14.
Analysis of building envelope thermal transmittance coefficient.
7. Conclusions
This study conducted simulations and experiments on actual engineering projects based on the DeST model, taking building comfort into consideration. By simulating building energy consumption and carbon emissions under assumptions of building en-velope components with varying thermal transmittance coefficients, an energy-saving solution for the building was determined based on a comparative analysis of multiple energy-saving schemes. The proposed energy-saving solution was validated through both experimental tests and in situ measurements, guaranteeing that the building’s energy efficiency would satisfy the requirements of the carbon-neutral pilot project. The following conclusions can be drawn from this study.
- (1)
- To address the issue of excessive energy demand and declining occupant comfort in HVAC systems, we implemented a broader PMV-based operational strategy. The analysis demonstrated that by maintaining occupant satisfaction above 85%, building energy consumption was reduced by 35% compared to the original design.
- (2)
- The DeST software is capable of performing comprehensive comparative analyses of building heating and cooling loads in varying scenarios, from which optimal energy-efficient design solutions can be identified. This demonstrates that DeST serves as an effective tool for guiding energy-saving building design.
- (3)
- As the thermal transmittance coefficient of buildings’ exterior walls and windows decreases, their insulating performance improves significantly, reducing their seasonal heating and air conditioning loads. The most notable reduction occurs in the heating season. By contrast, annual accumulated building humidity load remains relatively stable.
- (4)
- As the thermal transmittance coefficient of a building’s envelope components decreases, its annual carbon emissions are clearly reduced.
- (5)
- While DeST software has proven reliable in this study (with deviations <10% between simulated and measured values as shown in Table 14), it is still subject to certain limitations that should be acknowledged. The built-in materials library can be somewhat out of date, making it necessary for users to manually input new materials, a relatively cumbersome process. Additionally, during analysis of building energy retrofit design, DeST requires the use of multiple separate models for different retrofit scenarios rather than supporting the use of a single model with adjustable conditions, which reduces analytical efficiency and complicates the evaluation process. Furthermore, the simulation did not fully account for outdoor wind speed fluctuations, contributing to minor deviations in cooling load estimates (2.2% as noted in Section 6).
Compared to internationally widely used software such as EnergyPlus and e-Quest, DeST offers advantages in terms of its materials database better suited to Chinese climate conditions and faster computation time for preliminary design iterations. However, EnergyPlus provides more flexible HVAC system modeling capabilities and better integration with CFD tools for detailed airflow analysis. For projects requiring complex HVAC optimization or novel building geometries, cross-validation between DeST and other simulation tools is recommended to enhance result reliability.
- (6)
- This study provides practical evidence supporting China’s building sector carbon neutrality goals outlined in the 14th Five-Year Plan, and the findings have several important implications for policy development and practical implementation:
The demonstrated feasibility of achieving 20–27% additional energy savings beyond the standard 65% requirement suggests that current provincial building codes in Cold Zone regions could be updated to mandate stricter envelope performance standards. Specifically, we recommend setting maximum thermal transmittance coefficients of U ≤ 0.66 W/(m2·K) for exterior walls and U ≤ 2.2 W/(m2·K) for exterior windows in public building renovations within Cold Zone B regions.
The PMV-APMV coupled comfort model established in this study, which achieved 85% occupant satisfaction while reducing energy consumption by 35% compared to conventional uniform HVAC control, challenges the traditional “one-size-fits-all” approach to thermal comfort standards. This differentiated comfort strategy could inform policy revisions to allow variable thermal comfort zones in public buildings, particularly for transitional spaces such as corridors, lobbies, and restrooms where shorter occupancy durations permit broader temperature tolerance ranges. This approach could be incorporated into updated versions of GB/T 50785-2012 [21].
The methodology established in this study is directly applicable to similar public buildings (cultural centers, libraries, museums, government office buildings) across China’s Cold Zone B regions, which encompasses 17 provinces and covers approximately 320 million m2 of existing public building area. If the energy-saving retrofit strategies demonstrated in this study were replicated across 10% of these buildings, the cumulative annual carbon reduction potential could reach approximately 350,000 tCO2, contributing meaningfully to provincial and national decarbonization targets.
The implementation barriers include upfront capital requirements (ranging from 520,000 to 1,760,000 RMB per building depending on the retrofit scheme) and the need for skilled labor in advanced insulation application techniques, such as inorganic fiber spraying. To accelerate wider adoption of these energy-efficient retrofit strategies, we recommend several policy support mechanisms: (a) government subsidy programs covering 30–40% of retrofit costs for public buildings that achieve energy savings exceeding 20% above the baseline standard, (b) establishment of regional materials procurement consortia to reduce costs through bulk purchasing and standardized specifications, (c) mandatory post-occupancy energy audits and thermal performance verification for public buildings exceeding 10,000 m2 in floor area, and (d) integration of building energy simulation tools such as DeST into mandatory building permit review processes to ensure compliance with energy efficiency targets during the design phase.
Author Contributions
Methodology, Investigation, Writing—original draft, Visualization and Data Curation, L.C. and Y.C.; Model Experiment, Z.H. and Y.L.; Writing—review and editing, Y.W. and H.C.; Conceptualization and Funding Acquisition, Z.Z. and K.Y.; Provision of Study Materials, X.L. and H.C. All authors have read and agreed to the published version of the manuscript.
Funding
This research was supported by the Major Science and Technology Special Program of Henan Province (Grant No. 221100320100).
Data Availability Statement
The original contributions presented in the study are included in the article, further inquiries can be directed to the corresponding author.
Conflicts of Interest
Authors Lu Chen, Zhipan Han, Zhongshan Zhang, Yu Liu, Xiaomeng Li were employed by the company China Construction Seventh Engineering Division Corp., Ltd. Author Yujie Wu was employed by the company Henan Academy of Architectural Sciences Co., Ltd. The remaining authors declare that the research was conducted in the absence of any commercial or financial relationships that could be construed as a potential conflict of interest.
References
- Research Center for Building Energy Conservation. Annual Development Research Report on Energy Conservation in China; Research Center for Building Energy Conservation, Tsinghua University: Beijing, China, 2018. [Google Scholar]
- The “BP Statistical Review of World Energy (2013 Edition)” Is Released. Available online: https://www.rrojasdatabank.info/bpworld2013.pdf (accessed on 27 September 2025).
- BP Statistical Review of World Energy 2019. 2019. Available online: https://www.bp.com/content/dam/bp/country-sites/zh_cn/china/home/reports/statistical-review-of-world-energy/2019/2019srbook.pdf (accessed on 27 September 2025).
- Hu, A.; Zhou, S. Preliminary Assessment of China’s Economic and Social Development During the 14th Five-Year Plan Period. 2025. Available online: http://kns.cnki.net/kcms/detail/11.4558.G.20250126.1940.014.html (accessed on 27 September 2025).
- Izquierdo, M.; Venegas, M.; Marcos, J.D.; Rodríguez, P. Life Cycle and Optimum Thickness of Thermal Insulator for Housing in Madrid. In Proceedings of the 2005 World Sustainable Building Conference, Tokyo, Japan, 27–29 September 2005; pp. 418–425. [Google Scholar]
- Bojic, M.; Yik, F.; Leung, W. Thermal Insulation of Cooled Spaces in High-Rise Residential Buildings in Hong Kong. Energy Convers. Manag. 2002, 43, 165–183. [Google Scholar] [CrossRef]
- Nussbaumer, T.; Wakili, K.G.; Tanner, C. Experimental and Numerical Investigation of the Thermal Performance of a Protected Vacuum-Insulation System Applied to a Concrete Wall. Appl. Energy 2006, 83, 841–855. [Google Scholar] [CrossRef]
- Zhangabay, N.; Tursunkululy, T.; Ibraimova, U.; Abdikerova, U. Energy-Efficient Adaptive Dynamic Building Facades: A Review of Their Energy Efficiency and Operating Loads. Appl. Sci. 2024, 14, 10979. [Google Scholar] [CrossRef]
- Kos, Z.; Babii, I.; Grynyova, I.; Nikiforov, O. Ensuring the Energy Efficiency of Buildings through the Simulation of Structural, Organizational, and Technological Solutions for Facade Insulation. Appl. Sci. 2024, 14, 801. [Google Scholar] [CrossRef]
- Deshmukh, M.; Yadav, M. Optimizing Thermal Efficiency of Building Envelopes with Sustainable Composite Materials. Buildings 2025, 15, 230. [Google Scholar] [CrossRef]
- Lahoud, C.; Chahwan, A.; Rishmany, J.; Yehia, C.; Daaboul, M. Enhancing Energy Efficiency in Mediterranean Coastal Buildings Through PCM Integration. Buildings 2024, 14, 4023. [Google Scholar] [CrossRef]
- Xiong, J.; Wu, J.; Cao, J.; Tian, Z.; Yang, Q. Energy-Efficient Architectural Design of a Banquet Hall with Integrated Tunnel Ventilation: Monitoring Performance During the Transitional Season in China. Buildings 2024, 14, 3335. [Google Scholar] [CrossRef]
- Wang, X. Research on Energy Conservation Policies and New Technologies for Foreign Building Construction. Refrig. Air Cond. 2012, 26, 4, 388–389, 394. [Google Scholar]
- Guo, D. Research on the Optimization of Insulation Layer Thickness of Building Envelopes in Energy Conservation Retro-Fitting of Existing Residential Buildings in Cold Regions; China University of Mining and Technology: Xuzhou, China, 2019. [Google Scholar]
- Zhou, H.; Dong, H.; Sun, L.; Feng, C. Research on the Optimization of Thermal Performance of Building Envelopes in Residential Buildings. Build. Sci. 2015, 31, 105–111. [Google Scholar]
- Li, F.; Zhang, W.; Wang, Y.; Wu, J. Analysis of Energy Conservation Retrofitting and Application of Prefabricated Buildings in Rural Areas of Hot Summer and Warm Winter Regions. Build. Struct. 2021, 51, 1059–1065. [Google Scholar]
- Yan, D.; Xie, X.; Song, F.; Jiang, Y. Introduction to Building Simulation Technology and the Development of DeST—The First Lecture of Building Environment Design Simulation Analysis Software DeST. HVAC 2004, 34, 48–56. [Google Scholar]
- Hu, S.; Kong, G.; Yang, Q. Uncertainty Method and Sensitivity Analysis for Assessment of Energy Consumption of Underground Metro Station. Sustain. Cities Soc. 2023, 92, 104504. [Google Scholar] [CrossRef]
- GB 50176-2016; Chinese Standard for Design of Heating Ventilation and Air Conditioning of Civil Buildings. Ministry of Housing and Urban-Rural Development of the People’s Republic of China: Beijing, China, 2016.
- Van, H.J. Forty years of Fanger’s model of thermal comfort: Comfort for all? Indoor Air 2008, 18, 182–201. [Google Scholar] [CrossRef] [PubMed]
- GB/T 50785-2012; Evaluation Standard for Indoor Thermal Environment in Civil Buildings. China Academy of Building Research: Beijing, China, 2012.
- JGJ/T 440-2018; Technical Standard for Residential Outdoor Air System. MOHURD: Beijing, China, 2018.
- GB/T 51366-2019; Standard for Building Carbon Emission Calculation. Ministry of Housing and Urban-Rural Development of the People’s Republic of China: Beijing, China, 2019.
- GB/T 23483-2009; Test Standard for Overall Heat Transfer Coefficient of Building Envelope and Heat Supply for Space Heating. Standardization Administration of the People’s Republic of China: Beijing, China, 2009.
Disclaimer/Publisher’s Note: The statements, opinions and data contained in all publications are solely those of the individual author(s) and contributor(s) and not of MDPI and/or the editor(s). MDPI and/or the editor(s) disclaim responsibility for any injury to people or property resulting from any ideas, methods, instructions or products referred to in the content. |
© 2025 by the authors. Licensee MDPI, Basel, Switzerland. This article is an open access article distributed under the terms and conditions of the Creative Commons Attribution (CC BY) license (https://creativecommons.org/licenses/by/4.0/).