Abstract
The presence of adjacent tall buildings significantly affects the mechanical response of water-rich strata during metro station excavations. This study focuses on the deep construction pit excavation project of the Houhu Fourth Road Metro Station on Wuhan Metro Line 12. The deformation of the retaining structure and the surface settlement behind the wall obtained from field monitoring data are analyzed. Finite difference numerical simulations are conducted to investigate the responses of water-bearing strata adjacent to tall buildings during the excavation process of the construction pit. The numerical simulation results show that during the excavation process, the maximum deformation of the diaphragm wall is approximately 25.1 mm. It occurs at the position where the wall is buried 28 m deep. The maximum value of ground settlement is approximately 11.9 mm. Furthermore, an empirical formula for predicting the ground settlement under the influence of adjacent buildings and construction pit excavation—applicable to water-bearing sandy strata with conditions similar to those of the Houhu Fourth Road Metro Station—is proposed. The results, derived from the Houhu Fourth Road Metro Station case, demonstrate that the ground surface settlement profile in its water-bearing sandy stratum is significantly altered due to groundwater seepage and the additional loads from nearby buildings. The settlement predicted by the empirical formula shows good agreement with both measured and simulated data: the correlation coefficient (R2) between the predicted values and measured data is above 0.92.
1. Introduction
Urban transportation networks serve as a critical foundation for modern urban development. They play an essential role in facilitating the efficient transportation of people, goods, and information. As urbanization progresses rapidly, traditional surface transportation systems are no longer sufficient to meet the growing travel demand. Urban transportation is undergoing a profound transformation—from above ground to underground development [1,2]. Recent studies have highlighted innovation trends in underground works, including BIM integration and construction optimization, which enhance project safety and efficiency [3].
During construction pit excavation, the original stress equilibrium within the soil mass is disrupted, leading to stress redistribution in the surrounding soil. The redistributed stress induces the soil strata outside the excavation area to deform, thereby posing safety risks to the surrounding environment [4]. Moreover, due to the inherently low bearing capacity and high permeability of sandy soils, deep excavations in such strata are highly susceptible to uneven settlement and lateral displacement. Their high permeability also enables rapid groundwater migration, and the presence of a water-rich environment further amplifies this characteristic. The continuous recharge of groundwater, coupled with the inherent permeability of sandy soils, can significantly alter the physical and mechanical properties of the soil under seepage conditions. This is especially critical under conditions of high seepage pressure and low soil cohesion, where seepage-induced failures, such as piping and sand boiling, are more likely to occur [5,6,7]. Nikolinakou et al. [8] reported that, for an anchored excavation in Berlin sand under high groundwater conditions, the prediction of excavation performance was primarily governed by the initial earth pressure and the in situ void ratio. Russo et al. [9] investigated the deformation characteristics of a top-down excavation in Naples, Italy, under highly permeable sandy soil conditions, and proposed a fitted settlement prediction function based on field measurements. Holtz [10] studied the settlement of shallow foundations and compared it with cases involving adjacent excavations, highlighting the mutual influence between shallow foundations and nearby excavations.
At present, research on deep excavations in water-bearing sandy strata remains limited. In water-bearing sandy areas, surface settlement induced by deep construction pit excavation is particularly prominent, with deformation characteristics influenced by multiple factors such as stratum structure, groundwater level, and construction conditions. To enhance the safety and economic efficiency of such projects, an in-depth investigation into the deformation patterns of surface settlement is urgently necessary. This, in turn, reduces construction risks and improves the overall controllability and stability of the project. For example, Long [11] and Moormann [12] analyzed large databases to identify the relationship between maximum settlement, excavation face distance, and excavation depth by studying surface displacement trends. Their research compared the applicability of various classical settlement prediction methods, including Peck’s empirical formula [13], Limano’s elastic theoretical solution [14], and Mair’s volume loss method [15]. Hu Changming et al. [16] focused on the highly permeable and low-stability water-bearing sandy strata to improve the traditional Peck empirical formula by integrating extensive field measurements and applied linear regression analysis to the settlement distribution during construction pit construction. Their study introduced correction factors for the maximum surface settlement and the width of the settlement trough, enhancing the applicability and prediction accuracy of Peck’s formula under such complex geological conditions. Systematic analysis based on monitoring data and numerical simulations of settlement behavior caused by excavation not only reveals the development trends and influencing factors of settlement but also provides theoretical guidance and practical experience for construction pit design and construction in similar geological environments.
In recent years, with advances in computational capacity and geotechnical engineering theory, an increasing number of researchers have utilized numerical simulation techniques for in-depth analysis of deep construction pit projects. By employing finite element, finite difference, and other numerical methods, researchers can more accurately predict ground settlement, construction pit deformation, and the stress states of supporting structures. For instance, Blackburn et al. [17] analyzed soil–structure interaction during deep excavation using finite element-based numerical simulation software. Wang et al. [18] developed a three-dimensional numerical model for four different retaining structure deformation modes and simulated surface settlement behind the construction pit walls using the Mohr–Coulomb constitutive model. Their study systematically analyzed the influence of different retaining structures on soil settlement behind the walls during deformation and ultimately established the correlation curves between various retaining structure deformation patterns and the corresponding ground settlement. Xie [19] used ANSYS 7.0 finite element analysis to simulate the impact of pile foundations and basement structures of adjacent buildings on excavation, and concluded that pile foundations can transfer loads and thereby reduce the additional loads within the excavation zone. Hesami et al. [20] employed two-dimensional finite element numerical simulation to investigate the distribution characteristics of surface settlement induced by the New Austrian Tunneling Method (NATM) during the construction of Line 2 of the Karaj Metro in shallow gravelly sand strata. Compared to traditional analytical methods, numerical simulations can more realistically reflect the soil–structure interaction processes under complex geological conditions and simulate stress variations and deformation responses at different construction stages and working conditions.
Currently, considerable progress has been made in predicting ground surface settlement during construction pit construction. However, settlement prediction for surfaces adjacent to buildings in complex geological regions remains insufficient. Particularly in water-rich sandy strata, traditional empirical formulas or simplified models struggle to accurately capture the settlement development patterns near adjacent structures. Therefore, there is an urgent need for further in-depth research on high-precision ground settlement prediction methods that integrate multiple coupled factors—particularly methods that systematically combine on-site monitoring, numerical simulation, and empirical modeling for comprehensive development. Such an integrated approach is critical to addressing the current limitations in accurately capturing settlement patterns near adjacent structures in water-bearing sandy strata, as traditional empirical formulas or simplified numerical models alone fail to fully account for the synergistic effects of groundwater seepage, stratum permeability, and additional loads from nearby tall buildings. This study thus fills this gap by establishing a multi-method fusion framework, which not only enhances prediction accuracy but also provides a more reliable technical basis for engineering safety control in complex geological and environmental contexts.
In this paper based on the deep excavation project of the Houhu Fourth Road Metro Station on Wuhan Metro Line 12, under typical water-bearing sandy geological conditions, field monitoring data throughout the construction process were systematically analyzed, with a focus on the response relationship between retaining structure deformation and ground surface settlement. Key factors such as excavation depth, construction conditions, and groundwater level variations were incorporated into comparative numerical simulations to further validate the model’s reliability and applicability. Finally, an empirical formula for predicting ground surface settlement tailored to the water-bearing sandy strata of the study area was developed, providing a theoretical support and practical reference for deep construction pit design and settlement control in similar geological environments. The research flow chart of this paper is shown in Figure 1.
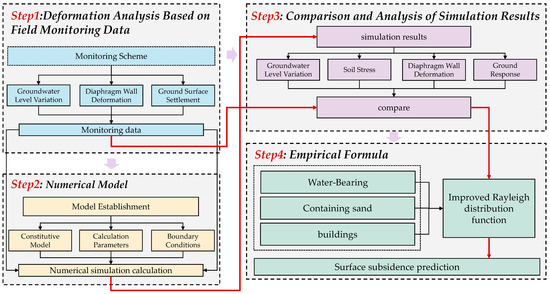
Figure 1.
Flowchart.
2. Project Overview
2.1. Metro Station Overview
Houhu Fourth Road Metro Station is the fifth station of Stage II of Wuhan Metro Line 12. Its location is shown in Figure 2. It is located on the intersection of Houhu Third Road, Houhu Fourth Road, and Xingye Road in Jiang’an District, Wuhan, and oriented east–west along Xingye Road. The station’s main structure is an underground three-floor island platform, whose length is 140 m and width is 14 m. The station’s external auxiliary structures include four entrances/exits, two groups of ventilation shafts, and four emergency exits. The length of the construction pit is approximately 320 m, with a standard section width of about 23.5 m and a depth of approximately 26.2 m. The width and depth of the end section of the construction pit is about 27.4 m and 28.7 m.
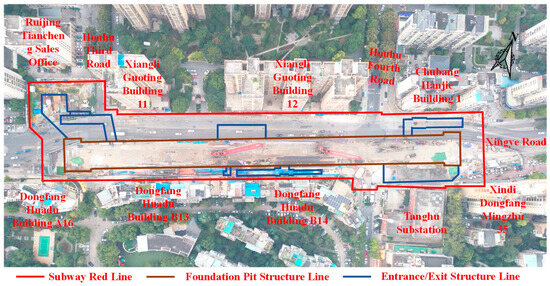
Figure 2.
Location of Houhu Fourth Road Station.
The deep construction pit of Houhu Fourth Road Metro Station is constructed using the open-cut sequential excavation method. The soil is excavated stepwise and supports are installed down to the base before building the internal structure. The primary retaining structure consists of a 1200 mm thick diaphragm wall, with an embedded depth of approximately 43 to 50 m. This is supplemented by soil stabilization treatments, including triaxial mixing piles for reinforcing the excavation walls, MJS piles for water cutoff, and layered installation of water-stop steel plates to enhance waterproofing. The support system comprises six layers of internal struts. The first, third, and fourth are concrete struts, while the second, fifth, and sixth are steel struts. The first concrete strut section is an 800 × 1000 mm rectangle; the third and fourth concrete strut sections are 1000 × 1000 mm rectangles. The steel struts have a cross-section of a circular ring whose radius is φ800 mm and thickness is 16 mm. The first support is located at 0.5 m below the ground surface, while the second, third, fourth, fifth, and sixth supports are installed at depths of 6.7 m, 11.7 m, 16.2 m, 20.7 m, and 25.2 m, respectively. Additionally, vertical columns are installed to work together with the diaphragm walls and internal supports. The upper parts of the columns are steel components, while the lower parts of the columns are reinforced concrete bored piles constructed with underwater C30 concrete, with a diameter of 1200 mm and a length of 14 m. The cross-sectional schematic diagram of the construction pit is shown in Figure 3. Deep well drainage inside the pit is employed to control the groundwater level for the construction pit. Twenty days prior to excavation, pre-dewatering and drainage were performed at the pit bottom using internal well points to reinforce the soil within the pit. The construction pit is excavated in seven stages. The construction pit is excavated in seven sequential stages, with each stage coordinated with the installation of corresponding internal supports to ensure construction safety. The detailed parameters of each excavation stage—including excavation depth, matched support type, and key objectives—are systematically summarized in Table 1, with excavation depths ranging from 1.0 m (Stage 1) to 27.5 m (Stage 7).
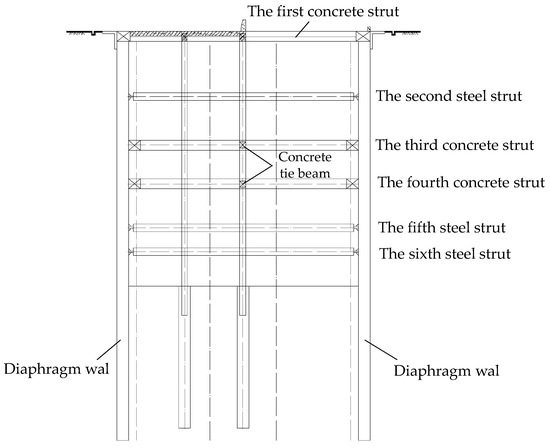
Figure 3.
Schematic diagram of foundation pit section.

Table 1.
Details of seven excavation stages.
2.2. Geological and Hydrogeological Conditions
Based on the geological survey [21], the construction site is stratigraphically divided into nine layers from top to bottom. They are as follows: (1-1) miscellaneous fill soil, with a thickness of 0.80 to 4.60 m; (3-1) clay, with an exposed thickness of 2.30 to 4.60 m in boreholes; (3-4) silty clay, with exposed thickness ranging from 4.00 to 11.30 m; (3-5) interbedded silty clay, silt, and silty sand, with borehole exposure of 7.80 to 23.30 m; (4-1) silt, 1.90 to 5.80 m thick; (4-2) fine silty sand, with exposed thickness between 1.60 and 11.70 m; (5) gravelly mixed cobbles, with a thickness of 1.70 to 18.10 m; (15a-1) strongly weathered silty mudstone, with an exposed thickness of 0.50 to 12.20 m; and (15a-2) moderately weathered silty mudstone, with thickness varying from 2.80 to 18.10 m. The sandy stratum is the most critical factor affecting the stability of the construction pit and the settlement of adjacent buildings. This type of stratum has a relatively large permeability coefficient, which provides a favorable channel for groundwater seepage. The strong seepage effect not only weakens the structural strength between sand particles and reduces effective stress and cohesion but also causes significant soil displacement under the influence of excavation. This chain reaction of ‘seepage weakening—soil movement’ will directly lead to the aggravation of ground surface settlement and the subsidence of adjacent buildings.
The groundwater within the site mainly comprises three types: Quaternary upper perched water, confined pore water, and fractured water in clastic rocks. The Quaternary upper perched water predominantly exists in the (1-1) miscellaneous fill soil and (1-2) plain fill soil layers, mainly recharged by surface water and atmospheric precipitation. Due to heterogeneities in aquifer material composition, density, permeability, and thickness, water quantities and water levels are discontinuous. Thus, no unified free water surface exists. The water table depth ranges from 1.40 to 2.60 m, corresponding to elevations between 17.87 and 19.75 m. The Quaternary confined pore water constitutes the principal groundwater in this region, mainly hosted in Quaternary alluvial sand and alluvial gravel soil. The upper part of this aquifer is composed of weakly permeable cohesive soil. The aquifer roof is composed of silt, fine silty sand, and gravelly mixed cobbles, buried at depths between 23.50 and 35.80 m, and an aquifer thickness generally ranging from 6.30 to 31.90 m. The aquifer base consists of Cretaceous–Lower Tertiary Donghu Group sand–gravel rock and silty mudstone, buried at depths between 39.50 and 55.90 m. The groundwater level in this aquifer is located at depths of 4.00 to 4.70 m, with corresponding elevations of 15.06 to 16.70 m. Fractured water in clastic rocks mainly occurs within the Cretaceous–Lower Tertiary Donghu Group sand–gravel rock and silty mudstone, primarily recharged by infiltration from the overlying confined pore water aquifer. The top of this aquifer corresponds to the bedrock surface. The level of the groundwater table significantly affects the risk of water gushing and sand boiling in the construction pit. An excessively high groundwater table not only necessitates long-term dewatering and drainage operations, which hinder construction progress, but also generates substantial excess pore water pressure during excavation. As dewatering and drainage work proceeds in the construction pit, the dissipation of this excess pore water pressure will lead to increased deformation of the support structure, thereby exerting an adverse impact on the stability of the construction pit.
2.3. Status of Adjacent Buildings
The main layout of Houhu Fourth Road Station on Wuhan Metro Line 12 is situated on the east side of the intersection of Xingye Road and Houhu Third Road, extending east–west along Xingye Road. Xingye Road is planned as an urban arterial road with a right-of-way width of 40 m. Houhu Third Road is a planned road with a width of 15 m and experiences considerable pedestrian and vehicular traffic. According to field surveys, the buildings around the construction pit are listed in Table 2. The surrounding environments of the proposed deep construction pit project are summarized as follows:
Table 2.
Summaries of buildings around the construction pit.
- (1)
- At the northwest corner of the station construction pit, there lies Building 1 and the sales office of the Ruijing Tiancheng residential community. Building 1 is a 33-story frame-shear wall residential building located approximately 45.6 m from the main construction pit. The sales office is a 13-story frame-shear wall office building situated about 53.2 m from the main pit. To the north of the construction pit, there are Buildings 11 and 12 of Xiangli Guoting, along with 2-story street-facing commercial shops. Building 11 is a 24-story frame-shear wall residential building approximately 22.1 m from the main pit. Building 12 is a 21-story similar structure about 18.3 m away. At the northeast corner of the pit, there is Building 1 of Chubang Hanjie, a 12-story frame-shear wall residential building located roughly 14.2 m from the main construction pit.
- (2)
- At the southeast corner, there is Building 35 of Xindi Dongfang Mingzhu, a 16-story frame-shear wall residential building approximately 18.4 m from the main pit. To the south of the deep construction pit, there are Buildings B13 and B14 of Dongfang Huadu, 2-story street-facing commercial shops, and the Tanghu Substation. Buildings B13 and B14 are both 12-story frame-shear wall residential buildings, located about 10.6 m and 10.3 m from the main pit, respectively. The Wuhan Power Supply Bureau’s Tanghu 110 kV substation is a 3-story structure about 24.4 m from the construction pit. At the southwest corner of the station pit, there is Building A16 of Dongfang Huadu, a 12-story frame-shear wall residential building approximately 8.2 m from the main pit.
3. Deformation Analysis
3.1. Monitoring Scheme
The construction pit at this station is elongated, with considerable length and excavation depth. To ensure the scientific validity and effectiveness of the monitoring work, the layout of monitoring points follows principles of standardization, rigor, and orderliness. In particular, monitoring density and frequency have been increased at key areas, such as pit corners, retaining structure connections, and areas with complex geological conditions or significant deformation. Based on relevant technical standards and station design requirements, a reasonable monitoring scheme was developed. The detailed arrangement of monitoring points is shown in Figure 4. Ground subsidence, building settlement and tile, horizontal and vertical displacements of retaining wall, groundwater level, and the axial force of the supporting system are measured. This monitoring scheme has certain limitations due to some practical conditions. The monitoring points mainly focus on structural types and do not cover scenarios with high variability in load height, such as 1–3-story low-load street-front shops or high-load commercial complex areas with heavy equipment. The number of monitoring points and monitoring frequency are limited by site space and personnel allocation, making it impossible to achieve more intensive point layout and higher-frequency monitoring. During the monitoring period, it is greatly affected by local weather factors, leading to certain fluctuations and errors in the monitoring data. Therefore, the monitoring data have a certain reference value in terms of the overall trend, and only appropriate references are made in specific numerical values.
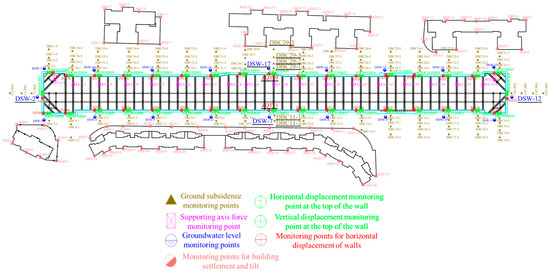
Figure 4.
Monitoring point layout.
The data selected for analysis in this paper mainly include groundwater level, diaphragm wall deformation, and ground settlement. For groundwater level monitoring, monitoring points are arranged by drilling and pipe installation. The monitoring frequency is once a day during the excavation period and once every 7 days during the main structure construction period. For diaphragm wall deformation monitoring, the inclinometer tube is installed in the diaphragm wall reinforcement cage by binding, along through the reinforcement of the diaphragm wall, and poured together with the diaphragm wall. Subsequently, as the construction pit excavation and wall top breaking proceed, the inclinometer tube is connected and flushed. The monitoring frequency is twice a day during the excavation period and once a day during the main structure construction period. For ground settlement monitoring, monitoring holes are arranged on the ground around the construction pit at a distance of 1~2 times the excavation depth. A level is used for forward and backward observations in the form of a closed leveling route. The monitoring frequency is twice a day during the excavation period and once every 2 days during the main structure construction period.
3.2. Measured Groundwater Level Variation
Representative monitoring points DSW-2, DSW-7, DSW-12, and DSW-17, located at the east and west ends as well as the north and south standard sections of the construction pit, were selected for data analysis. Monitoring data from these four points were filtered, summarized, and plotted to produce the groundwater level variation curve shown in Figure 5. As illustrated, the groundwater level outside the construction pit exhibits an overall fluctuating downward trend, with a relatively gradual decline. During the early stages of construction, water level fluctuations were relatively large but gradually diminished and stabilized over time. The monitoring points at the pit ends stabilized approximately 1.1 m below the initial water level, while those at the standard sections remained near 1.3 m below the initial level. This indicates effective waterproofing by the diaphragm wall, with groundwater levels maintained within controlled limits, thereby contributing to the stability of the construction pit and construction safety.
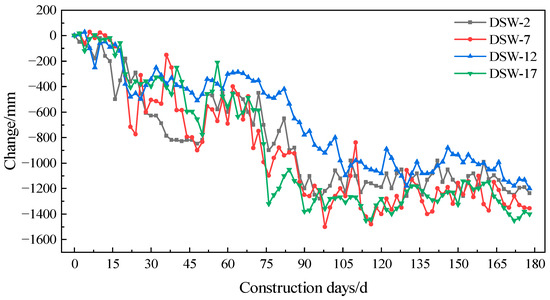
Figure 5.
Variation in groundwater level versus time.
3.3. Measured Diaphragm Wall Deformation
The selected monitoring points for analyzing the diaphragm wall horizontal displacement data are representative points ZQT11 and ZQT29, located on the north and south sides of the construction pit’s standard section. Data from these two points were organized and correlated with the construction stages to generate the diaphragm wall horizontal displacement curves shown in Figure 6. The maximum displacement of the wall during each construction stage is shown in Table 3. As illustrated, the horizontal displacement of the diaphragm walls on both sides of the construction pit exhibits a roughly concave “bow-shaped” curve inward to the pit as depth increases.
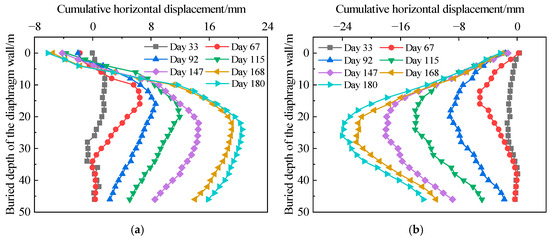
Figure 6.
Wall horizontal displacement at different construction stages. (a) ZQT11 monitoring point on the south side; (b) zqt29 monitoring point on the north side.
Table 3.
Maximum horizontal displacement of diaphragm wall.
Figure 6a shows that at each construction stage, the top of the south diaphragm wall exhibits varying degrees of negative horizontal displacement. This is primarily due to soil disturbance, the influence of adjacent buildings, and temporary surcharge, which increase the effective stress within the pit soil, causing a certain degree of consolidation. Consequently, the passive earth pressure on the inside of the pit increases, exerting compressive forces on the retaining wall and resulting in lateral displacement of the wall toward the outside of the pit. On day 33 of construction, after the installation of the first internal strut and completion of soil excavation, the horizontal displacement of the south wall was relatively small, with a maximum value of only 1.91 mm, mostly occurring in the upper half of the wall. As excavation progressed, the maximum horizontal displacement of the wall increased continuously, with the location of maximum displacement gradually shifting downward. On day 67, following the installation of the second strut and completion of excavation, the maximum horizontal displacement appeared at a depth of 14 m, reaching approximately 6.49 mm. By day 92, the maximum displacement increased to 8.66 mm at a depth of 16 m. On day 115, the displacement further increased to 11.94 mm, with the maximum located at 20 m depth. By day 147, the maximum displacement had shifted to approximately 24 m below the wall top, reaching about 14.49 mm. On days 168 and 180, corresponding, respectively, to the completion of the sixth internal strut installation and soil excavation and to the seventh excavation cycle, the horizontal displacement in the upper half of the wall remained essentially unchanged. The location with maximum displacement moved to a deep place, occurring at 24 m and 25 m below the wall top, with values of 19.13 mm and 20.51 mm, respectively.
Figure 6b indicates that although the horizontal displacement values at monitoring point ZQT29 differ from those at ZQT11, the overall deformation patterns and trends remain largely consistent. The main difference is that the top of the north diaphragm wall consistently exhibits displacement inwards to the construction pit. From day 33 to day 180 of construction, the maximum horizontal displacements at ZQT29 were 1.34 mm, 5.11 mm, 9.20 mm, 13.99 mm, 18.04 mm, and 22.03 mm, occurring at depths of 22 m, 16 m, 20 m, 24 m, 26 m, and 28 m below the surface, respectively. When excavation reached the pit bottom, the increment in wall horizontal displacement was minor, with a maximum value of approximately 24.05 mm at 27 m below the wall top.
3.4. Measured Ground Surface Settlement
For the analysis of ground surface settlement monitoring data, representative points DBC11-1, DBC11-2 on the south side, and DBC29-1, DBC29-2, DBC29-3, and DBC29-4 on the north side of the construction pit standard section were selected as data sources. The data from these monitoring points were plotted to generate the cumulative vertical displacement variation curve of the ground surface, as shown in Figure 7. The core vertical displacement characteristics of ground surface monitoring points on the south and north sides are concisely organized in Table 4.
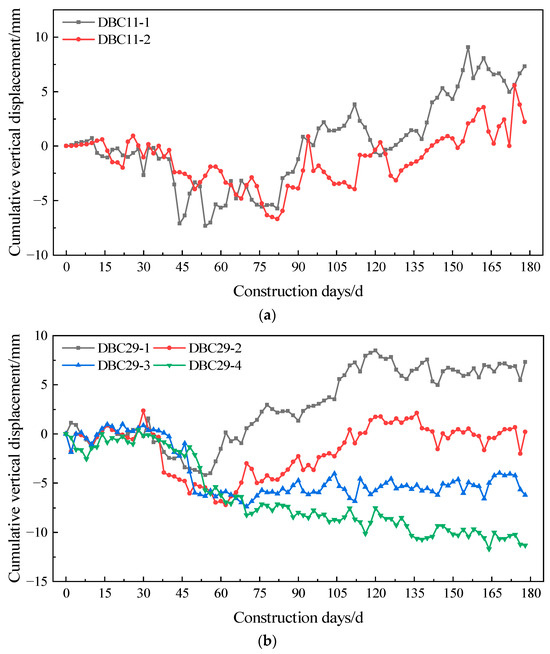
Figure 7.
Surface vertical displacement over time. (a) DBC11 monitoring point on the south side; (b) DBC29 monitoring point on the north side.
Table 4.
Ground settlement values at each construction stage.
As shown in Figure 7, the two monitoring points on the south side of the construction pit exhibit fluctuating curves characterized by initial settlement followed by heave, with maximum settlement values of 7.32 mm and 6.70 mm, respectively. During the excavation process, the surrounding ground surface soil generally showed an upward trend, though slight settlement occurred in the early excavation stage. This is primarily attributed to the insufficient soil consolidation initially. The rebound caused by excavation was insufficient to offset the consolidation-induced settlement, resulting in temporary soil subsidence. After 77 days of construction, influenced by the uplift of the diaphragm wall, the vertical displacement of the ground surface gradually developed into heave. The heave rate initially increased and then decreased, with monitoring points closer to the construction pit exhibiting larger heave values, which were controlled within 10 mm. Observing the vertical displacement curves at the northern pit monitoring points in Figure 7b, points DBC29-1 and DBC29-2, located closer to the diaphragm wall, also show settlement followed by heave. In contrast, points DBC29-3 and DBC29-4, situated farther from the diaphragm wall, experienced weaker heave effects and their settlement values gradually increased with excavation, eventually stabilizing at approximately −7 mm and −12 mm, respectively.
4. Numerical Model
4.1. Model Establishment
FLAC3D is used to perform the numerical simulation. The influence zone of the excavation is roughly four to five times the excavation depth. Considering the effects of adjacent buildings, the model dimensions were appropriately enlarged. The final model set the excavation direction as the z-axis, the long side of the construction pit as the x-axis, and the short side as the y-axis. Taking the center of the model bottom face as the origin, the model dimensions are 500 m in the x-direction, 250 m in the y-direction, and 80 m in the z-direction. The entire model is divided into nine soil layers from surface to bottom as follows: (1-1) miscellaneous fill, (3-1) clay, (3-4) silty clay, (3-5) interlayers of silty clay, silt, and fine sand, (4-1) silt, (4-2) fine sand, (5) gravelly cobbles, (15a-1) strongly weathered silty mudstone, and (15a-2) moderately weathered silty mudstone.
Due to the presence of numerous buildings, most of which are high-rise structures, the modeling and computational process is complex and time-consuming. To improve computational efficiency, the superstructures of the buildings were simplified, retaining only their foundations. The foundations were modeled as pile-raft foundation systems, combining raft slabs and piles. The superstructure loads were converted equivalently into uniformly distributed vertical loads applied on the top surface of the raft foundations. The equivalent load is calculated as 15 kPa per floor. The completed numerical model is illustrated in Figure 8. The numerical model sectional view of the construction pit after excavation completion is shown in Figure 9.
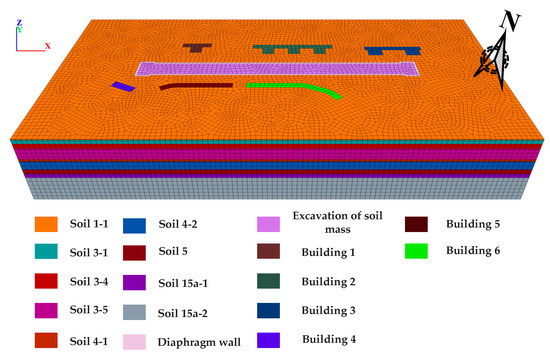
Figure 8.
Numerical model diagram.
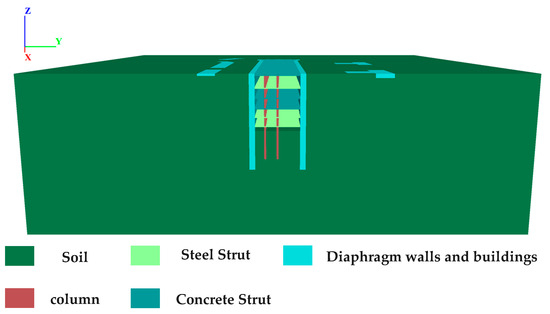
Figure 9.
Sectional view of the construction pit after excavation completion.
4.2. Constitutive Model and Calculation Parameters
The soil was modeled using the plastic hardening (PH) constitutive model. It is an elastoplastic model supporting both shear and volumetric hardening, specifically developed for simulating soil mechanical behavior and widely applied in geotechnical engineering fields such as excavation and soil–structure interaction analysis. The PH model integrates a hyperbolic stress–strain relationship, Mohr–Coulomb failure criterion, and stress-dependent elastic stiffness, enabling accurate reproduction of soil deformation characteristics under unloading–reloading cycles and complex stress paths [22]. The soil layer parameters, based on the geological survey report, are listed in Table 5 [21].
Table 5.
Soil parameters in numerical model [21].
In addition to the soil, other parameters for the diaphragm wall, internal supports, columns, and building pile-raft foundations are set. These parameters for other retaining structures and buildings are presented in Table 6.
Table 6.
Calculation parameters of retaining structures and buildings.
To better simulate the impact of groundwater on construction pit construction in saturated areas, seepage parameters were also incorporated to model groundwater flow. During seepage calculations, the size of the time step is inversely proportional to the permeability coefficient of the material. In other words, higher permeability coefficients require smaller time steps, resulting in longer convergence times. Therefore, to accelerate convergence and improve computational efficiency, the differences in permeability coefficients among soil layers were appropriately reduced. The fluid analysis parameters for each soil layer are listed in Table 7.
Table 7.
Seepage parameters for soils.
4.3. Boundary Conditions and Calculation Steps
In terms of mechanical boundary conditions, the normal displacement of the boundaries in the x = 0 and x = 500 m planes and y = 0 and y = 250 m planes is fixed; the bottom boundary of the model, i.e., the z = 0 plane, fixes the displacements in the x, y, and z directions; the top boundary of the model, i.e., the z = 80 plane, is a free boundary condition. For seepage boundary conditions, the top surface was set as a permeable boundary, while the bottom and sides were treated as impermeable boundaries.
The FLAC 7.0 numerical simulation software features excellent capabilities for coupled fluid–solid calculations. On one hand, it can perform standalone seepage analysis, calculating fluid flow without considering mechanical responses. On the other hand, it supports fluid–solid coupling analysis, where soil mechanical behavior and pore water pressures interact during seepage analysis. This study adopts the fluid–solid coupling mode in seepage analysis. In this mode, pore water pressure within the soil causes deformation of the soil skeleton, and soil deformation, in turn, affects the water pressure.
Based on the construction pit support and construction schemes, the simulation considers the staged dewatering, support installation, and excavation of the Houhu Fourth Road Metro Station deep construction pit. The installation of the first concrete strut marks the start of the staged excavation process. The simulation divides the construction into seven stages, with each stage corresponding to the installation of one support strut and excavation of one soil layer. The specific steps are as follows:
- (1)
- Establish the model, considering the initial geo-stress equilibrium among adjacent buildings, diaphragm walls, and columns;
- (2)
- Set groundwater levels and fluid analysis parameters to generate the initial hydrostatic stress field;
- (3)
- Reset displacements caused by initial geo-stress and hydrostatic stress fields as zero while retaining the stress state;
- (4)
- Install the first concrete strut and excavate soil to the bottom of the first strut;
- (5)
- Dewater the pit to the bottom of the second excavation surface, install the second strut, and excavate soil to the bottom of the second strut;
- (6)
- Repeat step (5) until completion of the sixth excavation;
- (7)
- Dewater to the bottom of the seventh excavation surface and excavate soil to the construction pit bottom.
5. Results and Analysis
5.1. Groundwater Levels
As the excavation proceeds with staged dewatering, support installation, and soil removal, the pore water pressures within the soils on both the inside and outside of the foundation pit undergo dynamic changes. The variations in pore water pressure induced by dewatering under different construction conditions can be clearly illustrated in the pore pressure contour plots. The pore water pressure contour maps for each construction stage are shown in Figure 10.
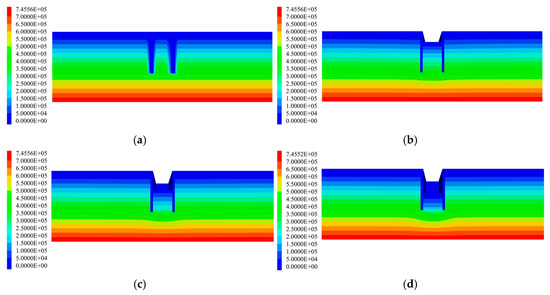
Figure 10.
Pore water pressure contour maps. (a) Before excavation; (b) simulated condition 3; (c) simulated condition 5; (d) simulated condition 7.
From Figure 10, it can be observed that the pore water pressure above the groundwater table is zero, while below the water table it exhibits a gradient distribution. Overall, the pore pressure distribution shows a typical concave-shaped pattern. As dewatering and excavation of the construction pit proceed step by step, the dewatering funnel at the pit bottom becomes increasingly pronounced, accompanied by a significant reduction in pore water pressure. This reduction is particularly rapid when excavation reaches the highly permeable sandy soil layer. In addition, since the diaphragm wall is made of impermeable material, the pore water pressure at the wall location is zero. The cut-off curtain effectively blocks direct groundwater seepage into the pit, forcing the groundwater outside the excavation to bypass the bottom of the diaphragm wall before entering the pit. This makes groundwater seepage into the excavation more difficult, leading to a slight decrease in pore water pressure outside the pit, though the magnitude of this decrease remains relatively small. The pore water pressure distribution law from this paper’s simulation is consistent with that obtained by Fu [6]. In sandy soil layers, the water level drops rapidly. The pore water pressure also dissipates rapidly.
The simulated groundwater levels at monitoring points DSW-7 and DSW-17 were compiled and compared with the measured data, resulting in the groundwater level comparison chart shown in Figure 11. The result demonstrates a good agreement between the numerical simulation results and the field measurements. Both of them exhibit a gradual decline in groundwater levels concurrent with construction pit excavation. A notable rise in measured groundwater levels occurred during Stage 5, primarily due to heavy concentrated rainfall during the construction period. Rainwater infiltrated the subsurface through the ground surface or surrounding strata, causing a temporary increase in groundwater levels, which was particularly evident near the monitoring wells. The simulated groundwater levels were slightly higher than the measured values, with deviations controlled within 1200 mm. The RMSE between the monitoring data and simulation values of the two monitoring points is controlled within 100 mm, indicating that the constructed model efficiently captures the groundwater level variations.
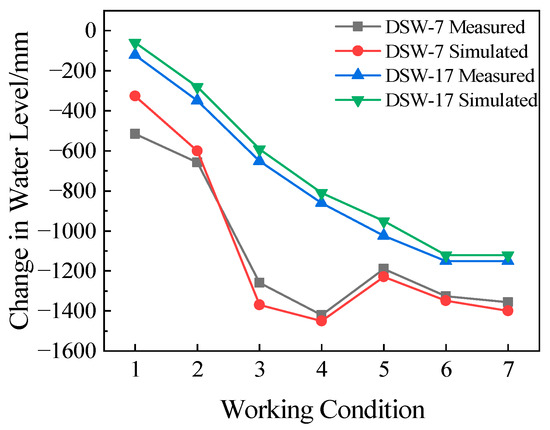
Figure 11.
Groundwater level comparison.
5.2. Soil Stress
Soil stress refers to the stress state generated within the soil under its own weight and external loads. It directly reflects the mechanical response of soil under loading conditions. During the excavation of a deep construction pit, the distribution of soil stress continuously adjusts with the increase in excavation depth. This redistribution affects ground surface settlement and the stability of adjacent buildings. Therefore, the analysis of soil stress is not only helpful for revealing the mechanical mechanisms during excavation but also provides an important reference for construction safety and support structure design. Figure 12 presents the distribution of vertical soil stress under different conditions.
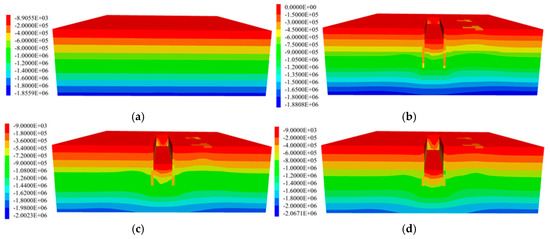
Figure 12.
Vertical soil stress diagram. (a) Soil stress equilibrium; (b) simulated condition 3; (c) simulated condition 5; (d) simulated condition 7.
From Figure 12, it can be seen that the initial stress distribution of the soil increases as the depth grows. As the excavation progresses, the vertical stress at the pit bottom decreases significantly. The main reason is that excavation removes the overlying soil, releasing the stress originally induced by the soil’s self-weight, which manifests as a reduction in stress at the pit bottom. In the area beneath adjacent buildings, especially below the high-rise building on the north side, soil stress shows an increasing trend. This occurs because excavation causes a redistribution of soil stress, and the additional stress induced by the building’s self-weight is transferred and concentrated into the foundation soil. Since the north-side building carries a greater load, the stress is concentrated in this area.
5.3. Diaphragm Wall
The simulated and monitored deformation data of the diaphragm wall were plotted in Figure 13. The figure reveals that as the soil inside the construction pit is progressively excavated and unloaded, the diaphragm wall undergoes lateral deformation due to the loss of internal support and the action of external earth and water pressures. The horizontal displacement along the wall depth exhibits a typical bow-shaped pattern, characterized by maximum displacement at the mid-depth and smaller displacements near the top and bottom. The location of the maximum displacement shifts downward as excavation proceeds. The simulation results indicate that the maximum displacement point moves downward with excavation progress: in Stage 2, the maximum horizontal displacement is approximately 6.3 mm at around 18 m depth; by Stage 7, it reaches about 25.1 mm near 28 m depth. Compared to the previous stage’s maximum displacement, the increases for subsequent stages are approximately 2240.7%, 70.9%, 38.9%, 30.5%, 19.3%, and 7.5%, respectively. The initial excavation depth in Stage 1 is relatively small, resulting in minor diaphragm wall deformation. In Stage 2, with excavation depth reaching 7.2 m, the wall displacement increases sharply, followed by a gradual deceleration in growth rate. Comparative analysis between the simulation and field monitoring data shows that except for Stages 1 and 2, the simulated values closely match the measured values in terms of deformation trends. Both of them exhibit a pronounced bow-shaped deformation pattern. The horizontal displacement increases continuously as the excavation depth grows. The result that “diaphragm wall horizontal displacement follows a ‘bow-shaped’ curve, with maximum displacement shifting downward with excavation depth” is consistent with Wang et al. [18], who simulated similar “bow-shaped” deformation in braced excavations using the Mohr–Coulomb model. Both studies show that as the foundation pit is excavated, the maximum displacement point of the foundation pit retaining wall will gradually move downward and eventually tend to be stable.
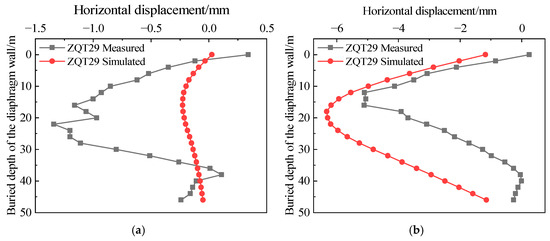
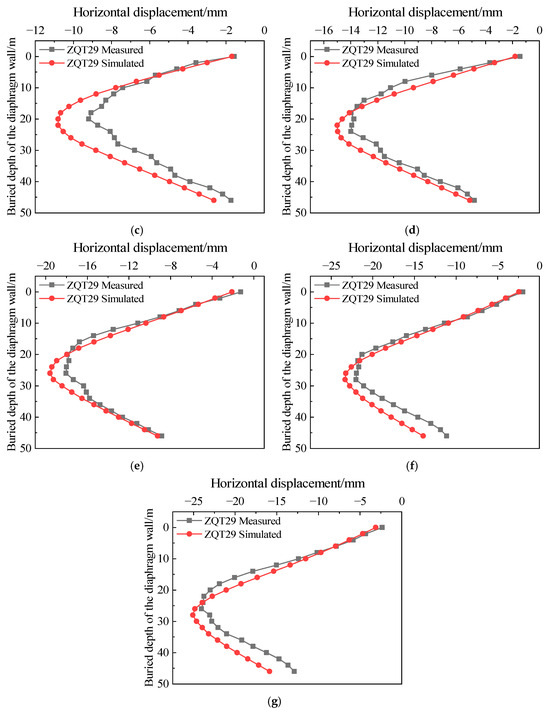
Figure 13.
Diaphragm wall deformation comparison. (a) Simulated condition 1; (b) simulated condition 2; (c) simulated condition 3; (d) simulated condition 4; (e) simulated condition 5; (f) simulated condition 6; (g) simulated condition 7.
The larger deviations in the early stages may be attributed to the idealized treatment of the contact conditions between the diaphragm wall and surrounding soil in the numerical model. The numerical model does not fully account for soil heterogeneity, construction disturbances, temperature variations, and other practical factors. Additionally, monitoring data may have errors due to instrument precision and installation effects when deformation is small. Despite these discrepancies, the overall consistency between simulation results and measured trends validates the reliability of the numerical model established based on FLAC3D.
5.4. Ground Response
Figure 14 shows the simulated contour maps of vertical displacements in the soil strata at different construction stages. From the perspective of the excavation’s impact on surrounding soil layers, in the early stages of pit excavation, the soil experiences a relatively minor influence. As the excavation depth gradually increases, both the lateral extent and vertical strata settlement continue to increase, reaching their maximum when the pit bottom is excavated in Stage 7. In terms of the magnitude of soil deformation around the excavation, soil near the sides of the pit exhibits relatively larger displacements. Generally speaking, the magnitude of soil settlement is positively correlated with the sequence of the excavation stages. The maximum settlement initially increases rapidly to 8.42 mm, and then the rate of increase gradually slows down due to the timely implementation of the pit support structures. In Stage 7, the maximum vertical displacement occurs at a certain distance from the pit edges, reaching approximately 11.90 mm. The ground settlement law obtained from the simulation in this paper is extremely similar to that of the water-rich sandy stratum in Xi’an studied by Hu et al. [16]. Both studies show that the original Peck formula [13] for predicting ground settlement underestimates the influence of sand in the soil layer on seepage and ground settlement. Therefore, it is necessary to reconsider the impacts of seepage and buildings to modify the prediction formula for ground settlement.
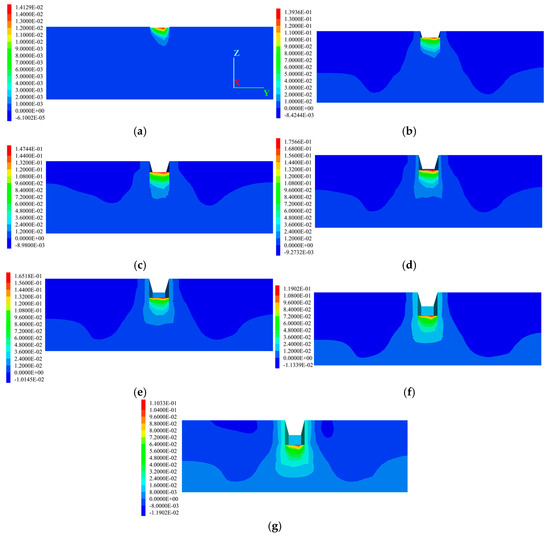
Figure 14.
Contour map of vertical displacement in the soil strata. (a) Simulated condition 1; (b) simulated condition 2; (c) simulated condition 3; (d) simulated condition 4; (e) simulated condition 5; (f) simulated condition 6; (g) simulated condition 7.
The simulated surface settlement values at the midpoint of the construction pit were compared with monitoring data, as shown in Figure 15. The comparison reveals that in Stage 1, due to the shallow excavation depth and the constraint of the first concrete support structure, surface deformation was limited, with settlement controlled within 1 mm. The discrepancy between simulated and measured values is mainly attributed to the very small settlement magnitude, which amplifies errors under monitoring precision limitations. From Stage 2 to 7, the surface settlement curves exhibit a distinct “concave” distribution pattern, characterized by slight heave near the pit edge that gradually transitions to settlement with increasing distance from the pit edge. The maximum settlement is approximately 11.0 mm before stabilizing. Due to the limited number of regional monitoring points, the accuracy evaluation of the simulation results can only be conducted locally. Except for Stage 1, the simulated results align well with the measured values in terms of distribution trends across all other stages, with settlement increasing progressively with excavation depth. The simulation curves tend to be slightly smoother and the predicted settlements marginally lower than the measured data. This is because in the numerical model it is difficult to fully replicate the real conditions of the soil properties and spatial variability, construction disturbances, mechanical loading, and groundwater seepage. Despite these discrepancies, the simulation results exhibit a good agreement with the measured data in terms of trend, inflection characteristics, and settlement magnitude. It shows that the numerical model established herein is highly reliable and applicable for simulating surface settlement deformation. Given the close fit between simulated and measured results within the monitored area, it can be inferred that the model possesses representativeness and predictive capability beyond the instrumented zones. This model thus enables reasonable prediction of surface settlement trends in areas that are far from the pit edge.
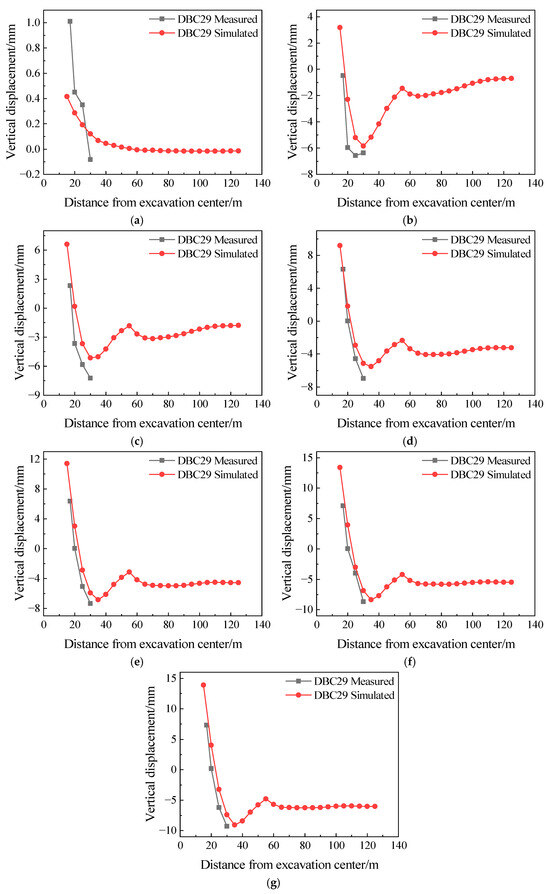
Figure 15.
Surface settlement comparison. (a) Simulated condition 1; (b) simulated condition 2; (c) simulated condition 3; (d) simulated condition 4; (e) simulated condition 5; (f) simulated condition 6; (g) simulated condition 7.
6. Empirical Formulation
During construction pit excavation adjacent to buildings in water-bearing sandy soil, surface settlement typically exhibits distinct nonlinear and staged characteristics. In the initial construction phase, settlement rapidly increases due to stress release. Subsequently, as the supporting structure progressively installs, the settlement process shows a degree of rebound or stabilization, resulting in localized variations. Finally, with continued construction advancing towards a stable stage, surface settlement tends to gradually flatten and stabilize. Studies have found that the maximum deformation of the retaining structure induced by excavation, denoted as δhm, is proportional to the excavation depth, as expressed in Equation (1). Furthermore, the maximum surface settlement outside the pit, δvm, correlates with the maximum retaining structure deformation δhm, as shown in Equation (2). Existing research indicates that the surface settlement curve beyond the construction pit usually presents a concave-shaped distribution, which can be reasonably approximated by the Rayleigh distribution function. However, most current empirical models based on the Rayleigh distribution primarily consider the influence of retaining structure deformation, without adequately accounting for the interaction effects between adjacent buildings and the construction pit. Under site conditions with nearby buildings, such models struggle to accurately reflect the disturbance effects of buildings on surface deformation patterns, limiting their applicability in practical engineering. Therefore, this study reconstructs a multivariate-driven surface settlement model outside the construction pit by integrating the effects of soil strata, retaining structure deformation, and adjacent building influence into a unified deformation framework based on the Rayleigh distribution function. This approach enables the estimation of surface settlement distribution for construction pits in water-bearing sandy soils with adjacent buildings, providing a simpler and more reliable predictive method. The maximum deformation of the retaining structure is calculated by
In the formula, δhm represents the maximum deformation of the retaining structure (in m); kδ is a dimensionless proportionality coefficient; H denotes the excavation depth of the construction pit (in m). The maximum surface settlement outside the construction pit is calculated by
In the formula, δvm represents the maximum surface settlement outside the construction pit (in m); α is an empirical, dimensionless coefficient; δhm denotes the maximum deformation of the retaining structure (in m). The empirical formula is
In the formula, d denotes the distance from the calculation point to the edge of the construction pit (in m); H is the excavation depth of the construction pit (in m); δv represents the settlement value at the calculation point (in meters); δvm is the maximum surface settlement value (in m); a, b1, c1, f1, b2, c2, and f2 are fitting coefficients. All of them are dimensionless.
Formula (3) was used to fit the settlement distribution outside the construction pit at four different excavation depths, and the Levenberg–Marquardt method was used for the fitting. The fitting results are shown in Figure 16. The fitting coefficients and goodness-of-fit values are listed in Table 8. As indicated by Table 8, the goodness-of-fit for multiple excavation depths all exceed 0.92. This indicates that the empirical formula effectively characterizes the surface settlement patterns during construction pit construction in the presence of adjacent buildings. It is worth mentioning that in the later stages of excavation, the formula achieves an R2 value greater than 0.96, validating its reliability and applicability.
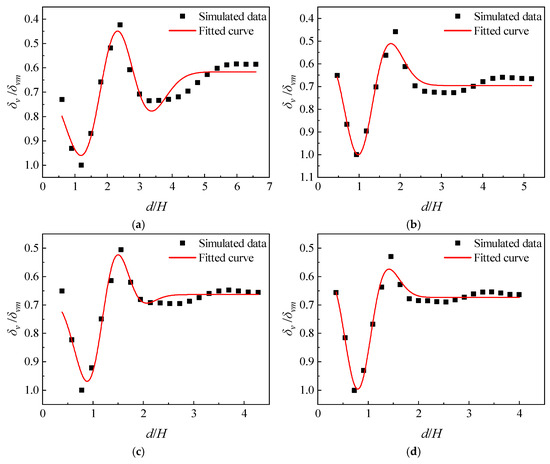
Figure 16.
Fitted curve of surface settlement outside the excavation. (a) Simulated condition 4 with excavation depth of 16.7 m; (b) simulated condition 5 with excavation depth of 21.2 m; (c) simulated condition 6 with excavation depth of 25.7 m; (d) simulated condition 7 with excavation depth of 27.5 m.
Table 8.
Fitting coefficients at different excavation depths.
In summary, the established empirical formula for surface settlement systematically quantifies the combined effects of construction pit construction disturbances, groundwater level changes, and the presence of adjacent buildings on surface settlement in water-bearing sandy soil strata. The model demonstrates good fitting accuracy and predictive capability under typical conditions. By improving the Rayleigh distribution function, this model provides an approximate representation of settlement behavior in complex scenarios, offering significant practical value for engineering applications. Furthermore, based on the numerical simulation results in this study, the parameter kδ (dimensionless parameter) for water-bearing sandy soil areas can be approximately taken as 0.8% to 1.0%, while the value of α (dimensionless parameter) ranges around 0.3 to 0.5. On this basis, combined with the empirical settlement formulas proposed herein, rapid prediction of surface settlement distribution outside the construction pit can be achieved using Equations (1)–(3) solely if the excavation depth in similar geological conditions with adjacent buildings is known. This also allows for a preliminary assessment of building safety. The method is simple and practical, providing strong engineering guidance value in early design stages for construction safety evaluation.
7. Conclusions
This paper comprehensively analyzes the actual monitoring data and numerical simulation results of the construction pit at Houhu Fourth Road Metro Station on Wuhan Metro Line 12. The surface settlement characteristics during construction pit excavation in water-bearing sandy soil strata adjacent to buildings are analyzed. A method for predicting the surface settlement outside the construction pit is proposed. The main conclusions are as follows.
The groundwater level outside the pit shows an overall fluctuating downward trend, with a slow decline. In the initial construction stage, fluctuations are larger, then gradually decrease and stabilize. With progressive dewatering and excavation, the drainage funnel at the pit bottom becomes more pronounced. Pore water pressure drops significantly, especially in the highly permeable sand layer where the decline is rapid. During excavation, the vertical stress of the pit bottom soil decreases sharply—this is due to the removal of overburden load. In contrast, the vertical stress of the soil beneath adjacent buildings increases because of additional loading. The most obvious stress increment appears beneath the north-side high-rise building. The horizontal displacement of the diaphragm walls (both north and south sides of the pit) forms an inward-bending “bow-shaped” curve as depth increases. The vertical displacement of surface points shows different trends by side: on the south side, it follows “initial settlement then heave”—maximum settlement is 7.32 mm and 6.70 mm; slight settlement in the early excavation stage comes from incomplete soil consolidation, and subsequent surface heave (max < 10 mm) is driven by diaphragm wall heave. On the north side, a similar trend is seen: points closer to the pit have greater heave, while farther points show increasing settlement and stabilize at −7 mm to −12 mm. Numerical simulation results of deformation are generally consistent with actual monitoring data. The deformation development patterns also match real conditions well. This proves that the established numerical model is feasible and reliable for simulating deep metro foundation pit excavation in water-bearing sandy strata. The proposed surface settlement prediction method considers three key factors: water-bearing sandy soil geological conditions, groundwater seepage effects, and adjacent building influences. It achieves high prediction accuracy (goodness-of-fit > 0.92), combines high precision with simple computation, and serves as a practical, effective tool for predicting surface settlement around foundation pits.
This article has obtained a relatively complete conclusion on the construction of construction pits in water-rich sand layers. However, due to limitations in time and the author’s research level, the study has certain limitations: the empirical formula and key parameters are derived based on the specific geological conditions of the study area, and their applicability to other water-bearing strata needs further verification; the numerical model simplifies the dynamic and non-uniform characteristics of adjacent building loads, which may lead to minor deviations in soil stress simulation; and field monitoring only covers the excavation period, lacking analysis of long-term settlement under post-construction metro vibration loads. Future work will focus on three aspects: collecting data from multi-geological construction pit projects to optimize the empirical formula with geological correction coefficients, building a refined numerical model integrating dynamic building loads and irregular layouts to improve interaction analysis accuracy, and establishing a long-term post-construction monitoring system to study the long-term mechanical response of water-bearing sandy strata and verify the prediction method’s long-term reliability.
Author Contributions
Conceptualization, W.F. and J.X.; methodology, R.Z.; software, Z.Y. and L.F.; validation, W.F., Z.Y. and Y.Z.; formal analysis, J.X.; investigation, W.F., J.X. and R.Z.; resources, Z.Y. and Y.Z.; data curation, G.Z. and Z.C.; writing—original draft preparation, W.F. and L.F.; writing—review and editing, J.X., R.Z. and Z.C.; visualization, Z.Y.; supervision, G.Z. and Z.C.; project administration, W.F.; funding acquisition, G.Z. All authors have read and agreed to the published version of the manuscript.
Funding
This work is supported by the Group’s Science and Technology Special Plan for the Year 2025: “Unveiling the List and Leading the Way” of WSGRI Engineering & Surveying Co., Ltd. (Grant No. 2025ZXA04).
Data Availability Statement
The original contributions presented in this study are included in the article. Further inquiries can be directed to the corresponding author.
Conflicts of Interest
Authors Wen Feng, Jian Xu and Rui Zhang were employed by the company China Railway 11th Bureau Group City Rail Engineering Co., Ltd. The remaining authors declare that the research was conducted in the absence of any commercial or financial relationships that could be construed as a potential conflict of interest.
References
- Peng, F.-L.; Dong, Y.-H.; Wang, W.-X.; Ma, C.-X. The next frontier: Data-driven urban underground space planning orienting multiple development concepts. Smart Constr. Sustain. Cities 2023, 1, 3. (In Chinese) [Google Scholar] [CrossRef]
- Zhang, M.; Xie, Z.; He, L. Does the scarcity of urban space resources make the quality of underground space planning more sustainable? A case study of 40 urban underground space master plans in China. Front. Environ. Sci. 2022, 10, 966157. (In Chinese) [Google Scholar] [CrossRef]
- Baraibar, J.-M.; Escobal-Marcos, I.; Prendes-Gero, M.-B.; Guerrero-Miguel, D.-J. Innovation Trends in Underground Works: The Example of the Arnotegi Tunnel in Bilbao. Designs 2022, 6, 30. [Google Scholar] [CrossRef]
- Sun, Y.; Xiao, H. Wall displacement and ground-surface settlement caused by pit-in-pit foundation pit in soft clays. KSCE J. Civ. Eng. 2021, 25, 1262–1275. [Google Scholar] [CrossRef]
- Zhi, H.; Li, F.; Gao, J. Risk Analysis of Diaphragm Wall Construction in Water-Rich Sandy Strata of Subway Stations. Eng. Technol. Res. 2020, 5, 169–170. (In Chinese) [Google Scholar]
- Fu, L. Research on Risk Analysis and Control Technology of Seepage in Deep Subway Excavations in Sandy Soil Strata. Master’s Thesis, Central South University, Changsha, China, 2022. (In Chinese). [Google Scholar]
- Xiang, X. Deformation Characteristics of Deep Excavation in Water-Rich Sandy Gravel Strata Based on Fluid-Solid Coupling. Railw. Stand. Design. 2016, 60, 80–84. (In Chinese) [Google Scholar]
- Nikolinakou, M.; Whitttle, A.; Savidis, S.; Schran, U. Prediction and interpretation of the performance of a deep excavation in berlin sand. J. Geotech. Geoenviron. Eng. 2011, 137, 1047–1061. [Google Scholar] [CrossRef]
- Russo, G.; Nicotera Marco, V.; Autuori, S. Three-dimensional performance of a deep excavation in sand. J. Geotech. Geoenviron. Eng. 2019, 145, 05019001. [Google Scholar] [CrossRef]
- Holtz, R.D. Stress distribution and settlement of shallow foundations. In Foundation Engineering Handbook; Fang, H.-Y., Ed.; Springer: Boston, MA, USA, 1991; pp. 166–222. [Google Scholar]
- Long, M. Database for retaining wall and ground movements due to deep excavations. J. Geotech. Geoenviron. Eng. 2001, 127, 203–224. [Google Scholar] [CrossRef]
- Moormann, C. Analysis of wall and ground movements due to deep excavations in soft soil based on a new worldwide database. Soils Found. 2004, 44, 87–98. [Google Scholar] [CrossRef]
- Peck, R.B. Deep Excavations and Tunneling in Soft Ground. In Proceedings of the 7th International Conference on Soil Mechanics and Foundation Engineering, Mexico City, Mexico, 25–29 August 1969. [Google Scholar]
- Crisp, M.P.; Farooq, N.; Nair, R. Automatic Calibration of Tunnel Volume Loss Using Leapfrog and the Limaniv Method. In Integrating Mega Project Planning, Airfield Behavior, and Rail Transition Zones, Proceedings of the 5th International Conference on Transportation Geotechnics (ICTG) 2024, Sydney, Australia, 20–22 November 2024; Springer Nature: Singapore, 2025; pp. 189–197. [Google Scholar]
- Mair, R.J.; Gunn, M.J.; O’reilly, M.P. Ground Movement around Shallow Tunnels in Soft Clay. Tunn. Tunn. Int. 1982, 14, 45–48. [Google Scholar]
- Hu, C.; Feng, C.; Mei, Y.; Yuan, Y. Improvement of Peck’s Settlement Prediction Formula for Shield Tunneling in Water-Rich Sandy Strata in Xi’an. Chin. J. Undergr. Space Eng. 2018, 14, 176–181. (In Chinese) [Google Scholar]
- Blackburn, J.T.; Finno, R.J. Three-dimensional responses observed in an internally braced excavation in soft clay. J. Geotech. Geoenviron. Eng. 2007, 133, 1364–1373. [Google Scholar] [CrossRef]
- Wang, B.; Xiong, J.; Zhu, B. Influence of deformation mode of retaining structures on surface settlement. Struct. Eng. 2007, 23, 48–52. (In Chinese) [Google Scholar]
- Xie, B. Study on the Influence of Basement and Pile Foundation on Adjacent Excavation. Master’s Thesis, Tongji University, Shanghai, China, 2007. (In Chinese). [Google Scholar]
- Hesami, S.; Ahmadi, S.; Taghavi Ghalesari, A.; Hasanzadeh, A. Ground surface settlement prediction in urban areas due to tunnel excavation by the natm. Electron. J. Geotech. Eng. 2013, 18, 1961. [Google Scholar]
- Wuhan Geological Engineering Survey Institute. Engineering Geology Survey Report of Houhu Fourth Road Metro Station Project; Wuhan Geological Engineering Survey Institute: Wuhan, China, 2023. (In Chinese) [Google Scholar]
- Itasca Consulting Group Inc. Flac3d—Fast Lagrangian Analysis of Continua in Three-Dimensions, version 7.0.; Itasca Consulting Group: Minneapolis, MN, USA, 2011; Available online: https://docs.itascacg.com/flac3d700/common/models/hardening/doc/modelhardening.html (accessed on 10 June 2024).


Disclaimer/Publisher’s Note: The statements, opinions and data contained in all publications are solely those of the individual author(s) and contributor(s) and not of MDPI and/or the editor(s). MDPI and/or the editor(s) disclaim responsibility for any injury to people or property resulting from any ideas, methods, instructions or products referred to in the content. |
© 2025 by the authors. Licensee MDPI, Basel, Switzerland. This article is an open access article distributed under the terms and conditions of the Creative Commons Attribution (CC BY) license (https://creativecommons.org/licenses/by/4.0/).