Abstract
Research Objective: This study analyzes the budget quotas and sample cases of traffic engineering and landscaping projects to address the following issues: low accuracy and inability to reflect the cost levels of enterprises in the existing cost estimation techniques. It constructs a historical database and utilizes Python and BIM to develop a BP neural network intelligent estimation system, aiming to provide data and decision support for intelligent and visual cost estimation in traffic landscaping projects. Research conclusions: This study focuses on the construction drawing budget estimation for transportation engineering and landscape ecological engineering projects. Data were collected through questionnaires administered to scholars and practitioners, with key factors influencing pricing units identified using SPSS factor analysis. Subsequently, extensive historical data on road transportation and greening engineering were gathered and standardized through temporal and regional adjustments. Quantitative feature analysis was then conducted to establish a historical database of construction drawing budgets for completed transportation landscape ecological projects, based on construction enterprises. The cosine similarity method was employed to retrieve highly similar sample cases from the database for target projects. A BP neural network-based intelligent estimation system was developed using Python and BIM technology, providing reliable data support and technical assurance for cost estimation, decision-making, and ongoing maintenance endeavors pertaining to transportation landscape and ecological engineering projects.
1. Introduction
In recent years, as the public’s travel needs have been met, the construction of transportation networks has increasingly emphasized ecological, esthetically pleasing, and environmentally friendly development. Despite the efforts that have been made to advance the construction and management of transportation and landscaping projects. This phenomenon is particularly characteristic of construction units, which are often reliant on regional unified budget quotas for preparing drawing budgets. By failing to apply their company quotas, these companies inaccurately reflect construction costs and specific consumption levels. Moreover, the accuracy of cost estimation for transportation landscape ecological projects directly determines their economic and social benefits, representing a critical issue currently faced in the fields of urban planning and construction. Therefore, this study constructs a historical database of completed construction drawing budgets for construction companies, thereby establishing a BP neural network intelligent estimation system.
Elfahham Y. (2019) [] derived a formula for calculating relevant construction cost indicators based on the cost records of key processes in completed projects. By applying neural networks, linear regression, and autoregressive time series to predict construction cost indicators, the scholar provided a reliable cost estimation tool. Wu X. (2020) [,] analyzed the current cost management status, focusing on municipal road projects in China; the scholars studied the key cost control points at various stages of municipal road construction. Qiu Y. (2019) [] focused on municipal road cost control, applying the earned value analysis method throughout the construction process. Wang H. (2019) [] explored cost control during the construction period of municipal roads, integrating methods such as earned value, work breakdown structure, target costing, and cost accumulation curve into the construction process. This researcher analyzed the main factors affecting construction costs and proposed corresponding improvement measures. Zhang H. (2018) [] applied BIM technology to the decision-making, design, construction, and operation and maintenance stages of municipal road projects, and offered reasonable proposals. Wu J. (2025) [] employed an Improved Artificial Bee Colony (IABC) algorithm and ensemble learning techniques to predict investment data for municipal road projects, thereby enhancing the accuracy of traditional investment estimation methods. However, these previous studies did not integrate intelligent prediction with visualization, nor did they achieve the technical capability of quickly generating cost estimates through one-click input of target case characteristics.
In summary, while scholars domestically and internationally have achieved certain results in road project cost management, there remains a scarcity of research that applies intelligent estimation theory to the construction drawing budget phase of transportation projects and achieves both intelligent and visual integration. With the advancement of artificial intelligence and big data technologies, deep learning and machine learning models are manifesting broad application potential across various domains. This study applies historical data from construction companies. By employing the cosine similarity method to select historical data with high similarity to the target case, a basis for intelligent estimation is established. Due to the abundance of similar cases, the overall pricing unit of transportation and landscape engineering construction drawings offers a robust foundation. A BP neural network intelligent estimation system is established using Python3 to estimate the overall pricing unit of the target case. Finally, a 3D auxiliary model is created using BIM technology to visualize transportation engineering and landscaping. These estimation methods are subsequently integrated into a computer-based intelligent estimation system, which yields satisfactory results. This study aims to provide technical support for the intelligent and visual estimation of transportation engineering and landscaping.
2. An Intelligent Estimation System for the Drawing Budget of Traffic Engineering and Landscaping Projects
2.1. Determine the Main Factors Affecting the Construction Drawing Budget Pricing Unit
2.1.1. Basic Factors Affecting Construction Drawing Budget Pricing Units
Based on the content of the ‘Code for Quantity Calculation of Municipal Engineering’ and the ‘Code for Quantity Calculation of Landscape Gardening Engineering,’ the quantity list method is applied to break down the pricing units of municipal engineering, primarily into landscaping, road construction, and municipal pipeline projects. The basic influencing factors of these units significantly impact the construction drawing budget. Additionally, building upon relevant literature, statistical data, and the expert consultation method, experts with over three years of relevant experience were invited to provide feedback through face-to-face interviews and other channels. Their input was then categorized and analyzed from three dimensions: engineering characteristics, technical management, and construction processes, to identify the fundamental factors influencing construction drawing budgeting [], as shown in Table 1.

Table 1.
Statistical results of preliminary influencing factors for pricing units and personnel information.
2.1.2. Selecting the Main Influencing Factors for Pricing Units
Design and Distribution of Questionnaires
The Likert scale is a common rating scale that sums up items related to the same concept for scoring. In 1932, American social psychologist, Robert Cattell, revised and initially studied this scale. It comprises a set of descriptions, each with five options: “strongly agree,” “agree,” “neutral,” “disagree,” and “strongly disagree.” These options are numbered 5, 4, 3, 2, and 1, respectively, reflecting the respondents’ ratings of the intensity of the impact of each factor []. This study primarily utilized on-site interviews and online links to distribute questionnaires, collecting a total of 104 valid responses. The statistical details of the participants’ personal information are illustrated in Table 2.

Table 2.
Statistical results of preliminary influencing factors of pricing units and personnel information.
Processing and Preliminary Analysis of Survey Results
In statistical endeavors, the most fundamental indicators are the mean and standard deviation. These metrics effectively illustrate the data’s concentration and dispersion, providing a more intuitive understanding of its distribution. Therefore, based on SPSS26, the mean and standard deviation for each preliminary influencing factor are calculated, as depicted below. The standard deviation for each influencing factor is less than 1. Considering the characteristics of traffic engineering and landscaping, factors with a mean value above 3 were selected. A total of 27 influencing factors meet the statistical criteria and offer a data foundation for subsequent research, as shown in Table 3.

Table 3.
Survey results for preliminary influencing factors of pricing units.
Internal Consistency Reliability and Validity Test
The reliability and validity test of the questionnaire survey is a necessary guarantee for ensuring the effectiveness of the follow-up analysis. Cronbach’s α coefficient is utilized as the reliability test method, and its calculation process is depicted in Formula (1):
where k denotes the number of factors affecting the questionnaire, specifically the variance of the answer to the i-th question. As shown in Table 4, the number of valid cases is 104. Using SPSS, a reliability test was conducted on the survey data. A reliability coefficient above 0.7 indicates that the questionnaire has high reliability. Herein, the Cronbach’s α coefficient for the survey data is 0.946, indicating that the questionnaire results are reliable. The reliability test results are illustrated in Table 5. The item-total statistics indicate that after removing any items, the Cronbach’s α coefficient remains at or below 0.946, which indicates strong consistency in the survey questionnaire. The item-total statistics are illustrated in Table 6.

Table 4.
Summary of case handling.

Table 5.
Reliability test results.

Table 6.
Summary statistics of items.
After completing the reliability test, the questionnaire data is subjected to a structural validity test using SPSS factor analysis. The KMO and Bartlett’s test of sphericity are applied for data assessment. The KMO value should be between 0 and 1, where a KMO value approaching 1 indicates good structural validity. The significance level from Bartlett’s test of sphericity should be less than 0.05. As depicted in Table 7, the KMO value of the questionnaire data exceeds 0.8, and the significance level from Bartlett’s test of sphericity is 0. This indicates that the questionnaire has good structural validity and the data meet the requirements.

Table 7.
Test results of the data validity for influencing factors of pricing units.
2.1.3. Quantifying the Main Influencing Factors of the Pricing Unit
Based on the survey results, the primary factors influencing the budgeting of ecological construction projects for traffic landscapes have been identified. To facilitate the analysis and extraction of historical data and implement the corresponding algorithms, the main influencing factors are assigned values. Quantitative continuous variables are recorded based on actual values, while qualitative and quantitative non-continuous variables are quantified. The specific details are illustrated in Table 8.

Table 8.
Quantification table for the main influencing factors of the pricing unit.
2.2. Constructing a Historical Database for Construction Drawing Budget Pricing Units
2.2.1. Data Collection and Collation
This study collected a total of 30 cases of cost data through participation in engineering projects, specialized engineering investigations, and publicly available government documents. The dataset spans the period from 2018 to 2024, with unit construction costs ranging from a minimum of 648.43 CNY/m2 to a maximum of 1010.28 CNY/m2, and project site areas varying between 10,767 m2 and 140,951 m2. Because the collected historical data are characterized by spatial and temporal differences, unified processing of case data becomes necessary. Thus, the deviation occasioned by regional and time differences can be eliminated. By introducing the regional adjustment coefficient and time adjustment coefficient methods, case data can be correctly adjusted [].
Territorial Adjustments
To ensure that each case data is based on a unified regional study, Hebei Province in China is selected as the benchmark region, and the regional adjustment coefficient formula is employed to adjust the case data, as depicted in Formulas (2) and (3).
where α signifies the regional adjustment coefficient; Dri denotes the full life cost of project i in the reference area (Hebei Province, China); Pri indicates the weight of project i; Doi corresponds to the full life cost of projects in other regions; Poi denotes the weight of project i in other regions; and Gri signifies the quantity of project i or similar projects.
Time Adjustment
To ensure that each case data is based on a unified time basis, 2024 is set as the adjusted base period, and the time adjustment coefficient formula is applied to adjust the case data, as illustrated in Formulas (4) and (5).
where β indicates the time adjustment coefficient; Dti signifies the project cost of project i in the base year (2024); Pti denotes the weight of project i; Doi corresponds to the project cost of other years for project i; Poi indicates the weight of project i in other years; and Gri signifies the quantity of project i or similar projects.
2.2.2. Similar Case Selection Based on the Cosine Similarity Method
The cosine similarity algorithm calculates the cosine value of the angle between two vectors and judges their similarity. Using the Euclidean dot product, the cosine value between two vectors can be calculated:
To obtain eigenvectors, the sample cases and target cases in the database are processed according to the quantitative indicators of influencing factors. The cosine similarity between any two vectors A and B is calculated as follows:
where n denotes the number of cases and respectively represents the corresponding quantitative indicators of the influence factors in case A and case B.
The similarity range is from −1 to 1: −1 indicates that the two vectors point in exactly opposite directions, 1 indicates that they point in the same direction, and 0 indicates that the two vectors are independent of each other. This result is not influenced by the length of the vectors but solely by their direction. Considering the characteristics of traffic engineering and landscaping, the threshold is set at 0.85. By measuring the cosine similarity between historical cases and target cases, data with a cosine similarity above 0.85 is utilized as the basis for subsequent intelligent estimation. The correlation between the threshold range and variables is detailed in Table 9.

Table 9.
Cosine similarity correlation.
2.3. BP Neural Network Method Is Utilized to Estimate the Total Project Cost and Unit Price of Comprehensive Pricing Units Under a Large Amount of Data
The training of a BP neural network requires the support of a large amount of historical data. An increased number of training samples leads to enhanced quality and more accurate training results. If the case data is exceedingly limited and the similarity is low, the BP neural network often fails to converge. Therefore, when there are more sample cases, the BP neural network can be selected for intelligent estimation.
The BP neural network model selects a three-layer network including the input, hidden, and output layers [].
- Input layer: The input neurons in the model are the characteristic vectors of the main influencing factors after simplification: the main influencing factors of the construction drawing budget for traffic engineering and landscaping are the input items, and the quantified values of the influencing factors are extracted as the input vector X = (x1, x2, …xn).
- Hidden layer: This study utilizes Kolmogorov’s theorem to calculate the number of hidden layer neurons. The number of hidden layer neurons is 2 times the number of input layer neurons plus 1, alternatively expressed as 2m + 1 (where m signifies the number of input layer neurons).
- Output layer: In conformance to the reviewed literature, the output neuron is the cost per square meter of the target case.
- Parameter design: A three-layer neural network is adopted, including an input layer, a hidden layer, and an output layer. The sigmoid is applied as the activation function, and the stochastic gradient descent algorithm is utilized.
2.4. Intelligent Estimation of Construction Drawing Budgets and a BIM Computer-Aided Model for the Construction of Traffic Engineering and Landscaping Projects
2.4.1. Intelligent Estimation System for the Construction Drawing Budgets of Traffic Engineering and Landscaping Projects
Using the Python language—lauded for its simplicity, scalability, and strong compatibility—we can integrate and connect the historical database, similar case selection, and aforementioned estimation methods. This enables the development of an intelligent computer software system for budget estimation, especially for traffic engineering and landscaping construction drawings. The system enables users to input data from a pricing unit perspective, by simply entering the main influencing factors of the target case. Subsequently, it automatically selects the appropriate algorithm to perform the calculations and output the estimation results, thus achieving an intelligent and automated estimation process.
2.4.2. BIM Computer-Aided Visualization Model
This study establishes a three-dimensional model and analyzes the application of BIM technology in traffic engineering and landscaping from the following two aspects:
- The 3D computer virtual model of the unit project structure is constructed to visualize the overall project structure.
- The 3D computer virtual dynamic model of the construction method and construction procedure is constructed for the dynamic three-dimensional visualization of the construction scheme and construction procedure.
3. Model Implementation
3.1. Target Case-ZGZT Project Overview
The ZGZT project, located in the Xiongan New Area of Hebei Province, covers an area of 34,242.3 m2. The surrounding terrain is flat, and construction conditions are excellent. The road surface is primarily made of asphalt concrete, which provides excellent resistance to pressure and wear. Trees such as maple and hibiscus are planted along both sides of the road, while shrubs such as boxwood and golden privet are primarily utilized, with regular planting and neat pruning. This meets the travel needs of residents and creates a vibrant atmosphere. The project primarily focuses on road engineering, traffic engineering, greening, lighting, and water supply and drainage systems.
3.2. Quantifying Project Characteristics and Calculating Case Similarity for Unit Projects
3.2.1. Quantifying Target Case Characteristics
According to the main influencing factors, the construction drawing budget for the traffic engineering and landscaping ZGZT project is analyzed, and the text description for the main influencing factors of the pricing unit is extracted as depicted in Table 10.

Table 10.
Description of the main influencing factors for the ZGZT project valuation unit.
Based on the description of the main influencing factors of the ZGZT construction drawing budget in the preceding table and the aforementioned quantification standards, the main influencing factors are assigned values and uniformly quantified before data processing, data mining, and intelligent estimation. The quantification results of the ZGZT construction drawing budget pricing unit are illustrated in Table 11.

Table 11.
Quantitative results of the main influencing factors for the ZGZT project valuation unit.
3.2.2. Case Similarity Calculation
Based on the quantification standards for the main influencing factors of the existing traffic engineering and landscaping projects, data analysis and data mining were conducted on 30 case data sets from the historical database. The textual descriptions of the main influencing factors were extracted, and each description was assigned a corresponding value according to the quantification standards. The results of assigning values to the main influencing factors of each historical case pricing unit are illustrated in Table 12.

Table 12.
Quantitative results of the main influencing factors of the valuation unit in each historical case.
Based on the quantitative processing of the target and historical case data, the cosine similarity method in Python is applied to calculate the similarity between cases. Cases with a higher similarity to the target case are selected to provide reliable data support for the subsequent intelligent estimation by the BP neural network. Some of the operational processes are illustrated in Figure 1.
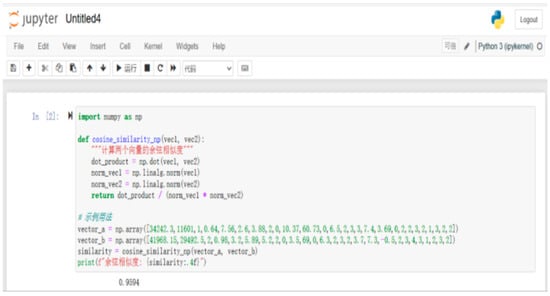
Figure 1.
Operation process of the cosine similarity method.
Considering the characteristics of transportation engineering and landscaping, this study selects historical cases with a similarity degree of 0.85 or higher to the target case. The results illustrate that 26 cases, including cases 1–8, 10–19, 21–23, 25–27, and 29–30, meet the requirements. The cosine similarity calculation results for each historical case are depicted in Table 13.

Table 13.
Calculation results of the cosine similarity for each historical case.
3.3. Comprehensive Unit Price Estimation of Pricing Units Based on the BP Neural Network
According to the cosine similarity calculation, 26 sets of historical cases were selected, and the primary condition (i.e., having a large amount of data) was met, thus providing data support for intelligent estimation. Therefore, the BP neural network was applied, and via Python, the researchers could perform intelligent estimation of the overall pricing unit per square meter cost of target cases. The specific steps are as follows:
- (1)
- The input nodes of the model are determined to be 27, i.e., 27 influencing factors.
- (2)
- The number of hidden layer nodes is determined to be 2 × 27 + 1 = 55.
- (3)
- The model has only one output node, i.e., the project estimate cost per square meter, which signifies the one-time investment consumed for each square meter of land area.
- (4)
- From the 30 case data sets, select 25 cases with a similarity of over 0.85 as training samples, and utilize Case 14 as the test sample. Set the system’s maximum number of iterations to 1000. The main influencing factors, quantified indicators, and cost per square meter for the 25 training samples and 1 test sample are detailed in Table 14.
 Table 14. Main data table of sample cases.
The random initialization of weights and thresholds in the BP neural network estimation model introduces significant instability to the estimation results, often leading to substantial variations in the estimation outcomes during operation. To minimize the errors occasioned by this uncertainty, 10 training sessions were conducted, and the average of the 10 estimation results was selected as the final training result. The feature values of similar cases and their corresponding unit cost from the aforementioned context are input into variables X and Y in the BP neural network code, for details, please refer to Appendix A. The operational process is illustrated in Figure 2 and Figure 3.
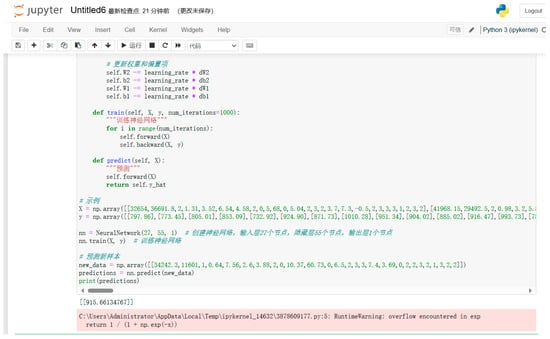
Figure 2.
BP neural network training process.
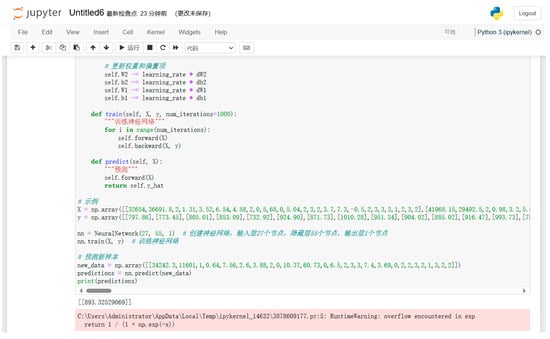
Figure 3.
BP neural network training process.
To reduce the uncertainty and randomness of BP neural network operation, 10 times of training were performed, and the mean value of the 10 times of estimation results was set as the final prediction value of the test sample case and target case. The results and mean value of 10 runs are depicted in Table 15.

Table 15.
Output values of training samples.
The BP neural network pricing unit estimation system, built using Python technology, was applied for estimation. After 10 training sessions and processing the results using the mean method, the estimated value of the pricing unit for the test sample was 864.5 yuan/m2. This value has an error of −1.98% compared to the actual value of 881.98 yuan/m2, which is less than 3%. The error between the classical techniques and the actual value was −6.49%. Compared with the classical techniques, the proposed approach reduces the deviation rate, demonstrating the superior accuracy of the intelligent analysis method. Therefore, the model’s performance meets the error requirements for the construction drawing budgeting phase and can be applied to predict the budget of the target case. Similarly, the intelligent estimation of the target case yielded a predicted pricing unit estimate of 899.21 yuan/m2, compared to the actual value of 913.16 yuan/m2, with an error of −1.53%, which is within 3%. Additionally, the proposed method demonstrates a notable reduction in error compared to the conventional technique, highlighting its superior accuracy. The errors between the final construction drawing budget estimates of the test sample and the target case and the actual values meet the error requirements. Thus, applying this intelligent estimation system for traffic engineering and landscaping is both reasonable and scientifically feasible, with significant application value.
4. Applying a Computer-Aided 3D and Intelligent Estimation Model for Traffic Engineering and Landscaping Projects
4.1. Constructing a BIM 3D Model
This study establishes a 3D model, primarily covering road engineering, traffic engineering, and landscaping. Utilizing the target case ZGZT project as an example, the model components are constructed based on actual design plans and relevant standards. The components are configured and positioned according to the design drawings, as illustrated in Figure 4. Furthermore, engineering information from the construction drawing stage was associated with the BIM 3D model. This integration enables the visualization of all geometric and engineering data within the BIM model, providing an accurate basis for quantity calculation. Moreover, changes during construction, adjustments in material prices, and other cost-related information can be incorporated into the BIM model. This allows for a more comprehensive and multidimensional representation of the engineering attributes and cost information of each component, as illustrated in Figure 5.
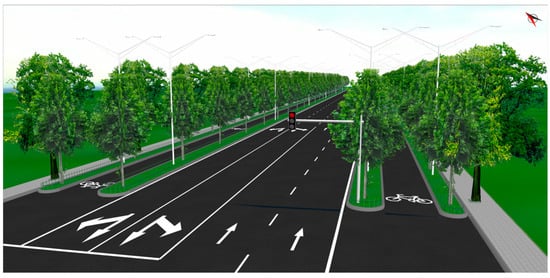
Figure 4.
BIM modeling process.
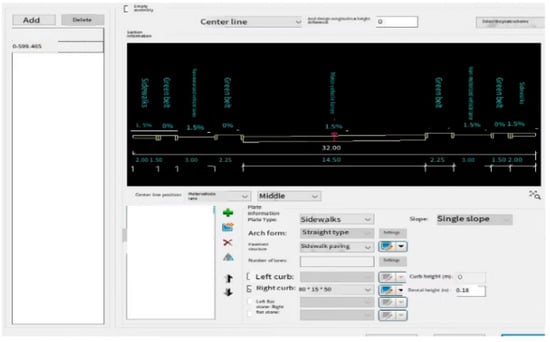
Figure 5.
Add parameters.
To better utilize the functions of BIM 3D auxiliary models and achieve a more three-dimensional representation of data, a BIM information management platform is established. This platform can store historical data, perform data mining, and display BIM 3D models, providing technical support for future data extraction, cost management, and 3D browsing. Additionally, the historical database for the construction drawing budgets of traffic engineering and landscaping projects can be fed into the platform, facilitating subsequent data queries and intelligent estimation. The platform’s login interface and menu interface are depicted in Figure 6 and Figure 7.

Figure 6.
Login screen.
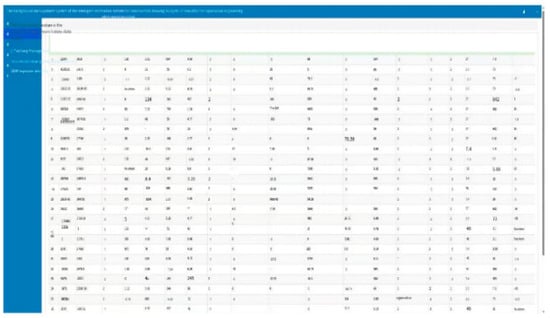
Figure 7.
Historical database.
4.2. Developing an Intelligent Estimation System for Construction Drawing Budgets of Traffic Engineering and Landscaping Projects Using PYTHON
To ensure compatibility and integration with the historical database, similar case selection, and estimation methods applied herein, we developed an intelligent estimation computer software system for construction drawing budgets tailored to traffic engineering and landscaping projects using Python and HTML. This system can automatically generate estimation results by inputting the main influencing factors of the target case or through human–computer interaction. Users can access the intelligent estimation platform via the login interface, as illustrated in Figure 8.
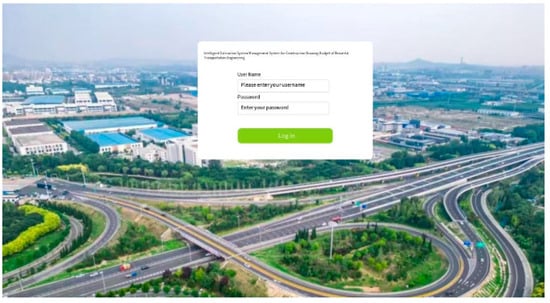
Figure 8.
Login screen.
Based on the main influencing factors, historical data, and the intelligent estimation model, the platform’s estimation interface is established. Users input the construction location and time of the proposed project, and they select the corresponding options from the drop-down menu for major influencing factors based on the project’s drawings and actual conditions. After all the information is input, users click the intelligent estimation button. The system subsequently extracts and calculates the data based on the input information, and it finally outputs the estimation results.
5. Conclusions
This study investigates the cost estimation of transportation landscape engineering projects. Data were collected through questionnaires distributed to relevant scholars and practitioners, and SPSS factor analysis was employed to eliminate less influential factors, thereby identifying key pricing units with research significance. Reliability and validity tests were conducted to ensure the standardization and rationality of the survey. Additionally, cost-influencing factors were thoroughly examined through analysis of typical historical cases to identify the primary determinants of construction costs.
A comprehensive collection of historical data was standardized through temporal and regional adjustments to mitigate discrepancies. Based on the identified key factors, feature quantification analysis was performed on the historical data, leading to the establishment of a historical cost database for completed transportation landscape projects sourced from construction enterprises. This database provides a reliable and authentic foundation for intelligent cost estimation, addressing the rigidity and lag associated with unified standard quota systems.
The cosine similarity method was applied to screen the historical database, retrieving sample cases highly similar to the target project. A BP neural network-based intelligent estimation system, developed using Python, demonstrated greater speed, efficiency, and accuracy compared to traditional methods while meeting precision requirements. The proposed intelligent estimation approach was validated as rational and feasible. By integrating BIM and Python technologies, a 3D visualization and intelligent estimation model was constructed based on the design and construction schemes of transportation landscape projects. This model served as the foundation for an information management platform that links data with three-dimensional models.
The developed intelligent estimation platform for transportation landscape engineering costs enables rapid and smart cost estimation, providing data and technical support for budgeting, decision-making, and subsequent cost management during the construction drawing phase.
Due to limitations in expertise and time, the BIM-based information management platform and intelligent estimation system presented in this study have not yet fully realized all intended functionalities, with certain modules requiring further development. As informatization and intelligent technologies continue to advance, the integration of information technology with engineering practices represents a future trend. Thus, the proposed management platform holds significant potential for further development and practical application.
Author Contributions
Writing original draft, Conceptualization, Data curation, Methodology, Visualization, Formal analysis D.Z.; Software, Supervision, Formal analysis J.N.; Investigation, Validation, Resources X.L.; Funding acquisition, Supervision, Project administration, Writing—review & editing X.D. All authors have read and agreed to the published version of the manuscript.
Funding
Research and Practice Project on Innovation and Entrepreneurship Education Teaching Reform in Hebei Province Universities. Project Name: Innovative Research on AI-Enabled Computer-Aided Construction Engineering Cost Classroom Practice Teaching (Serial number: 368).
Data Availability Statement
The original contributions presented in the study are included in the article, further inquiries can be directed to the corresponding author.
Conflicts of Interest
The authors declare no conflicts of interest.
Appendix A
BP Neural Network Implementation Code:
import numpy as np
def sigmoid(x):
"""Sigmoid"""
return 1/(1 + np.exp(-x))
class NeuralNetwork:
def __init__(self, input_size, hidden_size, output_size):
"""Initializing the neural network"""
self.input_size = input_size
self.hidden_size = hidden_size
self.output_size = output_size
# Random weight initialization
self.W1 = np.random.randn(self.input_size, self.hidden_size)
self.b1 = np.zeros((1, self.hidden_size))
self.W2 = np.random.randn(self.hidden_size, self.output_size)
self.b2 = np.zeros((1, self.output_size))
def forward(self, X):
"""Forward Propagation"""
self.z1 = np.dot(X, self.W1) + self.b1
self.a1 = sigmoid(self.z1)
self.z2 = np.dot(self.a1, self.W2) + self.b2
self.y_hat = self.z2
def backward(self, X, y, learning_rate = 0.01):
"""Backpropagation"""
m = X.shape[0]
# Computing the gradient
dz2 = self.y_hat − y
dW2 = np.dot(self.a1.T, dz2)/m
db2 = np.sum(dz2, axis = 0)/m
dz1 = np.dot(dz2, self.W2.T) * self.a1 * (1 − self.a1)
dW1 = np.dot(X.T, dz1)/m
db1 = np.sum(dz1, axis = 0)/m
# Updating weights and biases.
self.W2 −= learning_rate * dW2
self.b2 −= learning_rate * db2
self.W1 −= learning_rate * dW1
self.b1 −= learning_rate * db1
def train(self, X, y, num_iterations = 1000):
"""Training the neural network"""
for i in range(num_iterations):
self.forward(X)
self.backward(X, y)
def predict(self, X):
"""Prediction"""
self.forward(X)
return self.y_hat
References
- Elfahham, Y. Estimation and prediction of construction cost index using neural networks, time series, and regression. Alex. Eng. J. 2019, 58, 499–506. [Google Scholar] [CrossRef]
- Wu, X. Research on Cost Control of the Whole Process of Municipal Road Engineering Project Construction. Ph.D. Thesis, Shenyang Jianzhu University, Shenyang, China, 2020. [Google Scholar]
- Wu, X.; Pan, Z. Analysis of Key Points of Cost Control in Each Stage of Municipal Road Engineering Construction. Archit. Budg. 2020, 27–30. [Google Scholar]
- Qiu, Y. Research on the Application of Construction Cost Control in Road Projects. Ph.D. Thesis, Chang’an University, Xi’an, China, 2019. [Google Scholar]
- Wang, H. Research on Cost Control in the Construction Stage of Municipal Road Engineering. Ph.D. Thesis, Anhui University of Finance and Economics, Hefei, China, 2019. [Google Scholar]
- Zhang, H. Research on the Application of BIM Technology in Municipal Infrastructure Projects. Ph.D. Thesis, Beijing University of Civil Engineering and Architecture, Beijing, China, 2018. [Google Scholar]
- Wu, J. Research on Intelligent Estimation Method of Municipal Road Engineering Investment Based on Data Mining. Sci. Technol. Inf. 2025, 23, 159–161. [Google Scholar] [CrossRef]
- Jiang, M.; Yan, M.; Yan, P.; Huang, C.; Tan, S. Factors Influencing Investment Estimation at the Feasibility Study Stage of Municipal Road Projects and Countermeasure Research. Constr. Econ. 2021, 42, 60–64. [Google Scholar] [CrossRef]
- Yang, C. Application of SPSS Project Analysis in Questionnaire Design. High. Corresp. J. (Nat. Sci. Ed.) 2010, 23, 107–109. [Google Scholar]
- Duan, X. Research on the Theory and Method of Comprehensive Investment Control for Government Investment Projects. Ph.D. Thesis, Tianjin University, Tianjin, China, 2007. [Google Scholar]
- Duan, X.; Chen, Y.; Shi, Z.; Huang, K. Research on Intelligent Estimation Methods for Investment in Subway Engineering Construction. J. Railw. Eng. 2021, 38, 109–114. [Google Scholar]
Disclaimer/Publisher’s Note: The statements, opinions and data contained in all publications are solely those of the individual author(s) and contributor(s) and not of MDPI and/or the editor(s). MDPI and/or the editor(s) disclaim responsibility for any injury to people or property resulting from any ideas, methods, instructions or products referred to in the content. |
© 2025 by the authors. Licensee MDPI, Basel, Switzerland. This article is an open access article distributed under the terms and conditions of the Creative Commons Attribution (CC BY) license (https://creativecommons.org/licenses/by/4.0/).