Article

Reinforcement of Insufficient Transverse Connectivity in Prestressed Concrete Box Girder Bridges Using Concrete-Filled Steel Tube Trusses and Diaphragms: A Comparative Study

1
School of Civil Engineering, Xiangtan University, Xiangtan 411100, China
2
School of Civil Engineering, Southeast University, Nanjing 210096, China
3
Department of Civil, Environmental, and Geospatial Engineering, Michigan Technological University, 1400 Townsend Drive, Houghton, MI 49931-1295, USA
*
Authors to whom correspondence should be addressed.
Buildings 2024, 14(8), 2466; https://doi.org/10.3390/buildings14082466
Submission received: 17 July 2024 / Revised: 5 August 2024 / Accepted: 8 August 2024 / Published: 9 August 2024
(This article belongs to the Section Building Structures)

Abstract

To address the issue of insufficient transverse connectivity in prestressed concrete box girder (PCB) bridges, this study investigates two transverse strengthening methods—installing diaphragms and utilizing concrete-filled steel tube trusses (CFSTTs). A finite element model was developed for a typical 30 m PCB bridge and was validated by on-site load test results for reliability. Based on the deflection and load distribution of PCB bridges before and after reinforcement, as well as the maximum stress and strain of the diaphragms and the CFSTTs, comparative analyses were conducted on diaphragms of different thicknesses and materials, as well as on CFSTTs of various strength grades. The results show that the addition of a transverse partition and CFSTTs can effectively improve the load distribution of the PCB bridge and reduce the maximum deflection of the girder, especially when using the CFSTT reinforcement method. The unique structural design improves the reinforcement effect of the material in the post-elastic stage. When using CFSTTs, increasing the steel tube wall strength significantly reduces the maximum deflection of the main girder. For example, using steel tubes with yield strengths of 235 MPa and 420 MPa filled with concrete of 50 MPa compressive strength reduced the maximum deflections by 15.32% and 24.55%, respectively, and improved the load distribution coefficients by up to 7.31% and 11.57%. Additionally, steel diaphragms demonstrated better reinforcement effects compared with concrete diaphragms. The load transverse distribution coefficients for the CFSTT-reinforced PCB bridge were calculated using the hinge plate (beam) and the rigid plate (beam) methods, showing minimal differences between the two approaches. The findings of this study provide valuable insights into the design of diaphragm and CFSTT reinforcement in PCB bridges, aiding in the selection of optimal reinforcement strategies.

1. Introduction

Prestressed concrete box girder (PCB) bridges are widely used in urban viaducts and highway bridges, spanning 20 to 40 m, due to their advantages of high torsional stiffness, high load-bearing capacity, convenient construction, and low engineering cost [1,2,3,4]. However, with the increase in service time and the substantial growth in traffic volume and hefty vehicles, the deterioration issues of PCB bridges have intensified, such as prestress loss, corrosion of reinforcement, beam cracking, and transverse connection decline [5,6,7,8]. Among these issues, inadequate transverse connectivity is particularly prominent. As transverse connectivity decreases, transverse stiffness and overall performance decline, and the cooperative work between different girder sections is disrupted. If the transverse connectivity is wholly compromised, it may even lead to the bridge experiencing single-girder loading, which has a profound impact on the safety of the bridge [9].
To address the issues mentioned above, incorporating diaphragms in bridges has gradually become a consensus [10]. In recent years, composite truss reinforcement technology has also garnered widespread attention. The former method involves setting diaphragms to ensure that the bridge structure maintains a good spatial force state, significantly enhancing transverse connectivity and overall integrity. The latter method involves adding truss components to the bridge structure, thereby enhancing the bridge’s overall stiffness and load-bearing capacity [11]. Many scholars have conducted in-depth studies on these two reinforcement methods. Shi and Chen [12] explored the rationality of diaphragm arrangements in precast box girders through finite element analysis, discovering that diaphragms significantly improve transverse stress and crack resistance while reducing vertical deformation. In their series of studies, Lee et al. [13,14] propose an improved design method for the intermediate diaphragm spacing of steel box girder bridges, accounting for the complexities of various construction stages and design parameters, thereby effectively controlling the bridge’s torsional stresses. Wan Ikram’s study demonstrates that the addition of intermediate diaphragms can significantly enhance the vibrational performance of concrete bridges under moving loads, improving the driving experience [15]. Tsiptsis’ research evaluates the optimal placement of intermediate diaphragms in composite bridges, noting the impact of diaphragm thickness and position on structural performance [16].
However, diaphragm reinforcement methods have drawbacks, such as long construction times and the susceptibility of concrete diaphragms to cracking. Consequently, more scholars have focused on using composite trusses to reinforce bridges with damaged transverse connectivity. This reinforcement method offers advantages such as not disrupting everyday bridge use, convenient construction, and effective reinforcement. Numerous studies have been conducted on this method. In the study by Yang et al. [17], composite trusses made of low-carbon steel were used to reinforce T-girder bridges. They conducted experiments and finite element analyses on the mechanical performance of reinforced concrete T-girder bridges under four loading conditions. They studied the LDF using the rigid connection plate (beam) method. The results indicated that compared to non-reinforced girders, T-girder specimens reinforced with composite trusses (K-shaped) showed a 12.4% increase in maximum transverse stiffness and a 39.7% reduction in maximum deflection. Hou et al. [18,19] also used steel to manufacture K-BCT-reinforced T-beam bridges and found that the local deformation and crack propagation mode of T-beam bridges were improved. In the subsequent study, the fatigue life of composite truss under actual traffic load was evaluated, and its durability was confirmed to be as long as 92.39 years. Chen et al. [20] compared the reinforcement effects of triangular and K-shaped composite trusses using aluminum alloy as the truss material. The results showed that K-shaped composite trusses outperformed triangular ones, with deflection and strain in T-girder bridges reduced by 21.0% and 16.0%, respectively. Niu et al. [21] selected steel to manufacture spatial double-K braces and reinforced existing T-girder bridges. Field test results showed that the stress of diaphragms at mid-span decreased by 69.4%.
The studies above report on reinforcing bridges with diaphragms and composite trusses to improve load distribution and enhance cooperative behavior between adjacent main girders. However, the comparison of the reinforcement effect between the two, especially for the reinforcement effect under different material parameters, is rarely involved. In practical engineering, diaphragms and composite trusses are common reinforcement techniques for PCB bridges. Selecting the appropriate reinforcement scheme and determining the optimal material parameters is crucial. Therefore, it is necessary to conduct in-depth research to investigate the reinforcement effects of diaphragms and composite trusses under different parameters on PCB bridges.
In this study, a PCB bridge model [22] was developed based on ABAQUS (2022), in which transverse partition and concrete-filled steel tube composite trusses (CFSTTs) were set, respectively, in the span. Based on the deflection and load distribution of the PCB bridge before and after reinforcement, as well as the maximum stress and strain of the diaphragms and the CFSTTs, the reinforcement effects of the transverse partition and the CFSTTs under different reinforcement parameters were compared and analyzed. The purpose of this study is to help select the most suitable reinforcement technology and material parameters to improve the structural performance of PCB bridges.

2. Finite Element Model

2.1. Geometric Description

Using ABAQUS (2022) software, a three-dimensional solid model of the superstructure of a box girder bridge was established based on a specific PCB bridge. This bridge has a span of 30,000 mm and a deck width of 13,500 mm, consisting of four box girders—two edge girders and two middle girders, as shown in Figure 1. The dimensions of the PCB bridge cross-section, as well as the selection of prestressed steel strands and reinforcing bars, were referenced from the “General Code for Design of Highway Bridges and Culverts” (JTG D60-2004) [23]. The thickness of the top slab is 180 mm, and the widths of the edge girders and middle girders are slightly different, as shown in Figure 1a.

2.2. Materials

2.2.1. Concrete

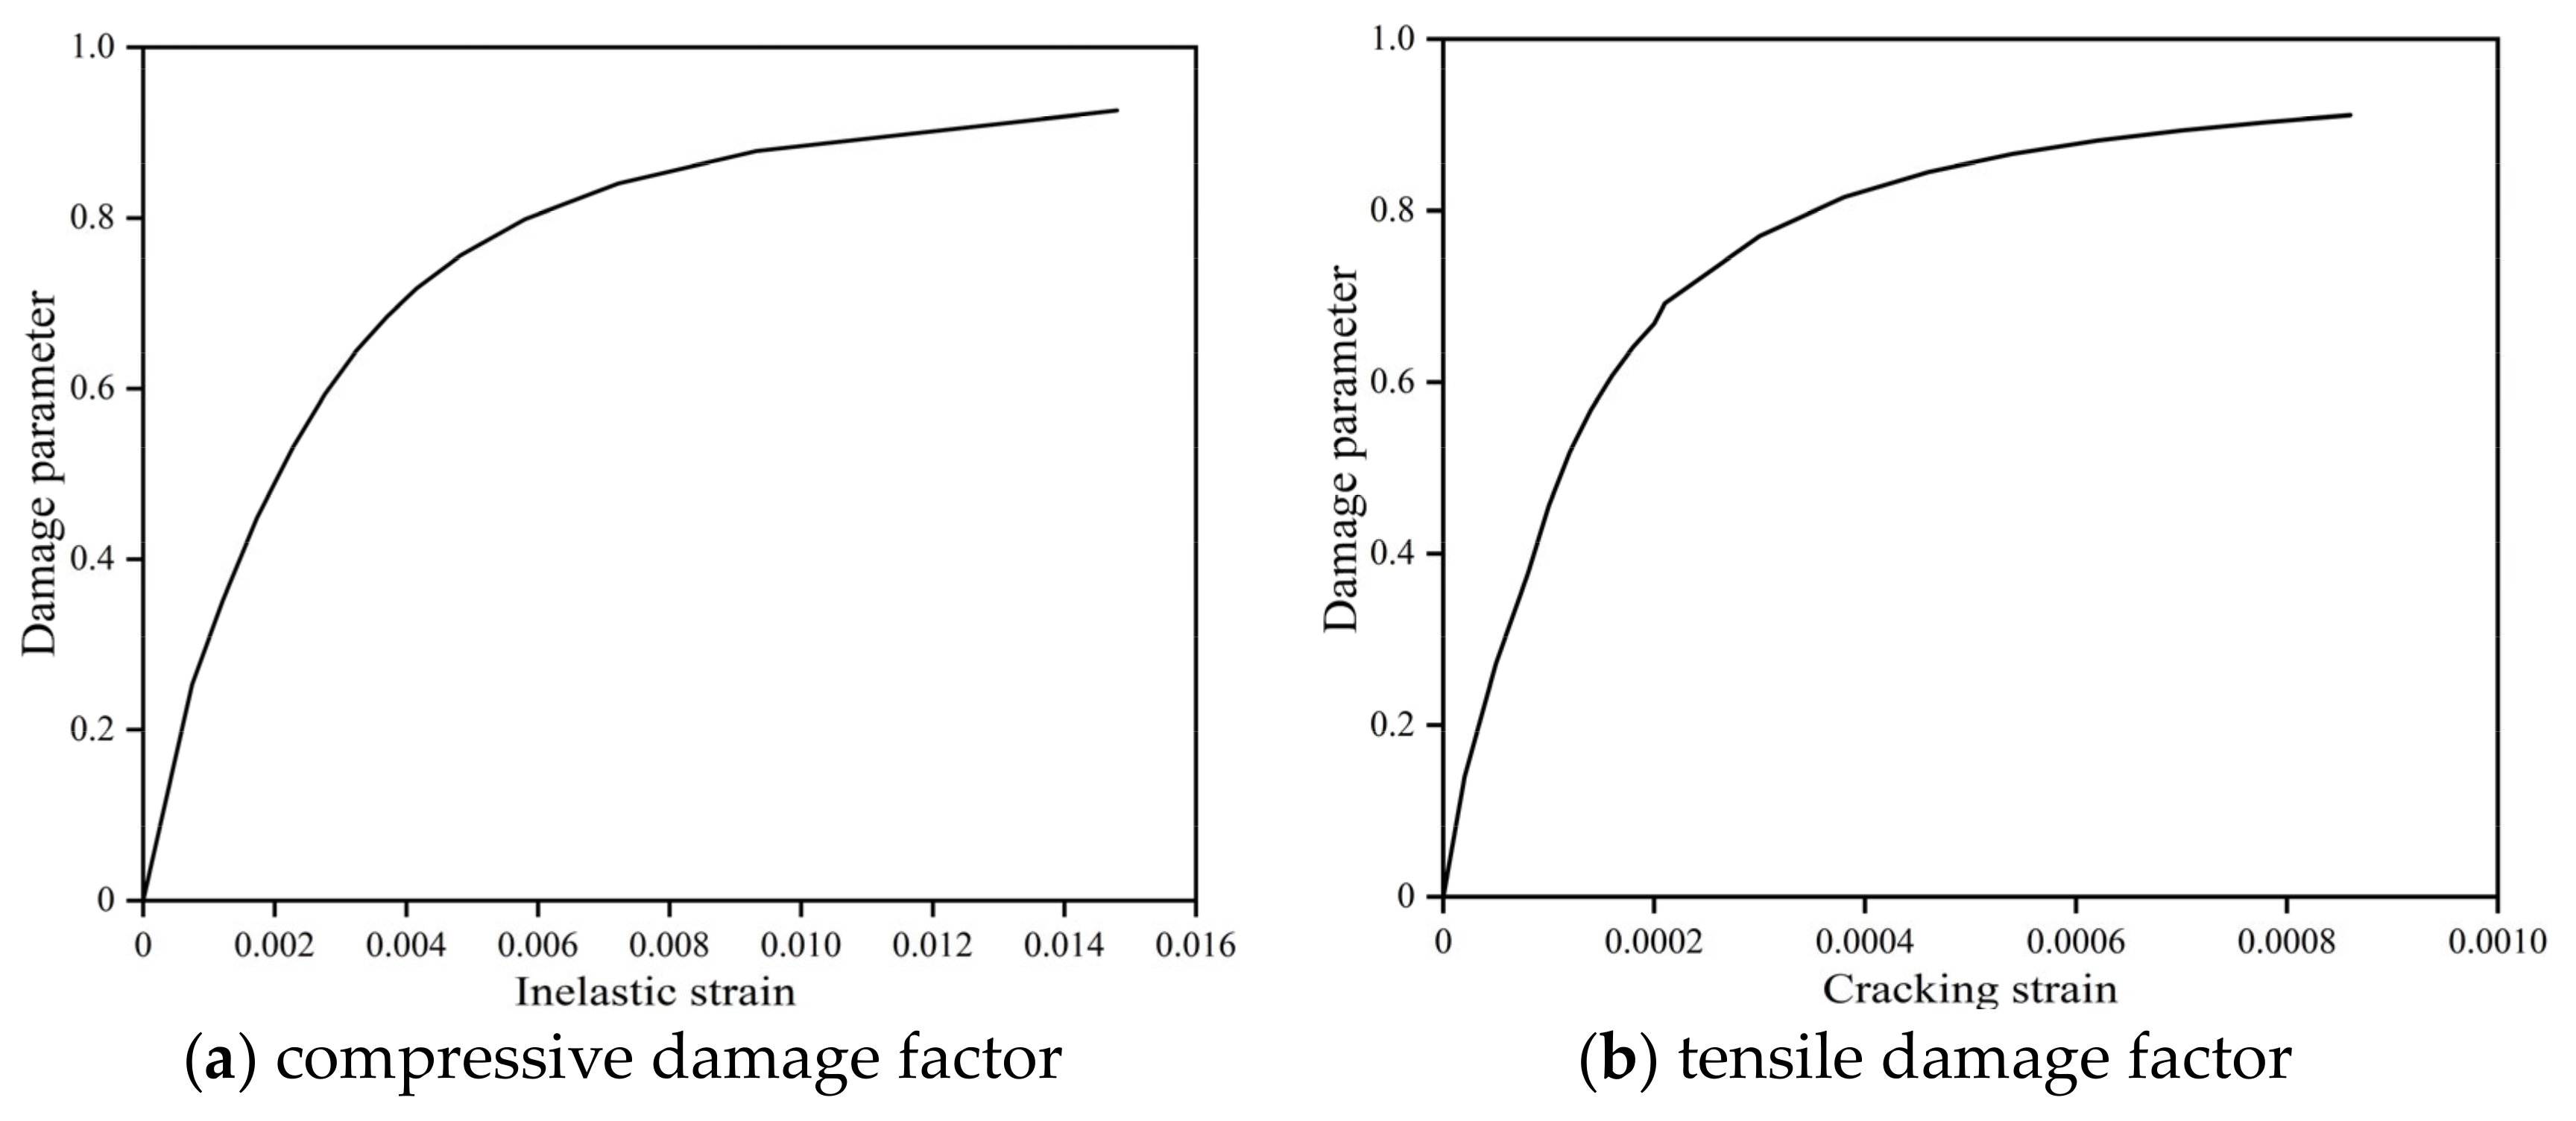
Based on the “Standard for test methods for mechanical properties of ordinary concrete” (GB/T 50081) [24], compressive strength and tensile splitting tests were conducted on 150 mm × 300 mm cylindrical specimens against the background of a 30 m span PCB bridge to determine the concrete strength. Referring to the study by Li [25], the Concrete Damage Plasticity (CDP) model was used to describe the nonlinear behavior of concrete, as shown in Figure 2. This model was first proposed by Lubliner et al. [26] and simulates the degradation of concrete stiffness with increasing damage using two independent damage variables (tensile damage factor and compressive damage factor) [27]. The concrete parameters of each strength grade used by the diaphragm and CFSTT are shown in Table 1.
In Table 1, C30, C40, and C50 are the standard compressive strength values of the standard concrete cube, and their unit is MPa. This value is the compressive strength of a 150 mm cube specimen made and maintained according to the standard method and tested with the standard test method at 28 days or a specified age, with a guaranteed rate of 95%.

2.2.2. Steel Bars and Steel Strands

The steel bars were simplified using the constant reinforcement principle. The common steel bars in PCB bridges are divided into R1, R2, and R3 types; the elastic perfectly plastic model was adopted for the reinforcements in this study. The layout of the steel bars for the edge and middle girders is shown in Figure 3, and the material parameters of the ordinary steel bars are listed in Table 2.
The linear elastic constitutive model is used to establish the prestressed tendons. According to the length, area, radius, and initial angle of the prestressed tendons, the prestressed tendons are divided into three types—N1, N2, and N3, as shown in Table 3. According to the cooling method to simulate prestress, the calculation formula of the temperature drop value is shown in Equation (1). N1, N2, and N3, respectively, represent three prestressed steel strands with high-strength relaxation at the base. Specifically, N1 consists of five 5 ϕ s 15.2 prestressed steel strands ( ϕ s 15.2 represents a 15.2 mm diameter of the prestressed steel strands), with a total length of 30,760 mm; N2 and N3 consist of four 4 ϕ s 15.2 prestressed steel strands, with a total length of 30,810 mm and 30,660 mm, respectively. The inner diameter of the embedded bellows is 55 mm, the wall thickness is 25 mm, and the extension at both ends is 209 mm. Table 4 gives more information about the prestressed tendons. The prestressed tendons of the side beam and the middle beam are the same, and each main beam in the PCB bridge model has six prestressed steel strands passing through the web and bottom plate. Figure 4 takes the middle beam as an example to show the position of the prestressed tendons of the support and mid-span section; the profile is shown in Figure 5. As the prestress of the steel strand decreases with the service life of the bridge, according to the study of EC [28], it is calculated that the contribution of elastic compression, cable tension, and concrete creep shrinkage to the prestress loss is 81.7 MPa and 58.75 MPa, 97.41 MPa, and 139.93 MPa, respectively. The cumulative prestress loss is 377.79 MPa, which is equivalent to 20.3% of the initial tensile stress applied in the prestressing process. According to the “Code for design of concrete structures” (GB50010-2010) [29], the standard tensile strength f p k of steel strand is 1860 MPa, and the tension control stress is 0.75 f p k , which is 1395 MPa.
Δ t = P E p A p α

2.2.3. CFSTTs and Diaphragms

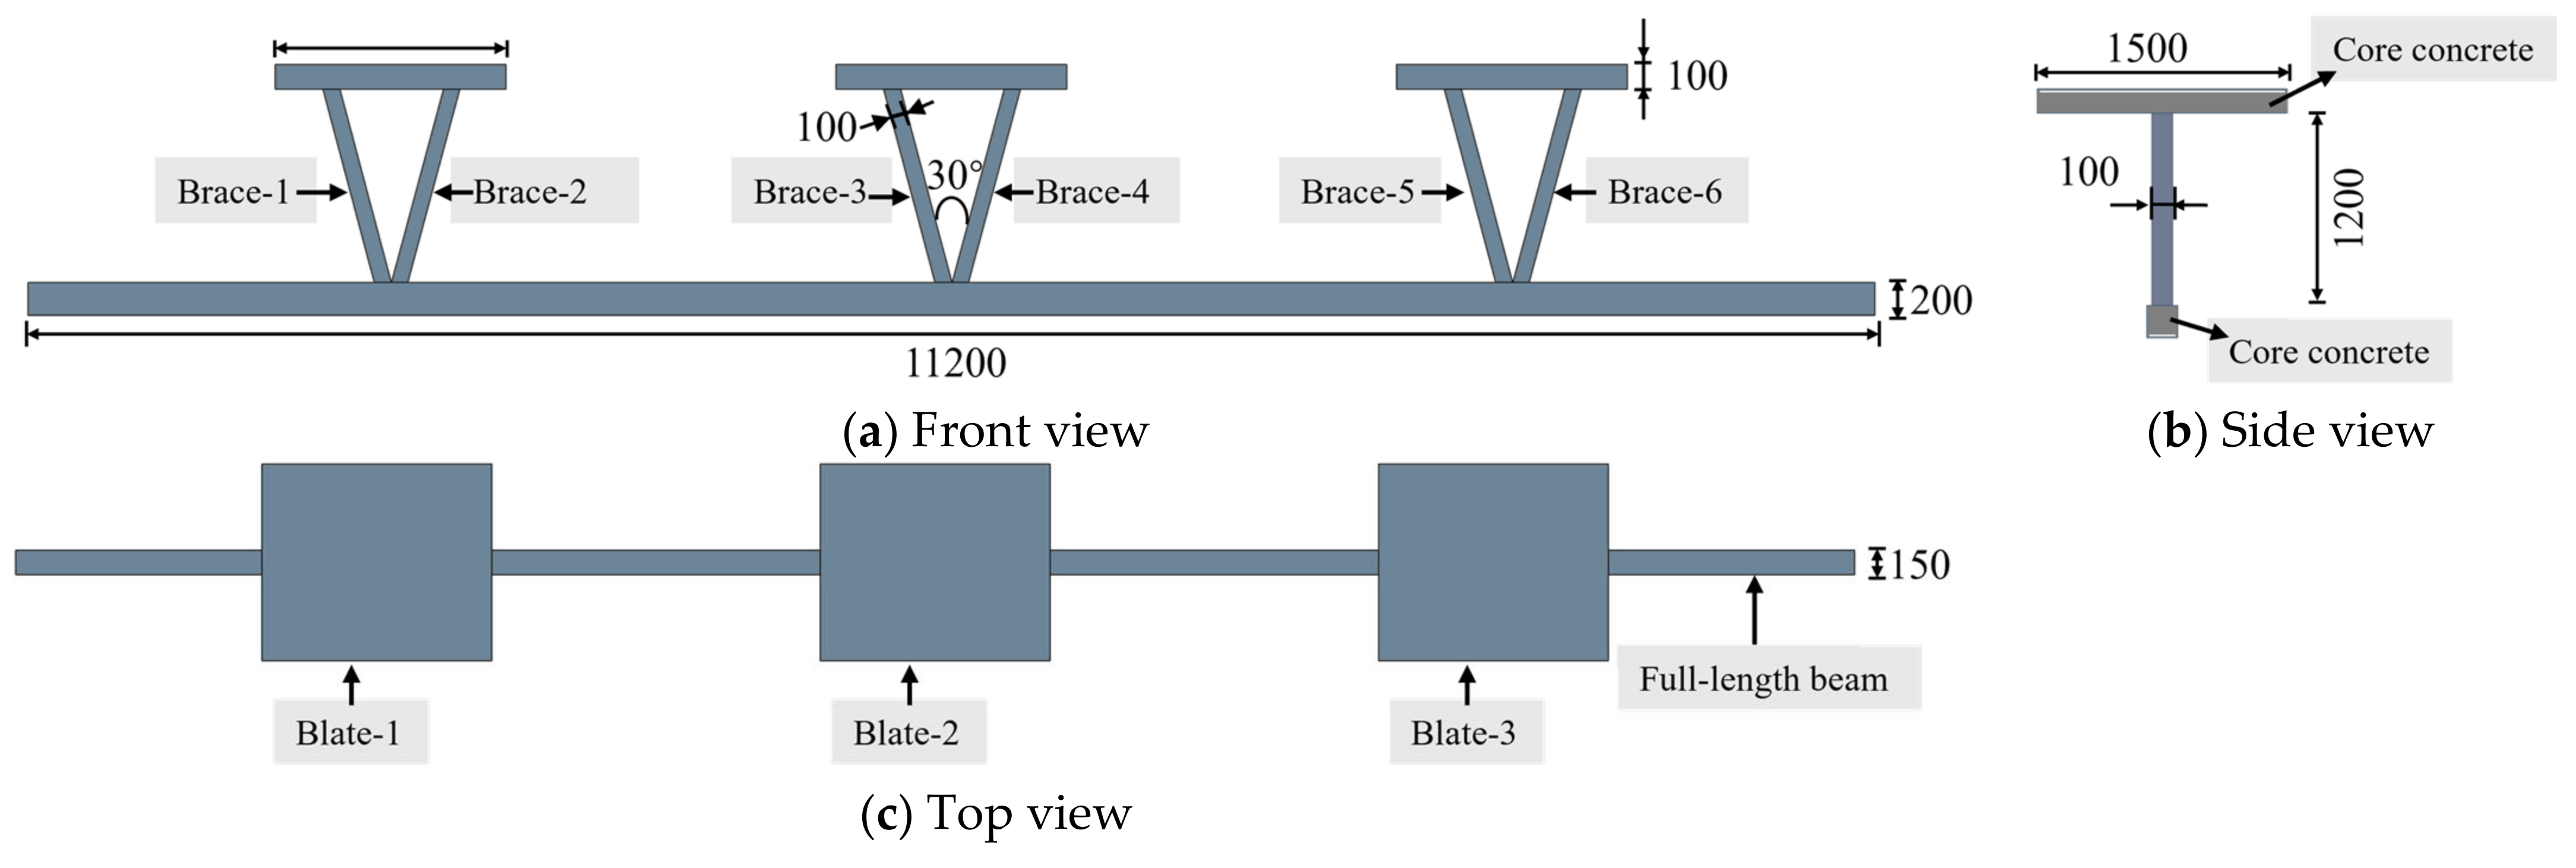
The CFSTT consists of three support plates, six diagonal braces, and one continuous bottom beam. Its dimensions were determined based on previous research [30,31,32,33], as shown in Figure 6. The dimensions of the support plates are 1400 mm × 1500 mm × 100 mm, and the continuous bottom beam measures 11,200 mm × 200 mm × 150 mm. The width and thickness of the diagonal braces are both 100 mm. The steel used for the CFSTTs and the diaphragms has a density of 7.85 × 10³ kg/m3, an elastic modulus of 3.45 × 10⁴ MPa, and a Poisson ratio of 0.3. The reinforcement of the concrete diaphragm board is set according to the “General Drawing of Highway Bridge (Plate girder series, box girder series)” [34], and their arrangement in the PCB bridge is shown in Figure 7.

2.3. Elements and Mesh

ABAQUS offers various element types with distinct physical characteristics and constitutive relationships. Therefore, selecting appropriate element types is crucial for establishing a reliable finite element model [22]. This study used solid elements (C3D8R) for the PCB bridge, wet joints, CFSTTs, and diaphragms. The C3D8R element is an eight-node linear solid element with one numerical integration point, integrated with simplified linear material properties [35]. Truss elements (T3D2) were employed to simulate ordinary steel bars and prestressed tendons.
Proper meshing is essential for accurate computational results, as it discretizes the entire structure into discrete finite elements. This process directly affects the accuracy of the computed results from the geometric model to the finite element model. In this research, the element mesh sizes for the PCB bridge, CFSTTs, and diaphragms were approximately 278 mm × 254 mm × 45 mm, 25 mm × 25 mm × 5 mm, and 130 mm × 120 mm × 20 mm, respectively. It is important to note that consistent mesh sizes were maintained across all models to study the effectiveness of the CFSTT and diaphragm reinforcement on the PCB bridge.

2.4. Contacts and Boundary Conditions

The bonding relationship between the PCB bridge and the wet joints, CFSTT steel pipe, and concrete, as well as between the CFSTTs, diaphragms, and the PCB bridge, is defined by binding command (Tie constraint); this bonding relationship ensures that the components can be coordinated in their deformation. The contact between prestressed steel bars, ordinary steel bars, and concrete is simulated using embedded commands within the contact module. Due to the grouting inside the bellows, it is assumed that all prestressed tendons are fully bonded in the concrete, and relative slip is ignored [36,37].
In the model of boundary conditions, two types of constraints were applied—hinged and roller supports. The hinged support limited translations in the X, Y, and Z axes, while translation in the Y axis alone was restricted by the roller support [38].

3. Calibration and Validation of the FE Model

3.1. Calibration of Models

Concrete exhibits significant nonlinear properties, showing different mechanical behaviors under tension and compression. The CDP model can capture these complex nonlinear characteristics, provided that model parameters are accurately calibrated. In the ABAQUS model, using the CDP model requires us to define five parameters—dilation angle, eccentricity ε, the ratio of initial isotropic yield stress to initial uniaxial compressive yield stress fb0/fc0, the ratio of second stress invariant on the tensile meridian to second stress invariant on the compressive meridian K, and viscosity coefficient μ [39]. Among these, ε, fb0/fc0, and K can be set to 0.1, 1.16, and 0.667, respectively, while dilation angle and μ require calibration.

3.1.1. Viscosity Coefficient

Figure 8 compares stress–strain curves under different viscosity coefficients for tensile behavior against theoretical values. It can be observed that all curves reach their peak stress value, approximately 2.7 MPa, when the strain approaches 0.0001, after which the stress rapidly decreases. When the viscosity coefficient is 0.0005, the curve reflects the material’s initial loading characteristics well. It exhibits reasonable hysteresis during the stress reduction phase. This indicates that this viscosity coefficient can more accurately simulate the actual behavior of concrete during loading. Therefore, this study selects 0.0005 as the viscosity coefficient for the CDP model parameter analysis.

3.1.2. Dilation Angle

As one of the parameters of the CDP model, the dilation angle Ψ is used to describe the shear dilation effect of concrete materials. Most researchers use Equation (2) to define the dilation angle. Table 5 shows the average relative error of the strain and deflection of the main girders of the PCB bridge model compared to the load test under different dilation angles. It can be seen from the table that when the dilation angle is 28°, the strain and deflection have the lowest average relative error, indicating the highest prediction accuracy of the model at this dilation angle. Conversely, when it is 50°, the average relative error is at its highest. Comprehensive analysis suggests that a dilation angle of 28° should be selected to achieve the best fit with the actual load test results.
ψ = arcsin ε v p ε v p 2 ε l p
where ε v p is the plastic volumetric strain rate, and ε l p is the first principal plastic strain rate.

3.2. Validation of Models

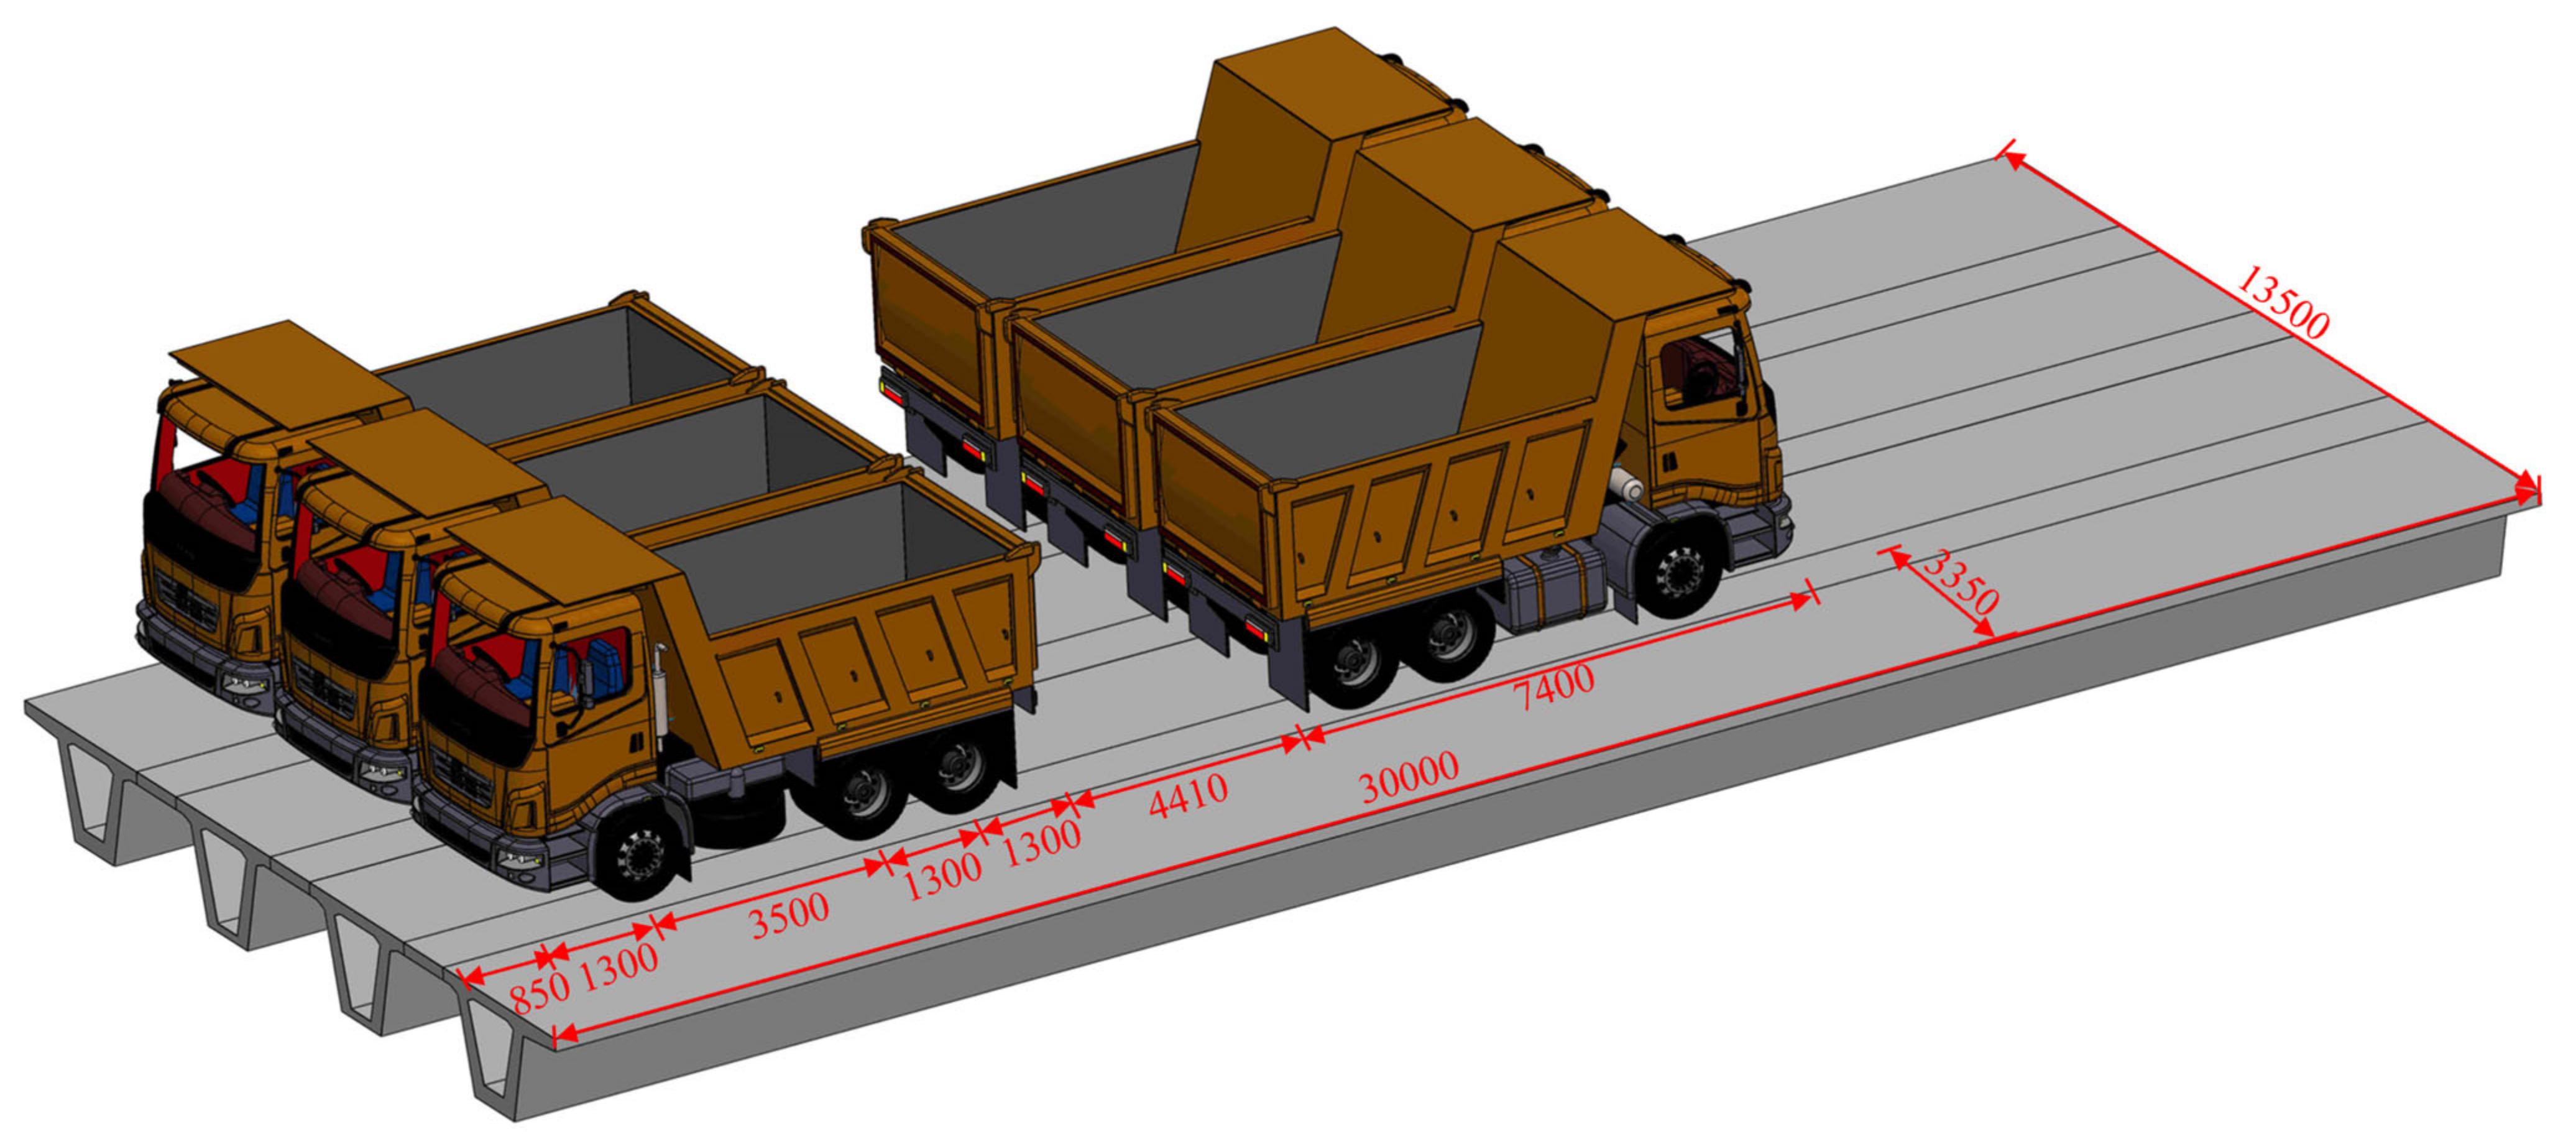
A static load test was conducted on the PCB bridge to validate the effectiveness of the finite element model. Strain and displacement sensors were used to measure the strain and deflection values at the midspan. According to the specification [40], based on the investigation of the operating load of the PCB bridge (1.3 times the car over 20 classes), the control load during the static load test was selected, and a heavy vehicle of 35 tons was selected for loading through calculation; the dimensions of the vehicles are shown in Figure 9. The vehicles, characterized by a wheelbase of 1800 mm and an overall width of 2500 mm, feature a horizontal spacing of 1300 mm between adjacent truck axles.
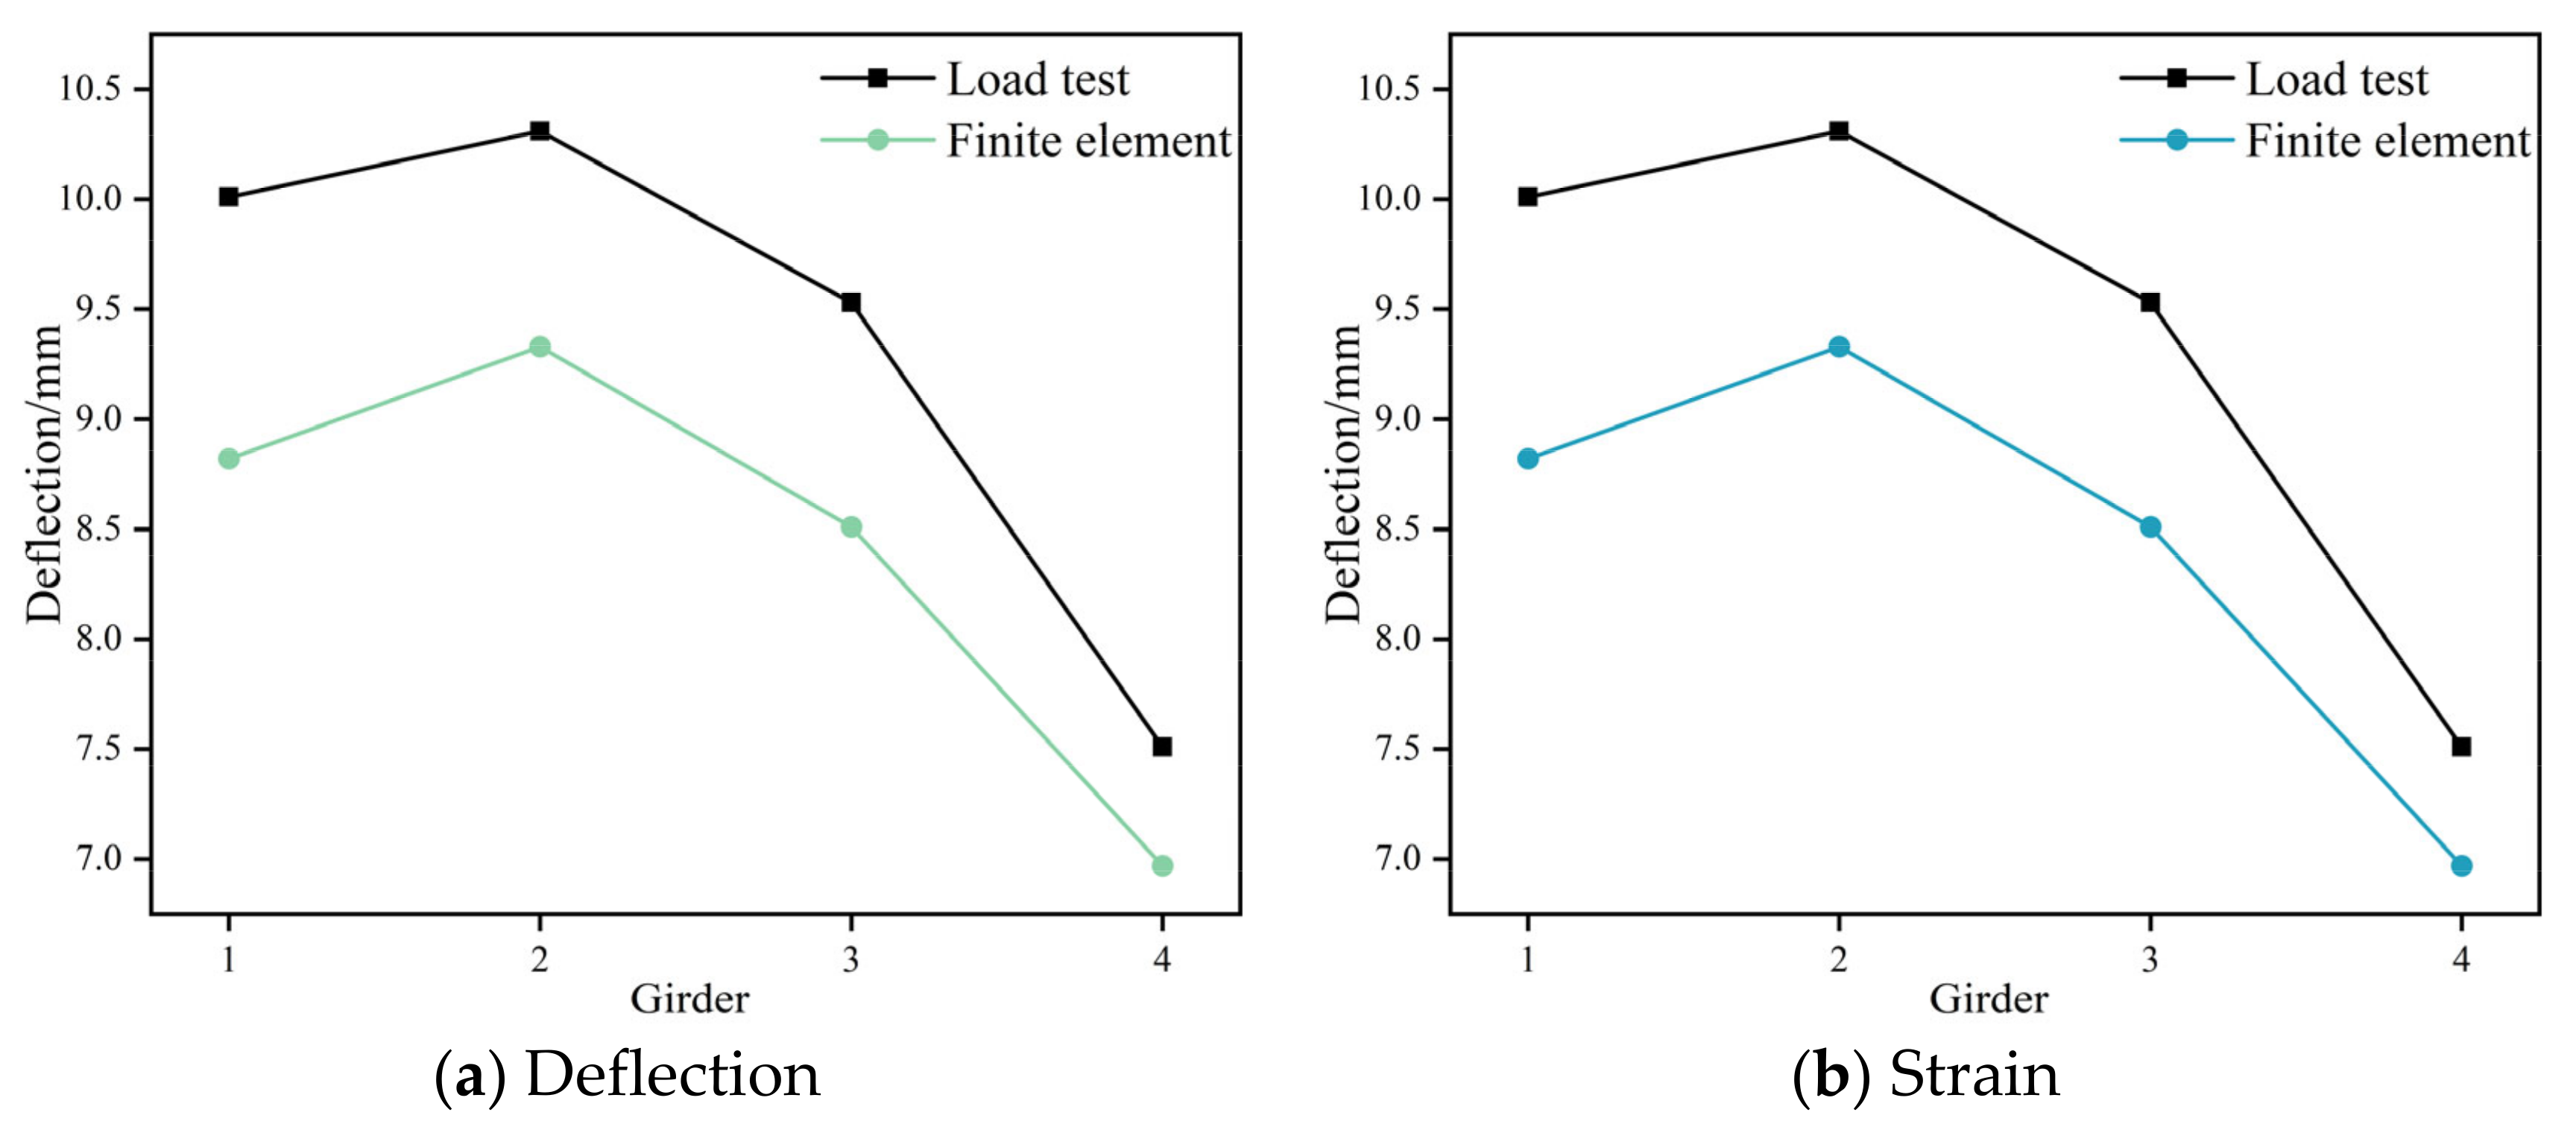
As shown in Figure 10, the load test and the finite element model exhibit a consistent trend. On Girder-2, the static load test and the finite element model show higher strain and deflection values than the other girders. The deflection value of each main beam under load test is less than 1/600 of the calculated span specified in the code [41]. Additionally, the strain and deflection values of the finite element model are consistently lower than those of the static load test, with maximum errors of 10.31% and 13.40%, respectively. This discrepancy can be attributed to the finite element model not accounting for stiffness degradation and accumulated bridge damage, resulting in the model having a slightly higher stiffness than the actual bridge. Consequently, the strain and deflection values are underestimated. Overall, the finite element model demonstrates relatively tiny errors compared to the test results, indicating that it can be used for further analysis of the PCB bridge under static load conditions.

4. Load Mode and Models

4.1. Load Mode

According to the specification [40], the load positions are determined based on the principles of the most unfavorable stress conditions and the representativeness of the bridge structure. According to the design load standard and the vehicle load grade of the 30 m box girder bridge in the specification [23], six 60-ton three-axle trucks are applied to offset load in all working conditions, so as to simulate the influence of heavy load on the bridge structure. The contact area between the standard loaded vehicle’s wheel surface and the bridge deck is defined according to the code [23]. A coupling constraint is applied to each wheel surface at the center of the truck’s mass. Figure 1b shows the load point positions, with coordinates provided in Table 6.

4.2. Finite Element Models

To evaluate the influence of the material parameters of the CFSTTs and diaphragms on the reinforcement effect, three commonly used compressive strength grades of concrete (30 MPa, 40 MPa, and 50 MPa) and three commonly used yield strength grades of steel (235 MPa, 345 MPa, and 420 MPa) were selected in this paper. According to the research of Zu [41], diaphragms of different thicknesses (10 mm, 20 mm, 30 mm, 100 mm, 300 mm, and 500 mm) were selected, and a total of 12 finite element models were established, as shown in Table 7. Model CM-1 is a control model and is not reinforced, models SM-1 to SM-5 are reinforced with CFSTTs, and models SM-6 to SM-11 are reinforced with diaphragms. According to previous studies [30,31,32,33], the two CFSTTs were arranged symmetrically along the middle section of the PCB bridge span, with a spacing of 3 m (one-tenth of the bridge span), as shown in Figure 1b. The “Design Code for Highway Reinforced Concrete and Prestressed Concrete Bridge and Culvert” (JTJ023-85) [42] gives relevant instructions on the use of beam bridge diaphragms, while the “AASHTO Standard specification for Highway Bridges” [43] states that intermediate diaphragms should be used at the maximum bending moment for bridges with spans of more than 12.2 m. In order to compare the reinforcement effect of CFSTTs with that of a conventional diaphragm, a diaphragm was installed in the mid-span section to provide a controlled evaluation.
In Table 7, Q235, Q345, and Q420 are the yield strength of steel, that is, the stress value when the steel presents the yield phenomenon and the material produces plastic deformation without increasing the force during the test period; the unit is MPa.

5. Results and Discussion

5.1. Deflection

Due to prestress, the PCB bridge exhibits a slight reverse arch shape [44]. In the control and strengthen models, the reverse arch of the vehicle under static load is 25.2 mm and 25.1 mm, respectively, indicating that the transverse diaphragm and CFSTT have little influence on the reverse arch. The average deflection of the beam bottom in the middle section of each main beam span is taken to draw the deflection distribution of different models before strengthening. It can be seen from Figure 11 that both the CFSTT and the transverse diaphragm can reduce the deflection of the main girder. With CFSTT reinforcement, both the strength of the steel tube wall and core concrete significantly influence the deflection of the main girder, especially the strength increase in the steel tube wall, which is more effective in reducing the deflection of the main girder. When concrete with compressive strength grades of 50 MPa is used to fill steel pipe walls with yield strength grades of 235 MPa for CFSTT reinforcement, the deflection of Girder-1 is reduced from 22.57 mm without reinforcement to 19.11 mm, a decrease of 15.32%, and the yield strength grades of the steel pipe wall are further increased to 420 MPa. The deflection reduction in Girder-1 is increased to 24.55%. In contrast, when the yield strength grades of the steel pipe wall are fixed at 345 MPa and the compressive strength grades of the core concrete are 30 MPa and 50 MPa, respectively, the deflection of Girder-1 is reduced by 13.19% and 20.30%, respectively. Similar to Hou’s study [18], this phenomenon shows that strengthening the yield strength of the steel tube wall provides a significant increase in local stiffness in the key areas of the PCB bridge. With the increase in yield strength, the restraint effect of the steel tube wall on concrete is significantly enhanced, which not only limits the transverse expansion of core concrete under high pressure, but also optimizes the interaction between materials and improves the overall stiffness and bearing capacity of the structure.
When the reinforcement strategy of adding a transverse diaphragm is adopted, the thickness of the transverse diaphragm shows a proportional relationship with the reduction in the deflection of the main beam. Specifically, with the increase in the thickness of the diaphragm, the deflection of the main beam decreases more significantly. The experimental results show that the deflection reduction rate of Girder-1 increases from 8.72% to 18.82% when the thickness of the concrete diaphragm with compressive strength grades of 50 MPa is increased from 100 mm to 500 mm. However, when the thickness of the transverse diaphragm varies between 100 mm and 300 mm, the reduction in deflection only increases by 0.61%. Further, when using steel with a yield strength grade of 345 MPa, the 10 mm and 30 mm thick diaphragms reduce the deflection of Girder-1 by 12.73% and 21.80%, respectively. According to Euler–Bernoulli beam theory [44], the deflection of a beam is proportional to the reciprocal of the section modulus. Therefore, the increase in the transverse diaphragm significantly improves the section modulus of the main beam, especially when the thickness of the steel transverse diaphragm increases, and the bending stiffness of the beam can be significantly improved, thus reducing the deflection [45].

5.2. Load Distribution

5.2.1. Theory of LDF

The hinged plate (beam) method is suitable for the concrete beam bridge with the wet joint connection of cast-in-place concrete, while the rigid plate (beam) method is suitable for the beam bridge with the inner transverse partition beam or the integral beam [46]. In this study, the main beams of the PCB bridge are connected by cast-in-place 180 mm thick wet joints. In practical engineering, the two adjacent main beams simultaneously transmit a transverse bending moment and a vertical shear force at the wet joints under vertical load, which is consistent with the basic assumption of the rigidly connected plate (beam) method. The span is provided with a transverse partition or CFSTT, which is consistent with the application range of the hinged plate method. Therefore, these two methods can be used for calculation. The hinged plate (beam) method is simple to calculate and can be applied to many types of bridges, but it is too simplified and ignores the difference in stiffness, so the results may not be accurate. The rigidly connected plate (beam) method takes stiffness into account and is highly accurate, but the calculation is complex and may still not cover all the complex factors in the actual load transfer process [47].
Based on the rigidly connected beam (beam) method and the hinged plate (beam) method, for PCB bridges reinforced with CFSTTs, the approach considers treating the bottom beam of the composite truss as part of the main girder bottom slab in the calculation of the LDF [17]. This treatment assumes that a PCB bridge reinforced with CFSTTs is equivalent to having two intermediate transverse beams installed at mid-span.
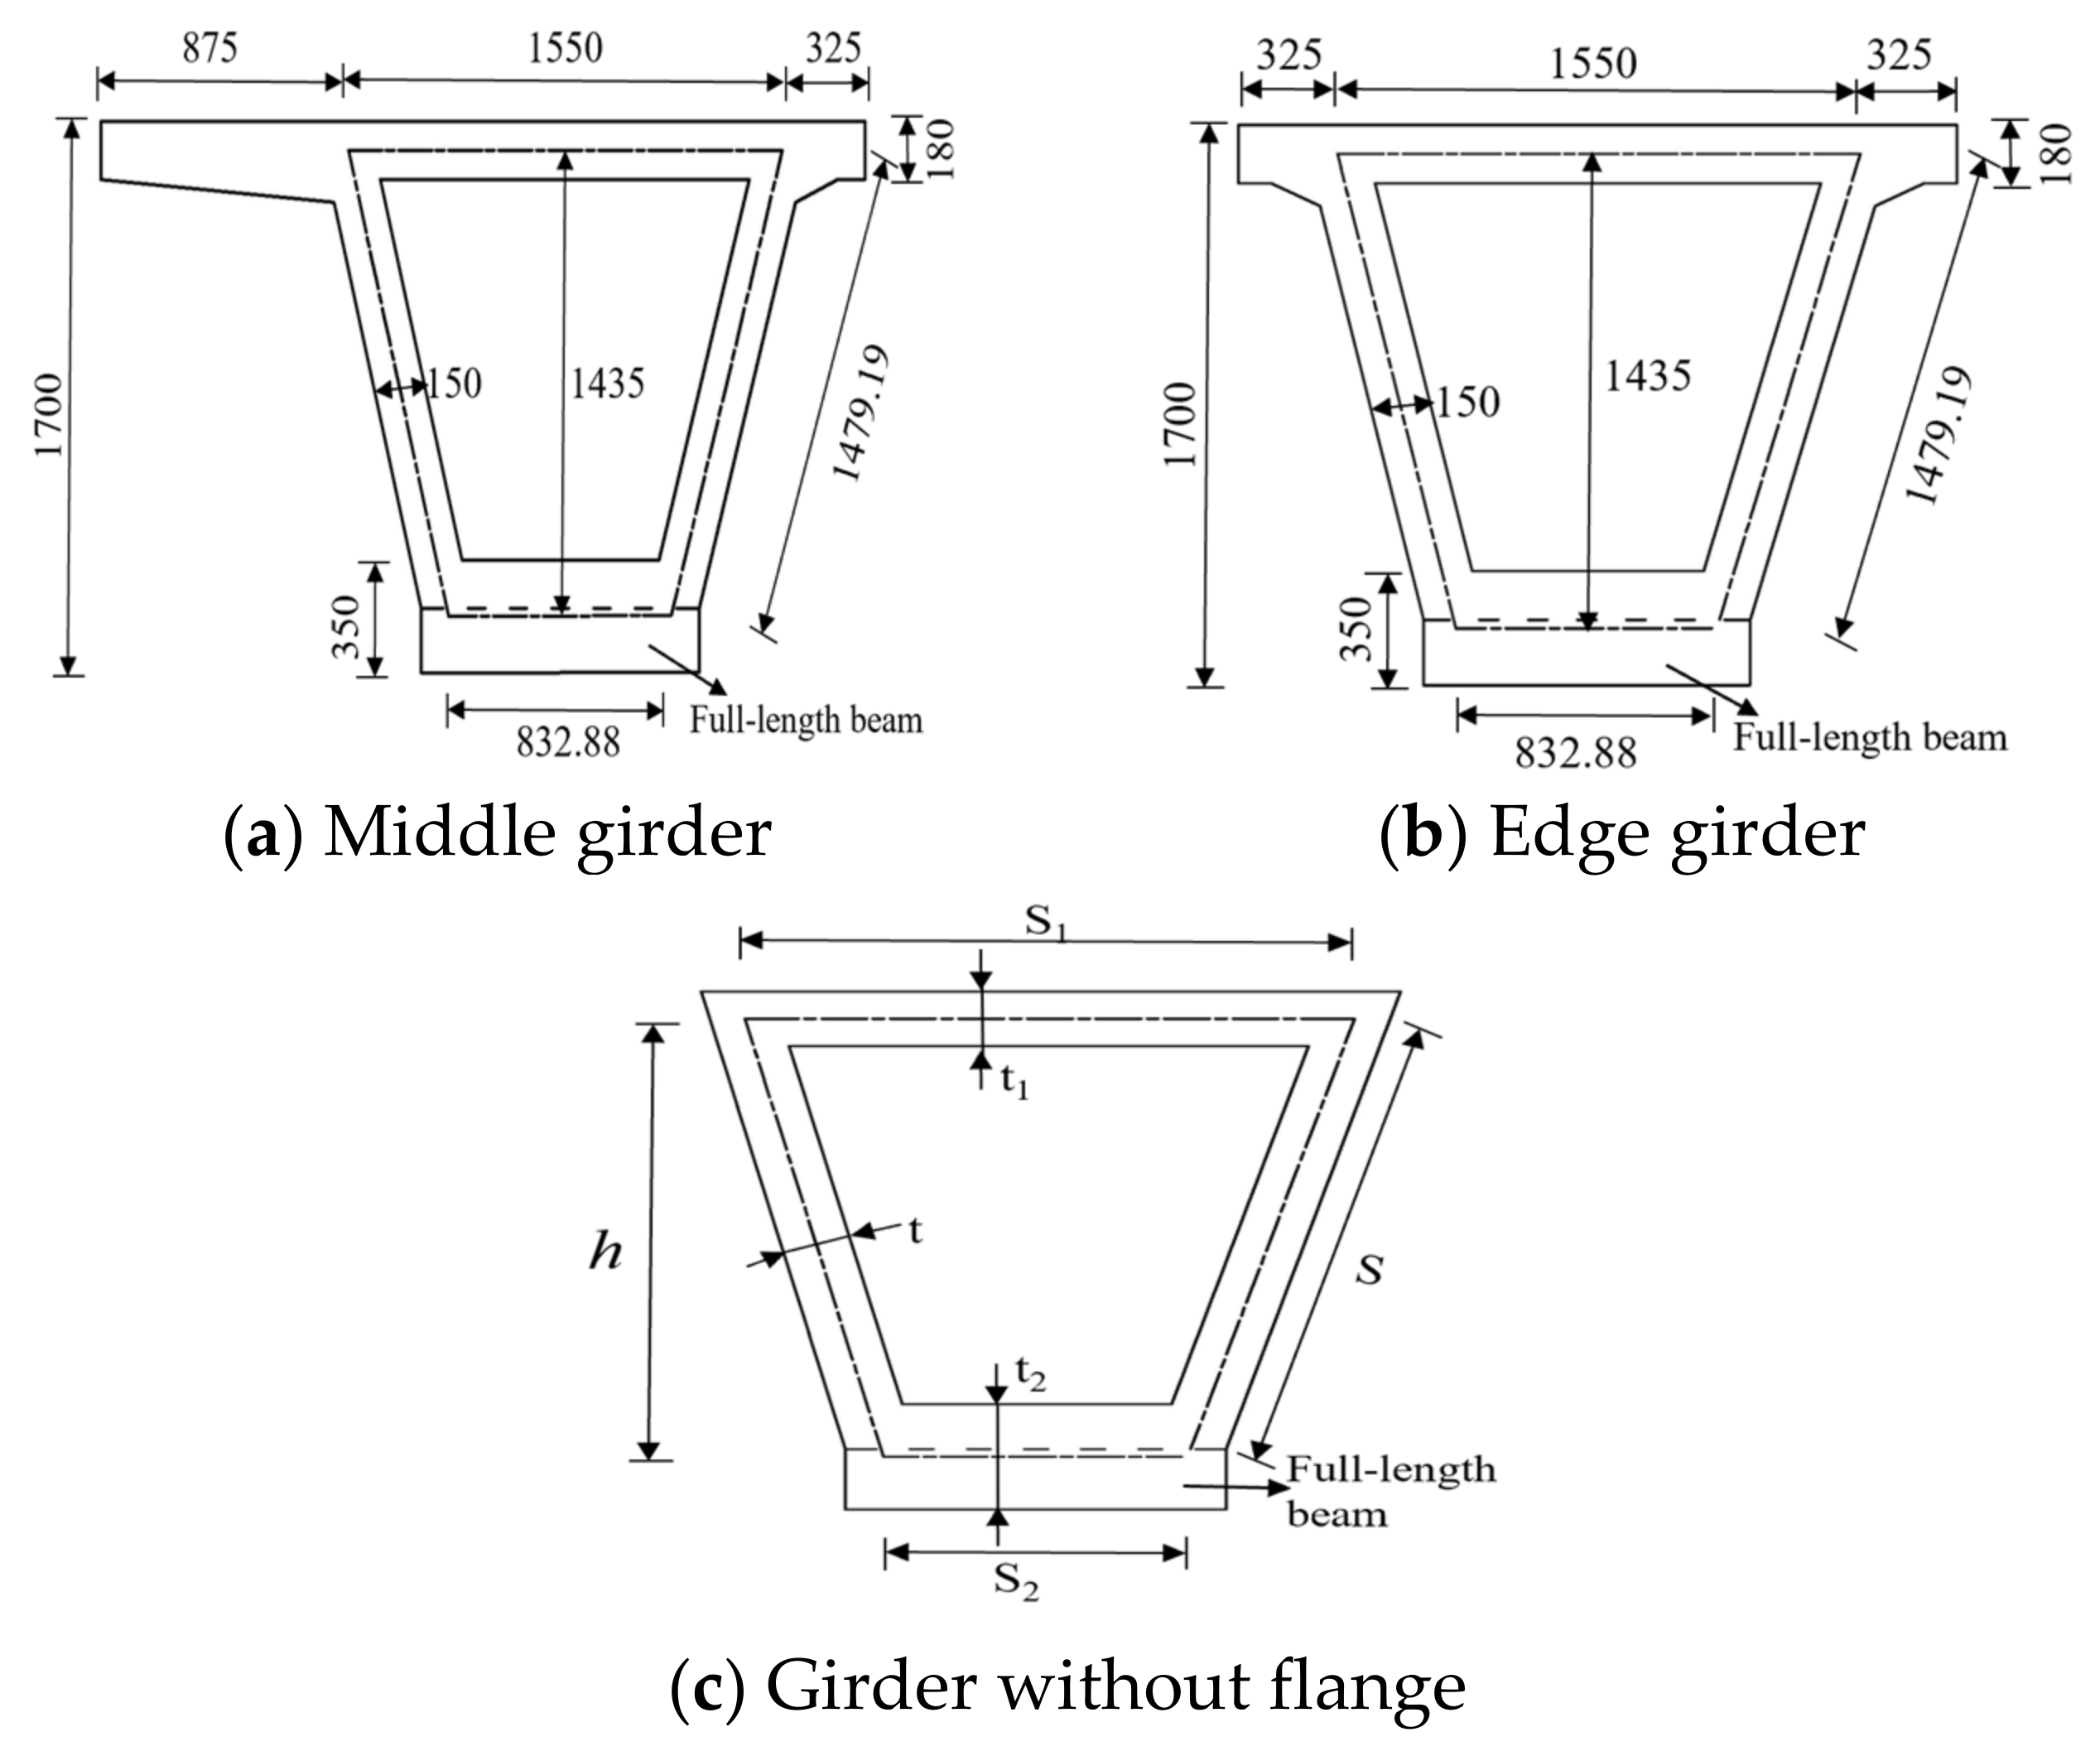
Using MIDAS Civil, the moment of inertia of the cross-sections of the side and middle girders was calculated. The influence of the flange plate on the torsional moment of inertia of the box girder section is negligible and can be ignored in calculations. The closed section part can be calculated using Equation (3) [48], and the simplified cross-sections of the side girders and middle girders are shown in Figure 12a,b.
I T = s 1 + s 2 2 h 2 1 2 s t + s 1 t 1 + s 2 t 2
where t and s are the thickness and length of the web plate of the girder; t 1 and s 1 are the thickness and length of the top plate of the main beam; and t 2 and s 2 are the thickness and length of the bottom plate of the girder, and are the distance from the center line of the top plate to the center line of the bottom plate.
After calculation, the geometric properties of the side and middle girder sections differ by less than 1%. Therefore, calculations are performed assuming identical cross-sections for each main girder section. The following analysis focuses on the middle girder section, represented by the simplified cross-section in Figure 12c.
The ratio of the bending stiffness of the main girder to the slab, denoted as the stiffness ratio coefficient β, can be calculated using Equation (4). The ratio of the bending stiffness to the torsional stiffness of the main girder, represented by the coefficient γ, may be determined using Equation (5) [49]. A schematic of the main girder under force is depicted in Figure 13a, where a sinusoidal force is assumed to be applied to the wet joint. According to the principle of virtual work, the sum of the virtual work corresponding to the bending moments and shear forces at each cross-section within the main girder is equal to the virtual work of the external load under the assumed displacement field. The maximum force occurs at the mid-span section, where the integral of all internal forces over infinitesimal virtual displacements equals the integral of the external force over virtual displacements, reflecting the equilibrium of forces at the mid-span section under load, as shown in Figure 13b. The force applied to the left side of the main girder can be replaced by an equivalent force and moment applied at the centroid of the section, as illustrated in Figure 13c. φ and ϖ represent the rotation and deflection, respectively, under this loading condition.
β = 4 d 1 3 E h 1 3 l 4 π 4 E I 390 I l 4 d 1 h 1 3
In Equation (4), I represents the section moment of inertia, l denotes the main beam span, and h 1 stands for the thickness of the flange plate. For flange plates with variable thickness, the thickness at a distance d 1 / 3 from the beam rib can be taken, and d 1 represents the overhang length of the flange plate.
γ = b 2 φ ω = b 2 P b l 2 2 π 2 G I T P l 4 π 4 E I = π 2 E I 4 G I T b l 2 5.8 I I T b l 2
where φ , ϖ , and b , respectively, represent the deflection, rotation, and width of the section. I T is the torsional moment of inertia of the section. E is the elastic modulus, and G is the shear modulus.
According to the rigid plate (beam) method and the hinge plate (beam) method, referring to Appendix A (Table A1 and Table A2) [48,49], the lateral distribution influence line values at the mid-span section of the girder are calculated using linear interpolation. Taking Girder-1 as an example, Table 8 and Table 9 present the calculation results for the two methods.
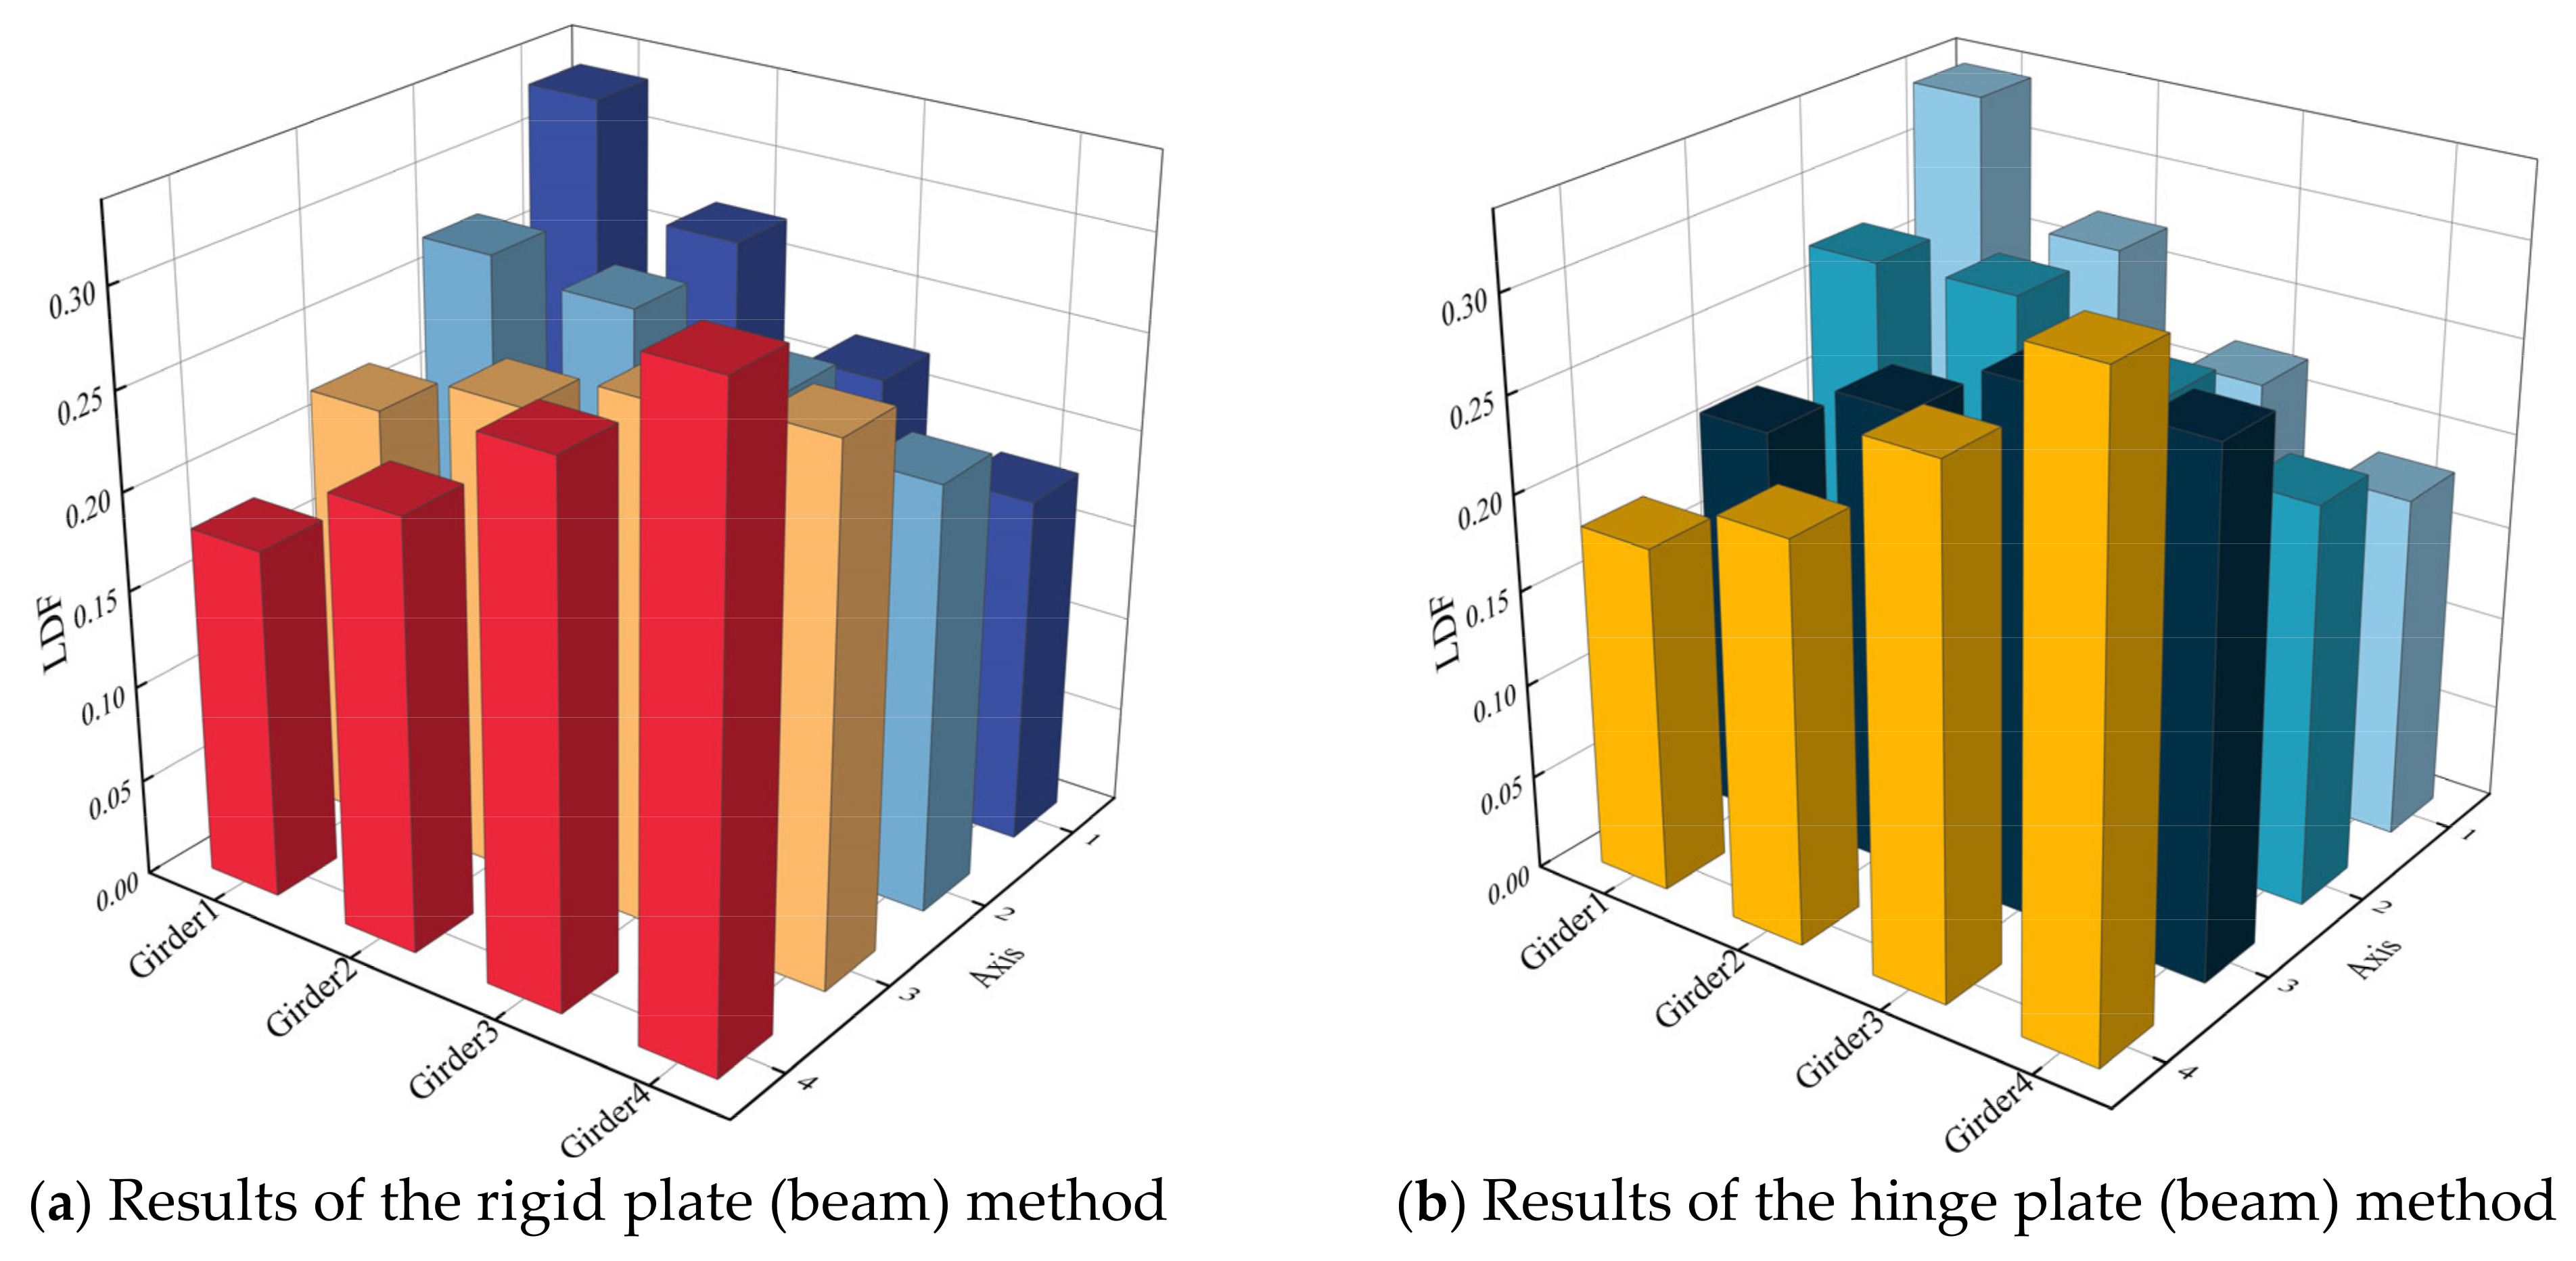
Figure 14 shows the LDF of the mid-span section of each girder calculated using the two methods. The comparison shows that the LDF calculated using the rigid plate (beam) method and the hinged plate (beam) method is not much different when each girder exerts a unit concentrated force in the mid-span position. The maximum relative errors for Girder-1 and -3 are 4.09% and 3.79%, respectively, both occurring when a unit concentrated load is applied at the mid-span of Girder-3. Similarly, for Girder-2 and -4, the maximum relative errors are 4.52% and 4.09%, respectively, when the load is applied at the mid-span of Girder-4. Due to the structural symmetry between Girder-3 and -4 and Girder-1 and -2, the LDF exhibits this characteristic.

5.2.2. FE Method

The finite element method is suitable for structures with complex geometry and a significant nonlinearity of materials, but the modeling is complicated, and convergence is difficult. Based on deflection, Chen and Yang [33] proposed a method to calculate the LDF, as shown in Equation (6).
f i = y i 1 n y i
where f i represents the LDF for each main girder, y i denotes the deflection value of each main girder, and n represents the number of girders.
As shown in Figure 15, the LDF variation trend in each main beam after reinforcement is consistent, and the peak value of the LDF curve of each main beam decreases compared with that before reinforcement. Specifically, for Girder-1, -2, and -3, the LDF decreased after reinforcement, while for Girder-4, the LDF increased after reinforcement.
For the CFSTT reinforcement method, the improvement effect of improving the steel pipe wall strength on the LDF is better than that of improving the strength grade of the concrete. In particular, when the steel pipe with yield strength grades of 420 MPa is filled with concrete with a compressive strength of 50 MPa for CFSTT reinforcement, the LDF of Girder-1 decreases by 4.39% compared with that before reinforcement, while the LDF of Girder-4 increases by 11.57%. This change indicates that the CFSTT reinforcement method effectively improves the integrity of the bridge and the uniformity of load distribution by enhancing the transverse connection of the bridge. In contrast, when the steel pipe with yield strength grades of 235 MPa is filled with concrete with compressive strength grades of 50 MPa, the LDF of Girder-1 decreases by 2.95%, and the LDF of Girder-4 increases by 7.31%, showing that the steel pipe wall strength has an important influence on the reinforcement effect.
In addition, although the improvement effect of adding a diaphragm on the PCB bridge load distribution is not as good as that of CFSTT reinforcement, the reinforcement effect of a steel diaphragm is still better than that of a concrete diaphragm. For example, under the reinforcement of a steel diaphragm with a thickness of 30 mm and a yield strength grade of 325 MPa, the LDF of Girder-1 is reduced by 4.39% compared with that before reinforcement, while the LDF of Girder-4 is increased by 9.54%. The LDF of Girder-1 decreased by 3.69%, and the LDF of Girder-4 increased by 7.77% for the reinforcement of the 500 mm thick concrete diaphragm with compressive strength grades of 50 MPa. This phenomenon reveals that steel has better flexural properties than concrete, which can more effectively raise the local stiffness of PCB bridges, thus improving load distribution. Therefore, it can be concluded that the CFSTT reinforcement method provides a higher lateral load capacity for the bridge by adjusting the strength of the steel pipe wall and the concrete, and the reinforcement effect of the steel diaphragm emphasizes the key role of material properties in bridge reinforcement.

5.3. Maximum Stress and Strain

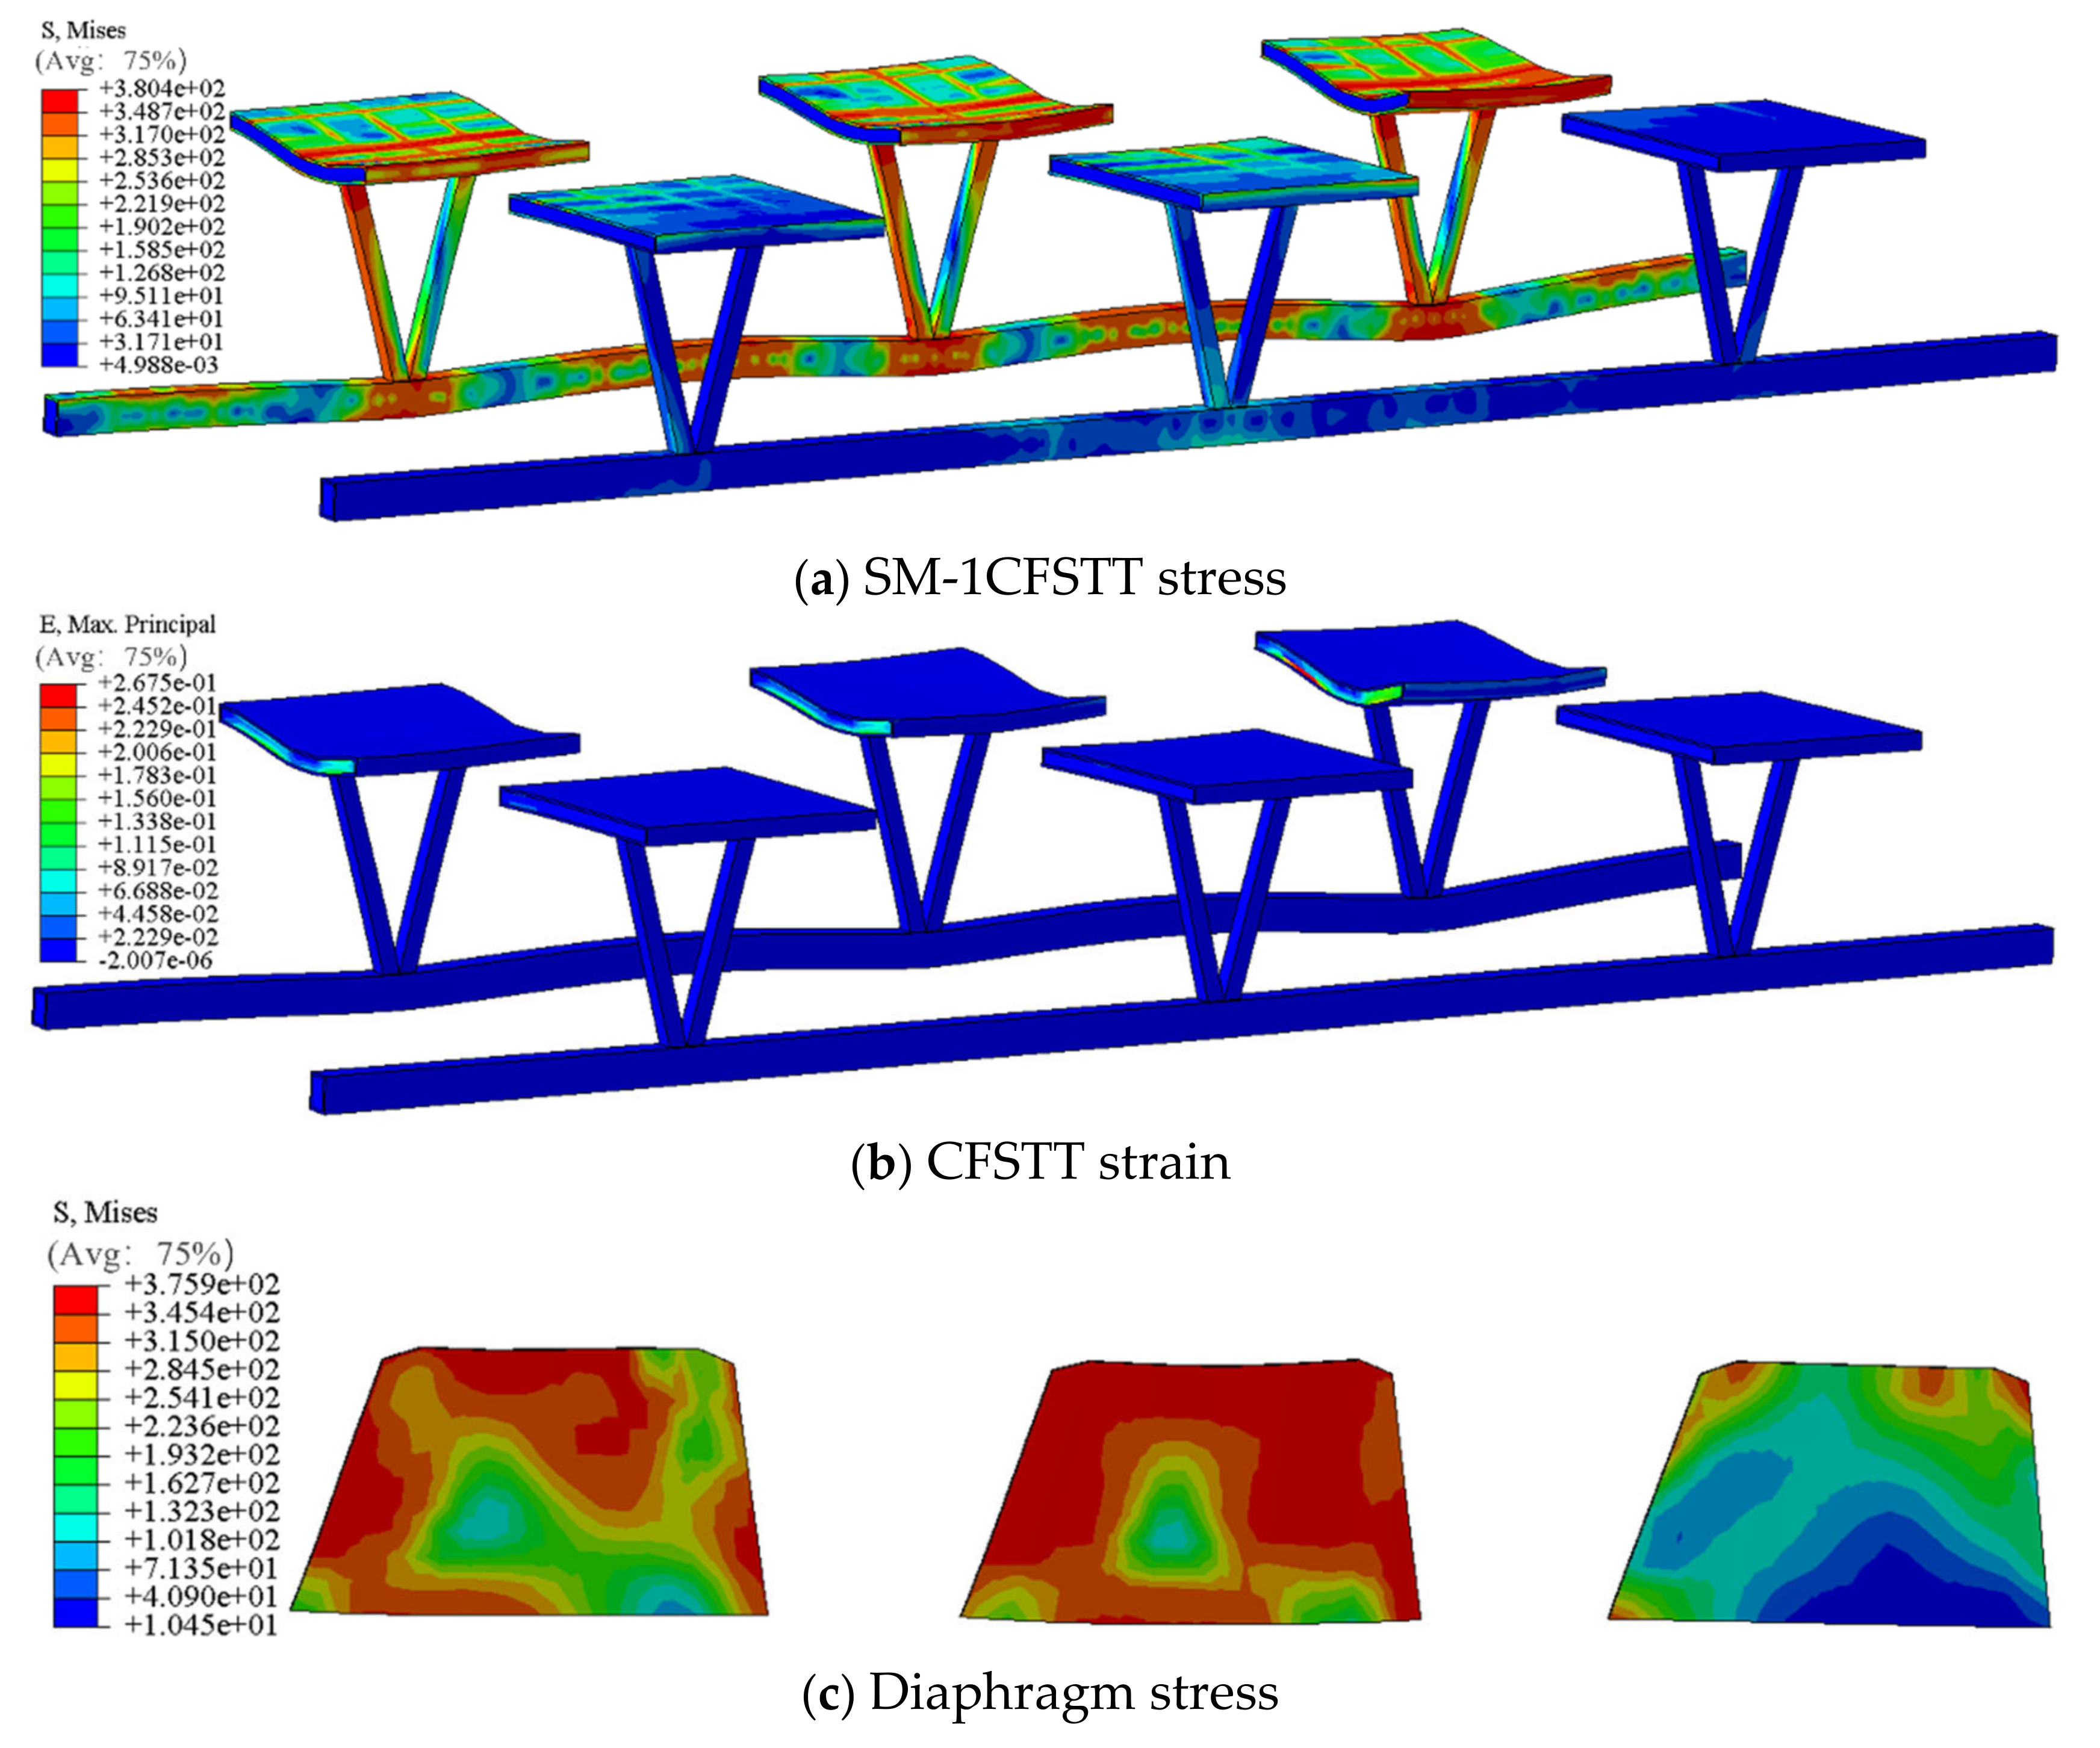
Figure 16 shows the maximum stress and strain results of CFSTTs and diaphragms under the double deformation coefficient in various models.
Figure 16a,b illustrate the stress–strain distribution within the CFSTTs of Model SM-1. Notably, significant stress concentrations are observed at the CFSTT nodes and along the bottom flanges, with peak stress values reaching approximately 3.804 × 10² MPa. This exceeds the yield strength of 235 MPa for the steel material utilized in the CFSTT of SM-1, indicating a transition into the post-elastic regime. In this phase, the stress–strain relationship deviates from proportionality, with the material undergoing plastic deformation. Despite these local plastic deformations, the overall stress distribution across the structure remains relatively uniform under load. This uniformity can be attributed to the composite action of concrete and steel in the CFSTT, leveraging the high strength of concrete and the confining effect of the steel tube. These attributes endow the CFSTT with commendable deformability and residual strength even at high stress levels. The maximum principal strain plots further delineate the deformation trends throughout the loading process, with the overall maximum strain values remaining at low levels, substantiating the CFSTT’s elastic behavior and ductility.
In contrast, Figure 16c,d depict the stress–strain response of the diaphragms in Model SM-6. Compared to the CFSTTs, the diaphragms exhibit pronounced stress concentrations at the junctions with the box beams, with maximum stress values of 3.759 × 10² MPa, surpassing the 325 MPa yield strength of the steel used in the diaphragms of SM-6. Such stress concentrations may indicate potential zones of fatigue damage, warranting design considerations to mitigate long-term performance and safety concerns. Unlike the CFSTTs, the diaphragms’ response in the post-elastic phase could be more susceptible to stress concentration-induced plastic deformation, potentially impacting the structure’s durability. The maximum principal strain plot in Figure 16d elucidates the overall deformation characteristics of the diaphragms during reinforcement, demonstrating their effectiveness in restricting the lateral displacement of the PCB bridge and enhancing the structure’s lateral stiffness. However, this enhancement in stiffness must be balanced against the plastic deformation capacity of the diaphragms in the post-elastic phase to ensure structural reliability under sustained loading.
In summary, the CFSTT demonstrates a superior performance in the reinforcement of PCB bridges. Its post-elastic behavior is characterized by excellent mechanical properties, with plastic deformation capabilities that facilitate load absorption and distribution and a more effective lateral force transmission. This performance contributes to a reduced risk of damage due to localized stress concentrations. In comparison, the post-elastic response of diaphragms necessitates more nuanced design considerations to prevent potential damage from stress concentrations.

6. Conclusions

In this paper, the application effect of diaphragms and CFSTTs in strengthening PCB bridges was studied in depth, and the influence of different reinforcement parameters on the deflection and load distribution of PCB bridges was compared and analyzed; additionally, the maximum stress and strain of CFSTTs on the transverse partition was analyzed. It provides some references for the design of diaphragm- and CFSTT-reinforced PCB bridges and helps choose a more suitable reinforcement strategy. The following conclusions were drawn:
(1)
Both diaphragm and CFSTTs can improve the lateral connection and load distribution of PCB bridges, reducing the deflection of main girders. After reinforcement, the main girders tend to cooperate more effectively in load sharing. Comparatively, the CFSTT reinforcement method demonstrates better effectiveness than adding diaphragms, especially in significantly reducing main girder deflections by enhancing the strength of steel tube walls. When steel pipes with yield strength grades of 235 MPa and 420 MPa are used to fill concrete with compressive strength grades of 50 MPa, the maximum deflection of the main girders decreased by 15.32% and 24.55%, respectively. The maximum improvement in LDF for the main girders was 7.31% and 11.57%.
(2)
The reinforcement effect of steel diaphragms is superior to that of concrete diaphragms, and the reduction in deflection is proportional to the thickness of the diaphragms. When using concrete transverse diaphragms, the deflection reduction in Girder-1 was 8.72% and 18.82% for diaphragm thicknesses of 100 mm and 500 mm, respectively. When the thickness of steel diaphragms was 10 mm and 30 mm, the deflection of Girder-1 decreased by 12.73% and 21.8%, respectively.
(3)
Treating CFSTTs as a midspan diaphragm, there is little difference in the calculated LDF between the hinged plate (beam) method and the rigidly connected plate (beam) method under unit load. From the perspective of maximum stress and strain, CFSTTs have significant advantages in stress dispersion and deformation control compared with traditional diaphragms.
(4)
In addition, when selecting a reinforcement strategy, it is important not only to optimize the material properties of the reinforcement technology for optimal reinforcement results but also to comprehensively evaluate the economic impacts, practical challenges, and other factors associated with implementing the reinforcement program. The reinforcement effects of traffic loads and different load combinations need to be further studied.
(5)
By comparing strain and deflection values from load tests on a PCB bridge, the reliability of the finite element model is verified. Therefore, this finite element model can be used to effectively study the reinforcement effects of lateral reinforcement methods on PCB bridges.

Author Contributions

Conceptualization, P.L., C.Y. and F.X.; data curation, P.L., C.Y. and F.X.; methodology, P.L., C.Y., F.X., J.L. and D.J.; resources, C.Y., F.X. and D.J.; supervision, C.Y., F.X. and D.J.; writing—original draft, P.L., F.X. and D.J., writing—review and editing, P.L., F.X. and D.J. All authors have read and agreed to the published version of the manuscript.

Funding

This research was funded by the National Natural Science Foundation of China (52078122) and the Hunan University Teaching Reform Research Project (2023JGYB118).

Data Availability Statement

The datasets generated and analyzed during the current study are available from the corresponding author on reasonable request.

Conflicts of Interest

The authors declare no conflicts of interest.

Appendix A

Table A1. Four beam G η table of the influence of the line of loading lateral distribution on rigid joint plates and rigid bridges.
Beam β γ The Unit Load Acts on the Axis of the Beam
1234
1#0.0010.02294283234209
0.04329274222176
0.0030.02299263230208
0.04334273218175
2#0.0010.02263257246234
0.04274261243222
0.0030.02263261246230
0.04273266243218
Note: The median value of the table is three digits after the decimal point; for example, 294 is 0.294.
Table A2. Four beam Jy table of the influence of the line of loading on the lateral distribution of hinged plates and hinged bridges.
Beam γ The Unit Load Acts on the Axis of the Beam
1234
1#0.02300263227210
0.04341273208178
2#0.02263264246227
0.04273276243208
Note: The median value of the table is three digits after the decimal point; for example, 300 is 0.300.

References

  1. Sun, Y.; Xu, D.; Chen, B.; Xu, F.-Y.; Zhu, H.-P. Three-dimensional reinforcement design method and program realization for prestressed concrete box-girder bridges based on a specific spatial lattice grid model. Eng. Struct. 2018, 175, 822–846. [Google Scholar] [CrossRef]
  2. Duan, M.; Miao, J.; Wu, J.; Dong, F. Reliability Assessment Approach for Fire Resistance Performance of Prestressed Steel–Concrete Box Girder Bridges. Fire 2023, 6, 472. [Google Scholar] [CrossRef]
  3. Yuan, J.; Luo, L.; Zheng, Y.; Yu, S.; Shi, J.; Wang, J.; Shen, J. Analysis of The Working Performance of Large Curvature Prestressed Concrete Box Girder Bridges. Materials 2022, 15, 5414. [Google Scholar] [CrossRef]
  4. Wei, Y.; Zhang, Y.; Zhou, F.; Liu, Z. Effect of frame stiffness calculation method on the analysis of distortion effect of box girder. J. Southeast Univ. (Nat. Sci. Ed.) 2024, 54, 423–431. [Google Scholar]
  5. Li, Y.; Yu, Z.; Liu, Y. Experimental and Numerical Study of the Ultimate Flexural Capacity of a Full-Size Damaged Prestressed Concrete Box Girder Strengthened with Bonded Steel Plates. Materials 2023, 16, 2476. [Google Scholar] [CrossRef]
  6. Nettis, A.; Nettis, A.; Ruggieri, S.; Uva, G. Corrosion-induced fragility of existing prestressed concrete girder bridges under traffic loads. Eng. Struct. 2024, 314, 118302. [Google Scholar] [CrossRef]
  7. Cao, G.; Shen, J.; Yang, L.; Li, K.; Li, Z. Experimental and Modeling Study on Long-Term Deformation of Three-Span Prestressed Concrete Continuous Box-Girder Bridge Model after Cracking. J. Bridge Eng. 2024, 29. [Google Scholar] [CrossRef]
  8. Liu, H.; Li, J.; Zhang, J.; Pang, D. Decision Analysis of a Reinforcement Scheme for In-Service Prestressed Concrete Box Girder Bridges Based on AHP and Evaluation of the Reinforcement Effect. Buildings 2022, 12, 1771. [Google Scholar] [CrossRef]
  9. Hu, Z.; Li, X.; Shah, Y.I. Simplified Method for Lateral Distribution Factor of the Live Load of Prefabricated Concrete Box-Girder Bridges with Transverse Post-tensioning. KSCE J. Civ. Eng. 2022, 26, 3460–3470. [Google Scholar] [CrossRef]
  10. Li, L.; Ma, J.-Z. Effect of Intermediate Diaphragms on Decked Bulb-Tee Bridge System for Accelerated Construction. J. Bridge Eng. 2010, 15, 715–722. [Google Scholar] [CrossRef]
  11. Zhang, K.; Qi, T.; Li, D.; Xue, X.; Wu, F.; Liu, X. Research on innovative reinforcement of prestressed T-beam bridge. Int. J. Struct. Integr. 2021, 12, 922–937. [Google Scholar] [CrossRef]
  12. Shi, J.; Chen, Z. Research on the Rationality of Setting the Transverse Ribs of Large Cantilever Segmental Prefabricated Box Girders. Buildings 2023, 13, 1873. [Google Scholar] [CrossRef]
  13. Lee, J.; Kim, S.; Kang, Y.J. Improved design of intermediate diaphragm spacing in horizontally curved steel box bridges. J. Constr. Steel Res. 2022, 198, 107488. [Google Scholar] [CrossRef]
  14. Jeonghwa, L.; Seungjun, K.; Jong, Y.K. Effect of cross-sectional rigidity on intermediate diaphragm spacing of steel-box girder bridges. J. Constr. Steel Res. 2022, 188, 107006. [Google Scholar]
  15. Ahmad, I.W.; Ibrahim, I.S.; Padil, K.H.; Umar, S.; Lee, H.S.; Singh, J.K. Numerical analysis on the effect of the intermediate diaphragm on the concrete bridge to the acceleration and frequency under moving load. IOP Conf. Ser. Earth Environ. Sci. 2023, 1135, 012045. [Google Scholar]
  16. Tsiptsis, N.I.; Sapountzaki, E.O. Analysis of composite bridges with intermediate diaphragms & assessment of design guidelines. Comput. Struct. 2020, 234, 106252. [Google Scholar]
  17. Yang, C.-Q.; Du, W.-P.; Hou, P.; Zhu, F.-W.; Chen, Y.-J.; Ma, C.-J.; Pan, Y.; Zhang, H.-L. Adding composite truss to improve mechanical properties of reinforced concrete T-girder bridge. Adv. Struct. Eng. 2022, 25, 2058–2207. [Google Scholar] [CrossRef]
  18. Hou, P.; Yang, J.; Pan, Y.; Ma, C.-J.; Du, W.-P.; Yang, C.-Q.; Zhang, Y. Experimental and simulation studies on the mechanical performance of concrete T-Girder bridge strengthened with K-Brace composite trusses. Structures 2022, 43, 479–492. [Google Scholar] [CrossRef]
  19. Hou, P.; Yang, C.Q.; Yang, J.; Pan, Y.; Li, P.; Du, W.-P. Fatigue Life of Composite Truss Used to Strengthen the Prestressed Concrete Box Girder Bridge: A Case Study. J. Perform. Constr. Facil. 2024, 38, 04024032. [Google Scholar] [CrossRef]
  20. Chen, C.; Yang, C.-Q.; Zhang, K.; Wang, W.; Dong, L. Structural Behavior and Load Distribution Factor of a T-Girder Bridge with Various Truss Diaphragms. J. Bridge Eng. 2023, 28, 04023094. [Google Scholar] [CrossRef]
  21. Niu, Y.; Liu, B.; Zhao, Y.; Rong, S.; Huang, P. Diaphragm damage of precast concrete T-shape girder bridge: Analysis and strengthening. Open Civ. Eng. J. 2014, 8, 396–405. [Google Scholar] [CrossRef]
  22. ABAQUS. User’s Manual, version 6.13; ABAQUS, Inc.: Providence, RI, USA, 2022. [Google Scholar]
  23. JTG D60-2004; General Code for Design of Highway Bridges and Culverts. The Ministry of Construction of the People’s Republic of China: Beijing, China, 2004.
  24. GB/T 50081-2002; Standard for Test Methods for Mechanical Properties of Ordinary Concrete. The Ministry of Construction of the People’s Republic of China: Beijing, China, 2002.
  25. Li, X. Parametric study on numerical simulation of missile punching test using concrete damaged plasticity (CDP) model. Int. J. Impact Eng. 2020, 144, 103652. [Google Scholar] [CrossRef]
  26. Lubliner, J.; Oliver, J.; Oller, S.; Oñate, E. Aplastic-damage Model for Concrete. Int. J. Solids Struct. 1989, 25, 299–326. [Google Scholar] [CrossRef]
  27. Jia, Y.; Chiang, J.C.L. Finite Element Analysis of Punching Shear of Reinforced Concrete Slab–Column Connections with Shear Reinforcement. Appl. Sci. 2022, 12, 9584. [Google Scholar] [CrossRef]
  28. EC Standardization EN 1992-1-2; Design of Concrete Structures—Part 1-2: General Rules—Structural Fire Design. European Commission: Brussels, Belgium, 1992.
  29. GB 50010-2010; Code for Design of Concrete Structures. The Concrete Society: Surrey, UK, 2010.
  30. Hou, P.; Yang, C.-Q.; Yang, J.; Pan, Y. Study on the Mechanical Performance of the Xiuzhen River Bridge Strengthened Using K-brace Composite Trusses. KSCE J. Civ. Eng. 2024, 28, 860–872. [Google Scholar] [CrossRef]
  31. Chen, C.; Yang, C.-Q. Experimental and Simulation Studies on the Mechanical Performance of T-Girder Bridge Strengthened with Transverse Connection. J. Perform. Constr. Facil. 2019, 33, 04019055. [Google Scholar] [CrossRef]
  32. Chen, C.; Yang, C.-Q.; Pan, Y.; Zhang, H.-L.; De Backer, H. Simulation and design considerations 410 on transverse connection of prestressed concrete T-girder bridge. Int. J. Steel Struct. 2021, 21, 1182–1196. [Google Scholar] [CrossRef]
  33. Chen, C.; Yang, C.-Q.; Pan, Y.; Zhang, H.-L.; De Backer, H. Parameters analysis and design of 413 transverse connection strengthening prestressed concrete T-girder bridge. Struct. Concret. 2021, 22, 3385–3395. [Google Scholar] [CrossRef]
  34. Transportation, Ministry of Expertise, National Commission, etc. General Drawings of Highway Bridges (Plate Beam Series, Box Beam Series); China Communication Press: Beijing, China, 2014. [Google Scholar]
  35. Labib, S.N.; El-Salakawy, E.F. Finite-Element Analysis of Adjacent Concrete Box Girders Transversely Post-Tensioned at the Top Flanges Only. CivilEng 2022, 3, 165–183. [Google Scholar] [CrossRef]
  36. Li, X.; Hu, Z.; Shah, Y.I. Transverse Connection Performance of Prefabricated PC Box Girder Bridge with Transverse Prestress. Int. J. Civ. Eng. 2022, 20, 957–966. [Google Scholar] [CrossRef]
  37. Deng, Y.; Li, A.Q.; Zhang, Y.L.; Li, Y.H. Analysis on seismic performance of novel prefabricated pin-shaft concrete beam-column joints. J. Southeast Univ. 2022, 53, 461–470. [Google Scholar]
  38. Vu, Q.V.; Thai, D.K.; Kim, S.E. Effect of intermediate diaphragms on the load–carrying capacity of steel–concrete composite box girder bridges. Thin-Walled Struct. 2018, 122, 230–241. [Google Scholar] [CrossRef]
  39. Du, L.; Qi, J.; Cheng, Z.; Wang, J. Finite element modeling of UHPC slabs with dovetail joints and steel wire mesh using an innovative interfacial treating method. Structures 2022, 37, 745–755. [Google Scholar] [CrossRef]
  40. JTG/T J21-01-2015; Load Test Code for Highway Bridges. The Ministry of Construction of the People’s Republic of China: Beijing, China, 2015.
  41. Zu, J.-H. Research on the Influence of Beeline and Skew Multi-Shaped Beam Bridge’s Diaphragm Thickness to Its Static and Dynamic Performance. Master’s Thesis, Southwest Jiao Tong University, Chengdu, China, 2015. [Google Scholar]
  42. Highway Planning and Design Institute of the Ministry of Communications. Design Code for Highway Reinforced Concrete and Prestressed Concrete Bridge and Culvert JTJ023-85; China Communications Press: Beijing, China, 2002. [Google Scholar]
  43. AASHTO. Standard Specification for Highway Bridges; AASHTO: Washington, DC, USA, 2002. [Google Scholar]
  44. Armenàkas, E.A. Advanced Mechanics of Materials and Applied Elasticity; CRC Press: Boca Raton, FL, USA, 19 April 2016. [Google Scholar]
  45. Mahmoud, J.; Semih, E. Optimization of prestressed concrete bridge girder section using a modified harmony search algorithm. Structures 2022, 46, 625–636. [Google Scholar]
  46. Li, J.-W. Research on Transverse Load Distribution of Prestressed Concrete Small Box Girder Bridge. Master’s Thesis, Xi’an University of Technology, Xi’an, China, 2020. [Google Scholar]
  47. Zhang, J. Research on Transverse Distribution Coefficient of Bridge Load. Master’s Thesis, Wuhan University of Technology, Wuhan, China, 2011. [Google Scholar]
  48. Li, G.-H.; Shi, D. Calculation of Transverse Distribution of Highway Bridge Load; China Communications Press: Beijing, China, 1987. [Google Scholar]
  49. Yao, L. Bridge Engineering; People’s Communications Press: Beijing, China, 1985. [Google Scholar]
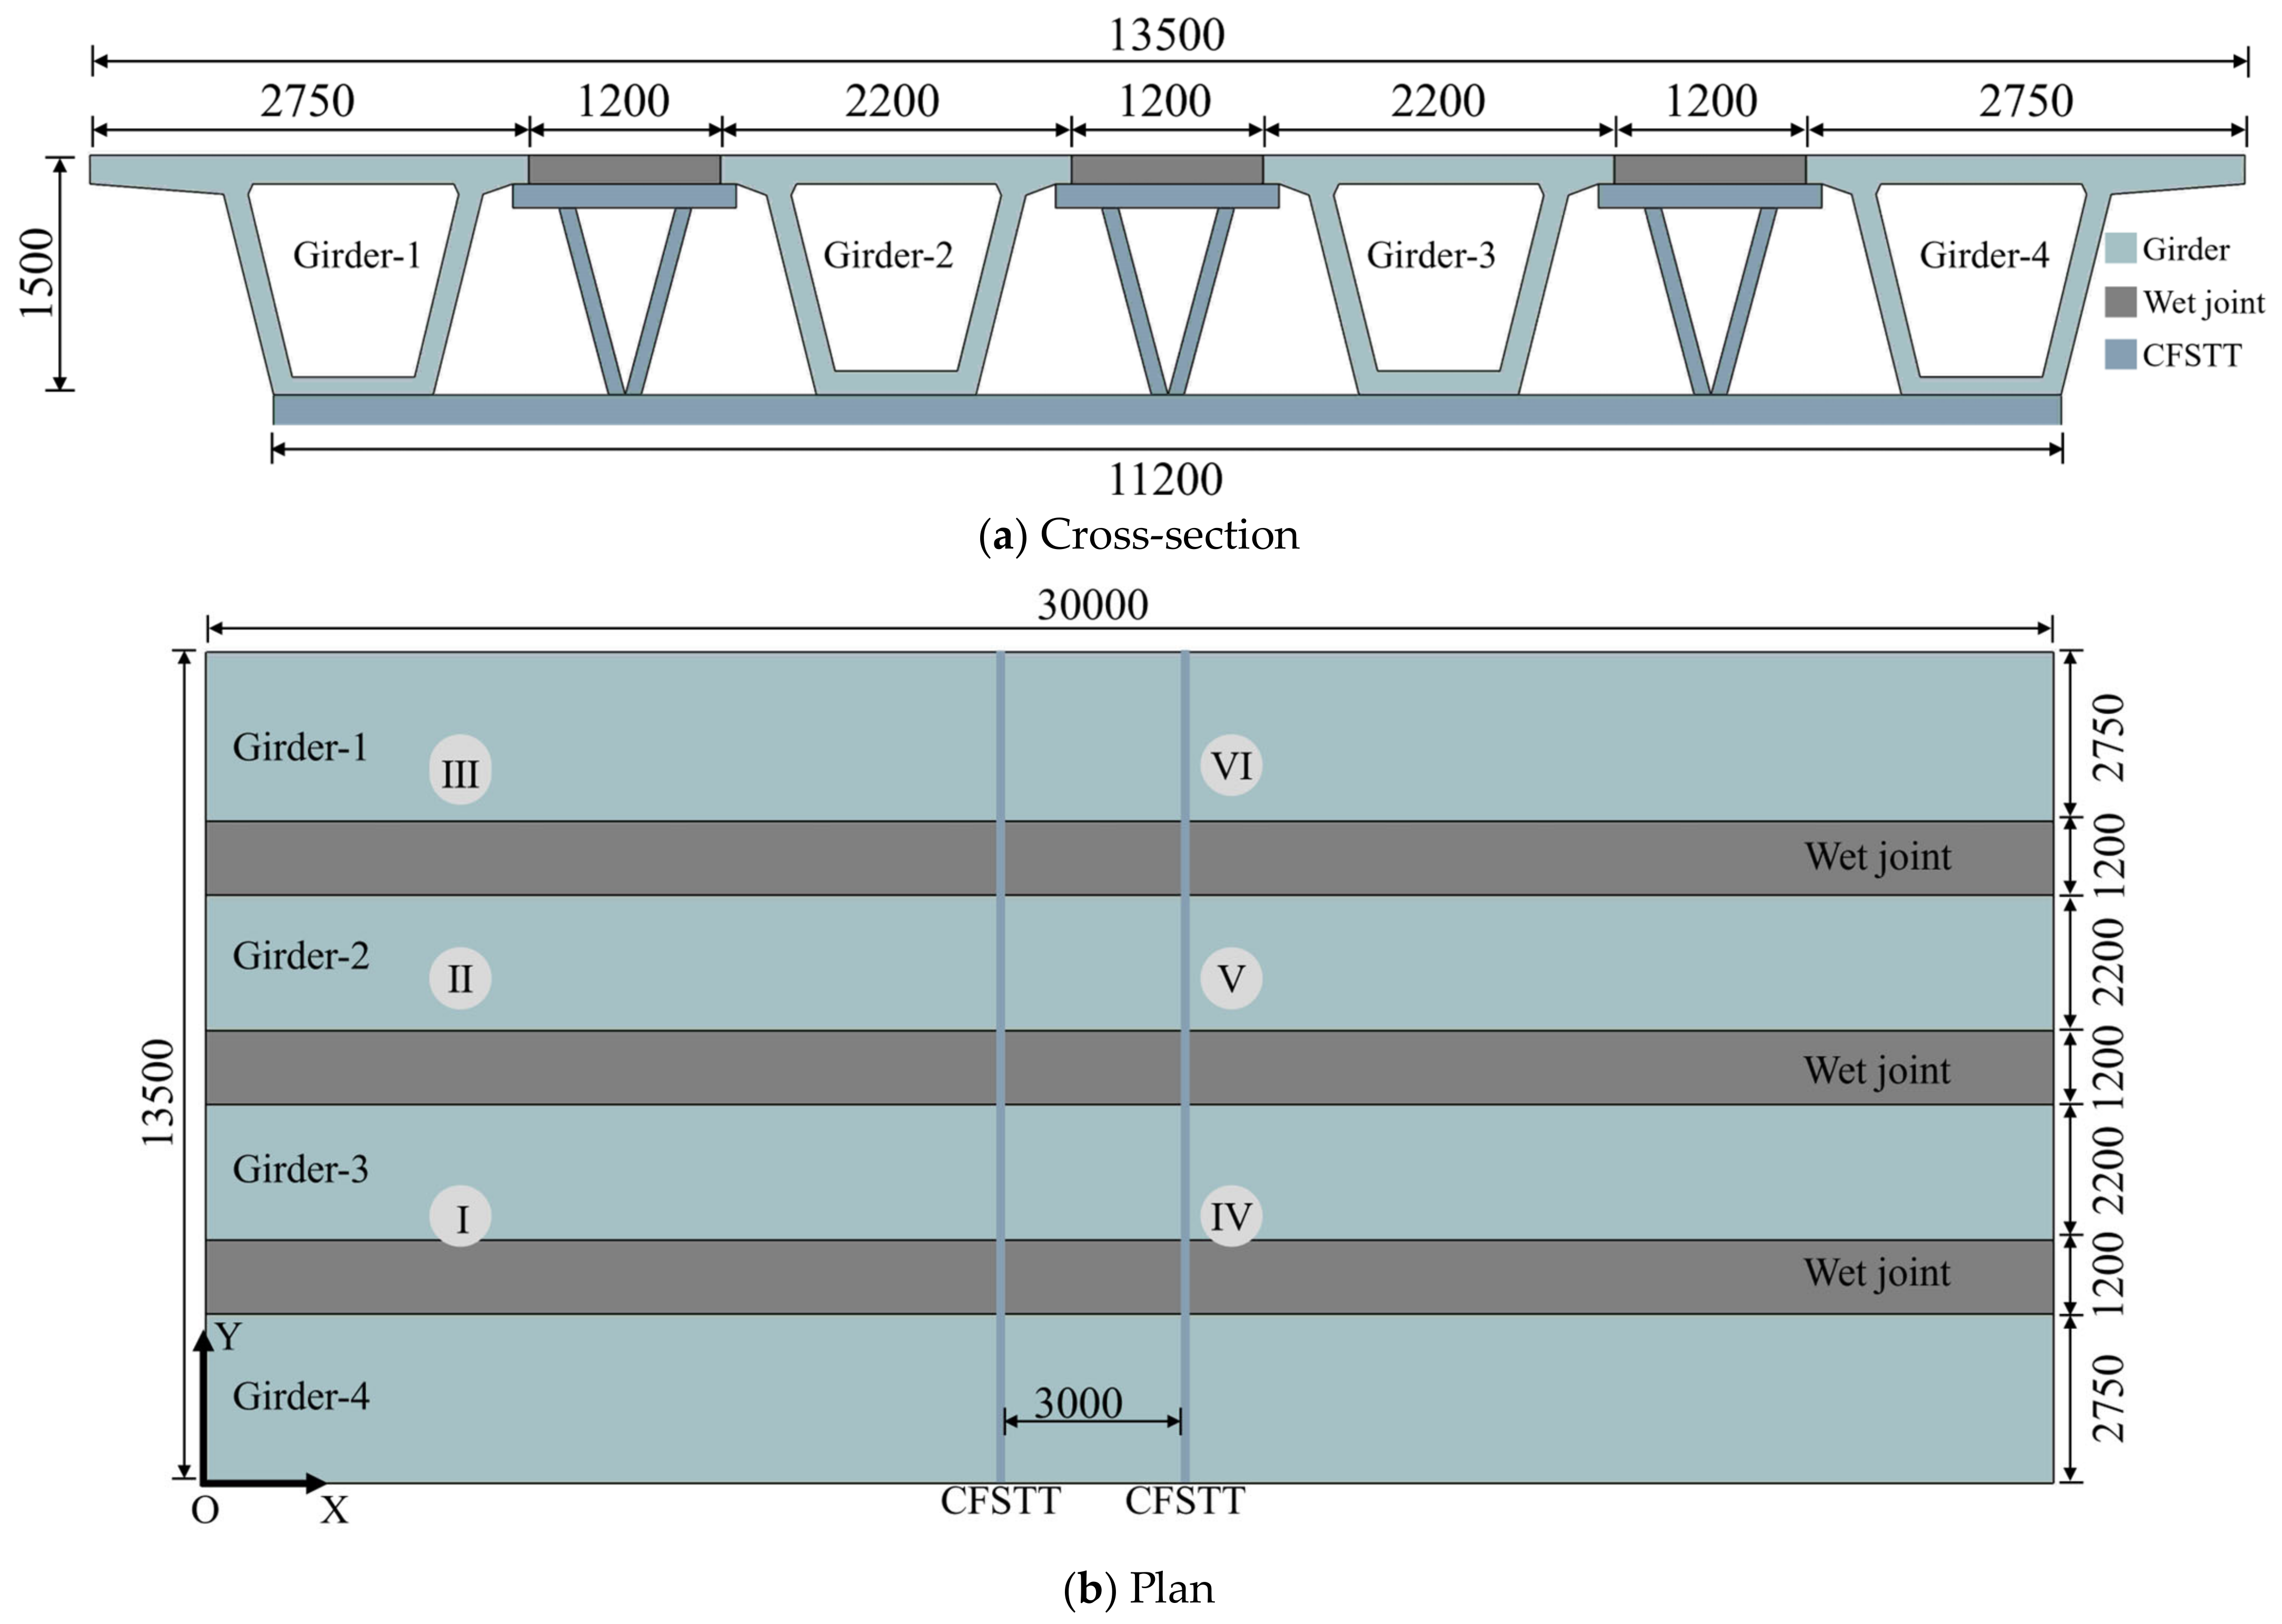
Figure 1. PCB bridge (Units: mm).
Buildings 14 02466 g001
Figure 2. Damage factors.
Buildings 14 02466 g002
Figure 3. Layout of ordinary steel bars (Units: mm).
Buildings 14 02466 g003
Figure 4. Layout of prestressed steel strand in middle beam (Units: mm).
Buildings 14 02466 g004
Figure 5. Section diagram of prestressed steel strand (Units: mm).
Buildings 14 02466 g005
Figure 6. Dimensions of the CFSTT (Units: mm).
Buildings 14 02466 g006
Figure 7. Dimensions of the diaphragm (Units: mm).
Buildings 14 02466 g007
Figure 8. Calibration results of viscosity coefficient.
Buildings 14 02466 g008
Figure 9. Vehicle static load diagram (Units: mm).
Buildings 14 02466 g009
Figure 10. Comparison of static load test and finite element model results.
Buildings 14 02466 g010
Figure 11. Deflection before and after reinforcement with different models.
Buildings 14 02466 g011
Figure 12. Calculation model (Units: mm).
Buildings 14 02466 g012
Figure 13. Girder force diagram.
Buildings 14 02466 g013
Figure 14. Results of LDF.
Buildings 14 02466 g014
Figure 15. Comparison of LDF before and after reinforcement with different models.
Buildings 14 02466 g015
Figure 16. Maximum stress and strain of CFSTTs and diaphragms.
Buildings 14 02466 g016aBuildings 14 02466 g016b
Table 1. Parameters of concrete grades.
Strength GradeTensile Strength (ftk)/MPaPoisson’s Ratio
( ν c )
Elasticity
Modulus/MPa
Density/
kg/m3
C302.200.23.00 × 1042.2 × 103
C402.390.23.25 × 1052.2 × 103
C502.510.23.45 × 1042.2 × 103
Table 2. Parameters of common steel bar materials.
TypeDiameter/mmYield Strength (fy)/MPaElasticity Modulus/MPaUltimate Strength (fu)/MPaElongation/%
R1203352.0 × 1054557.5
R2123352.0 × 1054557.5
R3103002.1 × 10542010.0
Table 3. Material parameters of prestressed reinforcement.
TypeInitial AngleArea/mm2Length/mmRadius of Curvature/mm
N16.843°40530,76050,000
N26.843°40530,81040,000
N31.909°55030,66030,000
Table 4. Mechanical properties of prestressed steel strand.
Nominal
Diameter (Dn)/mm
Maximum Total Elongational
(Agt)/%≥
Channel Friction CoefficientChannel Deviation CoefficientElasticity Modulus/MPa f p k /MPa
15.243.50.250.0015195,0001860
Table 5. Average relative errors of strain under different dilation angles.
ψ (°)Average Strain Relative Error (%)Average Deflection Relative Error (%)
1514.4915.22
288.9413.98
3621.8136.29
5031.7841.29
Table 6. Coordinates of loading points.
Loading PointIIIIIIIVVVI
X/mm51005100510017,40017,40017,400
Y/mm4050785011,6504050785011,650
Note: the lower left corner of Figure 1b is taken as the origin of coordinates.
Table 7. Model parameters.
Model IDDescriptionStrengthening Method
CM-1Control modelControl model
SM-1C50-grade concrete filled in Q235-grade steel pipe wallsUse CFSTTs
SM-2C50-grade concrete filled in Q345-grade steel pipe walls
SM-3C50-grade concrete filled in Q420-grade steel pipe walls
SM-4C30-grade concrete filled in Q345-grade steel pipe walls
SM-5C40-grade concrete filled in Q345-grade steel pipe walls
SM-610 mm thick Q345-grade diaphragmUse diaphragms
SM-720 mm thick Q345-grade diaphragm
SM-830 mm thick Q345-grade diaphragm
SM-9100 mm thick C50-grade concrete diaphragm
SM-10300 mm thick C50-grade concrete diaphragm
SM-11500 mm thick C50-grade concrete diaphragm
Table 8. LDF calculation results for Girder-1 using the rigid plate (beam) method.
γ β = 0.001 β = 0.003
η 1 η 2 η 3 η 4 η 1 η 2 η 3 η 4
0.020.2940.2830.2340.2090.2990.2630.2300.208
0.040.3290.2740.2220.1760.3340.2730.2180.175
First interpolation γ = 0.03710.3230.2740.2230.1800.3290.2710.2200.180
Second interpolation β = 0.0013
η 1 η 2 η 3 η 4
γ = 0.03710.3280.2720.2200.180
Table 9. LDF calculation results for Girder-1 using the hinge plate (beam) method.
γ η i j
η 11 η 12 η 13 η 14
0.020.3000.2630.2270.210
0.040.3410.2730.2080.178
First interpolation γ = 0.03710.3350.2720.2110.182
Disclaimer/Publisher’s Note: The statements, opinions and data contained in all publications are solely those of the individual author(s) and contributor(s) and not of MDPI and/or the editor(s). MDPI and/or the editor(s) disclaim responsibility for any injury to people or property resulting from any ideas, methods, instructions or products referred to in the content.