Abstract
The construction industry presents a significant environmental challenge due to its substantial environmental footprint, utilization of limited natural resources, and contribution to pollution and climate change. Additionally, optimizing the weight, cost, and duration of construction is crucial for enhancing serviceability, flexibility, efficiency, and profitability. In this research, the relationship between structure weight and other objective functions was explored using the single-objective gray wolf algorithm to investigate their impact on carbon footprint, water footprint, and construction time. Furthermore, employing a multi-objective optimization algorithm, a building structure was optimized for three systems featuring different structural frames based on the specified objective functions. The results revealed that the structure with intermediate steel moment-resisting frames exhibited the shortest construction time but incurred the highest construction cost. Conversely, the structure with intermediate steel moment-resisting frames with special steel concentric bracing demonstrated the lowest carbon footprint and water footprint among the studied structural frames. Consequently, the structure with intermediate steel moment-resisting frames with special concentric steel bracing was proposed as a green structure, emphasizing its environmentally friendly characteristics.
1. Introduction
The desired structural frame is selected and designed based on several factors, namely, the components and the type of connections in the frames, as well as considerations such as the construction site, the anticipated resistance, and the plasticity capacity required. In recent decades, the utilization of metaheuristic algorithms, which can interface with design software, has become increasingly prevalent. These algorithms not only facilitate the design of durable structures with high plasticity capacity but also aim to optimize factors such as cost and construction time. Moreover, the construction industry consumes numerous resources, with water being a vital one. However, one of the significant environmental issues associated with this industry is the carbon dioxide emissions resulting from the production of construction materials.
Population growth, particularly in developing countries, has resulted in a surge in demand for food, water, housing, and other natural resources. Given that construction projects predominantly rely on conventional methods, they face numerous sustainability challenges encompassing environmental, social, and economic aspects. This becomes particularly pronounced when resources are utilized inefficiently [1]. Presently, the sources of drinking water are dwindling at an alarming rate. Globally, nearly two billion individuals lack safe access to fresh water. The scarcity of water resources is deemed a critical issue concerning both human development and environmental sustainability [2].
The demand from the construction industry to extract minerals has led to significant environmental problems. Despite the existence of a significant amount of research on the environmental effects of construction, few studies have focused on the amount of water consumption in different stages of this industry. The concept of water footprint was introduced by Hoekstra in 2002. The water footprint is an index of freshwater use that not only pays attention to the direct consumption of water by consumers or producers but also to indirect water consumption [3]. The contribution of the construction industry to the amount of freshwater consumption is significant. According to global reports, almost 19% of all water is withdrawn by the industrial sector, with the construction industry among the top consumers of water. Global water withdrawal from groundwater and surface water is projected to increase by 55% between 2000 and 2050, largely attributed to the rising demand for water from industry and thermal energy production. Despite being the second-largest consumer of water, the industrial sector’s water footprint assessment remains limited, particularly within the construction industry. Construction materials such as cement, concrete, and steel are produced annually in billions of tons worldwide, contributing to water consumption and pollution throughout the production chain [4].
The water footprint in construction is 20% of the water used in the world, and by constructing environmentally friendly buildings, water consumption can be reduced by approximately 40% [5]. In 2023, a study based on a two-stage multi-objective optimization approach using NSGA-III for optimal designs of structures with four-span reinforced concrete frames with different heights, focusing on minimizing the water footprint and design cost, was analyzed. The results demonstrated that the Pareto front shape of the optimal design in the studied reinforced concrete frames is more related to the water footprint values of the material unit than the costs [6].
Recently, in the environmental review of materials and materials of reinforced concrete buildings, in parallel with optimizing the consumption of materials, reducing the cost of construction was also considered, and it was determined that paying more attention to environmental sustainability considerations in the preferential design of the structure, especially in the early stages of the design, is essential and can lead to a mitigation in the cost of construction and the construction of a sustainable structure in order to reduce harmful environmental effects [7]. An equivalent greenhouse is used to produce the elements needed in the construction industry, including the extraction and processing of raw materials and the production of construction materials that lead to carbon production, and they deduced that the construction and operation of the building are important factors in production. Carbon dioxide emits a quarter of the world’s total carbon dioxide production [8].
Kofoworola et al. [9], in extensive research, concluded that about 4% of the world’s greenhouse gases are produced in the construction industry. Abergel et al. [10] studied the relationship between buildings and the construction industry based on the annual reports published by the International Energy Agency and the World Alliance of Buildings and Construction, and in this research, it was shown that construction and construction operations account for 36% of the consumption. It accounts for the final global energy supply and 39% of energy-related carbon dioxide. Eleftheriadis et al. conducted research on the relationship between cost and carbon dioxide emissions in reinforced concrete structures using an optimization method based on building information modeling. They found that the most significant parameters influencing the amount of carbon dioxide emissions in concrete structures were the dimensions, thickness of structural elements, and their arrangement [11].
Blismas et al. [12] stated that in reinforced concrete buildings, the complete investigation of the construction costs of the structure and the resulting carbon production is one of the most essential items in construction management Paya-Zaforteza [13], in her research on carbon dioxide emissions, stated that the reduction in carbon dioxide in building structures can be achieved not only by considering more sustainable materials, but also by using structural materials efficiently through optimization methods. In a study accomplished by Fankhauser et al. [14], it was demonstrated that the embodied carbon, which encompasses carbon dioxide emissions related to the extraction, manufacturing, transportation, and installation of building materials, amounts to approximately 3.8 billion tons per year.
In the present study, the structure with the same plan, the height of the floors, and the same size of the apertures in three different structural frame systems have been scrutinized—the structural design has been made based on LRFD-AISC, and in this study, the structural weight, cost and construction time, water footprint, and carbon footprint for three different structural frame systems have been studied using a metaheuristic algorithm. In the past decades, in structural engineering, in order to increase the ductility capacity and seismic resistance, the weight of the structure was optimized as the only objective function using heuristic single objective (SOO) algorithms of the gray wolf optimization algorithm (GWO). In most of the preceding studies, the multi-objective optimization (MOO) algorithms of the gray wolf optimization algorithm (GWO) were extended. Other objective functions besides weight, such as cost in the direction of managing financial resources, or functions, including carbon dioxide and water emissions, for the evaluation and environmental sustainability of structures, were examined.
Most of the previous research was carried out on structures with one type of frame for several objective functions or on structures with different frames for only one objective function. One of the most important innovations of this article is the use of single-objective metaheuristic algorithms (SOO) to study the relationship of weight as an objective function with other objective functions, as well as to design and optimize multiple structural systems using multiple target optimization algorithms (MOO) with five target functions. It has finally ended with the introduction of an environmental structure with the least carbon footprint and water footprint.
In the present study, the structure with the same plan, floor height, and aperture size in three different structural frame systems has been investigated, and structural analysis and design have been performed using LRFD-AISC. In this study, structural weight, water consumption, and the production of carbon dioxide during the material production process, as well as the cost and construction time, have been studied based on a meta-exploration algorithm. One of the most notable innovations of this method is its capability for designing and optimizing multiple structural systems based on various objective functions. This culminated in the development of an environmentally friendly structure with the lowest carbon footprint and water footprint.
2. Metaheuristic Algorithm
Due to the non-gradient mechanism and the lack of need to calculate the derivative of the search space, metaheuristic optimization algorithms are increasingly used in engineering optimization problems that are non-linear, unlike the limitations and complexities of conventional methods. The meta-heuristic algorithms that can usually be used in such research are briefly mentioned.
2.1. Whale Optimization Algorithm
The WOA algorithm is considered one of the optimization algorithms inspired by nature and based on population, which can be used in different fields. The application of the WOA algorithm is in the field of continuous problems.
2.2. Slime Mould Algorithm
The meta-heuristic optimization algorithm of SMA slime mould is presented on the basis of the fluctuating behavior of slime mold in nature, which has several features with a unique mathematical model. This algorithm employs adaptive weights to simulate the process of generating positive and negative feedback from the propagation wave. Mucous mold, which is based on biological waves, is used. The application scope of this algorithm is also for continuous and derivable problems.
2.3. Particle Swarm Optimization Algorithm
Particle Swarm Optimization Algorithm PSO is an algorithm for non-linear continuous functions that is inspired by the concept of particle intelligence, which usually exists in groups of animals in the form of herds. As stated in the explanation, all the described algorithms exhibit proper performance in the field of continuous linear and non-linear problems, which is one of the disadvantages of these algorithms, but the WGOA algorithm can be suitable for the present research due to the search for solutions in the field of linear and non-linear problems and therefore performs the best.
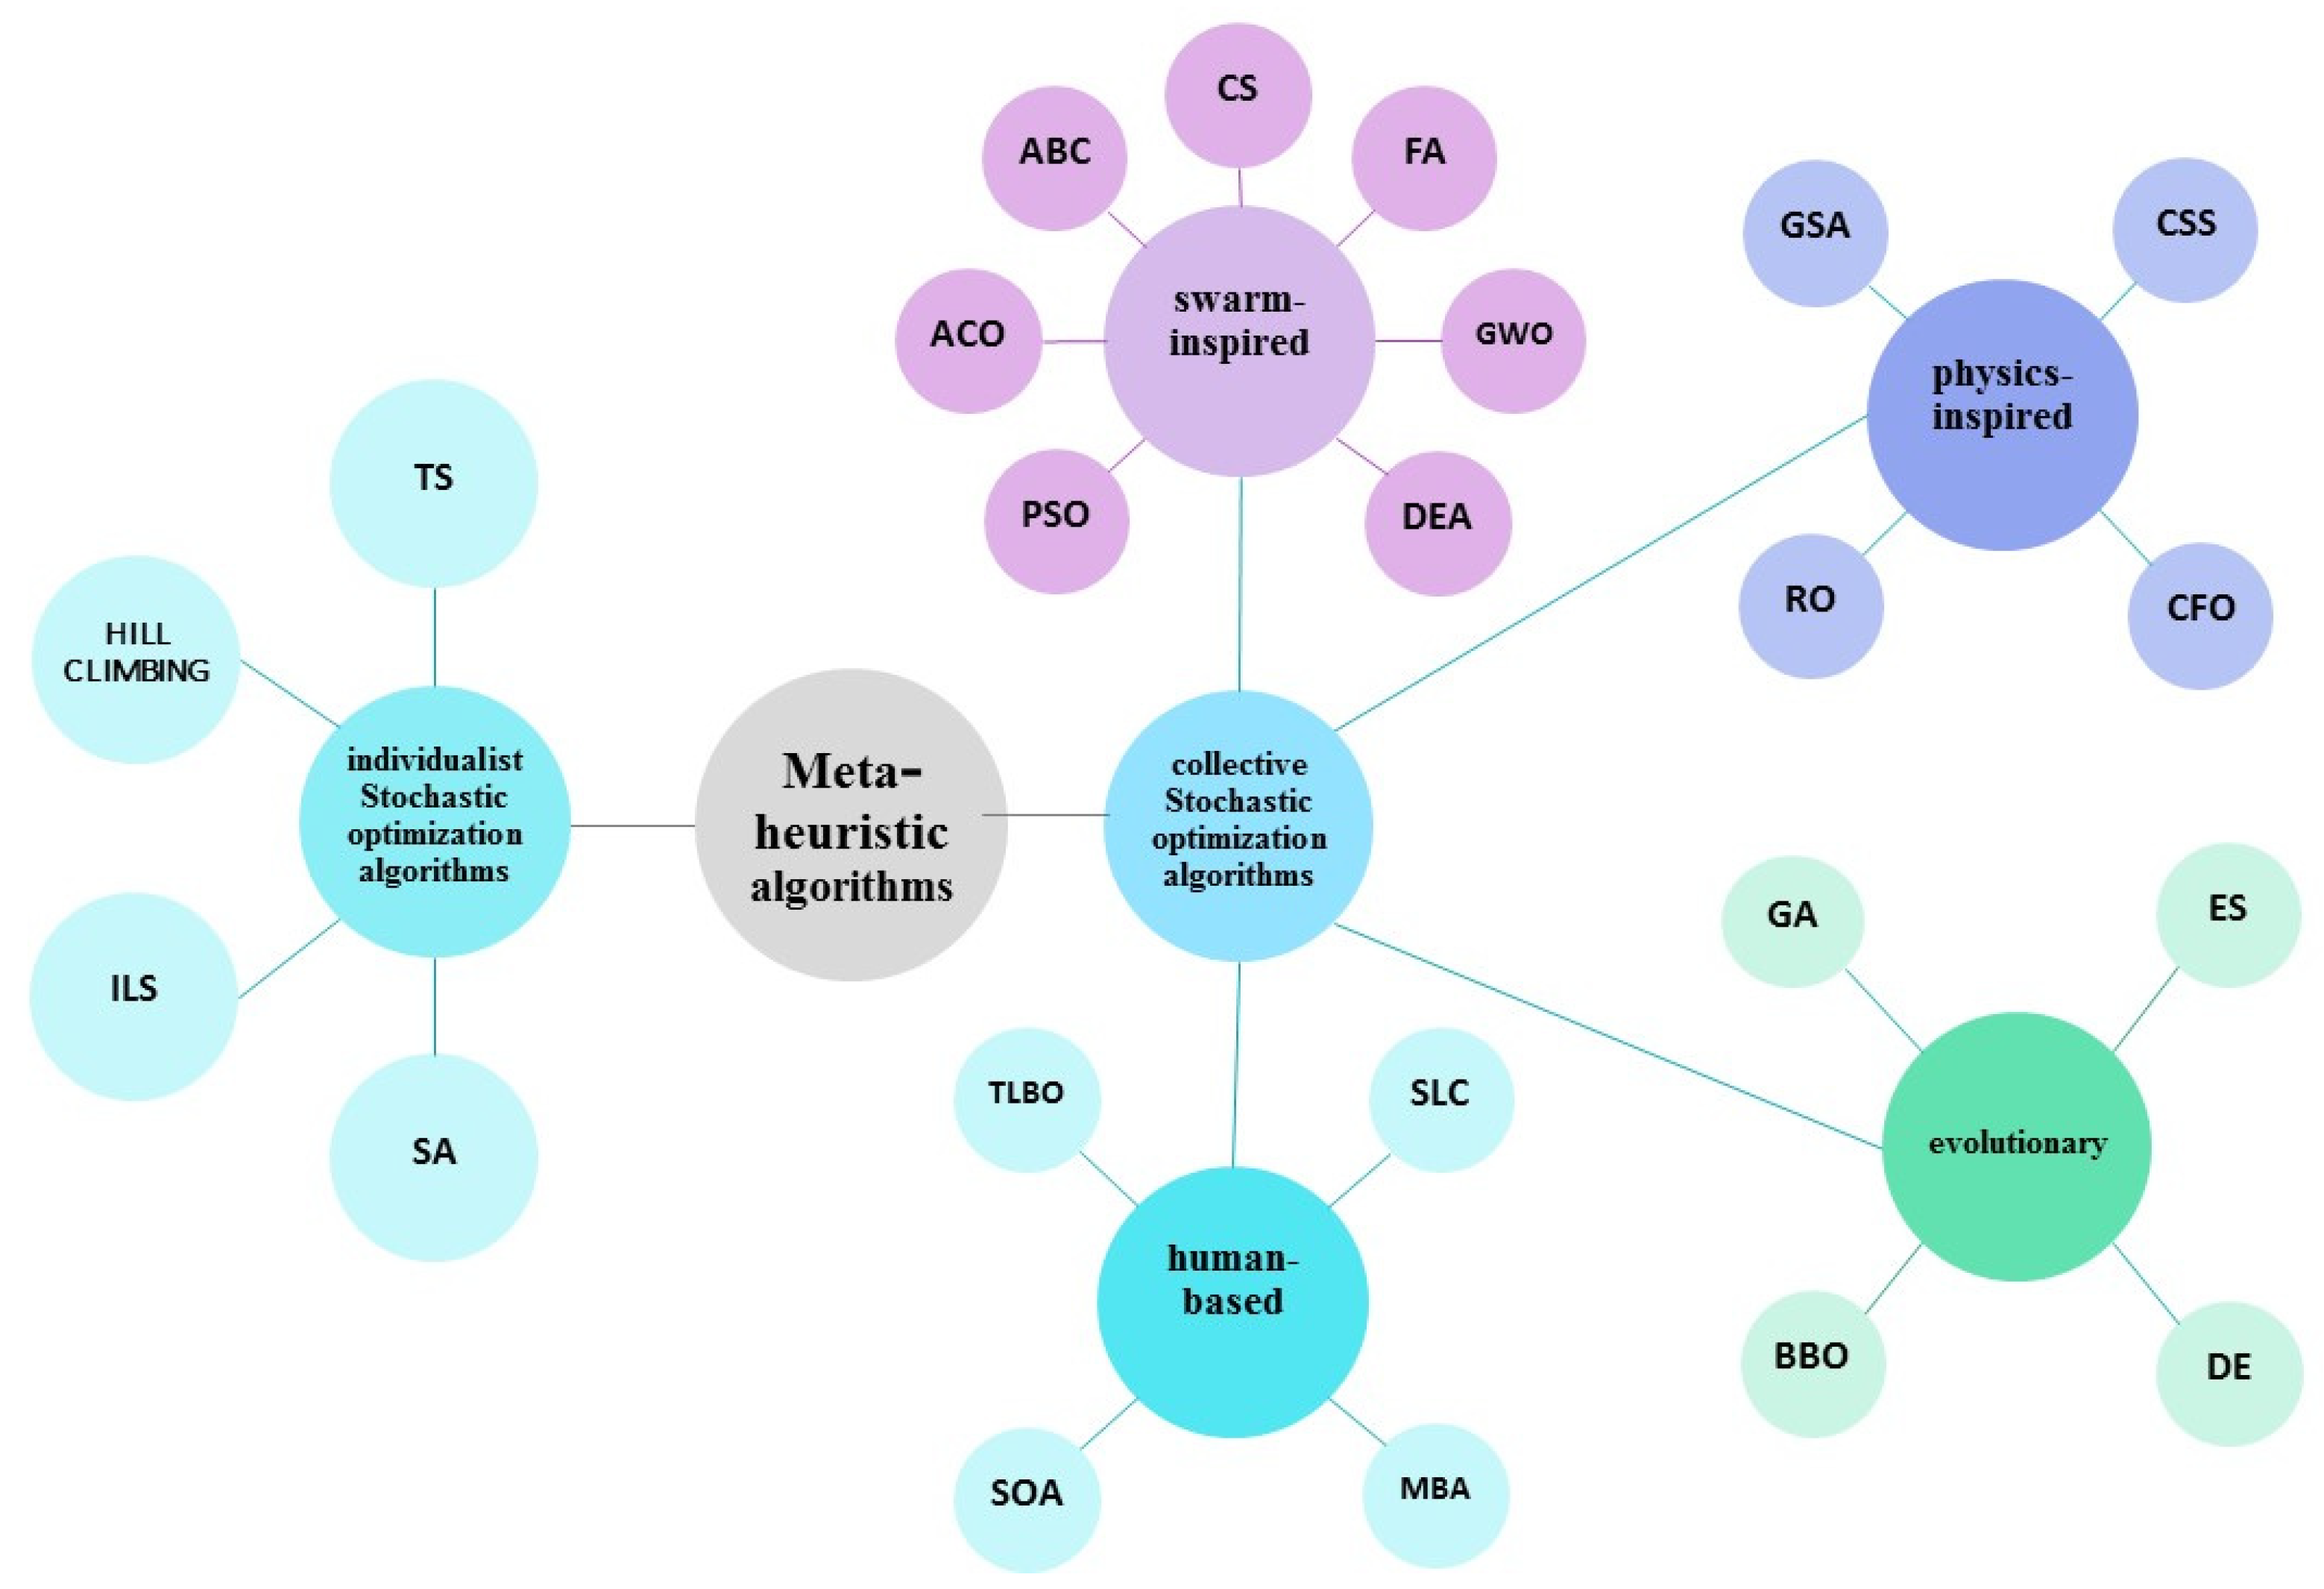
Metaheuristic optimization algorithms are a type of random algorithm. Metaheuristic algorithms are divided into two categories; stochastic individual and collective optimization algorithms. In individual metaheuristic algorithms, optimization starts and continues with a solution. The solution is randomly modified and enhanced for a number of pre-defined steps or to satisfy an end criterion. The advantage of this group is the low computational cost and the need for a small number of performance evaluations. But in the second group, the collective techniques generate several random solutions and evolve them during optimization. The solution set usually cooperates to better determine the optimum in the search space. The MOO problem is accomplished concurrently through optimization with a set of conflicting objectives [15].
Due to the advantages of collective metaheuristic algorithms, there is a growing interest in proposing new algorithms in this sphere. They can be divided into four main classes based on inspiration: group-inspired, physics-inspired, evolutionary-inspired, and human-based swarms. Figure 1 depicts the general classification of metaheuristic algorithms and the most popular ones in each of the groups.
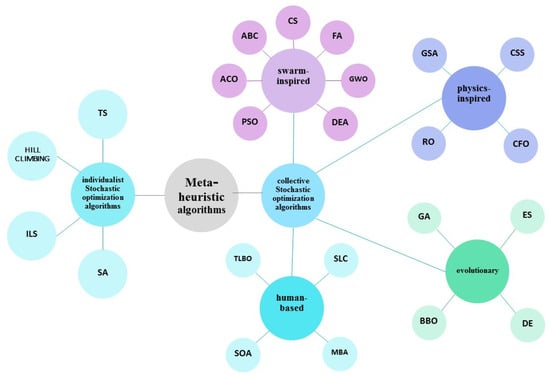
Figure 1.
Metaheuristic Optimization Algorithms.
2.4. Gray Wolf Optimizer Algorithm
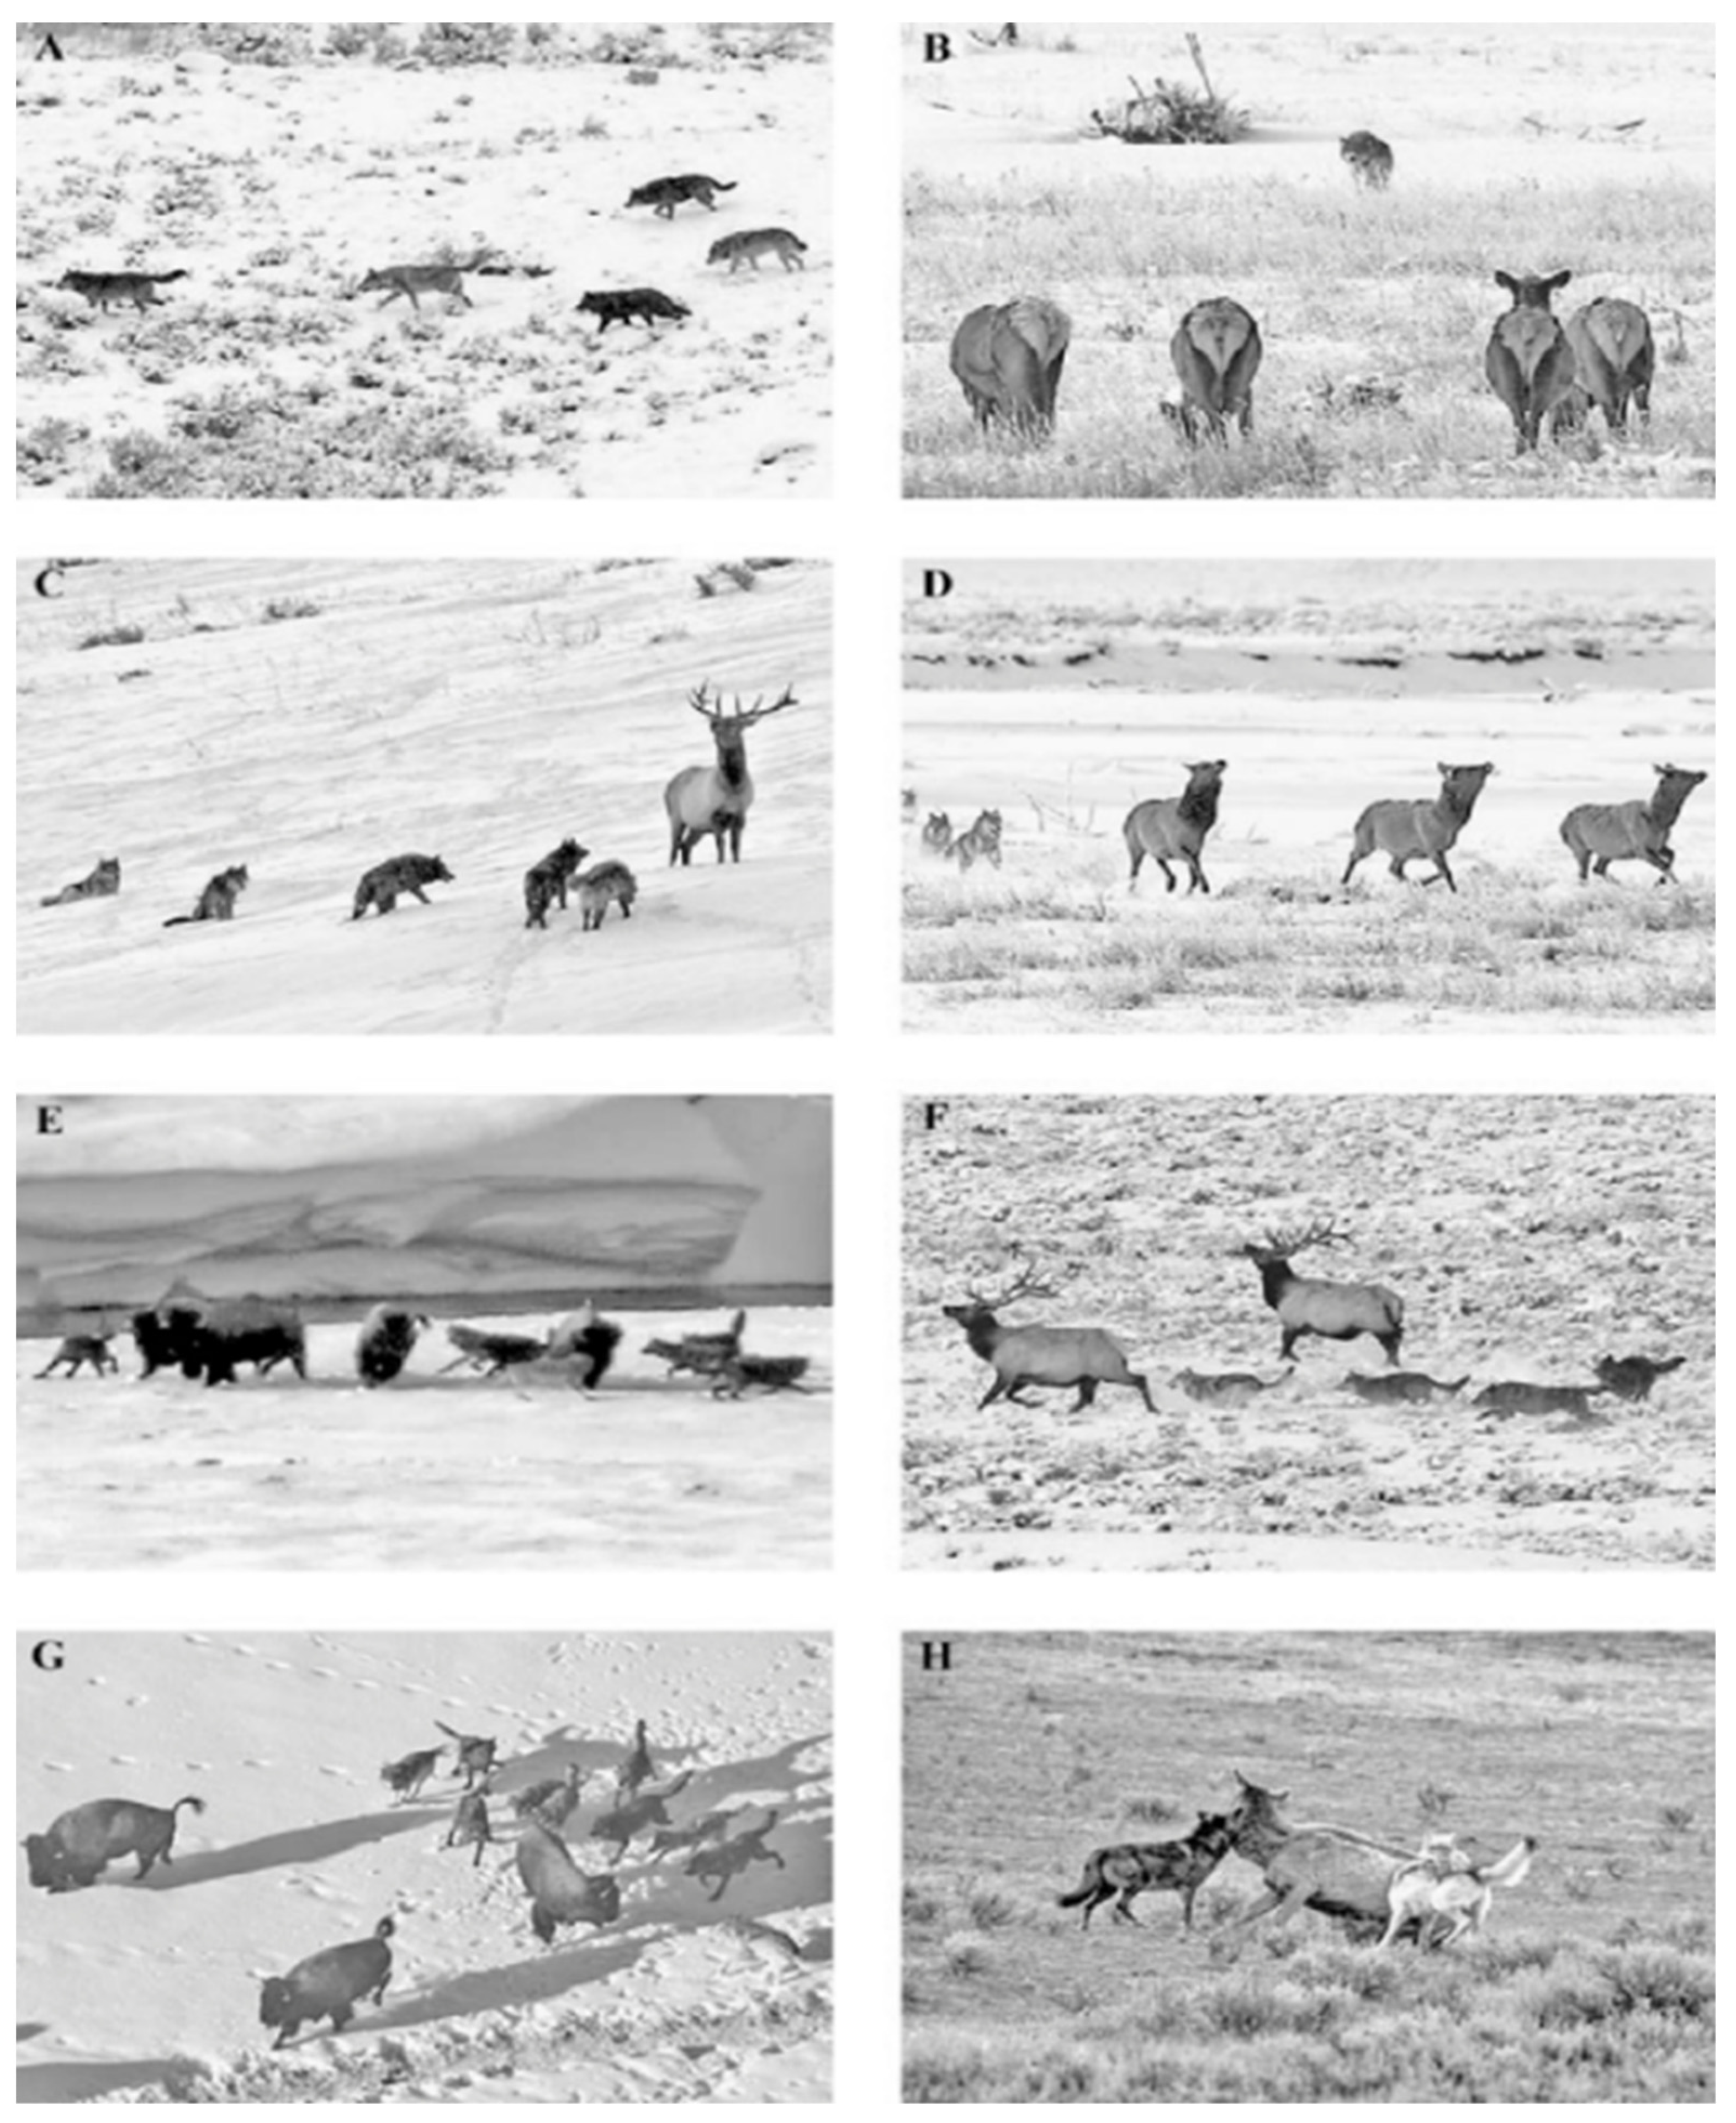
One of the latest metaheuristic algorithms that has demonstrated favorable results in multi-objective functions is called the gray wolf optimizer algorithm. This algorithm is derived from the behavior of a group of gray wolves when hunting. What this algorithm tries to simulate is the leadership hierarchy and the hunting method of the gray wolf group. Figure 2 illustrates how gray wolves behave in a group attack.
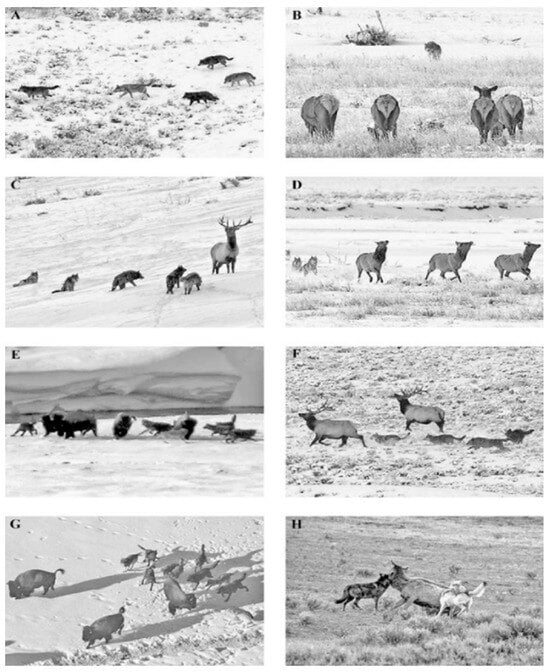
Figure 2.
How gray wolves hunt [16]. (A) search, (B) approach, (C) watch, (D) attack group (pursuit), (E) attack-group (harass), (F) attack-individual (pursuit), (G) attack-individual (harass), and (H) capture.
Governing Equations
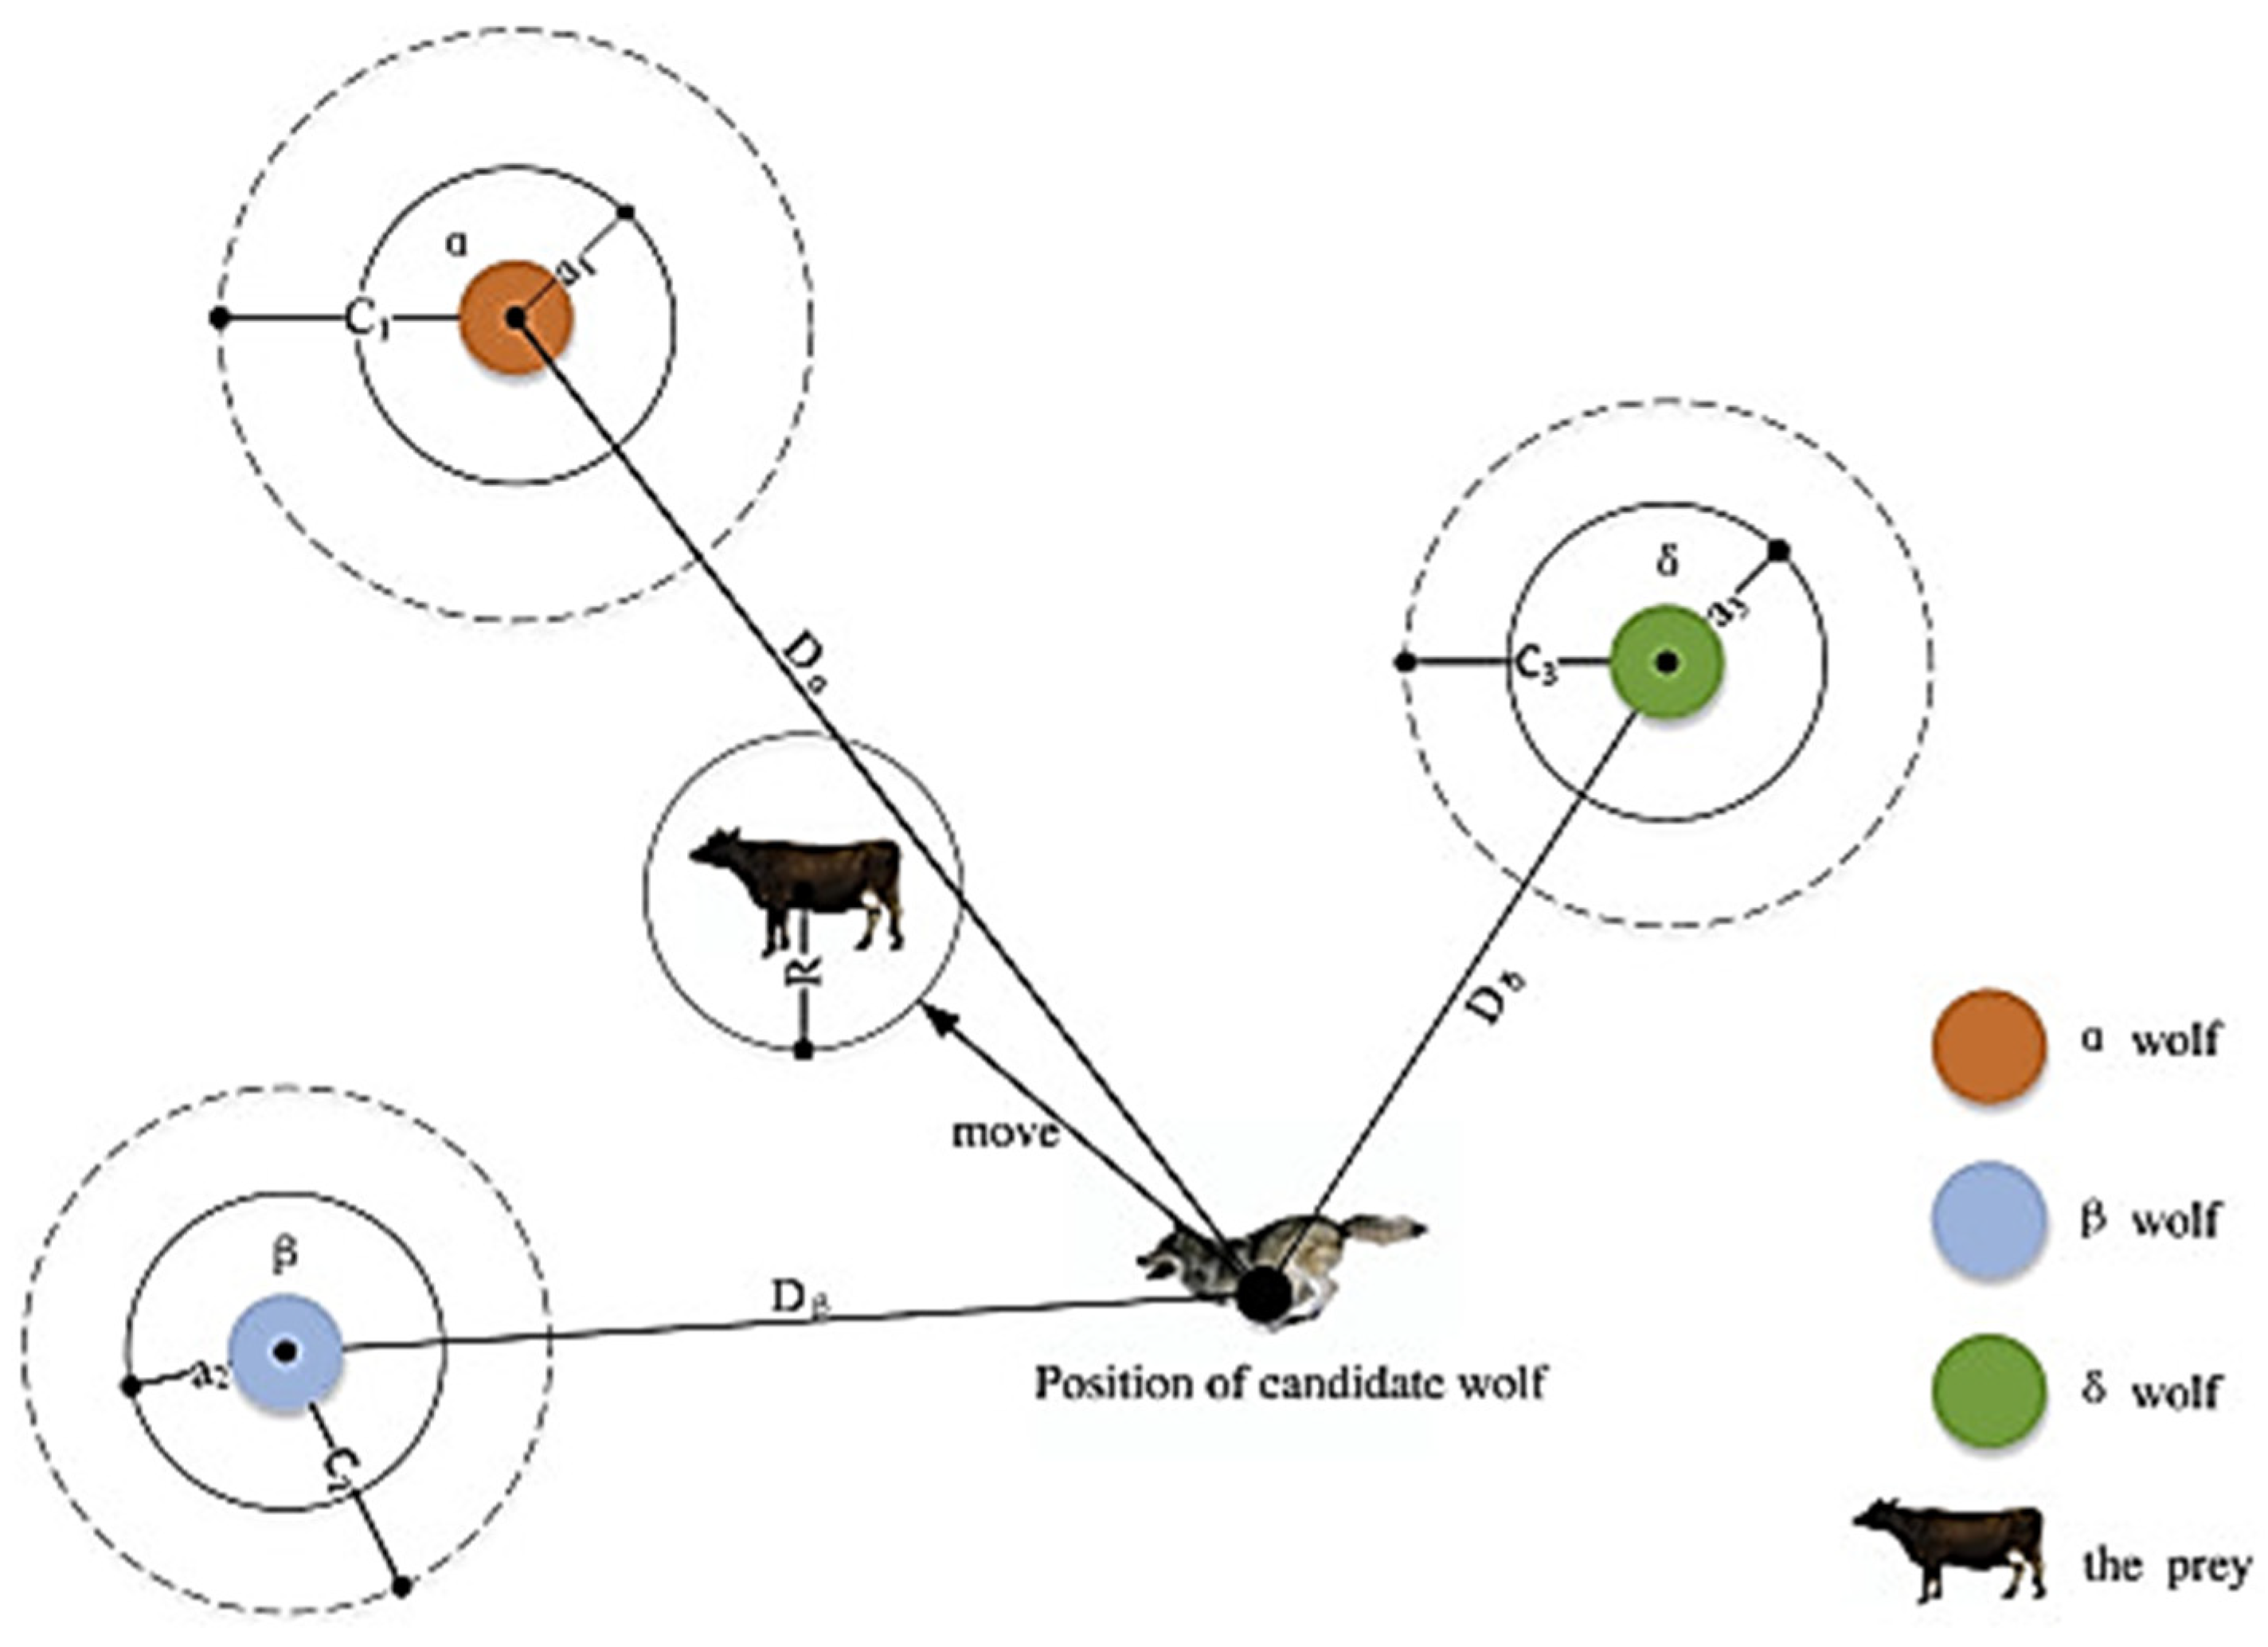
In order to optimize the behavior of wolves mathematically, the best answer is considered an alpha wolf, and the second and third answers are considered beta and delta wolves, respectively. The rest of the answers are known as omega wolves. The optimization process using the gray wolf algorithm is directed by the alpha, beta, and delta wolves, and the omega wolves follow them accordingly. The relations 1 to 4 can be noted as the governing equations for the afore-mentioned algorithm [17].
In the above equations, t denotes the current iteration, and are the vector of coefficients, is the position vector of the prey, and is the position vector of the gray wolf. where the vectors and are defined as follows:
In which the component is linearly reduced from 2 to zero in all iterations and and are random vectors with coordinates [0, 1]. In order to describe Equations (1) and (2), the possible placement positions of the gray wolf in the two-dimensional space are shown in Figure 3, and as seen in this figure, a gray wolf has its position (X,Y). can be updated based on the bait position (X*,Y*).
The Gray wolves have the ability to detect the position of the prey and surround it, and the hunt is usually led by the alpha wolf. Briefly, the search process starts with a random population of wolves. During the optimization process, alpha, beta, and delta wolves estimate the possible location of the prey, and other solutions (omega wolves) update their position based on this estimate. The parameter decreases from 2 to zero during the process to model search and productivity.

Figure 3.
Updating the position in the GWO Algorithm [17].
Figure 3.
Updating the position in the GWO Algorithm [17].
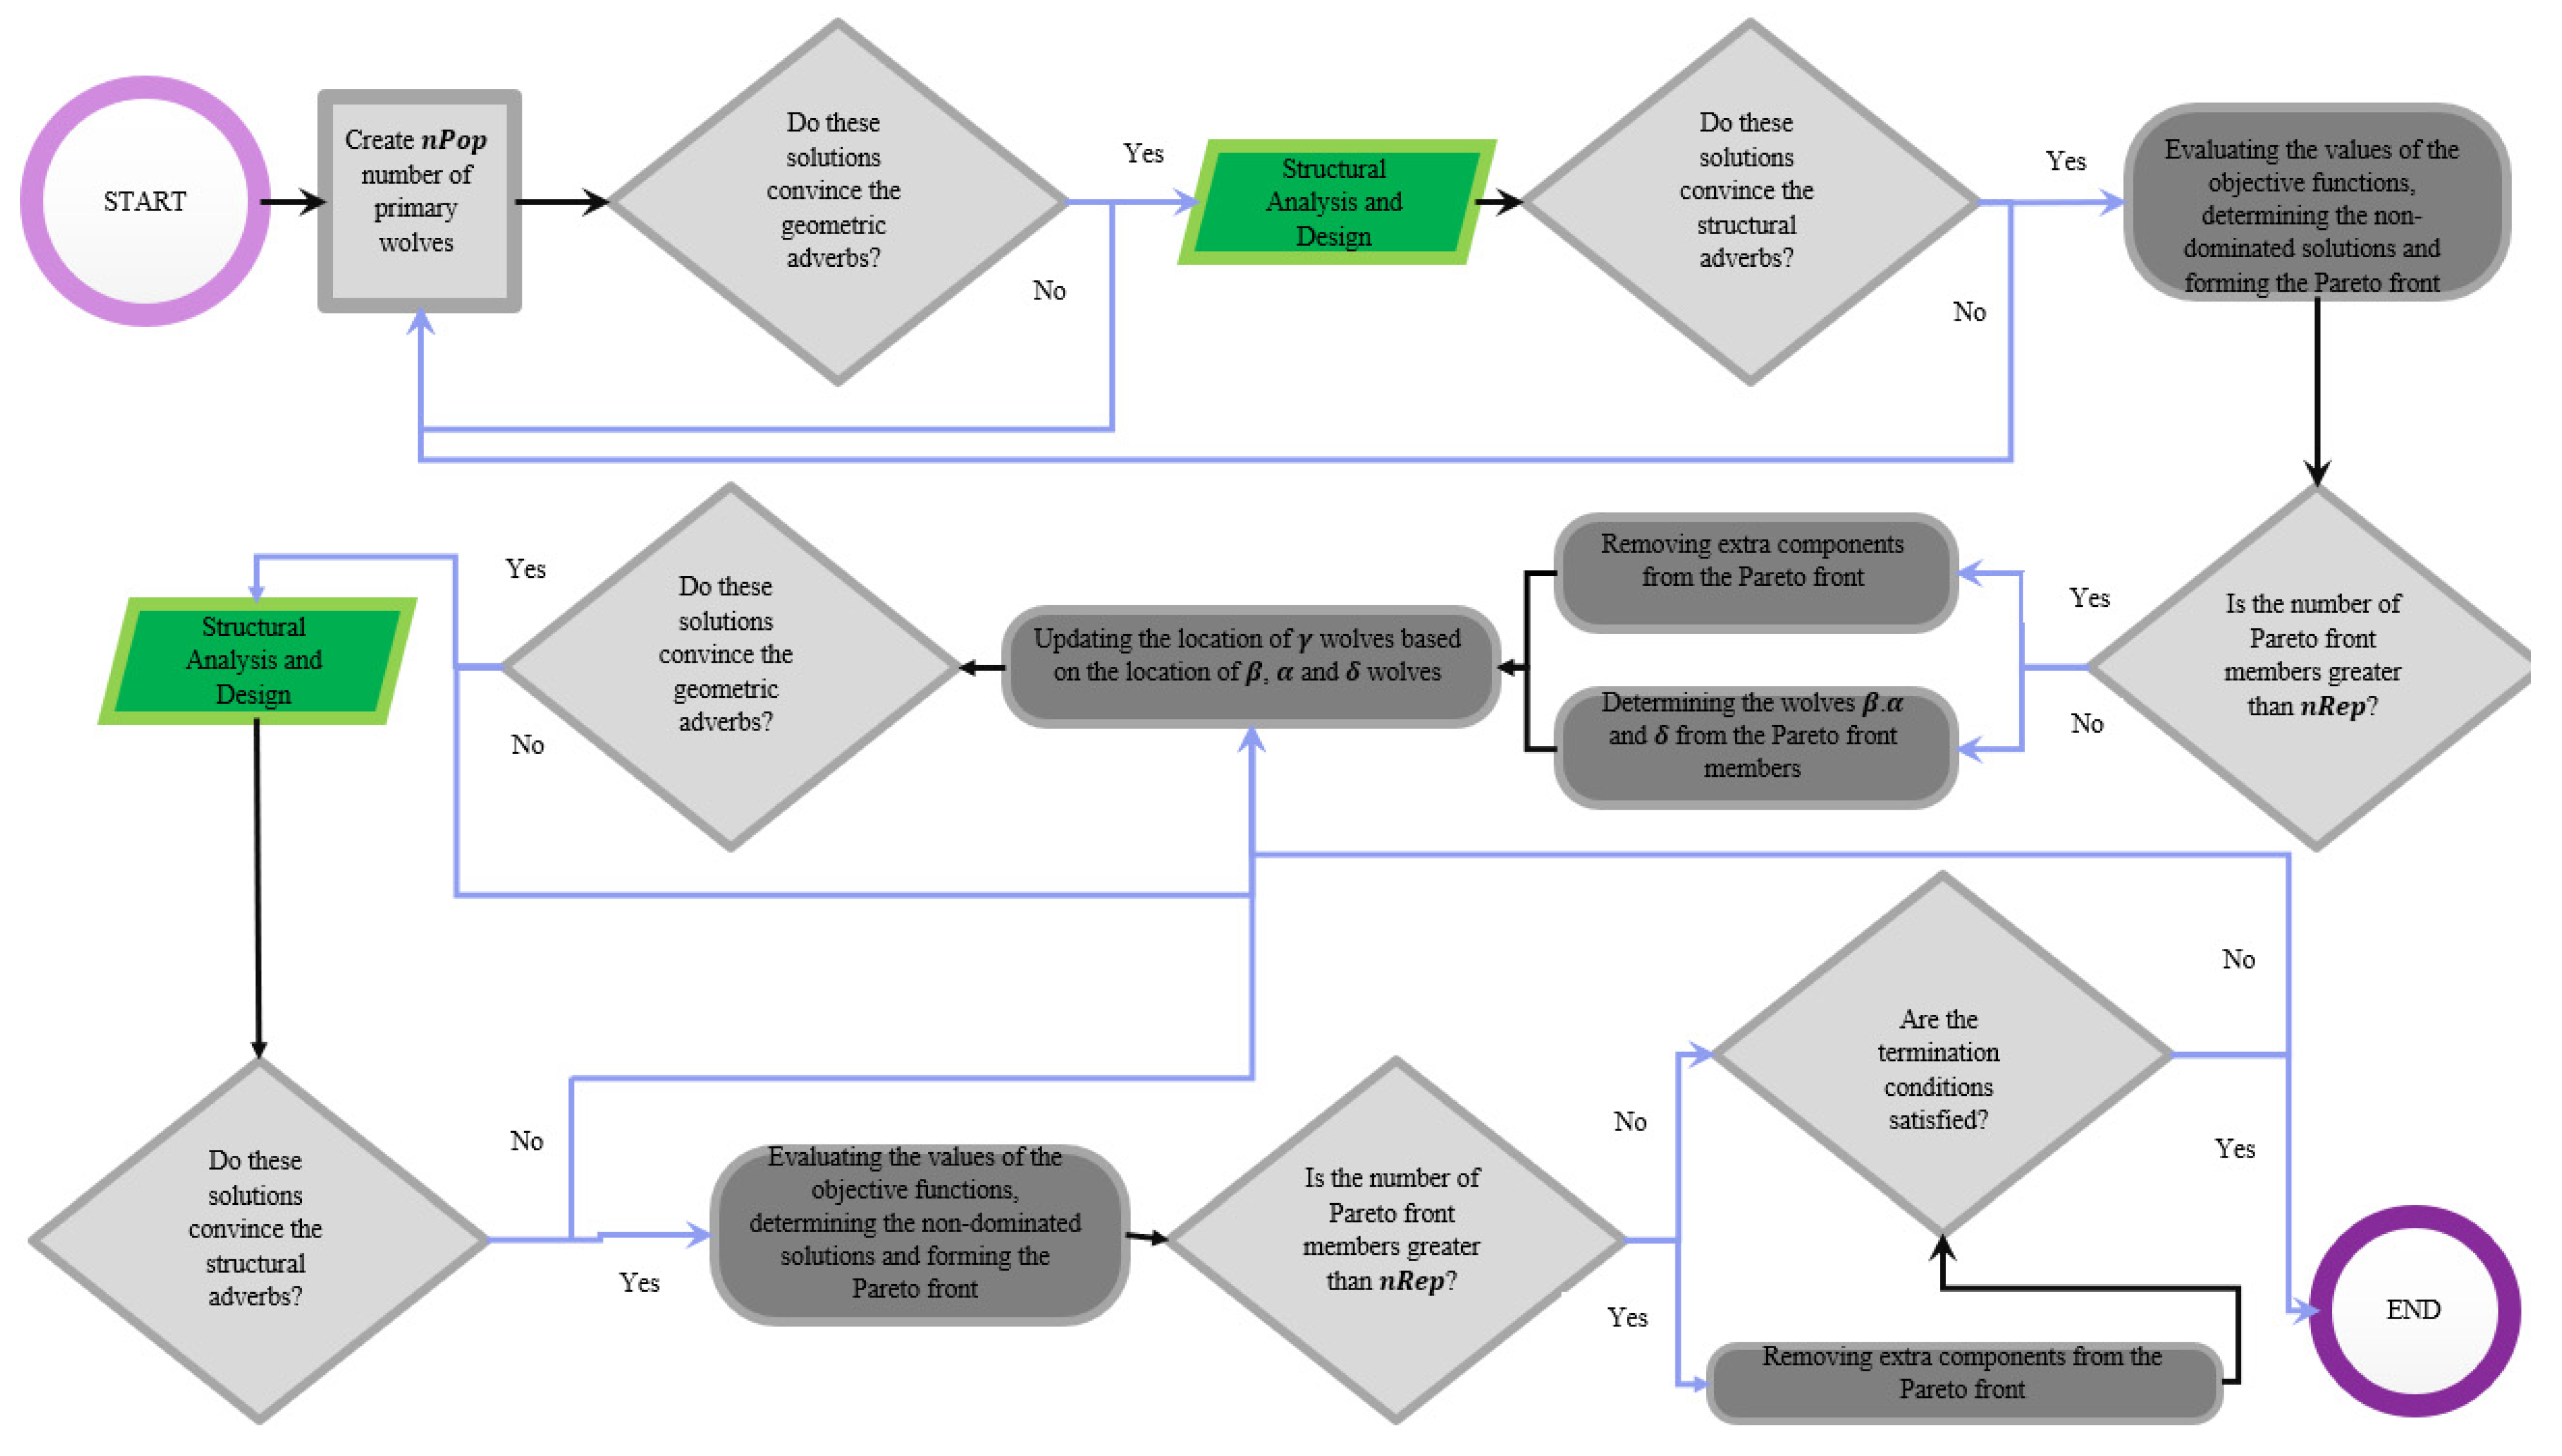
In the present study, the iterations of the algorithm have been performed with the branch connection with the SAP2000 numerical model, and this iteration has been conducted until the structural constraints are accepted [18,19]. The flowchart of the algorithm iteration is shown in Figure 4. Generally speaking, in all CSI (Computers and Structures, Inc.) software, there is a path for importing data from a programming language, and there is exactly such a process in SAP2000 software, and it has been used in the present research, so-called OAPI, which stands for Open Access Programming Interface. In this method, first the model is modeled in SAP2000, and then the algorithm uses SAP2000 designs to change its variables at each stage.
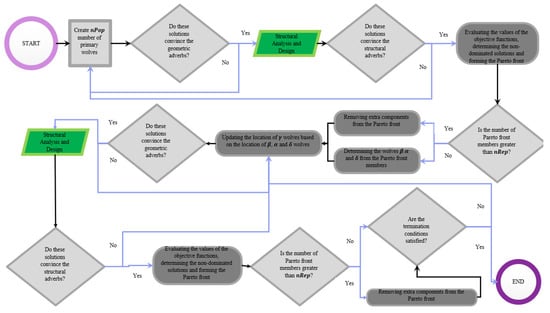
Figure 4.
Flowchart of the Gray Wolf Algorithm.
3. Properties of Study Structure
The structures studied in this research have three apertures with lengths of 5 m and consist of beam and block roofs with a height of each floor of 3.2 m and 4 floors. The characteristics of the studied structures are presented in Table 1.

Table 1.
Properties of study structures.
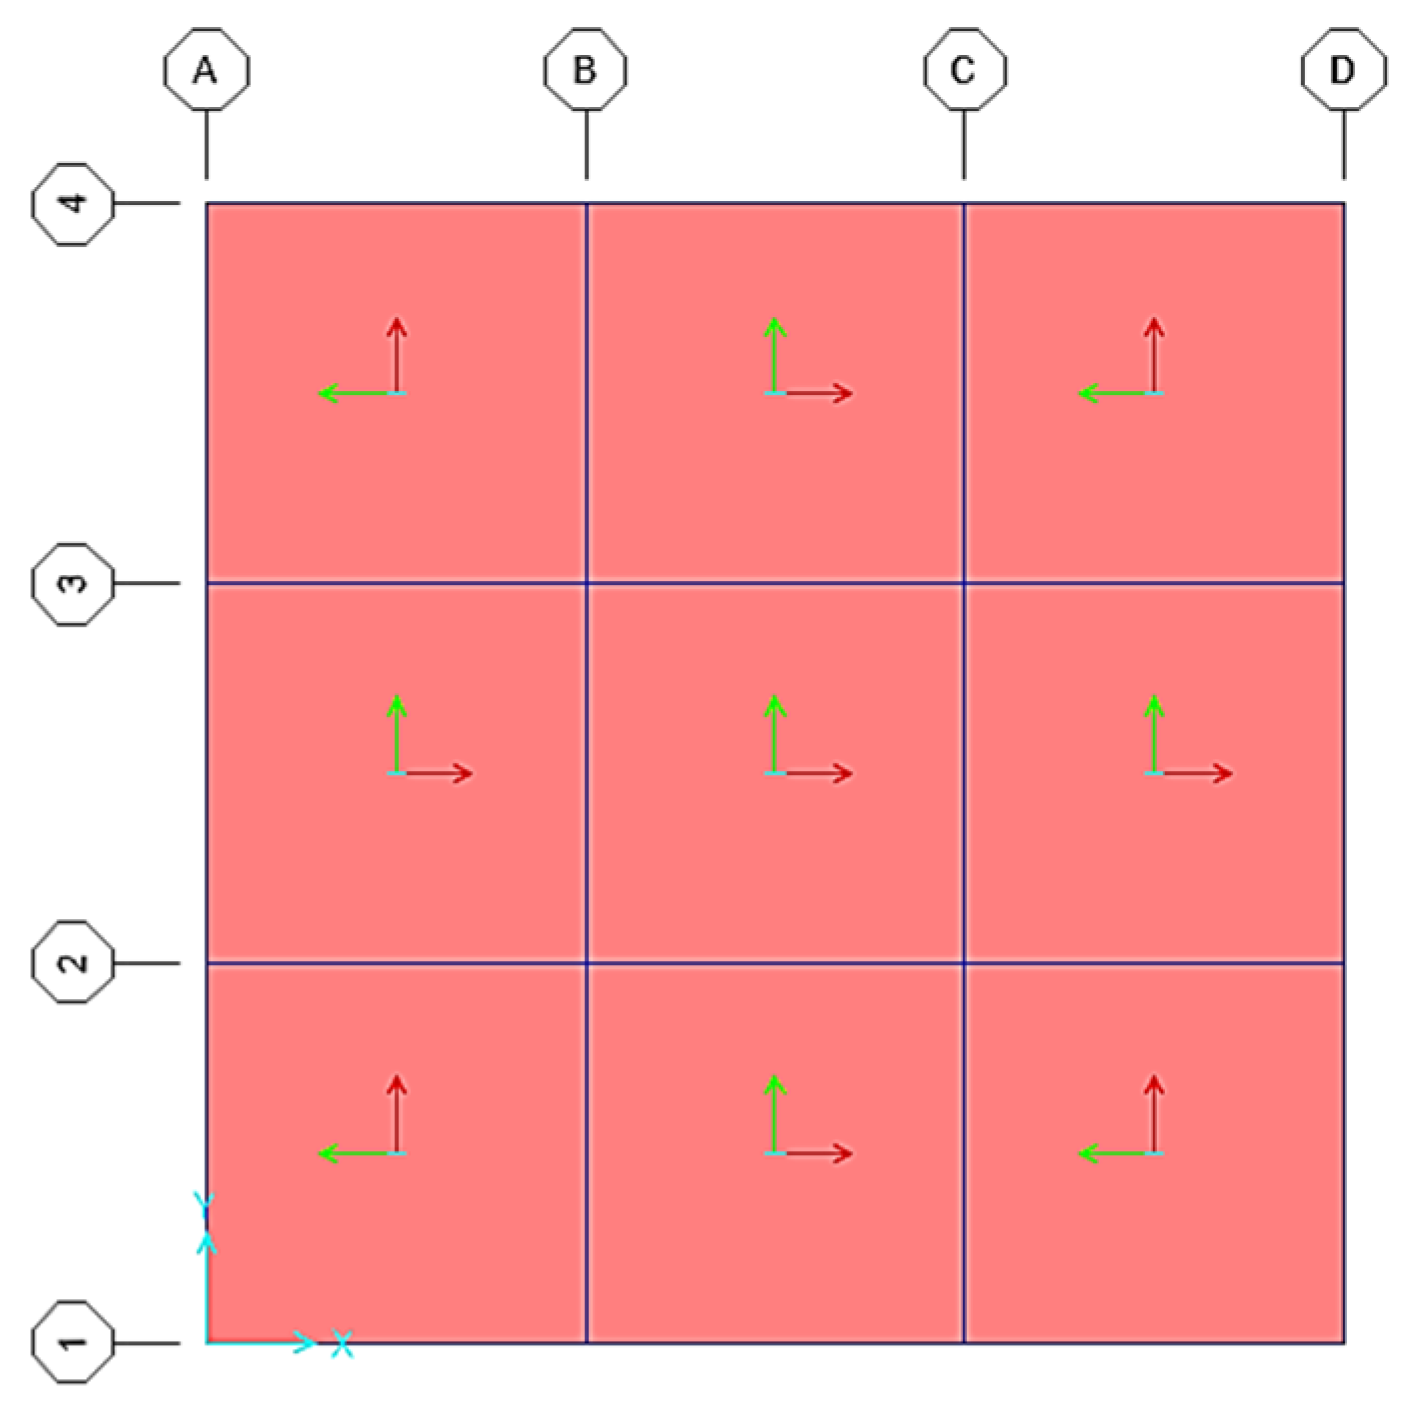
Moreover, the 3D view and the studied structural plan are shown in Figure 5 and Figure 6. In Figure 6, the numbers and letters represent the axes of the beams of the structure in the X and Y directions, respectively.
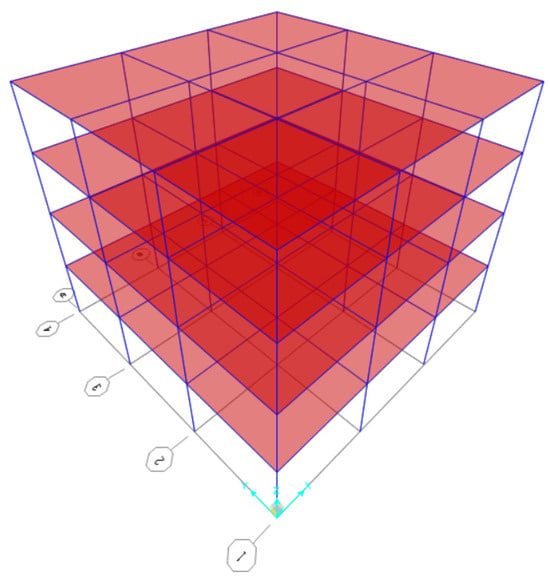
Figure 5.
3D view of the structure.

Figure 6.
Plan view of the structure.
According to the construction conditions, the beam and column cross-sections are defined as design variables based on the type of structure, as outlined in Table 2. Similarly, the design variables for wind brace members in structures featuring braces are detailed in Table 2 as well. This circumstance contributes to the fragmentation of the search space during the optimization of steel structures. Nevertheless, in certain scenarios, depending on the structure type, the utilization of any desired cross-section may be feasible. Consequently, in discrete problems, the size of the search space is dictated by the number of potential cross-sections available for each design variable.
Table 2.
Design variables for beams, columns, and brace members.
Afterwards, a multi-objective search is adopted to evaluate the objective functions for each possible design combination. The objective functions are the weight of the structural frames, the cost and duration of construction, the amount of water consumed, and the carbon dioxide emitted during the material production process. Ultimately, non-dominated sorting is applied to detect the Pareto optimal partitions.
4. Design and Geometric Limitations
4.1. Displacement and Designing Constraints
The lateral displacements and deflections of beams in steel frames are limited by the steel design codes due to serviceability requirements. According to the ASCE Ad Hoc Committee report [20], the accepted range of drift limits in the first-order analysis is 1/750 to 1/250 times the building height H, with a recommended value of H/400. The typical limits on the inter-story drift are 1/500 to 1/200 times the story height. Based on this report, the deflection limits recommended are proposed in [21,22,23] for general use, which are repeated in Table 3.
Table 3.
Displacement limitations for steel frames.
4.2. Geometric Constraints
In steel frames, it is not desired that the column section for the upper floor not have a larger section than the lower story column for practical reasons. Because having a larger section for the upper floor requires a special joint arrangement, which is neither preferred nor economical. The same applies to the beam-to-column connections. The section selected for any beam should have a flange width smaller than or equal to the flange width of the section selected for the column to which the beam is to be connected, which are named as geometric limits, which can also be seen in Table 4. These limitations are included in the design optimization model to satisfy practical requirements.
Table 4.
Geometric Constraints.
5. Materials Properties
According to the type of structural frames discussed in this research, the specifications of the steel materials used are presented in Table 5.
Table 5.
Steel Material Properties.
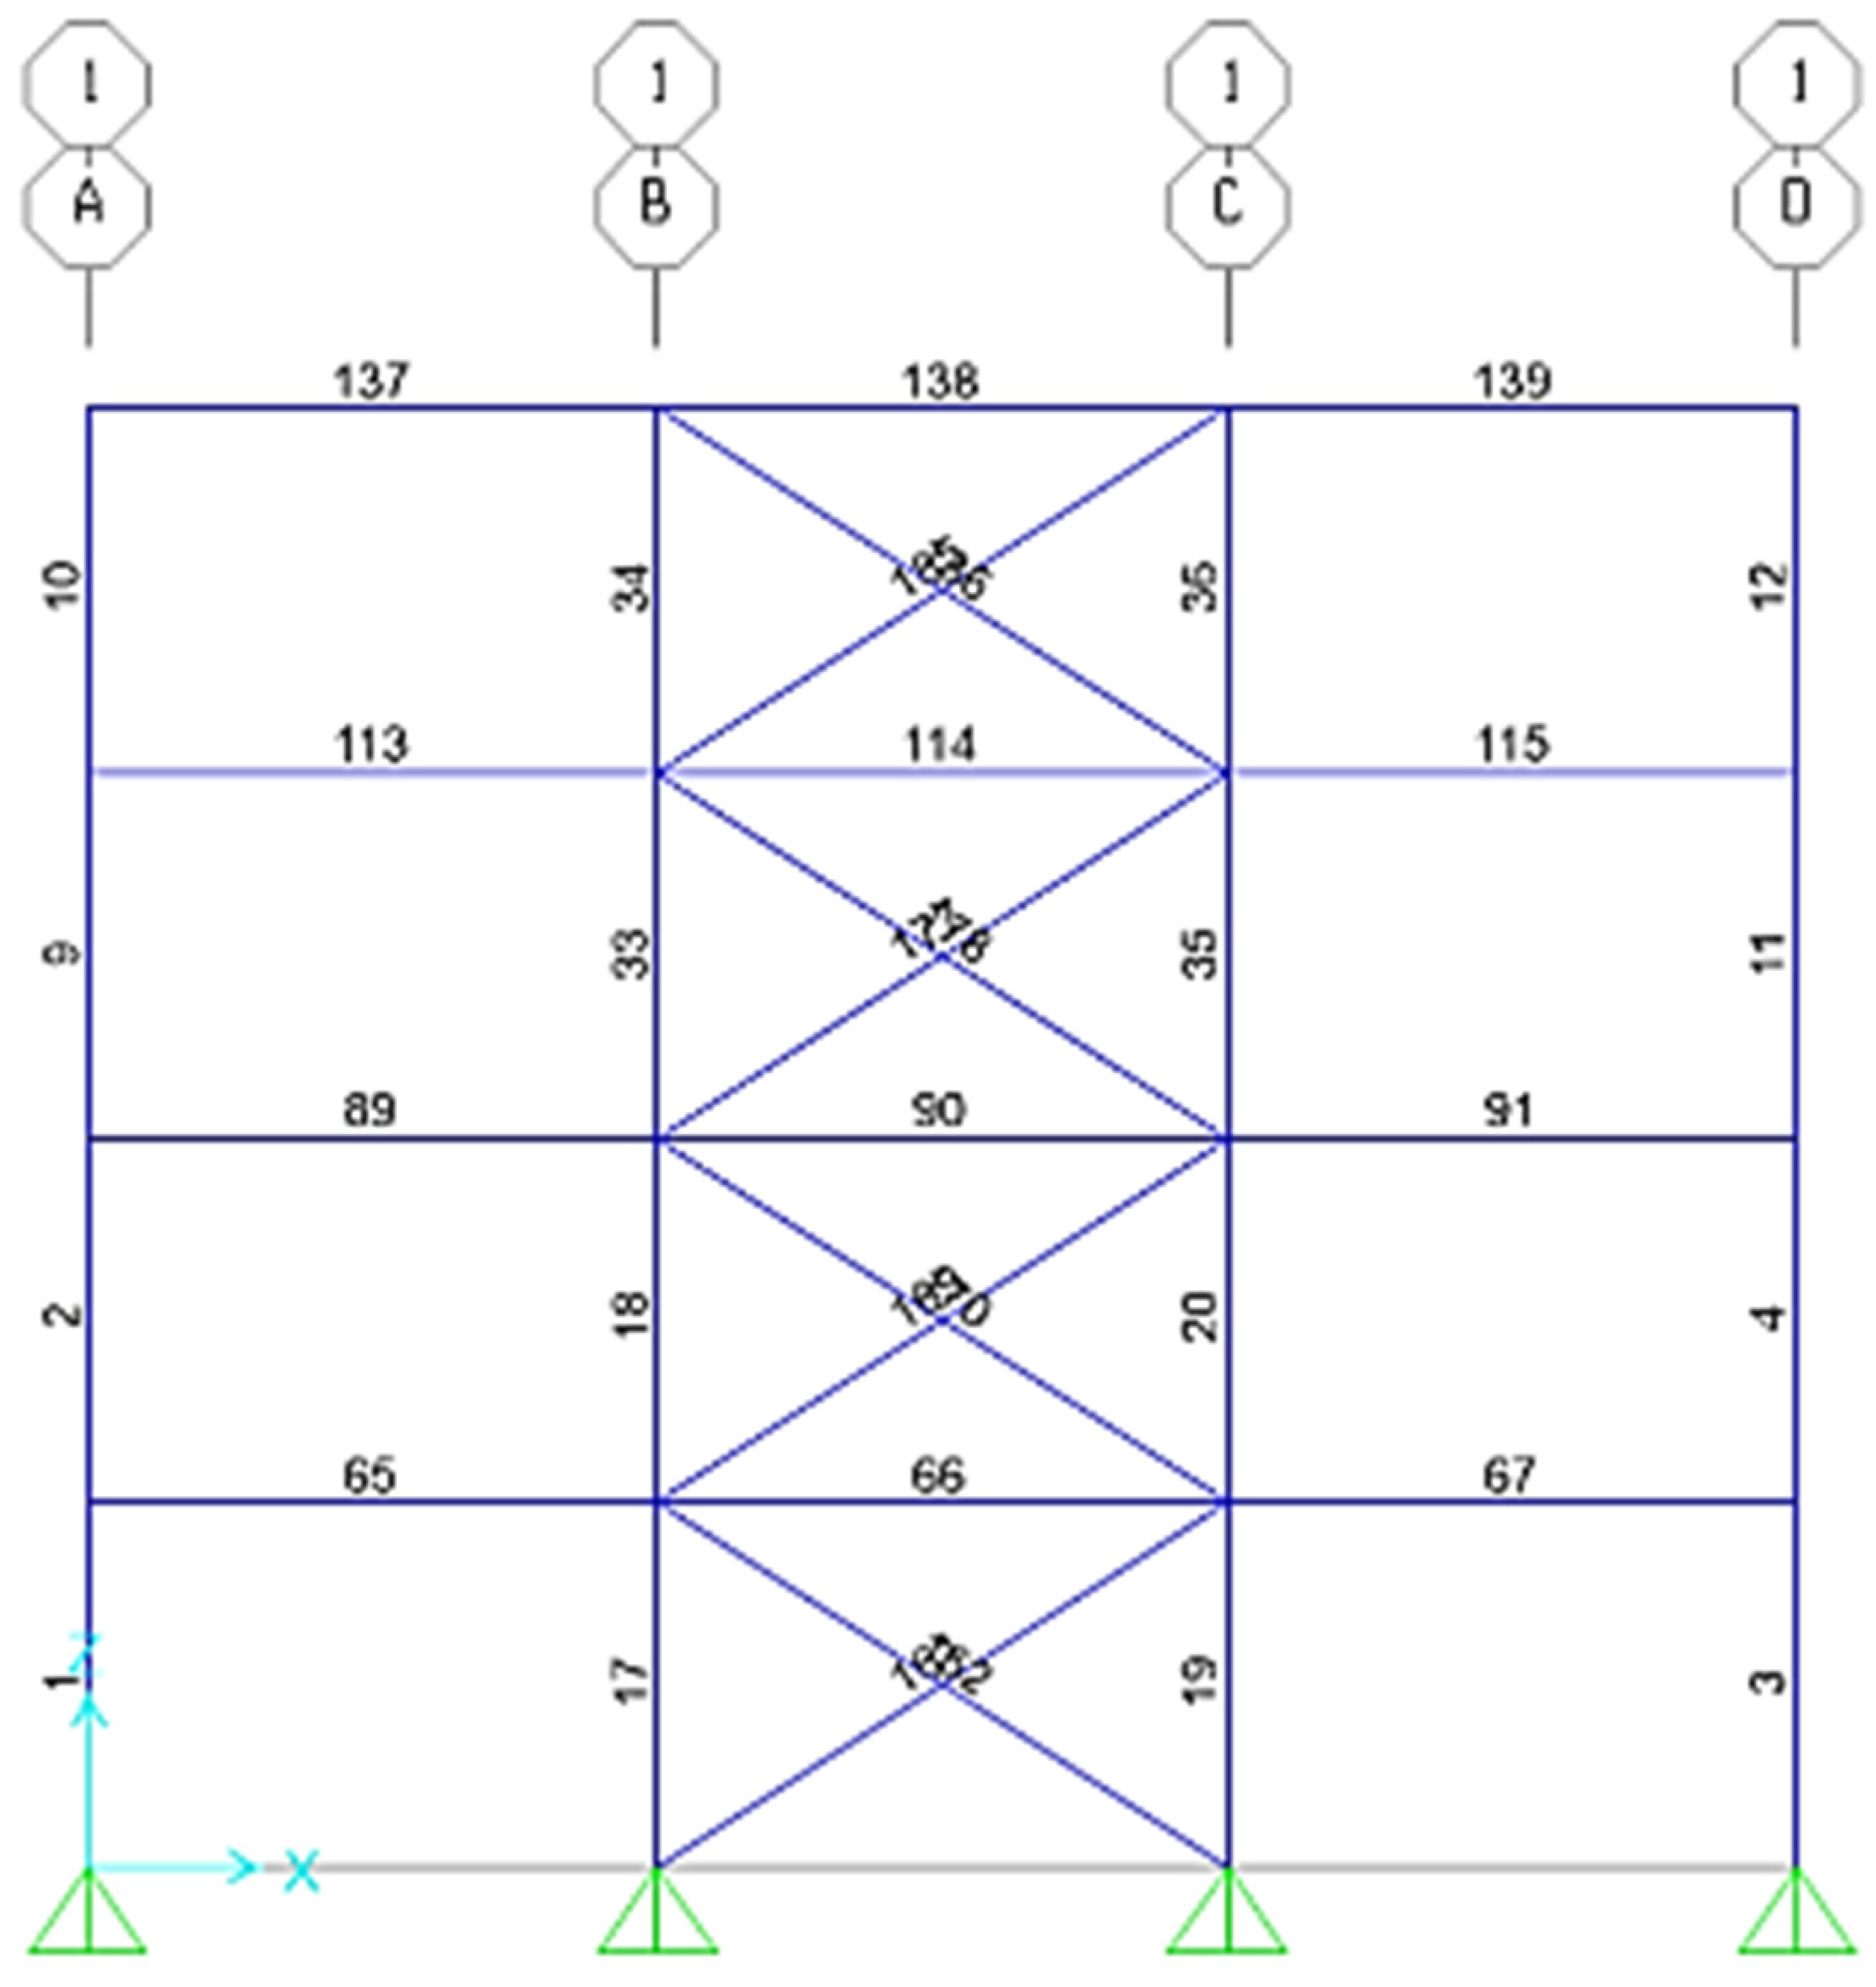
In order to incorporate the volume price of steel into the objective functions, the prices of the profiles were computed based on data from October 2023. It is essential to classify structural members for design and optimization purposes. The predetermined lists of cross-sections provided in Table 2 and Table 3 were utilized for design optimization in structures. Following the design approach, the cross-sections of structural elements were designated as design variables. Structural members were assigned numbers according to a predetermined list. For example, the numbering of structural elements in frame 1 and in the X-Z direction for each of the structural systems is illustrated in Figure 7, Figure 8 and Figure 9. In Figure 7, Figure 8 and Figure 9, numbers on the letters correspond to frame No. 1 in the structure, and each of the letters represents frames perpendicular to frame No. 1.
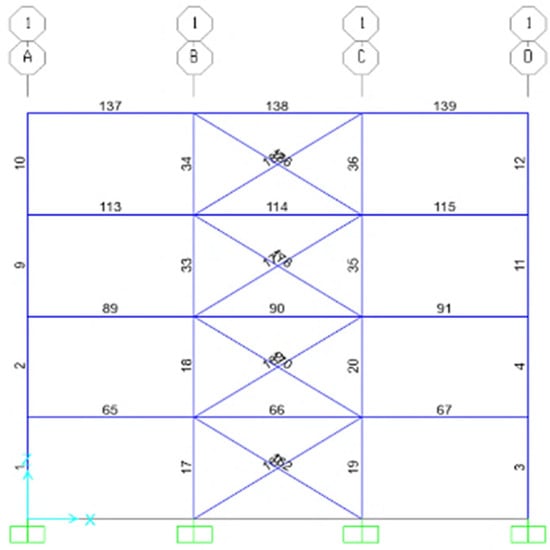
Figure 7.
The number of bracing members in the intermediate steel moment-resisting frame with a special steel concentrically braced frame in frame 1 in the X–Z direction.
Figure 7.
The number of bracing members in the intermediate steel moment-resisting frame with a special steel concentrically braced frame in frame 1 in the X–Z direction.
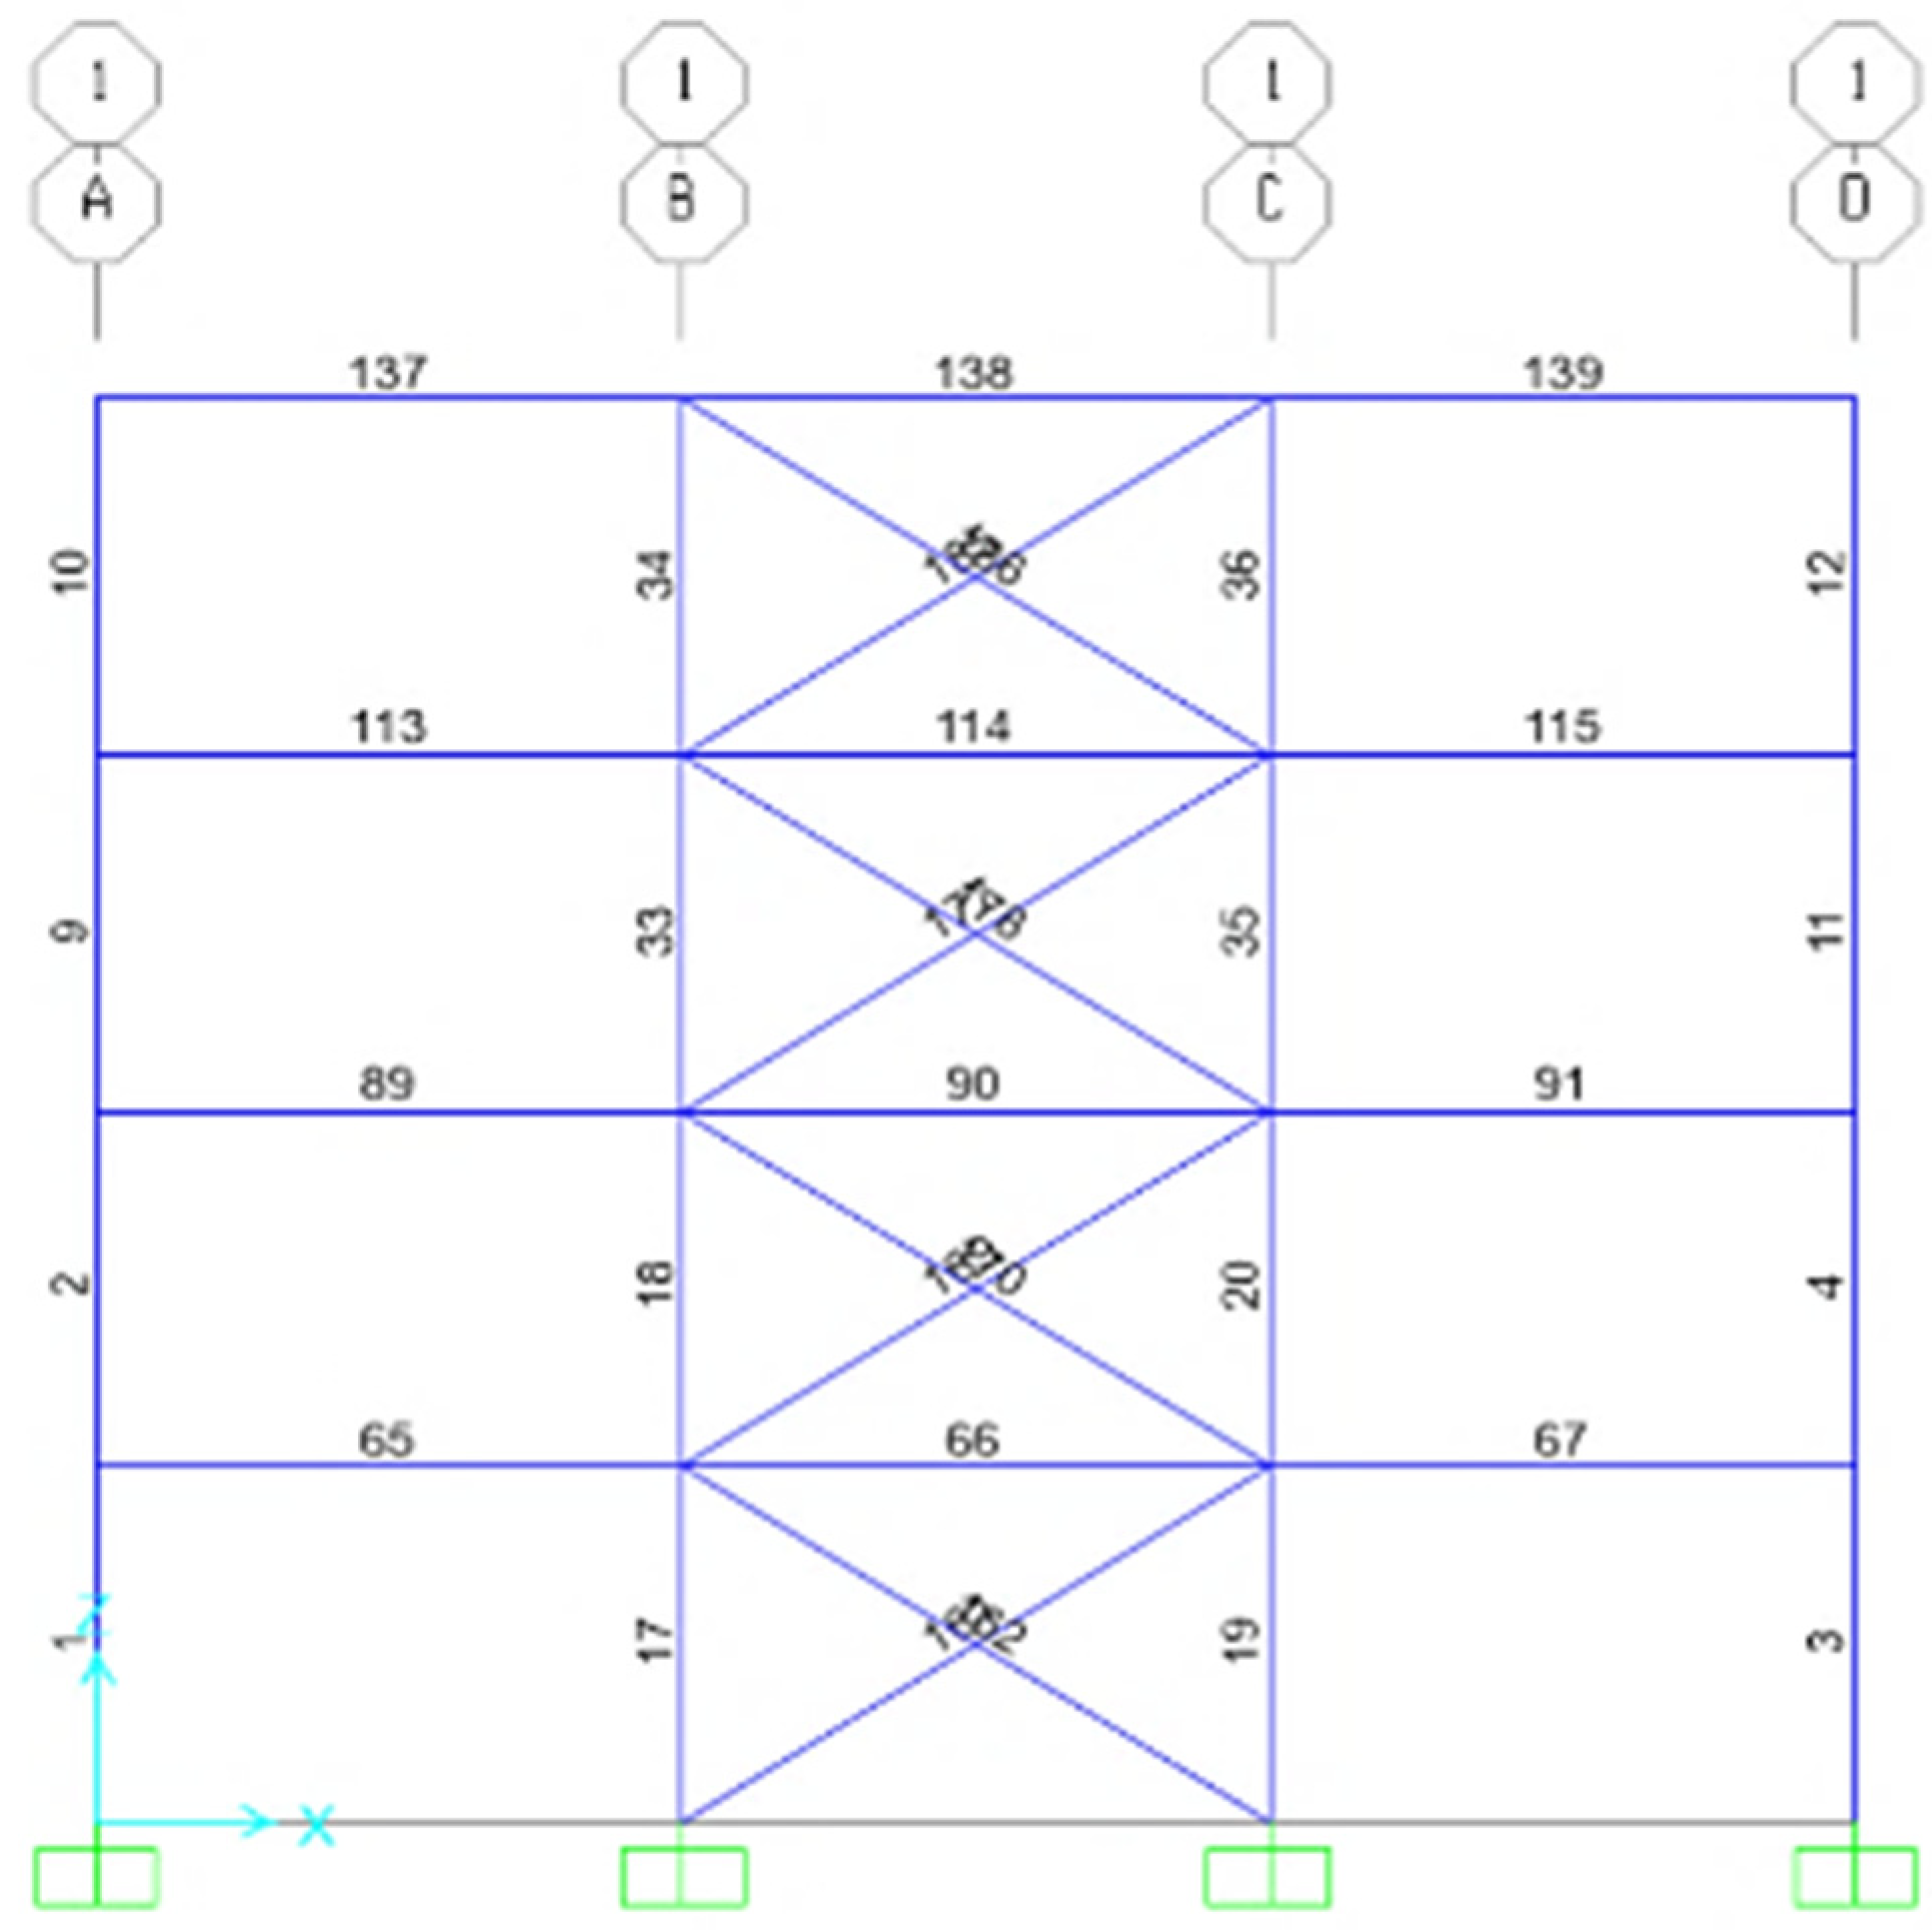
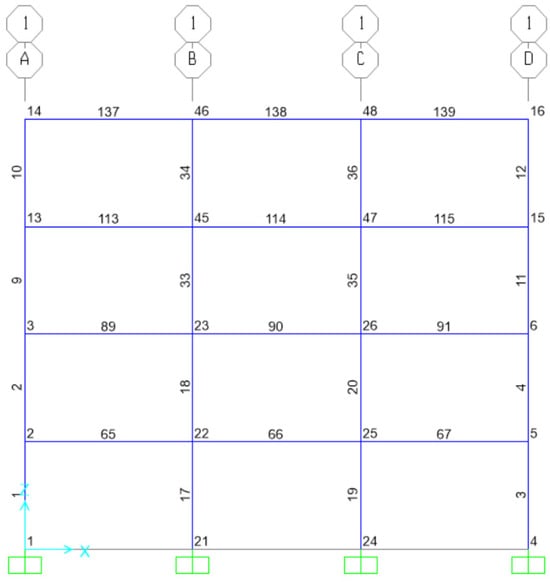
Figure 8.
Number of members in the intermediate steel moment-resisting frame in frame 1 in the X–Z direction.
Figure 8.
Number of members in the intermediate steel moment-resisting frame in frame 1 in the X–Z direction.
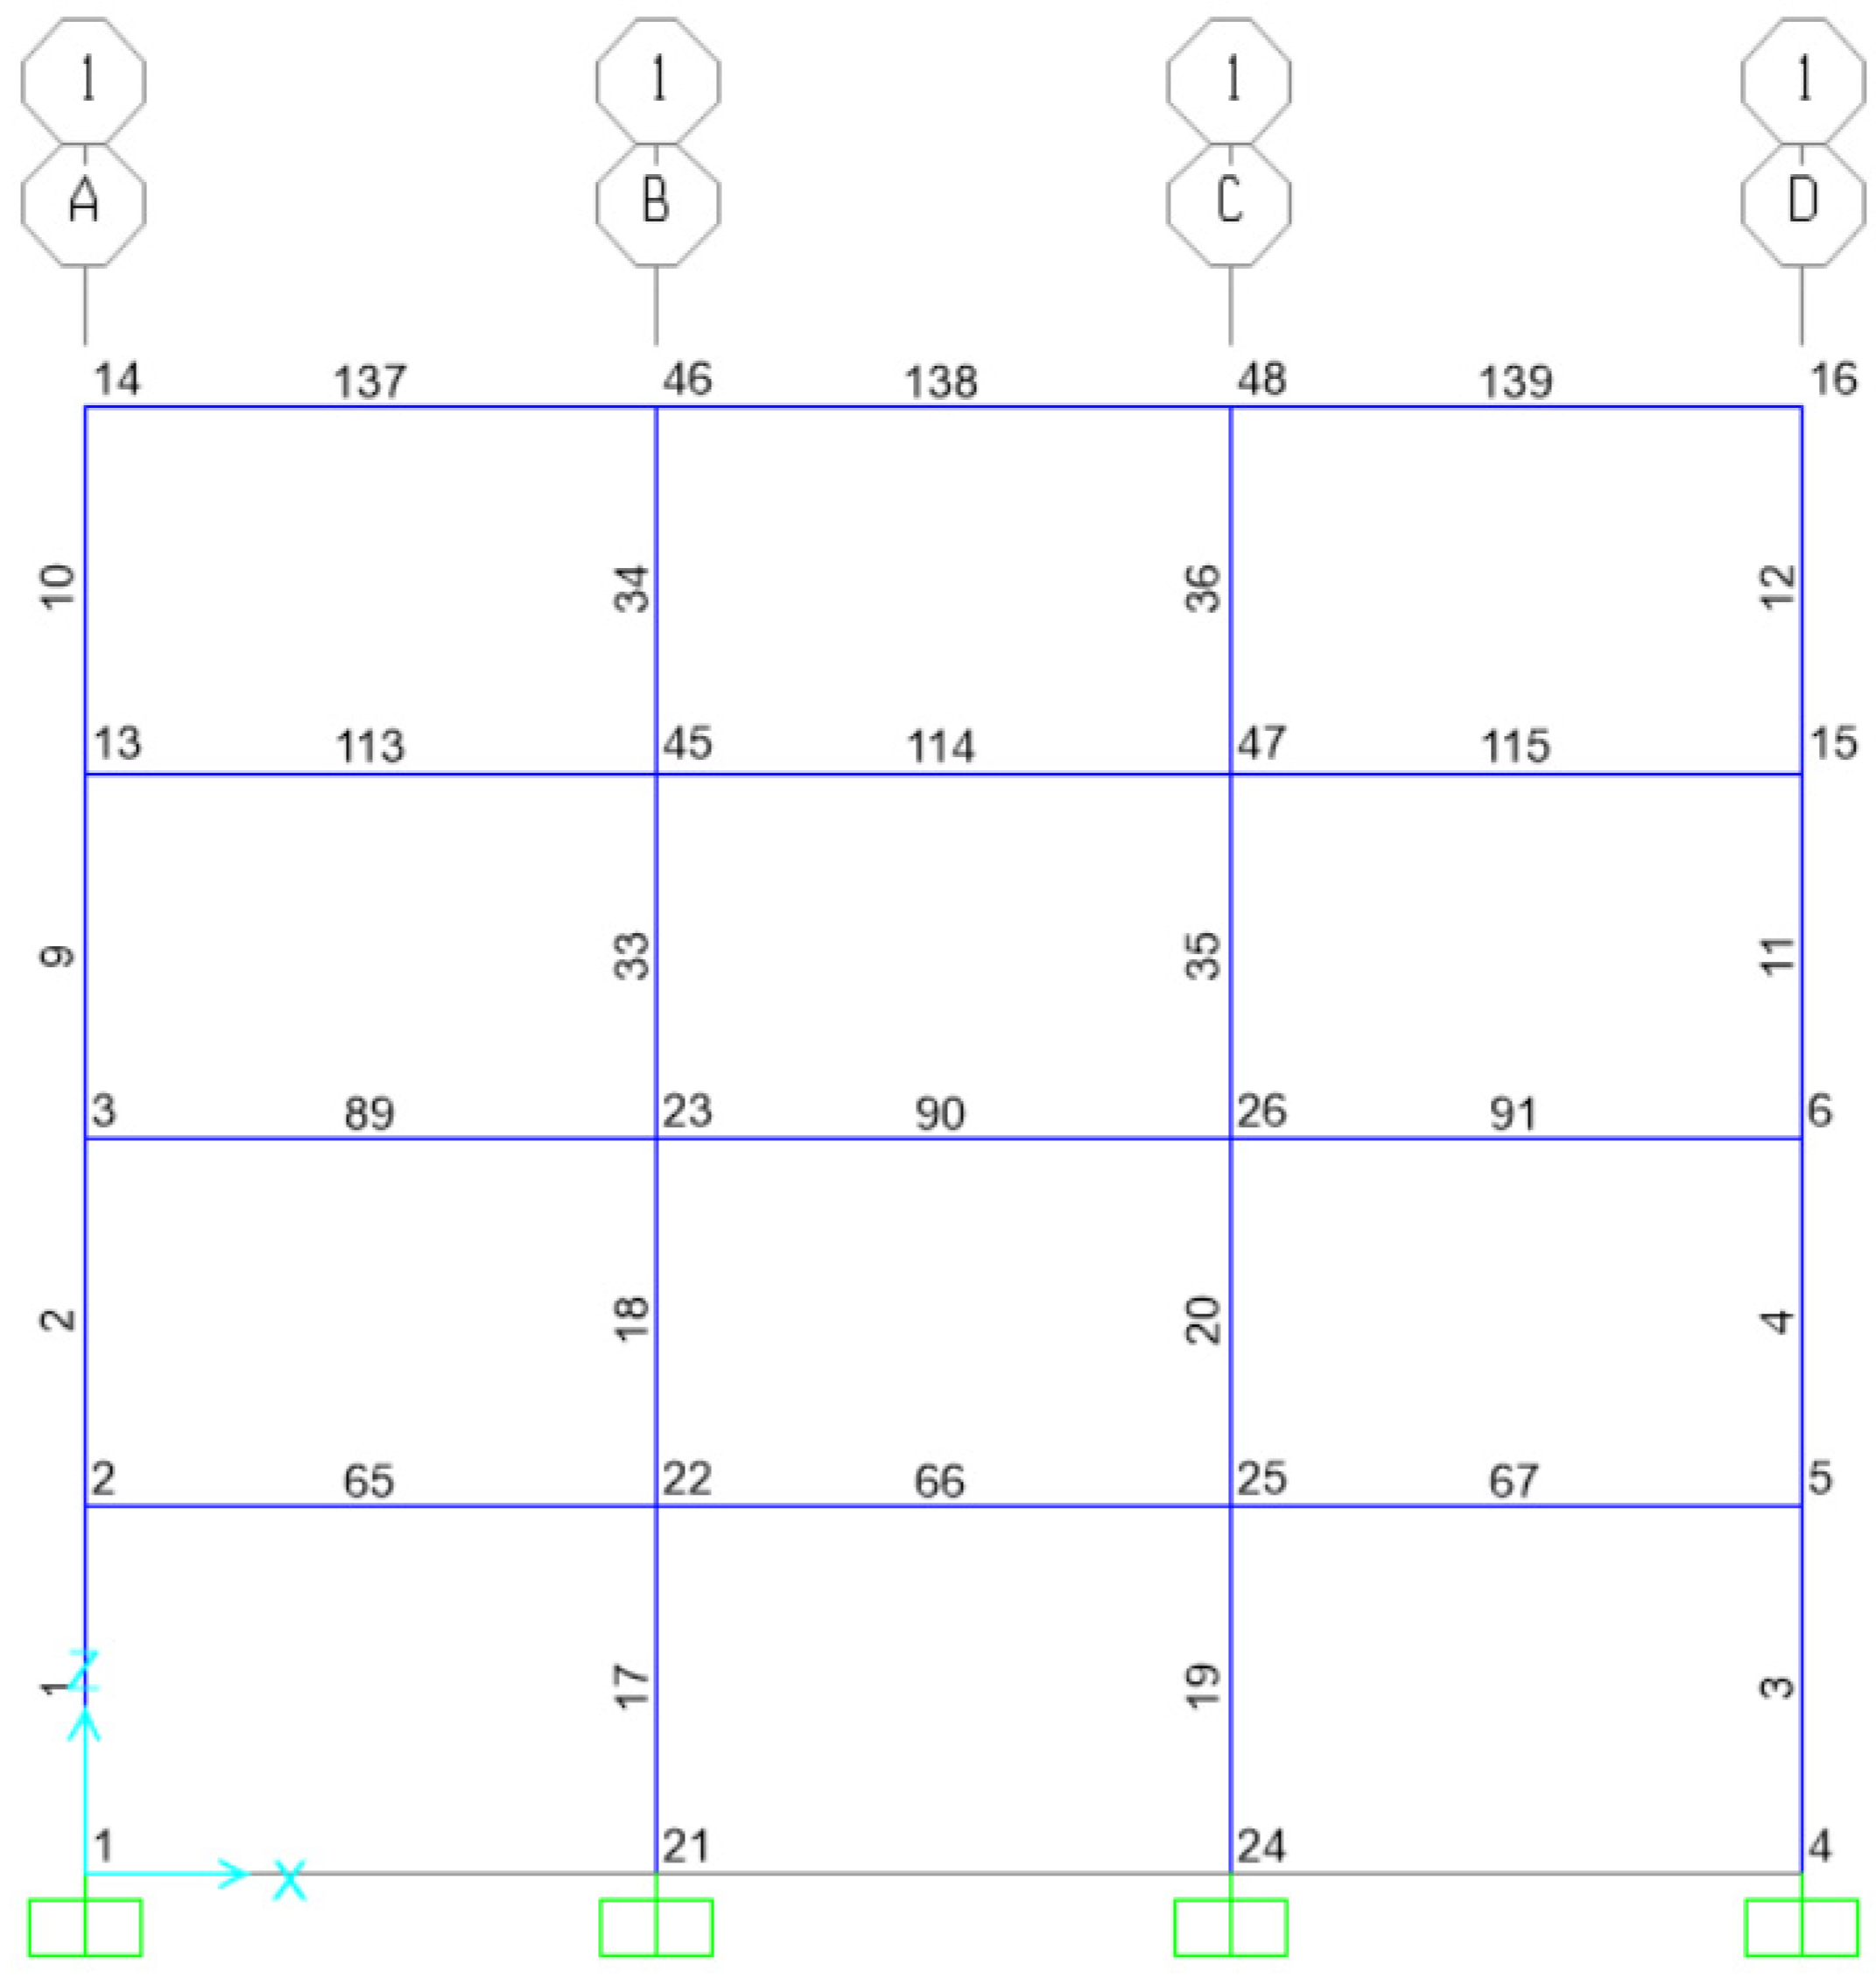
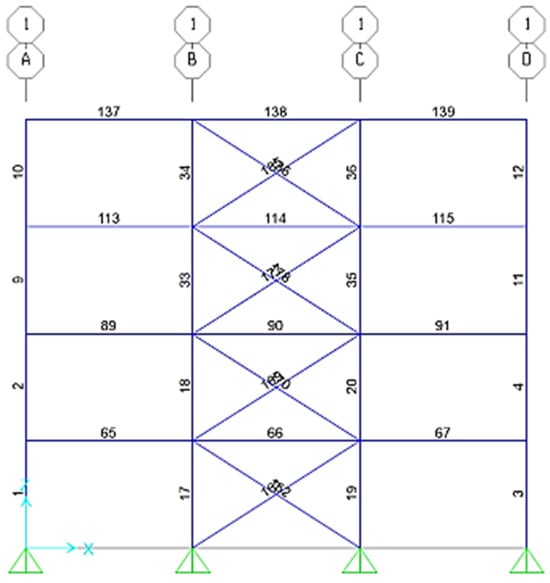
Figure 9.
The number of members in the ordinary braced steel frames in frame 1 in the X–Z direction.
Figure 9.
The number of members in the ordinary braced steel frames in frame 1 in the X–Z direction.
According to the type of elements, classification was done, which can be seen in the following tables. By using this framework, it is ensured that the list of predetermined sections is optimized for all structural members.
The classification of the intermediate steel moment-resisting frame in Table 6 is modeled in the form of 22 decision variables, which is the same area of the steel sections stated in Table 1. The type of steel concentric bracing frame and intermediate steel moment-resisting frame with concentrically braced frame is different from the intermediate steel moment-resisting frame due to the presence of braces in the peripheral frames, and their type is shown in Table 7.
Table 6.
Classification of Structural Members of an Intermediate Steel Moment-Resisting Frame.
Table 6.
Classification of Structural Members of an Intermediate Steel Moment-Resisting Frame.
| Type of Number | Members of Number | Member Type | Floor |
|---|---|---|---|
| 1 | 1–8 | Column | First and second |
| 2 | 9–16 | Column | Third and fourth |
| 3 | 17–32 | Column | First and second |
| 4 | 33–38 | Column | Third and fourth |
| 5 | 49–56 | Column | First and second |
| 6 | 57–64 | Column | Third and fourth |
| 7 | 65–70 | Beam | First |
| 8 | 71–76 | Beam | |
| 9 | 77–82 | Beam | |
| 10 | 83–88 | Beam | |
| 11 | 89–94 | Beam | Second |
| 12 | 95–100 | Beam | |
| 13 | 101–106 | Beam | |
| 14 | 107–112 | Beam | |
| 15 | 113–118 | Beam | Third |
| 16 | 119–124 | Beam | |
| 17 | 125–130 | Beam | |
| 18 | 131–136 | Beam | |
| 19 | 137–142 | Beam | |
| 20 | 143–148 | Beam | Fourth |
| 21 | 149–154 | Beam | |
| 22 | 155–160 | Beam | |
| 160 | Number of all members | ||
| 22 | Total number of decision variables (nVar) | ||
Table 7.
Classification of structural members of intermediate steel moment-resisting frames with special steel concentrically braced frames and simple steel frames with ordinary concentrically braced frames.
Table 7.
Classification of structural members of intermediate steel moment-resisting frames with special steel concentrically braced frames and simple steel frames with ordinary concentrically braced frames.
| Type Number | Member Number | Member Type | Floor |
|---|---|---|---|
| 1 | 1–8 | Column | First and second |
| 2 | 9–16 | Column | Third and fourth |
| 3 | 17–32 | Column | First and second |
| 4 | 33–48 | Column | Third and fourth |
| 5 | 49–56 | Column | First and second |
| 6 | 57–64 | Column | Third and fourth |
| 7 | 65–70 | Beam | First |
| 8 | 71–76 | Beam | |
| 9 | 77–82 | Beam | |
| 10 | 83–88 | Beam | |
| 11 | 89–94 | Beam | Second |
| 12 | 95–100 | Beam | |
| 13 | 101–106 | Beam | |
| 14 | 107–112 | Beam | |
| 15 | 113–118 | Beam | Third |
| 16 | 119–124 | Beam | |
| 17 | 125–130 | Beam | |
| 15 | 113–118 | Beam | |
| 19 | 137–142 | Beam | Fourth |
| 20 | 143–148 | Beam | |
| 21 | 149–154 | Beam | |
| 22 | 155–160 | Beam | |
| 23 | 161–168 | Brace | First |
| 24 | 169–176 | Brace | Second |
| 25 | 177–184 | Brace | Third |
| 26 | 185–192 | Brace | Fourth |
| 192 | Number of all members | ||
| 26 | Total number of decision variables (nVar) | ||
6. Objective Functions
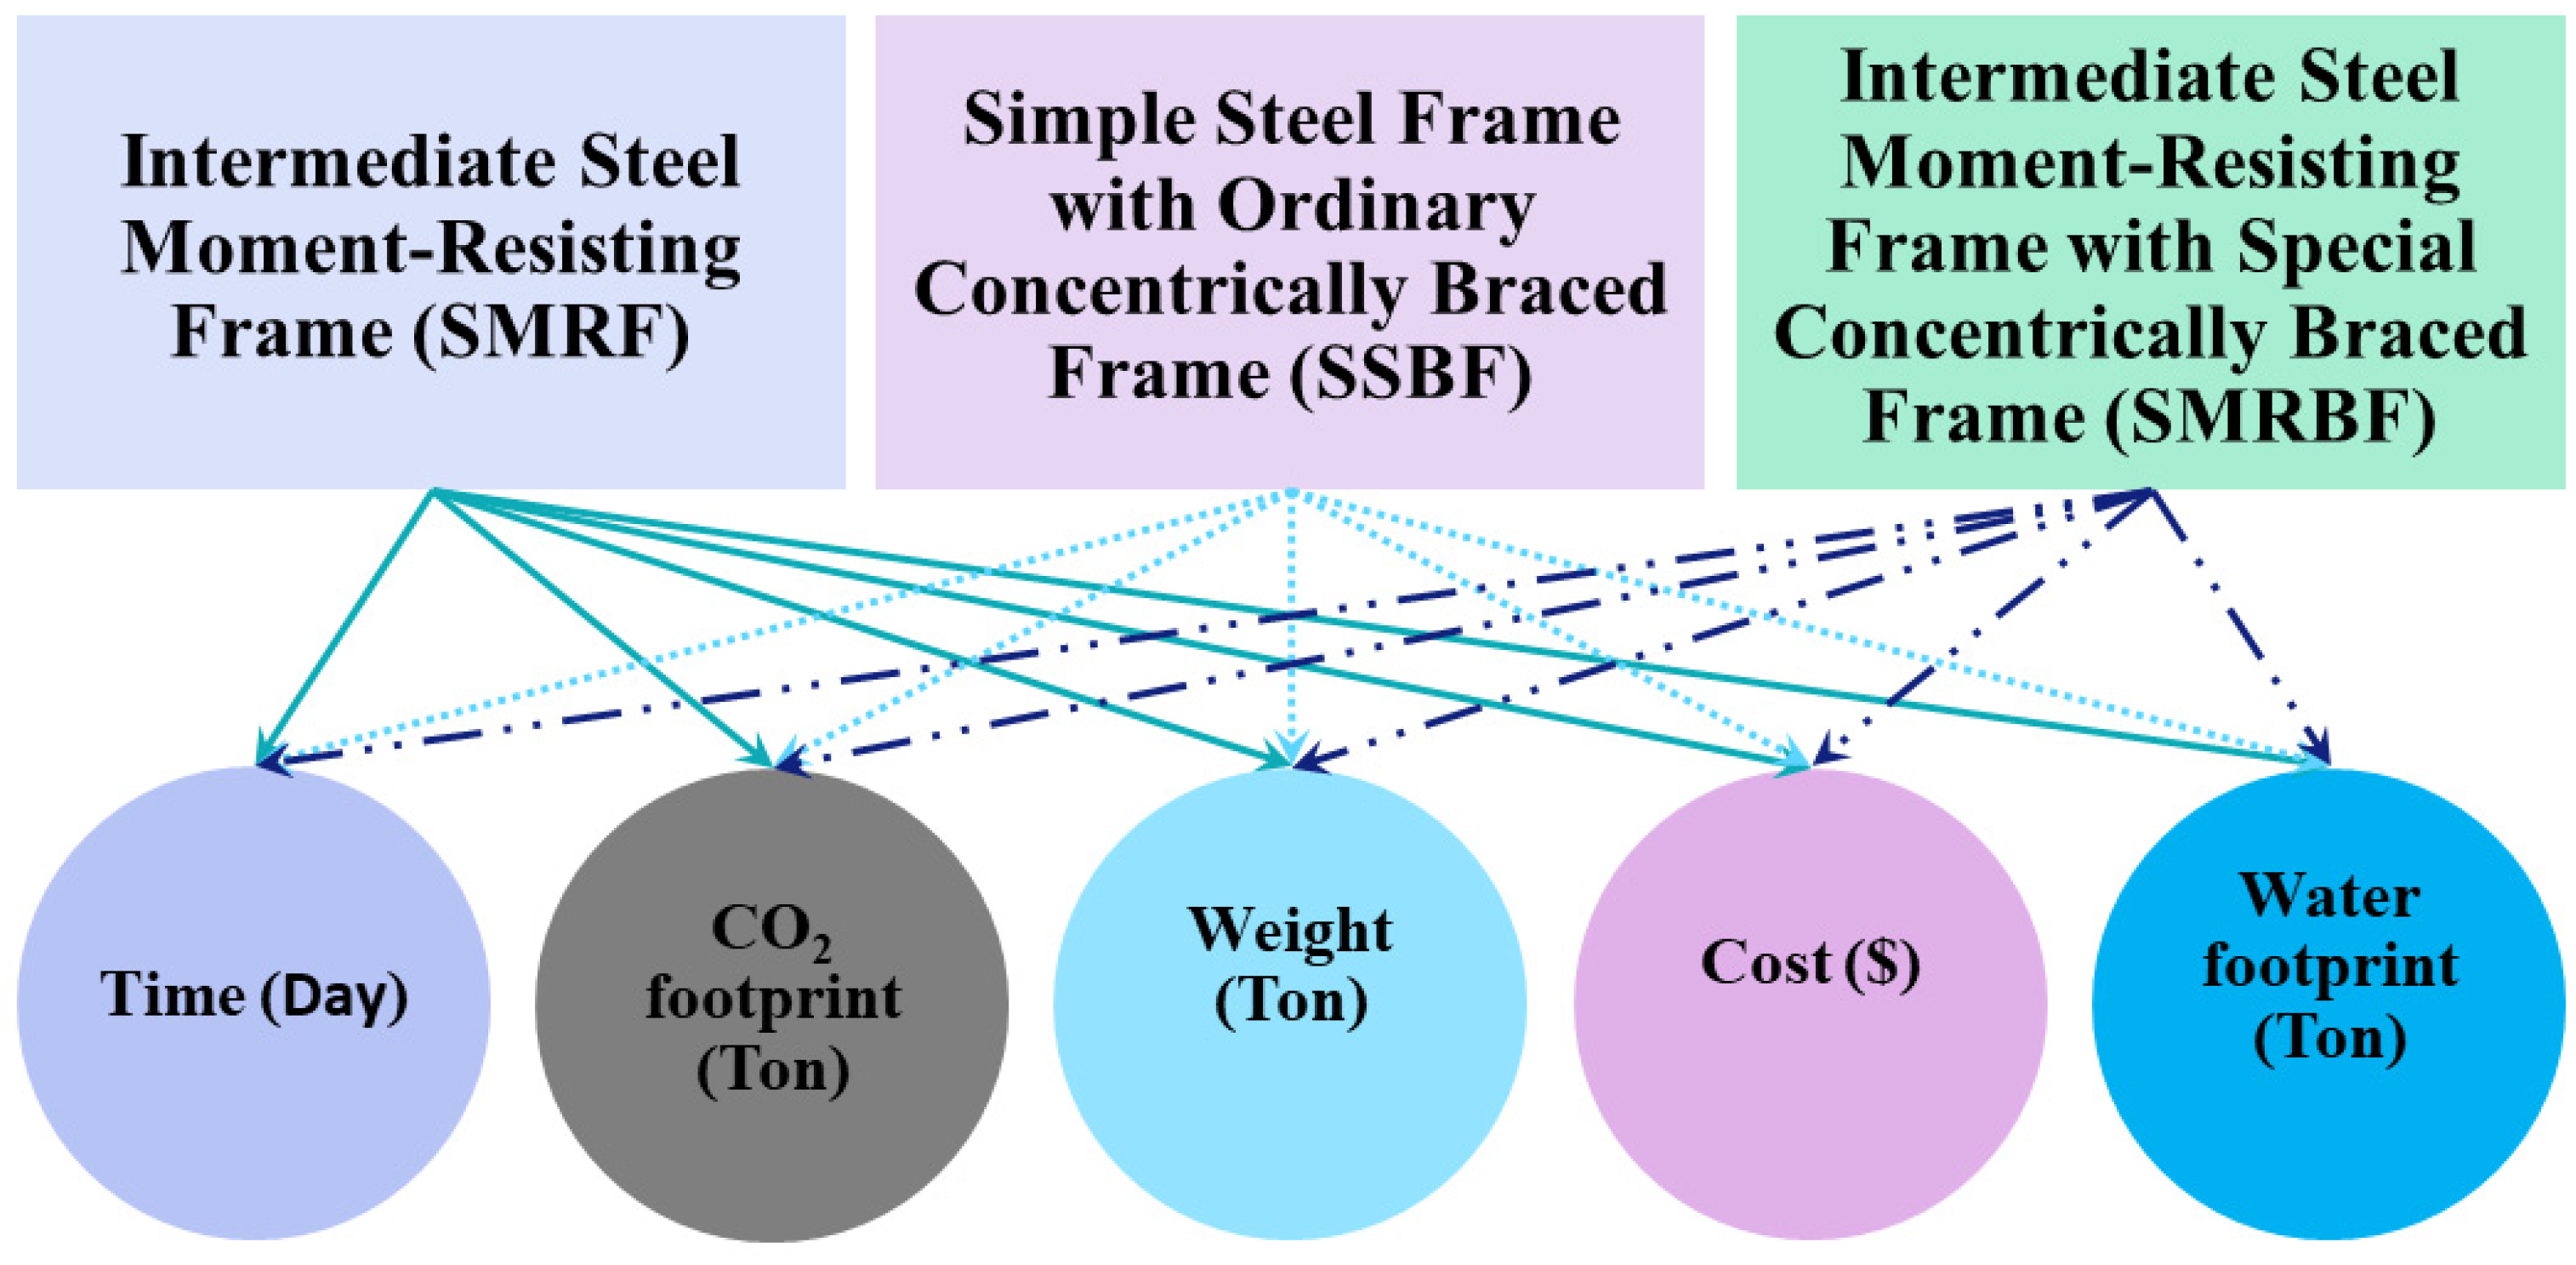
In the design optimization of structural members, the objective functions are evaluated for the studied structures. As can be seen in Figure 10, the objective functions studied are the weight of the structure, the carbon dioxide produced and the water consumed during the production of materials, and the cost and construction time for each of the structures with an intermediate steel moment-resisting frame with a special steel concentrically braced frame, an intermediate moment-resisting steel frame, and a simple steel frame with an ordinary concentric steel brace. The values and indicators in Figure 10 have been chosen based on the parameters affecting the designed structures, considering the amount of air pollution as well as the level of environmental drought in Iran. These parameters have been proposed as variable functions in the algorithm. The details of Figure 10 are described in the following sections.
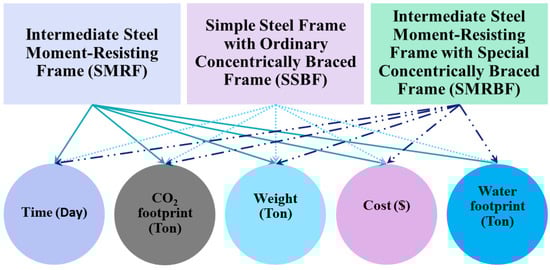
Figure 10.
The objective functions for each study frame.
6.1. Weight
In recent designs, optimizing structures for the lowest weight has become very important. One of the most important advantages of reducing the weight of the structure is the reduction in the seismic force on the structural frames. In this research, one of the target functions is the weight of the structural frames in the studied structural systems. It is also necessary to determine the weight of each of the structural frames due to the dependence of some other objective functions of the research on the weight of the structure. Equation (5) is used to calculate the weight of structural members in all studied steel frames, which is obtained from the results of this research.
In the above relationship, (), () and () represent the cross-sectional area of each member, the length of the structural member, and the specific weight of the steel, respectively.
6.2. Produced Carbon Dioxide
In the process of producing building materials, a significant amount of carbon dioxide is produced, the importance of which cannot be denied in any way. Therefore, the investigation and measurement of carbon dioxide resulting from the production of building materials in order to minimize it as an environmental pollutant is of high importance. In steel structures, the most important source of carbon dioxide production and emissions is associated with the steel production process. The amount of carbon dioxide produced is calculated using Equation (6), which is obtained from the results of this research.
In the above relation () represents the amount of carbon dioxide emission per ton of steel production, which is mentioned in Table 6. Moreover, is the weight of structural members obtained from Equation (5).
6.3. Time
Construction duration is essential in construction management, as time is an important concept in project progress. The execution time of steel structures can vary by changing the type of steel structure system. The function of time required for the construction of structures in steel frames is calculated according to Equation (7) [26].
In the above relationship, C1 is a parameter dependent on the welding technology, which is usually assumed to be equal to 1. and are equal to the specific weight of steel and the profile volume of the steel structure, respectively. is a coefficient, determined based on the type and technology of welding, and it is assumed to be equal to 0.78890 because the type of welding in all studied structures is welding with a manual electrode and arc welding with a covered electrode. C3 is a coefficient related to cutting technology, and in this research, cutting technology, acetylene with normal speed, is considered. As a result, C3 is equal to 1.13880. Also, is a hardness coefficient that varies according to the type of welding, which is equal to 2.5 for columns and beams that are IPE pairs, as well as 2.5 for braces that are UPE pairs, and for beam connections, the column in the joint connection is considered equal to 4. It is considered equal to 2.5 in the connector connections. κ is the number of structural elements, weld dimension, weld length, sheet thickness, is the cutting length of the steel structural member. The value of n in the studied structures is considered equal to 0.25.
6.4. Cost
The construction cost of steel structures consists of two parts: the cost of materials and the cost of framing, which is itself a function of time and is determined from Equation (8) [26].
According to the study (Jarmai, K.), in relation (8), is a coefficient of the volume price of steel (), which is determined based on the country and its level of development. The different values of this coefficient are shown in Table 8. Also, the value adopted for the study site is considered equal to 0.75, and is the volume price of steel. The parameter is also calculated from Equation (7). The amount of salary related to Iran has been calculated and chosen on average based on the economic situation between developed countries and third-world countries.
Table 8.
Wage coefficient.
6.5. Consuming Water
Due to limited water resources and solving the problems caused by water shortages, it is necessary to determine the level of involvement and consumption of each industry and activity. Construction activities, along with related industries, can be considered one of the biggest consumers of natural resources such as water. One of the goals of the research is to determine a structure that uses less water to produce its materials. Therefore, water consumption is another target function of this research. In order to calculate the amount of water consumption, it is enough to multiply the weight of steel in structural members according to Equation (5) by the amount of water consumption per ton of steel production which is stated in Table 6. Finally the calculation of the value of this objective function for the studied steel frames will be according to Equation (9).
7. Discussion and Results
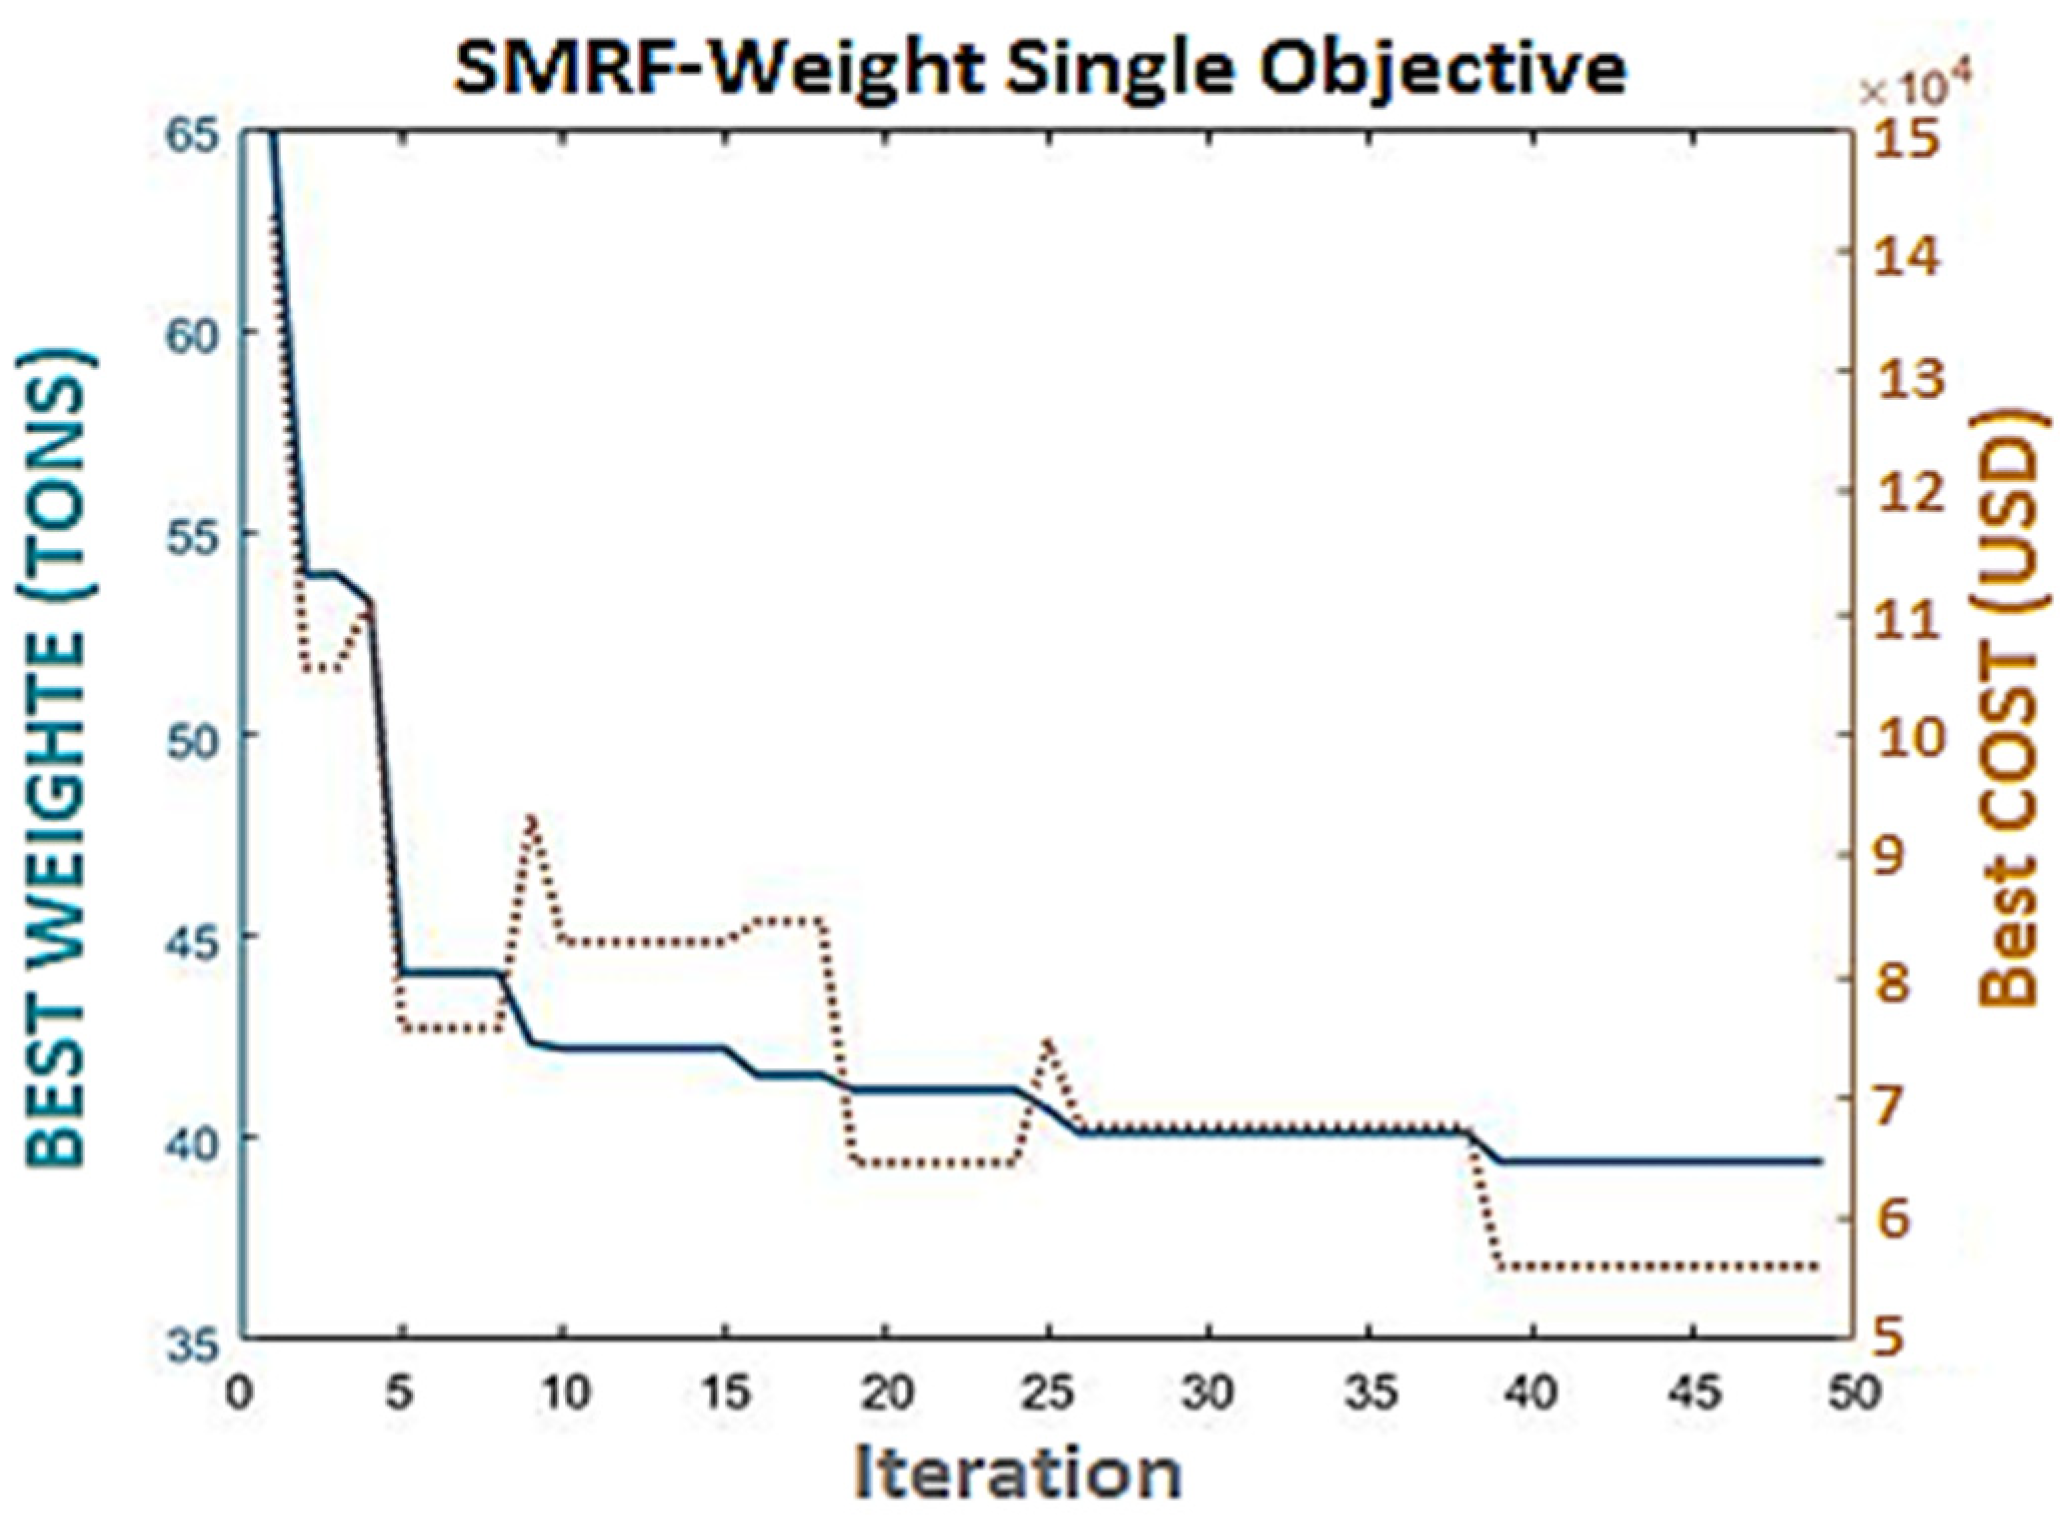
7.1. Algorithm Results in Single-Target Mode
In order to investigate the dependence of the progress of other objective functions on weight, as a single objective among the three structural systems under investigation, the results of the optimization of the medium steel bending frame were presented as an example.
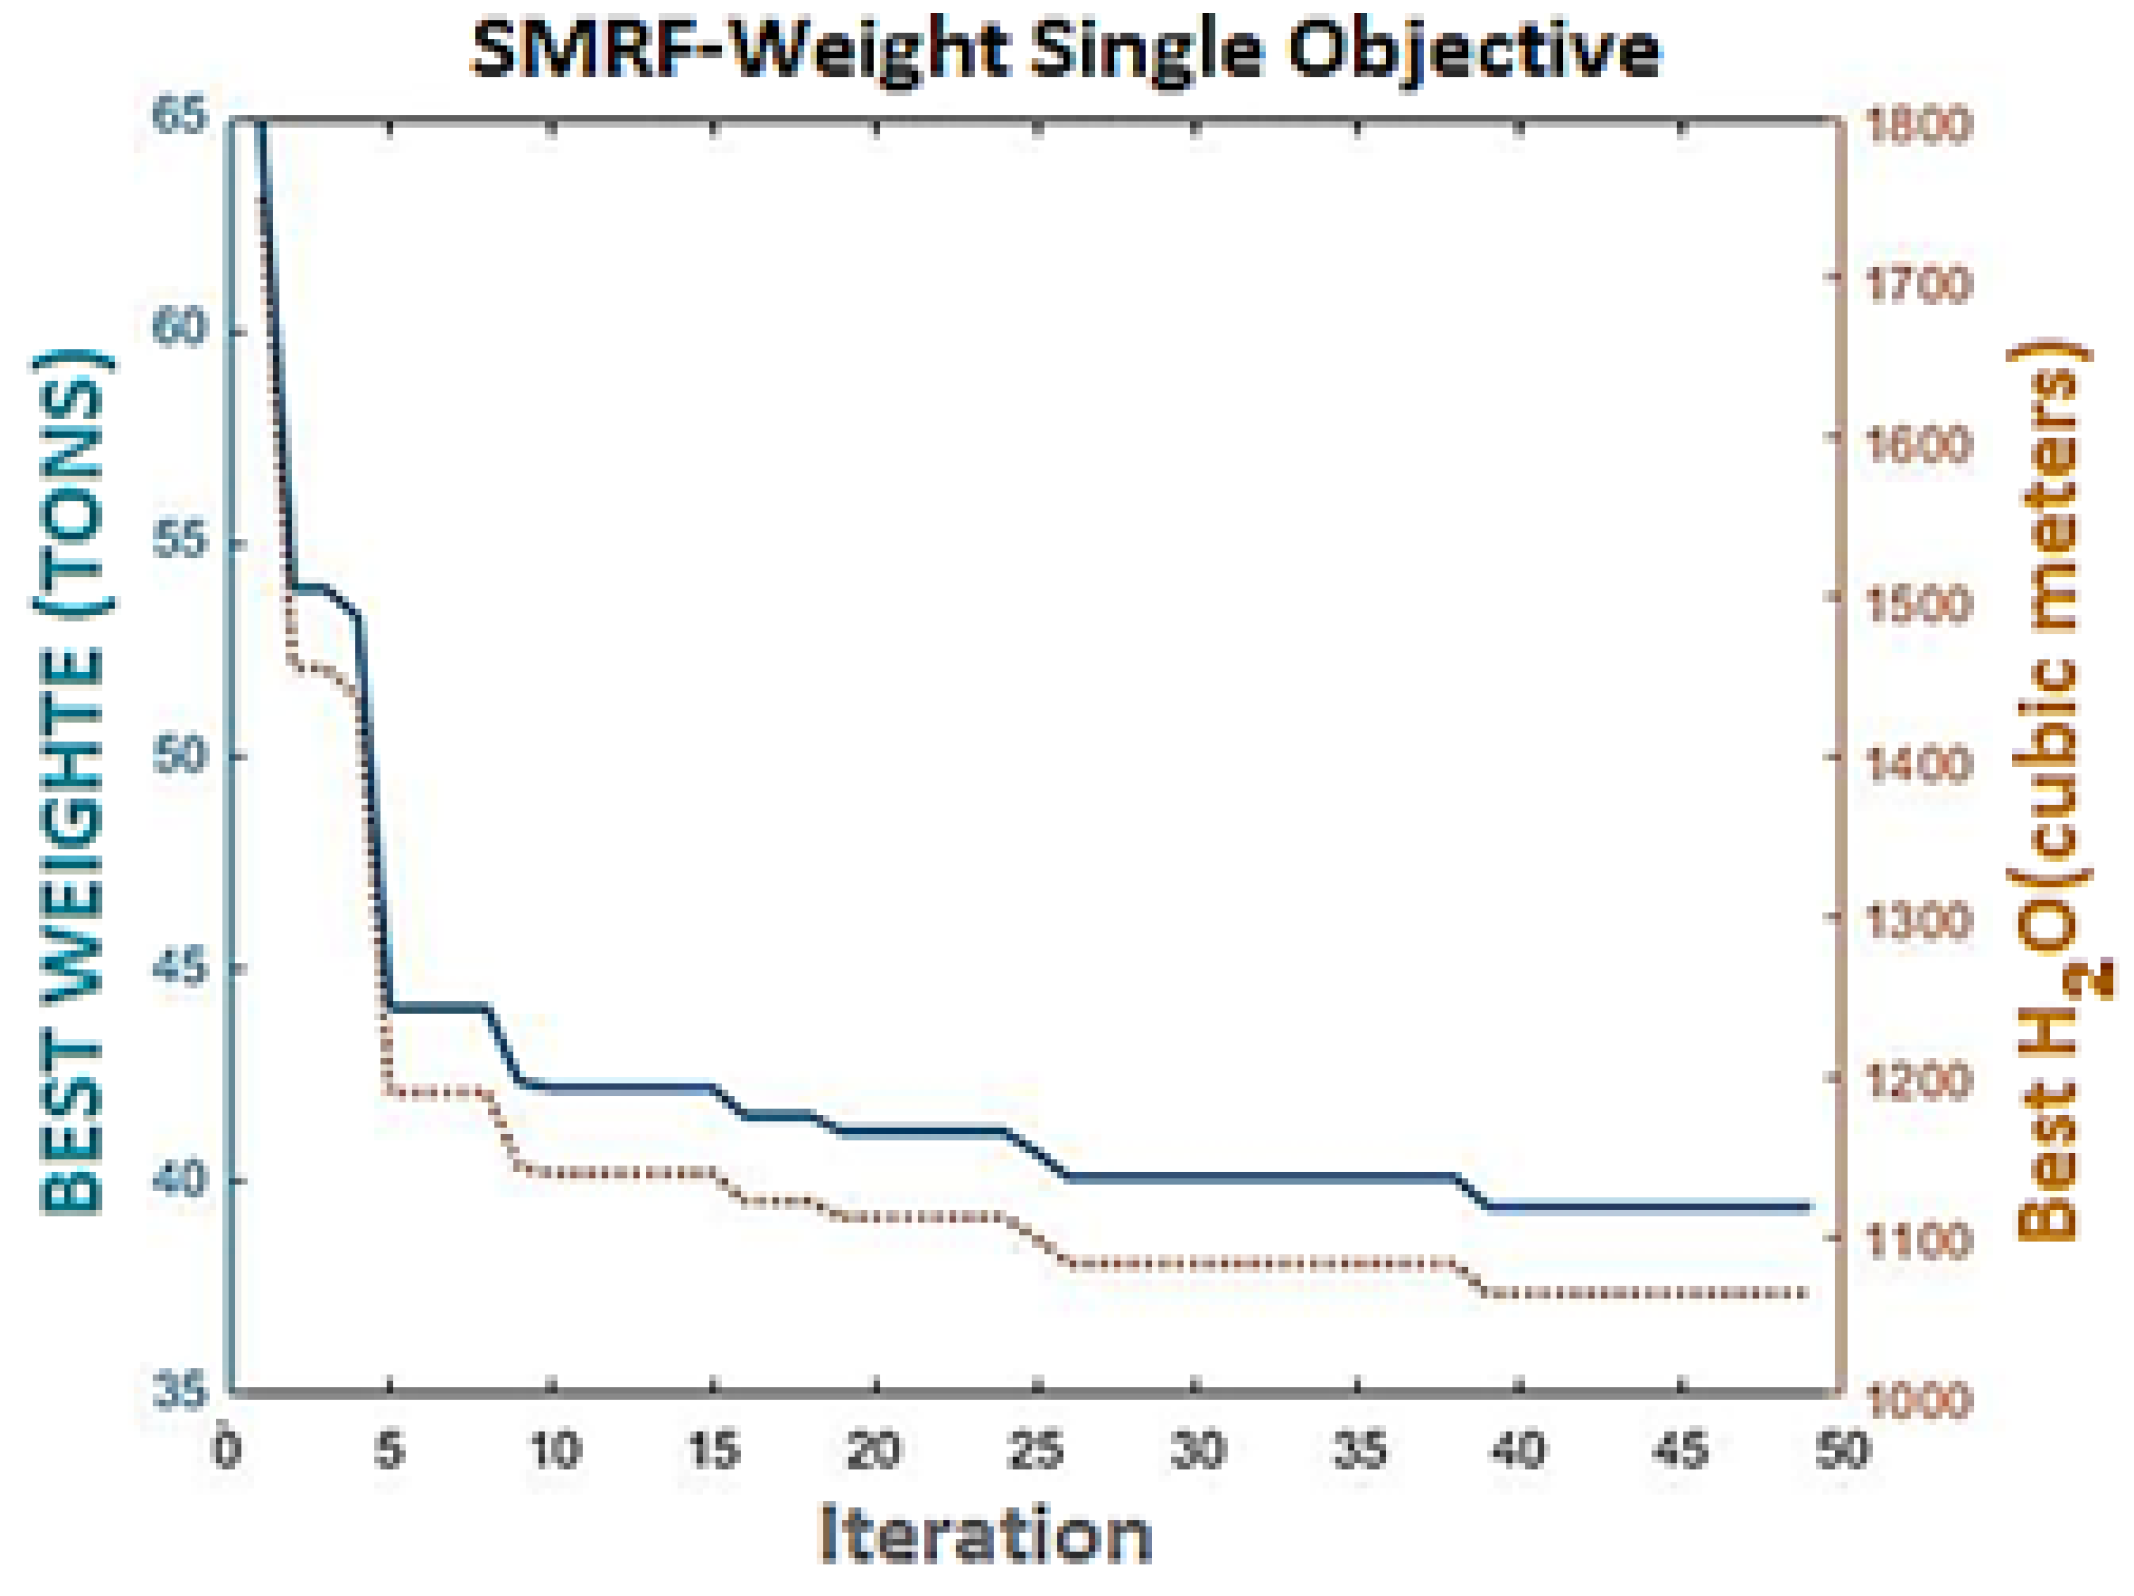
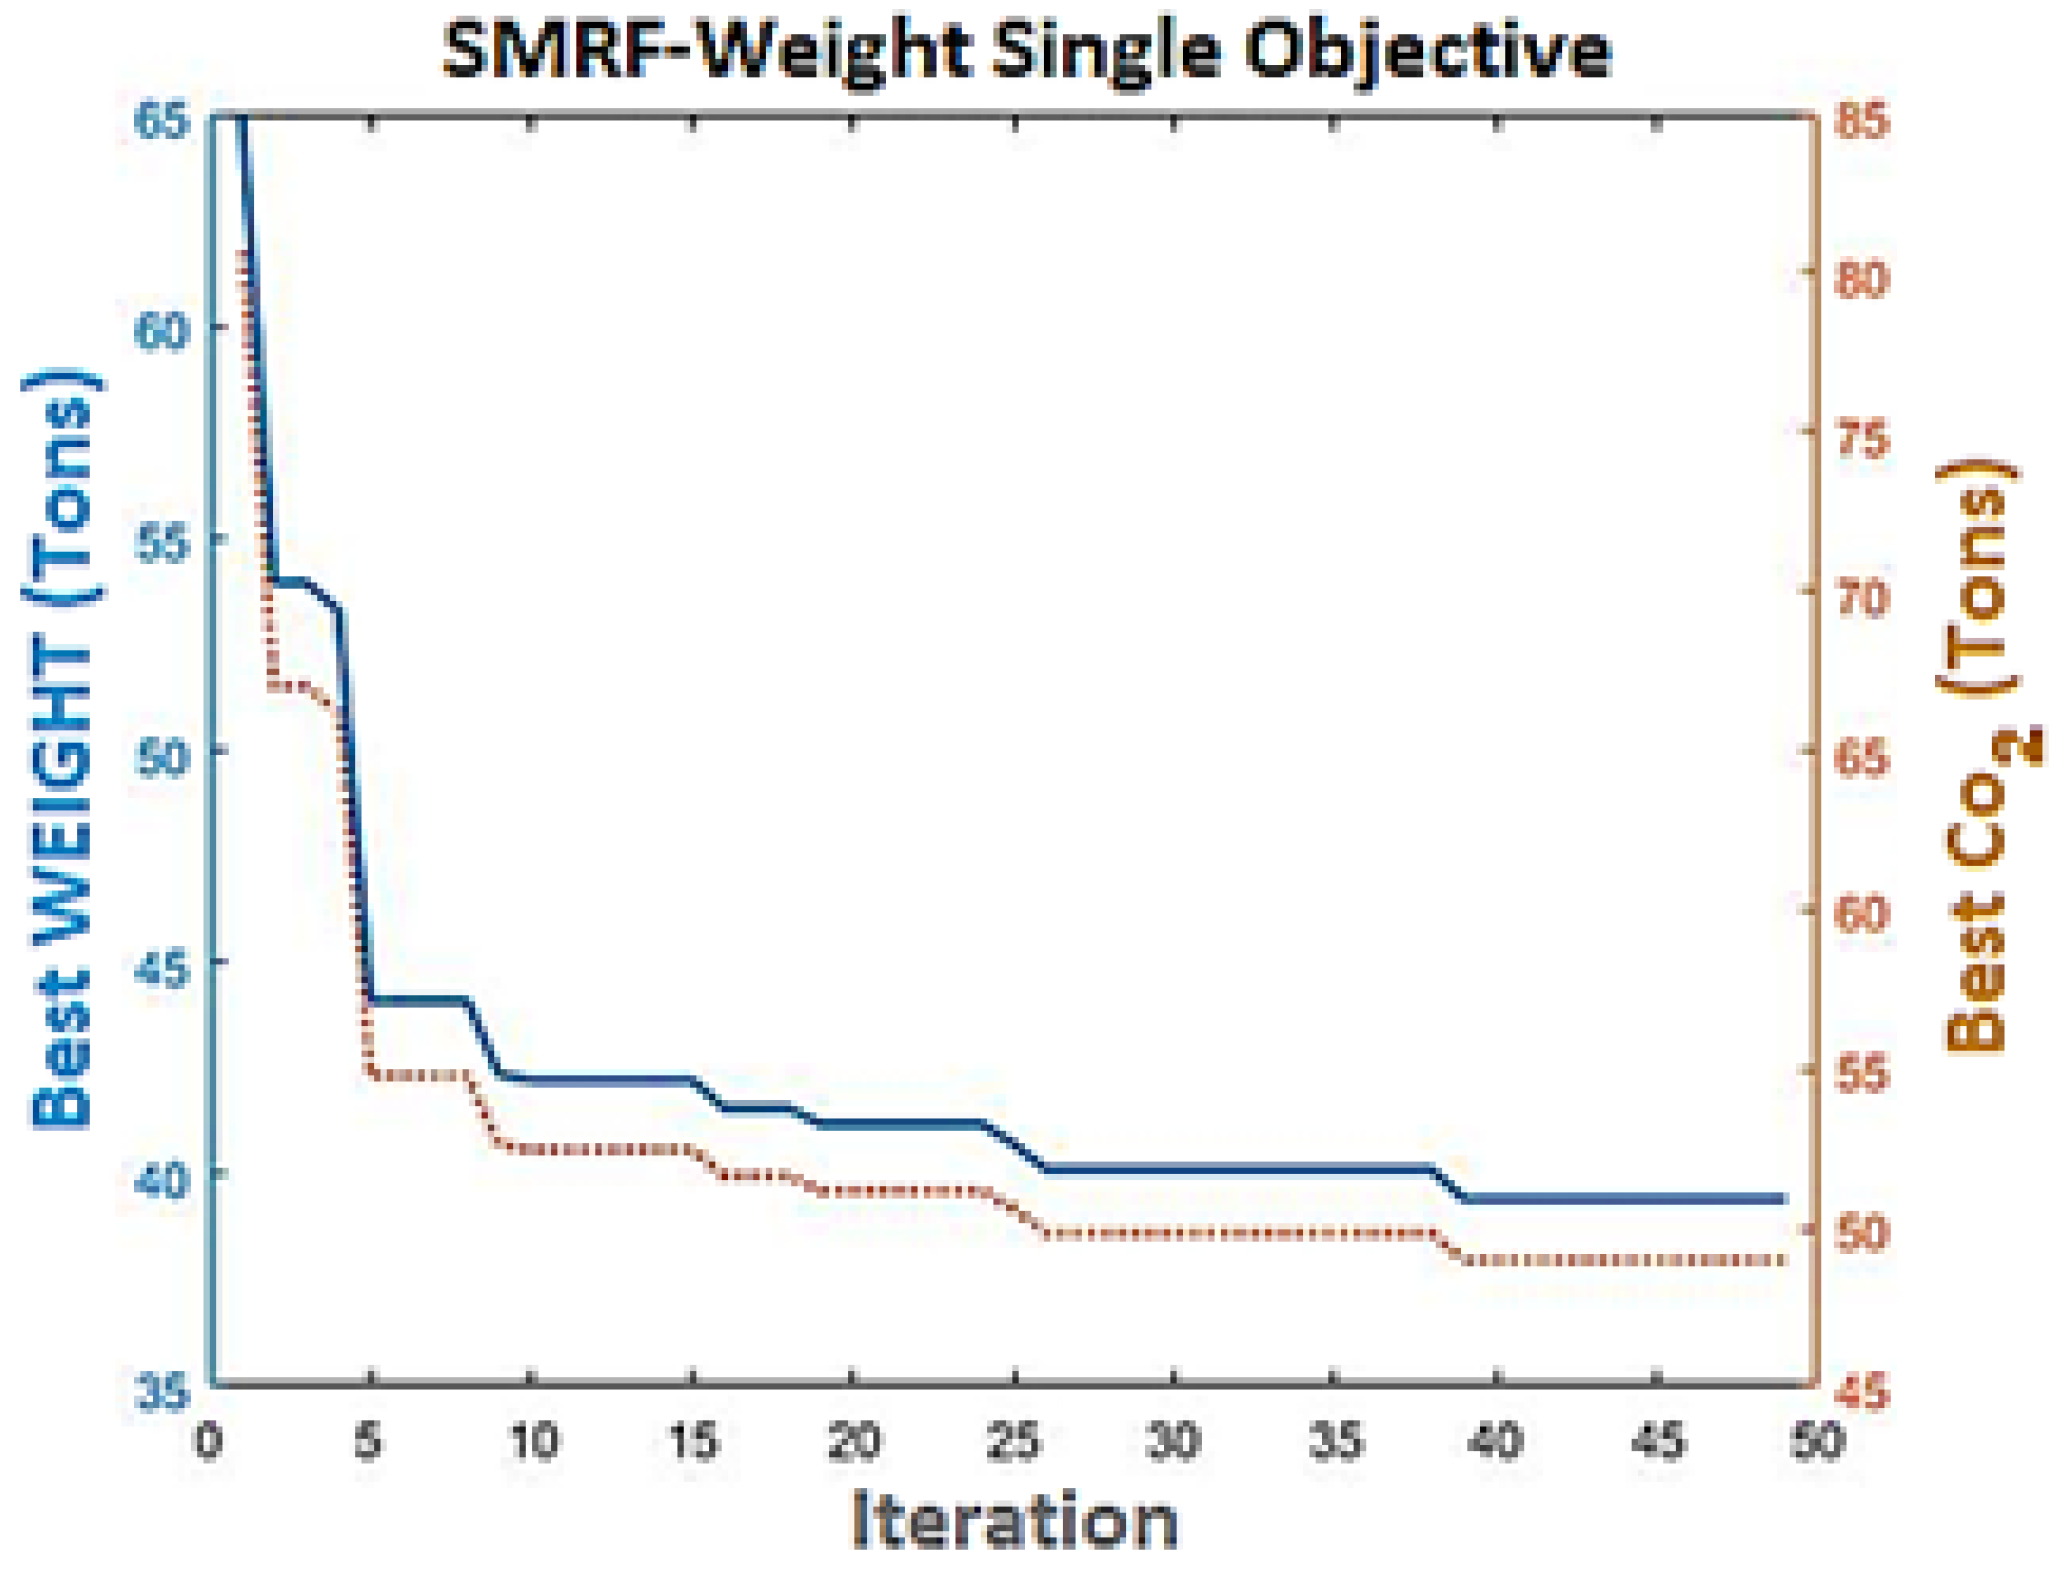
As can be seen in Figure 11 and Figure 12, in the structure with an intermediate steel moment-resisting frame system, due to the dependence of weight, water, and carbon on the volume of steel, the progress of the algorithm is exactly the same, and with the reduction in footprint weight Carbon leads to a reduction in water.
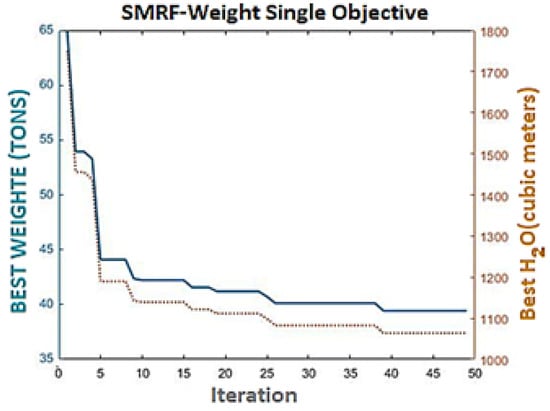
Figure 11.
Comparison of the progress of weight-water in single-target mode.

Figure 12.
Comparison of weight-carbon progress in single-target mode.
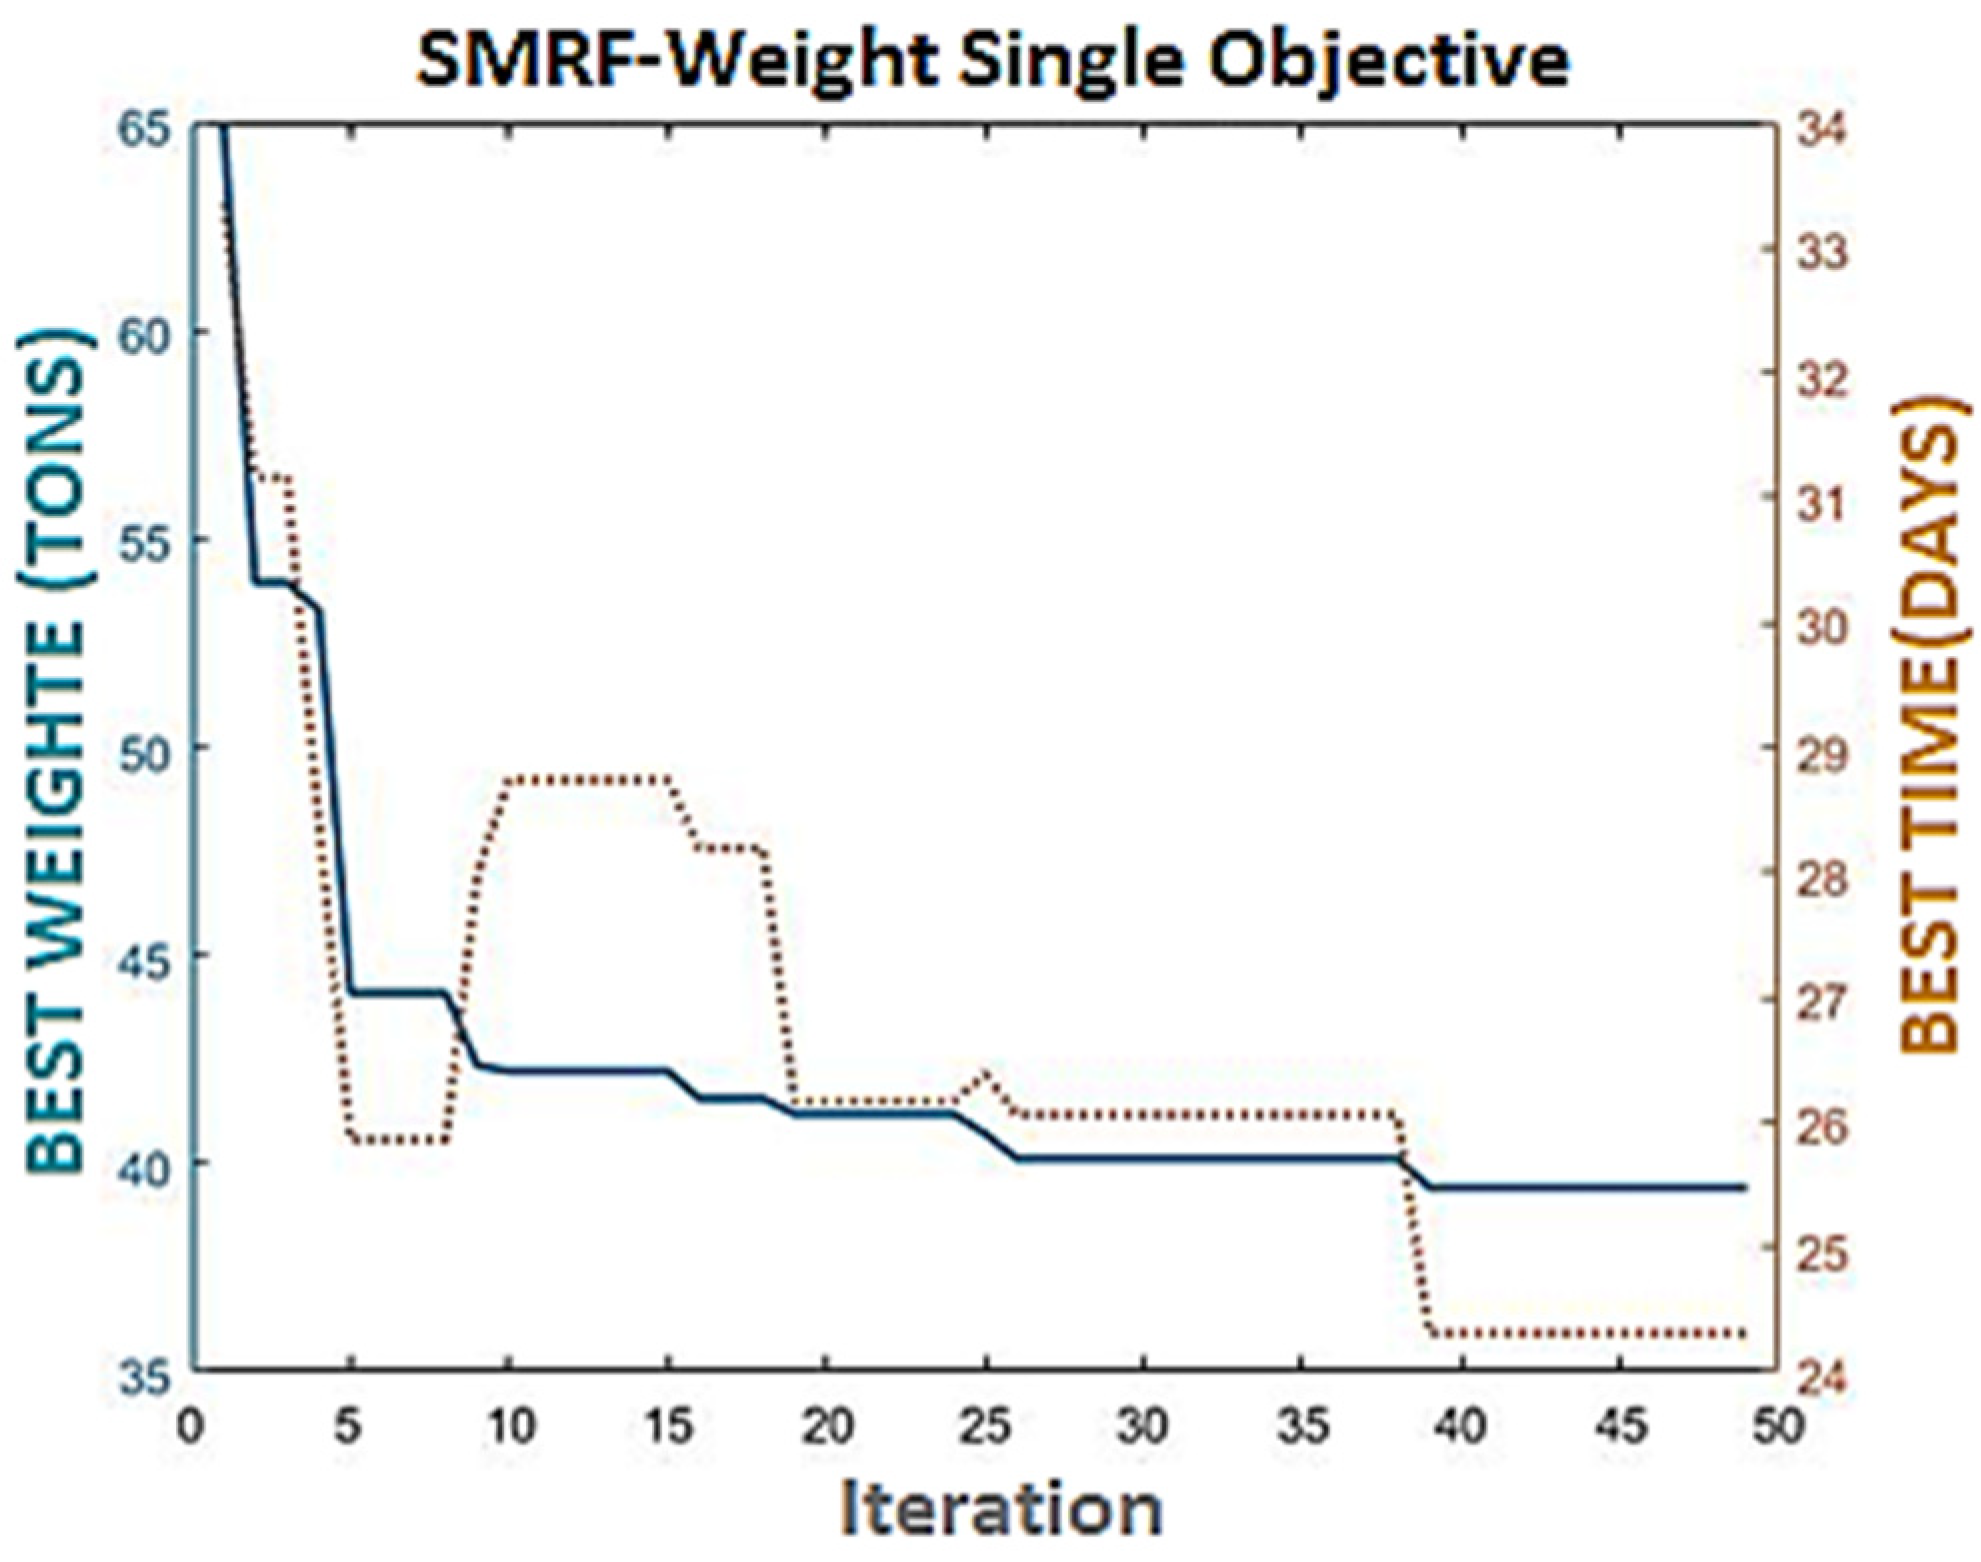
In Figure 13 and Figure 14, it can be seen that in a structure with an intermediate steel moment-resisting frame system, time and cost are not dependent on the weight, and the progress of the algorithm is different from each other.
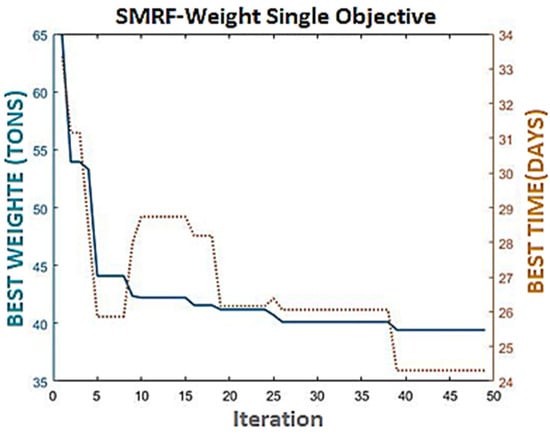
Figure 13.
Comparison of weight progress—time in single target mode.
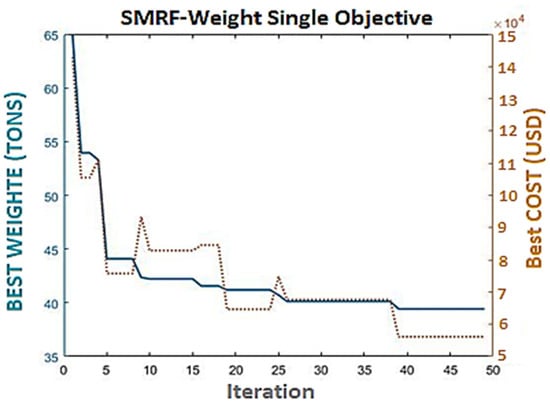
Figure 14.
Comparison of the progress of weight-cost in single-objective mode.
7.2. Algorithm Results for the Multi-Objective Mode of the Studied Frames
After repeating the process of the gray wolf optimization algorithm with a branch connection with the SAP2000 numerical model and repeating until the acceptance of the structural constraints, the best solution as alpha wolf at the end of the optimization process for each frame is obtained, and it is tabulated in Table 9.
Table 9.
Ultimate solutions.
At the end of the optimization process, gray Alpha provides the final solution for each frame. In the above table, the most optimal cross-section of each element among the design variables defined for each of the studied structural frames is mentioned in compliance with the design and geometric constraints. Moreover, in parallel with the determination of the most optimal element, the final percentage of each of the five target functions for all the studied structures is presented separately in Figure 15, which specifies the contribution of each of the functions to the total value.
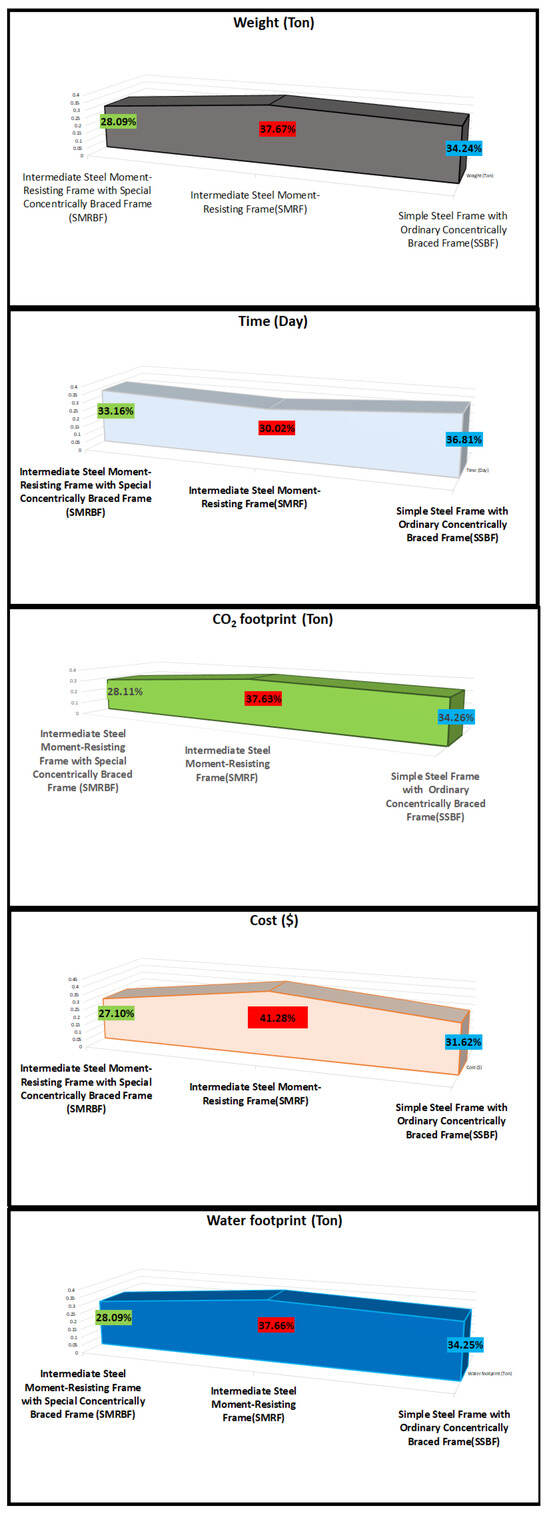
Figure 15.
The percentage of the final response of the studied frames to each objective function.
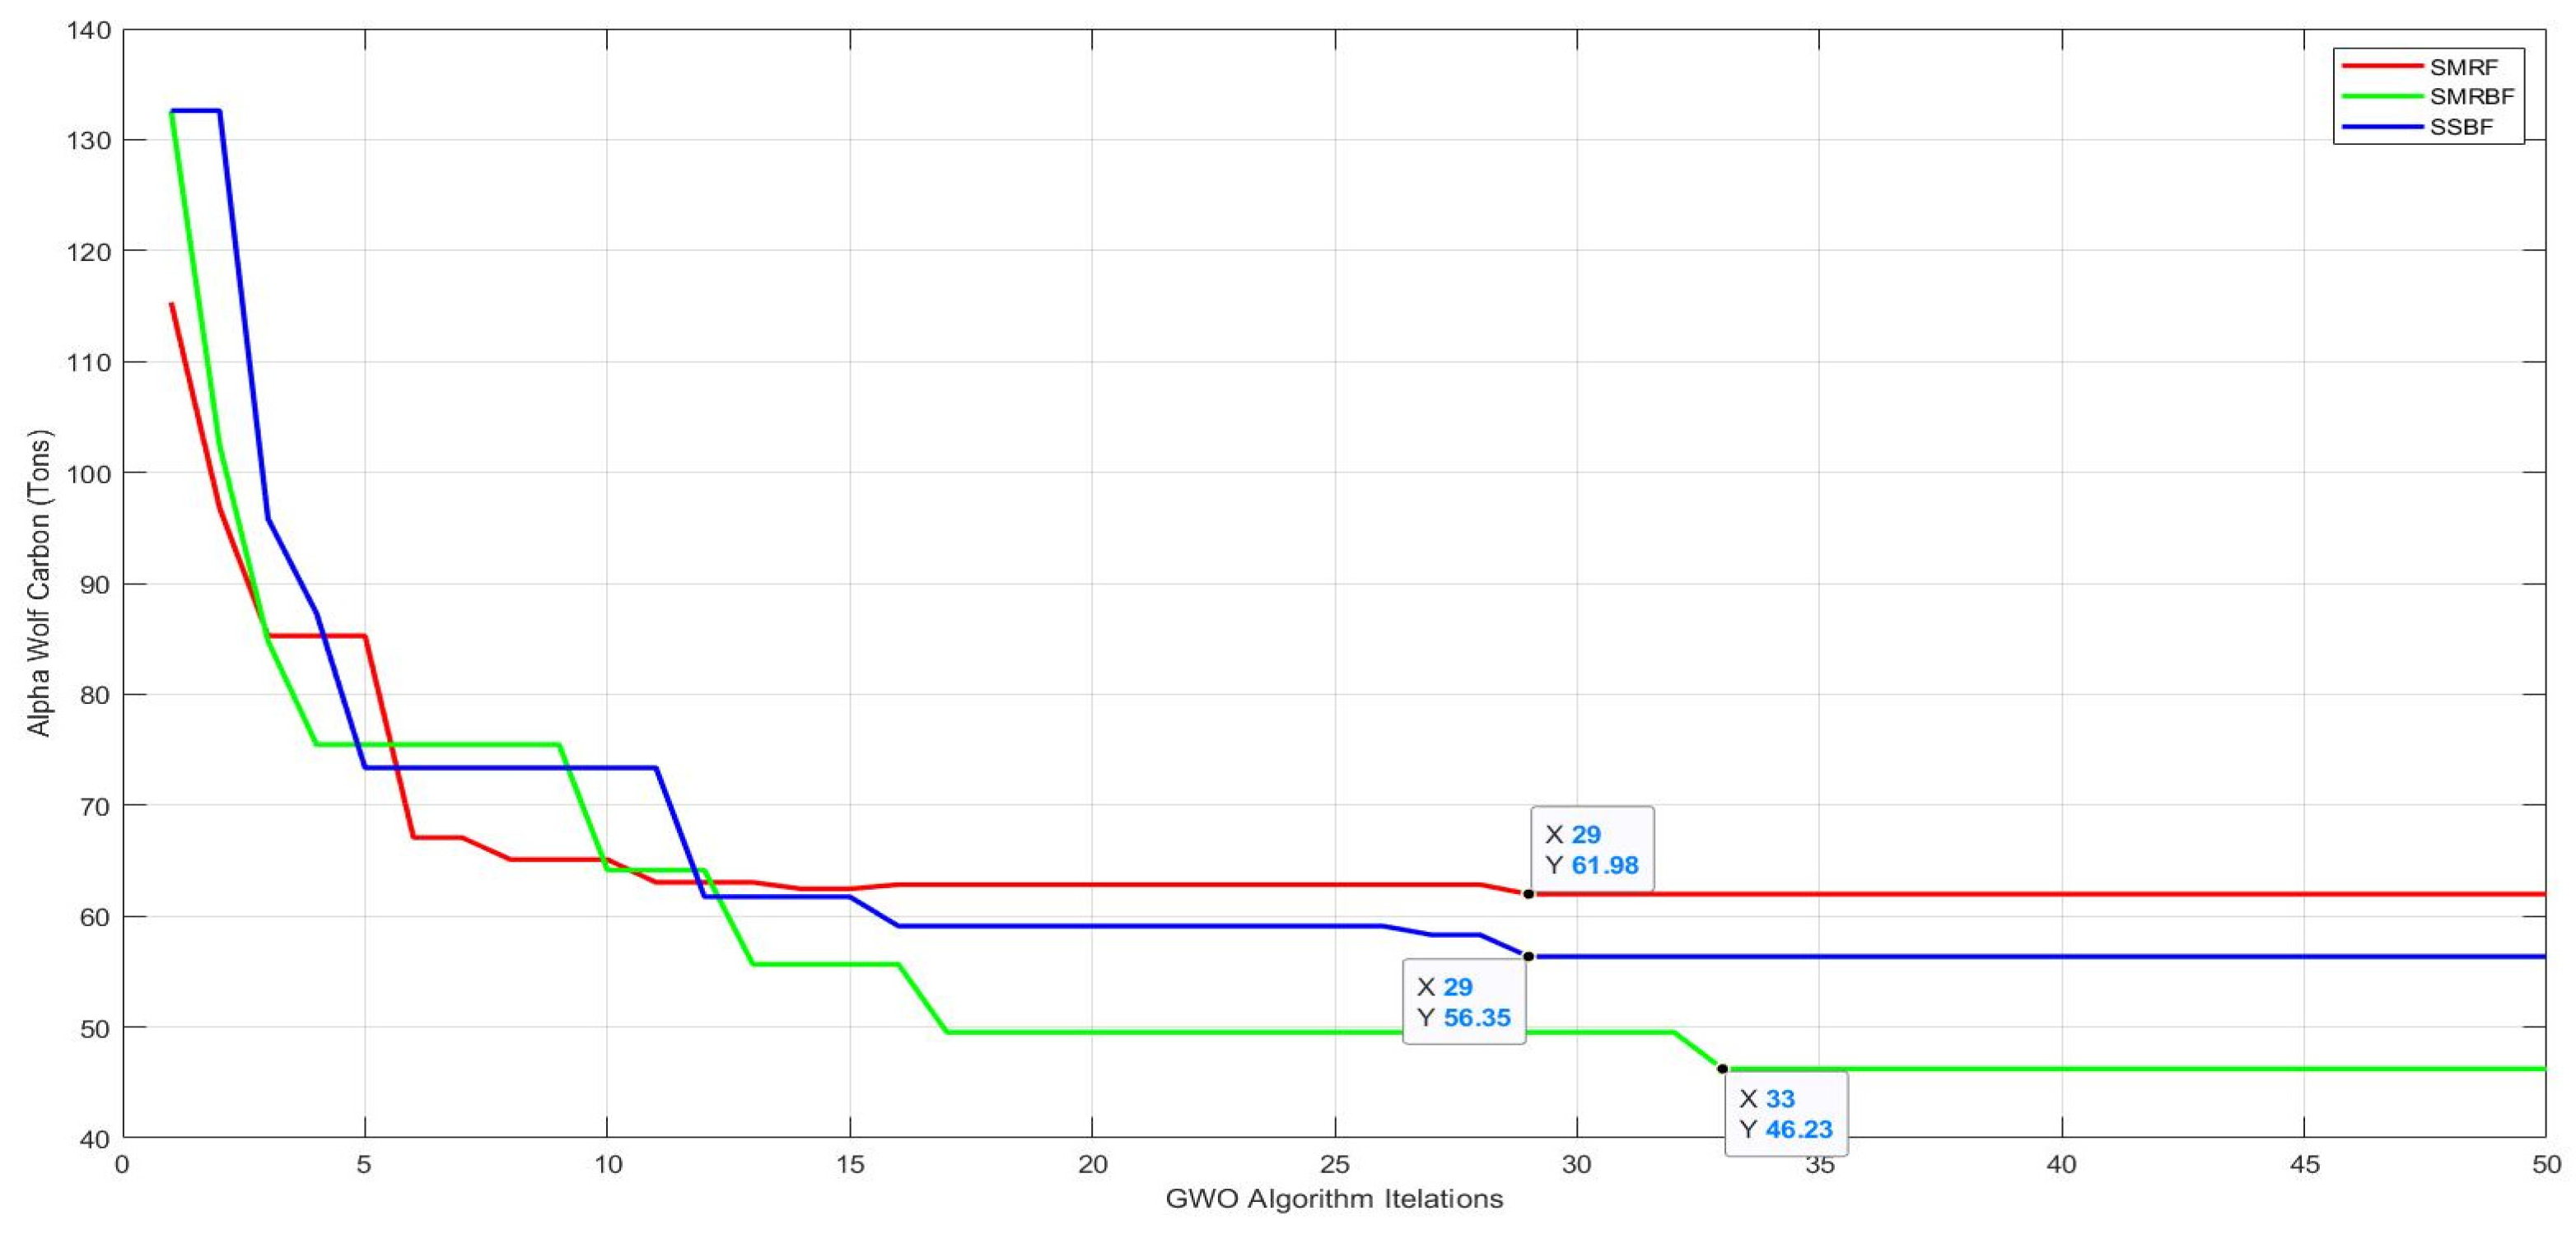
7.2.1. Algorithm Progress Chart
Figure 16, Figure 17, Figure 18, Figure 19 and Figure 20 show the progress of the algorithm in infinite iterations, so that the red, green, and blue curves, respectively represent the behavior of intermediate SMRF (Steel Moment-Resisting Frame), SMRBF (Steel Moment-Resisting Frame with a Special Concentrically Brace Frame) and SSBF (Simple Steel with an Ordinary Concentrically Braced Frame).
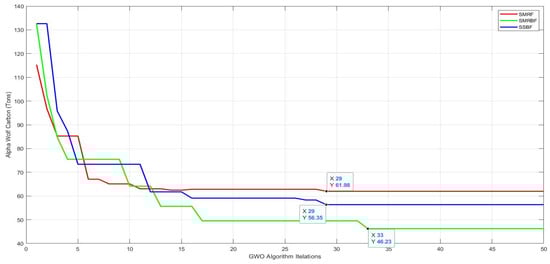
Figure 16.
Algorithm progress figure with respect to carbon dioxide diffused for steel production in structural steel frames.
As depicted in Figure 16, as the algorithmic process advances and the volume of consumed materials decreases, there is a corresponding reduction in carbon dioxide emissions. Ultimately, for the intermediate steel moment-resisting frame, the intermediate steel moment-resisting frame with a special concentrically braced frame, and the simple steel frame with an ordinary concentrically braced frame, the respective amounts of carbon dioxide released reach 61.89 tons, 56.35 tons, and 46.23 tons. The quantity of carbon dioxide emitted during the material production process in the intermediate steel moment-resisting frame with a specially concentrically braced frame is notably lower than in the other studied frames. Therefore, its selection as a green structure aligns with the definitions provided in the introduction of this research and appears to be a judicious choice.
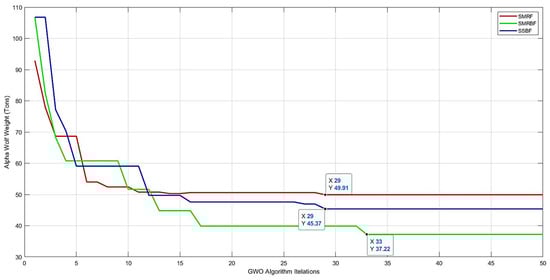
Figure 17.
Algorithm progression figure with respect to the weight of all three structural frames.
Figure 17.
Algorithm progression figure with respect to the weight of all three structural frames.

In Figure 17, the trend of the final weight in the three studied frames is presented. According to this importance, with the weight reduction, the lateral force on the structure will be reduced, and thus the lowest weight of the structure is 37.22 tons. The intermediate steel moment-resisting frame with a special concentrically braced frame is considered the best type of frame in terms of weight among the studied frames.
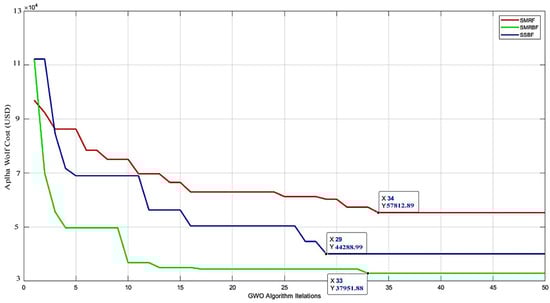
Figure 18.
Algorithm progression figure in relation to the cost of all three structural frames.
Figure 18.
Algorithm progression figure in relation to the cost of all three structural frames.

Figure 18 shows the trend of the algorithm for the cost function in all three frames, which shows that the structure with an intermediate steel moment-resisting frame and a special concentrically braced frame with a value of USD 37,951.88 in the studied period has the lowest construction cost among other structures.
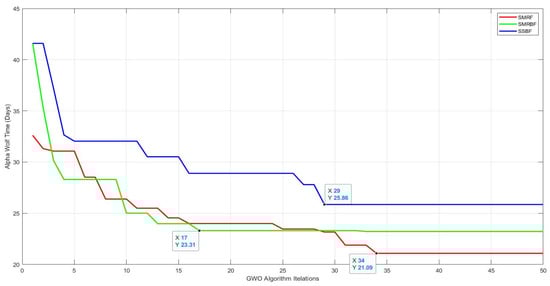
Figure 19.
Algorithm progression figure compared to the construction time of all three structural frames.
Figure 19.
Algorithm progression figure compared to the construction time of all three structural frames.
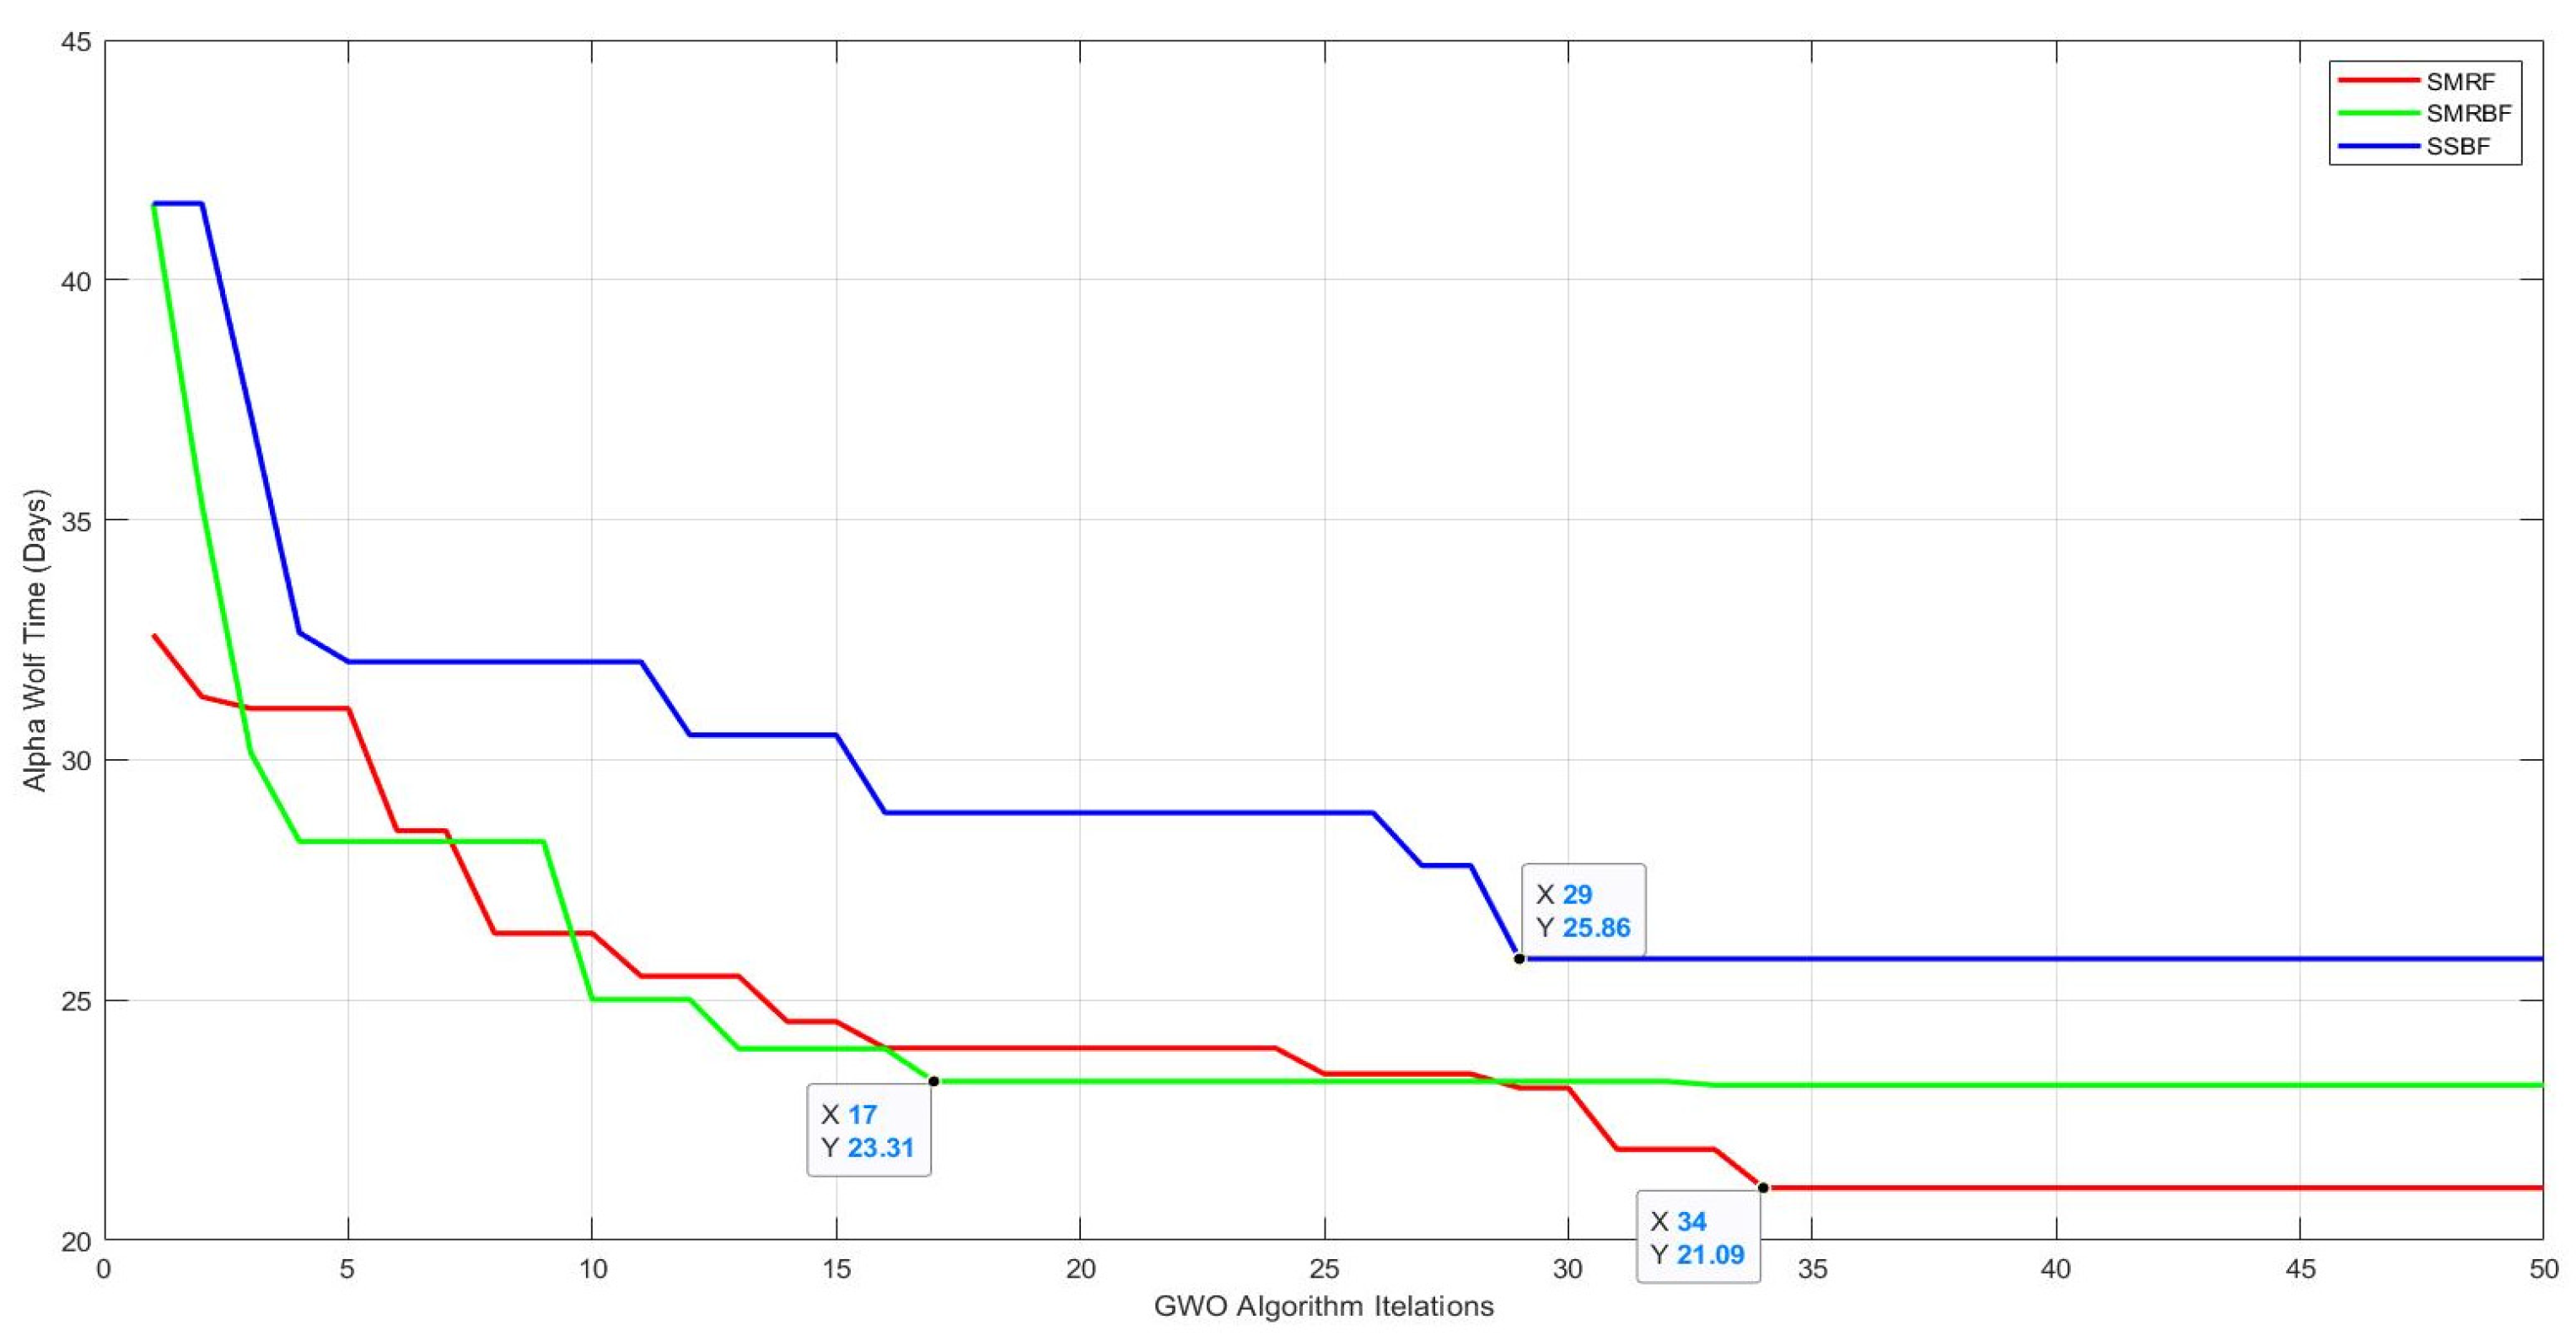
In addition, the minimum and maximum duration of construction are 21 and 26 days and nights, respectively, related to the structures, with an intermediate steel moment-resisting frame and a simple steel frame with an ordinary concentrically braced frame, as shown in Figure 19. So for the complete construction period of the studied structures, it has been calculated 24 h a day and continuously without a break. In addition, all activities are consecutive. For a better description of this time, considering that the working time per day (W.T.P.D)in the study area is equal to 8 h, the relationships are calculated as below:
| Intermediate steel moment-resisting frame | |
| Simple steel frame with an ordinary concentrically braced frame |
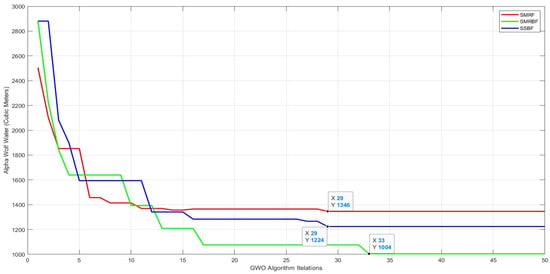
Figure 20.
Algorithm progression figure in relation to water consumption for the production of steel in structural steel frames.
Figure 20.
Algorithm progression figure in relation to water consumption for the production of steel in structural steel frames.
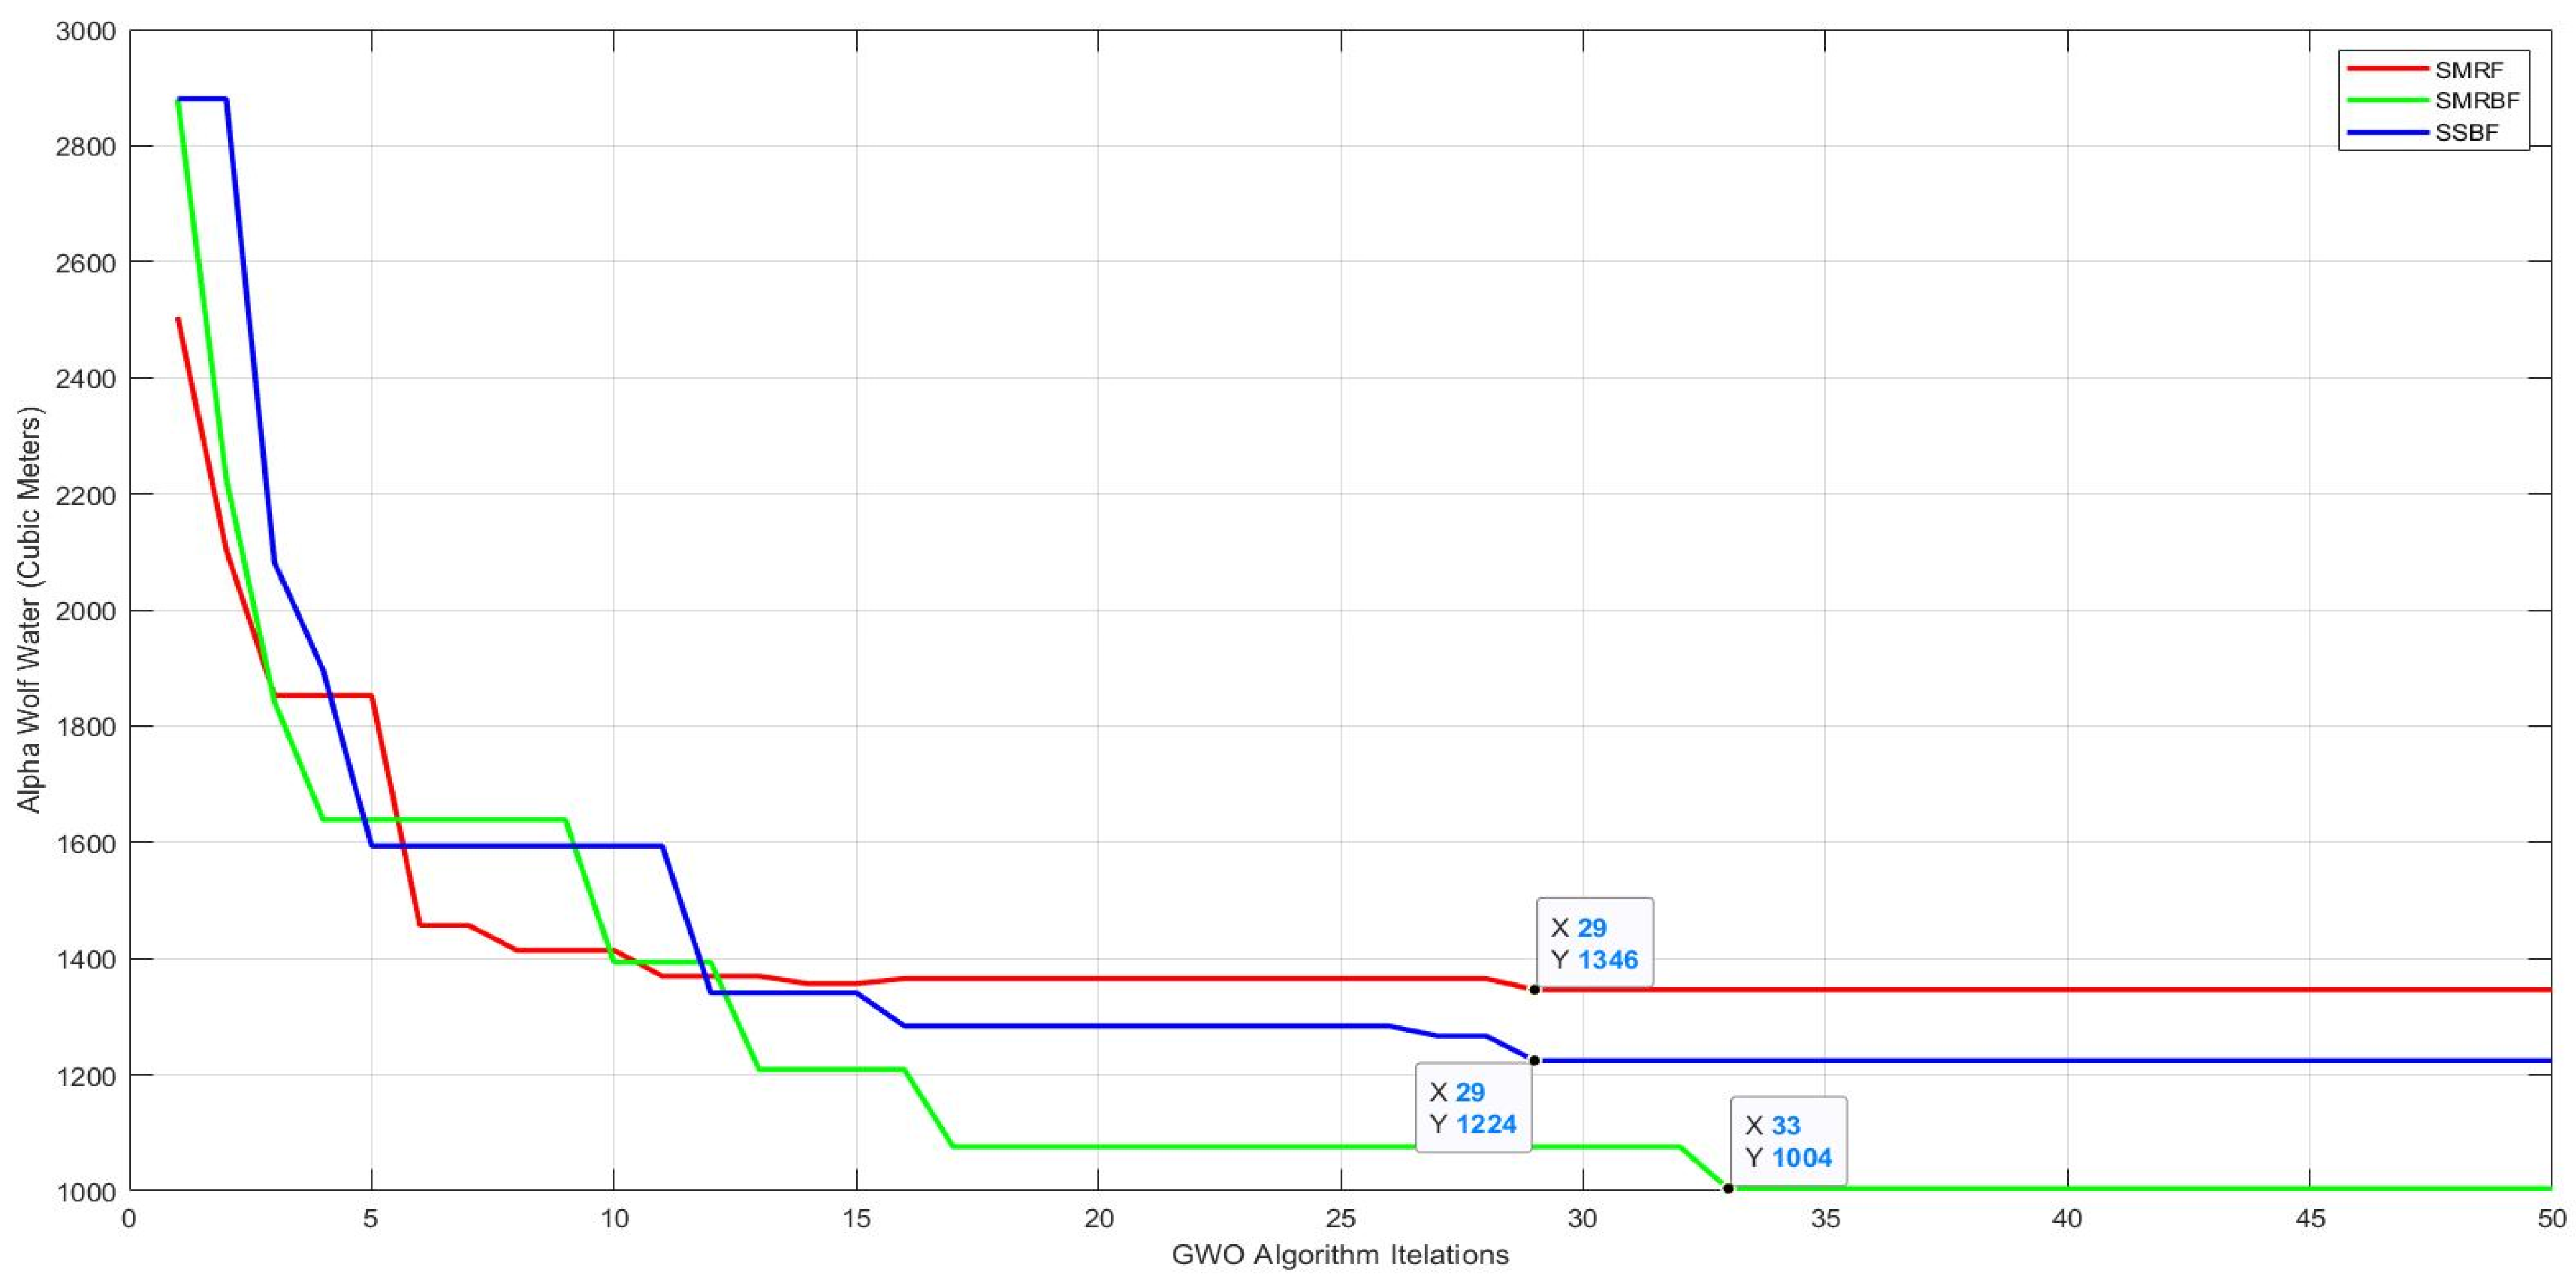
Figure 20 shows the progress of the algorithm in relation to the water consumption of the investigated structures. As can be seen, 1346 cubic meters of medium steel bending frame sections, 1224 cubic meters of steel converging frame structure, and a medium steel bending frame structure with special steel converging bracing consumed 1004 cubic meters of water.
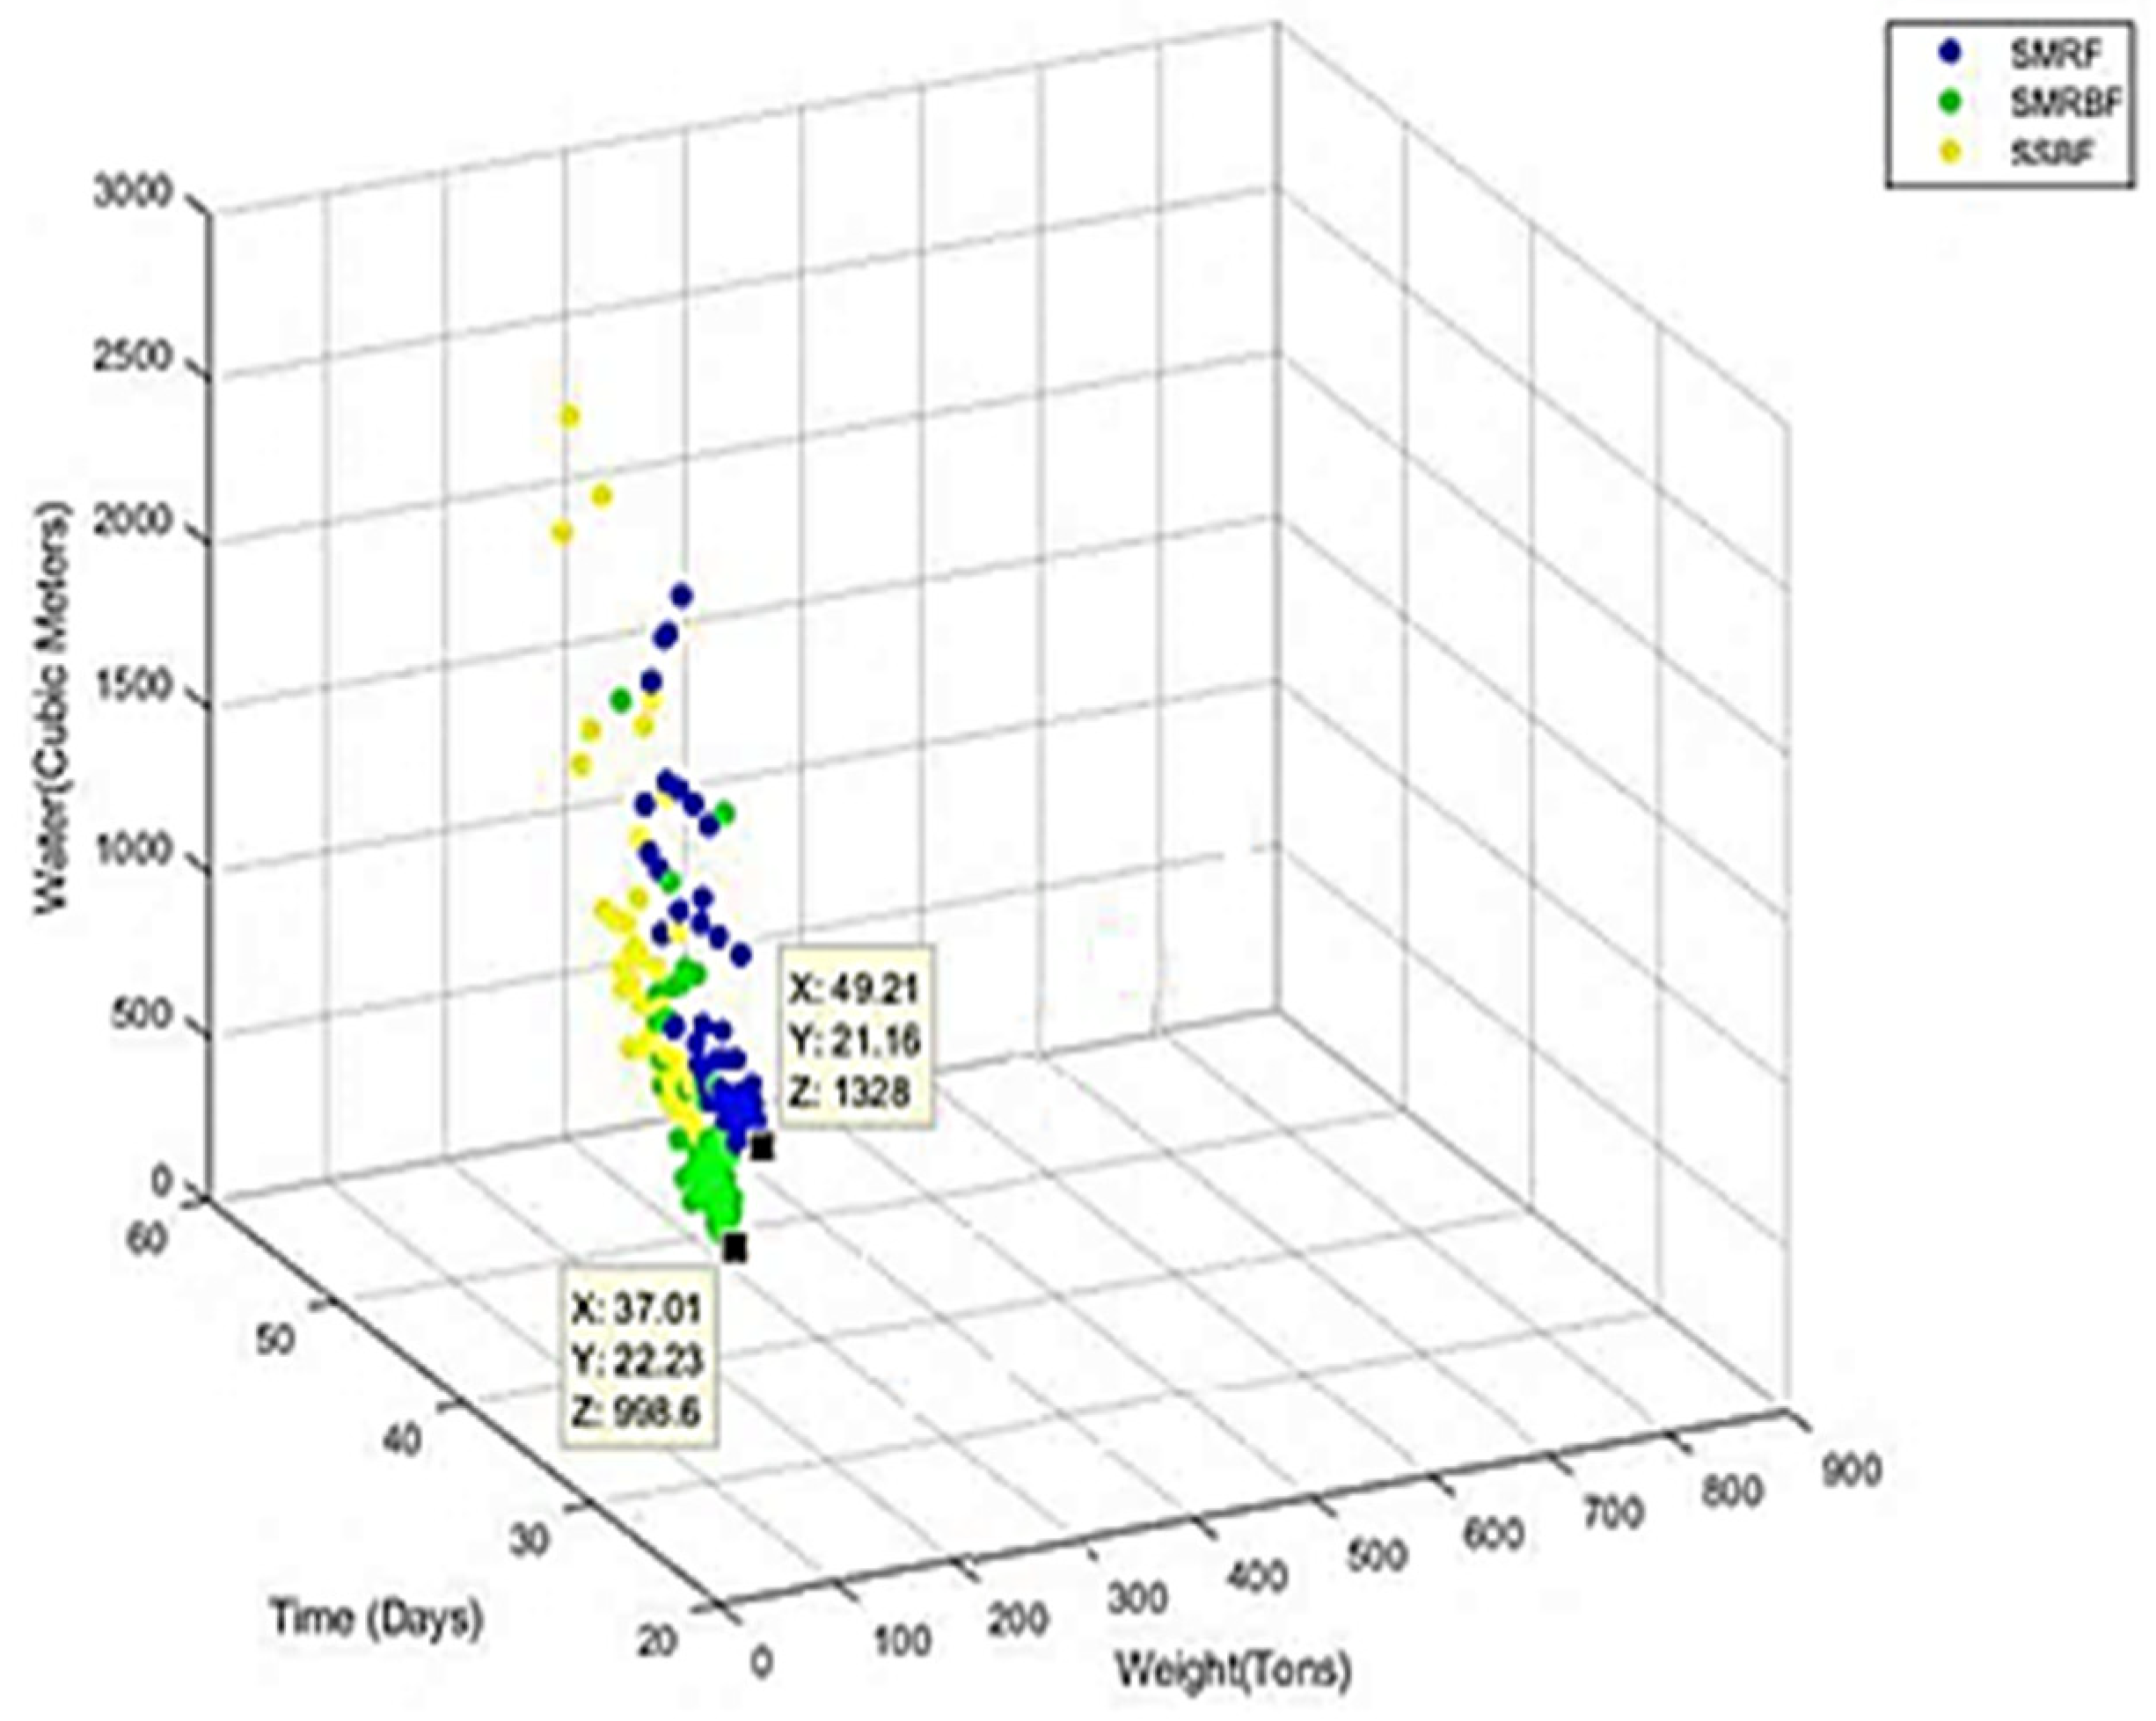
7.2.2. Pareto Front
With multiple objective functions, the concept of optimality shifts in multi-objective problems. Instead of seeking a single solution, as in single-objective optimization, the aim becomes to identify suitable compromises. A crucial aspect of multi-objective optimization involves generating a front of non-dominant solutions, known as the Pareto front. Pareto optimal solutions are those where none dominates the others with respect to the objective functions. In Figure 21, the vertical axis (Z) represents the amount of virtual water, which holds significant environmental importance. The horizontal axes (X) and (Y) denote the construction time and the weight of structural members, respectively. Notably, the intermediate steel moment-resisting frame with the special concentrically braced frame (depicted in green) exhibits the lowest weight and water consumption during material production. Meanwhile, the intermediate steel moment-resisting frame (depicted in blue) is characterized by the minimum construction time.

Figure 21.
The Pareto front on water-time-weight.
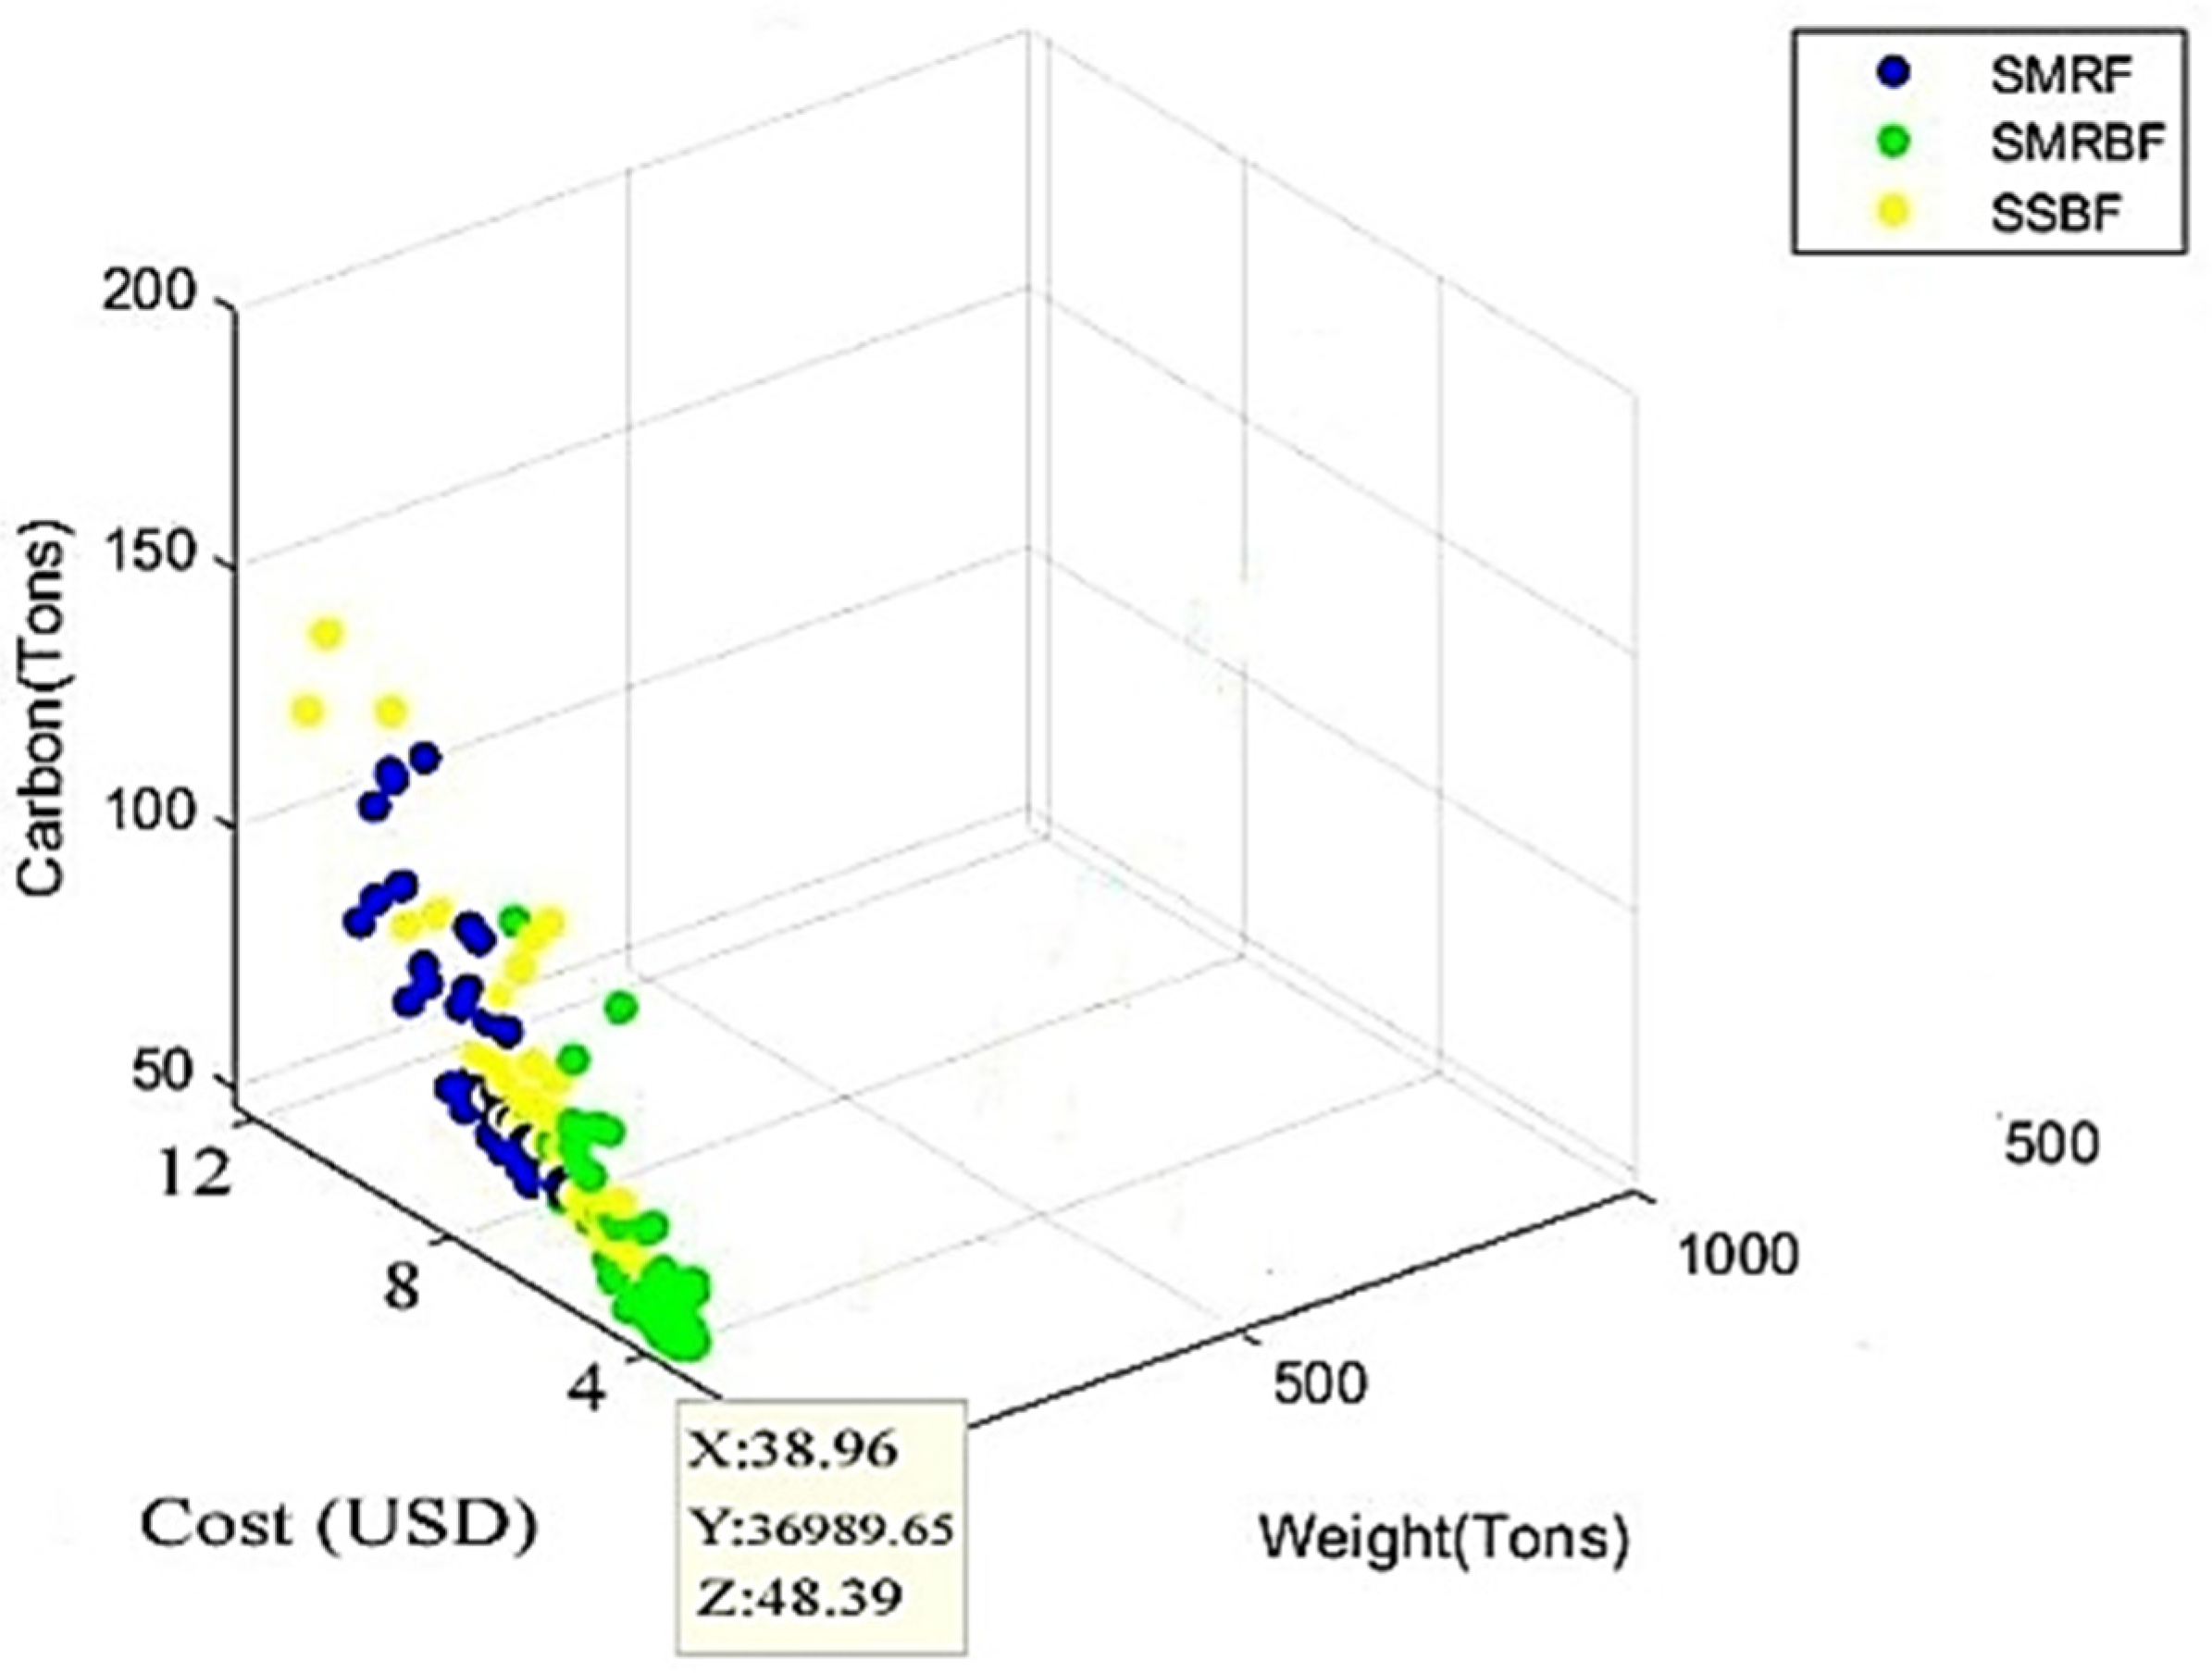
In Figure 22, carbon, cost, and weight functions are selected to draw the Pareto front. The vertical axis shows the amount of carbon dioxide emitted. In terms of reducing carbon production, the effect of an intermediate steel moment-resisting frame with a specially concentrically braced frame is quite evident. On the other hand, one of the horizontal axes (x) indicates the weight of structural members. Considering the importance of weight loss in terms of seismicity, weight loss is definitely evaluated as a positive component. The other horizontal axis (Y) represents the cost of construction, and the intermediate steel moment-resisting frame with a special concentrically braced frame (in green color) has the lowest cost of construction.

Figure 22.
The Pareto front on carbon cost-weight.
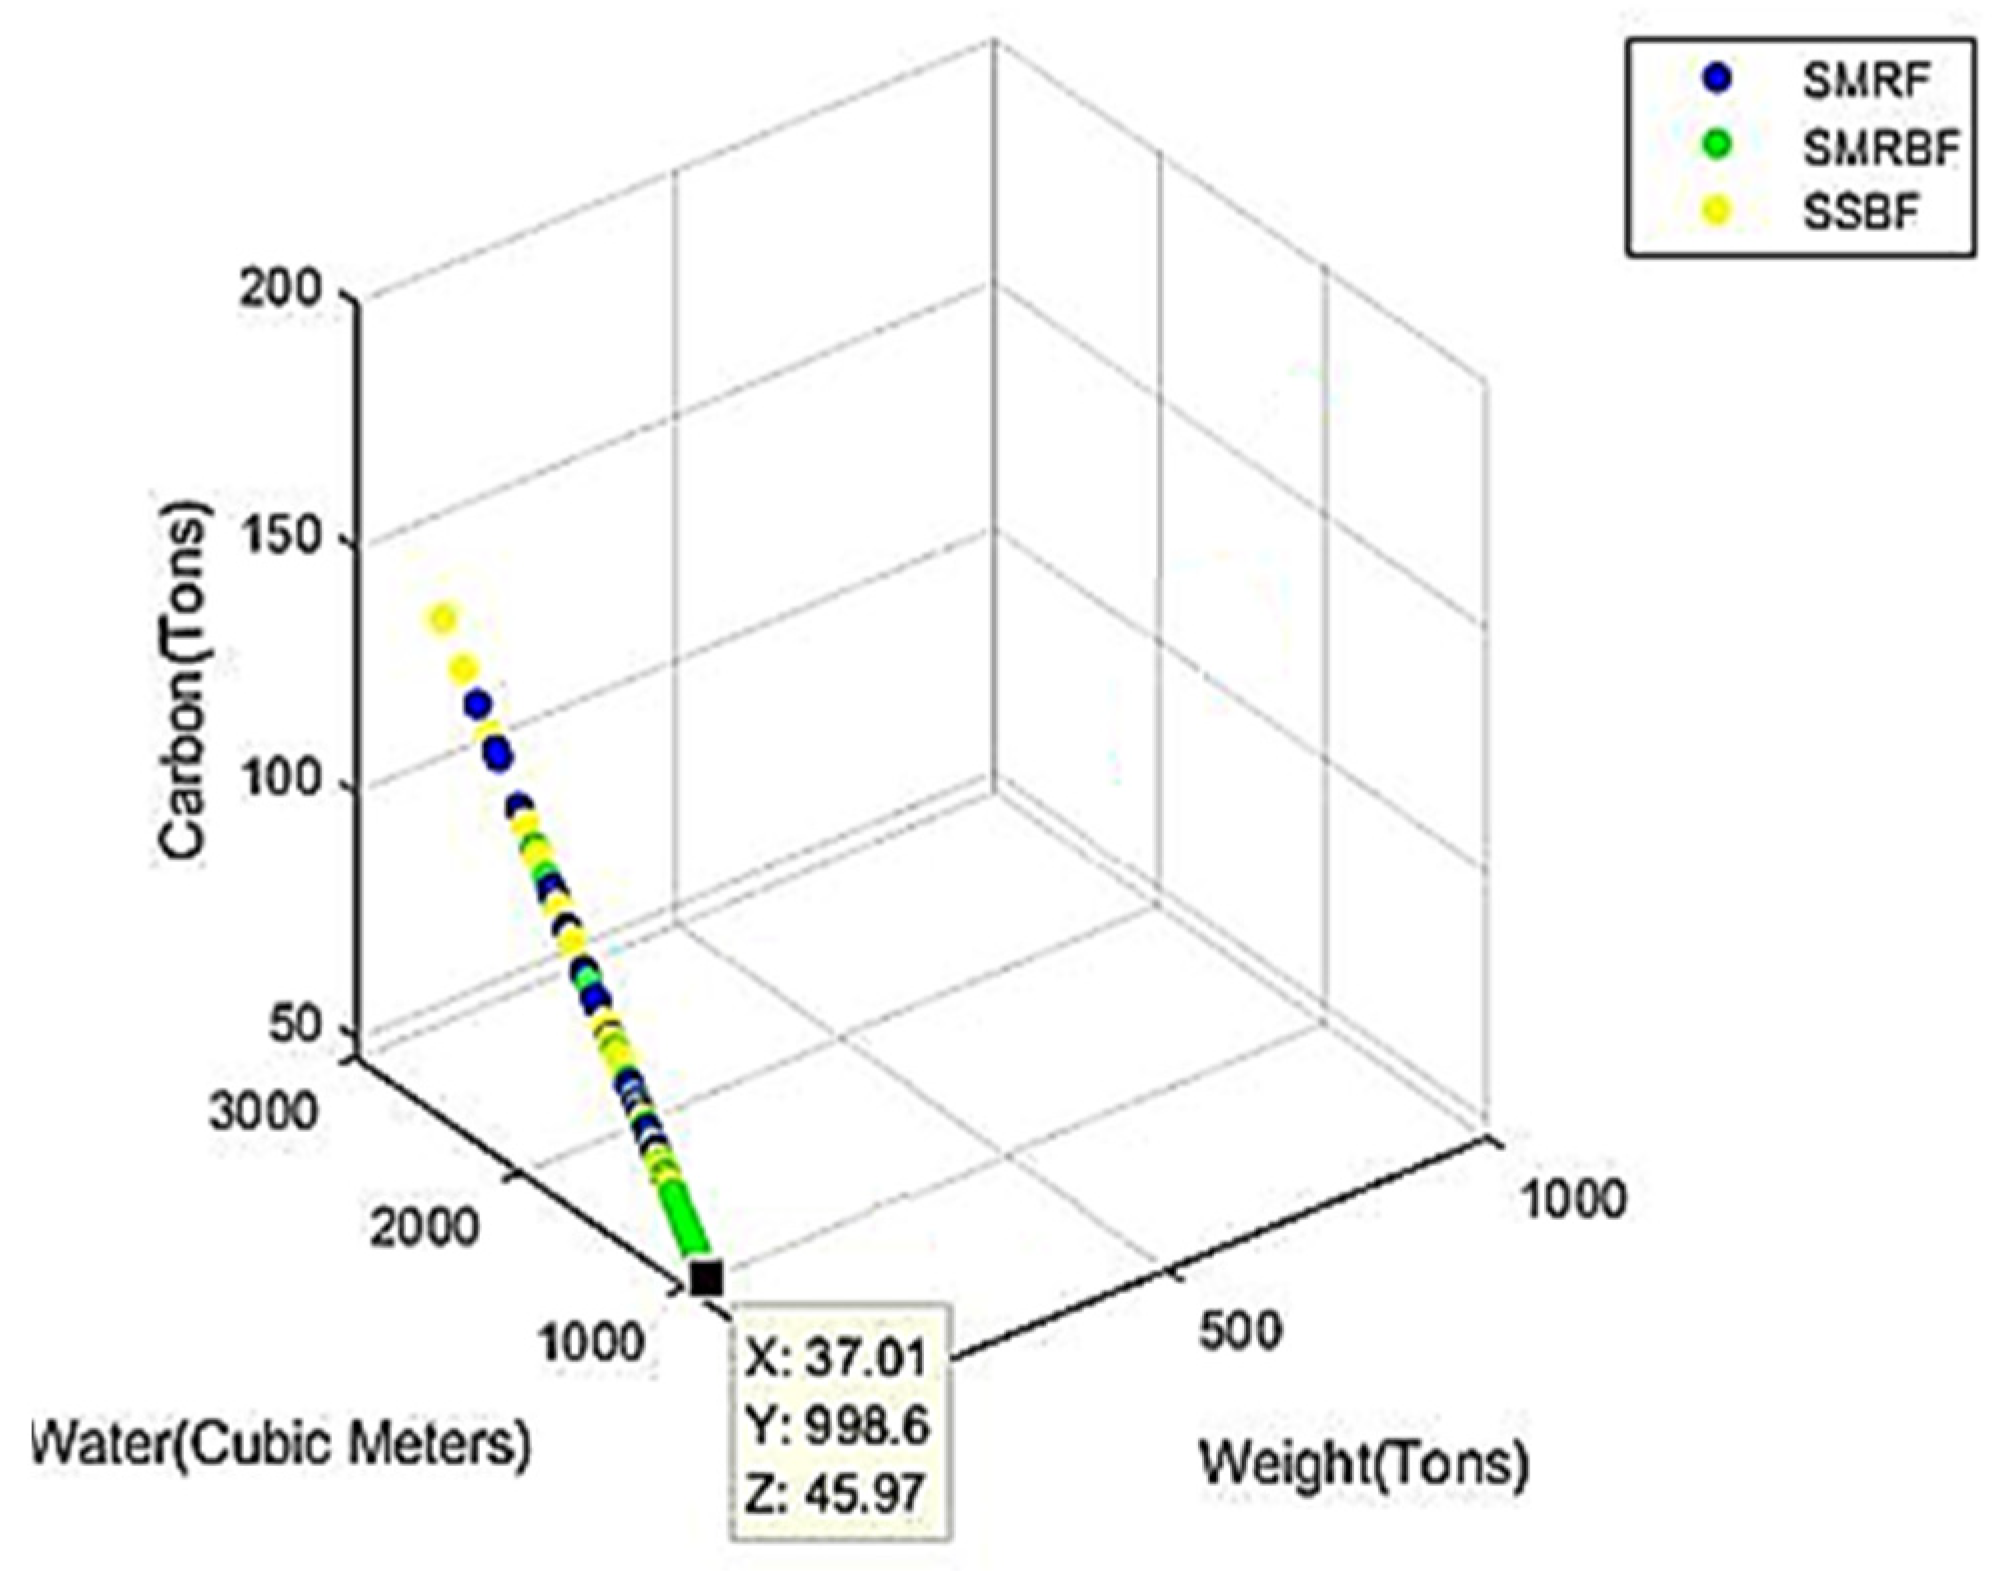
The Pareto front on the objective functions of carbon, water, and weight is shown in Figure 23. The reason for the linearity is the dependence of all three objective functions on one variable, namely the volume of steel. The thing that is clear is that the intermediate steel moment-resisting frame with a special concentrically braced frame in green at the end of the Pareto plane has the lowest number of objective functions compared to the other investigated frames. And as mentioned above, the intermediate steel moment-resisting frame with a special concentrically braced frame was introduced as an environmentally friendly structure due to the minimum amount of virtual water and virtual carbon as a green structure.

Figure 23.
The Pareto front on carbon-water weight.
In the Pareto front of Figure 24, the vertical axis (Z) and the horizontal axes (X) and (Y) indicate virtual carbon, construction time, and virtual water, respectively. As can be seen, the shortest construction time and the highest amount of water consumed during the material production process are specific to the intermediate steel moment-resisting frame. The lowest amount of carbon dioxide emitted and the most water consumed in the material production process are also specific to the intermediate steel moment-resisting frame with a specially concentrically braced frame.
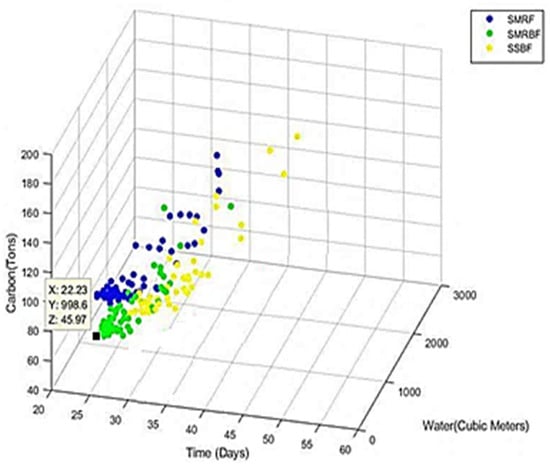
Figure 24.
The Pareto front on carbon-time-water.
8. Conclusions
- In reviewing the results of the algorithm, it was observed that the amount of carbon dioxide emitted and water consumed during steel production has a direct relationship with the weight of the structure, and the increase in the weight of the structure causes an increase in carbon dioxide emitted and water consumed during steel production, and vice versa. So, reducing the weight of the structure by complying with the design limits, in addition to increasing the serviceability and flexibility of the structure, leads to a reduction in the emission of carbon dioxide and water consumption.
- The results of the single-objective algorithm indicate that weight and construction cost have no special relationship with each other. Therefore, by increasing the cost of construction, the weight of the structure does not decrease, or, in other words, it is not necessary to reduce the weight of the structure and increase the cost of construction.
- It was also evident in the results of the single-objective algorithm that there is no special relationship between the weight of the structure and the duration of construction. So that the construction time does not necessarily decrease by reducing the weight of the structure.
- The structure with an intermediate steel moment-resisting frame and a special concentrically braced frame, comprising 192 structural members and weighing 37.22 tons, is identified as the lightest structure. In contrast, the intermediate steel moment-resisting frame consists of 160 structural members and weighs 49.91 tons, making it the heaviest structure among those studied. These findings indicate that the reduction in the weight of the structure is not necessarily associated with the number of structural members.
- Among the examined frames, the intermediate steel moment-resisting frame with a special concentrically braced frame stands out as a green structure due to its lowest structural weight of 37.22 tons, carbon footprint of 46.23 tons, and water footprint of 1004 cubic meters. Additionally, this frame is identified as the most economical structure among those investigated, with a construction cost of USD 37,951.88.
- The structure with steel moment-resisting frames has the shortest construction time with 506 working hours, and the structure with a simple steel frame with an ordinary concentrically braced frame has the longest construction time among the studied frames.
- The highest and lowest amount of carbon dioxide emitted during the production of materials, respectively, is 37.63% for the structure with intermediate steel moment-resisting frames and 28.11% for the structure with intermediate steel moment-resisting frame with special concentrically braced frame among all the studied frames.
Author Contributions
M.N.N., B.F.-N. and J.M.S. conceived of the presented idea, and they also developed the theory, performed the computations, and performed formal analysis as well as writing the original draft. M.N.N., H.H., B.F.-N. and J.M.S. verified the analytical methods. All authors have read and agreed to the published version of the manuscript.
Funding
This research received no external funding.
Data Availability Statement
The data presented in this study are available on request from the corresponding author.
Conflicts of Interest
There is no conflicts of interest.
Abbreviations
| : | (mm) Steel structure j Dimension of member welding |
| : | (m 2) steel structure i cross section of the member |
| : | (ton) carbon dioxide produced in the construction of steel structure profiles |
| : | (USD) cost of steel structure construction |
| : | () carbon dioxide produced in steel production |
| : | (min/kg0.5) is a parameter dependent on the welding technology which is usually considered equal to 1 |
| : | (min/mm2.5) are steel structures i Constants for different welding technology used in the member |
| : | (min/mm1.25) is a coefficient related to the cutting technology |
| : | is the number of structural elements that must be assembled (without units) |
| : | (USD/min) wage rate |
| : | (USD) steel structure j volumetric price of steel member |
| : | (mm) steel structure j cutting length of the member |
| : | (m) Steel structure i member length |
| : | (mm)steel structure j length of member welding |
| : | Number of structure members |
| : | (mm) steel structure j the thickness of the member sheet |
| : | (day) Construction duration of steel structure |
| : | (m3) steel structure j volume of member steel profile |
| : | (ton) Weight of steel structure |
| : | (m3) water consumption per ton of steel production |
| : | (kg/m3) Specific weight of steel |
| : | Hardness coefficient (without unit) |
| () Yield stress | |
| () ultimate stress |
References
- Hilary, O.O. A review of success factors for the adoption of green construction site practices in developing countries. Int. J. Sustain. Build. Technol. Urban Dev. 2019, 10, 216–226. [Google Scholar]
- Tzanakakis, V.A.; Paranychianakis, N.V.; Angelakis, A.N. Water supply and water scarcity. Water 2020, 12, 2347. [Google Scholar] [CrossRef]
- Hoekstra, A.Y.; Hung, P.Q. Virtual water trade. In Proceedings of the International Expert Meeting on Virtual Water Trade 2003, Delft, The Netherlands, 12 December 2003; Volume 12, pp. 1–244. [Google Scholar]
- Gerbens-Leenes, P.W.; Hoekstra, A.Y.; Bosman, R. The blue and grey water footprint of construction materials: Steel, cement and glass. Water Resour. Ind. 2018, 19, 1–12. [Google Scholar] [CrossRef]
- Abd El-Hameed, A.K.; Mansour, Y.M.; Faggal, A.A. Benchmarking water efficiency of architectural finishing materials based on a “cradle-to-gate” approach. J. Build. Eng. 2017, 14, 73–80. [Google Scholar] [CrossRef]
- Tanhadoust, A.; Madhkhan, M.; Nehdi, M.L. Two-stage multi-objective optimization of reinforced concrete buildings based on non-dominated sorting genetic algorithm (NSGA-III). J. Build. Eng. 2023, 75, 107022. [Google Scholar] [CrossRef]
- Afzal, M.; Liu, Y.; Cheng, J.C.; Gan, V.J. Reinforced concrete structural design optimization: A critical review. J. Clean. Prod. 2020, 260, 120623. [Google Scholar] [CrossRef]
- Dixit, M.K.; Fernández-Solís, J.L.; Lavy, S.; Culp, C.H. Identification of parameters for embodied energy measurement: A literature review. Energy Build. 2010, 42, 1238–1247. [Google Scholar] [CrossRef]
- Kofoworola, O.F.; Gheewala, S.H. Environmental life cycle assessment of a commercial office building in Thailand. Int. J. Life Cycle Assess. 2008, 13, 498–511. [Google Scholar] [CrossRef]
- Abergel, T.; Dean, B.; Dulac, J.; Hamilton, I.; Wheeler, T. Global Status Report—Towards a Zero-Emission, Efficient and Resilient Buildings and Construction Sector; World Green Building Council: London, UK, 2018; ISBN 978-92-807-3729-5. [Google Scholar]
- Eleftheriadis, S.; Duffour, P.; Greening, P.; James, J.; Stephenson, B.; Mumovic, D. Investigating relationships between cost and CO2 emissions in reinforced concrete structures using a BIM-based design optimization approach. Energy Build. 2018, 166, 330–346. [Google Scholar] [CrossRef]
- Blismas, N.; Pasquire, C.; Gibb, A. Benefit evaluation for off-site production in construction. Constr. Manag. Econ. 2006, 24, 121–130. [Google Scholar] [CrossRef]
- Paya-Zaforteza, I.; Yepes, V.; Hospitaler, A.; Gonzalez-Vidosa, F. CO2-optimization of reinforced concrete frames by simulated annealing. Eng. Struct. 2009, 31, 1501–1508. [Google Scholar] [CrossRef]
- Fankhauser, S.; Smith, S.M.; Allen, M.; Axelsson, K.; Hale, T.; Hepburn, C.; Kendall, J.M.; Khosla, R.; Lezaun, J.; Mitchell-Larson, E.; et al. The meaning of net zero and how to get it right. Nat. Clim. Chang. 2002, 12, 15–21. [Google Scholar] [CrossRef]
- Kaveh, A.; Mahdavi, V.R. Multi-Objective colliding bodies optimization algorithm for design of trusses. J. Comput. Des. Eng. 2019, 6, 29–59. [Google Scholar] [CrossRef]
- MacNulty, D.R.; Mech, L.D.; Smith, D.W. A proposed ethogram of large-carnivore predatory behavior, exemplified by the wolf. J. Mammal. 2007, 88, 595–605. [Google Scholar] [CrossRef]
- Mirjalili, S.; Mirjalili, S.M.; Lewis, A. Grey wolf optimizer. Adv. Eng. Softw. 2014, 69, 46–61. [Google Scholar] [CrossRef]
- SAP2000, version 16.0.0; Manual and Software; Computers and Structures, Inc.: Berkeley, VA, USA, 2013.
- The MathWorks Inc. Optimization Toolbox; Version 9.5 (R2018b); The MathWorks Inc.: Natick, MA, USA, 2018; Available online: https://www.mathworks.com (accessed on 1 February 2024).
- The Ad Hoc Committee on Serviceability Research, Committee on Research of the Structural Division. Structural serviceability: A critical appraisal and research needs. J. Struct. Eng. 1986, 112, 2646–2664. [Google Scholar] [CrossRef]
- Chen, W.F.; Kim, S.E. LRFD Steel Design Using Advanced Analysis; CRC Press: Boca Raton, FL, USA, 1997; Volume 13. [Google Scholar]
- Minimum Design Loads for Buildings and Other Structures; American Society of Civil Engineers: Reston, VA, USA, 2005. [CrossRef]
- Ellingwood, B. Serviceability guidelines for steel structures. Eng. J. 1989, 26, 1–8. [Google Scholar] [CrossRef]
- Kundak, M.; Lazić, L.; Črnko, J. CO2 Emissions in the Steel Industry. Metalurgija 2009, 48, 193–197. [Google Scholar]
- Ziaee, F.; Abbasi Harofteh, M. Structural system effect on water consumption of the construction of the contemporary typical houses in Yazd. J. Archit. Hot Dry Clim. 2019, 6, 1–21. [Google Scholar]
- Jármai, K.; Farkas, J. Cost calculation and optimization of welded steel structures. J. Constr. Steel Res. 1999, 50, 115–135. [Google Scholar] [CrossRef]


Disclaimer/Publisher’s Note: The statements, opinions and data contained in all publications are solely those of the individual author(s) and contributor(s) and not of MDPI and/or the editor(s). MDPI and/or the editor(s) disclaim responsibility for any injury to people or property resulting from any ideas, methods, instructions or products referred to in the content. |
© 2024 by the authors. Licensee MDPI, Basel, Switzerland. This article is an open access article distributed under the terms and conditions of the Creative Commons Attribution (CC BY) license (https://creativecommons.org/licenses/by/4.0/).