Abstract
This study is focused on the evaluation of vertical elastic acceleration response spectra for Vrancea intermediate-depth earthquakes in Romania in the context of the ongoing update of the national seismic design code. The ground motion database employed in this research consists of about 500 ground motions recorded during moderate and large Vrancea intermediate-depth earthquakes with moment magnitudes MW ≥ 5.2. The analysis of the dataset showed that a single ground motion recording had a peak ground acceleration larger than 0.20 g. The results of the analyses showed that no significant differences between the control periods of the vertical elastic response spectra as a function of the site class could be inferred. It was also observed that the mean value of the amplification factor computed for the entire ground motion database was about 2.5, irrespective of the earthquake magnitude, site class, or level of horizontal peak ground acceleration. However, larger-magnitude earthquakes generate larger spectral amplifications in the medium- and long-period ranges. The analysis of the ground motions recorded in Bucharest area revealed a magnitude dependency of the control period for the vertical ground motion TC,v. Finally, a single spectral shape for vertical acceleration response spectra characterized by a maximum dynamic amplification factor of 2.5 and control periods TBv and TCv of 0.05 s and 0.60 s is proposed for design purposes. This aspect allows for a major update from the current version of the national seismic design code which proposes control periods of the elastic vertical response spectrum dependent on the horizontal ones. The short-period (at T = 0.2 s) and long-period (at T = 1.0 s) ratios of the vertical acceleration response spectrum to the corresponding horizontal ones are 0.50 and 0.40.
1. Introduction
This study is focused on the development of elastic vertical acceleration response spectra for Vrancea intermediate-depth earthquakes in Romania in the context of the ongoing update of the national seismic design code which was enforced about 10 years ago. The current seismic design code in Romania P100-1/2013 [1] follows, in a consistent manner, the format of the first generation of Eurocode 8 [2]. The current definitions of the control periods TC and TD are based on the relations proposed by Lungu et al. [3], also considering the acceleration, velocity, and displacement response spectra. The effects of the vertical ground motion have been discussed in the literature, with reference to shallow earthquakes, by Papazoglou and Elnashai [4], Tian et al. [5], Valdés-Vázquez et al. [6], Kallioras et al. [7], and Wang et al. [8]. In Romania, a discussion on the impact of the vertical ground motion occurred after the Vrancea intermediate-depth earthquake of November 1940, when the single collapse of a high-rise reinforced concrete building (named the Carlton building) in Bucharest was attributed to the vertical component [9].
A significant number of studies in the literature concerning the ground motions recorded during Vrancea earthquakes have been published, especially in the last 20 years. The characteristics of the horizontal components of ground motions recorded during Vrancea intermediate-depth earthquakes were analyzed in previous studies in the literature. For instance, Pavel and Yaghmaei-Sabegh [10] evaluated the control periods TC for the horizontal ground motions recorded during Vrancea intermediate-depth earthquakes. The distributions of the peak ground accelerations during large-magnitude Vrancea earthquakes were discussed by Lungu et al. [11]. The spectral characteristics of the horizontal ground motion recordings from Vrancea seismic events were analyzed in the study by Pavel et al. [12]. The directional effects of the ground motions recorded during Vrancea earthquakes were discussed by Pavel et al. [13]. Pulse-like characteristics, which are characteristic of shallow moderate and large crustal earthquakes, were also noticed during moderate and large Vrancea intermediate-depth earthquakes [14]. Ground motion models for the prediction of the horizontal spectral accelerations taking into account different attenuation patterns were proposed by Sokolov et al. [15], Vacareanu et al. [16], and Manea et al. [17]. In the study by Olteanu and Vacareanu [18], a ground-motion model for horizontal spectral displacement due to Vrancea intermediate-depth earthquakes was proposed. No study dealing with the characteristics of the vertical ground motions recorded during Vrancea intermediate-depth earthquakes has been identified so far. Until now, the use of the vertical ground-motion component was limited to the evaluation of the soil conditions and the estimation of the bedrock depth for various sites in Romania (e.g., [19,20,21]) using the horizontal-to-vertical spectral ratio (HVSR) [22]. Consequently, considering the context of the update of the current Romanian seismic design code P100-1/2013 [1] and the current generation of Eurocode 8 [2], a revision and an update of the provisions regarding the vertical ground motion for Vrancea intermediate-depth earthquake are necessary. In addition, a second aim of this study was to align the definition of the vertical elastic acceleration response spectra to the ones from the proposed Eurocode 8 draft [23]. It is important to note, as well, that various ground-motion prediction equations (GMPEs) for the vertical-to-horizontal spectral acceleration (V/H) ratio have been proposed in the literature using ground motions recorded during crustal earthquakes as input (e.g., [24,25,26,27,28,29,30,31,32,33,34]).
2. Ground Motion Database
The research methodology applied in this study involves the following steps:
- The compilation of a database of ground motions recorded during Vrancea intermediate-depth earthquakes and its analysis;
- Evaluation of the influence of the earthquake magnitude, source-site distance, soil conditions, and horizontal peak ground acceleration on the vertical spectral shapes for Vrancea intermediate-depth earthquakes
- Derivation of a design spectral shape for the vertical ground motion.
A ground motion database of about 500 vertical recordings (both digital and analog) from 13 moderate and large Vrancea intermediate-depth earthquakes (only events having moment magnitudes MW ≥ 5.2 are considered) occurring in the period of 1977–2018 was employed in this research. The processing of the waveforms was performed in the same manner as in the case of the horizontal components recorded during the same events. More details about the processing of the analog recordings can be found in another study by Pavel et al. [12]. In the case of the digital recordings, no processing was performed, since only the already processed recordings were available for this study. The horizontal components of the ground-motion recordings employed in this study were previously compiled in the study by Pavel and Yaghmaei-Sabegh [10] in which a prediction model for the control period TC was developed. Vrancea intermediate-depth seismic region is characterized by earthquakes with reverse faulting mechanisms (in almost all events) and focal depths in the range of 60–220 km [35,36] (with the majority of the earthquakes occurring in the depth ranges of 90–110 km and 130–150 km). The two last major earthquakes occurred in 1940 and 1977 and affected Romania, as well as neighboring countries [37]. Some characteristics of Vrancea intermediate-depth earthquakes used in this study are briefly reported in Table 1 along with the number of recordings for each event and the range of the vertical peak ground accelerations. The range of epicentral distances is between 5 km and 400 km. It can be observed that the largest vertical peak ground acceleration was recorded during the moderate 2004 Vrancea event and not during the larger events of 1986 or 1990. In addition, only about 20% of the recordings were obtained during large-magnitude (MW ≥ 6.9) events. In addition, one has to mention that all the ground motions recorded during the MW ≥ 6.9 events were obtained using analog instruments.

Table 1.
Characteristics of Vrancea intermediate-depth earthquakes used in this study.
The distribution of the vertical peak ground acceleration as a function of the earthquake moment magnitude MW and hypocentral distance R is illustrated in Figure 1. It can be observed that very few vertical ground motion recordings have peak ground accelerations larger than 0.1 g.
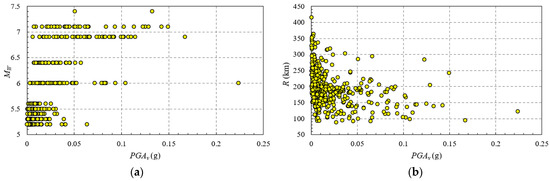
Figure 1.
Distribution of the vertical peak ground acceleration as a function of (a) earthquake moment magnitude MW; (b) hypocentral distance R.
The relation between the vertical peak ground acceleration PGAv and the horizontal one PGAh (defined as the geometrical mean of the two components) is analyzed in Figure 2. A fitted linear trendline and the coefficient R2 are also shown in Figure 2. It can be observed that the linear trendline approximates, quite well, the relation between the two peak ground accelerations in the horizontal and vertical directions (even for larger peak ground accelerations). Thus, it can be noticed that the vertical peak ground acceleration is about half of the corresponding horizontal one. The standard error of the linear regression shown in Figure 2 is 0.017.
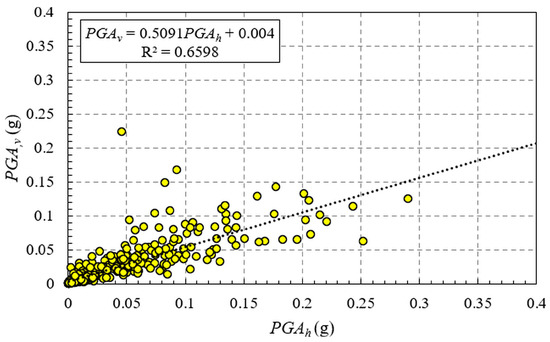
Figure 2.
Relation between the vertical peak ground acceleration PGAv as a function of the horizontal peak ground acceleration PGAh (geometrical mean of the two horizontal components).
The normalized (computed as the ratio between spectral accelerations and the corresponding peak ground acceleration) mean, mean + 1 standard deviation, and mean − 1 standard deviation vertical acceleration response spectra for the ground motions in the database are shown in Figure 3. It can be observed that the maximum amplification lies, as expected, in the short-period range, with the mean value of the amplification factor being approximately 2.5, a value similar to the one employed for the horizontal ground motion in the proposed Eurocode 8 draft [23]. In addition, due to the structure of the database itself (most of the ground motions recorded during smaller-magnitude events), there is a sharp decrease in the spectral amplitudes for periods longer than 0.20–0.25 s.
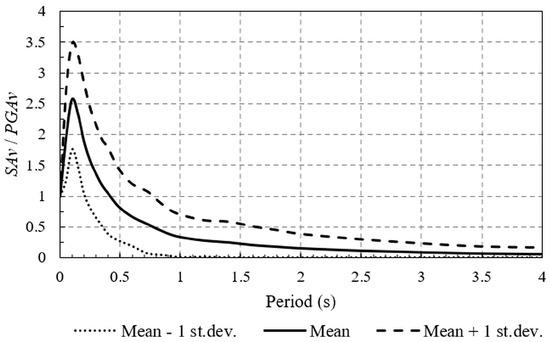
Figure 3.
Normalized mean, mean + 1 standard deviation, and mean − 1 standard deviation vertical acceleration response spectra for the database of recordings of Vrancea intermediate-depth earthquakes.
The variation in the normalized mean vertical acceleration response spectra with the earthquake magnitude is shown in Figure 4. The main observations from Figure 4 are as follows: (i) the maximum value of the spectral amplification is independent of the earthquake magnitude (the value is approximately 2.5 in all three cases) and (ii) the spectral amplifications for the medium- and long-period ranges are dependent on the earthquake magnitude (in the sense that larger-magnitude earthquakes generate larger spectral amplifications for the medium- and long-period ranges). Moreover, Figure 5 shows the normalized mean vertical acceleration response spectra as a function of the horizontal peak ground acceleration. It can be seen from Figure 5 that the main difference in terms of vertical spectral amplification period ranges is between the recordings having peak ground accelerations larger or smaller than 0.05 g.
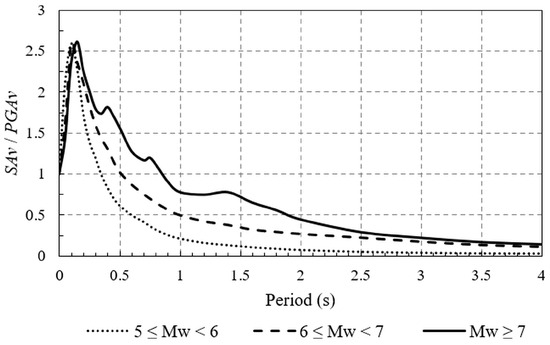
Figure 4.
Normalized mean vertical acceleration response spectra as a function of the earthquake magnitude.
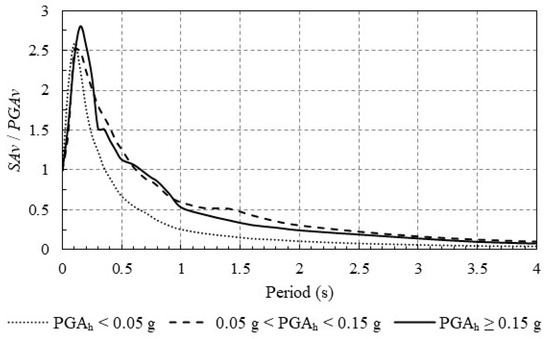
Figure 5.
Normalized mean vertical acceleration response spectra as a function of horizontal peak ground acceleration.
The control period TC,v for the vertical ground motion was evaluated using the same approach as that of the horizontal ground motions applied in the study by Pavel and Yaghmaei-Sabegh [10], namely, the approach from ASCE 7-16 [38]. In a previous study by Pavel and Lungu [39], a good correlation was observed between the two definitions of the control period TC (the one given by Lungu et al. [3] and the one from ASCE 7-16 [38]). All the definitions of the control period TC mentioned above are summarized in the study by Pavel and Lungu [39].
The correlation between the vertical control period TC,v and the horizontal one TC,h computed for the same ground motion recording is analyzed in Figure 6. The linear relation between the two control periods along with the coefficient R2 is also shown in Figure 6. The standard error of the linear regression is 0.146.
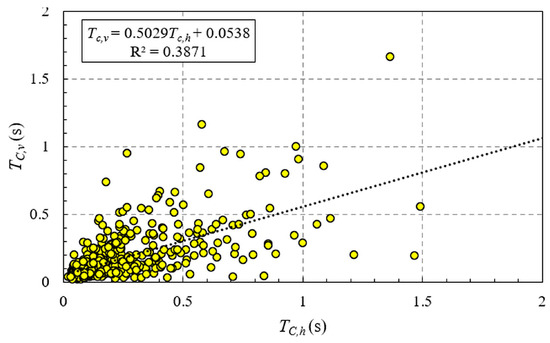
Figure 6.
Relation between the vertical control period TC,v and the horizontal one TC,h computed for the same ground motion recording.
3. Discussion of Results
The current approach to the definition of the vertical elastic response spectrum given by the current Romania seismic design code P100-1/2013 [1] is different than the one in the current Eurocode 8 [2]. Specifically, while both design codes define the vertical peak ground acceleration as a fraction of the horizontal one (the fraction is different), the control periods of the elastic vertical response spectrum are independent of (in the case of the current Eurocode 8 [2]) and dependent on (in the case of the code P100-1/2013 [1]) the control periods defining the horizontal elastic response spectrum. The model proposed in the current Eurocode 8 [2] is largely based on a previous research by Elnashai and Papazoglou [40]. On the other hand, the current draft of Eurocode 8 [23] also proposes a definition for the vertical spectral amplitudes based on the corresponding horizontal ones. However, a transition has been made in the current draft of Eurocode 8 [23] from peak ground accelerations to spectral accelerations as ground-motion amplitude metrics. In addition, the control period TB of the vertical elastic acceleration response spectrum is fixed at 0.05 s (as in the current Eurocode 8 [2]) and is not dependent on the control period TC as in the case of the horizontal elastic acceleration response spectrum.
The distribution of the control period TC,v for the vertical ground motion as a function of the earthquake magnitude and hypocentral distance is illustrated in Figure 7. A trend of slightly increasing TC,v values with the earthquake magnitude can be inferred from Figure 7. In the case of the hypocentral distance, a somewhat decreasing trend of the control periods TC,v can be observed. However, since there are very few ground motion recordings exhibiting large values of the control period TC,v, this inferred trend has to be further checked and validated.
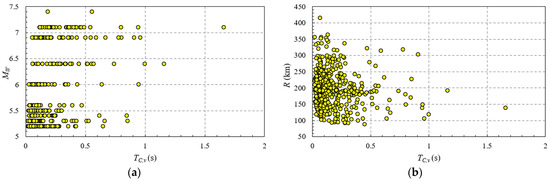
Figure 7.
Distribution of the control period TC,v for the vertical ground motion database as a function of (a) earthquake moment magnitude MW and (b) hypocentral distance R.
An evaluation of the ratio between the vertical and horizontal spectral accelerations as a function of the earthquake magnitude and hypocentral distance for peak ground acceleration and spectral accelerations at T = 0.2 s and T = 1.0 s is shown in Figure 8. Figure 8 shows the variation in the ratio of the vertical to the horizontal spectral accelerations as a function of the earthquake magnitude and hypocentral distance for T = 0.0 s, T = 0.2 s, and T = 1.0 s. No particular trend can be inferred from the plots shown in Figure 8, as the ratio varies significantly with respect to the former distance bin.
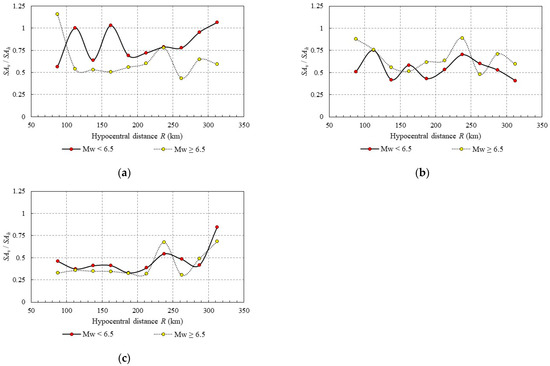
Figure 8.
Vertical to horizontal spectral ratios as a function of the earthquake moment magnitude MW and hypocentral distance R for (a) T = 0 s; (b) T = 0.2 s; (c) T = 1.0 s.
The median values of the ratio of the vertical to the horizontal response spectra at T = 0.0 s, T = 0.2 s, and T = 1.0 s computed in this study, as well as in other studies in the literature, are given in Table 2. It is important to note, as well, with reference to the results obtained in this study and shown in Table 2, that the standard deviation has basically the same order of magnitude as the median value for all three selected periods.
Table 2.
Median values of the ratio of the vertical to the horizontal response spectra at T = 0.0 s, T = 0.2 s, and T = 1.0 s computed in this study and proposed by Malhotra [41] and Cauzzi and Faccioli [42].
Subsequently, the influence of the site conditions on the control periods TC,v for the vertical ground motion is evaluated. For each seismic station, the corresponding site class is taken from the study by Pavel and Yaghmaei-Sabegh [10] in which the definition is based on the criteria given in the current draft of Eurocode 8 [23]. Similar evaluations of site conditions using the horizontal-to-vertical spectral ratios (HVSR) can be found, for instance, in various studies in the literature (e.g., [43,44,45]).
The results in terms of mean and median control periods TC,v for site classes B, C, and F defined according to the current draft of Eurocode 8 [23], and which have the largest number of recordings in the dataset (about 90% of the dataset compiled for this study), are reported in Table 3. It can be observed that the differences between the mean and median values as a function of the site class are very low. The analysis was not performed on site classes A (rock), D, and E since the number of available ground motion recordings is extremely limited (less than 10% of the entire dataset), and it does not permit an accurate estimation.
Table 3.
Mean and median control periods TC,v for seismic stations in site classes B, C, and F.
In order to validate this finding (the differences between the values for soil classes B, C, and F are very low), the mean normalized vertical acceleration response spectra as a function of the site class are shown in Figure 9. It can be observed from Figure 9 that the three mean normalized vertical acceleration response spectra have similar shapes, without significant differences.
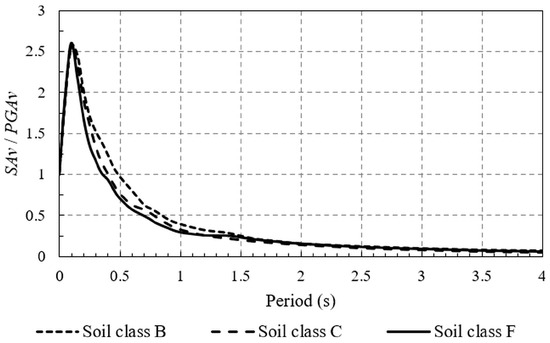
Figure 9.
Mean normalized vertical acceleration response spectra as a function of site class.
The median ratios between the vertical and horizontal response spectra at T = 0.0 s, T = 0.2 s, and T = 1.0 s computed in this study for three soil classes (B, C, and F) are reported in Table 4. It can be observed that the median ratio between the vertical and horizontal response spectra increases from soil class B to F for T = 0.0 s and has an opposite trend for T = 1.0 s. In the case of the median ratio between the vertical and horizontal response spectra at T = 0.2 s, the median ratio is not influenced by the soil class.
Table 4.
Median values of the ratio between the vertical and horizontal spectral ratios at T = 0.0 s, T = 0.2 s, and T = 1.0 s.
An evaluation of the variation of the mean control period TC,v as a function of the earthquake magnitude is shown in Figure 10 using all the ground motions recorded within Bucharest area (about 20% of the entire dataset compiled for this study). It has to be emphasized that Bucharest is situated on a layer of deep sediments [46,47,48]. A magnitude dependency of TC,v evaluated for Bucharest area (all the ground motions recorded in this area) can be inferred from the simple linear trendline fitted in Figure 10. It has to be emphasized that this type of analysis can be performed at this moment only in the case of Bucharest, as it is the only site which has more than five ground motion recordings for each magnitude bin. A more thorough analysis with an extended number of ground-motion recordings should be performed in order to validate the proposed linear fit.
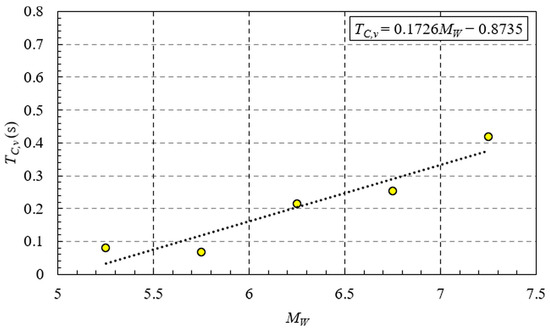
Figure 10.
Variation of the mean control period TC,v for vertical ground motions as a function of the earthquake magnitude for ground motions recorded in Bucharest area.
4. Derivation of the Vertical Elastic Acceleration Response Spectra for Design Purposes
In this section, based on the results shown in the previous ones, the vertical elastic acceleration response spectrum for Vrancea intermediate-depth earthquakes is derived for design purposes for the ultimate limit state (ULS). The proposed spectral shape is illustrated in Figure 11, along with the mean and mean + one standard deviation normalized vertical acceleration response spectral ordinates. The control periods of the proposed spectral shape are TBv = 0.05 s (value similar to the one given in the current draft of Eurocode 8 [23]) and TCv = 0.60 s. No magnitude or ground motion amplitude dependency of TBv was observed from the analyses. The value of TCv = 0.60 s was chosen so as to encompass the possible medium- and long-period spectral amplifications which were observed at a number of seismic stations during large-magnitude intermediate-depth earthquakes in Vrancea. In addition, the control period TCv = 0.60 s was also selected so as to exceed the mean + one standard deviation TCv value computed based on the ground motion recordings of the largest-magnitude events in the dataset (the earthquakes of March 1977, August 1986, and May 1990). Similarly with the spectral shape provided by Malhotra [41], no control period TDv is considered in the proposed shape. In addition, in order to determine the absolute vertical spectral accelerations, the short-period (at T = 0.2 s) and long-period (at T = 1.0 s) spectral amplifications are of 0.50 and 0.40 of the horizontal ones (based on the results in Table 3 and Table 4). The previously mentioned spectral amplification factors are slightly different from the ones proposed by Malhotra [41] and in the current draft of Eurocode 8 [23].
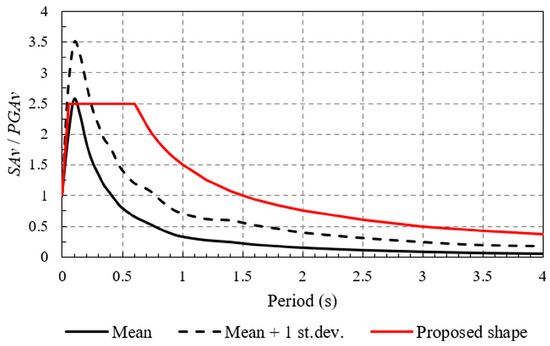
Figure 11.
Comparison of the proposed design spectral shape for the normalized vertical acceleration response spectrum for Vrancea intermediate-depth earthquakes with the mean and mean + one standard deviation normalized vertical acceleration response spectral ordinates.
A comparison of the proposed spectral shape with the one from the current Eurocode 8 [2] valid for shallow crustal earthquakes is shown in Figure 12. In addition, all the parameters of the proposed spectral shape are reported in Table 5.
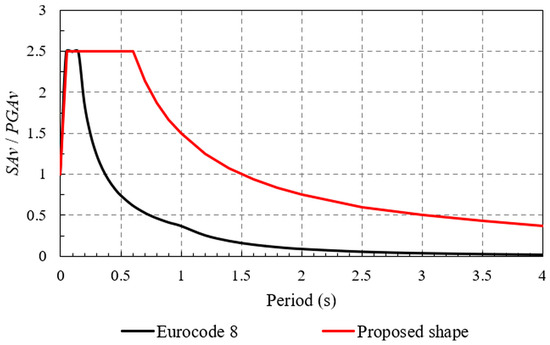
Figure 12.
Comparison of the proposed design spectral shape for the normalized vertical acceleration response spectrum for Vrancea intermediate-depth earthquakes with the one from the current Eurocode 8 [2].
Table 5.
Parameters of the proposed spectral shape for the normalized vertical acceleration response spectrum for Vrancea intermediate-depth earthquakes.
5. Conclusions
In this study, the vertical elastic acceleration response spectra from Vrancea (Romania) intermediate-depth earthquakes were analyzed in the context of the ongoing update of the national seismic design code and in the broader context of the current Eurocode 8 update. For this purpose, a ground-motion database of about 500 analog and digital ground-motion recordings from 13 moderate and large intermediate-depth earthquakes occurring in Vrancea in the period of 1977–2018 and having moment magnitudes MW ≥ 5.2 was compiled. The control period TC of the vertical ground motion was evaluated using the same approach as that applied for the horizontal components in previous studies available in the literature. It has to be emphasized that this is one of the few studies in the literature dealing with the vertical ground motion for intermediate-depth earthquakes and the development of design spectral shapes for this component. The main observations and conclusions of this research are as follows:
- The largest vertical peak ground acceleration was recorded during the moderate 2004 Vrancea event and not during the larger events of 1986 or 1990.
- The mean value of the dynamic amplification factor computed for the entire ground motion databases was about 2.5, a value also employed for the horizontal component. The computed value did not depend on the earthquake’s magnitude, site class, or horizontal peak ground acceleration.
- A linear trendline between the horizontal and vertical peak ground accelerations was inferred from the analyzed ground motion database. The results showed that the vertical peak ground acceleration was about half the corresponding horizontal one.
- The mean control period for the vertical ground motion TC,v evaluated for the entire dataset was about half the corresponding horizontal one TC,h.
- The results show that the maximum value of the spectral amplification of the vertical to horizontal components of ground motions is independent of the earthquake magnitude, and the spectral amplifications for the medium- and long-period ranges are dependent on the earthquake magnitude.
- No significant differences between the control periods TC,v as a function of the site class were observed. In addition, the mean vertical response spectra had similar shapes, irrespective of the site class.
- The analysis of the ground motions recorded in Bucharest area revealed a magnitude dependency of the control period for the vertical ground motion TC,v.
- The short-period (at T = 0.2 s) and long-period (at T = 1.0 s) spectral amplifications of the vertical acceleration response spectrum were 0.50 and 0.40 of the corresponding horizontal ones, values which are somewhat different from the ones proposed by Malhotra [41] and in the current draft of Eurocode 8 [23].
- For the ultimate limit state (ULS), a design spectral shape for vertical ground motion characterized by a maximum dynamic amplification factor of 2.5 and control periods TBv and TCv of 0.05 s and 0.60 s is proposed based on the results of the analyses for Vrancea intermediate-depth earthquakes. This aspect allows for a major update of the current version of the national seismic design code which proposes control periods of the elastic vertical response spectrum dependent on the horizontal ones. In addition, the value of the proposed design control period TCv is much larger than the one given, for instance, in the current Eurocode 8 [2].
- A future revision and update of the proposed spectral shape is envisaged when new data become available. In addition, a spectral shape for rock sites should also be developed in the future as more data become available.
- It has to be emphasized that the proposed spectral shape is valid only for the regions affected predominantly by Vrancea intermediate-depth earthquakes. For the other regions of Romania, which are affected by shallow local events (as is the case of the western part of the country), the designed spectral shapes for the vertical ground motion developed for the same type of earthquakes should be employed (for instance, the ones proposed in the current Eurocode 8 draft revision [23]).
Author Contributions
Conceptualization, F.P. and R.V.; methodology, F.P.; validation, F.P., A.A. and R.V.; formal analysis, C.A.; investigation, A.A.; data curation, F.P.; writing—original draft preparation, F.P.; writing—review and editing, A.A.; visualization, C.A.; funding acquisition, A.A. All authors have read and agreed to the published version of the manuscript.
Funding
Part of the presented work received support through the SETTING Project “Integrated thematic services in the field of Earth observation: a national platform for innovation”, No. 108206, cofinanced from the Regional Development European Fund (FEDR) through the Operational Competitivity Programme 2014–2020.
Data Availability Statement
The raw data supporting the conclusions of this article will be made available by the authors on request.
Conflicts of Interest
The authors declare no conflicts of interest.
References
- MDRAP P100-1/2013; Code for Seismic Design-Part I-Design Prescriptions for Buildings. MDRAP: Bucharest, Romania, 2013.
- EN 1998-1:2004; Eurocode 8: Design of Structures for Earthquake Resistance. Part 1: General Rules, Seismic Actions and Rules for Buildings. CEN: Brussels, Belgium, 2004.
- Lungu, D.; Cornea, T.; Aldea, A.; Zaicenco, A. Basic Representation of Seismic Action. In Design of Structures in Seismic Zones: Eurocode 8—Worked Examples; Bridgeman Ltd.: Timisoarea, Romania, 1997; pp. 1–60. [Google Scholar]
- Papazoglou, A.J.; Elnashai, A.S. Analytical and Field Evidence of the Damaging Effect of Vertical Earthquake Ground Motion. Earthq. Eng. Struct. Dyn. 1996, 25, 1109–1137. [Google Scholar] [CrossRef]
- Tian, Y.; Liu, X.; George, S. Effects of Vertical Ground Motion on Seismic Performance of Reinforced Concrete Flat-Plate Buildings. J. Struct. Eng. 2020, 146, 04020258. [Google Scholar] [CrossRef]
- Valdés-Vázquez, J.-G.; García-Soto, A.D.; Jaimes, M.Á. Impact of the Vertical Component of Earthquake Ground Motion in the Performance Level of Steel Buildings. Appl. Sci. 2021, 11, 1925. [Google Scholar] [CrossRef]
- Kallioras, S.; Graziotti, F.; Penna, A.; Magenes, G. Effects of Vertical Ground Motions on the Dynamic Response of URM Structures: Comparative Shake-Table Tests. Earthq. Eng. Struct. Dyn. 2022, 51, 347–368. [Google Scholar] [CrossRef]
- Wang, H.; Jia, M.; Yao, Y.; Chen, X.; Zhang, Z. Influence of the Vertical Component of Yangbi Ground Motion on the Dynamic Response of RC Frame and Brick-Concrete Structure. Buildings 2023, 13, 147. [Google Scholar] [CrossRef]
- Niculescu, C. The effects of earthquakes on constructions (the case of the Carlton building). Constructions 1948, 4, 288–291. [Google Scholar]
- Pavel, F.; Yaghmaei-Sabegh, S. Empirical Evaluation of the Control Period TC for Intermediate-Depth Earthquakes: Application for Romania. Nat. Hazards 2023, 118, 2609–2628. [Google Scholar] [CrossRef]
- Lungu, D.; Arion, C.; Aldea, A.; Demetriu, S. Assessment of Seismic Hazard in Romania Based on 25 Years of Strong Ground Motion Instrumentation. In Strong Motion Instrumentation for Civil Engineering Structures; Erdik, M., Celebi, M., Mihailov, V., Apaydin, N., Eds.; NATO Science Series; Springer: Dordrecht, The Netherlands, 2001; pp. 505–518. ISBN 978-94-010-0696-5. [Google Scholar]
- Pavel, F.; Vacareanu, R.; Cioflan, C.; Iancovici, M. Spectral Characteristics of Strong Ground Motions from Intermediate-Depth Vrancea Seismic Source. Bull. Seismol. Soc. Am. 2014, 104, 2842–2850. [Google Scholar] [CrossRef]
- Pavel, F.; Vacareanu, R.; Radulian, M.; Cioflan, C. Investigation on Directional Effects of Vrancea Subcrustal Earthquakes. Earthq. Eng. Eng. Vib. 2015, 14, 399–410. [Google Scholar] [CrossRef]
- Pavel, F. Analysis of Pulse-like Ground Motion Recordings from Vrancea Intermediate-Depth Earthquakes. J. Seism. 2021, 25, 733–745. [Google Scholar] [CrossRef]
- Sokolov, V.; Bonjer, K.-P.; Wenzel, F.; Grecu, B.; Radulian, M. Ground-Motion Prediction Equations for the Intermediate Depth Vrancea (Romania) Earthquakes. Bull. Earthq. Eng. 2008, 6, 367–388. [Google Scholar] [CrossRef]
- Vacareanu, R.; Radulian, M.; Iancovici, M.; Pavel, F.; Neagu, C. Fore-Arc and Back-Arc Ground Motion Prediction Model for Vrancea Intermediate Depth Seismic Source. J. Earthq. Eng. 2015, 19, 535–562. [Google Scholar] [CrossRef]
- Manea, E.F.; Cioflan, C.O.; Danciu, L. Ground-Motion Models for Vrancea Intermediate-Depth Earthquakes. Earthq. Spectra 2022, 38, 407–431. [Google Scholar] [CrossRef]
- Olteanu, P.; Vacareanu, R. Ground Motion Model for Spectral Displacement of Intermediate-Depth Earthquakes Generated by Vrancea Seismic Source. Geosciences 2020, 10, 282. [Google Scholar] [CrossRef]
- Pavel, F.; Vacareanu, R. Investigation on Site Conditions for Seismic Stations in Romania Using H/V Spectral Ratio. Earthq. Struct. 2015, 9, 983–997. [Google Scholar] [CrossRef]
- Grecu, B.; Zaharia, B.; Diaconescu, M.; Bala, A.; Nastase, E.; Constantinescu, E.; Tataru, D. Characterization of Site Conditions for Selected Seismic Stations in Eastern Part of Romania. Acta Geophys. 2018, 66, 153–165. [Google Scholar] [CrossRef]
- Manea, E.F.; Cioflan, C.O.; Coman, A.; Michel, C.; Poggi, V.; Fäh, D. Estimating Geophysical Bedrock Depth Using Single Station Analysis and Geophysical Data in the Extra-Carpathian Area of Romania. Pure Appl. Geophys. 2020, 177, 4829–4844. [Google Scholar] [CrossRef]
- Nakamura, Y.; Samizo, M. Site Effect Evaluation of Surface Ground Using Strong Motion Records. In Proceedings of the 20th JSCE Earthquake Engineering Symposium, 1989; pp. 133–136. [Google Scholar]
- CEN/TC 250/SC 8; Eurocode 8: Earthquake Resistance Design of Structures Working Draft 18.02.2021. CEN: Brussels, Belgium, 2021.
- Bozorgnia, Y.; Campbell, K.W. The Vertical-to-Horizontal Response Spectral Ratio and Tentative Procedures for Developing Simplified V/H and Vertical Design Spectra. J. Earthq. Eng. 2004, 8, 175–207. [Google Scholar] [CrossRef]
- Ambraseys, N.N.; Douglas, J.; Sarma, S.K.; Smit, P.M. Equations for the Estimation of Strong Ground Motions from Shallow Crustal Earthquakes Using Data from Europe and the Middle East: Horizontal Peak Ground Acceleration and Spectral Acceleration. Bull. Earthq. Eng. 2005, 3, 1–53. [Google Scholar] [CrossRef]
- Bozorgnia, Y.; Campbell, K.W. Ground Motion Model for the Vertical-to-Horizontal (V/H) Ratios of PGA, PGV, and Response Spectra. Earthq. Spectra 2016, 32, 951–978. [Google Scholar] [CrossRef]
- Edwards, B.; Poggi, V.; Fäh, D. A Predictive Equation for the Vertical-to-Horizontal Ratio of Ground Motion at Rock Sites Based on Shear-Wave Velocity Profiles from Japan and Switzerland. Bull. Seismol. Soc. Am. 2011, 101, 2998–3019. [Google Scholar] [CrossRef]
- Bommer, J.J.; Akkar, S.; Kale, Ö. A Model for Vertical-to-Horizontal Response Spectral Ratios for Europe and the Middle East. Bull. Seismol. Soc. Am. 2011, 101, 1783–1806. [Google Scholar] [CrossRef]
- Gülerce, Z.; Abrahamson, N.A. Site-Specific Design Spectra for Vertical Ground Motion. Earthq. Spectra 2011, 27, 1023–1047. [Google Scholar] [CrossRef]
- Ramadan, F.; Smerzini, C.; Lanzano, G.; Pacor, F. An Empirical Model for the Vertical-to-Horizontal Spectral Ratios for Italy. Earthq. Eng. Struct. Dyn. 2021, 50, 4121–4141. [Google Scholar] [CrossRef]
- Gülerce, Z.; Kamai, R.; Abrahamson, N.A.; Silva, W.J. Ground Motion Prediction Equations for the Vertical Ground Motion Component Based on the NGA-W2 Database. Earthq. Spectra 2017, 33, 499–528. [Google Scholar] [CrossRef]
- Çağnan, Z.; Akkar, S.; Kale, Ö.; Sandıkkaya, A. A Model for Predicting Vertical Component Peak Ground Acceleration (PGA), Peak Ground Velocity (PGV), and 5% Damped Pseudospectral Acceleration (PSA) for Europe and the Middle East. Bull. Earthq. Eng. 2017, 15, 2617–2643. [Google Scholar] [CrossRef]
- Laouami, N. Vertical Ground Motion Prediction Equations and Vertical-to-Horizontal (V/H) Ratios of PGA and PSA for Algeria and Surrounding Region. Bull. Earthq. Eng. 2019, 17, 3637–3660. [Google Scholar] [CrossRef]
- Zolfaghari, M.R.; Darzi, A. A Prediction Model for Vertical-to-Horizontal Ratios of PGA, PGV, and 5%-Damped Response Spectra (0.01–10 s) for Iran. J. Seism. 2019, 23, 819–837. [Google Scholar] [CrossRef]
- Radulian, M.; Mândrescu, N.; Panza, G.F.; Popescu, E.; Utale, A. Characterization of Seismogenic Zones of Romania. In Seismic Hazard of the Circum-Pannonian Region; Panza, G.F., Radulian, M., Trifu, C.-I., Eds.; Pageoph Topical Volumes; Birkhäuser: Basel, Switzerland, 2000; pp. 57–77. ISBN 978-3-0348-8415-0. [Google Scholar]
- Petrescu, L.; Borleanu, F.; Radulian, M.; Ismail-Zadeh, A.; Maţenco, L. Tectonic Regimes and Stress Patterns in the Vrancea Seismic Zone: Insights into Intermediate-Depth Earthquake Nests in Locked Collisional Settings. Tectonophysics 2021, 799, 228688. [Google Scholar] [CrossRef]
- Kronrod, T.; Radulian, M.; Panza, G.; Popa, M.; Paskaleva, I.; Radovanovich, S.; Gribovszki, K.; Sandu, I.; Pekevski, L. Integrated Transnational Macroseismic Data Set for the Strongest Earthquakes of Vrancea (Romania). Tectonophysics 2013, 590, 1–23. [Google Scholar] [CrossRef]
- ASCE/SEI 7-16; Minimum Design Loads and Associated Criteria for Buildings and Other Structures. ASCE: Reston, VA, USA, 2017.
- Pavel, F.; Lungu, D. Correlations Between Frequency Content Indicators of Strong Ground Motions and PGV. J. Earthq. Eng. 2013, 17, 543–559. [Google Scholar] [CrossRef]
- Elnashai, A.S.; Papazoglou, A.J. Procedure and Spectra for Analysis of Rc Structures Subjected to Strong Vertical Earthquake Loads. J. Earthq. Eng. 1997, 1, 121–155. [Google Scholar] [CrossRef]
- Malhotra, P.K. Smooth Spectra of Horizontal and Vertical Ground Motions. Bull. Seismol. Soc. Am. 2006, 96, 506–518. [Google Scholar] [CrossRef]
- Cauzzi, C.; Faccioli, E. Broadband (0.05 to 20 s) Prediction of Displacement Response Spectra Based on Worldwide Digital Records. J Seism. 2008, 12, 453–475. [Google Scholar] [CrossRef]
- Yaghmaei-Sabegh, S.; Rupakhety, R. A New Method of Seismic Site Classification Using HVSR Curves: A Case Study of the 12 November 2017 Mw 7.3 Ezgeleh Earthquake in Iran. Eng. Geol. 2020, 270, 105574. [Google Scholar] [CrossRef]
- Totani, F.; Aloisio, A. Probabilistic Shear Wave Velocity Model Based on Downhole Test Database for Apennine Flysch Formations. Soil Dyn. Earthq. Eng. 2023, 173, 108132. [Google Scholar] [CrossRef]
- Ilhan, O.; Indır, O.; Muratoğlu, G.; İçen, A.; Albayrak, K.; Sandıkkaya, M.A.; Askan, A.; Arduino, P.; Taciroğlu, E. Local Site Effects at the Selected Stations Affected by the February 6 2023 Türkiye Earthquake Sequences. Soil Dyn. Earthq. Eng. 2024, 178, 108454. [Google Scholar] [CrossRef]
- Manea, E.F.; Michel, C.; Poggi, V.; Fäh, D.; Radulian, M.; Balan, F.S. Improving the Shear Wave Velocity Structure beneath Bucharest (Romania) Using Ambient Vibrations. Geophys. J. Int. 2016, 207, 848–861. [Google Scholar] [CrossRef]
- Pavel, F.; Vacareanu, R.; Pitilakis, K.; Anastasiadis, A. Investigation on Site-Specific Seismic Response Analysis for Bucharest (Romania). Bull Earthq. Eng 2020, 18, 1933–1953. [Google Scholar] [CrossRef]
- Lungu, D.; Aldea, A.; Moldoveanu, T.; Ciugudean, V.; Stefanica, M. Near-Surface Geology and Dynamic Properties of Soil Layers in Bucharest. In Vrancea Earthquakes: Tectonics, Hazard and Risk Mitigation: Contributions from the First International Workshop on Vrancea Earthquakes, Bucharest, Romania, November 1–4, 1997; Wenzel, F., Lungu, D., Novak, O., Eds.; Advances in Natural and Technological Hazards Research; Springer: Dordrecht, The Netherlands, 1999; pp. 137–148. ISBN 978-94-011-4748-4. [Google Scholar]
Disclaimer/Publisher’s Note: The statements, opinions and data contained in all publications are solely those of the individual author(s) and contributor(s) and not of MDPI and/or the editor(s). MDPI and/or the editor(s) disclaim responsibility for any injury to people or property resulting from any ideas, methods, instructions or products referred to in the content. |
© 2024 by the authors. Licensee MDPI, Basel, Switzerland. This article is an open access article distributed under the terms and conditions of the Creative Commons Attribution (CC BY) license (https://creativecommons.org/licenses/by/4.0/).