Article

The Prediction of Pervious Concrete Compressive Strength Based on a Convolutional Neural Network

School of Transportation and Civil Engineering, Nantong University, Nantong 226019, China
*
Author to whom correspondence should be addressed.
Buildings 2024, 14(4), 907; https://doi.org/10.3390/buildings14040907
Submission received: 1 March 2024 / Revised: 22 March 2024 / Accepted: 22 March 2024 / Published: 27 March 2024
(This article belongs to the Section Building Materials, and Repair & Renovation)

Abstract

:
To overcome limitations inherent in existing mechanical performance prediction models for pervious concrete, including material constraints, limited applicability, and inadequate accuracy, this study employs a deep learning approach to construct a Convolutional Neural Network (CNN) model with three convolutional modules. The primary objective of the model is to precisely predict the 28-day compressive strength of pervious concrete. Eight input variables, encompassing coarse and fine aggregate content, water content, admixture content, cement content, fly ash content, and silica fume content, were selected for the model. The dataset utilized for both model training and testing consists of 111 sample sets. To ensure the model’s coverage within the practical range of pervious concrete strength and to enhance its robustness in real-world applications, an additional 12 sets of experimental data were incorporated for training and testing. The research findings indicate that, in comparison to the conventional machine learning method of Backpropagation (BP) neural networks, the developed CNN prediction model in this paper demonstrates a higher coefficient of determination, reaching 0.938, on the test dataset. The mean absolute percentage error is 9.13%, signifying that the proposed prediction model exhibits notable accuracy and universality in predicting the 28-day compressive strength of pervious concrete, regardless of the materials used in its preparation.

1. Introduction

Pervious concrete, acknowledged as an innovative and environmentally friendly construction material, features remarkable attributes such as excellent permeability, anti-slip properties, corrosion resistance, and durability [1,2]. With its applications ranging from urban development to environmental protection, pervious concrete offers a wide range of potential uses [3]. Among its key performance indicators, compressive strength emerges as pivotal. Precise prediction of pervious concrete’s compressive strength holds paramount importance in enhancing the design and construction quality of structures employing this material.
In recent years, extensive research has been conducted on the performance indicators of pervious concrete. Many studies have employed diverse experimental materials and conducted comparative experiments with varying mix proportions to investigate the influence of different materials on the compressive strength and other performance indicators of pervious concrete under different design conditions. These investigations have covered various aspects, including different fly ash substitution rates [4,5,6], various aggregate types [7,8,9], and different cement varieties [10,11], aiming to understand the impact of these factors on pervious concrete performance. With the increasing application of pervious concrete in urban construction, researchers have begun to explore the effects of novel materials on its performance. This includes investigating the influence of different types of fibers [12,13,14] and utilizing construction waste to prepare pervious concrete to meet specific performance requirements in urban construction [15,16]. Considerations have also been given to factors such as curing conditions [17] and porosity [18,19], analyzing the variations in compressive strength in pervious concrete from multiple perspectives. In addition to macroscopic studies on the strength variation patterns of pervious concrete, some researchers have employed advanced techniques such as Scanning Electron Microscopy (SEM) to investigate factors influencing its performance at a microscopic level. For example, Kelly Patrícia Torres Vieira et al. [20] observed recycled aggregate pervious concrete samples using SEM, discovering a significant decrease in compressive strength with an increase in the proportion of recycled aggregate. Conversely, Xiaoyan Zheng et al. [21] utilized field emission SEM and X-ray diffraction to study the mechanism of alkali-activated materials on pervious concrete performance. These microscopic studies not only provide a profound analysis of the variation mechanism of compressive strength in pervious concrete through extensive experimental data but also reveal key factors at the microscopic level, offering valuable guidance for future pervious concrete design and construction.
While previous studies have derived variation patterns of compressive strength in pervious concrete [22] with specific material configurations based on experimental materials, proposing empirical formulas, Table 1 illustrates some of these formulas and their predictive effectiveness. However, the empirical formulas may not precisely predict the compressive strength of pervious concrete with different materials and mix proportions as the scope of application widens and new materials are developed. Given the rigor of previous research and the resource consumption of comparative experiments, comprehensive consideration of pervious concrete compressive strength may be limited by unique geological conditions and technological capabilities in different regions. Different regions possess distinct construction experiences and explorations of pervious concrete preparation methods, making it challenging to obtain a prediction method applicable to the compressive strength of all pervious concrete using traditional empirical formulas. Therefore, it is of practical significance to fully utilize the results and experimental data from previous research to accurately predict the 28-day compressive strength of commonly used formulations of pervious concrete.
Table 1 illustrates that with the introduction of complex methods such as logarithms, the predictive accuracy of traditional empirical formulas continues to improve. However, it is crucial to note that the accuracy of traditional empirical formulas often relies on specific mix proportions. Consequently, empirical formulas that perform well in certain studies may not be applicable to research based on different mix proportions. This limitation arises from the fact that mix proportions and material types are typically not considered when constructing these formulas. Incorporating mix proportion information significantly increases the data requirements for model construction. Additionally, traditional regression methods may struggle to handle such large datasets effectively.
In recent years, research in machine learning and deep learning has made it feasible to predict sample indicators by integrating past large datasets with existing sample features [28,29]. Existing studies indicate that models based on machine learning and deep learning can predict the compressive strength of concrete with relatively high accuracy [30,31,32]. For instance, predictive models constructed using BP neural networks have shown good predictive performance regarding the compressive strength of different types of concrete [33,34,35,36,37]. Additionally, other machine learning methods, besides BP neural networks, have demonstrated a favorable trend in predicting the 28-day compressive strength of concrete [38,39,40,41,42]. With the continuous advancement of deep learning, models for predicting the compressive strength of concrete established using CNNs and improved convolutional neural networks exhibit superior predictive performance compared to traditional machine learning methods [43,44,45,46]. This provides novel insights and methods for researching the prediction of compressive strength in pervious concrete. For example, Ziyue Zeng et al. [47] analyzed the effectiveness of various deep learning and machine learning methods in predicting the compressive strength of concrete and developed a CNN-based predictive model for concrete compressive strength. This model was trained using data on concrete compressive strength from various materials with different material types and mix proportions. Testing revealed an R2 of 0.967 on the test set, confirming that the CNN-based predictive method for concrete compressive strength can be applied to concrete prepared from different materials with better applicability compared to traditional empirical formulas.
This study presents a predictive model for the 28-day compressive strength of pervious concrete utilizing CNN. The methodology integrates various material characteristics of pervious concrete, effectively merging existing research data and practical engineering experience to yield reliable strength predictions. By employing a deep neural network and utilizing the content of each component as input for data training and analysis, this approach is not only operationally straightforward but also adeptly characterizes key features influencing concrete strength, including water-to-cement ratio, sand-to-aggregate ratio, fly ash substitution ratio, etc.
The main contributions of this study are as follows: (i) Development of a CNN model to predict the 28-day compressive strength of pervious concrete. Comparative assessments based on goodness of fit, average absolute percentage error, root mean square error, and mean absolute error demonstrate the superior performance of the proposed model. (ii) Integration of existing mix proportion information into the model, primarily obtained from previous studies on the mechanical performance of pervious concrete. This utilization of component information as input simplifies the model’s operation, alleviating additional workload for engineers and enhancing its practicality. (iii) The proposed model achieves a goodness of fit greater than 0.9 on the test set, indicating its effectiveness in predicting the 28-day compressive strength of pervious concrete with different materials. The average absolute percentage error on the test set is less than 10%, suggesting that the CNN model’s prediction errors regarding pervious concrete strength under the influence of different materials fall within an acceptable range, affirming the applicability of the proposed method.
This research presents a novel approach, providing theoretical support for predicting the strength of pervious concrete. The findings offer valuable insights for future in-depth studies in related fields.

2. Data Source and Model Testing

To ensure experimental reproducibility, this section will introduce the data sources used to train the CNN, the methods employed for acquiring experimental data, as well as the structural information of the CNN and the specifics of the training and testing processes.

2.1. Data Source

To validate the universality of the predictive model established in this study, we employed data from experiments on pervious concrete using different materials reported in the literature for training and testing a convolutional neural network. Table 2 provides the sources and relevant component information for these 111 sets of data. Given that the compressive strength of pervious concrete is typically lower than that of conventional concrete and varies within the range of 2–28 MPa [22], although advances in research have led to improvements in the compressive strength of pervious concrete, it still remains lower than that of conventional concrete. Based on this, we searched for pervious concrete samples within the compressive strength range of 2 to 40 MPa for model training and prediction. Additionally, due to variations in the mix composition of pervious concrete studied in different articles, adding samples beyond a certain range of material types may lead to difficulty in model convergence during training. Therefore, we selected several sets of samples with conventional mix compositions to ensure better applicability of the model at the current stage. Specifically, during the data collection process, we gathered information on coarse and fine aggregate types and contents, water content, admixture content, cement types and contents, fly ash content, silica fume content, and 28-day compressive strength for each sample group. Furthermore, to mitigate the potential impact of minor variations in the training or testing sets on model training or prediction errors, we additionally collected 12 sets of data through experiments (as described in Section 3.2) and incorporated them into the dataset. Subsequently, each sample in the overall dataset was randomly assigned to the training set and testing set, ensuring that a different training set and testing set were used each time the model was run to enhance its robustness.
Considering the aim of this study to establish a method for predicting the 28-day compressive strength of pervious concrete, it is noted that existing publicly available datasets do not encompass the mix proportion information of pervious concrete prepared from different types of materials. In such a scenario, including material types as input parameters may potentially hinder model convergence or lead to poor predictive performance. Therefore, in the process of model development, this study opts to disregard restrictions on aggregate and cement types and endeavors to seek pervious concrete data that approximate material preparation during model training.
The dataset obtained from the literature was split into two subsets, with 70% designated as the training set and the remaining 30% as the testing set, utilized for training and evaluating the CNN models. Each sample in the dataset includes nine pieces of information: coarse and fine aggregate content, water content, admixture content, cement content, fly ash content, and silica fume content, covering eight input variables, along with the corresponding compressive strength after 28 days of curing.

2.2. Model Information
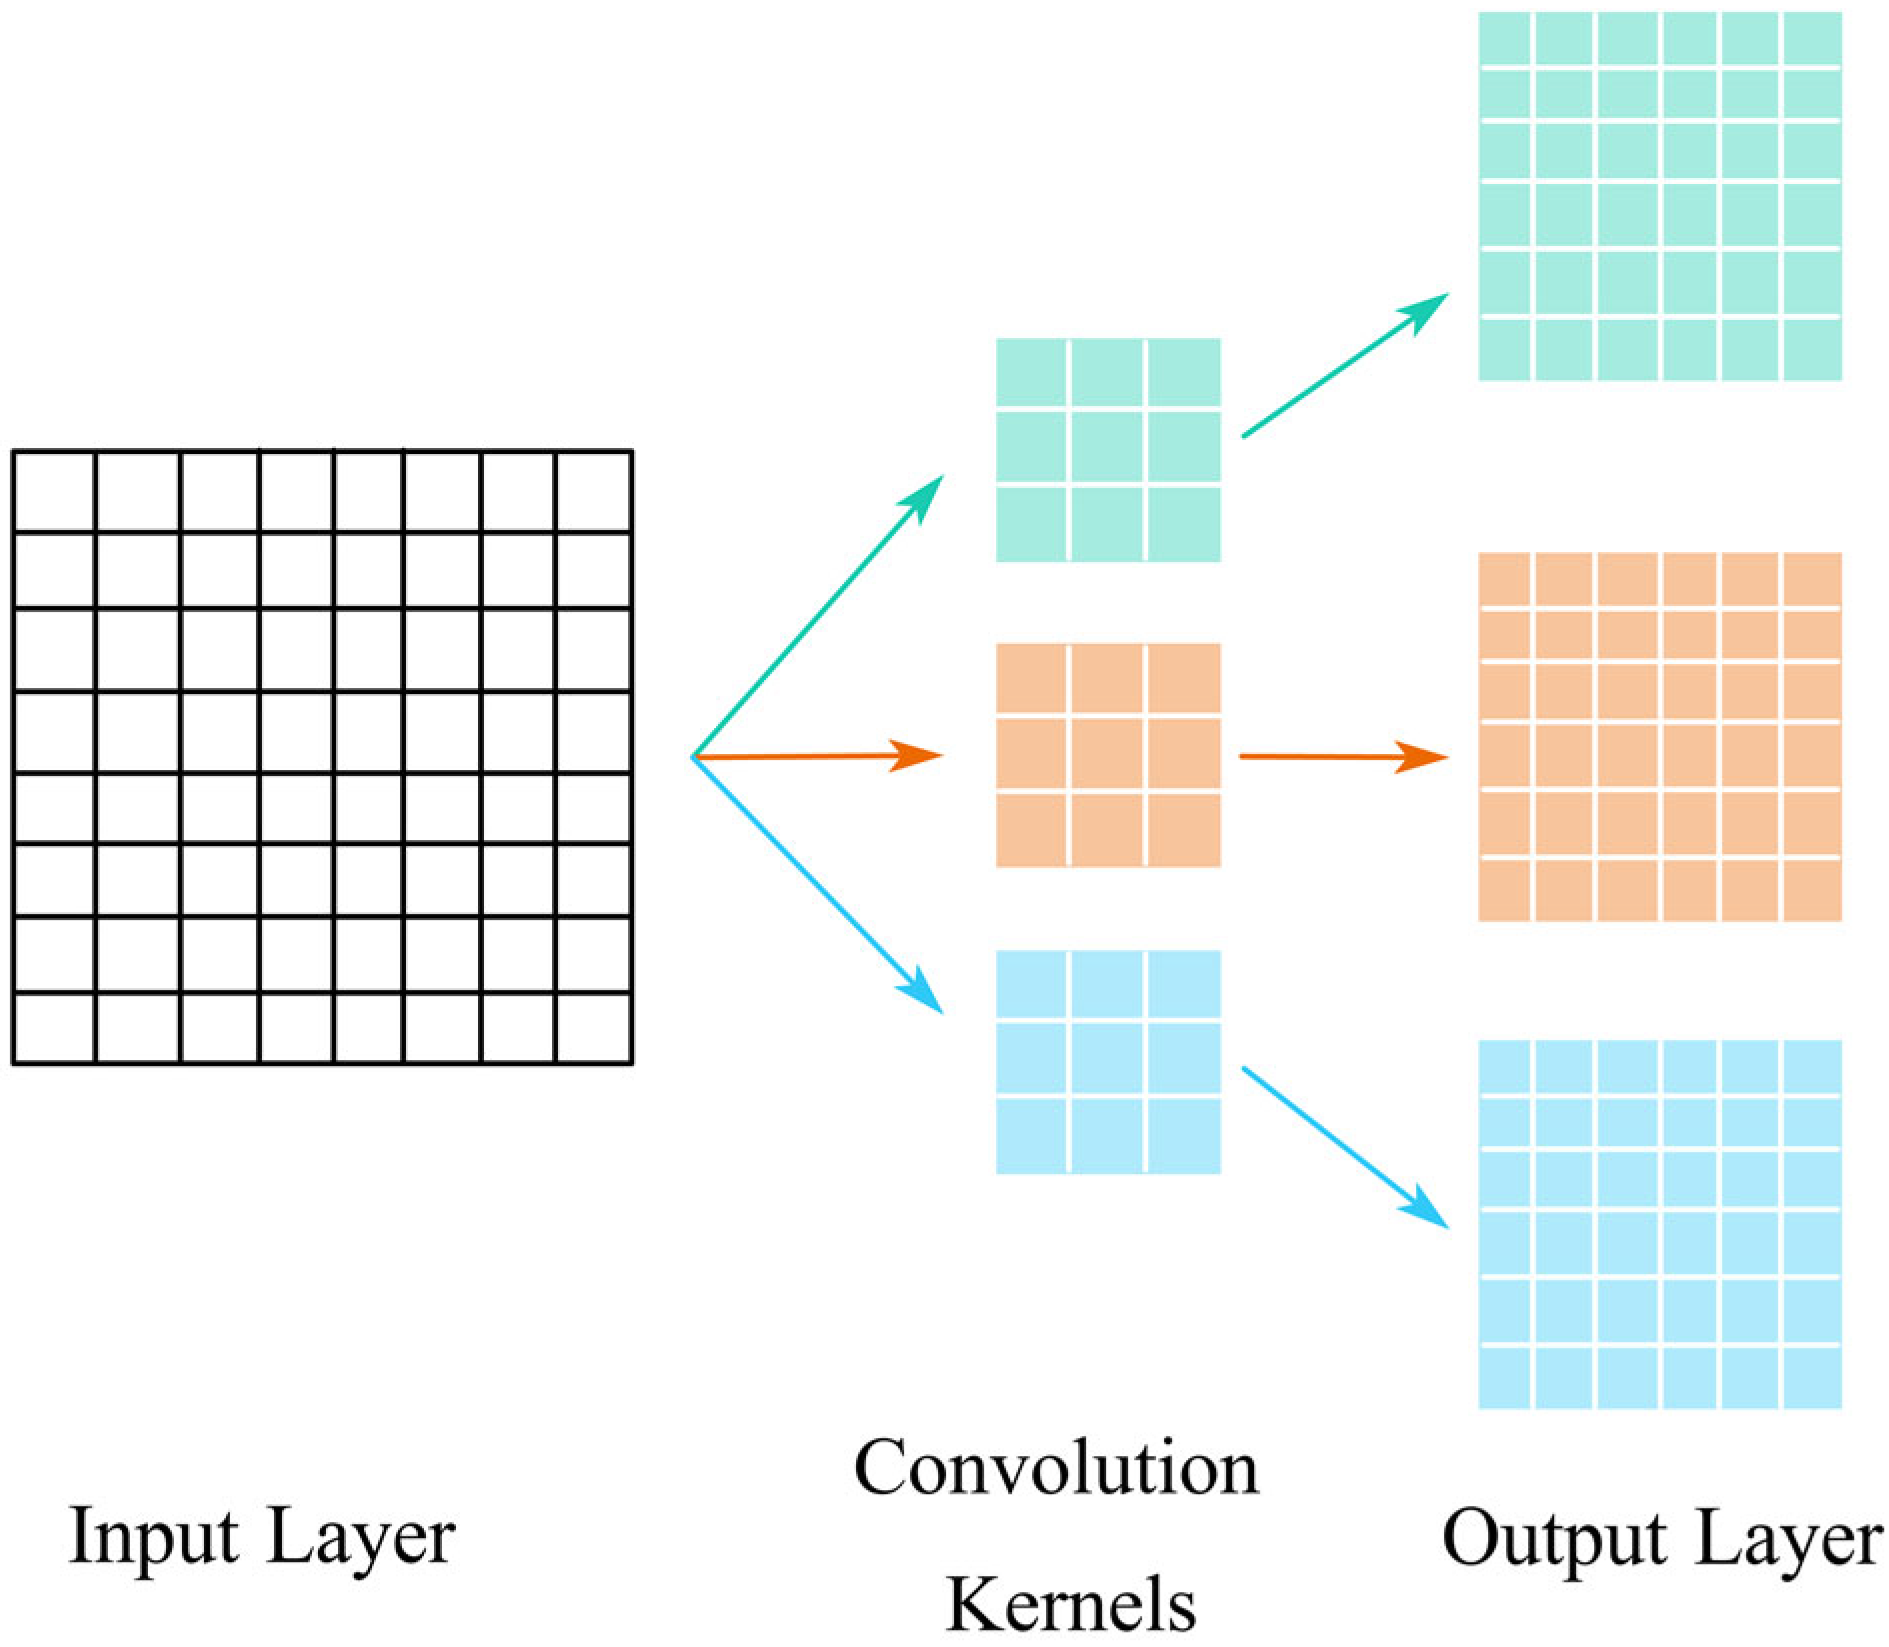
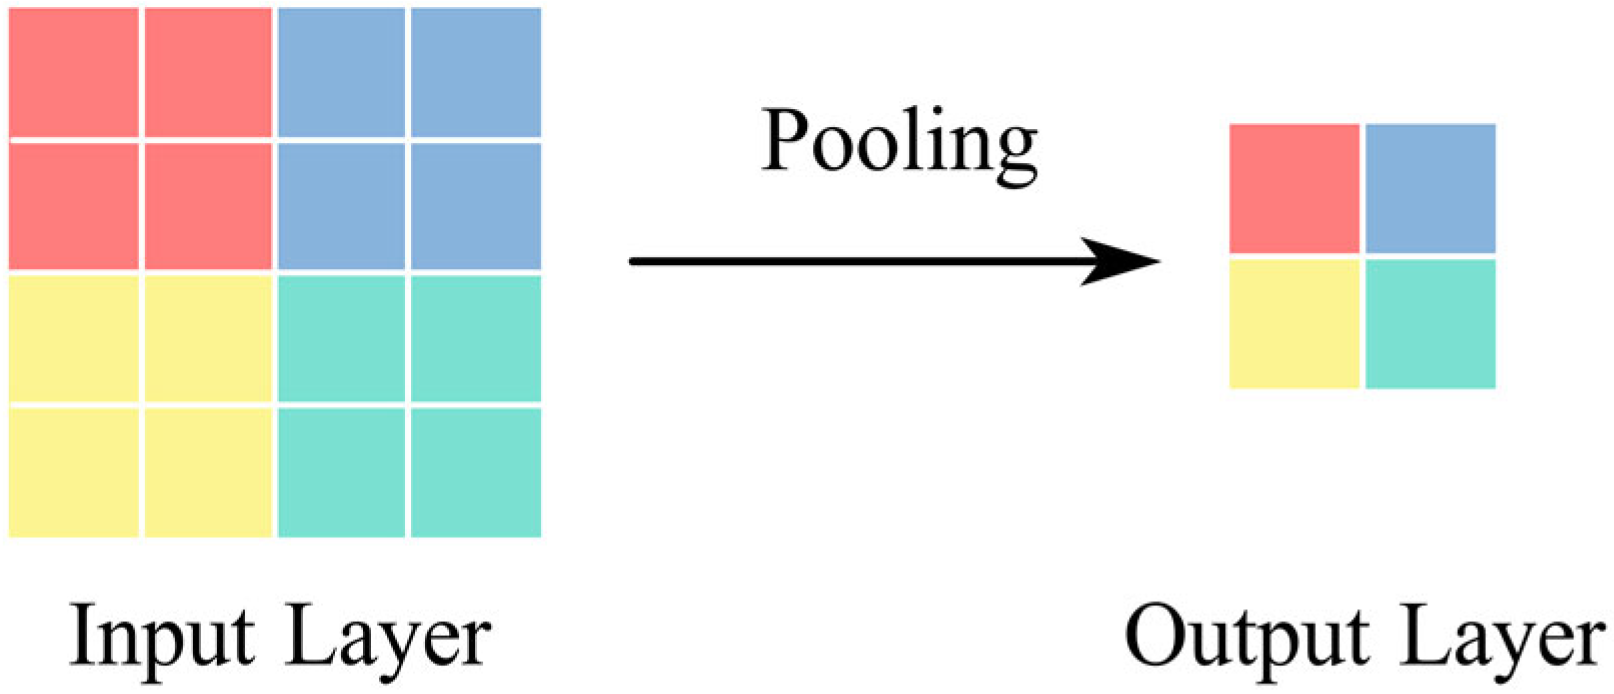
2.2.1. Background

CNN is a standard neural network structure in deep learning, originating from computer vision and finding widespread applications. It typically consists of layers, including convolutional layers, pooling layers, batch normalization layers, activation functions, and more. Among these, the convolutional layer performs convolution operations on the output data from the preceding layer to extract diverse features. This process can be represented as:
Y i , j k = m = 0 H 1 n = 0 W 1 l = 0 C 1 X ( S i + m , S j + n , l ) ω ( m , n , l , k ) + b ( k )
In the equation, Y i , j k represents the value at position (i, j) after the original data undergoes processing with the k-th convolutional kernel. H represents the height, W represents the width, C represents the number of channels in the input image, X(i, j, l) represents the value at position (i, j) on channel l of the input data, S denotes the stride of the convolutional kernel, set to 1 in this study. ω ( m , n , l , k ) signifies the value of the k-th convolutional kernel at position (i, j) on channel l, and b(k) denotes the bias of the k-th convolutional kernel. The convolutional layer extracts features from the output data of the preceding layer following the described rules, as illustrated in Figure 1.
The pooling layer is employed to filter redundant components from the output data of the preceding layer, reducing the computed data volume, enhancing the model’s noise resistance, preventing overfitting, and simultaneously preserving the original data features. Common pooling methods include max pooling and average pooling, with this study choosing max pooling to filter the data processed by the convolutional layer. Specifically, within each data region of the pooling kernel size, the maximum value is selected to form the new output. The primary computational process can be expressed by the following formula:
Y i , j l = max X ( S i + m , S j + n , l ) , m , n = 0 , , P 1
In the equation, Y i , j l represents the data value at position (i, j) for the l-th channel of the pooling layer’s output, and X(i, j, l) represents the value at position (i, j) for channel l of the input data. S denotes the stride of the pooling kernel, set to 1 in this study, and P represents the size of the pooling kernel. The process of the pooling layer’s treatment of the output data from the preceding layer (with a stride of 2 for the pooling kernel) is illustrated in Figure 2.
The batch normalization layer can be viewed as a preprocessing step involving data standardization and regularization. It is frequently applied in convolutional neural networks to normalize the output of each convolutional layer, ensuring that the outputs adhere to a Gaussian distribution with consistent mean and variance. This aids in preventing continuous shifts in the distribution of input data across different layers, thereby enhancing the stability and efficiency of the training process. The batch normalization process involves the following steps. Firstly, calculate the variance and mean for each data batch:
μ = 1 m i = 1 m X i
σ 2 = 1 m i = 1 m ( X i μ ) 2
In the equation, m represents the size of each batch, and Xi represents the i-th sample within each batch.
By computing the variance and mean of each batch, the normalization process is applied to the batch data:
X ^ i = X i μ σ 2 + ε
Here, ε is a small positive constant introduced to prevent division by zero in the denominator.
Finally, the normalized data is shifted and scaled to accelerate the training process while ensuring the stability of the model:
Y i = γ X ^ i + β
Here, γ represents the scaling parameter, and β is the translation parameter.
The activation function introduces non-linearity into the model, thereby enhancing the expressive power of the neural network. Common activation functions include the Rectified Linear Unit (ReLU) function, the Sigmoid function, and others. In this study, the ReLU function is utilized as the activation function for the convolutional neural network. The computation process of the ReLU function for each input data x is represented as follows:
f ( x ) = max ( 0 , x )
The fully connected layer achieves a linear combination of data and weights, introducing non-linearity through the incorporation of an activation function. This allows the model to extract more complex features from the data and undergo non-linear transformations, thereby enhancing its flexibility. The computation process is as follows:
Y = f ( X W + b )
In the equation, X represents the input data vector, W is the weight matrix, b is the bias vector, and f(x) denotes the ReLU function.

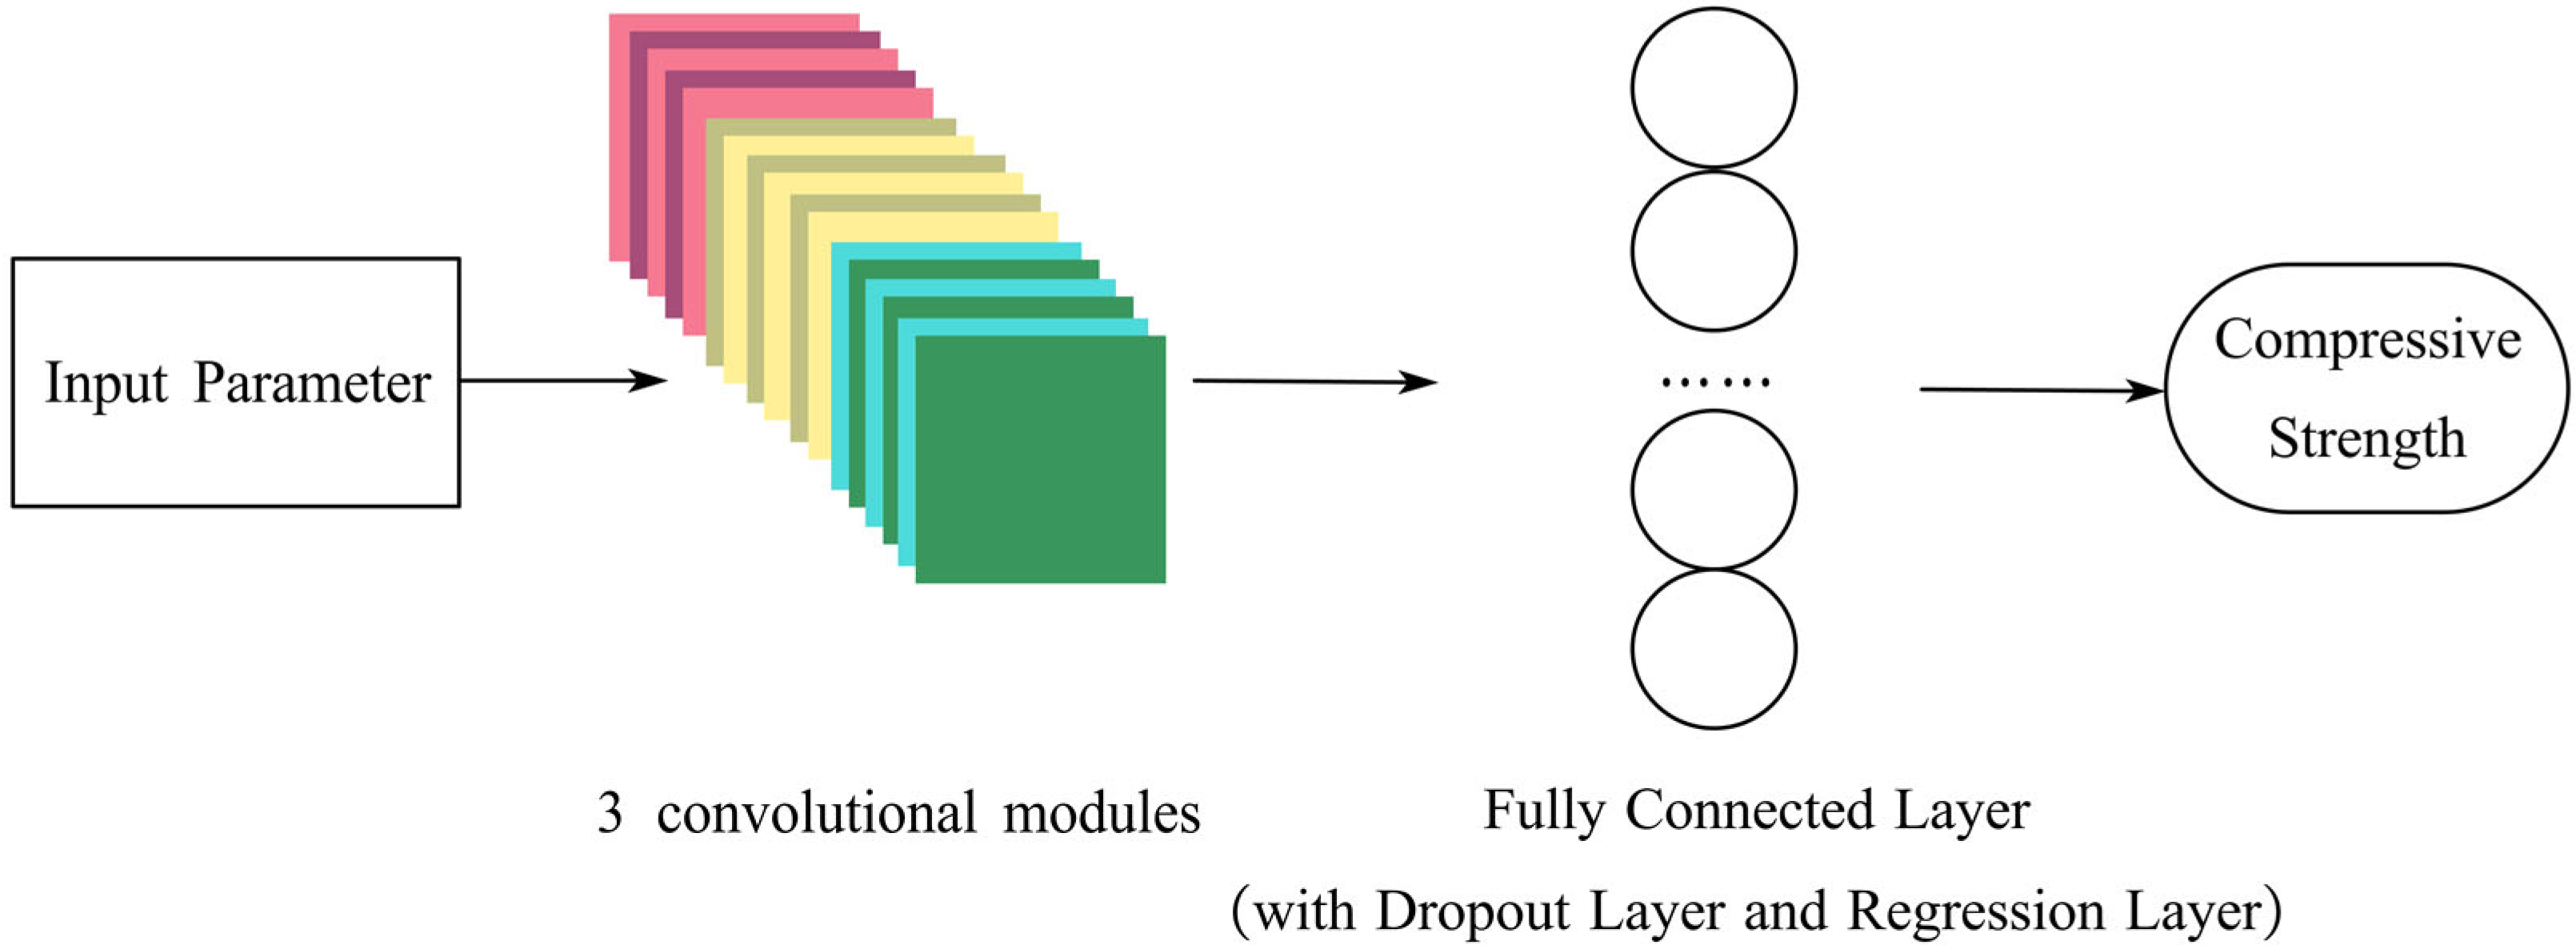
2.2.2. CNN Structure

CNNs have been extensively explored by researchers for predicting concrete compressive strength. For instance, Deng et al. [54] developed a neural network with a convolutional layer kernel and a hidden layer containing four neurons, utilizing four input features to predict recycled aggregate concrete. Conversely, Zeng et al. [47] argued that as the number of input indicators increases, the CNN’s structure should be adjusted accordingly. Therefore, they expanded the number of convolutional kernels and conducted a search for the optimal number of neurons in the fully connected layer within the range of 4 to 128.
Considering the significant variations in raw materials among samples in this study, the convolutional structure is enhanced accordingly. Each convolutional structure comprises a convolutional layer (with a kernel size of 3 × 1 × 1), a pooling layer (with a pooling kernel size of 1 × 1), a batch normalization layer, and a ReLU activation function layer. The collected data enter the model through the input layer. After undergoing basic training with three convolutional structures, redundant data are eliminated through dropout layers. Subsequently, data fusion is accomplished through fully connected layers. Finally, the model is trained, and data prediction is performed using a regression layer. The structure of the CNN is illustrated in Figure 3.

2.3. Model Training and Testing

The model undergoes training using a loss function, which quantifies the disparity between predicted and actual values. The CNN is iteratively optimized during training to minimize this loss. Common loss functions encompass mean square error, mean absolute error, and cross-entropy. In this study, the root mean square error (RMSE) is chosen as the loss function. The error after a training iteration is computed as:
L N = 1 N i = 1 N ( y i y ^ i ) 2
Here, N represents the total number of samples, y i denotes the actual value of the i-th sample, and y ^ i is the predicted value for the i-th sample.
The optimizer fine-tunes model parameters for the CNN based on predefined criteria to minimize the loss function. In this study, stochastic gradient descent (SGD) is employed as the optimizer. For each training iteration, SGD randomly selects a subset from all samples to calculate the gradient, subsequently updating the model parameters. The main formula for this process is as follows:
θ t + 1 = θ t η L ( θ t ; x i , y i )
In the equation, θ t represents the values of the model parameters at the t-th training iteration, η is the learning rate, L ( θ t ; x i , y i ) denotes the loss function of the sample ( x i , y i ) at the t-th training iteration, and L ( θ t ; x i , y i ) is the partial derivative of the loss function with respect to the model parameters.
During the initial training phase of convolutional networks, a higher learning rate aids in the rapid convergence of the model. However, as the model approaches the optimal point, a higher learning rate may lead to oscillations during training. Therefore, this study adopts a strategy of dynamic learning rate adjustment. We set the initial learning rate to 0.01, with a learning rate decay factor of 0.5. After 500 training iterations, the learning rate is reduced to 0.005. Additionally, during training, each batch consists of 30 samples, with a maximum of 2000 training iterations. The dataset is divided into 70% for training and 30% for testing. Given that this study aims to validate and test the predictive performance of CNNs for pervious concrete compressive strength, MATLAB 2021b is utilized for CNN model construction, training, and testing. Due to cost considerations, a shared data platform is not established at present.

3. Results and Discussion

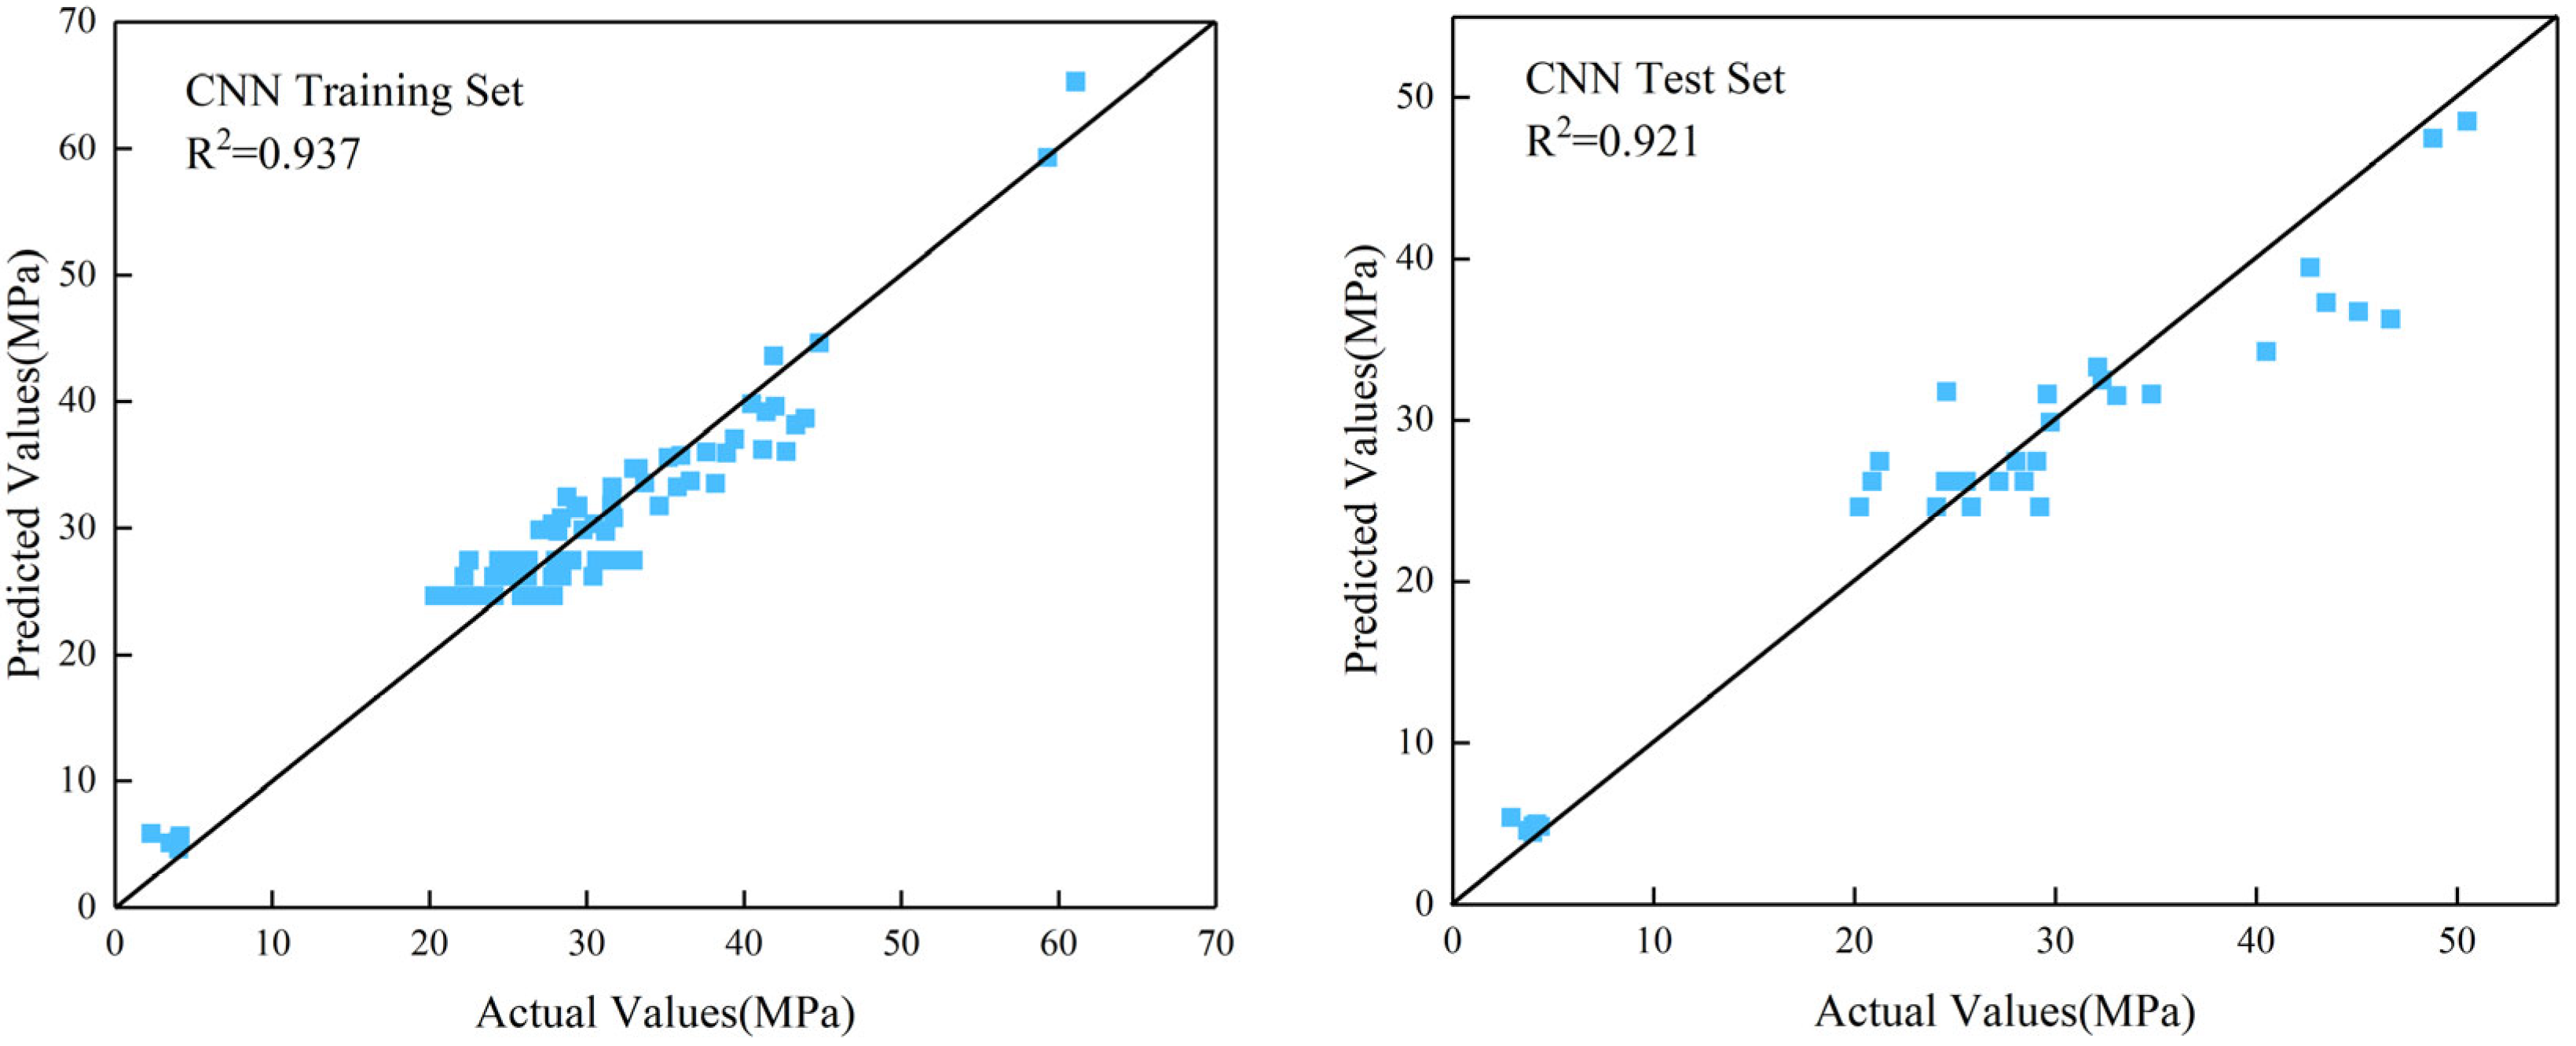
3.1. CNN Model Predictive Performance

To visually demonstrate the predictive capabilities of the CNN model for the compressive strength of pervious concrete, this study selects results from a specific experiment, as illustrated in Figure 4. The vertical axis represents the 28-day compressive strength predicted by the CNN model, while the horizontal axis represents the actual compressive strength data obtained through literature review and experimental testing. This figure enables a direct visual comparison of the CNN model’s predictions on the training and testing sets.
The data points in the graph are primarily clustered around the diagonal line, indicating a strong alignment between the model’s predictions and the observed results. This clustering pattern suggests a high degree of concordance between the predicted and actual compressive strength values. The model demonstrates notable accuracy in forecasting compressive strength for pervious concrete, as evidenced by the proximity of the data points to the diagonal line. This visual analysis underscores the CNN model’s ability to provide accurate predictions for compressive strength.

3.2. Improvements in CNN Model Training

3.2.1. Enhancements for Improved Robustness of the Model

Figure 4 illustrates the favorable predictive performance of the CNN model trained in this study for various types of pervious concrete. However, there is a lack of training data in the range of 10 to 20 MPa, which could lead to inadequacies in the model’s predictions for the compressive strength of pervious concrete within this range. To enhance the robustness of the model, ensuring that subtle variations in the material composition of pervious concrete do not significantly impact the prediction results, experimental data on the measured 28-day compressive strength in the range of 10 to 20 MPa will be added. This additional data aims to augment the training set of the CNN predictive model, improving its applicability to different types of pervious concrete.

3.2.2. Method for Enhancing Model Robustness

(1)
Experimental Materials
This study employed various materials for the pervious concrete experiments, including Ordinary Portland Cement (OPC) of grade 42.5. The OPC has a standard consistency of 27.1%, a specific surface area of 357 m2/kg, an initial setting time of 203 min, and a final setting time of 250 min. For coarse aggregates, 5–20 mm aggregates supplied by the Jinying Hardware Business Department in Jiangning District, Nanjing, were chosen. These aggregates exhibit an apparent density of 3.0149 g/cm3, a bulk density of 3.0045 g/cm3, a compacted bulk density of 2.9246 g/cm3, and a crushing value of 3.04%.
Additionally, low-calcium Class I fly ash produced by the Nanjing Thermal Power Plant was employed, featuring a density of 2.04 g/cm3, a water demand ratio of 0.95, and fineness (remaining on the 45 μm sieve) of 6%. To enhance concrete performance, a high-performance polycarboxylate superplasticizer from Wuhan Greelan Building Material Technology Co., Ltd., located in Wuhan City, Hubei Province, China, was introduced. This superplasticizer, in powder form with a gray-white appearance, has a bulk density ranging from 350 to 450 kg/m3 and achieves a 25% to 30% reduction in mortar water content. The water used in concrete mixing adhered to the standards outlined in JGJ63-2006 for concrete water usage [55].
(2)
Experimental Procedure
In this study, twelve sets of pervious concrete were prepared with different mix proportions, and their specific compositions are detailed in Table 3. The pervious concrete was fabricated using the slurry coating method, following a specific procedure: Initially, the coarse aggregates were mixed with approximately 3% water for 30 s in a mixer to ensure thorough pre-wetting of the aggregate surfaces, enhancing their adhesion to cement. Subsequently, 100% cement, water, and corresponding additives were added, and the mixture was stirred for 180 s to form a highly flowable slurry, significantly reducing friction between the aggregates. This process effectively prevented the crushing of the coarse aggregates when their resistance exceeded acceptable limits while facilitating uniform coating of the aggregate surfaces by the slurry, promoting the formation of a spherical structure and enhancing the porosity of the pervious concrete. The freshly mixed concrete was then poured into cubic molds measuring 100 × 100 × 100 mm3 and compacted by vibration. After being left to stand for 24 h, the specimens were demolded and placed in a standard curing chamber. After 28 days, compressive strength tests were conducted on the specimens according to the “Standard for Test Method of Mechanical Properties of Ordinary Concrete” (GB/T 50081-2002) [56]. The porosity and compressive strength test results of the pervious concrete specimens are listed in Table 4. Since the pervious concrete specimens were prepared to supplement the data gap in the 10–20 MPa range, the compressive strength test results showed relatively close values, with a standard deviation of approximately 4.63 MPa.

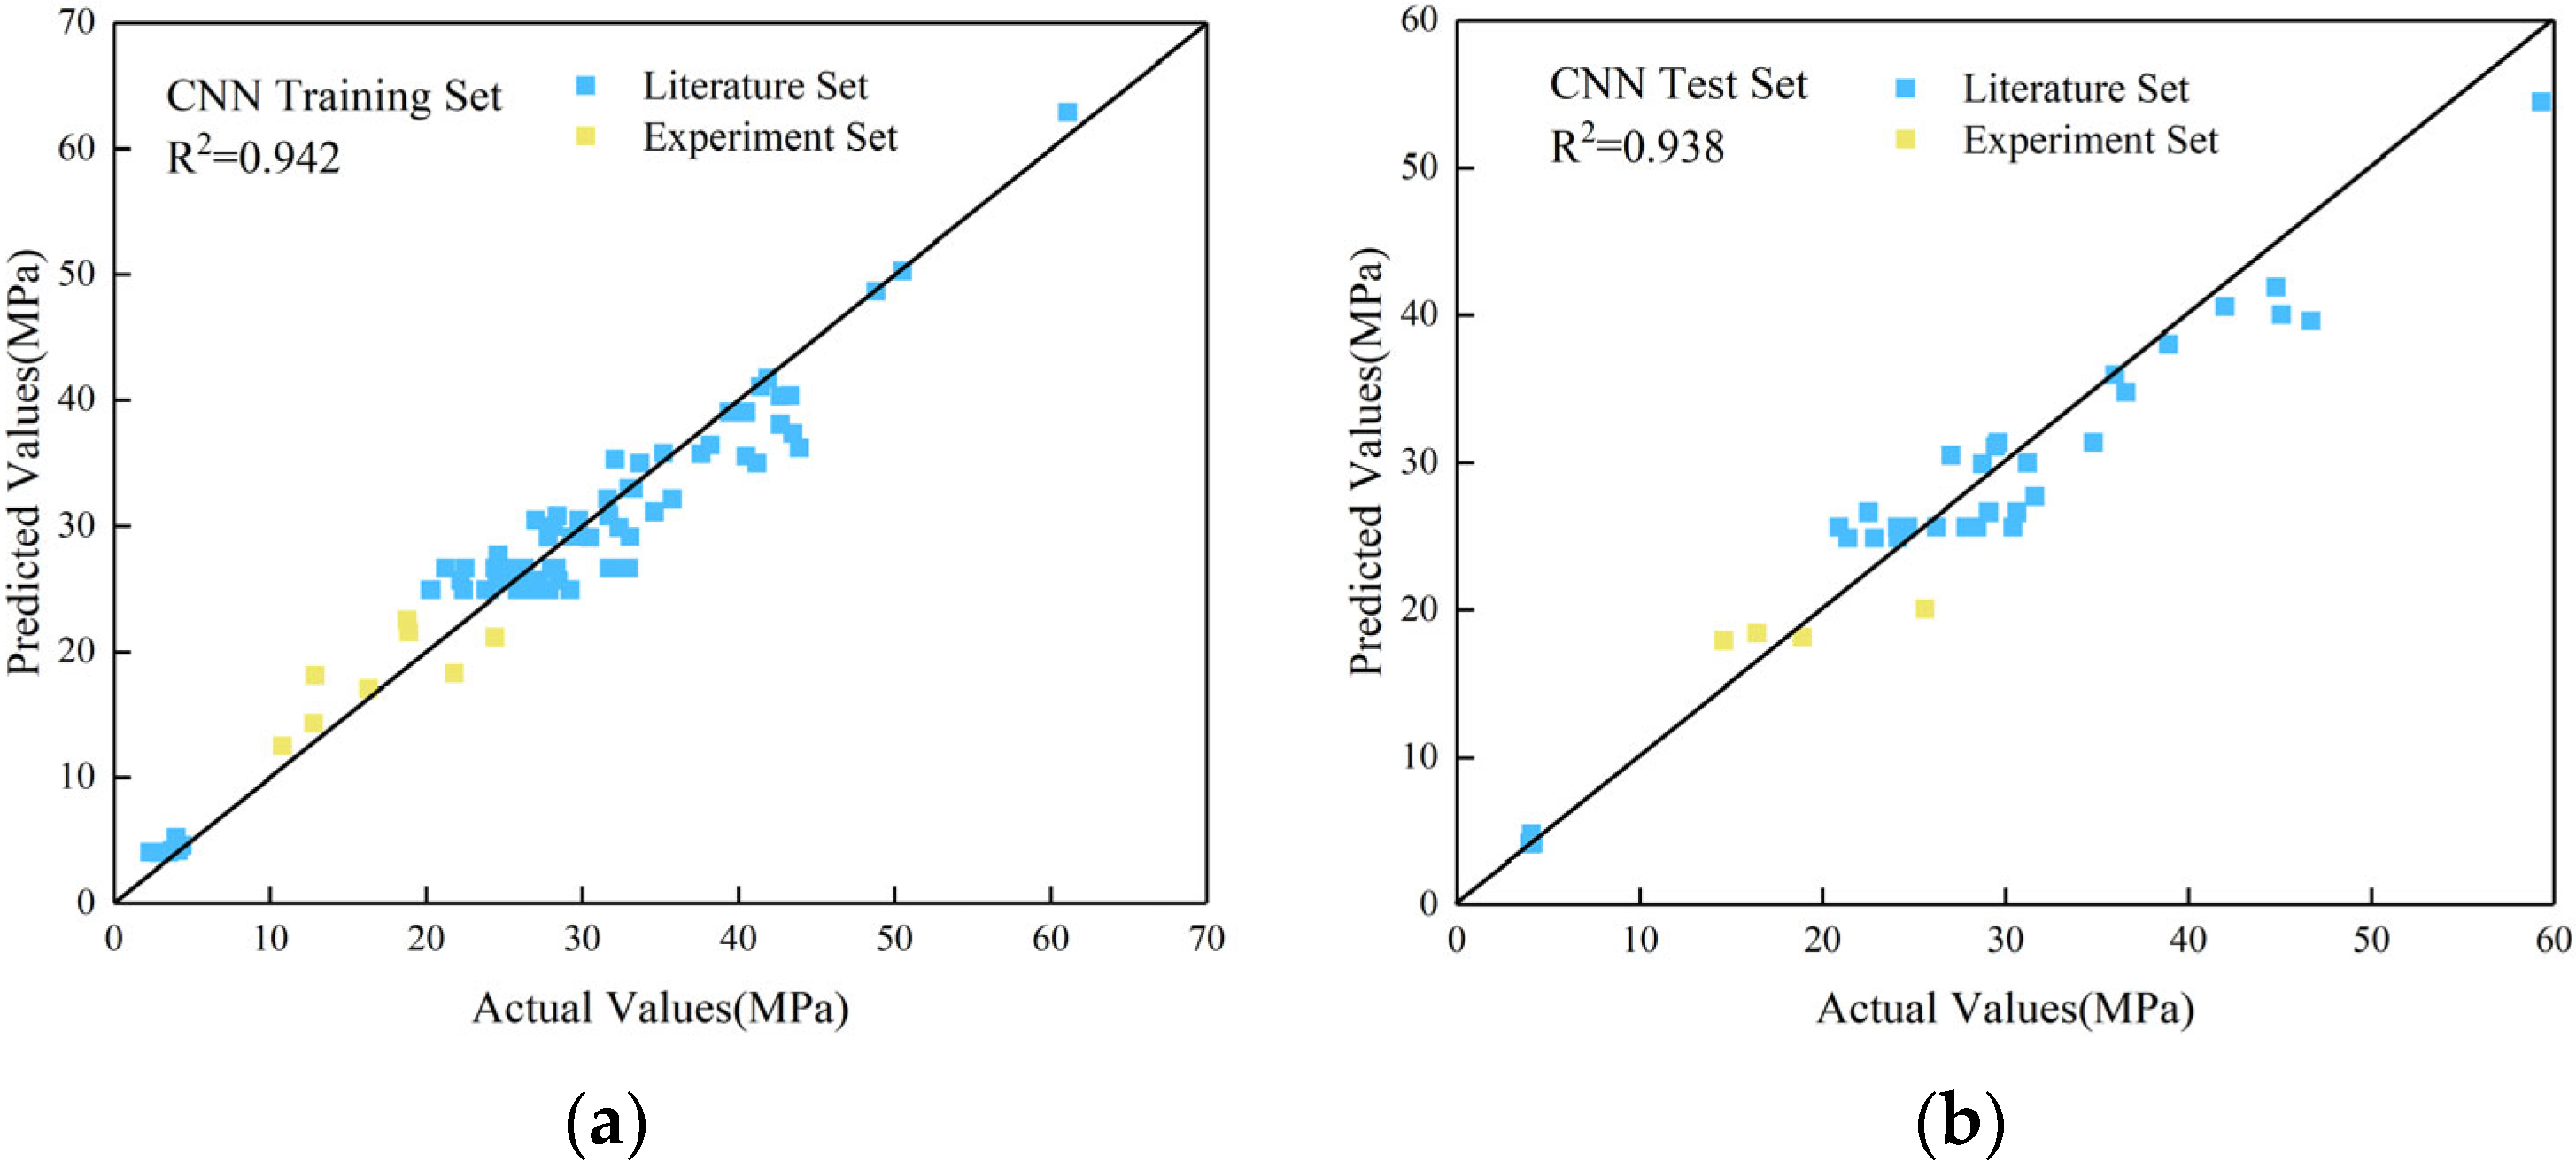
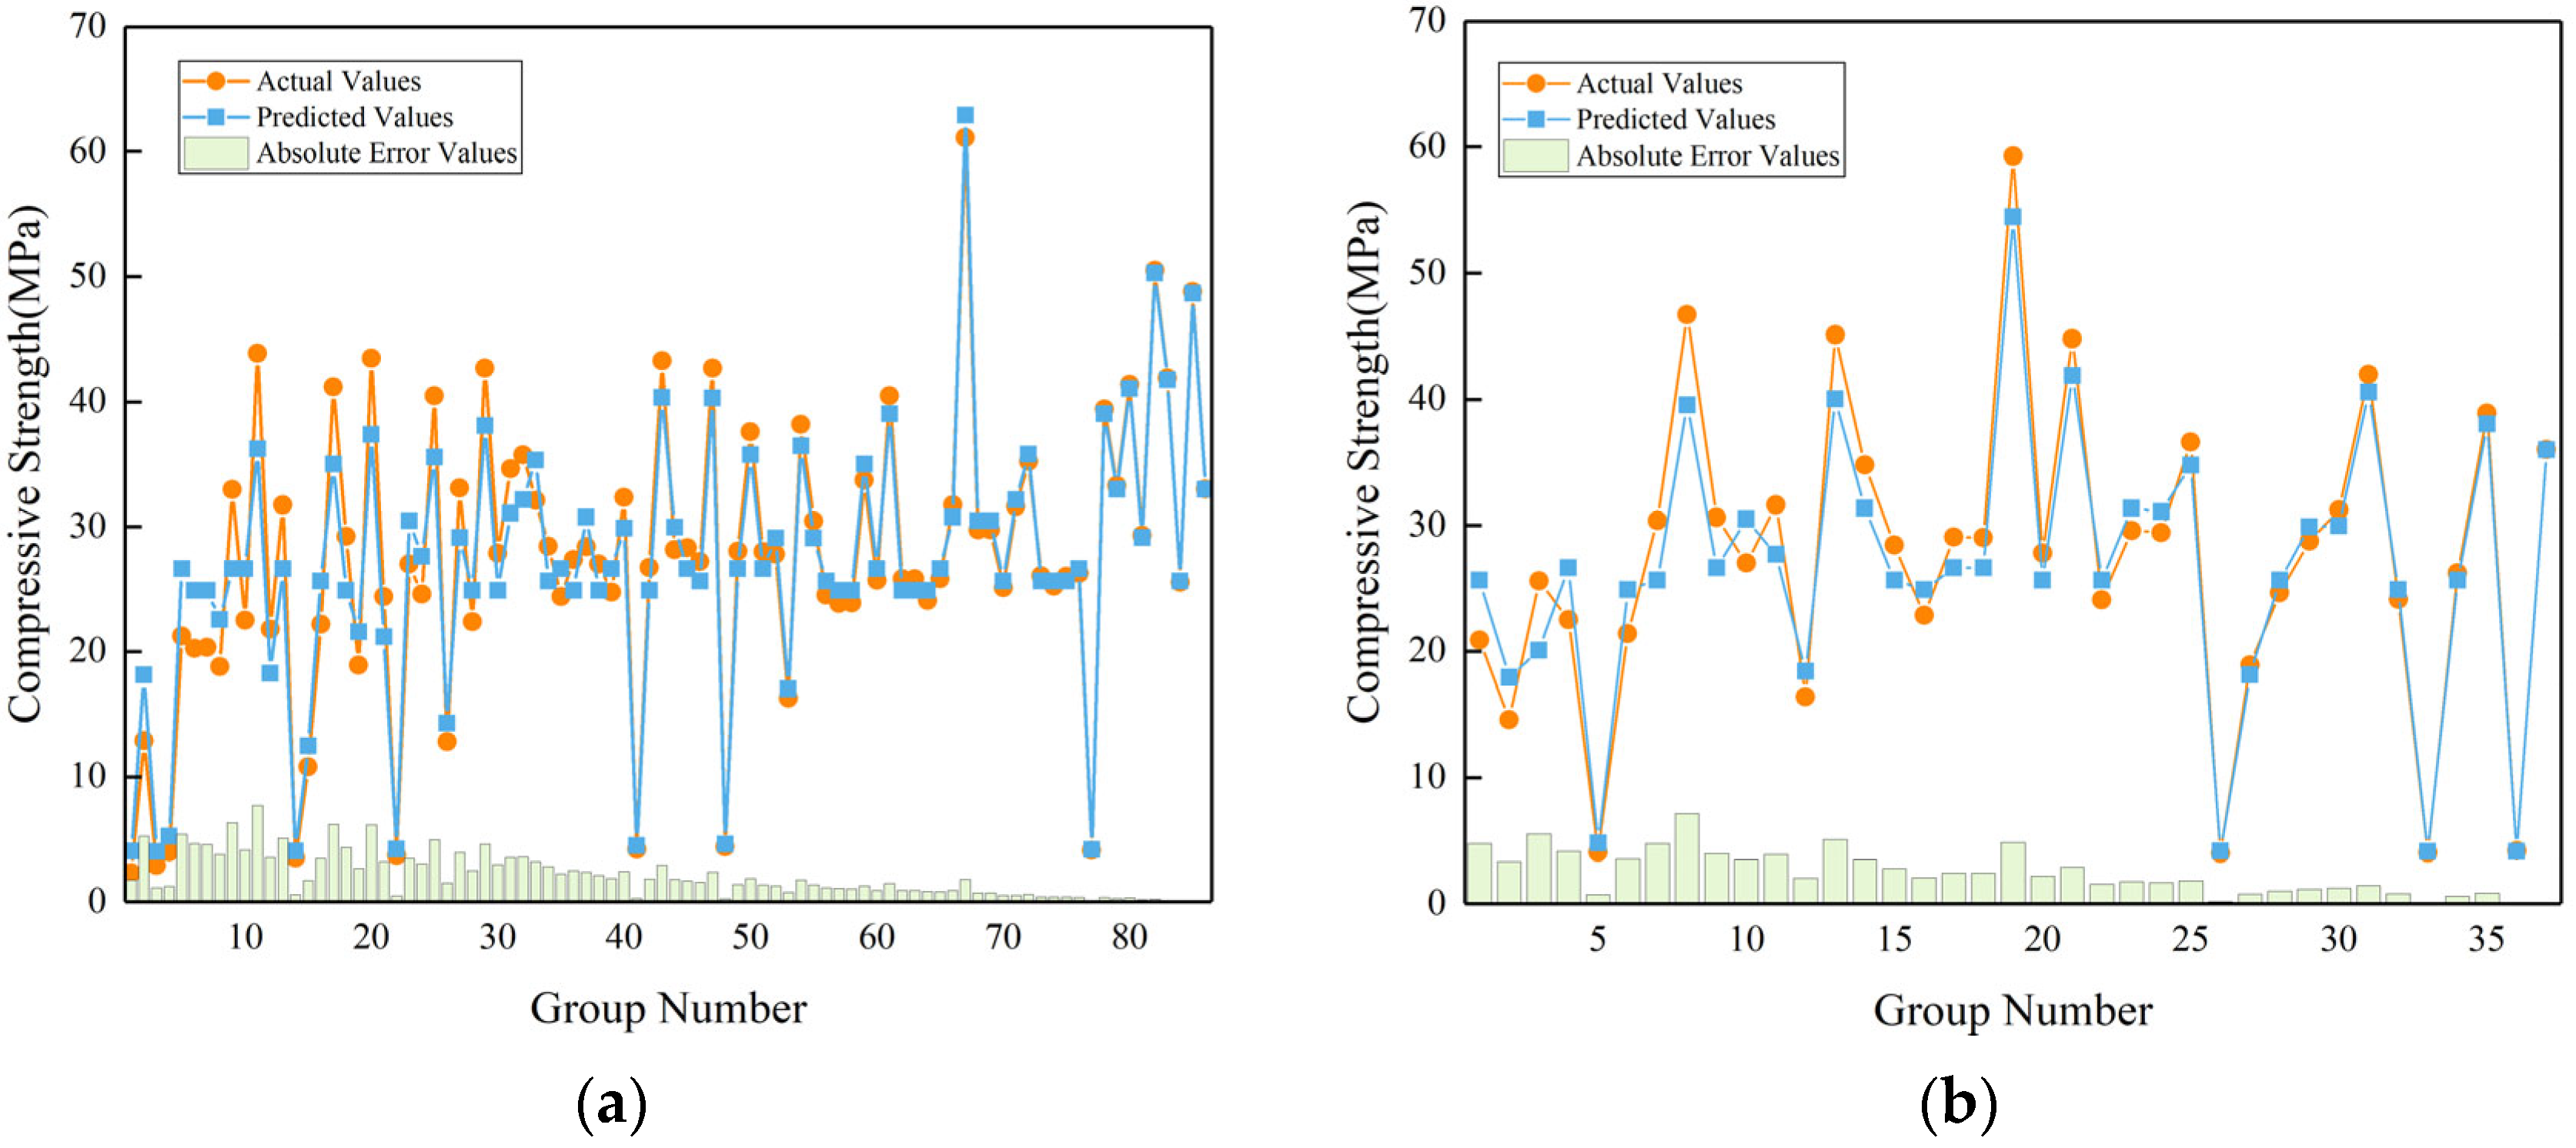
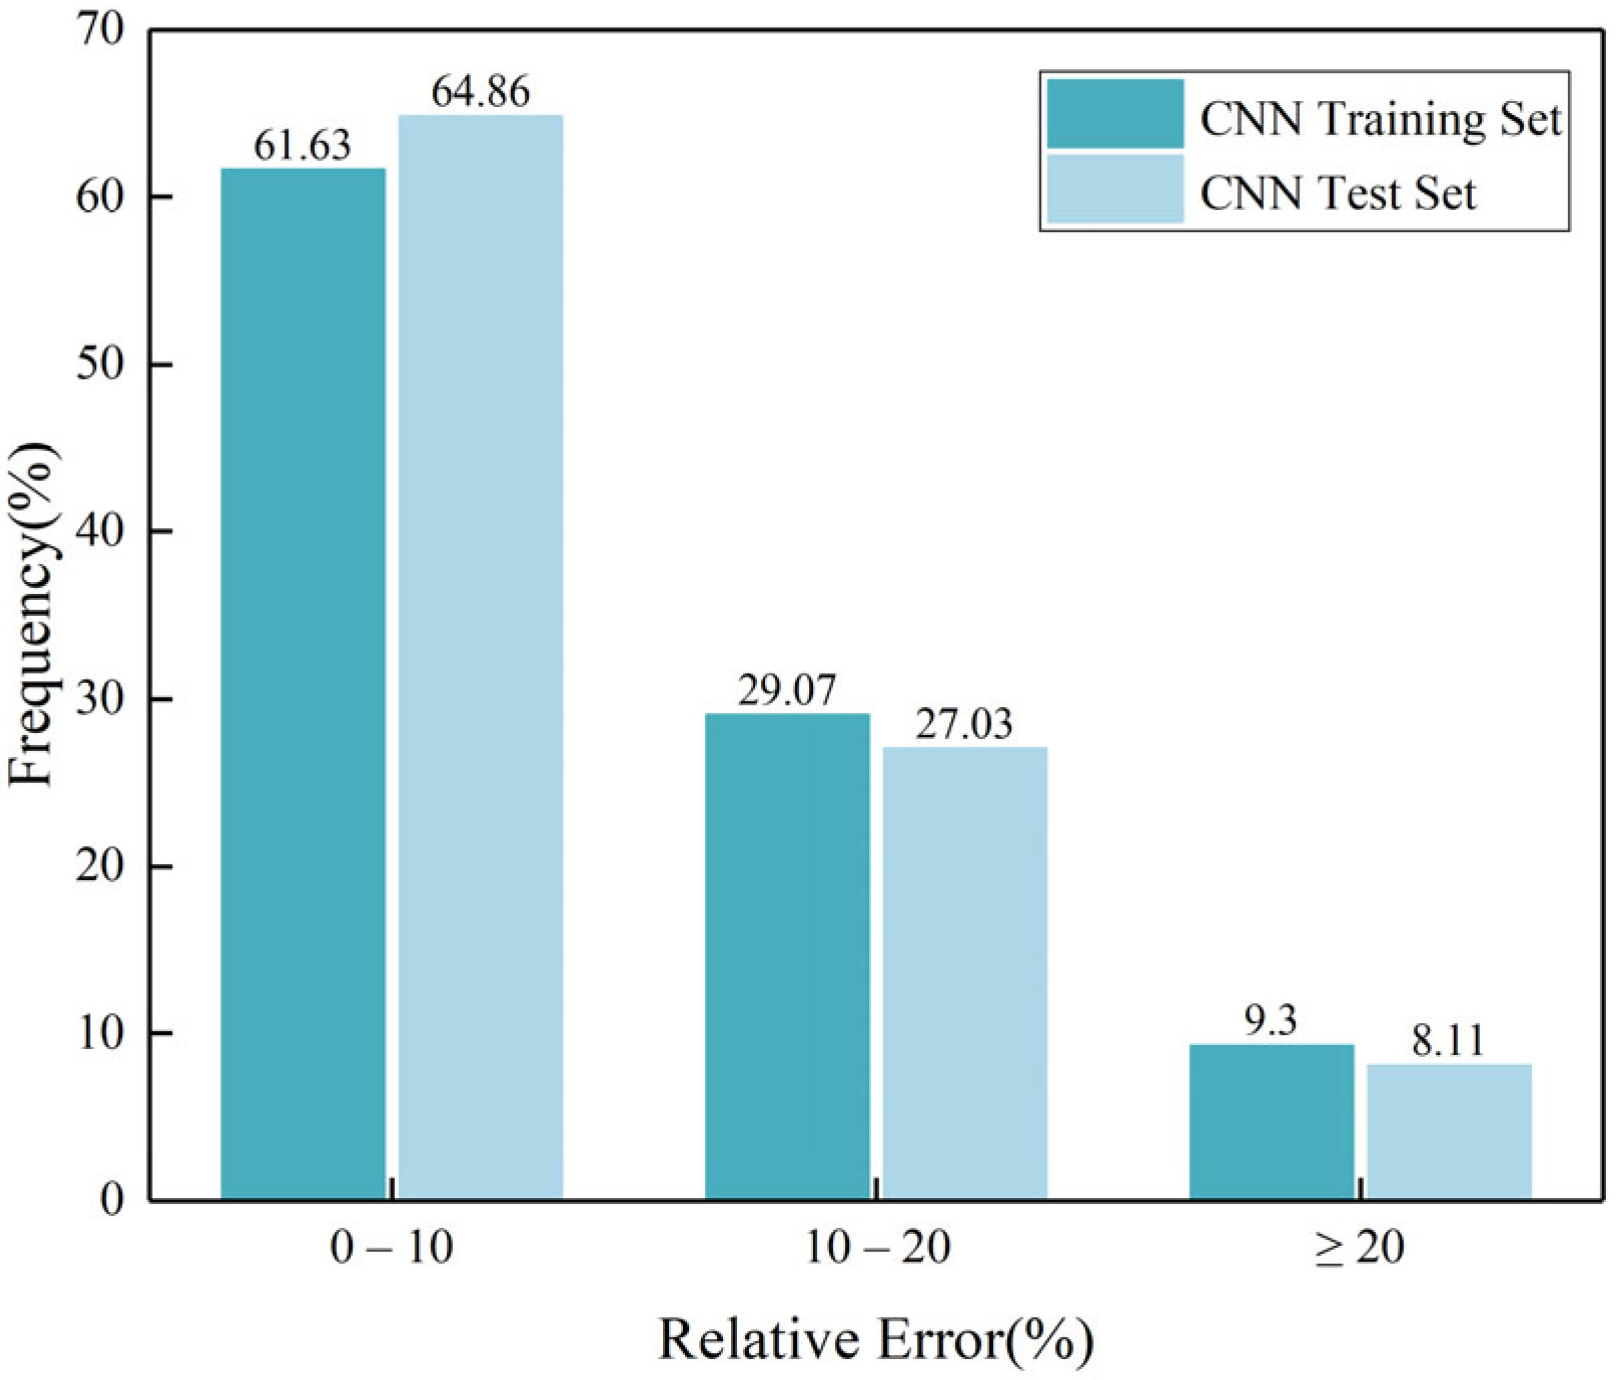
3.2.3. Predictive Performance after Model Training Enhancement

To visually showcase the predictive performance of the CNN developed in this study for estimating the compressive strength of pervious concrete with different material compositions, actual data from various sources were compared with their corresponding predicted values generated by the model. The comprehensive predictive performance is illustrated in Figure 5. Notably, the additional data incorporated in this study successfully addressed the data gap within the 10~20 MPa range. Following the retraining process, the CNN model demonstrated favorable predictive accuracy across all sample data, with data points clustered closely around the diagonal line.
After incorporating additional training data, the prediction performance of the CNN model on both the training and test sets is illustrated in Figure 6. It is evident that the model’s predicted values closely match the actual values in both the test and training sets, with minimal absolute errors. This observation signifies that the model, retrained with the inclusion of new data, showcases excellent predictive capabilities without encountering underfitting or overfitting issues. The model consistently achieves high accuracy in predicting the 28-day compressive strength of diverse types of pervious concrete.
To comprehensively demonstrate the predictive performance of the model, this paper employs the following metrics to further evaluate the prediction performance of the CNN model. The coefficient of determination R2, characterizing the prediction effect, is calculated by the Formula (11). The coefficient of determination is a commonly used evaluation index for assessing the prediction and fitting effects of the model. According to its definition, the value of R2 falls between [0, 1], with a value closer to 1 indicating that the model’s predicted values are closer to the actual values.
R 2 = 1 i = 1 N ( P r e d i c t e d i A c t u a l i ) 2 i = 1 N ( A c t u a l i A c t u a l ¯ ) 2
In Formula (11), Predictedi represents the predicted strength of the i-th sample in the model, Actuali represents the measured strength of the i-th sample, and A c t u a l ¯ denotes the average measured strength of all samples.
In addition to the coefficient of determination, this paper assesses the predictive performance of the CNN model on pervious concrete using Root Mean Square Error, Mean Absolute Percentage Error (MAPE), and Mean Absolute Error (MAE). Formulas (12)–(14) present the expressions for these indicators, and Table 5 provides the values of these evaluation metrics in a single model training experiment.
M A P E = 1 N i = 1 N | A c t u a l i P r e d i c t e d i A c t u a l i | × 100 %
R M S E = 1 N i = 1 N ( A c t u a l i P r e d i c t e d i ) 2
M A E = 1 N i = 1 N | A c t u a l i P r e d i c t e d i |
In addition to the aforementioned indicators, this paper also visually presents the distribution of relative errors between predicted and actual values in both the training and test sets through histograms, as illustrated in Figure 7. According to the calculations, the minimum relative error in the training set can reach 0.03%, and in the test set, it can reach 0.08%. Moreover, in the training set, over 60% of the relative errors are less than 10%, and in the test set, a similar proportion of over 60% of the relative errors fall below 10%. The percentage of relative errors exceeding 20% is only 9.30% in the training set and 8.11% in the test set. These findings indicate the CNN model’s ability to provide reliable and accurate estimates of compressive strength for pervious concrete with varying material compositions.

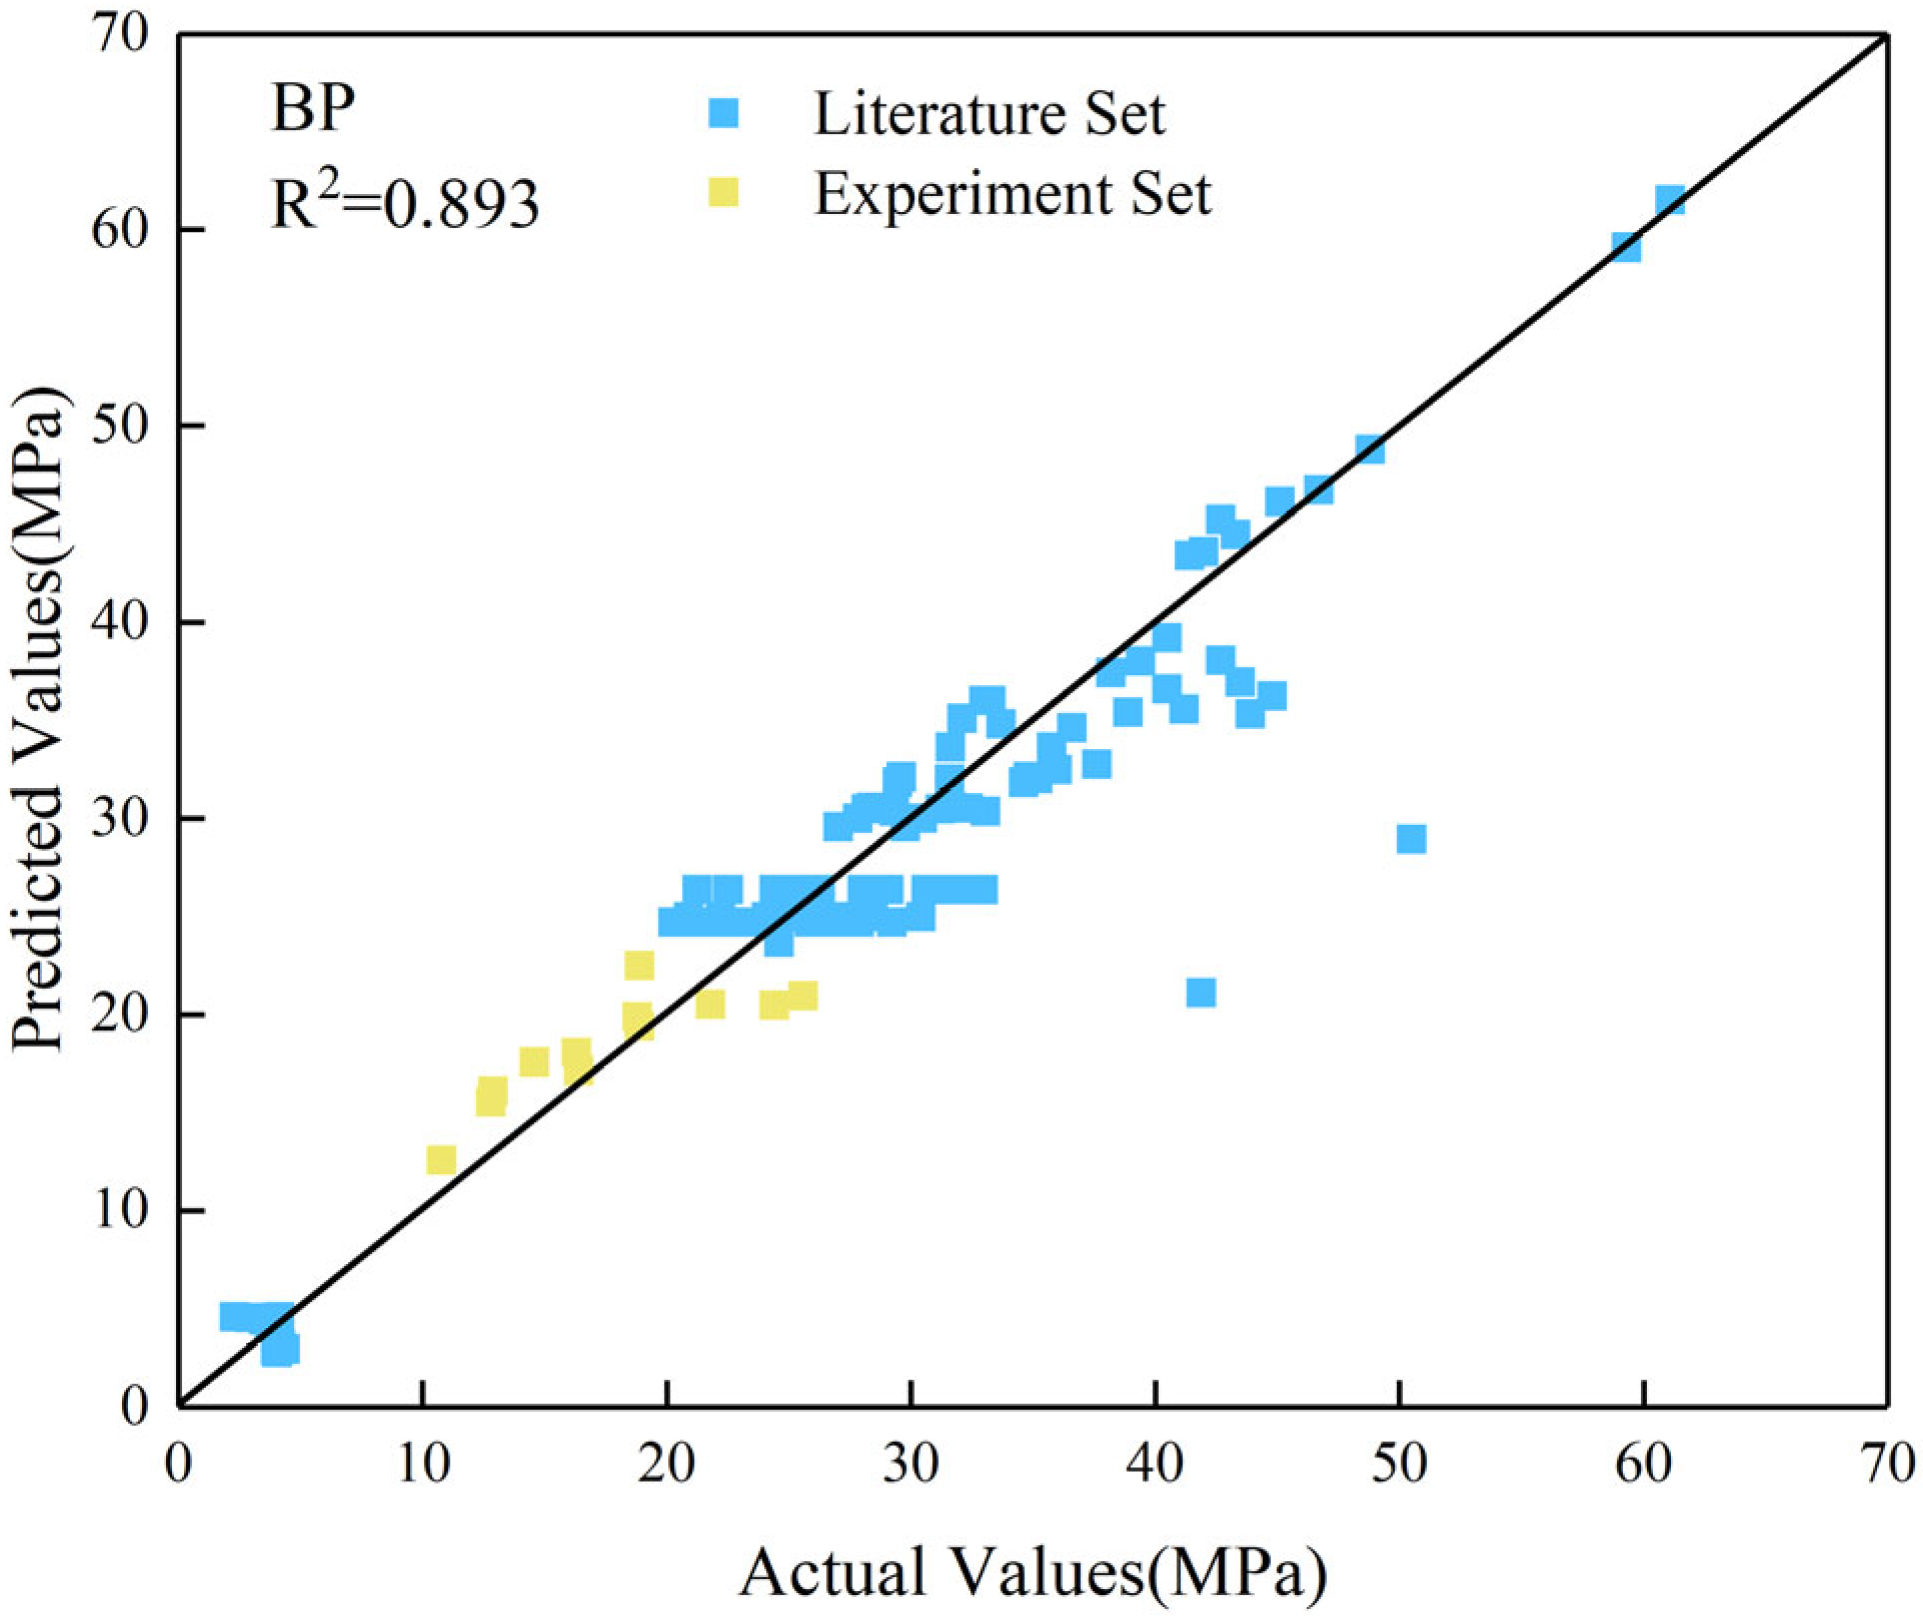
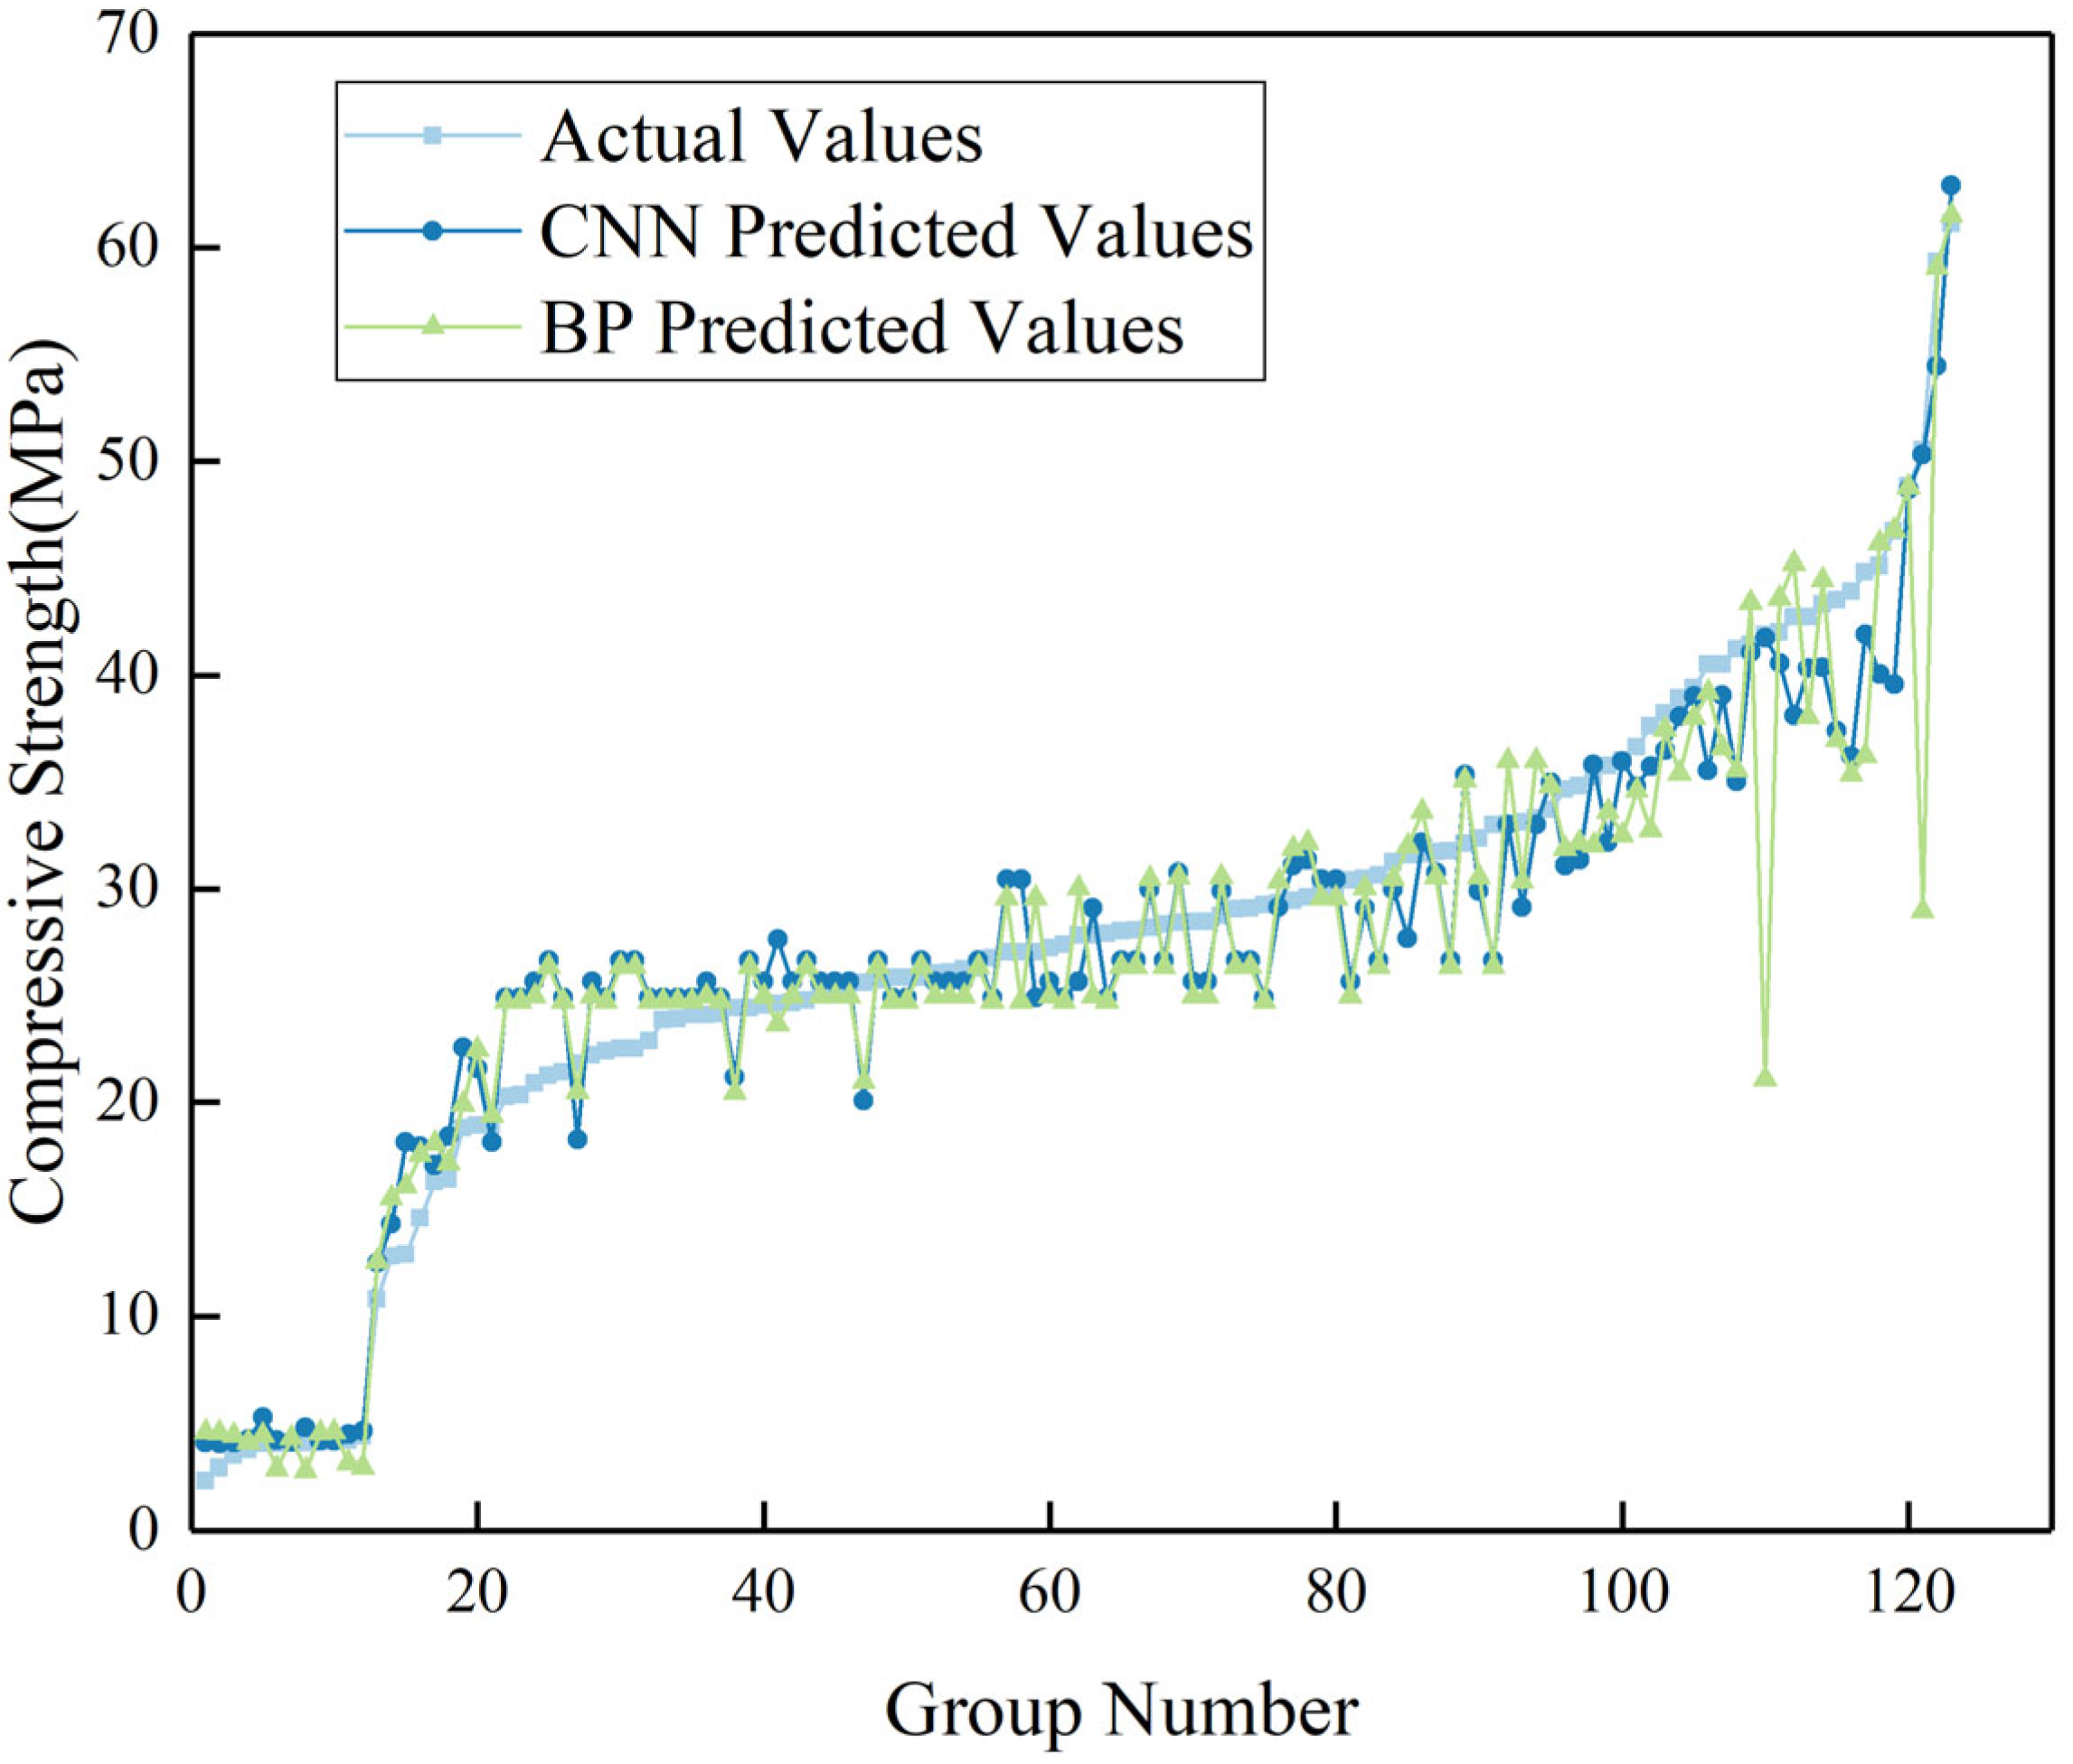
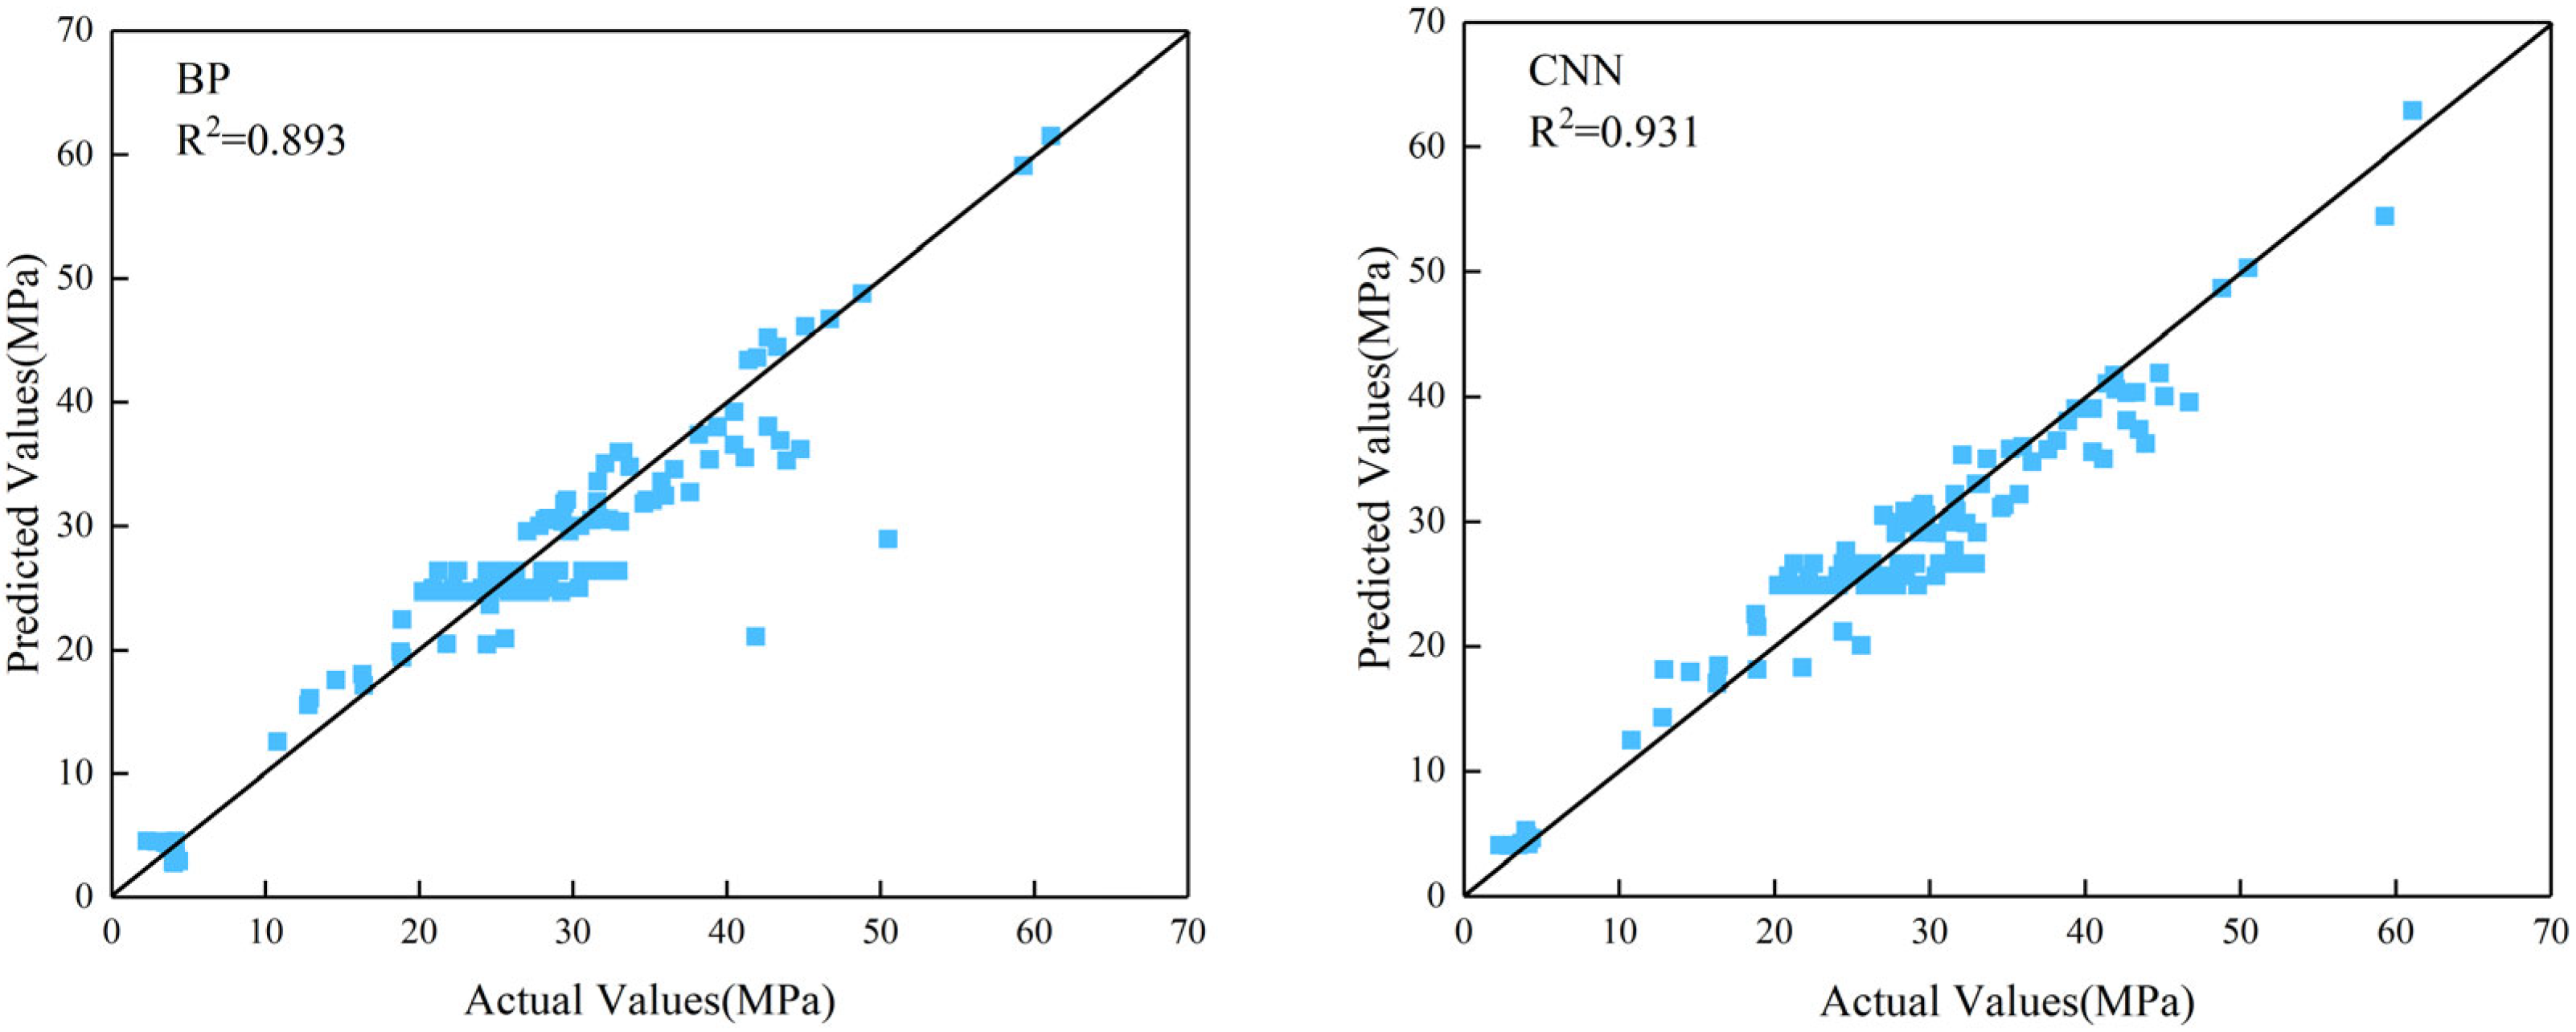
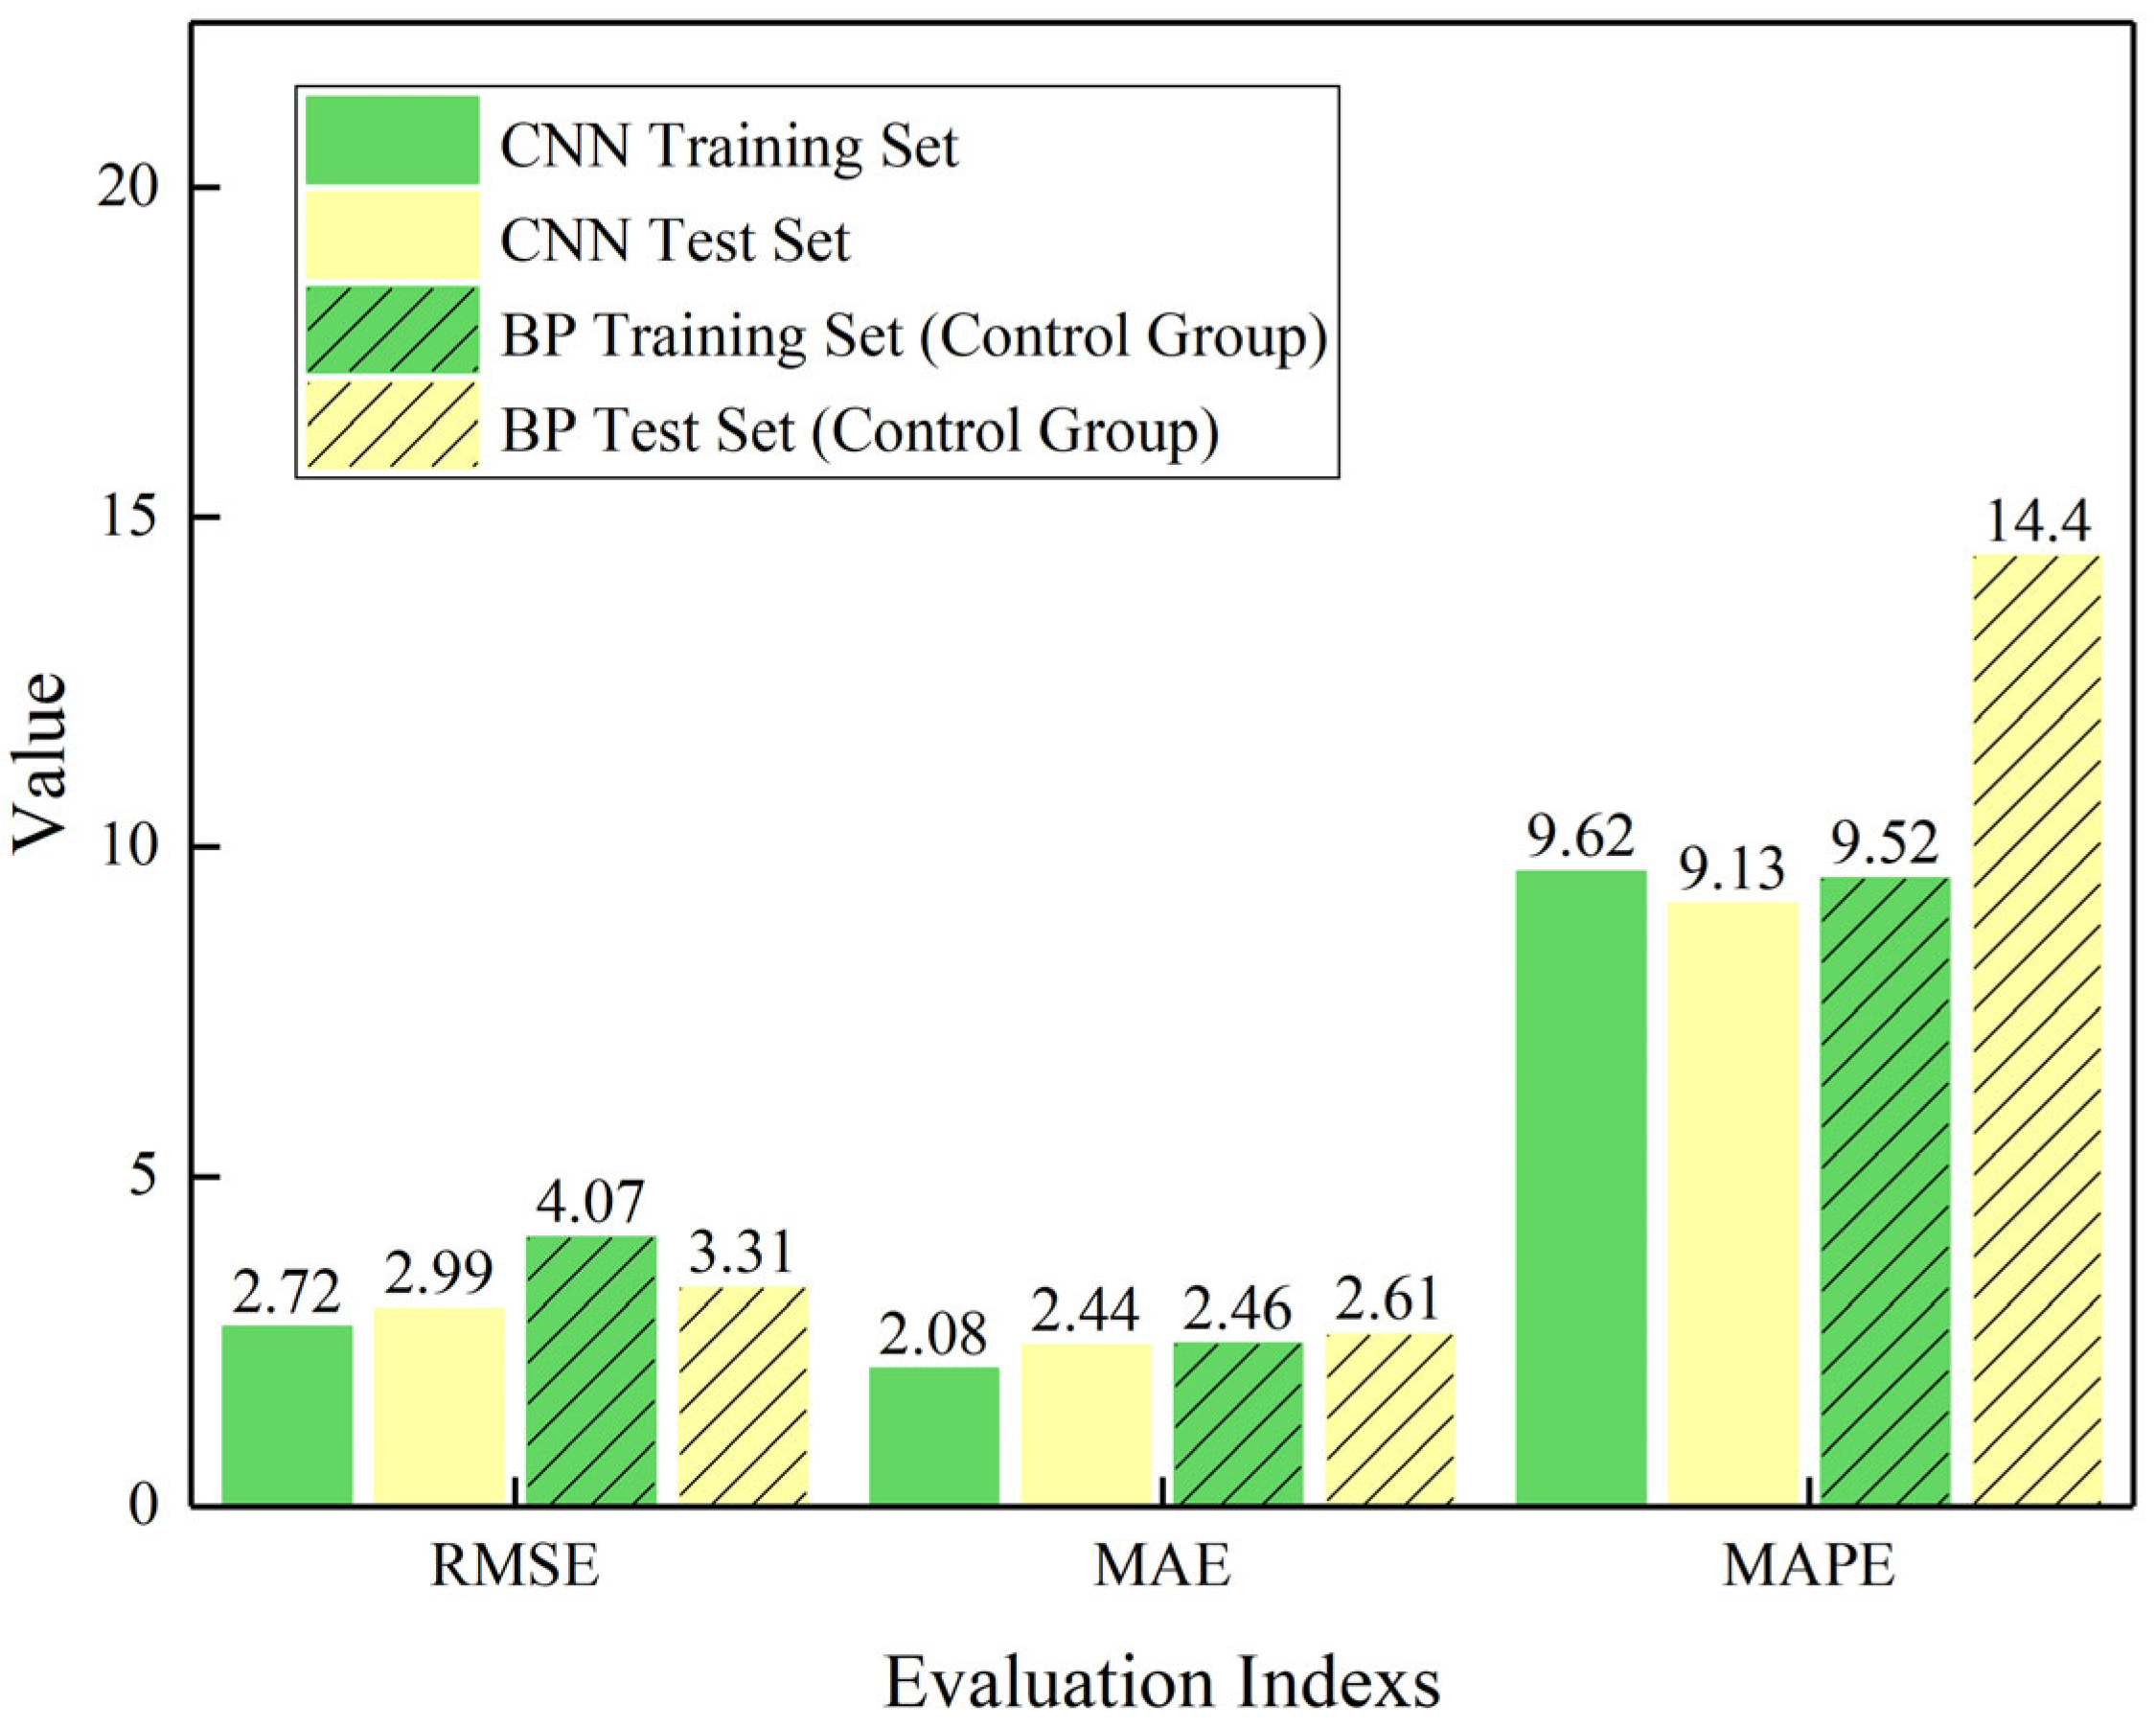
3.3. Comparative Analysis between CNN and Other Prediction Methods

To further highlight the superiority of CNN, this study conducted a comparative analysis of the predictive performance between CNN and another widely used machine learning model, the BP Neural Network. Both models were trained and tested using the same dataset. Figure 8 visually illustrates the predictive capabilities of the BP Neural Network regarding the compressive strength of pervious concrete from various sources. It is evident that the data points are generally distributed in proximity to the diagonal line, with some points exhibiting a certain distance from the diagonal but lacking clear outliers. This observation suggests that the BP Neural Network also demonstrates acceptable predictive performance for the 28-day compressive strength of pervious concrete with diverse material compositions.
To visually compare the efficacy of CNN and the BP neural network in predicting pervious concrete compressive strength, this paper generated a comparative graph illustrating their predicted values against the actual values. Figure 9 provides an intuitive representation of the variance in predictive performance between the BP neural network model and CNN for the 28-day compressive strength of pervious concrete. Notably, both CNN and BP’s predicted values exhibit clustering around the actual values. However, the predicted values of the CNN model are in closer proximity to the real values, visually indicating superior predictive performance. This visual analysis underscores that the CNN model offers greater accuracy and reliability in predicting the compressive strength of pervious concrete compared to the BP neural network.
To provide a more explicit comparison of the predictive capabilities for the 28-day compressive strength of pervious concrete between the CNN and BP models, this study contrasts the predicted values of CNN and BP with the actual values individually, as depicted in Figure 10. The results in the figure clearly demonstrate that both BP and CNN exhibit satisfactory predictive performance across the entire dataset. However, the data points in the CNN model are more densely clustered around the diagonal, indicating closer proximity between CNN predictions and the measured compressive strength. Additionally, the overall R2 for the sample predictions in the CNN model is 0.931, while for the BP neural network, it is 0.893. This implies that the overall predictive performance of CNN surpasses that of the BP neural network.
To comprehensively compare the predictive performance of CNN and BP, this study evaluated the RMSE, MAE, and MAPE metrics between the two models. Figure 11 illustrates the comparative results of CNN and BP based on these metrics. The findings reveal that CNN exhibits smaller RMSE, MAE, and MAPE in comparison to BP, indicating that the average differences between predicted values and actual values are reduced in the CNN model. Moreover, the MAPE for the BP test set is 14.40%, surpassing the desirable threshold of 10%. This suggests that while the BP neural network demonstrates reasonable predictive performance for most pervious concrete samples, it may exhibit notable deviations from actual values for specific mix ratios, presenting challenges in practical applications. In contrast, CNN demonstrates smaller error metrics, with all MAPE values falling below the 10% threshold, signifying that its predictive performance is within an optimal range. Therefore, CNN provides reliable predictions for the 28-day compressive strength of pervious concrete with various material compositions.

4. Conclusions

This paper introduces a CNN model designed for predicting the 28-day compressive strength of pervious concrete, utilizing eight mix proportion parameters as input variables. The model undergoes training and testing on a dataset comprising 123 samples from literature and experiments. The key findings of this study are as follows:
(I)
The proposed CNN model showcased remarkable accuracy. Through multiple experiments, the CNN model achieved an R2 of 0.938 and a MAPE of 9.13% on the test set, indicating acceptable prediction errors and robust model stability. This underscores the CNN model’s capability to precisely predict the 28-day compressive strength of pervious concrete, making it adaptable to diverse material compositions.
(II)
The predictive model presented in this paper demonstrates enhanced stability and outperforms traditional methods. In comparison to the BP neural network trained and tested on the same dataset, the CNN model exhibits considerably lower prediction error metrics (RMSE, MAE, and MAPE) and notably higher R2, signifying superior predictive performance and stability compared to traditional approaches.
(III)
This study supplemented the model training with experimental data encompassing the compressive strength range of 10–20 MPa for pervious concrete, ensuring coverage of the common compressive strength spectrum of pervious concrete. The test set results indicate that the model data augmented with experimental data performs well in predicting data obtained from different literature sources as well as data acquired through experiments.
The results of this study enable the prediction of the 28-day compressive strength of various types of pervious concrete using existing pervious concrete preparation experience, better meeting the needs of practical construction. However, due to the limited nature of the dataset, factors such as aggregate size, type, cement grade, curing conditions, etc., were not included as input parameters. The diversity of pervious concrete types may result in suboptimal performance of the predictive model constructed in this study. Therefore, in future work, to build CNN predictive models more suitable for different materials, it is essential to fully utilize existing experimental data, incorporate material information and preparation conditions of pervious concrete into the model’s input parameters, and collect sufficient data to ensure model convergence. Additionally, with the increase in input parameter variables and the significant expansion of the dataset, determining specific values for hyperparameters such as learning rate and learning rate decay factor will become a complex issue. It will be necessary to develop appropriate algorithms to partition a portion of the overall dataset for estimating these hyperparameter values, enabling the model to converge more quickly and thereby improve prediction accuracy and applicability.

Author Contributions

Conceptualization, G.Y., S.Z. and Z.X.; methodology, G.Y. and Z.X.; software, G.Y. and S.Z.; validation, G.Y., S.Z. and Z.X.; formal analysis, G.Y. and S.Z.; investigation, G.Y. and Z.X.; resources, S.Z. and Z.X.; data curation, G.Y.; writing—original draft preparation, G.Y.; writing—review and editing, S.Z. and Z.X.; visualization, G.Y.; supervision, S.Z. and Z.X.; project administration, S.Z. and Z.X.; funding acquisition, S.Z. and Z.X. All authors have read and agreed to the published version of the manuscript.

Funding

This research was funded by the National Statistical Science Research Project of China, grant numbers 2021LY099, and the funding body did not play any role in the execution of the research work.

Data Availability Statement

The raw data supporting the conclusions of this article will be made available by the authors on request.

Conflicts of Interest

The authors declare no conflicts of interest.

References

  1. Seeni, B.S.; Madasamy, M. Factors influencing performance of pervious concrete. Gradevinar 2021, 73, 1017–1030. [Google Scholar]
  2. AlShareedah, O.; Nassiri, S. Pervious concrete mixture optimization, physical, and mechanical properties and pavement design: A review. J. Clean. Prod. 2021, 288, 125095. [Google Scholar] [CrossRef]
  3. Zeng, Q.; Jike, N.; Xu, C.J.; Yang, R.J.; Peng, Y.; Wang, J.Y.; Gong, F.Y.; Zhang, M.Z.; Zhao, Y.X. Total recycling of low-quality urban-fringe construction and demolition waste towards the development of sustainable cement-free pervious concrete: The proof of concept. J. Clean. Prod. 2022, 352, 131464. [Google Scholar] [CrossRef]
  4. Wang, H.; Chen, X. Life-cycle assessment and multi-criteria performance evaluation of pervious concrete pavement with fly ash. Resour. Conserv. Recycl. 2022, 177, 105969. [Google Scholar]
  5. Kim, T.; Jang, H.; Kim, C.S.; Kim, J.; Rafieizonooz, M.; Khankhaje, E. Properties of pervious concrete incorporating fly ash as partial replacement of cement: A review. Dev. Built Environ. 2023, 14, 100130. [Google Scholar]
  6. Kapoor, K.; Singh, S.P.; Nazeer, M. Strength, durability and microstructural investigations on pervious concrete made with fly ash and silica fume as supplementary cementitious materials. J. Build. Eng. 2023, 69, 106275. [Google Scholar]
  7. Tang, B.; Sun, X.; He, X.; Yuan, L.; Fan, M. Experimental study on the water purification performance of carbonated recycled aggregate pervious concrete. Constr. Build. Mater. 2023, 406, 133392. [Google Scholar]
  8. Sheng, J.; Li, W.; Yu, M.; Zheng, X.; Wang, F.; Li, Y. Effect of a novel spherical tailings aggregate on the macro- and mesoscopic properties of pervious concrete. Cem. Concr. Compos. 2023, 144, 105311. [Google Scholar]
  9. Fan, M.; Yang, Z.; Sun, Y.; Yuan, L.; Tang, B. A comparison study of aggregate carbonation and concrete carbonation for the enhancement of recycled aggregate pervious concrete. Constr. Build. Mater. 2023, 371, 130797. [Google Scholar]
  10. Qin, Y.; Pang, X.; Tan, K.; Bao, T. Evaluation of pervious concrete performance with pulverized biochar as cement replacement. Cem. Concr. Compos. 2021, 119, 104022. [Google Scholar] [CrossRef]
  11. Fei, M.; Luo, C.; Zheng, X.; Fu, T.; Ling, K.; Chen, H.; Liu, W.; Qiu, R. High-performance pervious concrete using cost-effective modified vinyl ester as binder. Constr. Build. Mater. 2024, 414, 134908. [Google Scholar] [CrossRef]
  12. Singh, A.; Charak, A.; Biligiri, K.P.; Pandurangan, V. Glass and carbon fiber reinforced polymer composite wastes in pervious concrete: Material characterization and lifecycle assessment. Resour. Conserv. Recycl. 2022, 182, 106304. [Google Scholar] [CrossRef]
  13. Hari, R.; Mini, K.M. Mechanical and durability properties of basalt-steel wool hybrid fibre reinforced pervious concrete—A Box Behnken approach. J. Build. Eng. 2023, 70, 106307. [Google Scholar] [CrossRef]
  14. Ozel, B.F.; Sakallı, Ş.; Şahin, Y. The effects of aggregate and fiber characteristics on the properties of pervious concrete. Constr. Build. Mater. 2022, 356, 129294. [Google Scholar] [CrossRef]
  15. Chen, X.; Yang, Y.; Zhang, H.; Du, X.; Chen, L.; Zhao, Q.; Li, B. Brick-concrete recycled aggregate/powder synergistic preparation of pervious concrete. Constr. Build. Mater. 2023, 407, 133517. [Google Scholar] [CrossRef]
  16. Supit, S.; Priyono, W.M. Utilization of recycled PET plastic waste as replacement of coarse aggregate in pervious concrete. Mater. Today Proc. 2022, 66, 2990–2995. [Google Scholar] [CrossRef]
  17. Song, H.; Yao, J.; Xiang, J. The role of aggregate and cement paste in the deterioration of the transitional interface zone of pervious concrete during freeze-thaw cycles. Case Stud. Constr. Mater. 2022, 16, e01086. [Google Scholar] [CrossRef]
  18. Arun, A.; Chekravarty, D. Strength improvement techniques on pervious concrete. Mater. Today Proc. 2022, 52, 1979–1985. [Google Scholar] [CrossRef]
  19. Cai, J.; Chen, J.G.; Shi, J.; Tian, Q.; Xu, G.; Du, Y. A novel approach to evaluate the clogging resistance of pervious concrete. Case Stud. Constr. Mater. 2022, 16, e00864. [Google Scholar] [CrossRef]
  20. Brasileiro, K.P.T.V.; de Oliveira Nahime, B.; Lima, E.C.; Alves, M.M.; Ferreira, W.P.; dos Santos, I.S.; Bezerra Filho, C.P.; dos Reis, I.C. Influence of recycled aggregates and silica fume on the performance of pervious concrete. J. Build. Eng. 2024, 82, 108347. [Google Scholar] [CrossRef]
  21. Zheng, X.; Pan, J.; Easa, S.; Fu, T.; Liu, H.; Liu, W.; Qiu, R. Utilization of copper slag waste in alkali-activated metakaolin pervious concrete. J. Build. Eng. 2023, 76, 107246. [Google Scholar] [CrossRef]
  22. Adresi, M.; Yamani, A.; Tabarestani, M.K.; Rooholamini, H. A comprehensive review on pervious concrete. Constr. Build. Mater. 2023, 407, 133308. [Google Scholar] [CrossRef]
  23. Zhu, Y.; Fu, H.; Wang, P.; Xu, P.; Ling, Z.; Wei, D. Pore structure characteristics, mechanical properties, and freeze–thaw resistance of vegetation-pervious concrete with unsintered sludge pellets. Constr. Build. Mater. 2023, 382, 131342. [Google Scholar] [CrossRef]
  24. He, S.-S.; Jiao, C.J.; Li, S. Investigation of mechanical strength and permeability characteristics of pervious concrete mixed with coral aggregate and seawater. Constr. Build. Mater. 2023, 363, 129508. [Google Scholar] [CrossRef]
  25. Chockalingam, T.; Vijayaprabha, C.; Raj, J.L. Experimental study on size of aggregates, size and shape of specimens on strength characteristics of pervious concrete. Constr. Build. Mater. 2023, 385, 131320. [Google Scholar] [CrossRef]
  26. El-Hassan, H.; Kianmehr, P.; Tavakoli, D.; El-Mir, A.; Dehkordi, R.S. Synergic effect of recycled aggregates, waste glass, and slag on the properties of pervious concrete. Dev. Built Environ. 2023, 15, 100189. [Google Scholar] [CrossRef]
  27. Sathiparan, N.; Jeyananthan, P.; Subramaniam, D.N. Surface response regression and machine learning techniques to predict the characteristics of pervious concrete using non-destructive measurement: Ultrasonic pulse velocity and electrical resistivity. Measurement 2024, 225, 114006. [Google Scholar] [CrossRef]
  28. Berloco, F.; Bevilacqua, V.; Colucci, S. Distributed analytics for big data: A survey. Neurocomputing 2024, 574, 127258. [Google Scholar] [CrossRef]
  29. Selmy, H.A.; Mohamed, H.K.; Medhat, W. Big data analytics deep learning techniques and applications: A survey. Inf. Syst. 2024, 120, 102318. [Google Scholar] [CrossRef]
  30. Khan, A.Q.; Awan, H.A.; Rasul, M.; Siddiqi, Z.A.; Pimanmas, A. Optimized artificial neural network model for accurate prediction of compressive strength of normal and high strength concrete. Clean. Mater. 2023, 10, 100211. [Google Scholar] [CrossRef]
  31. de-Prado-Gil, J.; Martínez-García, R.; Jagadesh, P.; Juan-Valdés, A.; Gónzalez-Alonso, M.I.; Palencia, C. To determine the compressive strength of self-compacting recycled aggregate concrete using artificial neural network (ANN). Ain Shams Eng. J. 2023, 15, 102548. [Google Scholar] [CrossRef]
  32. Bingöl, A.F.; Tortum, A.; Gül, R. Neural networks analysis of compressive strength of lightweight concrete after high temperatures. Mater. Des. 2013, 52, 258–264. [Google Scholar] [CrossRef]
  33. Sui, C.; Qiao, D.; Wu, Y.; Zhu, H.; Lan, H.; Yang, W.; Guo, Q. Study of the Effect of Retarder and Expander on the Strength and Cracking Performance of Rubber Concrete Based on Back Propagation Neural Network. Materials 2023, 16, 6976. [Google Scholar] [CrossRef] [PubMed]
  34. Wang, K.W.; Ren, J.; Yan, J.; Wu, X.; Dang, F. Research on a concrete compressive strength prediction method based on the random forest and LCSSA-improved BP neural network. J. Build. Eng. 2023, 76, 107150. [Google Scholar] [CrossRef]
  35. Li, T.; Xiao, J.; Singh, A. Strength index analysis of concrete with large size recycled aggregate based on back propagation neural network. Adv. Struct. Eng. 2022, 25, 133–145. [Google Scholar] [CrossRef]
  36. Wang, H.; Zhao, K.; Zhang, Y.; Zhang, X. Prediction of Compressive Strength of Concrete Using the Spearman and PCA-Based BP Neural Network. Wirel. Commun. Mob. Comput. 2022, 2022, 1–10. [Google Scholar] [CrossRef]
  37. AL-Bukhaiti, K.; Liu, Y.; Zhao, S.; Abas, H. An Application of BP Neural Network to the Prediction of Compressive Strength in Circular Concrete Columns Confined with CFRP. Ksce J. Civ. Eng. 2023, 27, 3006–3018. [Google Scholar] [CrossRef]
  38. Park, J.-R.; Lee, H.-J.; Yang, K.-H.; Kook, J.-K.; Kim, S. Study on Influence of Range of Data in Concrete Compressive Strength with Respect to the Accuracy of Machine Learning with Linear Regression. Appl. Sci. 2021, 11, 3866. [Google Scholar] [CrossRef]
  39. Chi, L.; Wang, M.; Liu, K.; Lu, S.; Kan, L.; Xia, X.; Huang, C. Machine learning prediction of compressive strength of concrete with resistivity modification. Mater. Today Commun. 2023, 36, 106470. [Google Scholar] [CrossRef]
  40. Huang, J.; Sabri, M.M.S.; Ulrikh, D.V.; Ahmad, M.; Alsaffar, K.A.M. Predicting the Compressive Strength of the Cement-Fly Ash–Slag Ternary Concrete Using the Firefly Algorithm (FA) and Random Forest (RF) Hybrid Machine-Learning Method. Materials 2022, 15, 4193. [Google Scholar] [CrossRef]
  41. Cui, X.; Wang, Q.; Zhang, R.; Dai, J.; Li, S. Machine learning prediction of concrete compressive strength with data enhancement. J. Intell. Fuzzy Syst. 2021, 41, 7219–7228. [Google Scholar] [CrossRef]
  42. Shi, M.; Shen, W. Automatic Modeling for Concrete Compressive Strength Prediction Using Auto-Sklearn. Buildings 2022, 12, 1406. [Google Scholar] [CrossRef]
  43. Kumar, M.; Singh, S.; Kim, S.; Anand, A.; Pandey, S.; Hasnain, S.M.; Ragab, A.E.; Deifalla, A.F. A hybrid model based on convolution neural network and long short-term memory for qualitative assessment of pervious and porous concrete. Case Stud. Constr. Mater. 2023, 19, e02254. [Google Scholar]
  44. Khademi, P.; Toufigh, V. HPASC—OPCC bi-surface shear strength prediction model using deep learning. Road Mater. Pavement Des. 2023, 24, 1765–1792. [Google Scholar] [CrossRef]
  45. Huang, W.; Quan, W.; Ge, P. Orthogonal tests investigation into hybrid fiber-reinforce recycled aggregate concrete and convolutional neural network prediction. J. Asian Archit. Build. Eng. 2022, 21, 986–1001. [Google Scholar] [CrossRef]
  46. Ranjbar, I.; Toufigh, V.; Boroushaki, M. A combination of deep learning and genetic algorithm for predicting the compressive strength of high-performance concrete. Struct. Concr. 2022, 23, 2405–2418. [Google Scholar] [CrossRef]
  47. Zeng, Z.; Zhu, Z.; Yao, W.; Wang, Z.; Wang, C.; Wei, Y.; Wei, Z.; Guan, X. Accurate prediction of concrete compressive strength based on explainable features using deep learning. Constr. Build. Mater. 2022, 329, 127082. [Google Scholar] [CrossRef]
  48. Singh, S.B.; Murugan, M.; Chellapandian, M.; Dixit, S.; Bansal, S.; Reddy, K.S.K.; Gupta, M.; Vafaeva, K.M. Effect of fly ash addition on the mechanical properties of pervious concrete. Mater. Today Proc. 2023. [Google Scholar] [CrossRef]
  49. Seeni, B.S.; Madasamy, M.; Chellapandian, M.; Arunachelam, N. Effect of silica fume on the physical, hydrological and mechanical properties of pervious concrete. Mater. Today Proc. 2023. [Google Scholar] [CrossRef]
  50. Sun, Y.; Gao, P.; Geng, F.; Li, H.; Zhang, L.; Liu, H. Thermal conductivity and mechanical properties of porous concrete materials. Mater. Lett. 2017, 209, 349–352. [Google Scholar] [CrossRef]
  51. Agar-Ozbek, A.S.; Weerheijm, J.; Schlangen, E.; Van Breugel, K. Investigating porous concrete with improved strength: Testing at different scales. Constr. Build. Mater. 2013, 41, 480–490. [Google Scholar] [CrossRef]
  52. Chen, Y.; Wang, K.; Wang, X.; Zhou, W. Strength, fracture and fatigue of pervious concrete. Constr. Build. Mater. 2013, 42, 97–104. [Google Scholar] [CrossRef]
  53. Rezania, M.; Panahandeh, M.; Razavi, N.; Berto, F. Experimental study of the simultaneous effect of nano-silica and nano-carbon black on permeability and mechanical properties of the concrete. Theor. Appl. Fract. Mech. 2019, 104, 102391. [Google Scholar] [CrossRef]
  54. Deng, F.; He, Y.; Zhou, S.; Yu, Y.; Cheng, H.; Wu, X. Compressive strength prediction of recycled concrete based on deep learning. Constr. Build. Mater. 2018, 175, 562–569. [Google Scholar] [CrossRef]
  55. JGJ 63-2006; Ministry of Housing and Urban-Rural Construction of the People’s Republic of China. Standard of Water for Concrete. China Building Industry Press: Beijing, China, 2006. (In Chinese)
  56. GB/T 50081-2019; Ministry of Housing and Urban-Rural Construction of the People’s Republic of China. Standard for Test Method of Mechanical Properties on Ordinary Concrete. China Building Industry Press: Beijing, China, 2002. (In Chinese)
Figure 1. Schematic Diagram of the Convolution Process.
Buildings 14 00907 g001
Figure 2. Schematic Diagram of the Pooling Process.
Buildings 14 00907 g002
Figure 3. The Structure of the CNN.
Buildings 14 00907 g003
Figure 4. Relationship between Predicted and Actual Values in CNN Training and Testing Sets.
Buildings 14 00907 g004
Figure 5. Prediction Performance of Samples from Different Sources in the Model: (a) Training Set; (b) Test Set.
Buildings 14 00907 g005
Figure 6. Comparison between Predicted and Actual Values of the Improved CNN Model: (a) Training Set; (b) Test Set.
Buildings 14 00907 g006
Figure 7. Histogram of Relative Errors in the Training Set and Test Set.
Buildings 14 00907 g007
Figure 8. Predictive Performance of BP Neural Network for Data from Different Sources.
Buildings 14 00907 g008
Figure 9. Comparison between Predicted Values of CNN and BP and Actual Values.
Buildings 14 00907 g009
Figure 10. Predictive Performance of BP Neural Network and CNN.
Buildings 14 00907 g010
Figure 11. Comprehensive Comparison of CNN and BP Metrics.
Buildings 14 00907 g011
Table 1. Partial Predictive Models for Compressive Strength of Pervious Concrete and Their Performance.
Nomenclature of the ModelMethod ClassModelR2
f c : compressive strength;
ϕ : total porosity;
d ¯ p : mean pore size;
d a : diameter of the aggerate particles.
First-order multivariate function model [23] f c = 1.239 ϕ 1.568 d ¯ p d a + 39.265 0.99
f c c : compressive strength;
ϕ : porosity.
Logarithmic function model [24] f c c = 18.6 ln ( ϕ ) + 71.3 0.98
f c u : cube compressive strength;
D : height of the specimen;
d a : size of aggregate.
Power function [25] f c u = 532 ( D d a ) 1.25 0.87
f c u : compressive strength;
δ 1 : replacement rates of ground granulated blast-furnace slag;
δ 2 : replacement rates of recycled concrete aggregates;
δ 3 : replacement rates of recycled fine glass.
First-order multivariate function model [26] f c u = 23.60 + 11.96 δ 1 19.11 δ 2 4.51 δ 3 0.87
σ c : compressive strength;
U P V : ultrasonic pulse velocity.
Power function [27] σ c = 0.1292 U P V 3.617 0.80
y : compressive strength;
x : porosity.
Linear regression model [8] y = 7.05 x + 166.0 0.71
y : compressive strength;
x : density.
Linear regression model [22] y = 0.02 x 31.369 0.63
Table 2. Source and Information of the Dataset.
ReferenceCuring Age
(Days)
Type of CuringType of CementType of FillerType of Aggregate
CAFA
1Seeni Bright Singh et al. [48] 28MoistOrdinary Portland CementFly AshGravel
2Bright Singh Seeni et al. [49] 28MoistOrdinary Portland CementSilica FumeGravel
3Yafei Sun et al. [50] 28MoistOrdinary Portland CementFly AshNatural Gravel
4Ayda S. Agar-Ozbek et al. [51] 28be Wrapped with Aluminum and Plastic Foils (20 °C)CEM I 52.5MicrosilicaCrushed Basalt and River GravelCrushed Basalt
5Yu Chen et al. [52] 28MoistASTM Type IFly Ash and Silica FumeGranite
6M. Rezania et al. [53] 28Maintained Into a Pool (23 ± 2 °C)Ordinary Portland Cement Lightweight AggregateDry Apparent Specific Weight: 1600 kg/m3
Table 3. Pervious Concrete Mix Ratios.
MixtureCoarse Aggregates
(kg/m3)
Cement
(kg/m3)
Fly Ash
(kg/m3)
Water
(kg/m3)
Fresh Concrete Bulk Density
(kg/m3)
Mix 115323009090 1863
Mix 21532300178110 1945
Mix 31532300279111 2065
Mix 415323507494 1884
Mix 51532350144109 1967
Mix 61532350237123 2039
Mix 715324004094 1876
Mix 81532400115109 1958
Mix 91532400189120 2098
Mix 1015324501098 1855
Mix 11153245069104 1965
Mix 121532450159117 2075
Table 4. Pervious Concrete Porosity and Compressive Strength Test Results.
MixtureMeasured Porosity (%)28 d Compressive Strength (MPa)
Mix 124.910.8
Mix 220.412.9
Mix 315.916.4
Mix 424.312.8
Mix 519.214.6
Mix 616.518.8
Mix 723.216.3
Mix 821.118.9
Mix 914.324.4
Mix 1024.518.9
Mix 1121.121.8
Mix 1215.325.6
Table 5. Values of evaluation indicators in a single model training experiment.
Data SetPerformance Measures
R2RMSE (MPa)MAPE (%)MAE (MPa)
Training set0.9422.7169.6212.080
Test set0.9382.9979.1342.440
Disclaimer/Publisher’s Note: The statements, opinions and data contained in all publications are solely those of the individual author(s) and contributor(s) and not of MDPI and/or the editor(s). MDPI and/or the editor(s) disclaim responsibility for any injury to people or property resulting from any ideas, methods, instructions or products referred to in the content.

