Abstract
In Brazil, there is a shortage of approximately 5.80 million residences, a challenge that intensified during the pandemic. Since 2013, there has been a mandate to implement specific performance criteria in residential constructions. However, many construction firms face difficulties in meeting these standards, especially concerning sound insulation in partition elements. This work aims to assess the airborne sound insulation performance and compliance with legal standards in new residential buildings through measurements and simulations. In particular, subsidized housing units for low-income populations are studied, which are eligible for reduced taxes on building loans. These buildings are typically made of hollow ceramic blocks with vertical perforations as separating walls, a commonly used national building material. Three buildings located in Guarapuava, a southern city in Brazil with a population of approximately 183,000 residents, were selected for this purpose. Measurements were conducted following ISO 16283-1 guidelines, whereas simulations were performed using ISO 12354-1, initially assuming a uniform plate but also exploring an alternative model that considers orthotropic behavior with analytical expressions. The calculations considered both static and dynamic moduli of elasticity. The results indicated that all the units failed to meet the specified standards. The measured values were below the required thresholds, obtaining 42 < 45 dB for Building B1, 40 < 45 dB for Building B2, and 38 < 40 dB for Building B3. The predicted values agreed well with the measured values when considering orthotropy with a dynamic elastic modulus. However, discrepancies were observed in the spectral analysis, especially at lower and higher frequencies. The findings suggest refraining from employing single-leaf partition walls made of vertical hollow ceramic blocks in such buildings. Improving sound insulation necessitates embracing a comprehensive strategy that takes into account the separating element, flanking paths, and the room geometries.
1. Introduction
Brazil has a housing shortage of about 5.80 million residences [1]. In 2017, it was estimated that around 330 million urban households globally faced an affordable housing gap. However, it is predicted that this number will rise by over 30% and reach 440 million households or 1.60 billion people by 2025 [2]. Throughout its history, Brazil has implemented various public policies aimed at ensuring the availability of affordable housing. However, it is anticipated that the country will not be able to fulfill the Sustainable Development Goal (SDG) of Making cities and human settlements inclusive, safe, resilient, and sustainable through its existing ‘Decent Housing’ programs by 2030 [3]. To mitigate this effect, the Brazilian government constructs subsidized housing primarily targeting low-income populations. These buildings typically consist of load-bearing and regular masonry walls that are made of either ceramic or concrete hollow blocks. Additionally, the majority of coating applied to these systems is made of cement mortar. This article analyses these buildings from an acoustical point of view, focusing on indoor airborne sound insulation.
Since 2013, the Brazilian construction industry has adopted a performance standard for residential buildings, which sets forth various requirements encompassing thermal and acoustical performance [4]. This standard has prompted significant changes within the industry since its implementation. It can be argued that meeting these requirements has not been and continues not to be a straightforward task. Many practices have had to be reconsidered and companies are encountering challenges in implementing the necessary changes, including a lack of knowledge, the need for project reassessment, and a scarcity of technical information on products and construction systems [5]. Meeting performance standards has become a requirement for buildings seeking public funding for their construction. Adherence to these standards is linked to mandatory quality management programs implemented by construction companies to secure this specific type of funding [6].
For the measurement of airborne sound insulation between rooms, the Brazilian standard [7] categorizes the acoustical performance into minimum, intermediate, and superior levels. The mandatory minimum values differ based on the type of space, such as bedrooms and living rooms, and the purpose of the element, such as walls or floors. The measurements adhere to ISO 16283-1 standard [8], using the weighted standardized level difference between two rooms as the descriptor. It is not obligatory to conduct low-frequency range analysis. The has been found to be a good indicator for noise annoyance due to lack of sound insulation. In a study conducted by Andargie et al. (2023) [9], the connection between sound insulation and noise annoyance in multi-unit residences was examined. The researchers discovered a notable association between airborne noise annoyance and the apparent sound transmission class (ASTC), a single numerical value used to measure sound insulation based on the ASTM E336-20 standard [10]. Similarly, Rauscher et al. (2023) [11] conducted a comparable perceptual study and found a significant correlation between perceived loudness and the . The findings suggested that these single numerical values could effectively represent the perceived level of airborne sound insulation.
Prior to conducting measurements, an initial step involves the anticipation of acoustic performance using prediction models. In Brazil, the assessment of airborne sound insulation between rooms complies with the ISO 12354-1 standard [12], which relies on the physical and mechanical properties of the elements in question. However, a significant challenge arises due to the prevalent utilization of ceramic or concrete hollow blocks in the construction of walls in Brazilian buildings. These blocks do not precisely match the characteristics of an isotropic and homogeneous element. This challenge is further complicated by the limited availability of technical data pertaining to the manufacturing of these blocks, as they are produced by various companies, including smaller entities, outside the country [13]. Additionally, ISO 12354-1 [12] mentions that structural elements with perforations may not be deemed homogeneous unless the perforation dimensions are small and the perforation volume is less than 15% of the total volume. Despite having this information, many architects, practitioners, and engineers across the country continue to utilize ISO models for perforated elements due to the absence of sufficient models tailored for these materials.
It is important to highlight the difference between the and the Sound Reduction Index (). The first is obtained by in situ measurements, where the direct and indirect transmissions paths are under consideration. Sound propagates not solely through direct transmission across separating walls or floors, but also through numerous other architectural elements like walls, floors, cavities, ceiling voids, and beams. This indirect transmission is commonly referred to as flanking transmission. To forecast both direct and flanking transmission, statistical models grounded in Statistical Energy Analysis (SEA) prove highly useful due to their tendency to simplify assumptions about building elements. SEA serves as the foundation for prediction models outlined in ISO 12354-1 [12,14]. For every group of flanking surfaces, there exist three transmission paths for flanking transmission. In other words, when there are four flanking surfaces, there are an additional 12 transmission paths, apart from the direct transmission [15]. The rating can be determined under laboratory conditions using a reverberating chamber and a sample area of approximately 10 m2. The process for obtaining this value is described in the ISO 10140-4 standard [16]. The values serve as valuable data for the prediction models outlined in ISO 12354-1 [12].
There are several studies in the literature that analyse the performance of the ISO 12354-1 [12] and propose alternatives for predicting airborne sound insulation. In their study, Santoni et al. (2019) [17] investigated the impact of physical, mechanical, and acoustic characteristics on the sound prediction models outlined in ISO 12354-1 [12]. Their findings indicated that the ISO methodology falters in predicting outcomes when dealing with non-uniform walls, revealing a growing disparity between simulated outcomes and actual experimental data, particularly at higher frequencies. The outcomes of the prediction models remain consistent for partitions that are homogeneous and isotropic. In a similar study, Serpilli et al. (2021) [18] found that the ISO 12354-1 [12] model lacks precision when applied to hollow brick walls due primarily to the presence of the mortar used in wall assembly, which prevents characterization of the wall as an isotropic and homogeneous panel. The authors proposed an alternative calculation using Artificial Neural Networks (ANNs) to estimate the sound reduction index, validating this approach through measurements. Comparing the traditional ISO 12354-1 [12] calculation method with the use of ANNs for hollow brick walls, they observed the ANNs’ effectiveness being up to three times greater. Granzotto et al. (2021) [19] developed an analytical model relying on the wall impedance derived from the horizontal and vertical elastic moduli of individual clay hollow bricks, presuming orthotropic behavior. They introduced a more precise approach compared to the method outlined in ISO 12354-1 [12] specifically tailored for these types of blocks.
This study aims to investigate the indoor airborne sound insulation in three residential buildings constructed in Brazilian subsidized housing projects. These buildings consist of single-leaf walls made of hollow ceramic blocks, using cement mortar as coating. First, the between two rooms is measured in each building following the ISO 16283-1 standard [8]. The results are next compared with those obtained from simulations. These include predictions following the ISO 12354-1 [12] for isotropic behavior but also with the orthotropic option developed by Granzotto et al. (2021) [19], which has been shown to be accurate for hollow blocks. These models typically consider a static elastic modulus and a pioneering approach is adopted here to incorporate the dynamic elastic modulus, aiming to minimize deviations. Theoretical models provide the sound reduction index R of a partition. To obtain the , the three buildings are modeled with the software CYPE AcouBAT [20] using the R simulated for each partition. This software obtains the by considering the sound reduction in the direct path but also the contributions coming from the flanking transmission.
This research aims to attain the following objectives in the context of subsidized housing projects in Brazil:
- Provide essential information for the construction sector to discourage the use of single-leaf partition walls constructed with vertical hollow ceramic blocks from an acoustical point of view.
- Examine the use of existing prediction models that rely on analytical equations and introduce a new approach by taking into account the dynamic modulus of stiffness in the calculations.
The article is structured as follows. Section 2 presents the methodology of this work, showing first the composition of the scenarios considered in the three buildings, detailing the prediction models used to obtain R, the acoustic simulations to compute the , and the measurements performed to also obtain the . Next, Section 3 shows the results obtained. First, the sound reduction indices obtained with the prediction models are analyzed, the overall levels obtained for both experiments and simulations are then examined, and an analysis of the spectral content of is next performed. Some limitations found for the simulation models are also discussed at the end of this section. Conclusions finally close this article in Section 4.
2. Materials and Methods
2.1. Composition of the Buildings
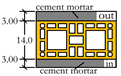
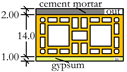
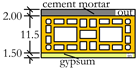
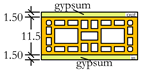
Research comprised the examination of three buildings made with hollow ceramic blocks. The first two buildings, denoted as B1 and B2, comprise multi-story residences with 7 and 4 floors, respectively, and the third one, B3, is a single-story house comprising twin single-story apartments. These buildings were selected because they typify the predominant construction systems employed by the building firms engaged in the social-housing funding initiative. The areas under analysis in B1 and B2 are bedrooms, where a minimum of 45 dB is required between them [7]. In the case of B3, the separating element must achieve a of at least 40 dB, as it separates two living rooms [7].
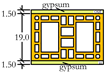
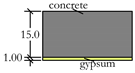
The second floors of buildings B1 and B2 were studied in this work. Detailed visuals of these buildings, emphasizing the analyzed bedrooms, are provided in Figure 1. The lightweight partition consists of two 15.0 mm thick gypsum boards separated by a 70.0 mm metal frame, creating a 10.0 cm wall. The structural flooring in both buildings consists of a 15 cm thick massive reinforced concrete slab, denoted as floor type A. Users have the flexibility to personalize the surface layer of the floor according to their preferences. Companies offer alternatives that exclude these additional top layers. In Building B1, the bedroom height measures 2.57 m, while, in Building B2, it measures 2.65 m. Beneath the concrete slab lies a 1 cm thick gypsum layer.
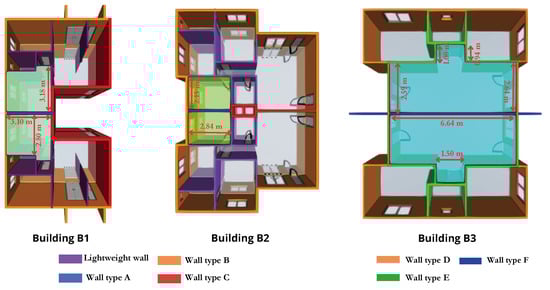
Figure 1.
Floor layouts of buildings B1, B2, and B3.
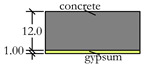
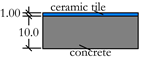
Building B3’s load-bearing walls incorporate various block types, illustrated in Figure 1. The ceiling of Building B3 comprises a 12.0 cm thick concrete slab supported by a 1 cm layer of gypsum plaster, classified as floor type B. Moreover, the floor consists of a 10.0 cm thick reinforced concrete layer with ceramic tiles above it, categorized as floor type C. This serves as the foundational element for both twin houses.
Table 1 illustrates various wall compositions labeled A through F, as well as floor types A, B, and C. Each wall type is composed of ceramic blocks with coating systems, where the coating material may vary between gypsum and cement mortar. In the construction of masonry units, adherence to national standards limits the horizontal and vertical mortar used for wall assembly to a thickness of 1.00 cm [21,22]. All ceramic blocks measure 19.0 cm in height and 29.0 cm in width. The variables m, , , and are defined in Section 2.2.1.

Table 1.
Wall types A to F and floor types A, B, and C.
2.2. Acoustical Properties and Prediction Models
Two prediction models were used in this work to compute the sound reduction index R. The first model takes into account the orthotropic characteristics of hollow ceramic block walls and applies the methodology introduced by Granzotto et al. (2021) [19] for this particular scenario, with certain modifications. Meanwhile, the second one assumes uniformity across all elements, adhering to the ISO 12354-1 guidelines [12]. R is defined as
with standing for the sound transmission coefficient. The following subsections describe how these models compute , as well as the physical and mechanical properties they require.
2.2.1. Physical and Mechanical Properties
The predictive models for hollow blocks incorporate diverse physical and mechanical properties, encompassing the vertical compressive strength , horizontal compressive strength , Poisson’s ratio (specified as 0.15 for hollow blocks and 0.20 for massive concrete elements [15]), mass per unit area m, internal loss factor (established at 0.005 for concrete and 0.01 for masonry units [12]), and the compressive strength of laying mortars . The latter closely resembles the Type III mortar outlined in Castro et al.’s study (2016) [23], with a value approximately at 4.50 MPa. As for the reinforced concrete used in flooring, its compressive strength is represented as , with a value of around 20.0 MPa.
Table 1 provides an overview of the physical and mechanical property values adopted in this work for the different partitions. The compressive strengths in both vertical () and horizontal () directions for blocks A to F were determined via a compressive resistance test, as depicted in Figure 2. This testing adhered to the national standard NBR 15270-2 (2023) [24], with five samples assessed for each block type. Calculating the mass per unit area requires considering the specified weight of the blocks from manufacturers and estimated densities for finishing layers.
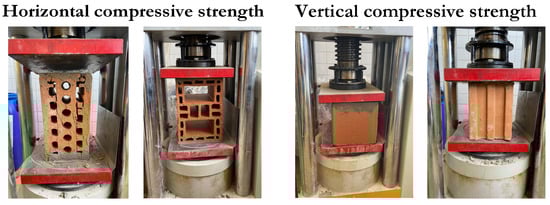
Figure 2.
Compressive resistance test of the blocks.
Table 2 provides information on the densities of gypsum and cement mortar, which serve as coating elements, along with their respective approximate static () and dynamic () moduli of elasticity. For concrete, employed in flooring, the static modulus was determined as [25]
whereas the dynamic modulus was computed as [26]
considering the incorporation of basaltic aggregate within its composition for both equations. These assumptions were formulated by considering the mortar types that closely resembled those actually used.
Table 2.
Densities and elastic moduli.
2.2.2. Prediction Model for Orthotropic Behavior
The predictive model for orthotropic behavior, drawing from Granzotto et al.’s research (2020) [19] and Ribeiro et al. (2021) [32], assumes the ability to compute the walls’ elastic modulus using the block and mortar resistances as references. The equation used to determine the vertical compressive strength of the wall reads [33]
whereas the horizontal compressive strength of the wall is computed as
Following Eurocode 6 (2005) [33], the K value is determined by the block’s composition and the void ratio of the element. Specifically, for wall type A, K stands at 0.35, whereas, for all other walls, the assumed K value is 0.45.
The static modulus of elasticity for the wall in vertical (E) and horizontal () directions is computed as [23]
The dynamic modulus of elasticity of mortar and/or concrete is an important input parameter in acoustic simulations, since it affects the stiffness of the structure, as the effective modulus of elasticity of the real structure, and, consequently, the sound transmission characteristics of the material. A very common strategy used to predict this parameter is to evaluate individually the volumetric fractions and the elastic properties of each composite phase, and then to apply classical homogenization models [34,35]. In fact, understanding is crucial for optimizing building design, reducing material consumption, and solving sound and vibration problems. Makoond et al. (2020) [36] established an empirical correlation for brick masonry constituents, linking the dynamic and static moduli of elasticity as . This equation has been utilized to estimate the dynamic modulus and assess its impact on the predicted sound reduction index.
It is important to highlight that incorporating cement mortar layers has the potential to enhance the compressive strength of the wall, thereby affecting its modulus of elasticity [37,38]. To investigate this impact, the homogenization of elastic moduli was conducted using the Voigt and Reuss methods as described in the following equations
Here, and represent the volume fractions of the outer and inner coating layers, while and denote the elastic moduli of these respective layers. The variable signifies the volume fraction of the wall excluding these layers, where can be either E or computed using Equations (6) and (7). The mean value derived from both the Voigt and Reuss models,
stands as a reliable estimation for a composite characterized by a stochastic distribution of inclusions [39,40]. The equivalent moduli of elasticity for vertical and horizontal are named as and . The corresponding modulus of elasticity can be expressed as a function of the in-plane angle [19,41,42]
with and standing for the complex form of the elasticity moduli. These magnitudes can be computed as [19]
with being the total loss factor. This is determined under laboratory conditions as [12]
with f representing the central frequency within the one-third octave band range.
The functions for the shear modulus and bending stiffness defining the elastic properties of isotropic materials can be expressed as [19]
where h is the thickness of the wall.
In non-isotropic panels, the impedance of the wall is contingent upon both the angle of incidence and the in-plane angle . Consequently, the normalized impedance can be determined as [19]
where represents the impedance of air (approximately 412 Ns/m3), stands for the density of the wall, denotes the speed of sound in air (taken as 343 m/s), corresponds to the angular frequency (), and i symbolizes the imaginary unit.
The angle-dependent transmission coefficient () for an infinitely large isotropic plate with mass and stiffness can be characterized as [19]
By combining Equations (17) and (18), the transmission coefficient encompassing and angles is derived, as described in [19].
For an orthotropic material and within a diffuse field environment, the sound transmission coefficient can be calculated as
where represents the limiting angle in an in-field scenario, set to radians [43].
2.2.3. Prediction Model according to ISO 12354-1
The ISO 12354-1 standard [12] offers the following formulas for calculating the transmission coefficient
where represents the air density (set at 1.29 kg/m3), stands for the radiation factor related to free bending waves, denotes the radiation factor for forced waves, signifies the critical frequency, computed as , and refers to the quasi-longitudinal wave velocity in meters per second, defined as [15]. An adjustment to Equation (22) was identified by Santoni et al. (2019) [17]. The dimensions taken into account for computing the radiation factors within the scope of Annex B of ISO 12354-1 [12] were 3.75 m × 2.65 m, representing a standard sample size commonly used in laboratory testing. The determination of the elastic modulus E involved computations derived from Equations (4), (6), (8) and (9), accounting for both static and dynamic scenarios. This calculation encompassed the concrete slabs with gypsum mortar as a coating.
When the frequency f surpasses , the effective critical frequency replaces in the computation. This can be computed as [12]
At elevated frequencies, the potential addition of the plateau effect might occur, which constrains the transmission coefficient to a determined value derived of [12]
2.3. Acoustical Simulations
Acoustic simulations were next performed to obtain the for the desired partition in each building, using as input the sound reduction indices R computed in the preceding section. We proceed as follows. The design process began in CYPE Architectural software [44], where the structure of each building was modeled. In the case of buildings B1 and B2, the analysis was limited to three floors to reduce computational times. This restriction aligns with ISO 12354-1 models [12], where transmission paths are limited to the immediate upper and lower levels of the analyzed floor. The model was next transferred to CYPE Open BIM Analytical model [45], defining rooms as volumes for analysis. The final step involved exporting the model to the building acoustics simulation software, CYPE AcouBAT [20]. This software conducts simulations in accordance with ISO 12354-1 [12], evaluating flanking transmission and computing the by means of analytical expressions. Figure 3 shows buildings B1, B2, and B3 in AcouBAT, illustrating their direct and lateral pathways for sound transmission.
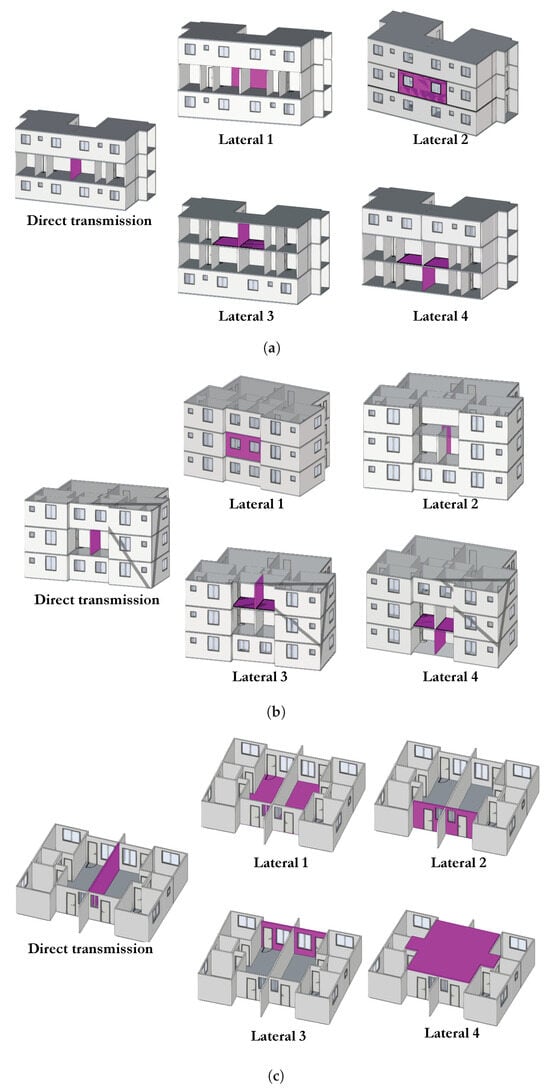
Figure 3.
Global and flanking transmission for building (a) B1, (b) B2, and (c) B3.
The software computation is dependent on the existence of cross- and T-junctions in the flanking elements, as well as the classification of the element type (e.g., massive or lightweight). Considering both the junction type and the sound reduction indices (R) of the envelope elements, AcouBAT collects information on both the direct and flanking transmission of the dwellings. Subsequently, it calculates the overall value for each frequency as
with representing the insulation data for each transmission path (direct and flanking) and n the number of paths. In this study, the parameter n has been constrained to a value of 5, taking into account both the direct transmission and the four lateral paths, as illustrated in Figure 3.
2.4. Acoustical Measurements
Acoustical measurements were performed following the guidelines outlined in the ISO 16283-1 standard for airborne sound insulation [8]. In particular, the standardized level difference was determined. The procedure involved using a single sound source deployed at various positions of the emitting room while keeping the microphone placements fixed, in both the emitting and receiving room. A Brüel&Kjær Type 2250 sound-level analyzer, coupled with a free field 1/2” microphone of Type 4189, was employed for the measurements. Pink noise was generated in the emitting room using an omnidirectional loudspeaker (Type DDC-100—GROM) with a maximum sound power of 109 dB re 1 pW across the 40–8000 Hz frequency range. Background noise correction was not needed because there were no workers or construction activities during the measurements and there was minimal traffic noise. The procedure for measurement entailed positioning two sound sources at designated locations within the emission room, each paired with five receiver positions. Furthermore, ten microphone placements were arranged within the reception room (five for each sound source placed in the emission room). Equivalent sound pressure levels () were subsequently measured across one-third frequency bands over a duration of 30 s. The distances between the sound sources, receivers, and room boundaries were established in accordance with the guidelines outlined in ISO 16283-1 [8].
ISO 16283-1 [8] also requires measuring the reverberation time (RT) in the receiving room in accordance with the ISO 3382-2 standard [46]. This was obtained by means of 6 impulse responses (IRs) measured with a 1/2” free-field microphone (type 4966-H-041—Brüel&Kjær) connected to a CCLD signal conditioner (type 1704-A-001—Brüel&Kjær), and coupled to a USB sound card (AudioBox USB 96—PreSonus). The IRs were acquired using the ITA-ToolBox [47] and considering the 30 dB dynamics (). Figure 4 shows the configuration used to obtain the sound insulation descriptor in each one of the considered buildings.
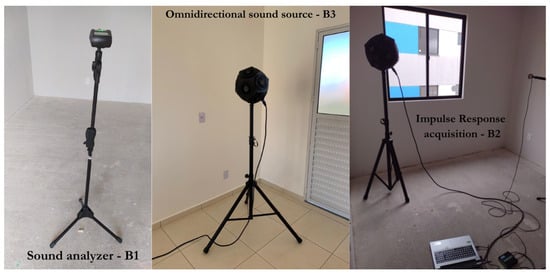
Figure 4.
Equipment for measuring airborne sound insulation in buildings B1, B2, and B3.
The weighted standardized level difference and the spectrum adaption terms C and are finally computed from following ISO 717-1 [48]. The uncertainty linked to is also determined following ISO 12999-1 [49] as
where U stands for the expanded uncertainty. This results from a product of a coverage factor k and the standard uncertainty for in situ scenarios , established at 0.90 dB as per the ISO standard. The coverage factor is assumed to be 1.65, corresponding to a one-sided test at a 95.0% confidence level. This procedure is applicable only to receiving rooms with volumes exceeding 25.0 m3, thereby restricting its use to building B3. Buildings B1 and B2 have, respectively, volumes of approximately 23.2 m3 and 20.3 m3, thus falling below this threshold.
3. Results and Discussion
3.1. Sound Reduction Indices
Figure 5 depicts the sound reduction indices obtained for wall types A to F shown in Table 1, predicted using the orthotropic behavior and the ISO 12354-1 [12] models with and . In walls of this kind, there are usually two dips in the R, the first one occurring at the critical frequency within the lower frequency spectrum and the second one at higher frequencies. The high-frequency dip occurrence is suggested to be a coincidental frequency effect associated with the thin surface layer on both sides of the web structure of the hollow blocks and coating [14,50]. Note that in the lower frequency spectrum the ISO models exhibit pronounced dips at critical frequencies, approximately 160 and 200 Hz for wall types A to D, 250 Hz for wall type C, and 125 Hz for wall type F. These predictions correlate with materials that are solid and uniform in nature. Conversely, for hollow blocks incorporated within masonry walls, these dips are expected to be broader, extending from 250 Hz to 500 Hz, as highlighted by Friguellino and Smith (1999) [50]. This expanded frequency range was produced in the orthotropic models across all wall types, affirming the model’s validity for these type of walls. The second dip in the high-frequency range usually falls between 2000 and 2500 Hz for walls of this type [51]. Nevertheless, observe in Figure 5 that none of the models show a decline in this frequency range. In the mid-frequency range, all models yielded comparable results. Granzotto et al. (2020) [19] assert in their study that their orthotropic model exhibits satisfactory alignment up to a frequency of 2500 Hz. However, beyond this limit, the approach fails to consider the impacts stemming from wall thickness and the intricate internal structure of the web. This oversight results in an overestimation of the acoustic reduction index and the omission of the second dip.
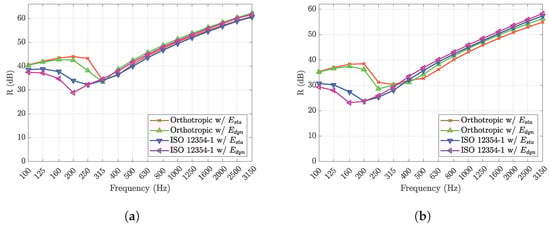
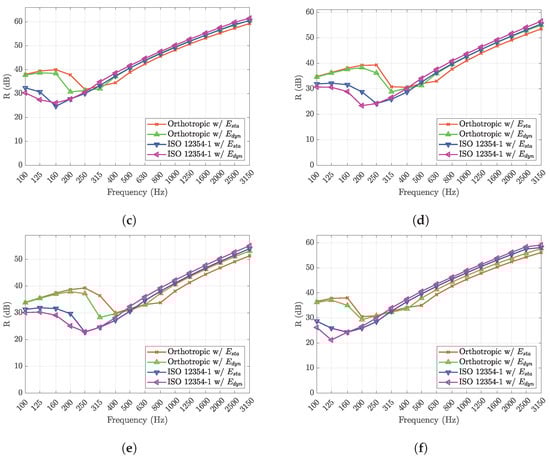
Figure 5.
Sound reduction indices R (in dBs) for walls A to F predicted with the orthotropic behavior model with , the orthotropic behavior model with , the ISO 12354-1 model with , and the ISO 12354-1 [12] model with . (a) Wall type A. (b) Wall type B. (c) Wall type C. (d) Wall type D. (e) Wall type E. (f) Wall type F.
3.2. Overall Levels
Table 3 contains the measured and simulated data for the weighted standardized level difference and the spectral adaptation terms C and , for buildings B1, B2, and B3. As can be seen from the measured values, the building with better insulation is B1 followed by B2 and B3. The prediction models tend to underestimate the compared to measurements. The exception is the model with the orthotropic behavior and a dynamic modulus of stiffness (), which coincides with this single value for all three buildings. Conversely, the model that produces larger deviations is the one based on ISO 12354-1 [12] and a static stiffness modulus (). Let us now focus on the spectrum adaptation terms in Table 3. The spectrum adaptation term C is derived from the A-weighting pink noise spectrum and is relevant to various activities such as living, children playing, railway traffic, highway road traffic, and factories emitting primarily medium- and high-frequency noise. The term is to be employed when assuming representative urban traffic noise as the loading noise, and it is applicable to urban road traffic, low-speed railway traffic, aircraft with propeller-driven engines, and factories emitting mainly low- and medium-frequency noise [52]. Based on the measured data, these types of separating elements show increased sensitivity to the term , implying a potential 2 dB decrease in perceived insulation for buildings B1 and B2, and a 1 dB decrease for building B3. Upon examining the simulated results, it becomes evident that the most significant deviation from the measured data lies in the term. This discrepancy is ascribed to the models employed in this study underestimating low-frequency values. In the ISO model, Serpilli et al. (2021) [18] identified that the most substantial deviations occur at the critical frequency, which, for masonry walls, typically falls within the medium–low-frequency range. The authors also noted that the low-frequency range exhibits higher deviations when compared to the measured data. Although the orthotropic model reduced these deviations, it still resulted in underestimated values for the low-frequency range. It is important to note that the data measurements for and R exhibit the most significant uncertainties in the low-frequency range (e.g., <250 Hz) [53]. As a result, caution should be exercised when comparing the measured and simulated data. Table 4 presents a comparison between the overall levels and the requirements outlined in NBR 15575-4 [7]. Observe that none of the analyzed buildings met the national standards. Building B2 requires the most significant improvement to reach the standard, with an increase of 5 dB for the . Building B1 follows, presenting a difference of 3 dB, and finally building B3, with 2 dB. Note, however, that once uncertainty is incorporated in building B3, the decreases from 38 dB to 36.5 dB, with a confidence level of 95%. These deviations with respect to the standard may contribute to noise-related disturbances between dwellings, potentially impacting the health of occupants [11].
Table 3.
Measured and simulated values of (C;) for buildings B1, B2, and B3.
Table 4.
Comparison of the measured data with the national requirements.
3.3. Spectral Analysis
It is also interesting to analyze the spectral content of the scenarios studied. Figure 6 shows the obtained through measurements and simulations for the three buildings. Let us start with Building B1 (Figure 6a). It is apparent that none of the predictive models align with the measured data across the entire frequency range of interest (100 Hz to 3150 Hz). In the case of this building, a satisfactory agreement between the prediction models and the measured data is observed within the 400 to 800 Hz range. However, significant discrepancies emerge especially in the lower frequency spectrum. Note, however, that these are alleviated when accounting for orthotropic behavior. Above 1250 Hz, the deviations amounted to approximately 8 dB for each one-third octave band until 3150 Hz, with slightly reduced deviations when considering orthotropy. For building B2, as depicted in Figure 6b, the prediction models exhibited notable effectiveness at the 500 Hz frequency but a worse estimation for other frequencies in the mid-frequency range. In addition, the upward trend in the high-frequency spectrum closely mirrored the measured data, with reduced deviation when using within an orthotropic framework. At low frequencies, and especially at 160 Hz and 200 Hz, the orthotropic models demonstrated a better alignment with the measured data compared to results obtained with the ISO 12354-1 [12] models. Figure 6c displays the results for building B3. The only notable correspondence between the measured and predicted data was observed within the 500 to 800 Hz range. For lower frequencies, prediction models underestimate the insulation, whereas at higher frequencies the opposite is observed. As in buildings B1 and B2, the model that obtains results closest to the measured data is the one based on orthotropic behavior and using . It is worth noting that building B3 showcases the impact of using gypsum mortar, recognized for its porous and lighter coating compared to cement mortar. This characteristic permits noise to pass through the wall assembly junctions, a limitation that arises when cement mortars are added [51].
Figure 6.
Standardized level difference measured [8] and simulated [12] for buildings (a) B1, (b) B2, and (c) B3.
Comparing the predicted values across the three buildings, the findings suggest that the decreases at the higher frequencies when using , whereas at low frequencies it increases. Despite close numerical proximity between the measured and predicted values, the spectral analysis reveals that the models exhibit significant agreement solely within the mid-frequency range. Introducing the concept of orthotropic behavior results in lower deviation within the low- and high-frequency spectrum. Cavities decrease the mass per unit area, leading to orthotropic behavior, and create voids that can accommodate one-, two-, or three-dimensional sound fields within the plate [14]. Furthermore, the orthotropy is amplified by the variation in the number of bed and head joints [54].
On the other hand, fluctuations observed in the measured data in the low-frequency range stem from uncertainties inherent in that specific range [53]. Coincidence frequencies, marking the transition from mid to high frequencies, were pinpointed between 1250 and 1800 Hz for both isolating elements. Within this frequency range, the insulation performance is affected by the surface mass of the elements and tends to escalate with increased mortar thickness, consequently raising the loss factor. At the higher frequencies, the prediction models do not accurately account for the resonances of the thicknesses within the complex web structure of the blocks. This leads to an overestimation of the sound insulation levels [50].
It should be highlighted that, in the case of wall type E, serving as the partition within building B3, gypsum plaster is applied on both sides. This particular coating is renowned for its significant porosity, serving its intended hygrothermal purposes [55]. Such porosity might enable the direct transmission of sound through joint mortars between rooms, with the resulting effects being independent of frequency, as they are affected by these potential leaks.
The precision of these models’ predictions hinges on the nature of the elements involved and the intricacy of boundary conditions, including direct and flanking transmission. While straightforward heavy constructions like concrete typically yield accurate results, managing combinations with lightweight, multilayered elements poses challenges. Nonetheless, this complexity should not deter the practical application of these models in design scenarios. Their utilization contributes significantly to expanding the knowledge base for implementing the standard [43]. The implementation of ISO 12354-1 [12] procedures serves as the official standard in numerous countries, including Brazil, for determining the overall level of sound insulation. While these procedures do not consider potential leaks that may occur in practice, they are still essential for use during the design phase of residential buildings.
3.4. Limitations of the Prediction Models
This work has not focused on developing new theoretical models, but on the use of those already existing and currently employed in the industry as predictive tools. The authors of this work have identified the following limitations for the models used in this study:
- The selected predictive models utilized elastic moduli from literature sources for both the coating system and joints, along with compressive resistance and densities. Construction companies controlled the thicknesses of the applied coatings in the buildings, which could vary due to slight deviations in the walls.
- Analytical expressions, sourced from the literature, were employed to calculate equivalent elastic moduli. However, for enhanced accuracy, it is recommended to measure this value through a comprehensive mechanical characterization of the sample. To accommodate variations in coating thicknesses and types of hollow blocks, the authors opted to calculate these factors separately.
- Assumptions were made regarding the impedance of the air (412 Ns/m2), the speed of sound in air (343 m/s), and the air density (1.29 kg/m3). Altering these values will yield different outcomes in the predicted models.
- The orthotropic model with demonstrates high accuracy in the mid-frequency range (e.g., 400–800 Hz) for hollow blocks featuring single-spaced holes, akin to those utilized in Wall Type A. However, for blocks with larger holes, as found in wall types B to F, it is necessary to conduct additional studies to fine-tune all prediction models and minimize deviations across lower and higher frequencies.
- According to Granzotto et al. (2020) [19], their model fails to forecast thickness resonances beyond the high-frequency spectrum (e.g., >2500 Hz) and this phenomenon cannot be feasibly derived through analytical calculations.
- Care should be exercised when making comparisons within the low-frequency range (from 100 to 250 Hz), as this interval contains the greatest uncertainties in the measured data [53].
- As described by Rindel (2017) [15], sound insulation computation programs typically suffer from the limitation that their outcomes represent the maximum achievable values, assuming ideal workmanship and acoustically flawless building details—conditions rarely met in practice.
4. Conclusions
This work has studied the airborne sound insulation of three different buildings made of hollow ceramic blocks that are constructed within the framework of a Brazilian government-funded housing initiative. Measurements and simulations have been performed for this purpose. Two theoretical models have been employed to assess their effectiveness as predictive tools for the sound reduction index: the ISO 12354-1 model for homogeneous plates, widely used in industry, and a model accounting for orthotropic behavior. In both instances, the dynamic and static elastic moduli have been scrutinized. The software AcouBAT has been used in conjunction with these theoretical models to estimate considering flanking transmission.
Measured have revealed that the analyzed rooms fell below the thresholds required by the Brazilian administration, resulting in values of 42 dB (<45 dB), 40 dB (<45 dB), and 38 dB (<40 dB) for buildings B1, B2, and B3, respectively. Simulation values have also confirmed this tendency. When compared to measured data, predicted results tend to underestimate values, with the exception of the orthotropic model with a dynamic elastic modulus, that has shown a perfect match. The model that presented the largest deviation was the ISO 12354-1 with a static elastic modulus. In general, results have improved when considering a dynamic elastic modulus. However, a close examination of the spectral content has shown that theoretical models fail in their predictions for low- and high-frequency ranges, respectively underestimating and overestimating values, although they provide accurate results for mid frequencies around 500 Hz. The model that produces better results is the one based on the orthotropic model with a dynamic elastic modulus, increasing the values for low frequencies and reducing them in the high-frequency range.
In the case of walls constructed with hollow ceramic blocks, it can be asserted that the orthotropic model, in conjunction with the dynamic elastic modulus, exhibits the least deviation in predicting sound insulation compared to the ISO model. Optimal results have been achieved in the mid-frequency range.
Despite the uncertainties tied to measurements, the findings suggest that neither of the prediction models for sound reduction indices utilized within the ISO 12354-1 overall calculation are appropriate for hollow block ceramic walls. However, utilizing the dynamic modulus of stiffness helped decrease the discrepancies. In order to improve precision across the entire spectrum, it may be beneficial to investigate alternative methods such as finite element modeling and artificial intelligence to predict the performance of this complex structure, particularly concerning resonances related to thicknesses within the high-frequency range.
The findings of this work suggest avoiding single-leaf walls constructed with hollow ceramic blocks, from an acoustic point of view. It is advised to adopt a comprehensive strategy, involving adjustments to the building envelope, interior walls, floor system, and room geometries, in order to enhance insulation values, along with gaining an understanding of the nature of noise sources.
Author Contributions
Conceptualization, R.S.R. and M.A.; methodology, R.S.R. and M.A.; software, R.S.R. and M.T.B.-C.; validation, R.S.R., D.A.S. and L.S.; formal analysis, R.S.R., M.A. and M.M.F.C.; investigation, R.S.R., M.A. and L.S.; resources, R.S.R. and M.A.; data curation, R.S.R., G.d.M.S.G. and R.M.B.; writing—original draft preparation, R.S.R., M.A., R.M.B. and G.d.M.S.G.; writing—review and editing, R.S.R., R.M.B., M.K. and M.A.; visualization, R.S.R., M.K. and M.T.B.-C.; supervision, R.S.R. and M.A.; project administration, R.S.R. and M.A. All authors have read and agreed to the published version of the manuscript.
Funding
This research received no external funding.
Data Availability Statement
The prediction models presented in this study are openly available in Mendeley Data at https://doi.org/10.17632/p7bp5wh62d.1.
Acknowledgments
The authors would like to thank the researchers at the Institute of Technical Acoustics of the RWTH Aachen University for the development and distribution of the ITA-Toolbox.
Conflicts of Interest
The authors declare no conflicts of interest.
References
- João Pinheiro Foundation. Brazilian Housing Shortage—2016–2019; João Piheiro Foundation: Belo Horizonte, Brazil, 2020. [Google Scholar]
- King, R.; Orloff, M.; Virsilas, T.; Pande, T. Confronting the Urban Housing Crisis in the Global South: Adequate, Secure, and Affordable Housing; Working Paper; World Resources Institute: Washington, DC, USA, 2017. [Google Scholar]
- de Souza, L.E.P.F.; de Barros, R.D.; Barreto, M.L.; Katikireddi, S.V.; Hone, T.V.; de Sousa, R.P.; Leyland, A.; Rasella, D.; Millett, C.J.; Pescarini, J. The potential impact of austerity on attainment of the Sustainable Development Goals in Brazil. BMJ Glob. Health 2019, 4, e001661. [Google Scholar] [CrossRef] [PubMed]
- NBR 15575; Residential Buildings—Performance. Technical Report. Brazilian National Standards Organization ABNT: Rio de Janeiro, Brazil, 2021.
- Hippert, M.A.S.; Longo, O.C. The performance standard—NBR 15575 and the architectural and structural designs. In Structures and Architecture—Bridging the Gap and Crossing Borders, Proceedings of the Fourth International Conference on Structures and Architecture (ICSA 2019), Lisbon, Portugal, 24–26 July 2019, 1st ed.; CRC Press: Lisbon, Portugal, 2019; p. 8. [Google Scholar]
- Lazzarini, S.; Hippert, M.A.S. Diretrizes para controle de informação documentada gerada pela implantação da NBR 15575: Edificações habitacionais: Desempenho em empresas construtoras. Ambiente Construído 2021, 21, 181–196. [Google Scholar] [CrossRef]
- NBR 15575-4; Residential buildings—Performance. Part 4: Requirements for Internal and External Wall Systems. Technical Report. Brazilian Association for Technical Standards ABNT: Rio de Janeiro, Brazil, 2021.
- ISO 16283-1; Acoustics—Field Measurement of Sound Insulation in Buildings and of Building Elements—Part 1: Airborne Sound Insulation. Technical Report. International Organization for Standardization ISO: Geneva, Switzerland, 2014.
- Andargie, M.S.; Touchie, M.; O’Brien, W.; Müller-Trapet, M. A field study of the relationship between sound insulation and noise annoyance, activity disturbance and wellbeing in multi-unit residences. Appl. Acoust. 2023, 206, 109291. [Google Scholar] [CrossRef]
- E336-20; Standard Test Method for Measurement of Airborne Sound Attenuation between Rooms in Buildings. Technical Report. ASTM (American Society for Testing and Materials): West Conshohocken, PA, USA, 2020. [CrossRef]
- Rauscher, T.; Neubauer, R.O.; Zaglauer, M.; Leistner, P. Single-number values versus subjective judgment of airborne sound insulation in dwellings. Build. Acoust. 2023, 30, 91–101. [Google Scholar] [CrossRef]
- ISO 12354-1; Building Acoustics—Estimation of Acoustic Performance of Buildings from the Performance of Elements. Part 1: Airborne Sound Insulation between Rooms. Technical Report. International Organization of Standardization ISO: Geneva, Switzerland, 2017.
- Muneron, L.M.; Hammad, A.W.; Najjar, M.K.; Haddad, A.; Vazquez, E.G. Comparison of the environmental performance of ceramic brick and concrete blocks in the vertical seals’ subsystem in residential buildings using life cycle assessment. Clean. Eng. Technol. 2021, 5, 100243. [Google Scholar] [CrossRef]
- Hopkins, C. Sound Insulation; Routledge: Burlington, VT, USA, 2007. [Google Scholar]
- Rindel, J.H. Sound Insulation in Buildings; CRC Press: Boca Raton, FL, USA, 2018. [Google Scholar]
- ISO 10140-4; Acoustics—Laboratory Measurement of Sound Insulation of Building Elements—Part 4: Measurement Procedures and Requirements. Technical Report. International Organization for Standardization: Geneva, Switzerland, 2021.
- Santoni, A.; Fausti, P.; Bonfiglio, P. Building materials: Influence of physical, mechanical and acoustic properties in sound prediction models. Build. Acoust. 2019, 26, 3–20. [Google Scholar] [CrossRef]
- Fabio, S.; Giovanni, D.N.; Mariano, P. Airborne sound insulation prediction of masonry walls using artificial neural networks. Build. Acoust. 2021, 28, 391–409. [Google Scholar] [CrossRef]
- Granzotto, N.; Bella, A.D.; Piana, E.A. Prediction of the sound reduction index of clay hollow brick walls. Build. Acoust. 2020, 27, 155–168. [Google Scholar] [CrossRef]
- CYPE Ingenieros S.A. AcouBAT by CYPE, version 2024.b; CYPE: Alicante, Spain, 2024. [Google Scholar]
- NBR 8545; Masonry Execution without Structural Function Using Ceramic Bricks and Blocks. Technical Report. Brazilian Association for Technical Standards ABNT: Rio de Janeiro, Brazil, 1984.
- NBR 16868-2; Structural Masonry. Part 2: Execution ant Site Control. Technical Report. Brazilian Association for Technical Standards ABNT: Rio de Janeiro, Brazil, 2020.
- Castro, L.O.; Alvarenga, R.C.S.S.; Silva, R.M.; Ribeiro, J.C.L. Experimental evaluation of the interaction between strength concrete block walls under vertical loads. Rev. IBRACON Estruturas Mater. 2016, 9, 643–681. [Google Scholar] [CrossRef]
- NBR 15270-2; Ceramic Components—Hollow and Bricks for Masonry. Part 2: Test Method. Technical Report. Brazilian Association for Technical Standards ABNT: Rio de Janeiro, Brazil, 2023.
- NBR 6118; Design of Concrete Structures. Technical Report. Brazilian Association for Technical Standards ABNT: Rio de Janeiro, Brazil, 2023.
- Gidrão, G.d.M.S. Propriedades Dinâmicas do Concreto e Relações com sua Microestrutura. Ph.D. Thesis, Universidade de São Paulo, São Paulo, Brazil, 2015. [Google Scholar]
- NBR 6120; Design Loads for Structure. Technical Report. Brazilian Association for Technical Standards ABNT: Rio de Janeiro, Brazil, 2019.
- Santos, T.; Gomes, M.I.; Silva, A.S.; Ferraz, E.; Faria, P. Comparison of mineralogical, mechanical and hygroscopic characteristic of earthen, gypsum and cement-based plasters. Constr. Build. Mater. 2020, 254, 119222. [Google Scholar] [CrossRef]
- Moayedian, S.M.; Hejazi, M. Effect of scale on compressive strength of brick masonry with gypsum mortar. Measurement 2021, 172, 108932. [Google Scholar] [CrossRef]
- Coquard, P.; Boistelle, R.; Amathieu, L.; Barriac, P. Hardness, elasticity modulus and flexion strength of dry set plaster. J. Mater. Sci. 1994, 29, 4611–4617. [Google Scholar] [CrossRef]
- Haach, V.G.; Carrazedo, R.; Oliveira, L.M.; Corrêa, M.R. Application of acoustic tests to mechanical characterization of masonry mortars. NDT Int. 2013, 59, 18–24. [Google Scholar] [CrossRef]
- Ribeiro, R.S.; de Sousa, R.P.; Amarilla, R.S.D.; Sant’Ana, L.H.; Avelar, M.; Catai, R.E.; Matoski, A. Sound insulation of a hollow concrete blocks wall made with construction and demolition waste and wood-based panels as linings. Build. Acoust. 2021, 28, 423–442. [Google Scholar] [CrossRef]
- Eurocode 6; Design of Masonry Structures. Part 1-1: General Rules for Reinforced and Unreinforced Masonry Structures. Technical Report. European Committee for Standardization: Brussels, Belgium, 2005.
- Broyles, J.M.; Shepherd, M.R.; Brown, N.C. Evaluation of the dynamic response for scaled models of shaped concrete floor slabs. Build. Acoust. 2023, 30, 143–163. [Google Scholar] [CrossRef]
- Gidrao, G.d.M.S.; Carrazedo, R.; Bosse, R.M.; Silvestro, L.; Ribeiro, R.; de Souza, C.F.P. Numerical Modeling of the Dynamic Elastic Modulus of Concrete. Materials 2023, 16, 3955. [Google Scholar] [CrossRef]
- Makoond, N.; Cabané, A.; Pelà, L.; Molins, C. Relationship between the static and dynamic elastic modulus of brick masonry constituents. Constr. Build. Mater. 2020, 259, 120386. [Google Scholar] [CrossRef]
- Messali, F.; Metelli, G.; Plizzari, G. Experimental results on the retrofitting of hollow brick masonry walls with reinforced high performance mortar coatings. Constr. Build. Mater. 2017, 141, 619–630. [Google Scholar] [CrossRef]
- Lucchini, S.S.; Facconi, L.; Minelli, F.; Plizzari, G. Retrofitting unreinforced masonry by steel fiber reinforced mortar coating: Uniaxial and diagonal compression tests. Mater. Struct. 2020, 53, 144. [Google Scholar] [CrossRef]
- Hill, R. A self-consistent mechanics of composite materials. J. Mech. Phys. Solids 1965, 13, 213–222. [Google Scholar] [CrossRef]
- Piattoni, Q.; Quagliarini, E.; Lenci, S. Experimental analysis and modelling of the mechanical behaviour of earthen bricks. Constr. Build. Mater. 2011, 25, 2067–2075. [Google Scholar] [CrossRef]
- Santoni, A.; Bonfiglio, P.; Mollica, F.; Fausti, P.; Pompoli, F.; Mazzanti, V. Vibro-acoustic optimisation of Wood Plastic Composite systems. Constr. Build. Mater. 2018, 174, 730–740. [Google Scholar] [CrossRef]
- Nilsson, A.; Liu, B. Vibro-Acoustics; Science Press: Beijing, China, 2015; Volume 1. [Google Scholar]
- Vigran, T.E. Building Acoustics, 1st ed.; Taylor & Francis: Abingdon, UK, 2008. [Google Scholar]
- CYPE Ingenieros S.A. CYPE Architecture Software, version 2024.b; CYPE: Alicante, Spain, 2024. [Google Scholar]
- CYPE Ingenieros S.A. CYPE Open BIM Analytical Model, version 2024.b; CYPE: Alicante, Spain, 2024. [Google Scholar]
- ISO 3382-2; Acoustics—Measurement of Room Acoustic Parameters—Part 2: Reverberation Time in Ordinary Rooms. Technical Report. International Organization for Standardization ISO: Geneva, Switzerland, 2008.
- Berzborn, M.; Bomhardt, R.; Klein, J.; Richter, J.G.; Vorländer, M. The ITA-Toolbox: An Open Source MATLAB Toolbox for Acoustic Measurements and Signal Processing. In Proceedings of the 43th Annual German Congress on Acoustics, Kiel, Germany, 6–9 March 2017. [Google Scholar]
- ISO 717-1; Acoustics—Rating of Sound Insulation in Buildings and of Building Elements. Part 1: Airborne Sound Insulation. Technical Report. International Organization for Standardization ISO: Geneva, Switzerland, 2020.
- ISO 12999-1; Acoustics—Determination and Application of Measurement Uncertainties in Building Acoustics—Part 1: Sound Insulation. Technical Report. International Organization for Standardization ISO: Geneva, Switzerland, 2020.
- Fringuellino, M.; Smith, R. Sound Transmission through Hollow Brick Walls. Build. Acoust. 1999, 6, 211–224. [Google Scholar] [CrossRef]
- Klippel, S.; Labres, H.S.; Pacheco, F.; Oliveira, M.F.d.; Tutikian, B.F. Influência da espessura de revestimentos de argamassa no desempenho acústico de alvenarias de blocos cerâmicos. Ambiente Construído 2019, 19, 145–156. [Google Scholar] [CrossRef]
- Garg, N.; Saxena, T.; Kumar, A.; Maji, S. Uncertainty evaluation and implications of spectrum adaption terms in determining the airborne sound insulation in building elements. Noise Control Eng. J. 2014, 62, 333–343. [Google Scholar] [CrossRef]
- Scrosati, C.; Scamoni, F.; Bassanino, M.; Mussin, M.; Zambon, G. Uncertainty analysis by a Round Robin Test of field measurements of sound insulation in buildings: Single numbers and low frequency bands evaluation—Airborne sound insulation. Noise Control Eng. J. 2013, 61, 291–306. [Google Scholar] [CrossRef]
- Gajjar, P.N.; Ali, M.; Sayet, T.; Gasser, A.; Blond, E.; Pereira, J.M.; Lourenço, P.B. Numerical study on the nonlinear thermomechanical behaviour of refractory masonry with dry joints. Eng. Struct. 2023, 291, 116468. [Google Scholar] [CrossRef]
- Arroyo, F.; Christoforo, A.; Salvini, V.; Pelissari, P.; Pandolfelli, V.; Luz, A.; Cardoso, C. Development of plaster foam for thermal and acoustic applications. Constr. Build. Mater. 2020, 262, 120800. [Google Scholar] [CrossRef]
Disclaimer/Publisher’s Note: The statements, opinions and data contained in all publications are solely those of the individual author(s) and contributor(s) and not of MDPI and/or the editor(s). MDPI and/or the editor(s) disclaim responsibility for any injury to people or property resulting from any ideas, methods, instructions or products referred to in the content. |
© 2024 by the authors. Licensee MDPI, Basel, Switzerland. This article is an open access article distributed under the terms and conditions of the Creative Commons Attribution (CC BY) license (https://creativecommons.org/licenses/by/4.0/).