1. Introduction
The growing population living in urban areas due to the level of affluence of large cities has resulted in several major problems, such as pollution and stormwater runoff during rainy seasons [
1,
2,
3], air pollution [
4], increased noise [
5], global warming [
6,
7], and the emergence of the urban heat island effect [
8], which is caused by a lack of vegetation sites. Urbanized environments with many paved areas and dense buildings cause an increase in temperature, especially at night, when the accumulated heat from these areas is radiated back into the environment [
9]. For this reason, there has been an effort to limit these areas or find other alternatives to them [
10]. In such regions, it can be easily argued that the lack of vegetation causes a remarkable increase in ambient temperatures that affect the thermal comfort conditions of both indoor and outdoor environments [
11]. In this context, greening systems are considered one of the most appropriate sustainable solutions to eliminate these problems. Greening systems consist mainly of vegetated roofs—green roofs—and vegetated wall structures [
12,
13]. The spread of environmental awareness has led to the effective use of these systems to improve the performance of buildings not only in terms of an efficient use of energy, but also in terms of desirable indoor and outdoor environments. Therefore, the integration of green building systems into urban areas has great potential to enhance the quality of the urban environment [
14].
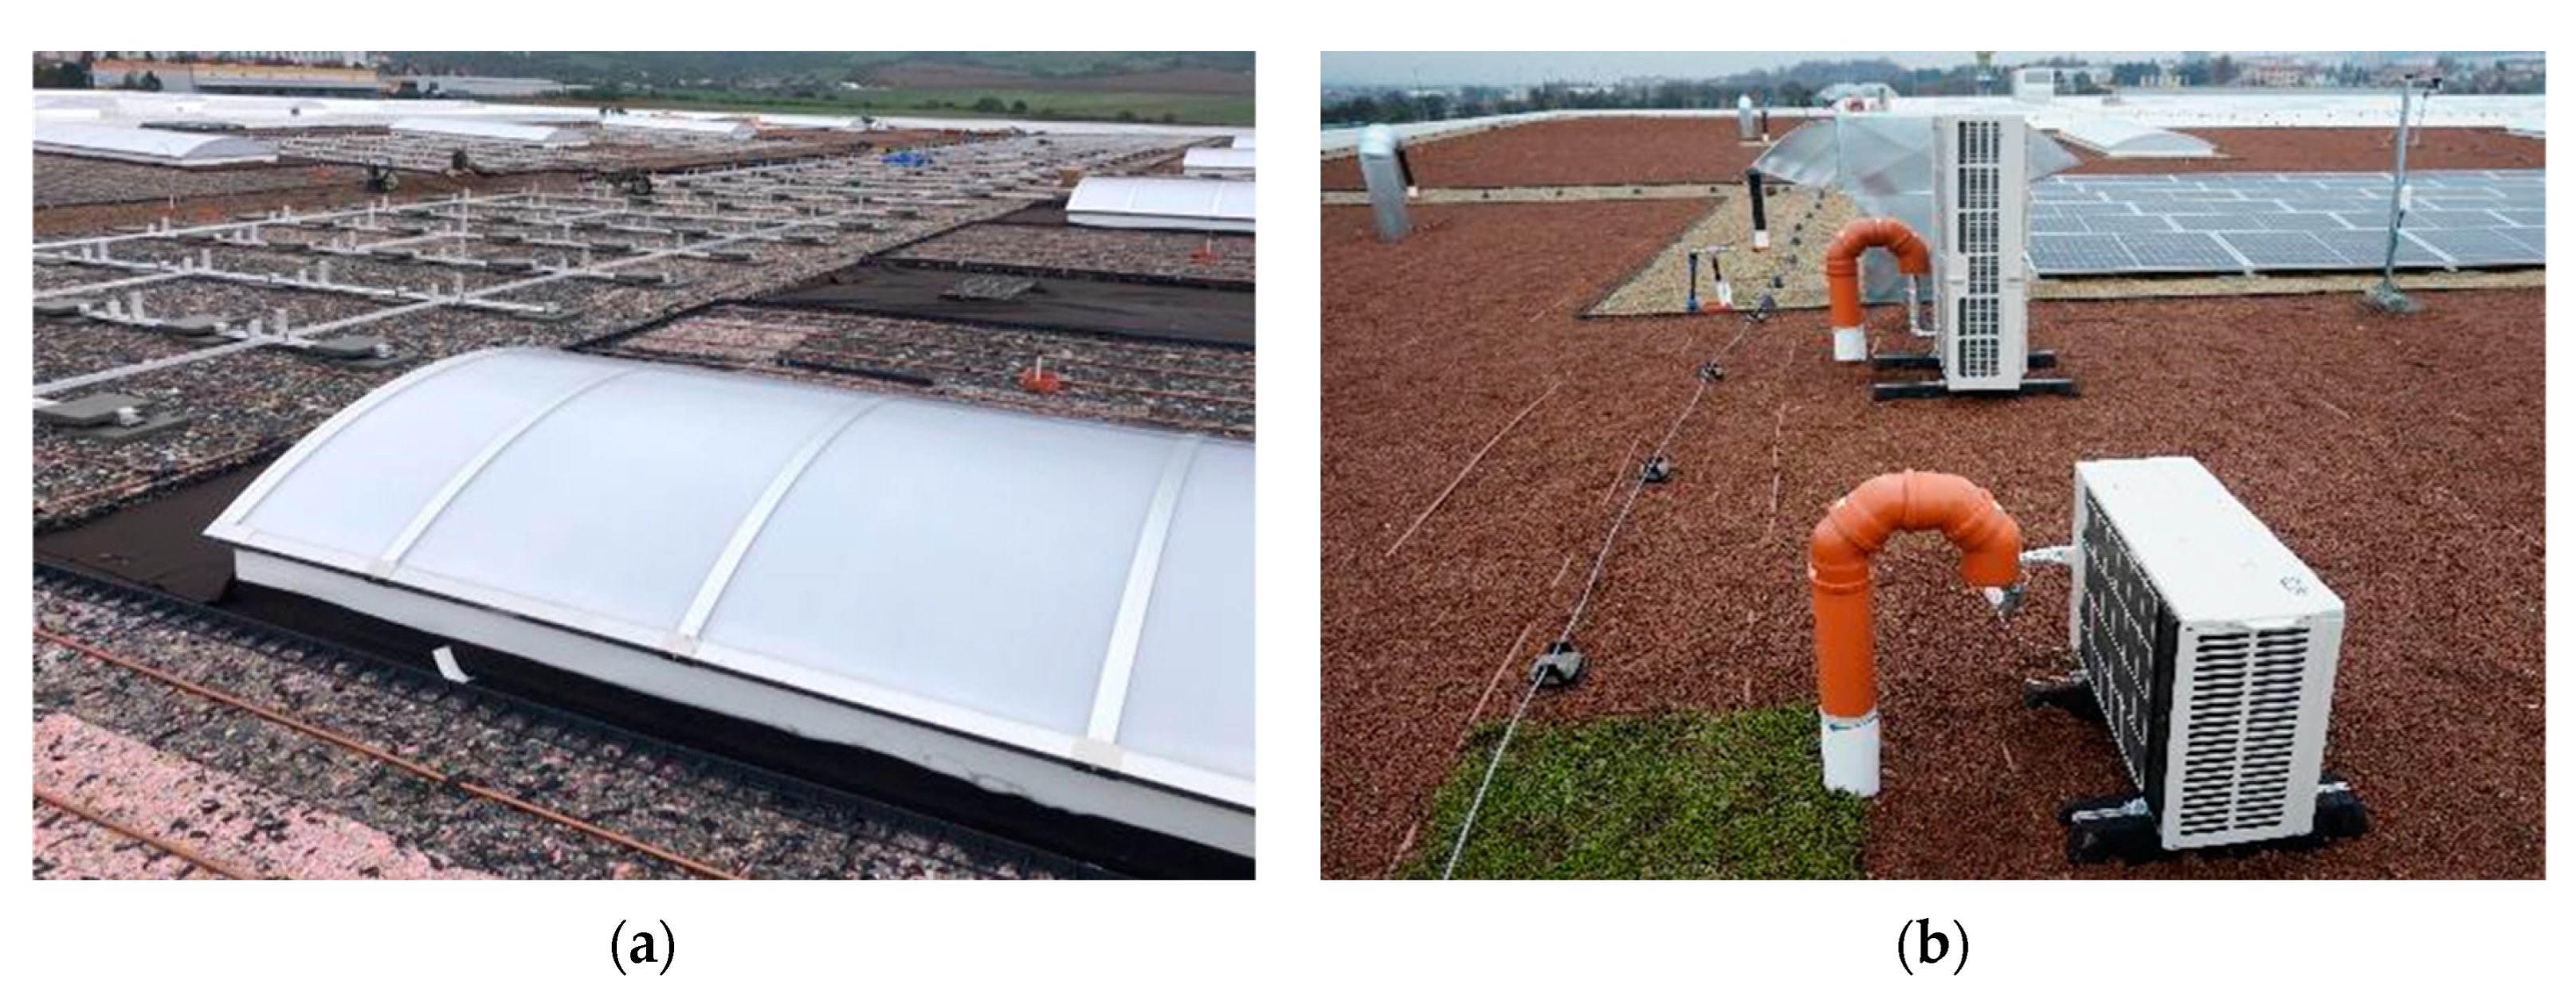
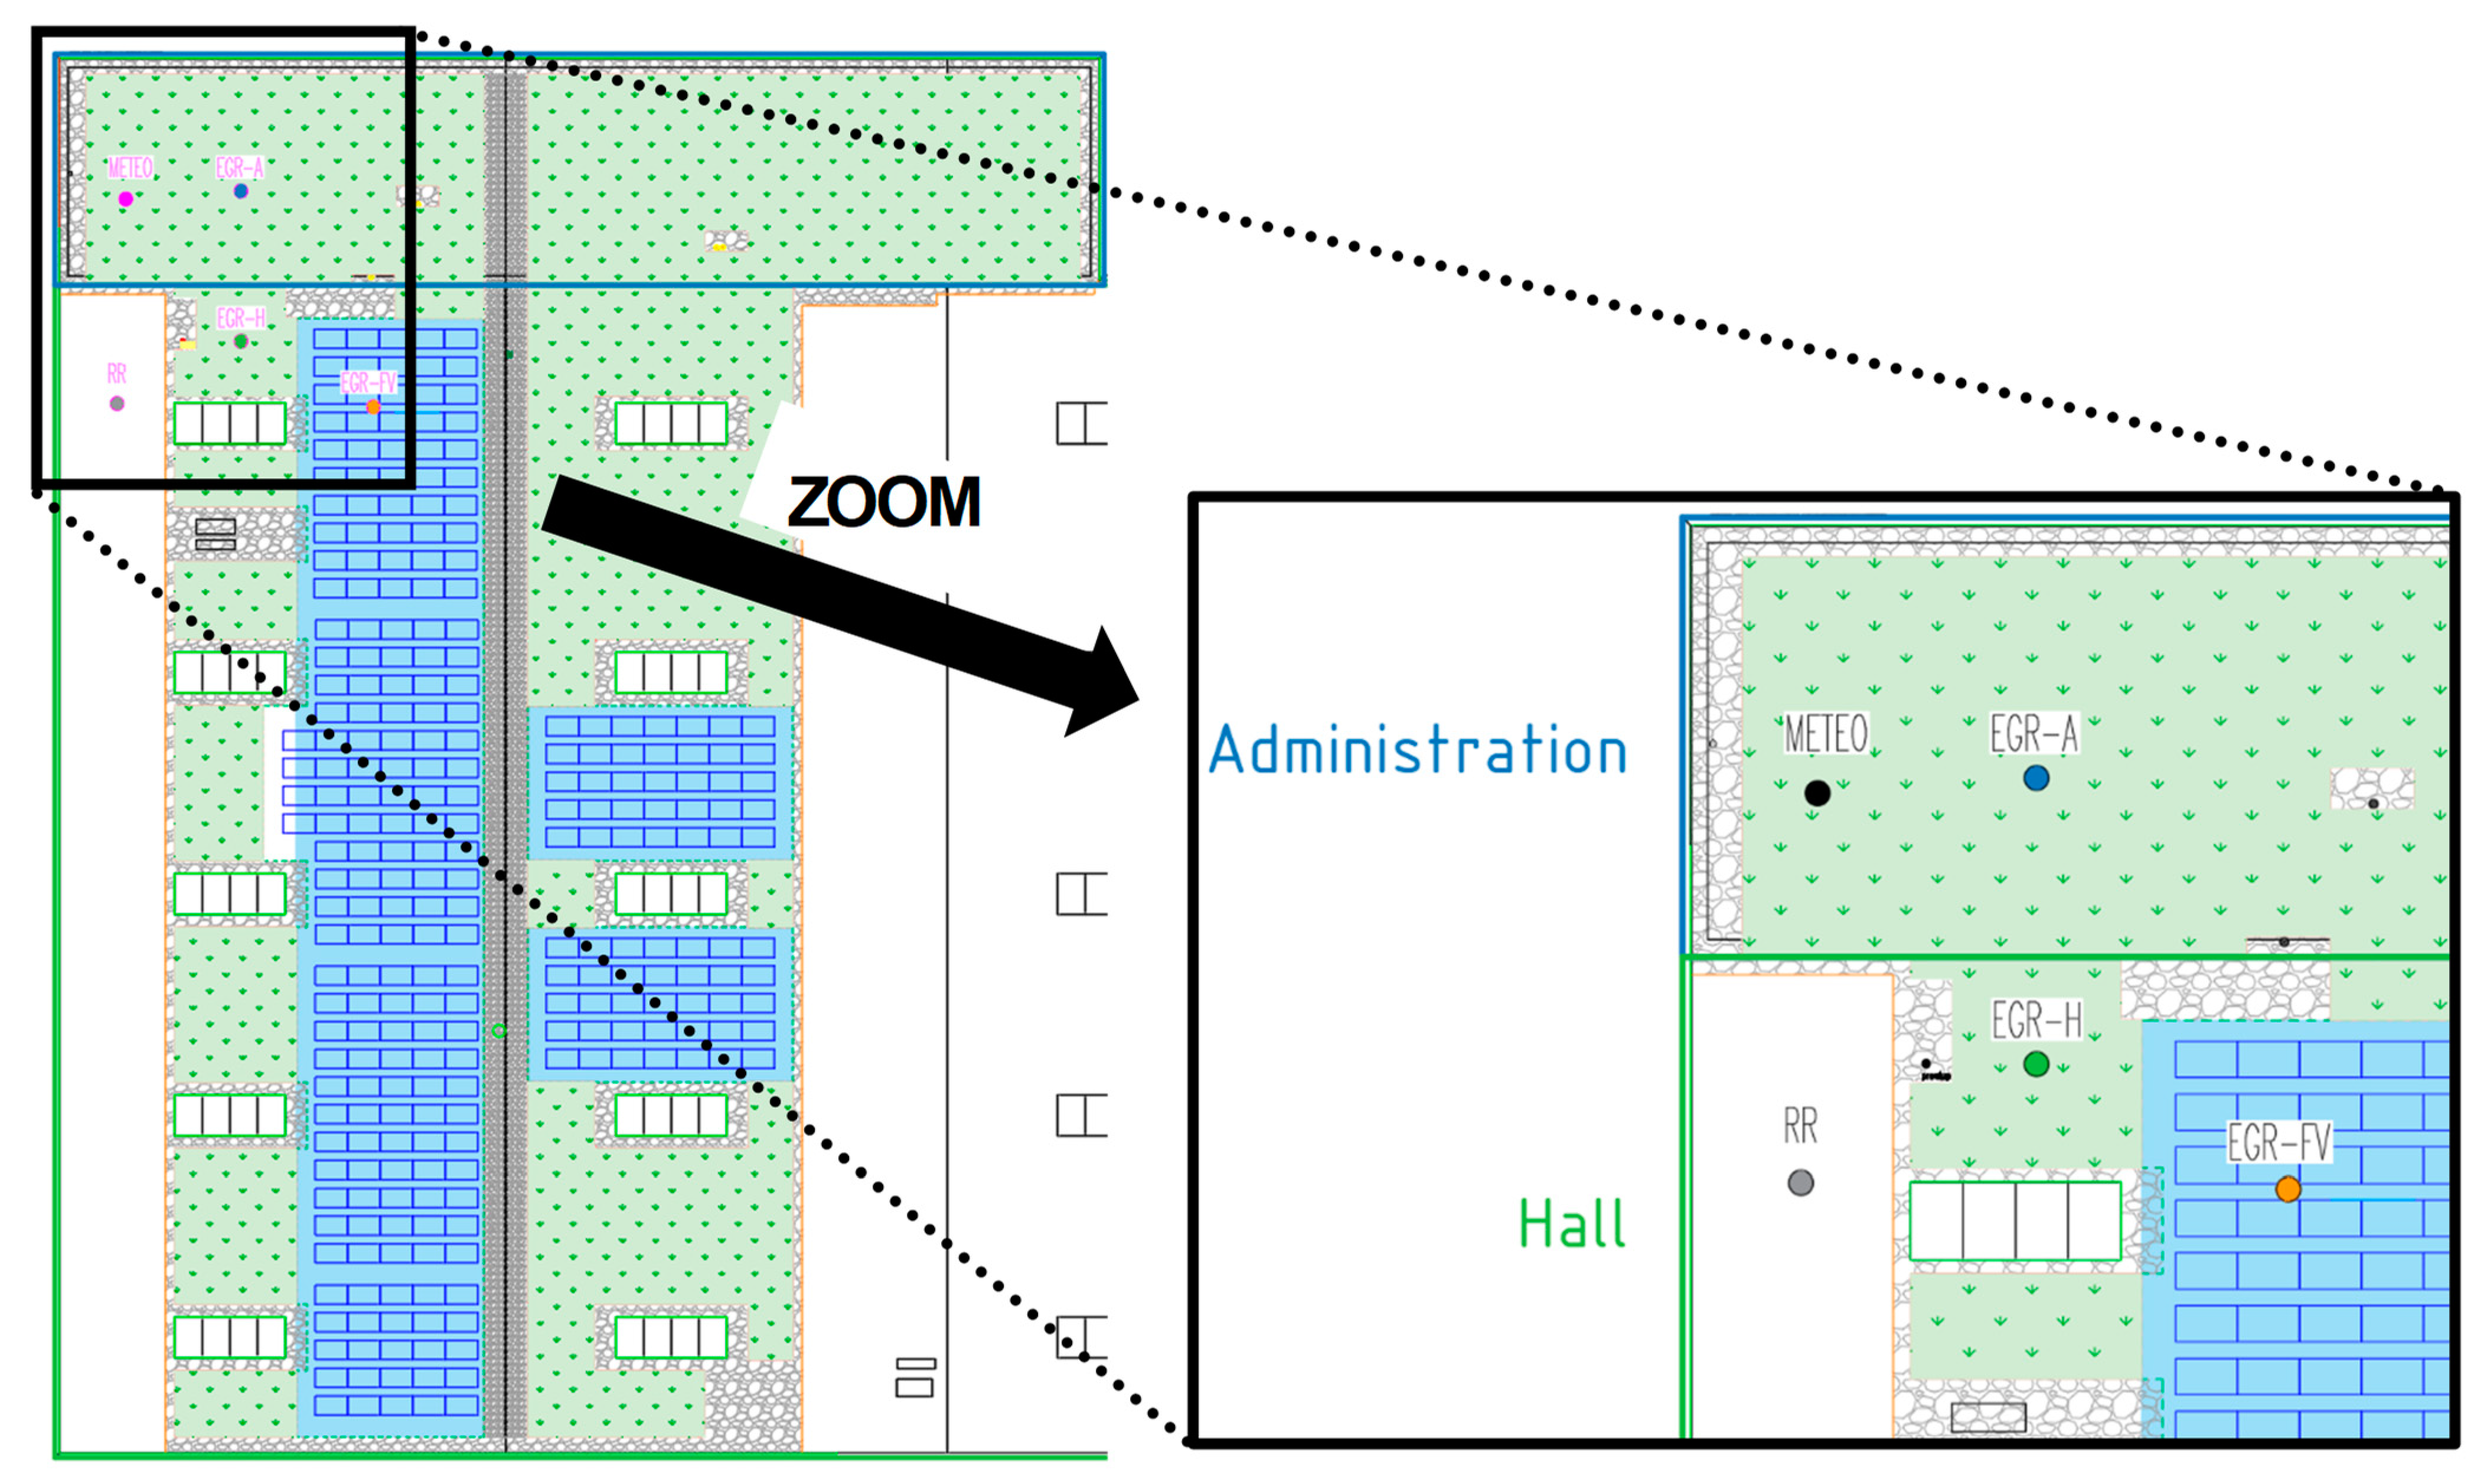
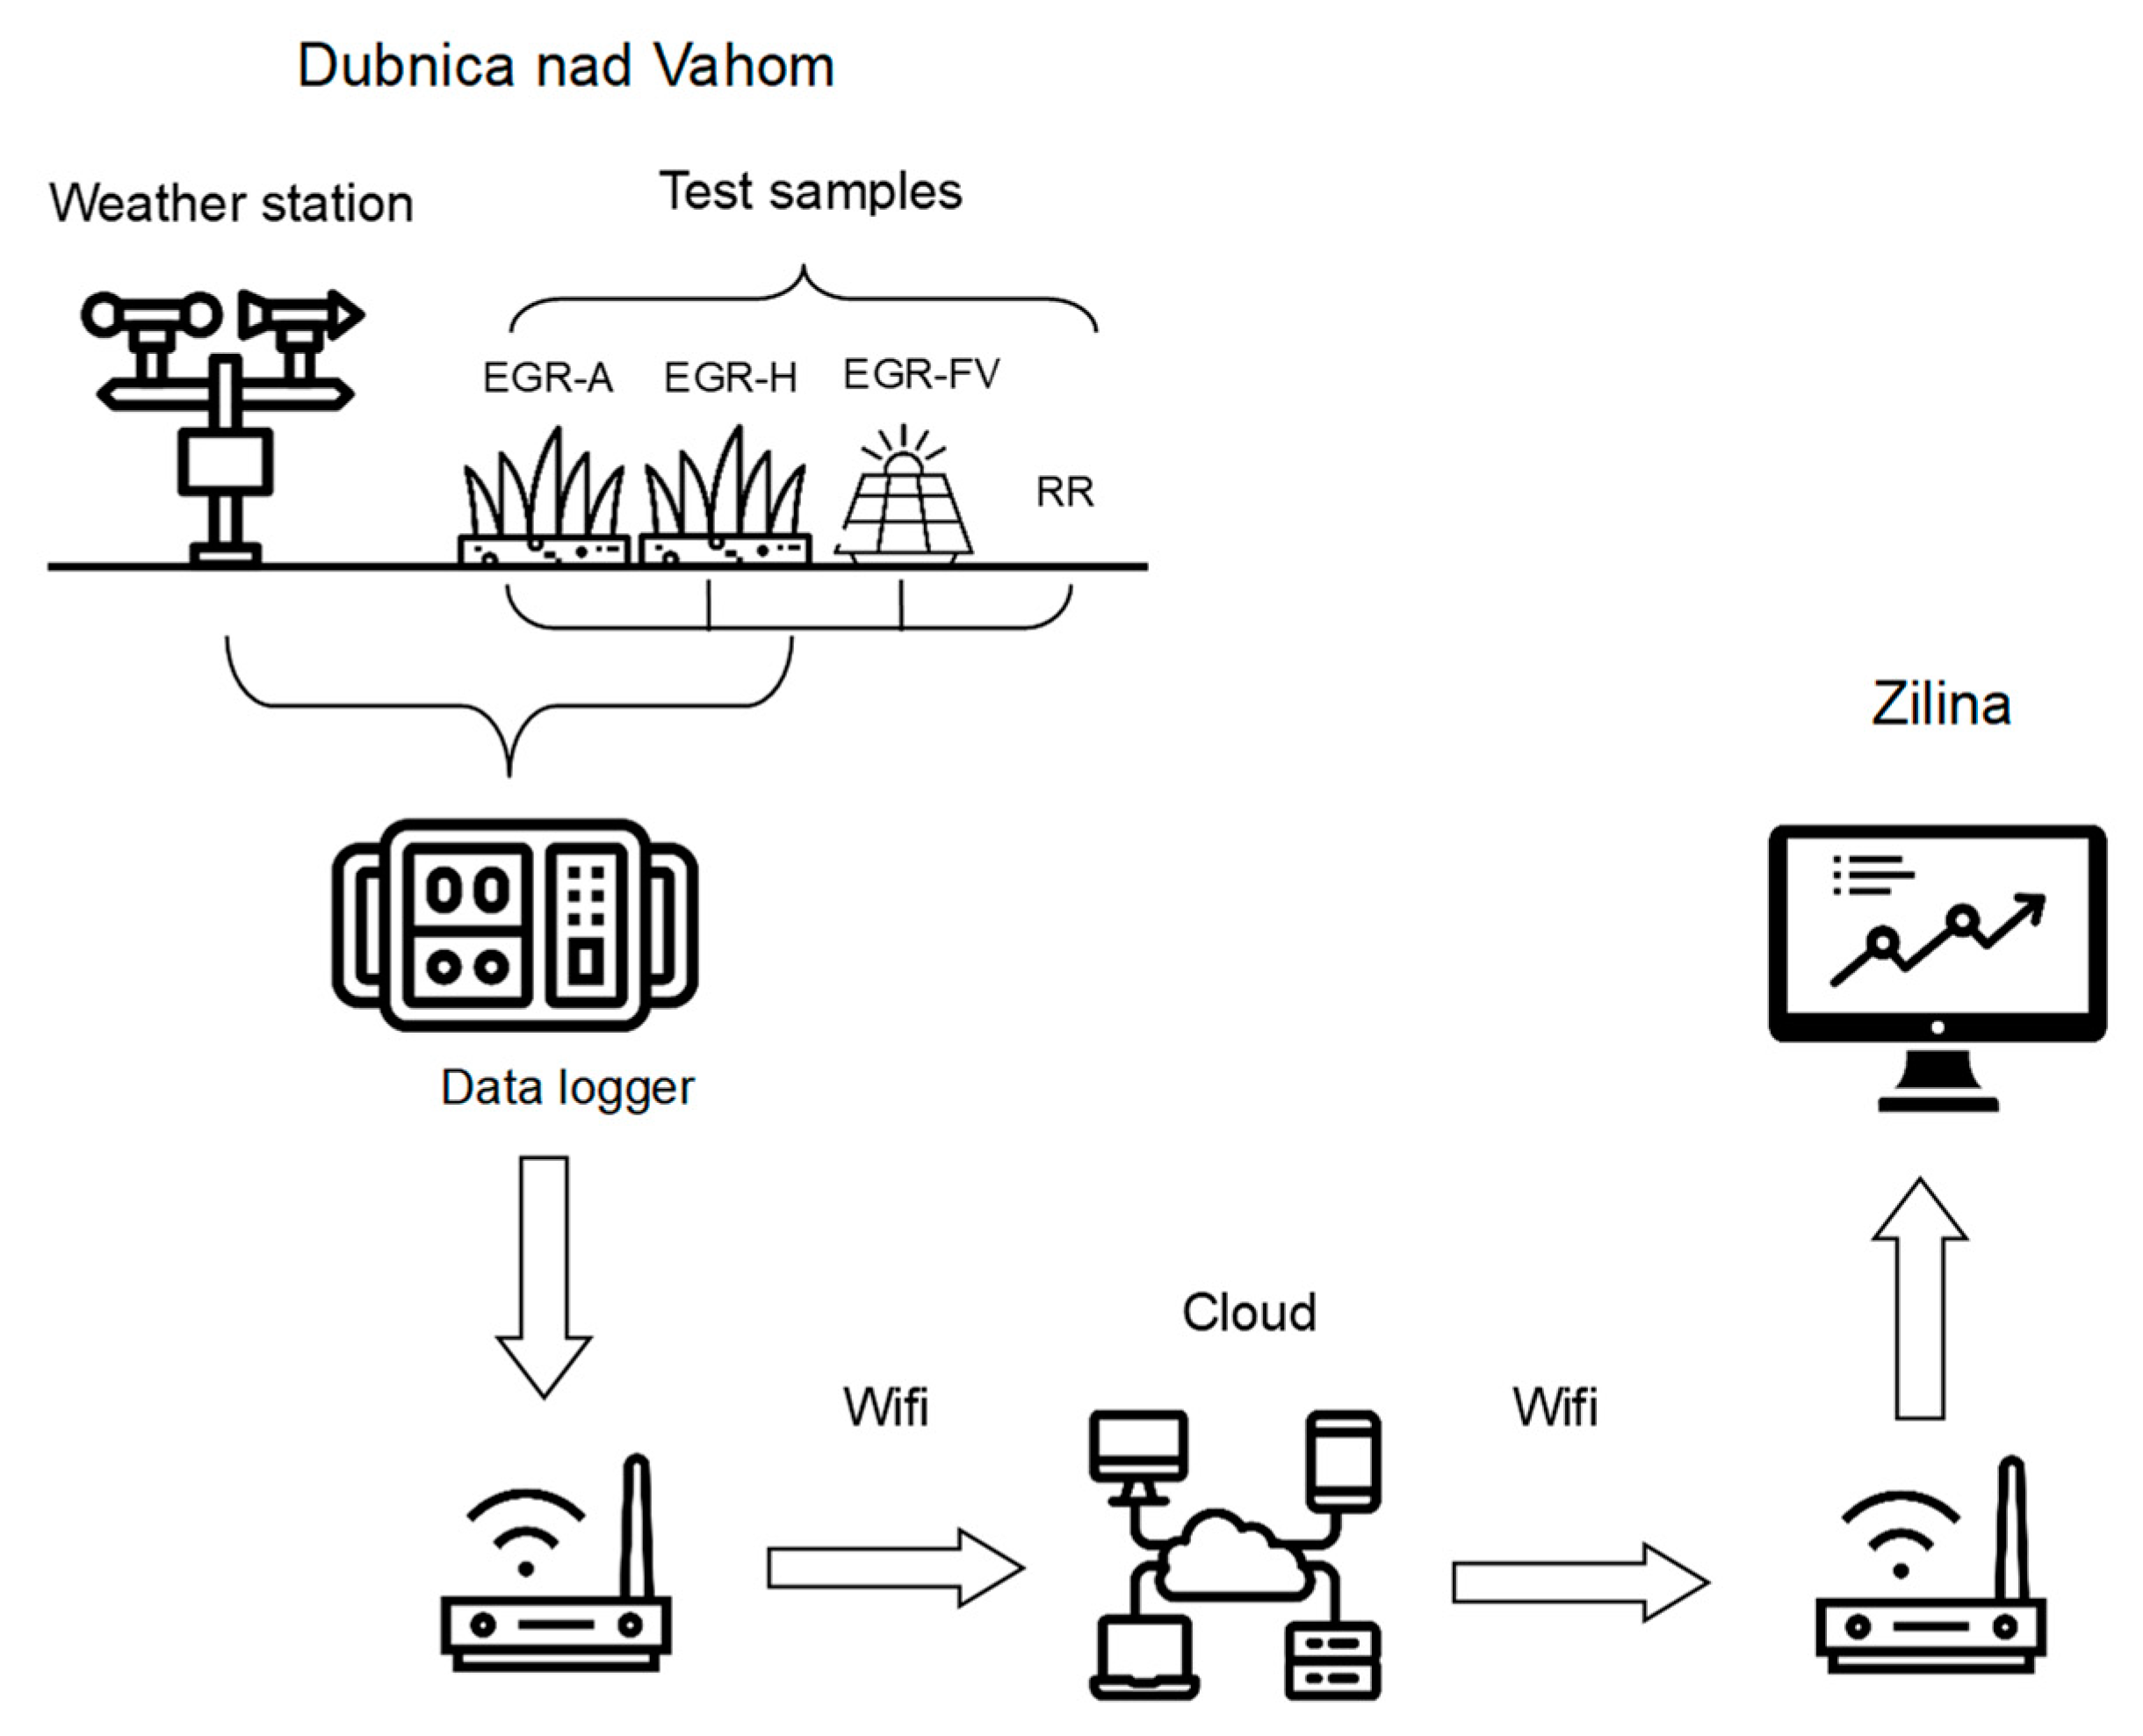
At the Department of Building Engineering and Urban Planning (DBEUP), Faculty of Civil Engineering (FCE), University of Žilina (UNIZA), samples of green roofs have been tested for a long time. The individual test samples of the extensive green roofs (EGRs) used have different compositions. The samples are placed on a real single-ply flat roof renovated in 2019 [
15]. Research in the field of green roofs has been carried out in our department for a long time. Previous measurements have focused on local test samples with dimensions of 1.8 m × 1.85 m. These roof samples are made according to system solutions of specific suppliers. Our measurements are mainly concentrated on the analysis of the temperature and water regimes of the summer period and the winter period separately.
Several foreign scientific articles and measurements confirm the suitability of the application of green roofs, with comparable results [
16,
17]. Most of the results confirm the evaporative cooling effects and the optimization of the temperature regime of green roofs in the summer period and the energy savings [
18] in the winter period due to the additional layers of vegetation. Green roofs also have positive impacts on the stabilisation of thermal comfort in the summer period. They dampen the maximum oscillations, in terms of the temperature regime, in the roof structure’s composition [
19]. Several factors and boundary conditions have an important role in the behaviour and impact of green roofs on buildings and their immediate surroundings. These are mainly the location of the studied sample, the composition of the vegetation layer, the water storage capacity and, finally, the vegetation density of the sample [
20,
21,
22,
23,
24,
25,
26]. However, there are also cases where the application of vegetation layers to a roof structure did not significantly impact a building or its surroundings [
27]. This is particularly the case in more northern countries, where roofs have a large amount of thermal insulation and thus the effect of the extensive green roof on the indoor environment is lost. However, high daily fluctuations in surface temperature have a negative effect on the service life of the waterproofing membrane, due to expansion and contraction of the material. The waterproofing membrane is also exposed to direct UV radiation, which also has a negative effect on its durability. An additional protective layer on the waterproofing membrane creates natural shading and reduces these fluctuations. However, as the temperature tends to be reduced in these northern locations, the significant cooling and humidification benefits of green roofs do not have a significant role [
28].
In the summer months, the focus is on a comparison between irrigated and non-irrigated samples to demonstrate the benefits of actively irrigated vegetation structures [
29,
30]. Since extensive green roofs are designed to be maintenance-free, or with minimal maintenance requirements, the absence of water in their composition significantly affects the thermal performance of the vegetation structure. Vegetated structures can absorb large amounts of solar radiation incident on their surface and transform it into latent heat. This cooling process, known as evapotranspiration, can not only significantly affect the microclimate of its immediate surroundings, but also the overall temperature pattern in the structure’s composition. As demonstrated in [
30], the difference in surface temperatures between the actively irrigated sample and the non-irrigated sample was more than 6 °C and up to 8 °C at the waterproofing level. From this paper, it is possible to see significant differences in the roofs’ leaf area index (LAI) value. The sample without vegetation, which had a significantly darker surface than the remaining samples, overheated more. The paper [
29] further analysed the behaviour of the samples in the period after manual irrigation in the dry season, during warm summer days. The maximum temperatures at the waterproofing level were 60 °C for the reference roof, 47 °C for the roof with gravel backfill and less than 30 °C for the vegetated roof. The daily temperature amplitudes also decreased significantly.
In winter, on the other hand, the focus has been on reducing the sub-cooling of the individual layers in the structure’s composition [
31,
32]. In particular, temperature progression at the waterproofing level has been observed. During this period, a large temperature oscillation occurs, which, together with direct solar radiation and UV radiation, can degrade the coating over time and thus render the roof structure non-functional. The dominant factor in the temperature regime of the roof structure has been shown to be the presence of snow cover—particularly fresh powdery snow. In this period, the difference between the different variants of the extensive green roof was almost zero. A significant difference occurred between the comparisons of the green roof and the reference roof—a roof without a vegetation layer. The paper [
31] again points out the temperature difference between the roof variants with a vegetation layer and without a vegetation layer. The daily temperature amplitude at the waterproofing in the snow-free period was 37 °C for the reference roof, while only 0.4 °C for the green roof. The difference in heat loss was more than 50%. In the period with snow, the daily amplitude of the temperature at the waterproofing was 9.2 °C for the reference roof, while only 0.5 °C for the green roof. The difference in heat loss in this case was only 8%.
The aim of this research is to confirm or disconfirm some of the hypotheses and results of the research on extensive green roofs in the Central European region. The results and the evaluation of this study are determined by the measured data obtained, observing the influence of outdoor climates on the temperature regime of roof structures. By analysing seasonality, it is possible to determine the suitability of using extensive vegetated roofs in different seasons. The aim is to illustrate their proven benefits in winter and summer. The authors attempt to confirm or disconfirm observations made from other measurements as well as their own research in the field of vegetated roofs in the region. In particular, attention has been focused on the effect of the leaf area index on shading and transpiration cooling with respect to the temperature pattern in the roof structures’ composition and the impact of the absence of irrigation during the summer heat. Also, the measurements have focused on determining the benefit of using green roofs and determining the amount of heat transferred through different compositions of them during summer and winter. In the measurements carried out on site, but also in the available literature, the benefits of using evapotranspiration cooling in the summer period are particularly demonstrated. However, does an extensive green roof also have an impact on the building during the winter period?
In this article, not only are the green roof and a reference roof with a waterproofing membrane as its final surface treatment observed and compared, but also the different variants of the green roof itself. The differences are in the location of the test samples, which are located above an administrative area and a production hall, and also in the design of their top layer—both a roof with a vegetation layer and one without vegetation substrate—under photo-voltaic panels. In 2023, periods were selected that represented the winter period with and without snow cover, and periods were selected that represented the summer period during cloudy weather and sunny weather.
3. Results and Discussion
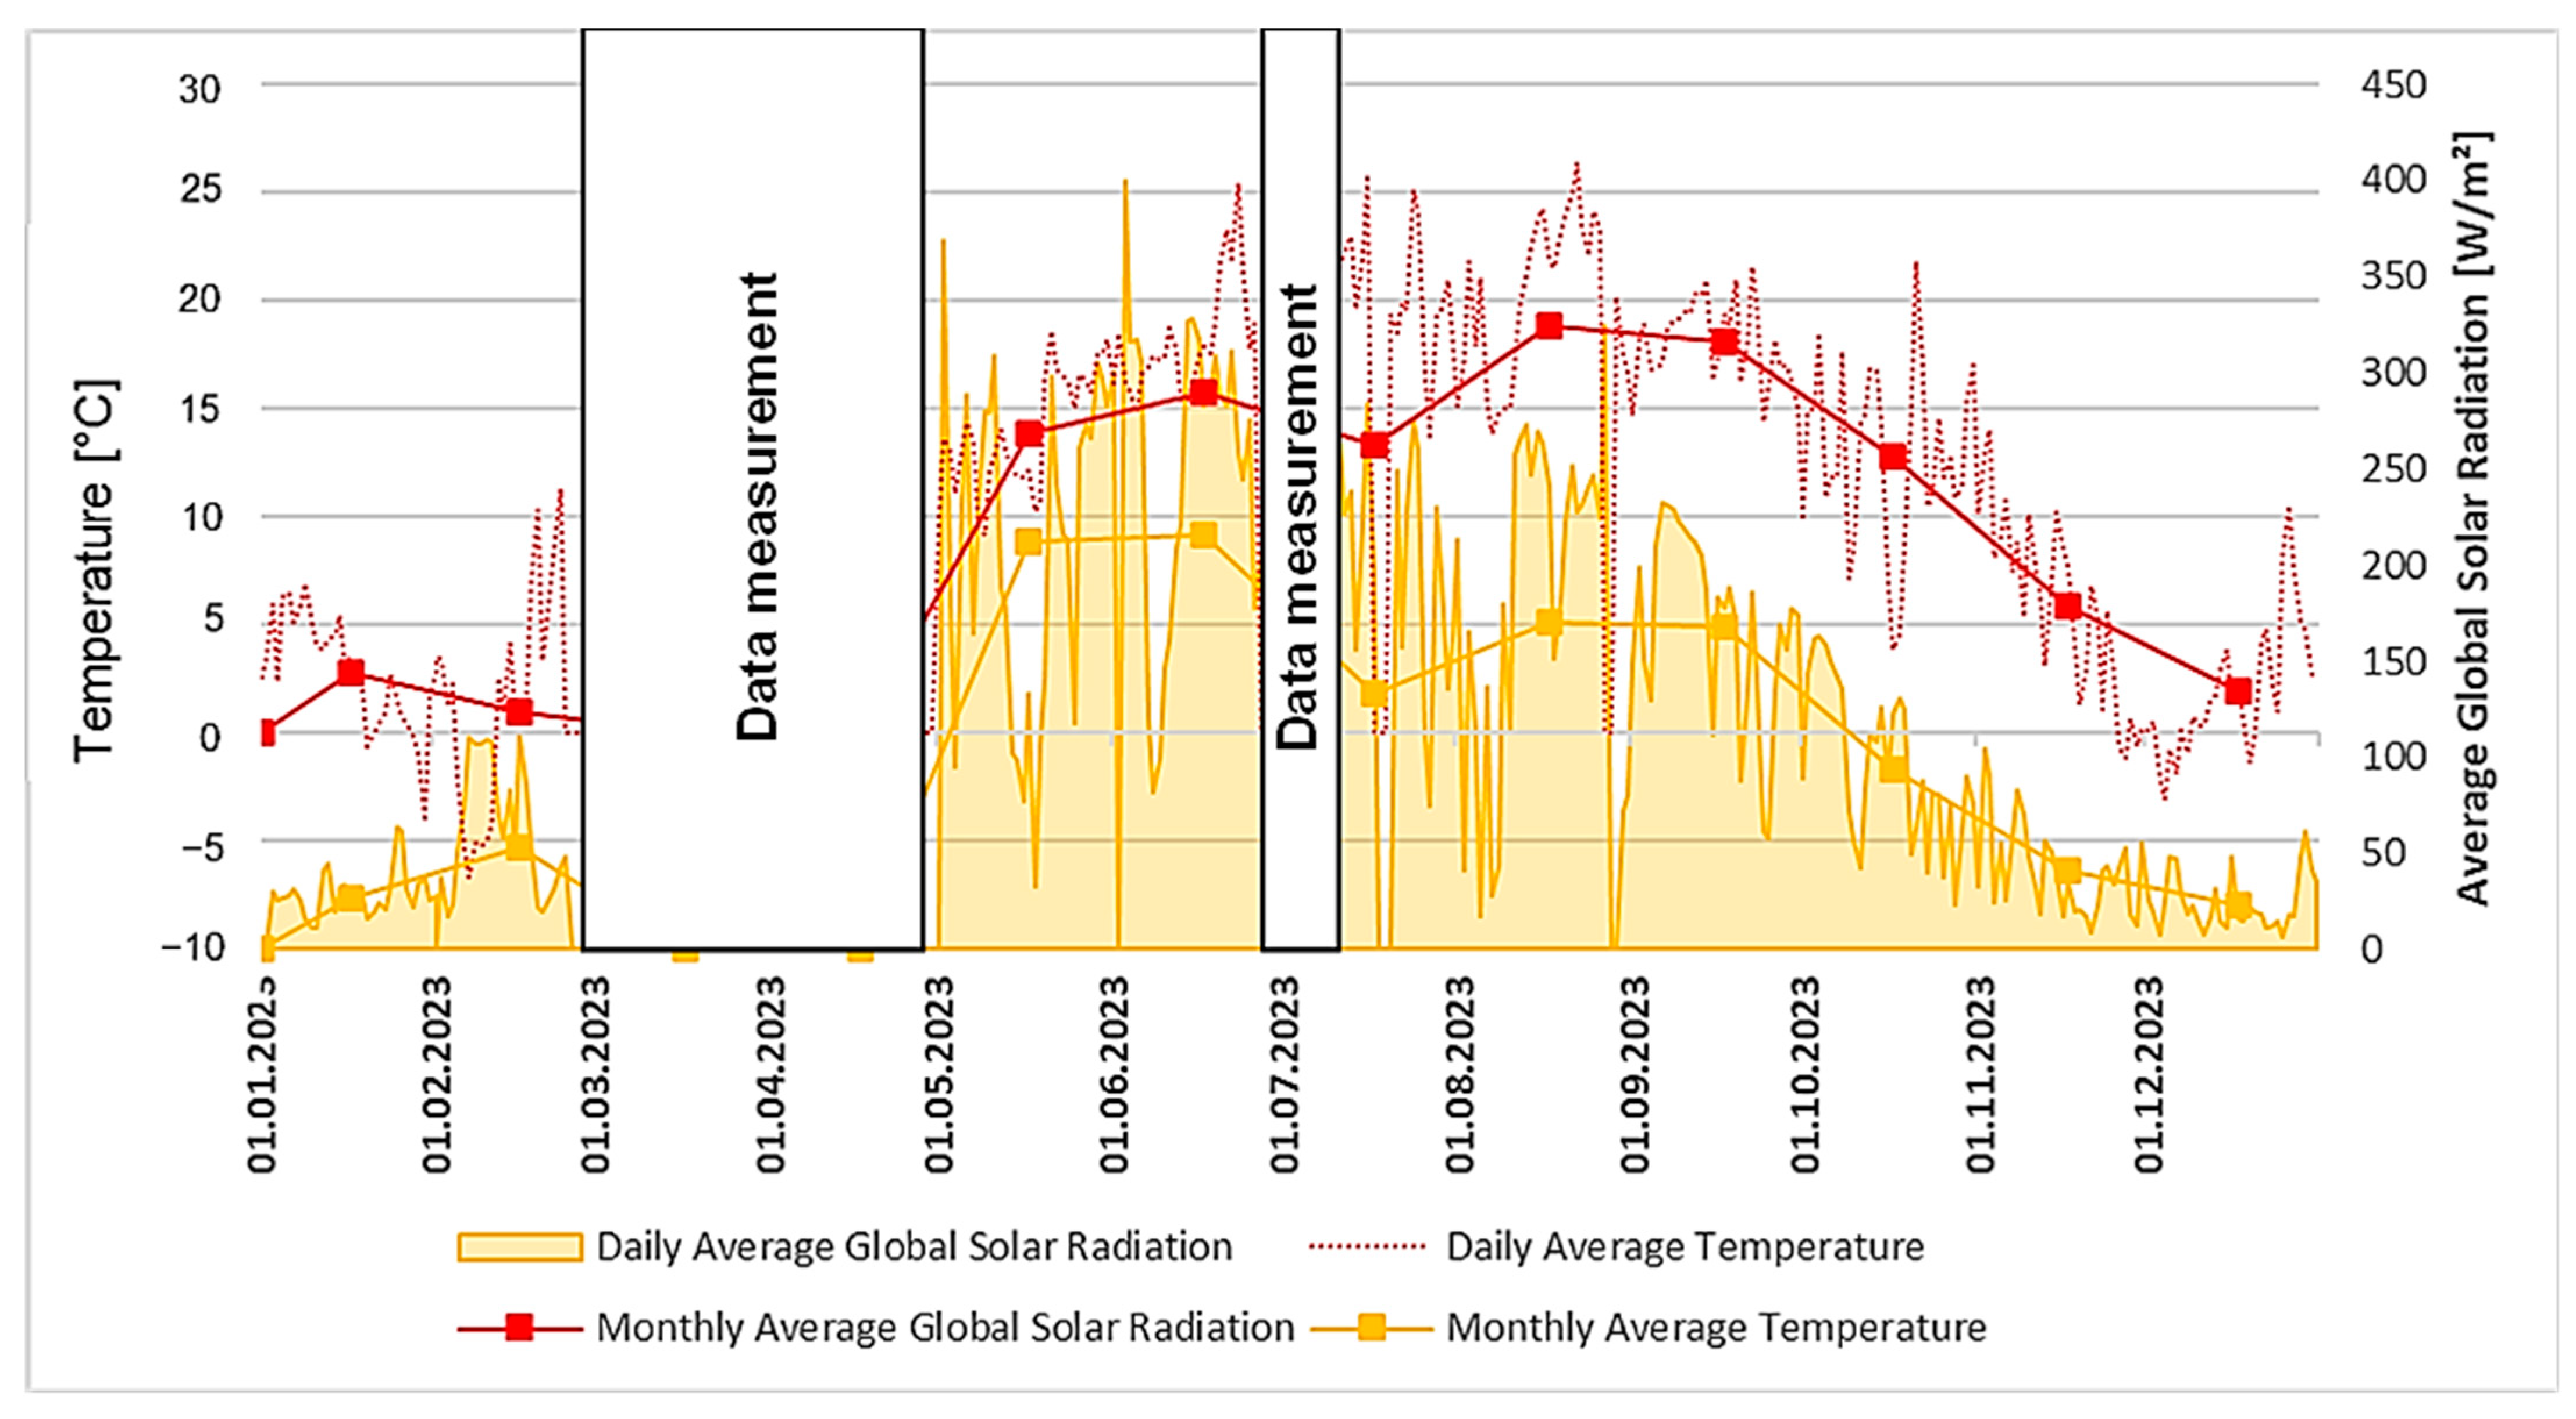
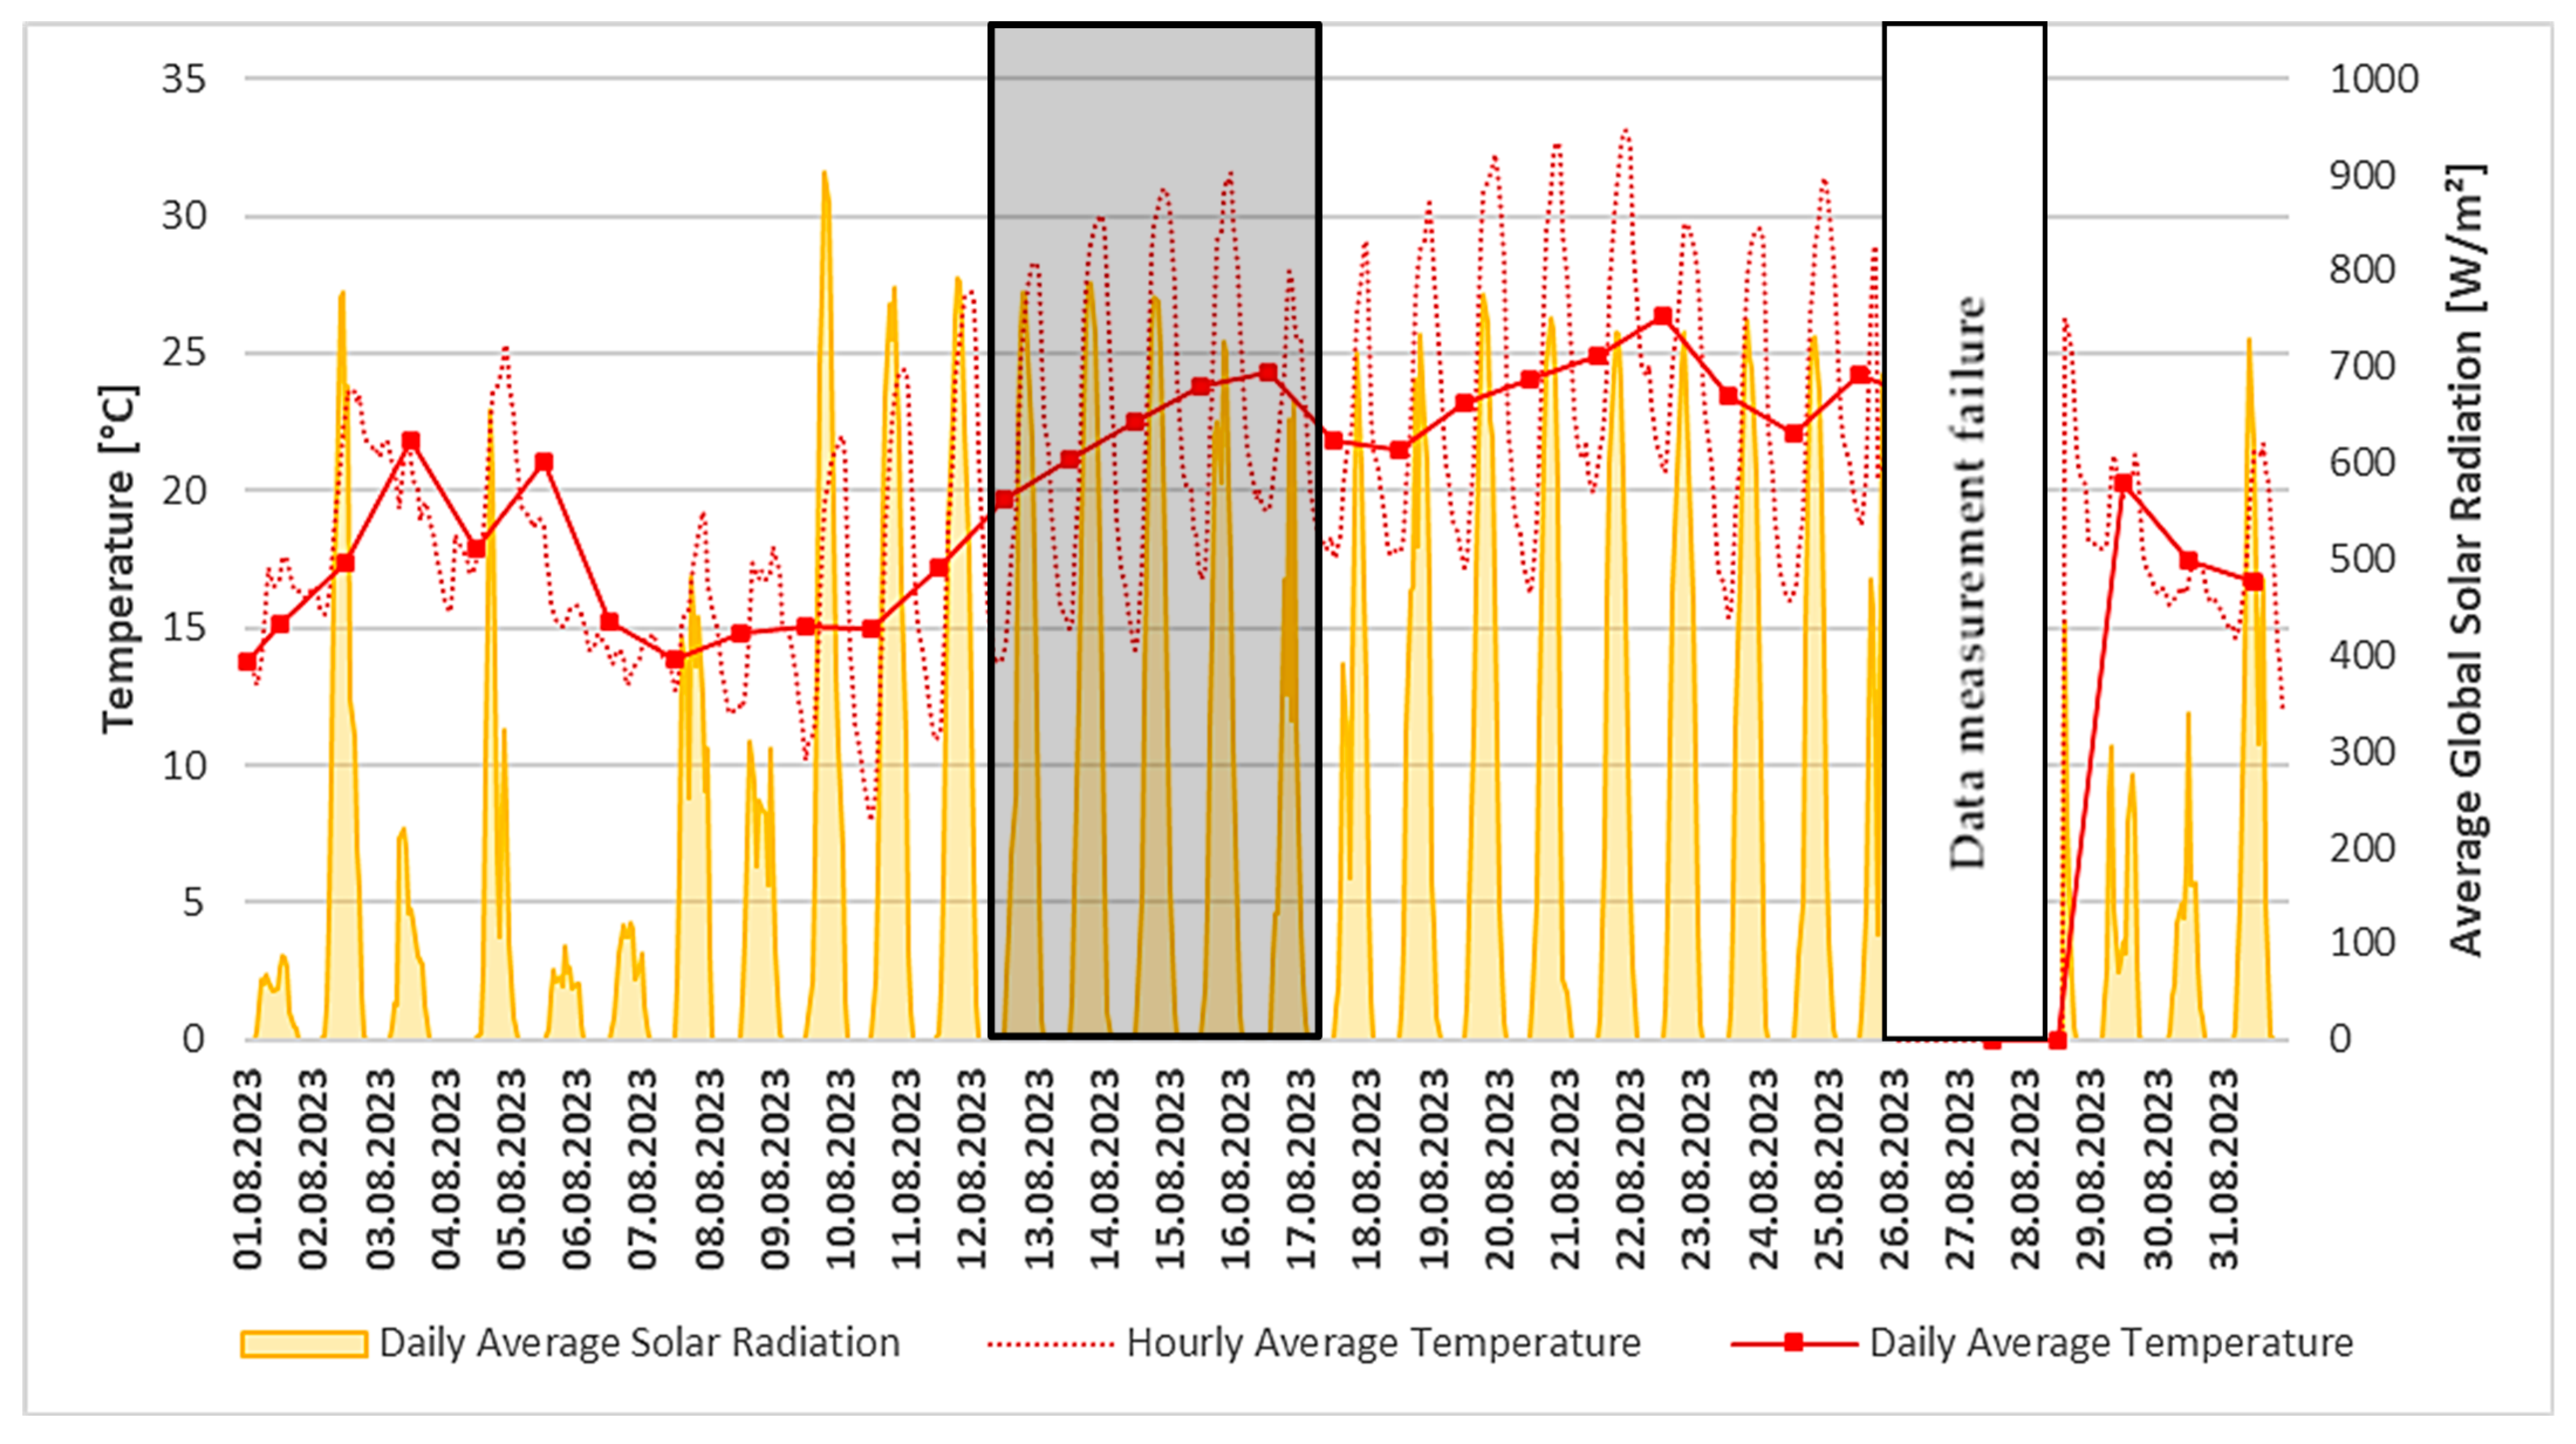
During the duration of this study, the weather station’s data recording was interrupted. A prolonged interruption of the recording took place from March until almost the end of May.
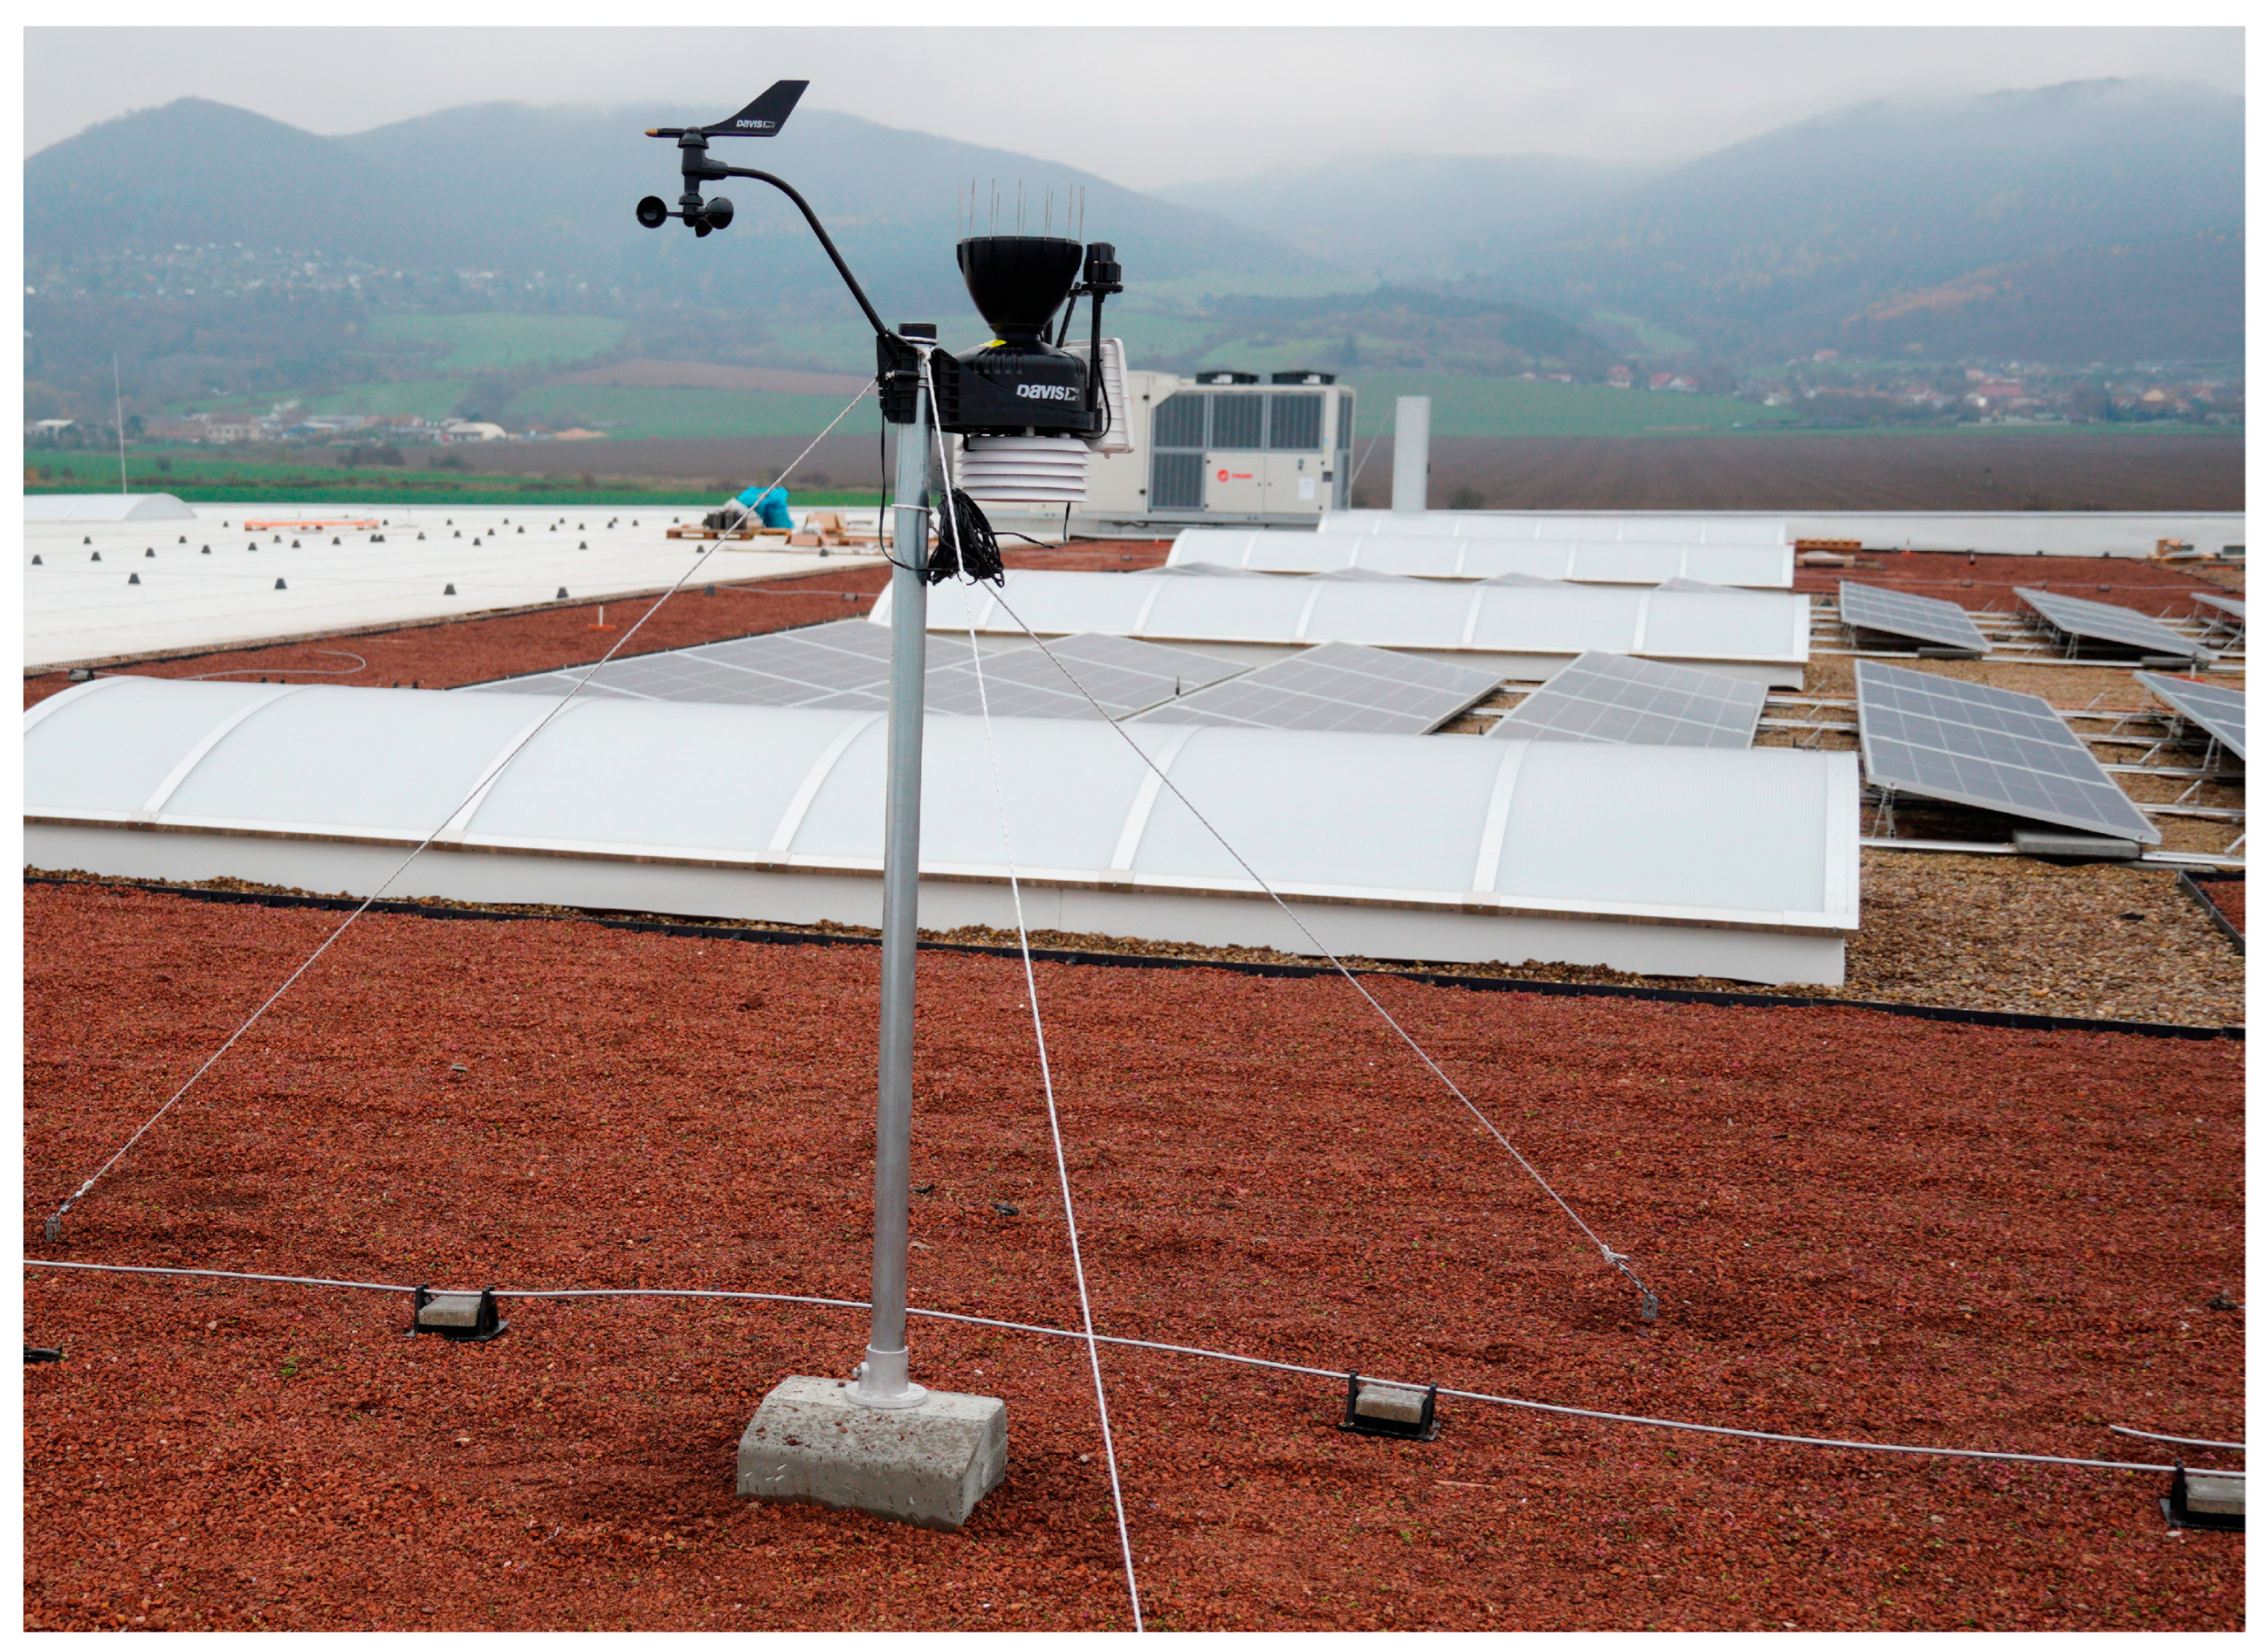
Figure 6 shows the daily and monthly mean values of the outdoor air temperature. Also shown are the daily sums and monthly averages of the solar radiation intensity sums. There are noticeable gaps in data recording on the graph.
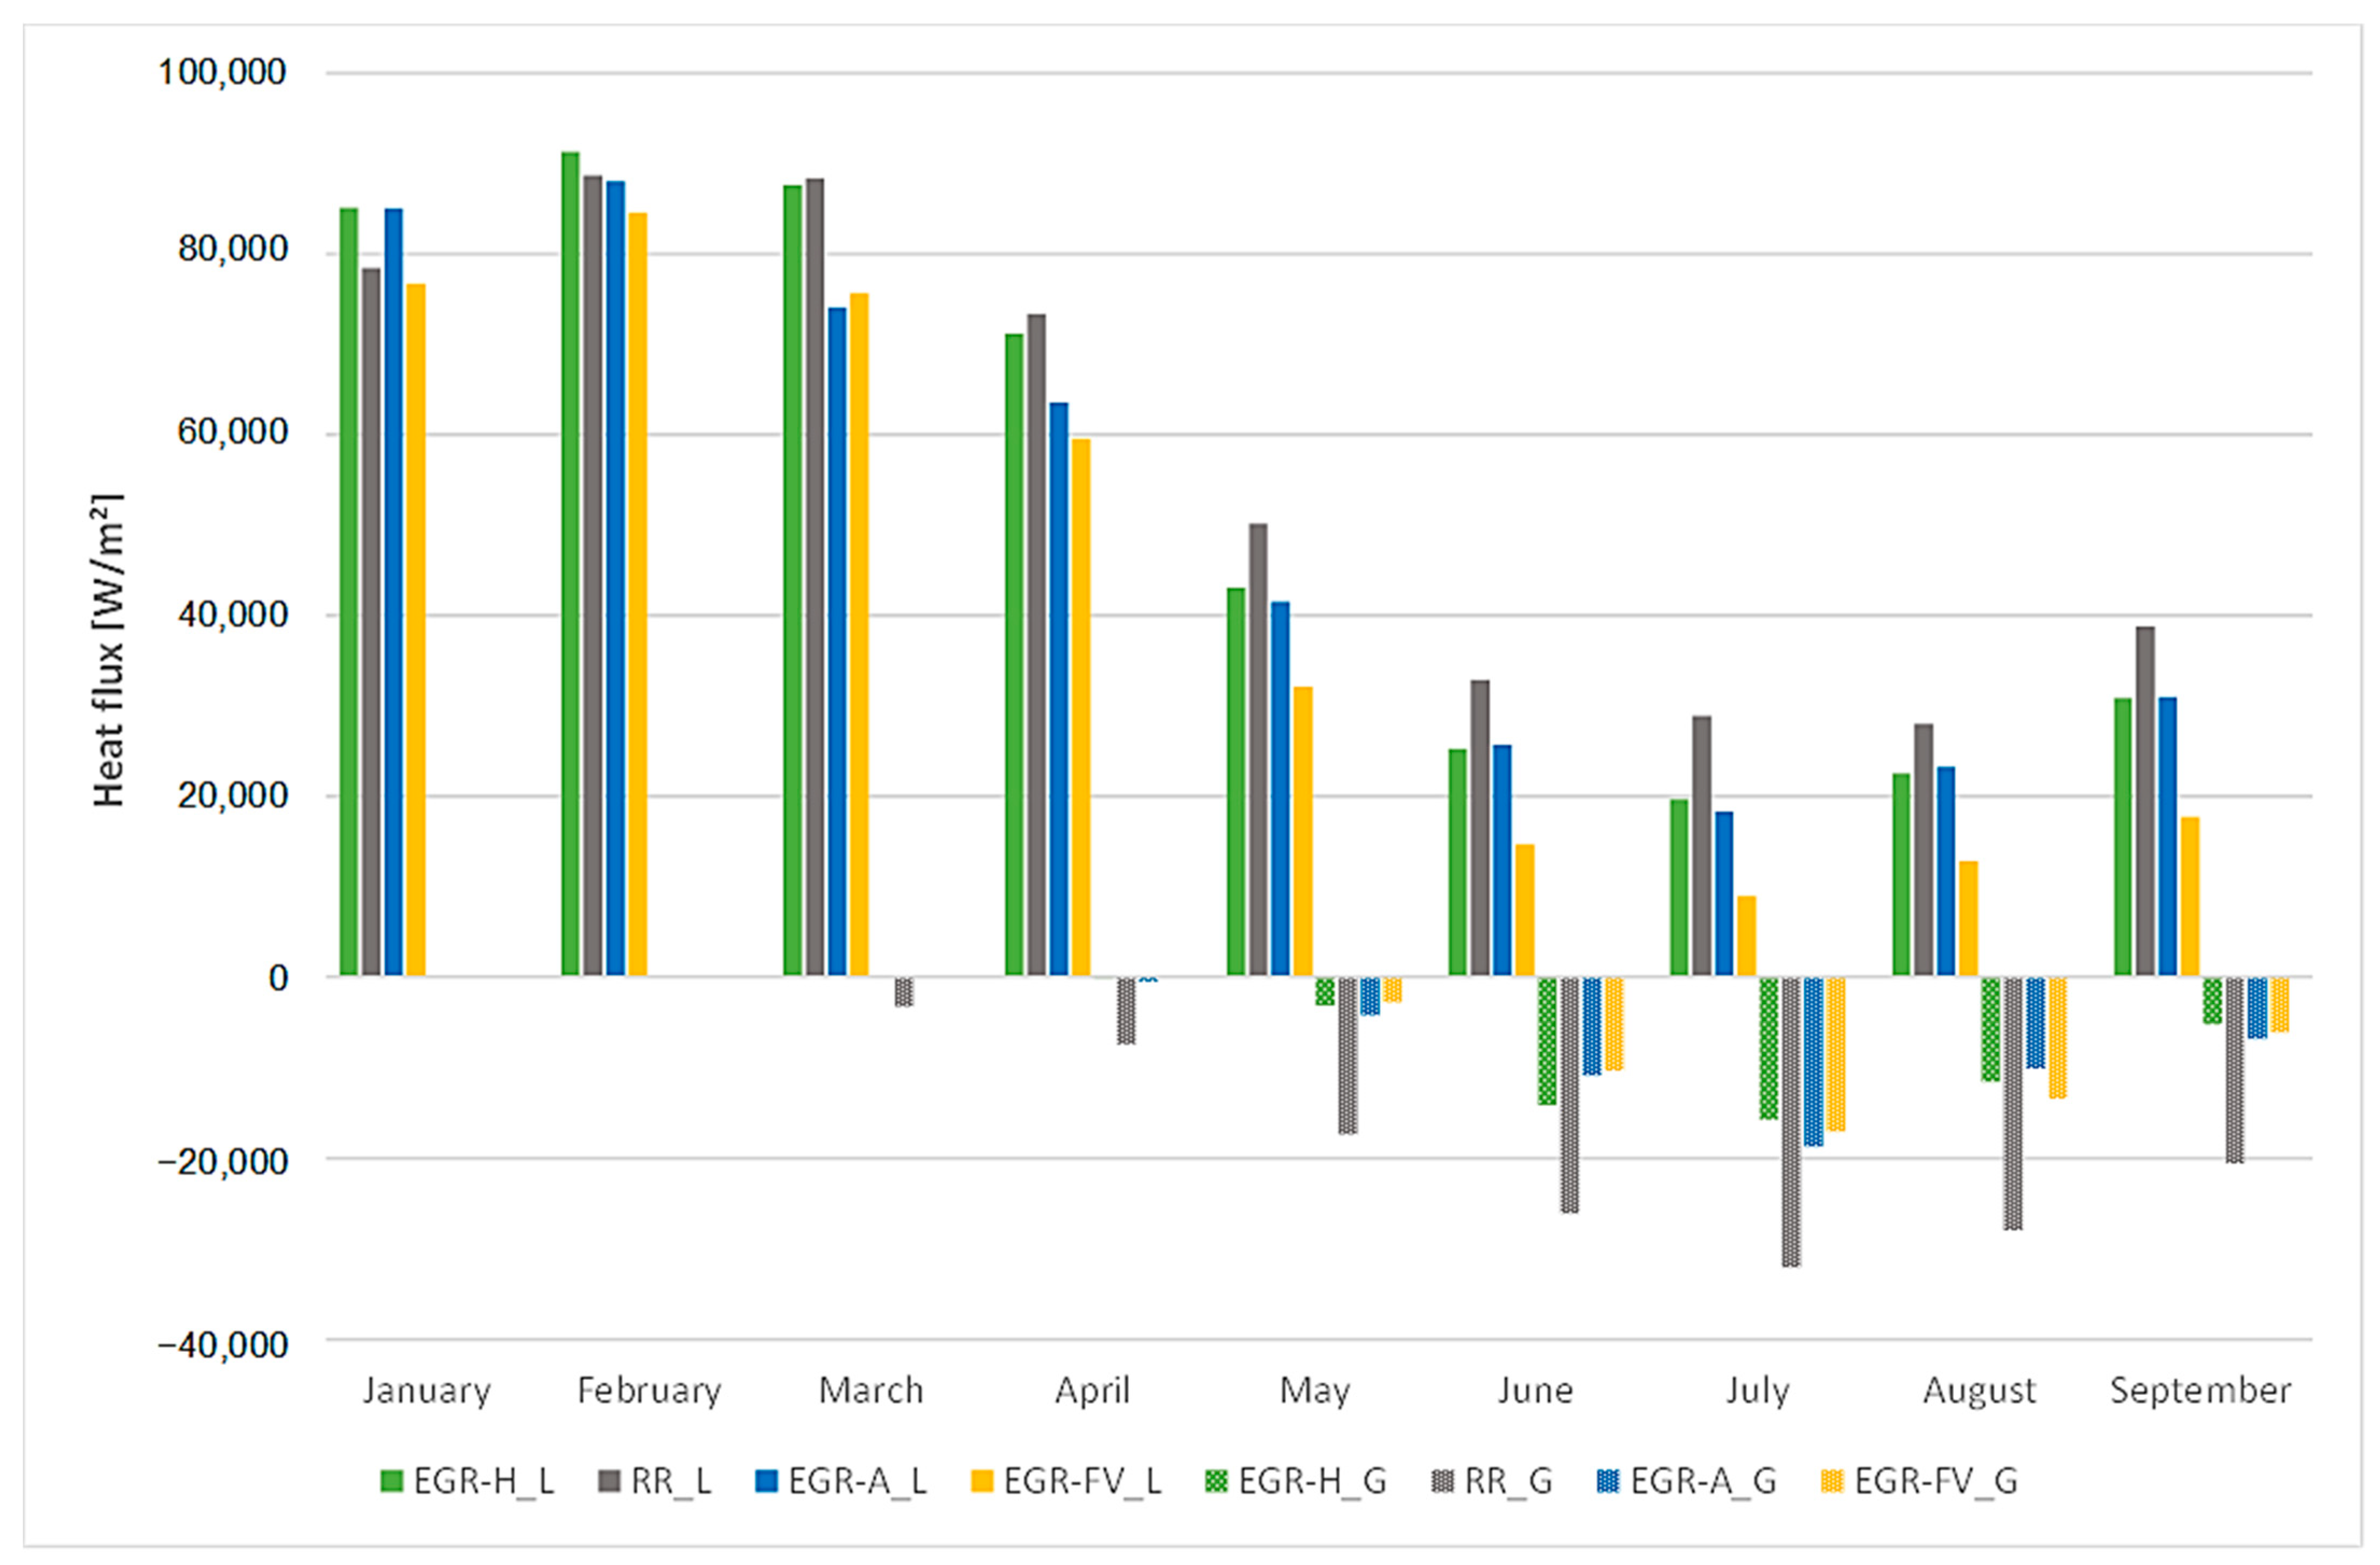
The heat flux pattern, which has a significant effect on the heat balance of buildings and the energy required to obtain suitable indoor environmental conditions (cooling in summer, heating in winter), was also investigated across the different EGR variants.
The monthly heat flux totals include both losses and gains throughout the month. From the graph we can see that, in the winter months, the thermal stability of the reference roof comes out more favourably than that of the vegetated roof over the production hall. This is mainly because during the day there are increased heat gains for the reference roof sample. The roof using FV panels achieves the lowest heat loss values. This is due to heat storage in the space below the FV panels, which provides warmer air in the immediate vicinity of the surface, and thus less heat transport through the structure and to the outside of the building is achieved. In
Figure 7, it is possible to see the decreasing trend of the heat loss of the building. This is due to the increasing outside temperature and also to the building’s increasing heat gains. In July, there is almost no heat flux transport. This is due to the steady state of heat loss and heat gain through the structure. The sensors are set so that the heat loss (heat spreading out from the building) through the structure is presented as positive values, while the heat gain (heat spreading into the building) is presented as negative values.
Figure 7 shows the amount of heat flux, which is presented as heat loss with the index “L” (positive values—losses) and as heat gain with the index “G” (negative values—gains), for each month.
3.1. Monthly Evaluation
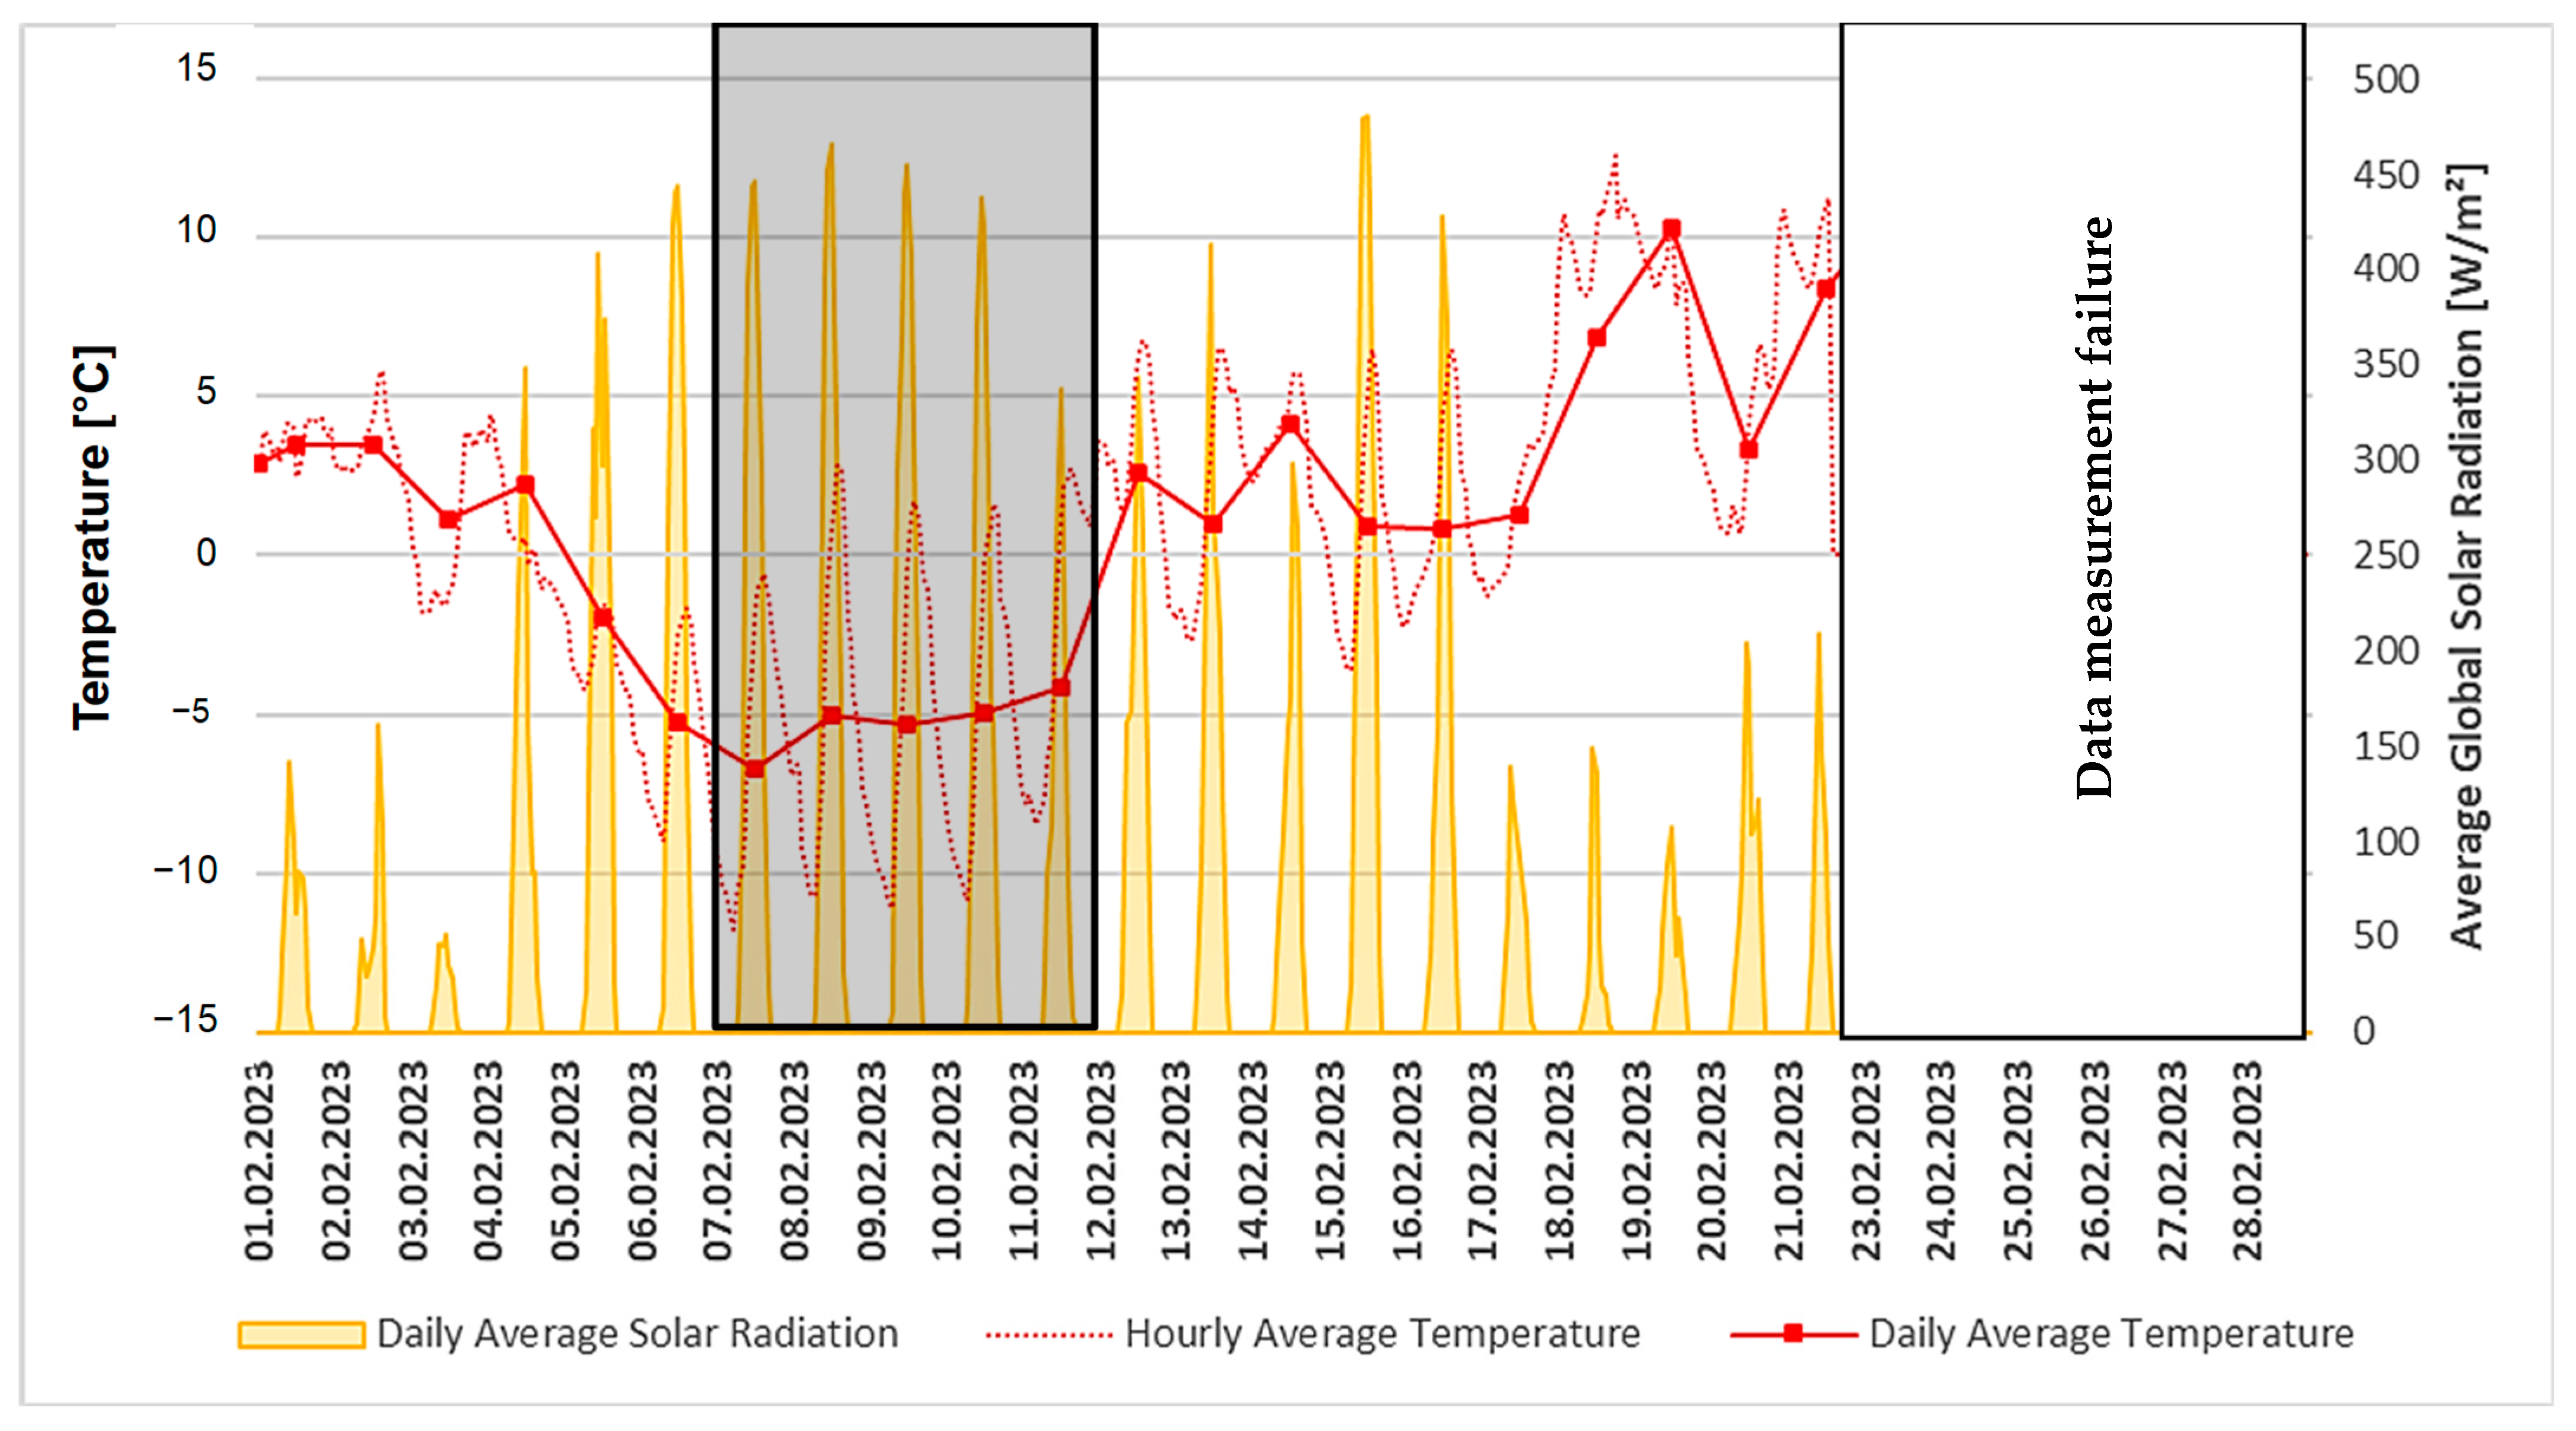
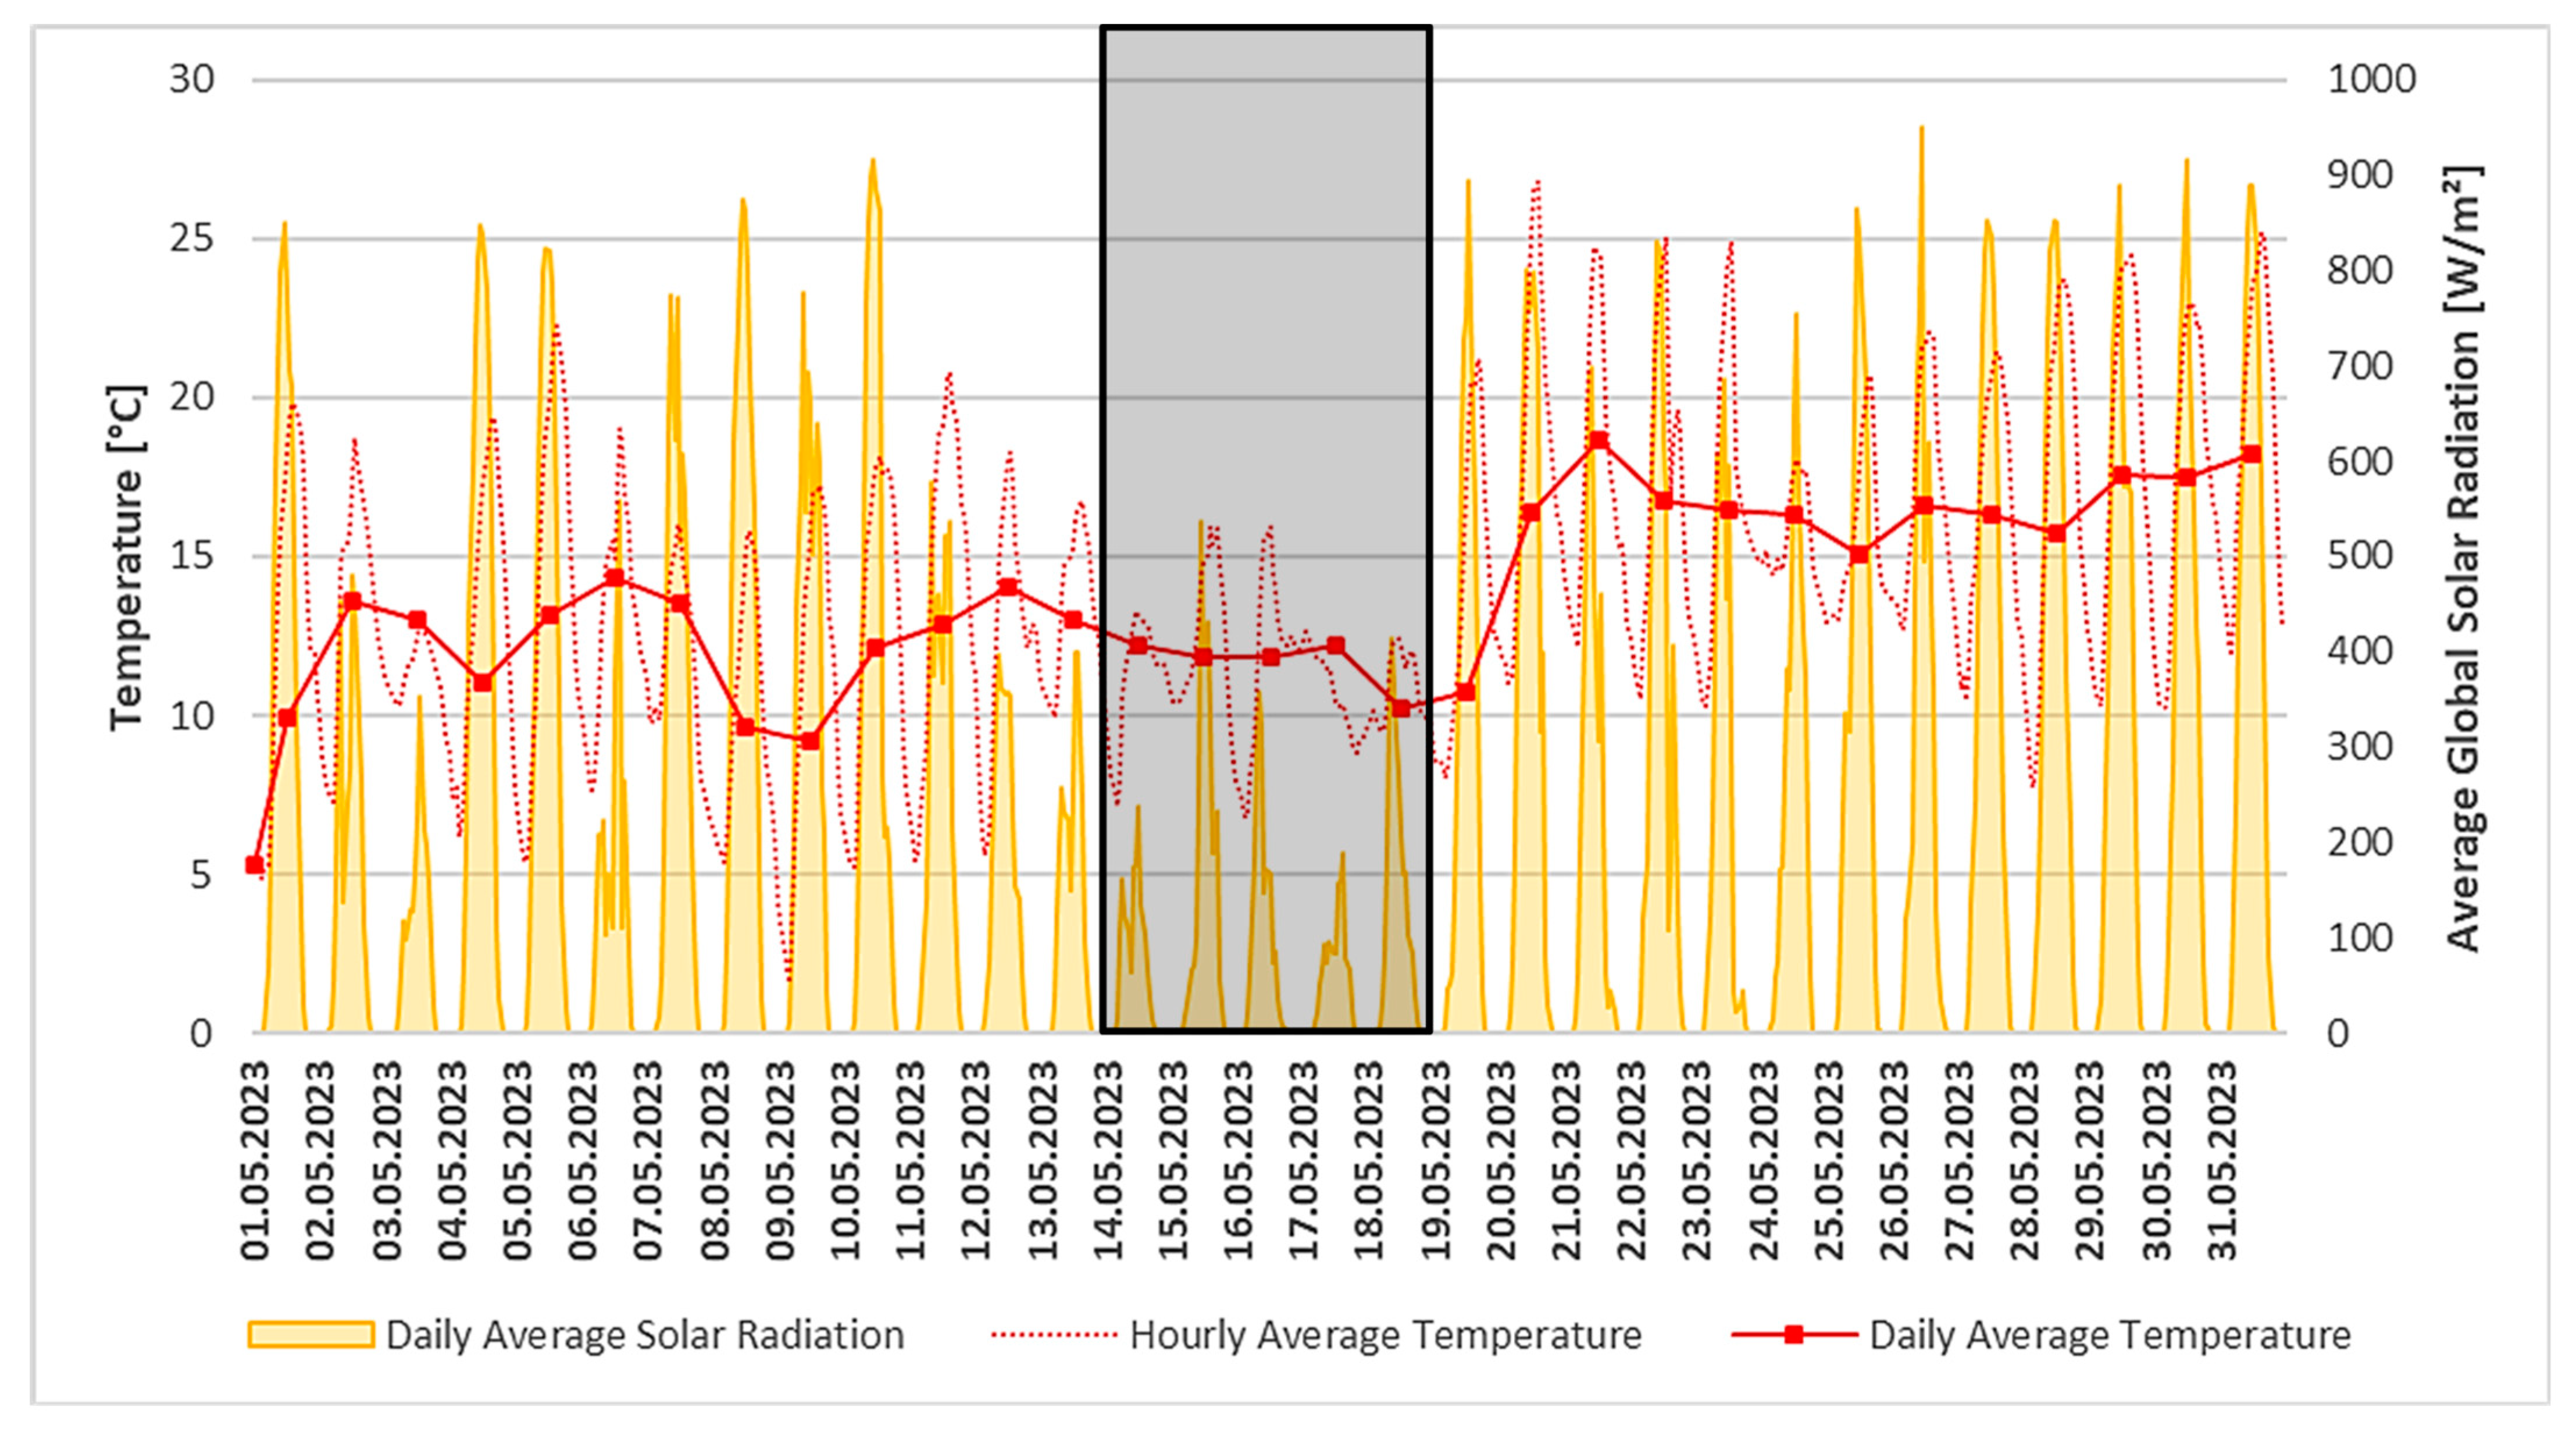
For better clarity and the appropriate selection of a representative period to investigate the behaviour of the EGR’s thermal performance, monthly graphs were made showing the ambient temperature and solar radiation intensity.
The following months were selected for the analysis of these results:
The month of January, for the presentation of the situation ‘winter with snow cover’ (
Figure 8);
The month of February for the presentation of the situation ‘winter without snow cover’ (
Figure 9);
The month of May for the presentation of the situation ‘summer with cloudy weather’ (
Figure 10);
The month of June for the presentation of the situation ‘summer with sunny weather’ (
Figure 11).
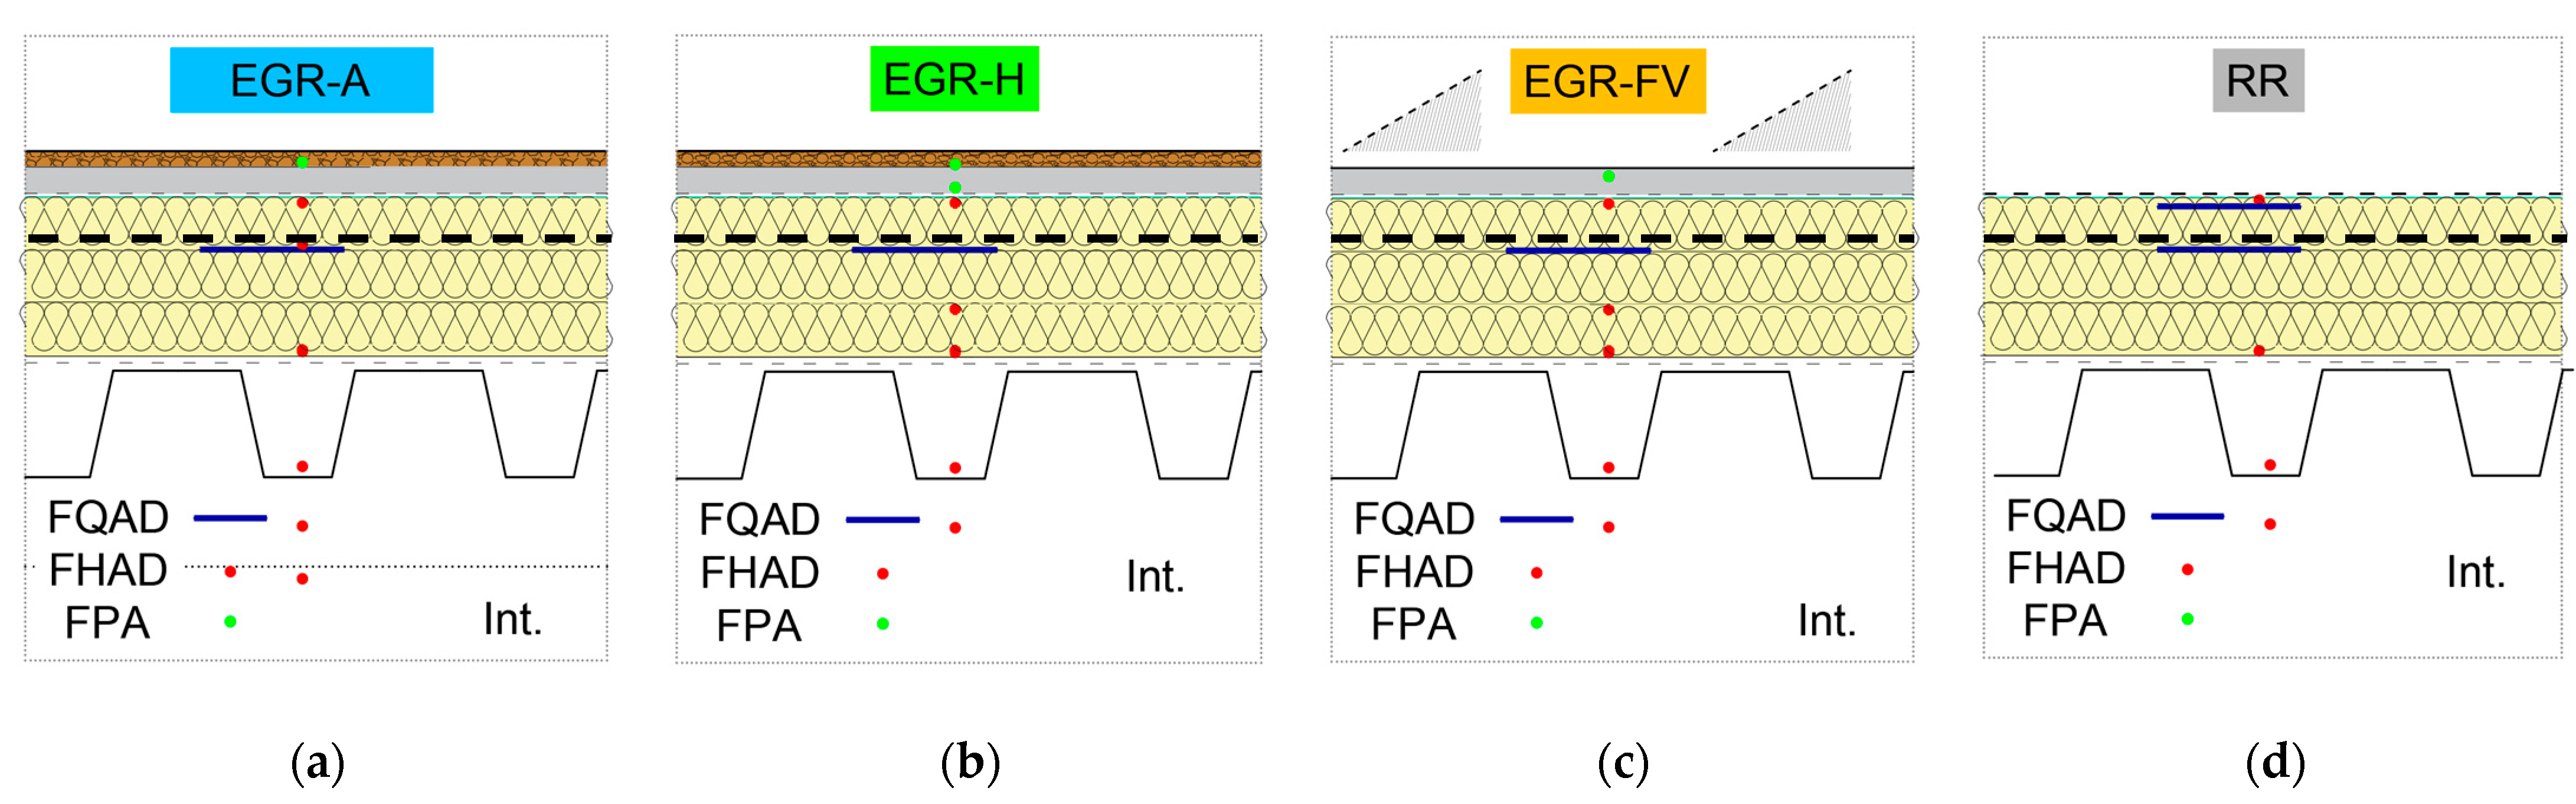
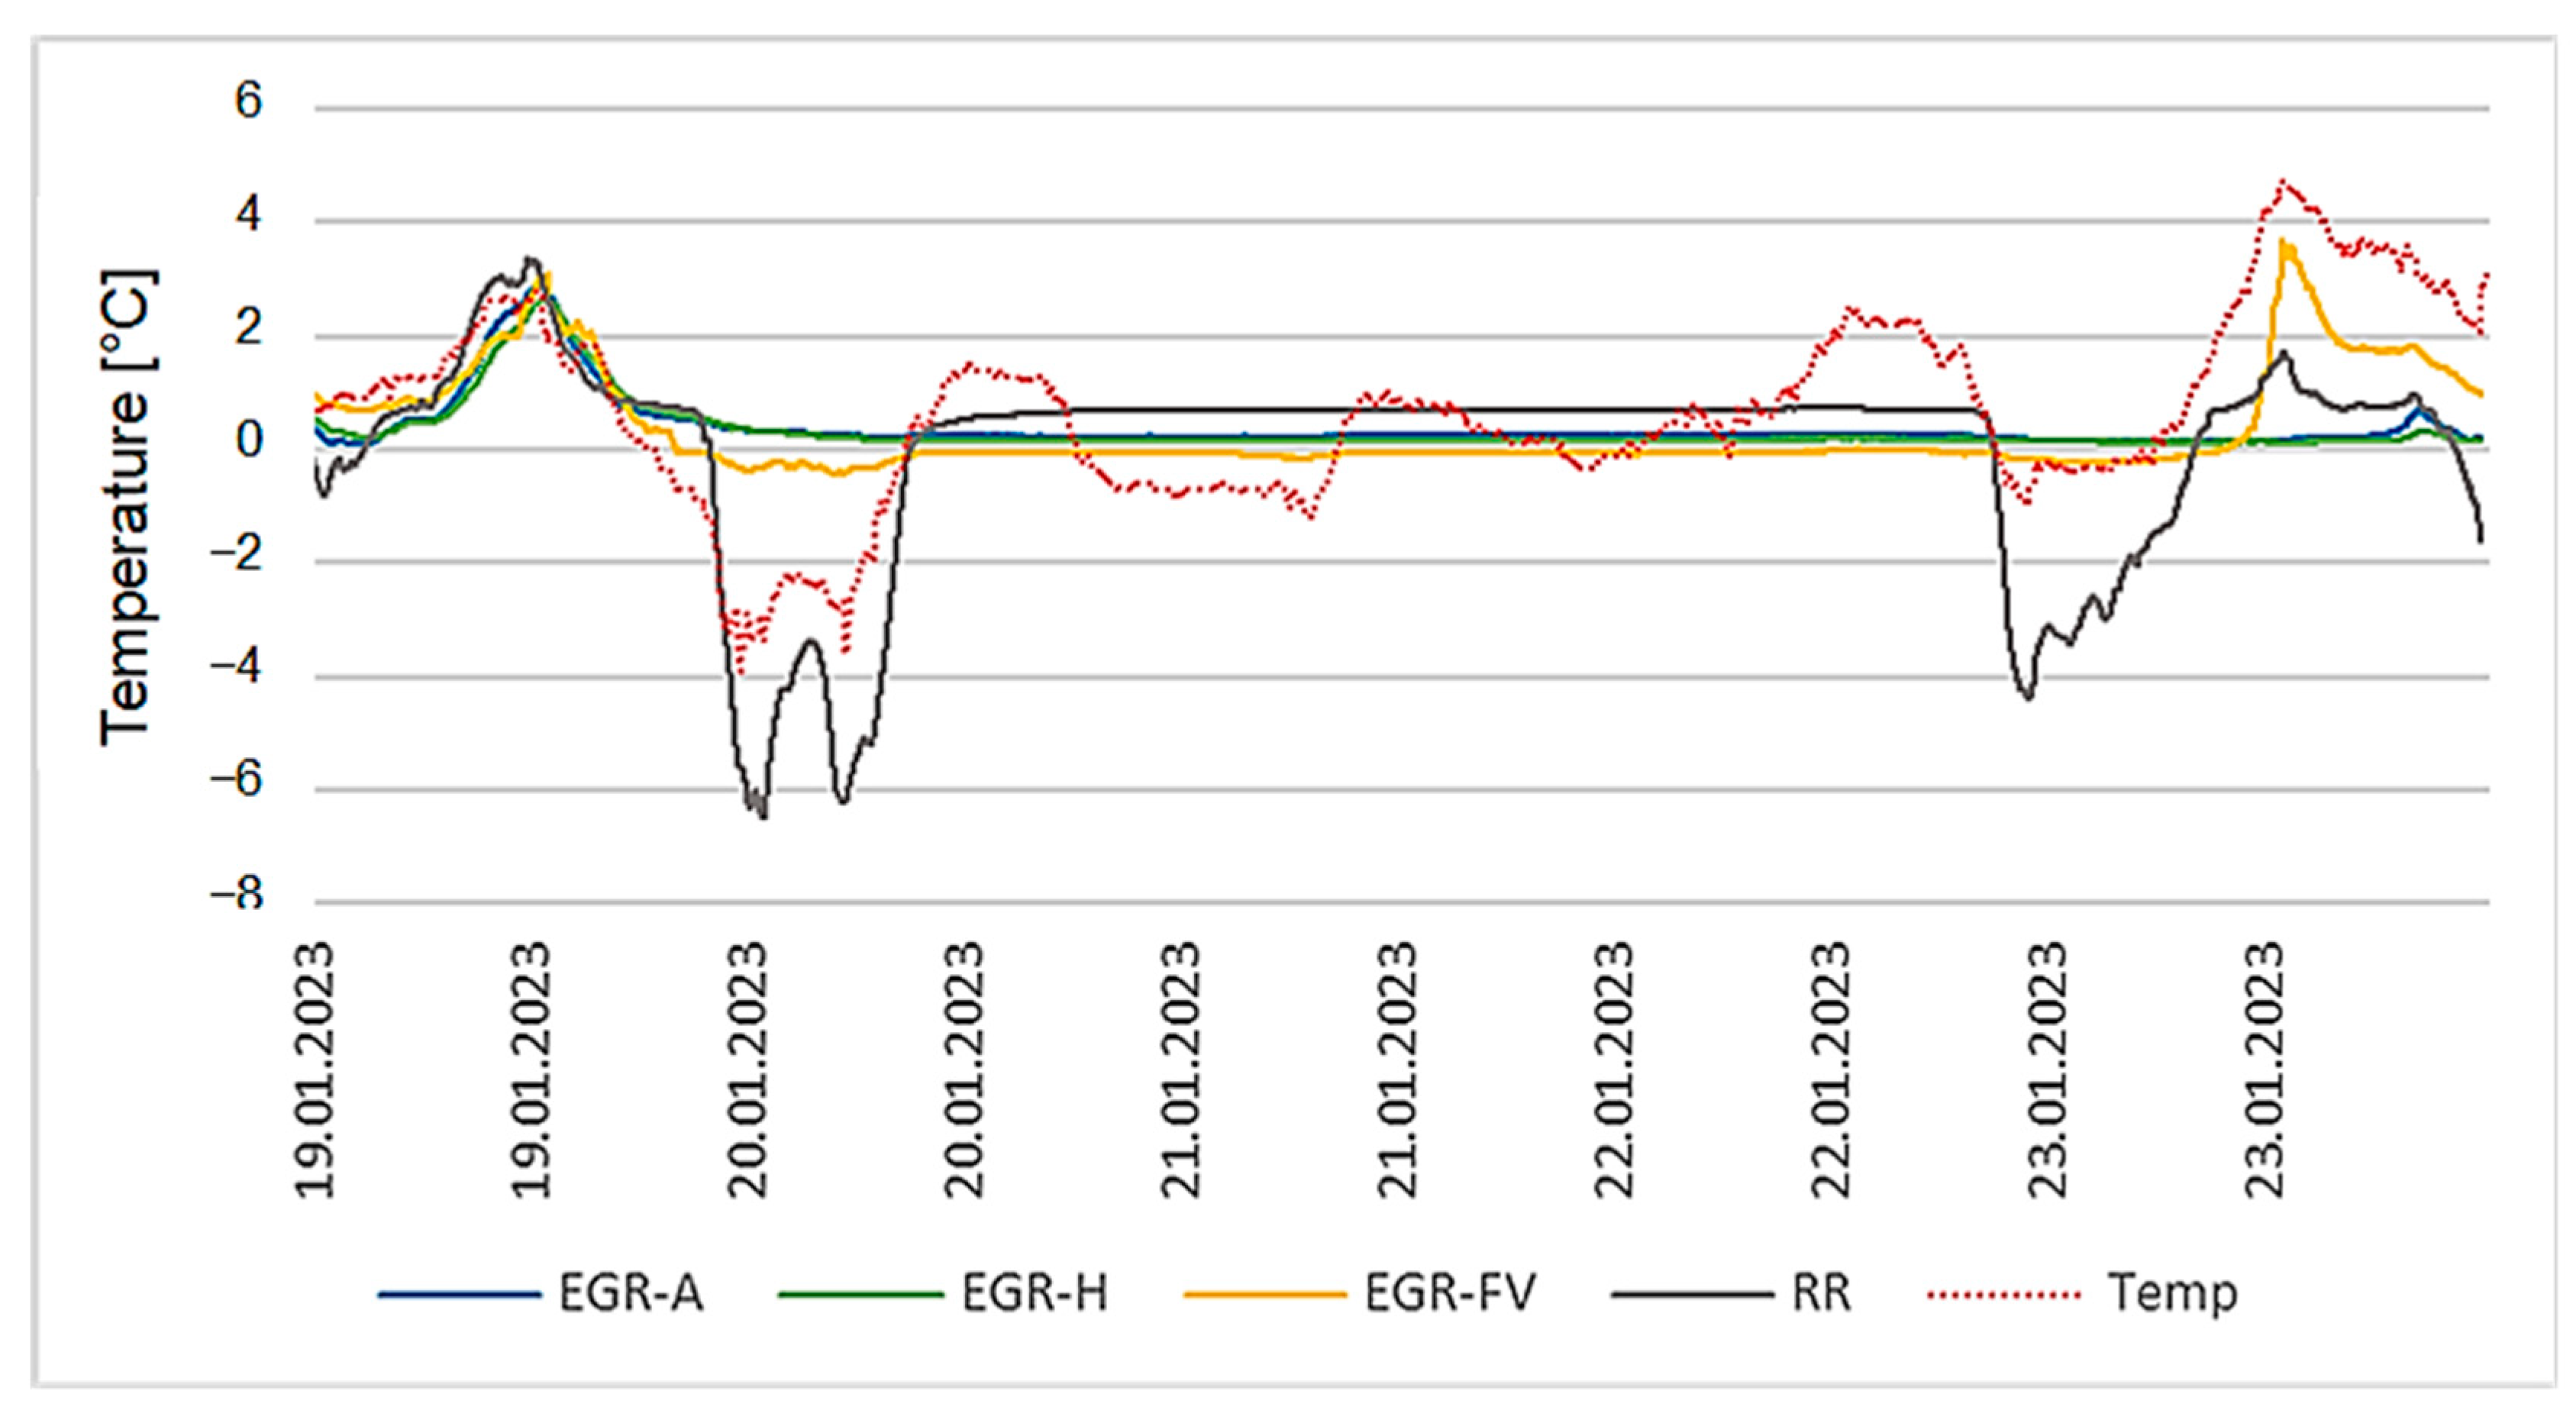
An interval of 5 consecutive days was subsequently selected from each month and analysed in more detail. In particular, the temperature changes in the EGR compositions of the different EGR variants, but also their heat flux, were demonstrated. In these graphs, the red dashed line represents the outside air temperature. In the monthly graphs, the red solid line represents the daily average outside air temperature. In all graphs in these figures, one colour is assigned to a particular sample for a better readability and interpretation of the results across samples. Dark grey colour—RR, blue colour—EGR-A, green colour—EGR-H, and yellow colour—EGR-FV.
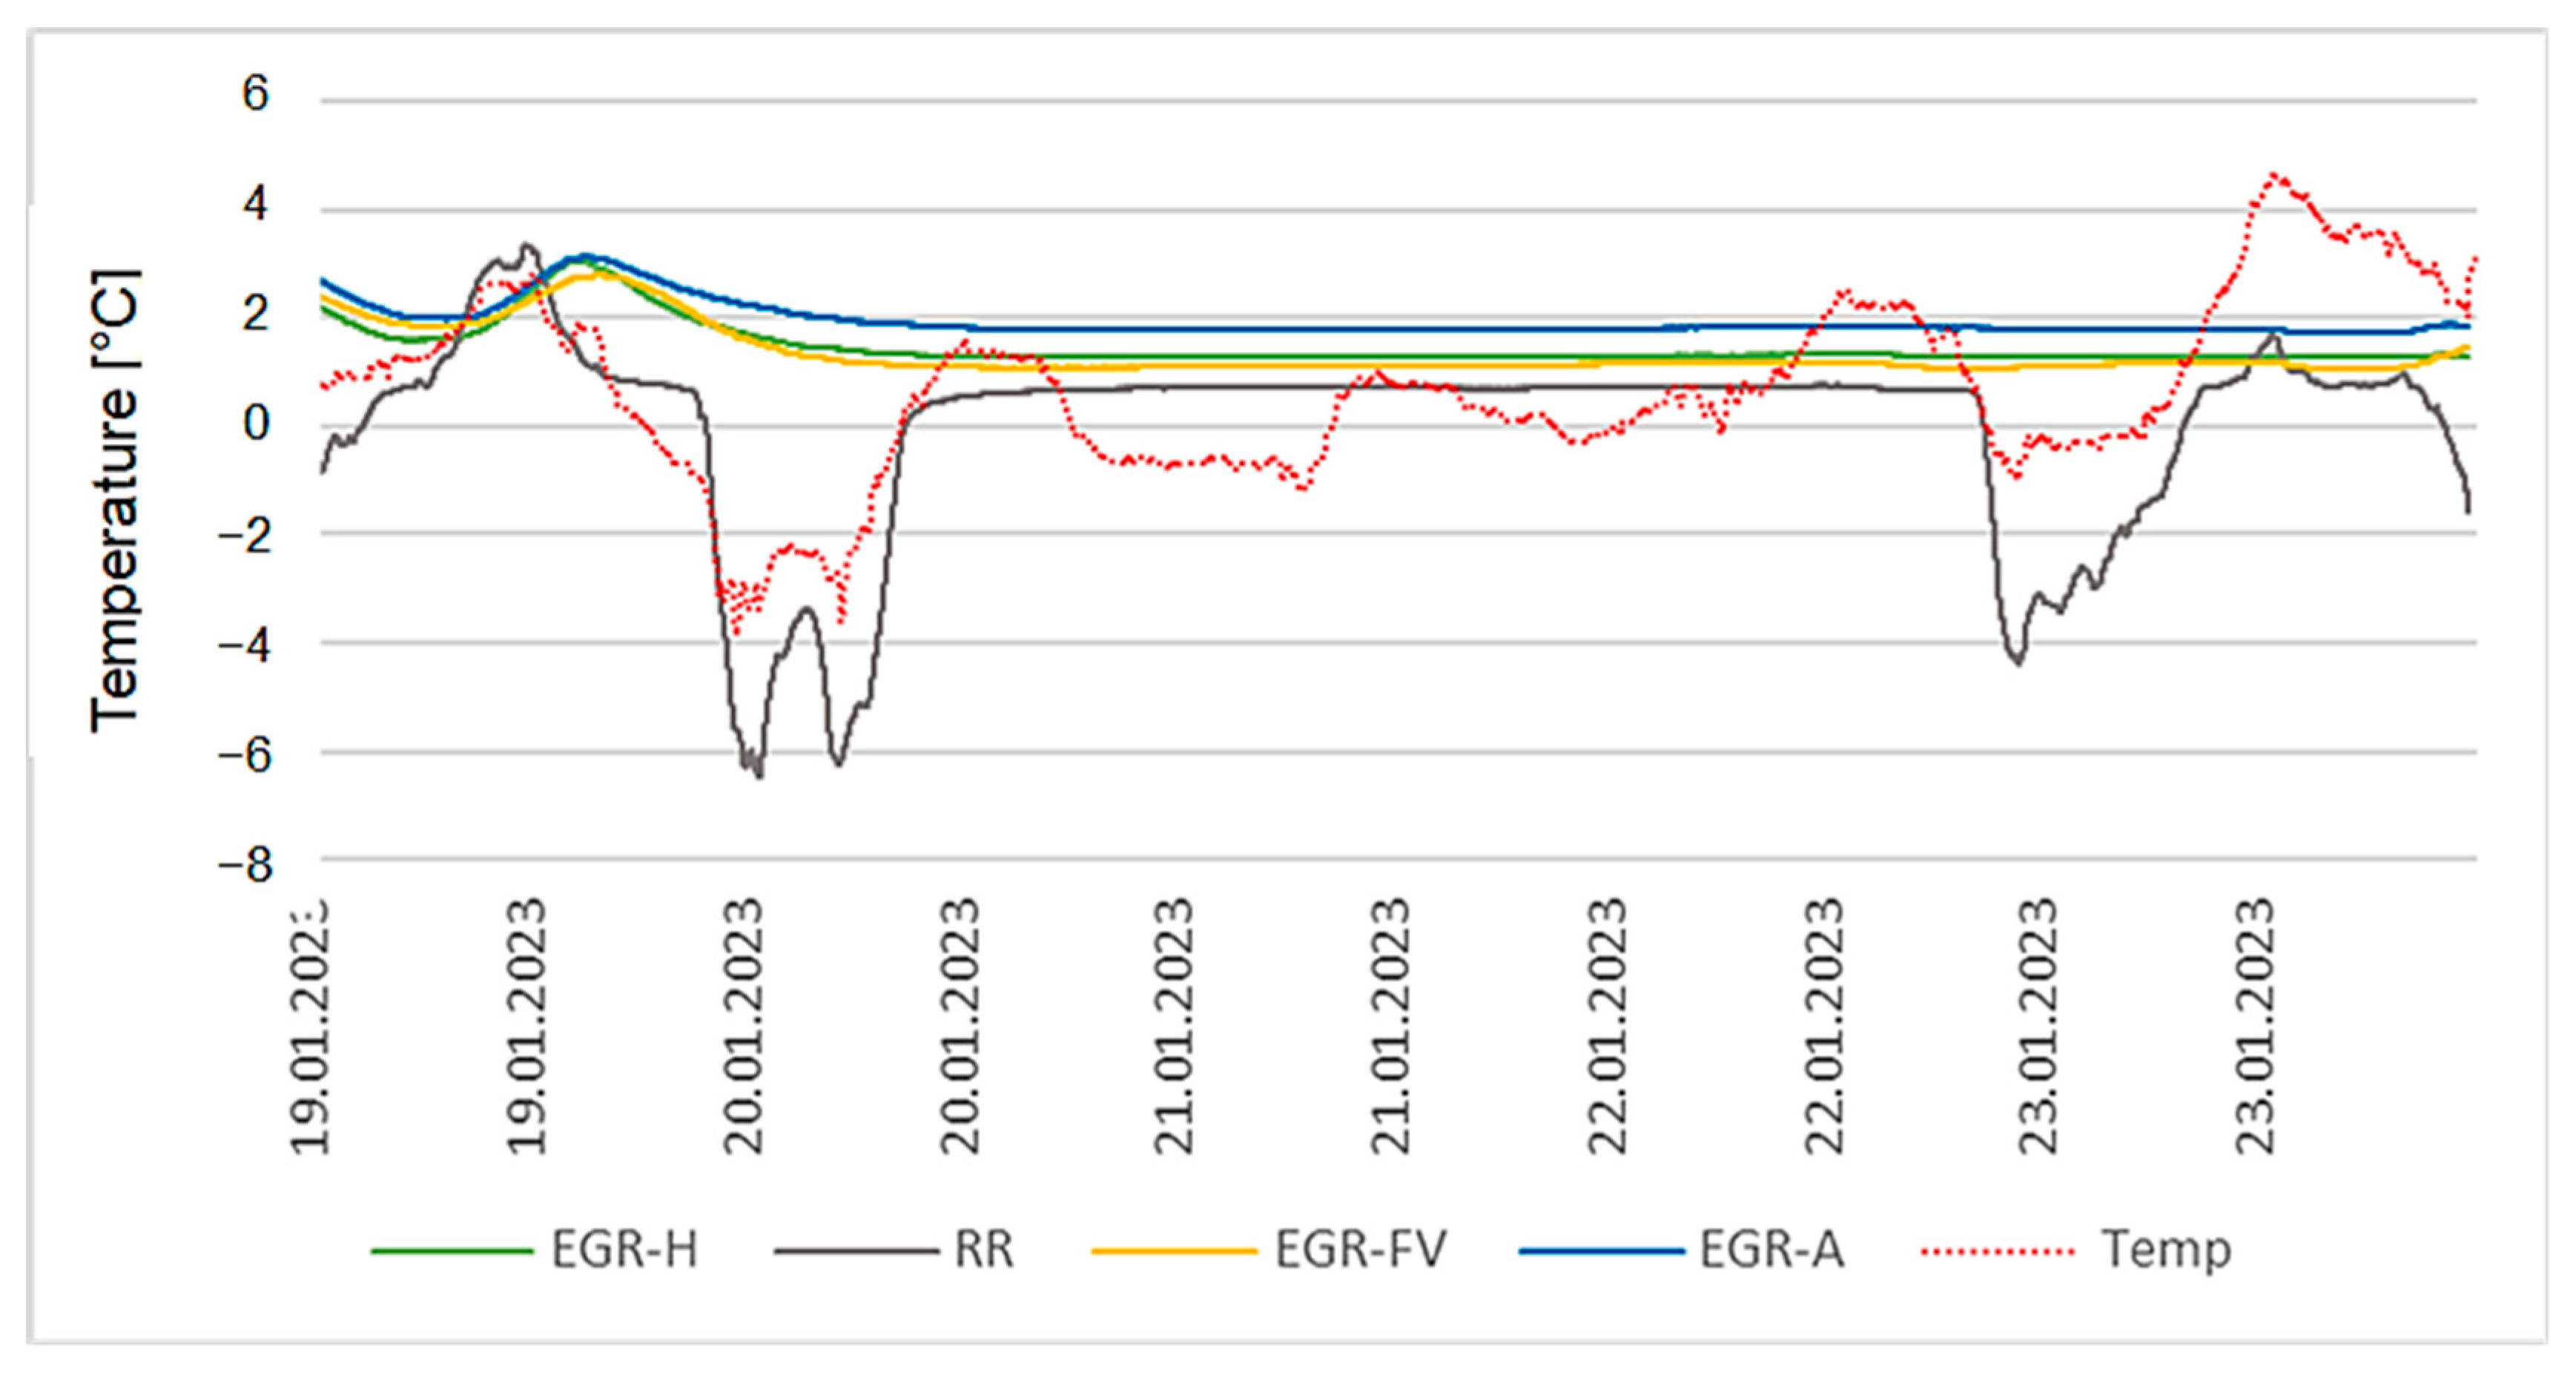
3.2. Winter with Snow Cover
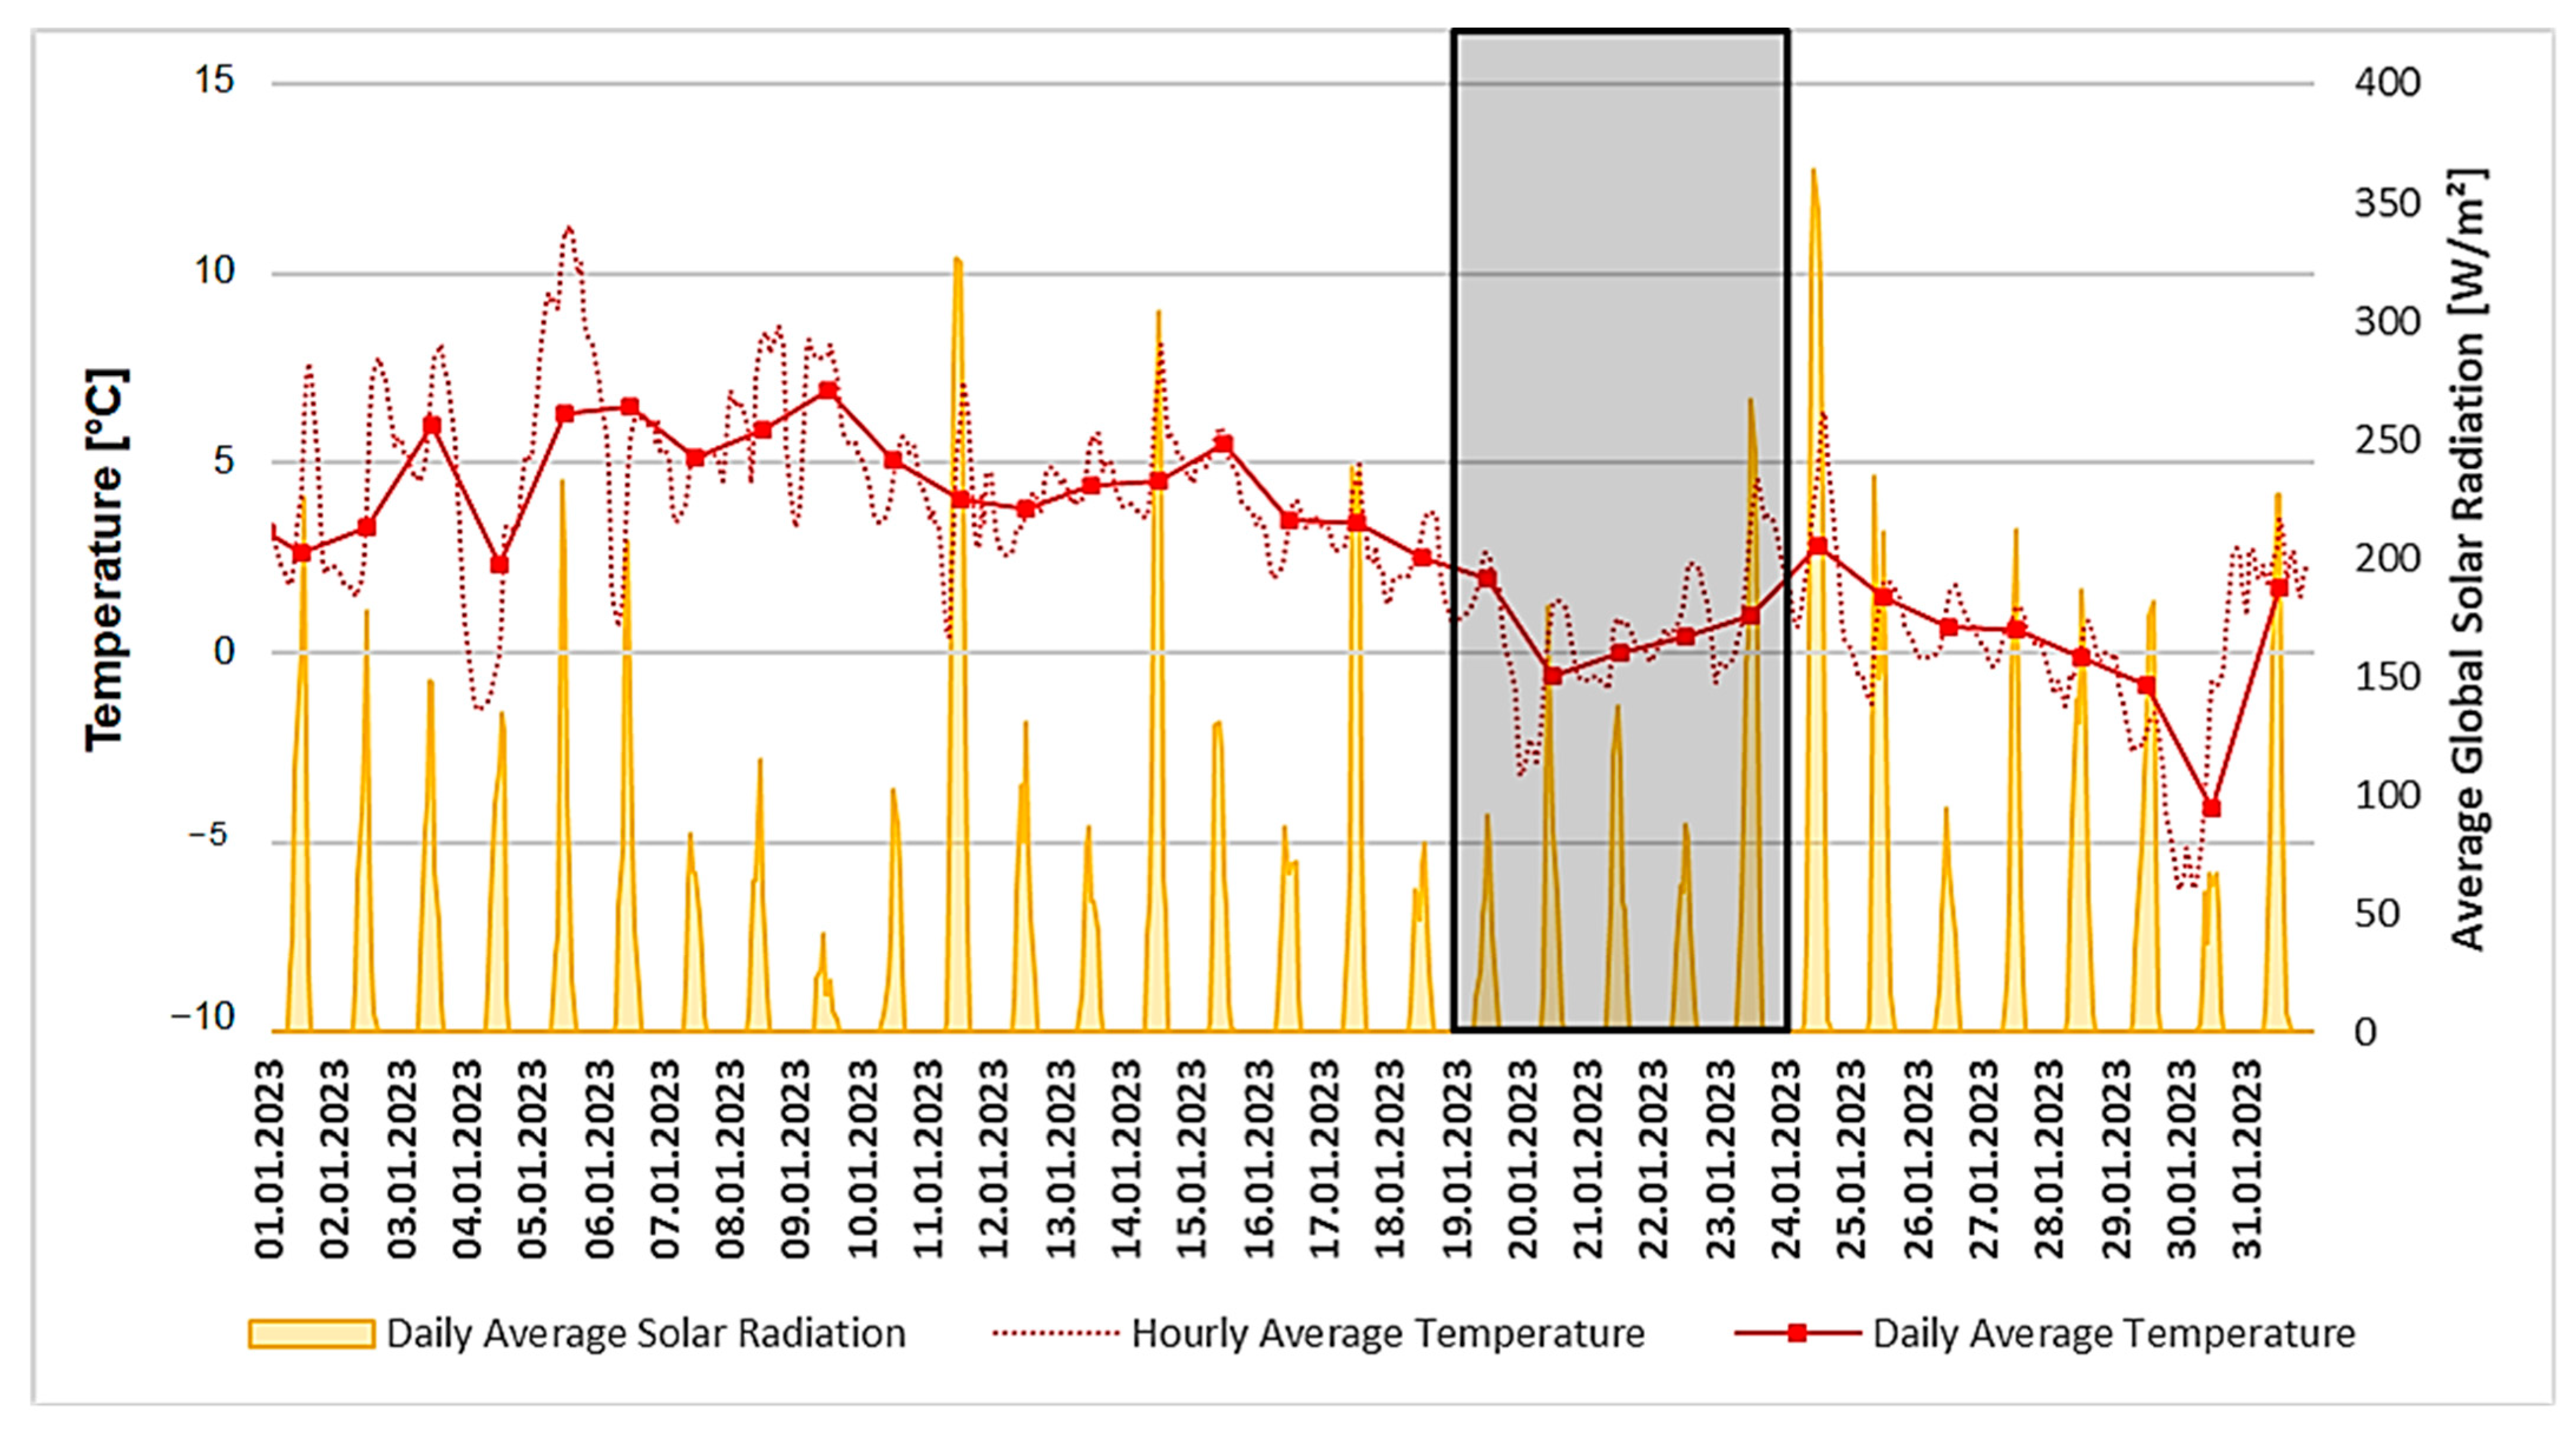
The graph in
Figure 12 shows the stabilization of the surface temperature during snow cover. On the 19th and 20th, the surface temperature can be seen to follow the outside air temperature, with different maximum values. However, on days 21 and 22, when fresh snow fell, there was a significant stabilization of temperature. On these days, the sky was cloudy, which also caused the outside air temperature to stabilise between −1.5 °C and +2.2 °C. The surface temperature maintained a constant temperature. The surface temperatures of the vegetation layer compositions were around 0 °C. Similar results were measured in paper [
31], when the surface temperature remained at 0 °C on a snowy day. From the 22nd to the 23rd, when snow melting occurred, a significant drop in surface temperature was seen for the reference roof; however, the vegetation layer compositions continued to maintain a stable surface temperature.
The graph in
Figure 13 shows the roof temperatures at the membrane (M) level. In this case, the temperature of the EGR compositions reaches higher than the M-level temperature of the reference roof, which is an expected result as there are additional layers on top the M in the case of EGRs to form the thermal storage mass of the different compositions. The temperatures in these compositions range from +1 °C to +2 °C. In this case, there was a change from the measurements in paper [
32]. In this case, the temperature at the M level was also close to 0 °C. This change can be attributed to the fact that the composition of the vegetation layer is slightly altered and also to the significantly lower outside air temperature (up to −15 °C). As can be noticed during day 19.01, there was also a phase shift in the temperature in the case of the EGR compositions, seen in the comparison of the temperatures at their surface and at the level of the M, over about 4 h.
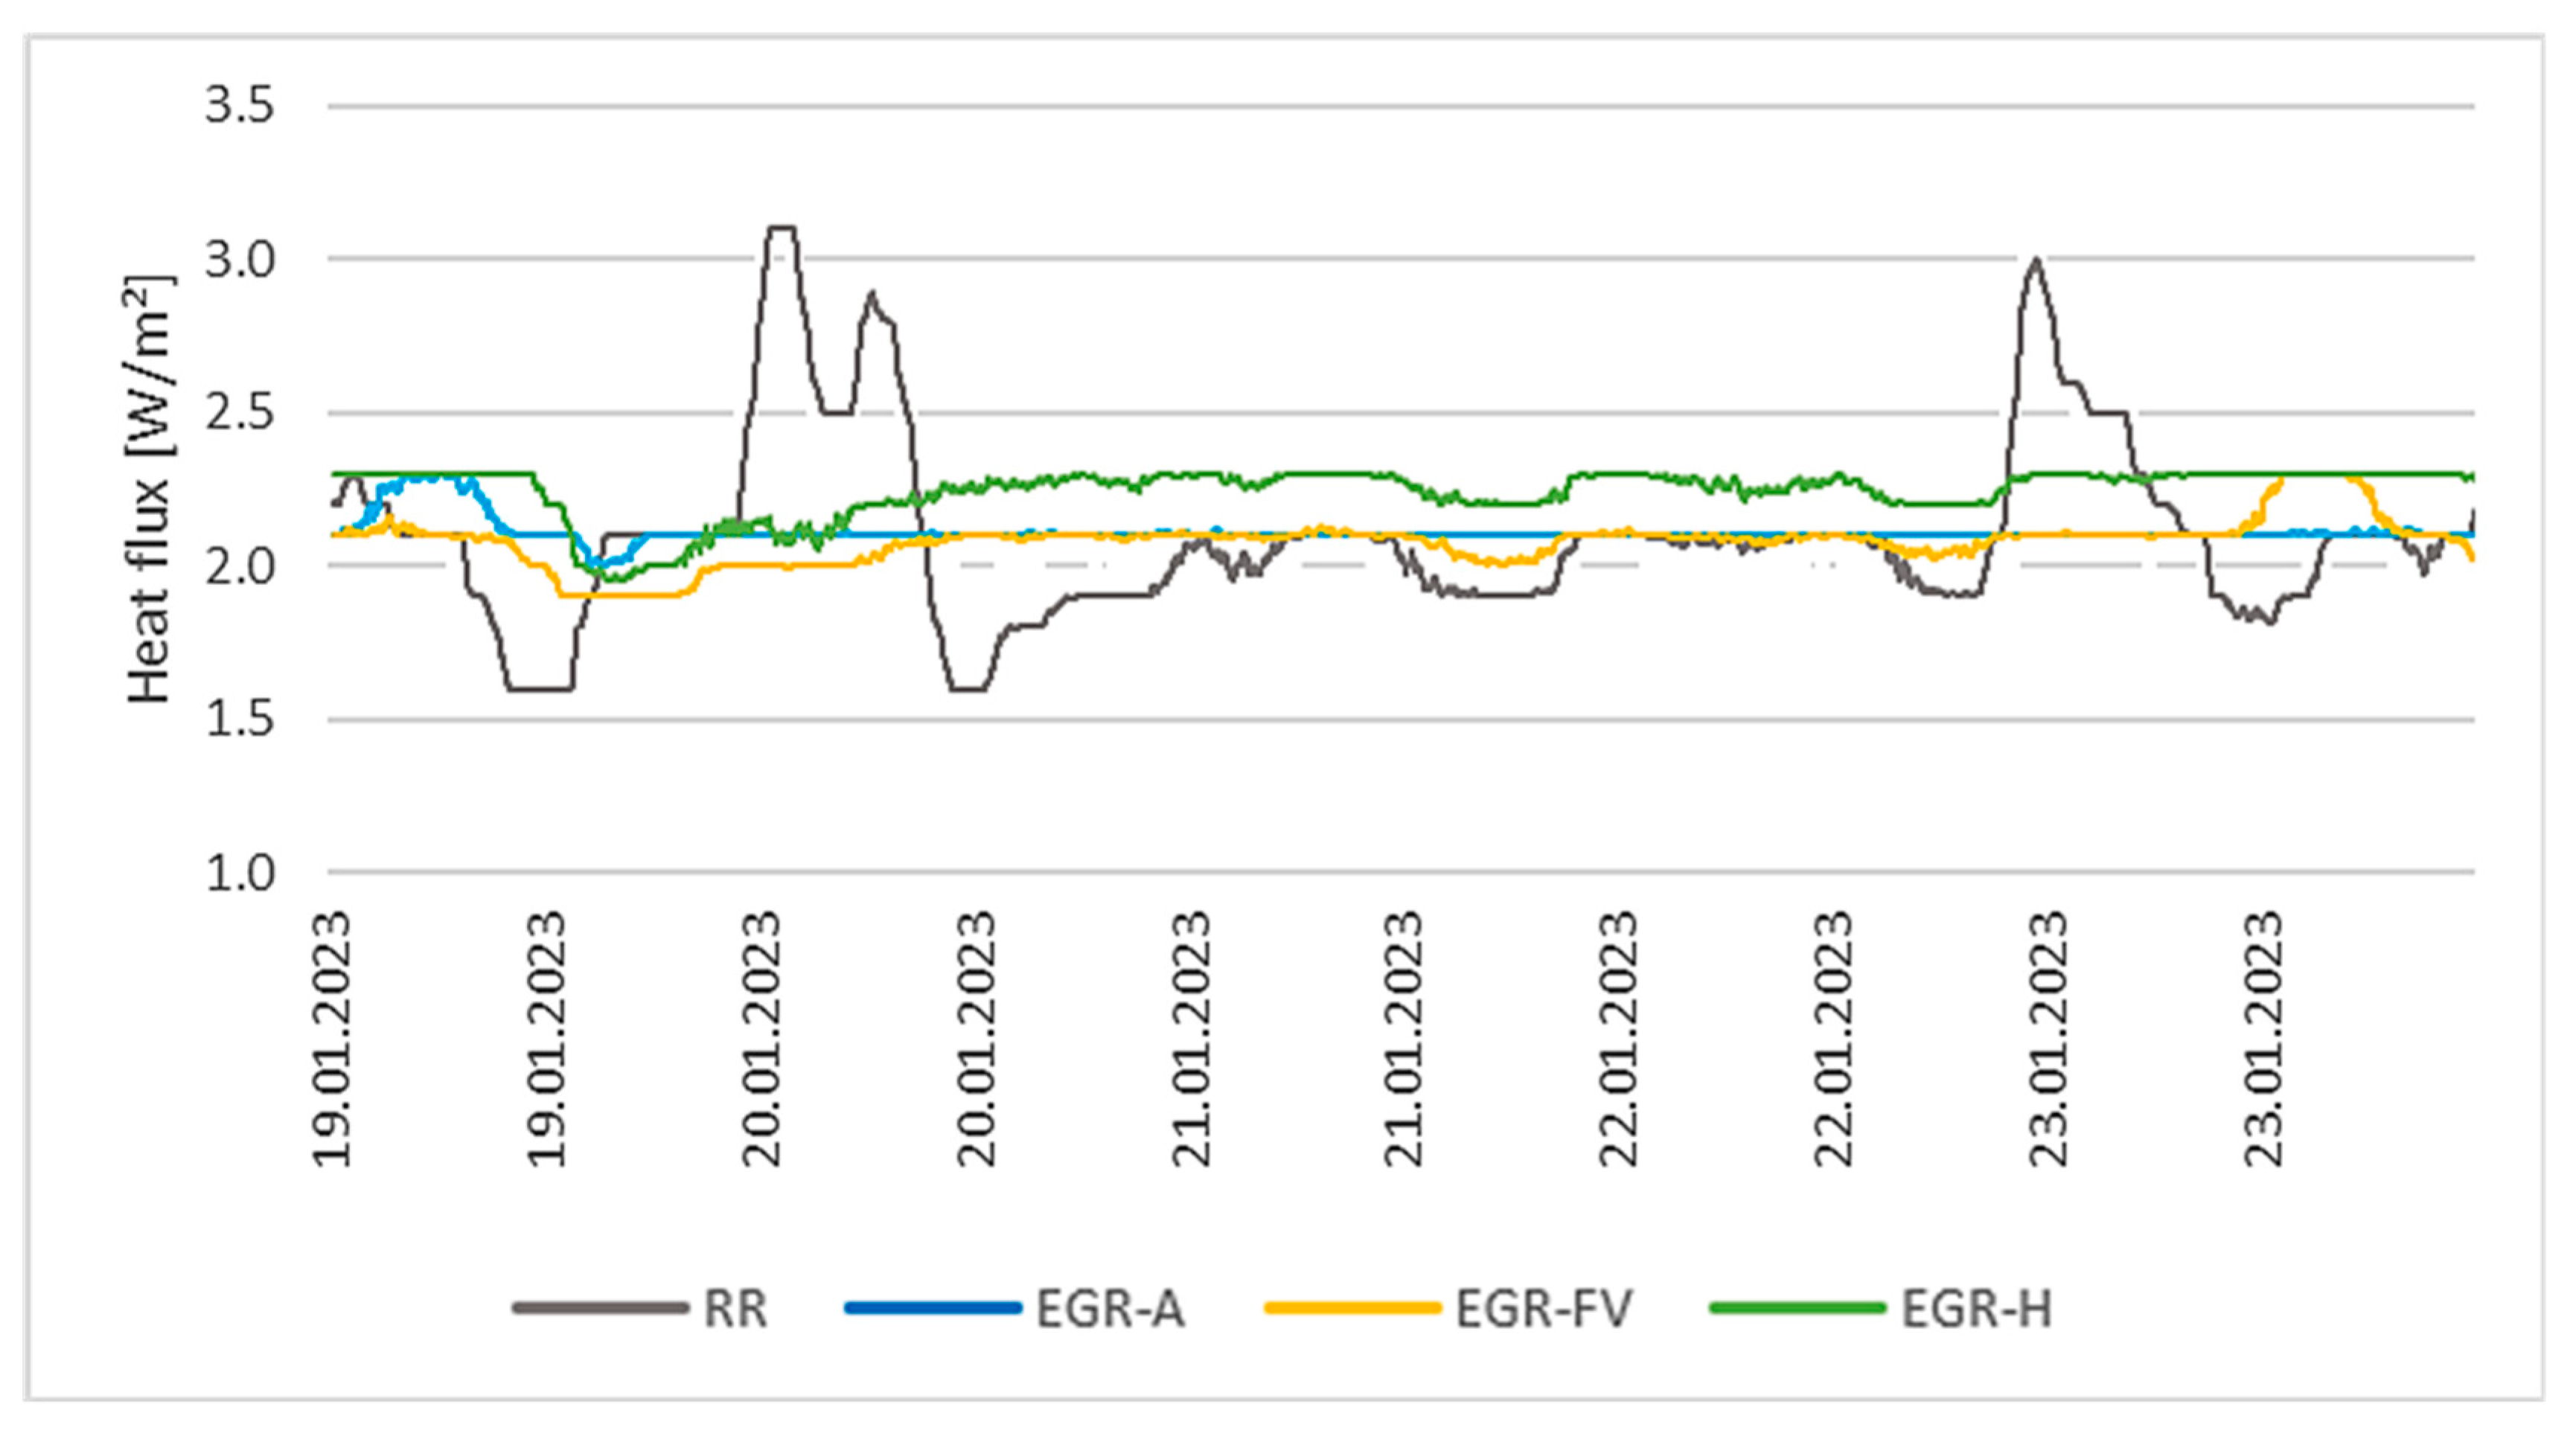
Figure 14 shows the heat fluxes from the heat flux plates (HFPs) in the different compositions. In the case of the reference roof, the plates were placed in the first thermal insulation (TI) layer, as was the case for the other observed compositions. There was no significant heat flux transport at the time of snow cover. The values were kept constant at 2 W/m
2. More pronounced fluctuations occur in the case of the reference roof when more pronounced deviations are observed. These variations occur when the roof is not completely covered by a blanket of snow or when snow melts and the roof surface is exposed to the direct effects of the external environment.
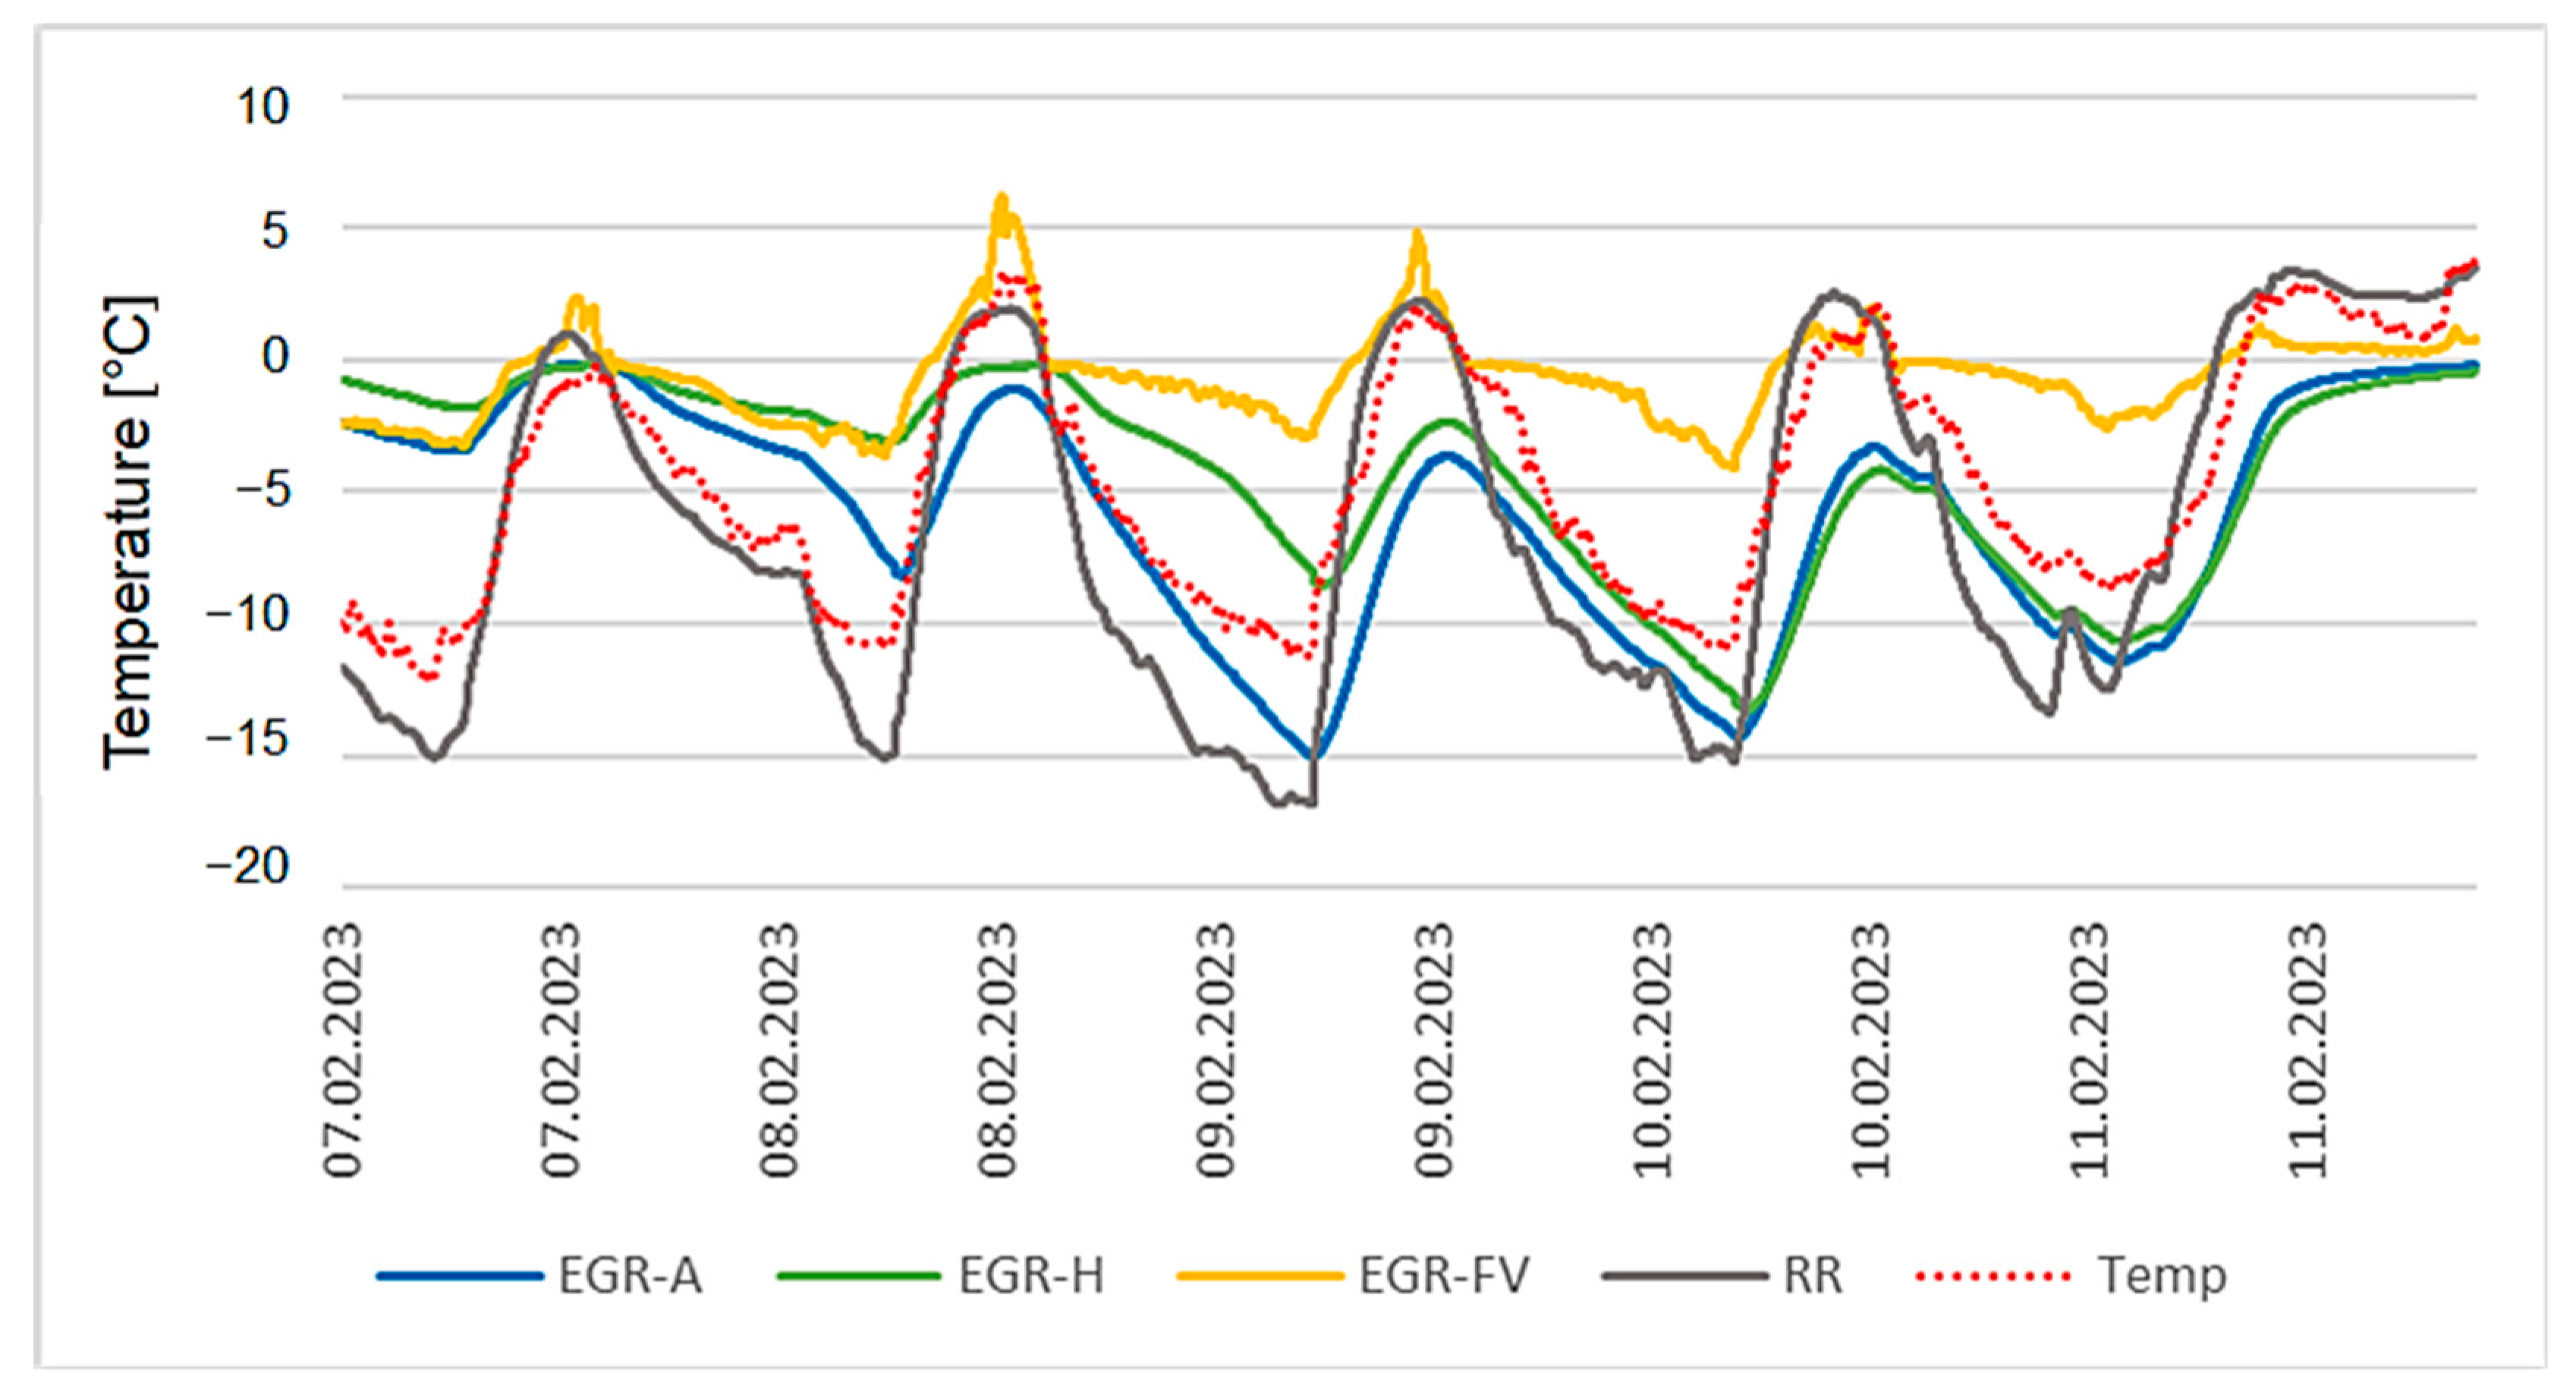
3.3. Winter without Snow Cover
As can be seen from
Figure 15 (the solar radiation and temperature patterns for winter conditions without snow cover), there is significantly higher solar radiation in the winter without snow cover. While, in the period with snow cover, the average value of solar radiation intensity during the monitored days was in the range of 100–150 W/m
2, in the selected period without snow cover the average value of solar radiation intensity was in the range of 350–470 W/m
2. During these clear days, the temperature was significantly lower. It ranged from −12 °C to +3 °C. The clear skies also had a significant effect on surface temperatures, as can be seen in the graph in
Figure 14. When the snow on the roof melted, the surface temperatures were significantly lower than the outside air temperature. An exception occurred in the variant with FV panels. The presence of the panels there created a suitable environment in the space below the panels due to the increased heat accumulation caused by the heated surface of the FV panels. It also created natural shading at night, so that the surface was not directly exposed to the clear sky and there was no significant subcooling due to the long-wave radiation of the cool atmosphere. In this way, a reduction in temperature oscillation was also achieved. While the maximum thermal difference of the RR was 19.1 °C, it was only 10 °C in the case of the FV panel composition. The other EGR variants replicated the thermal behaviour of the RR in their surface temperatures. This finding is not consistent with the results obtained in paper [
32], which maintained surface temperatures between 0 °C and −2 °C in the absence of snow cover. It should be noted that the roof investigated in this paper was exposed across its entire surface to outdoor conditions, without any intervention or covering by another structure, as in the case of paper [
32]. In that case, it was a local sample with small dimensions; moreover, it was affected by shading from an elevated part of the building. Its results may also be due to thermal radiation from the elevated part of the building, thus affecting the temperature of the EGR composition. In our cases, however, there is less thermal oscillation and shallower temperature rise and fall patterns. The similarity of the results from the EGR to the RR thermal regime can be attributed to the fact that the roofs were not fully vegetated and that it was the first winter for the roof under consideration. The second fact is that an extensive roof with a very low substrate thickness was being observed, so the temperature sensors are relatively close to the surface and are not protected by the thermal insulation layer of the substrate.
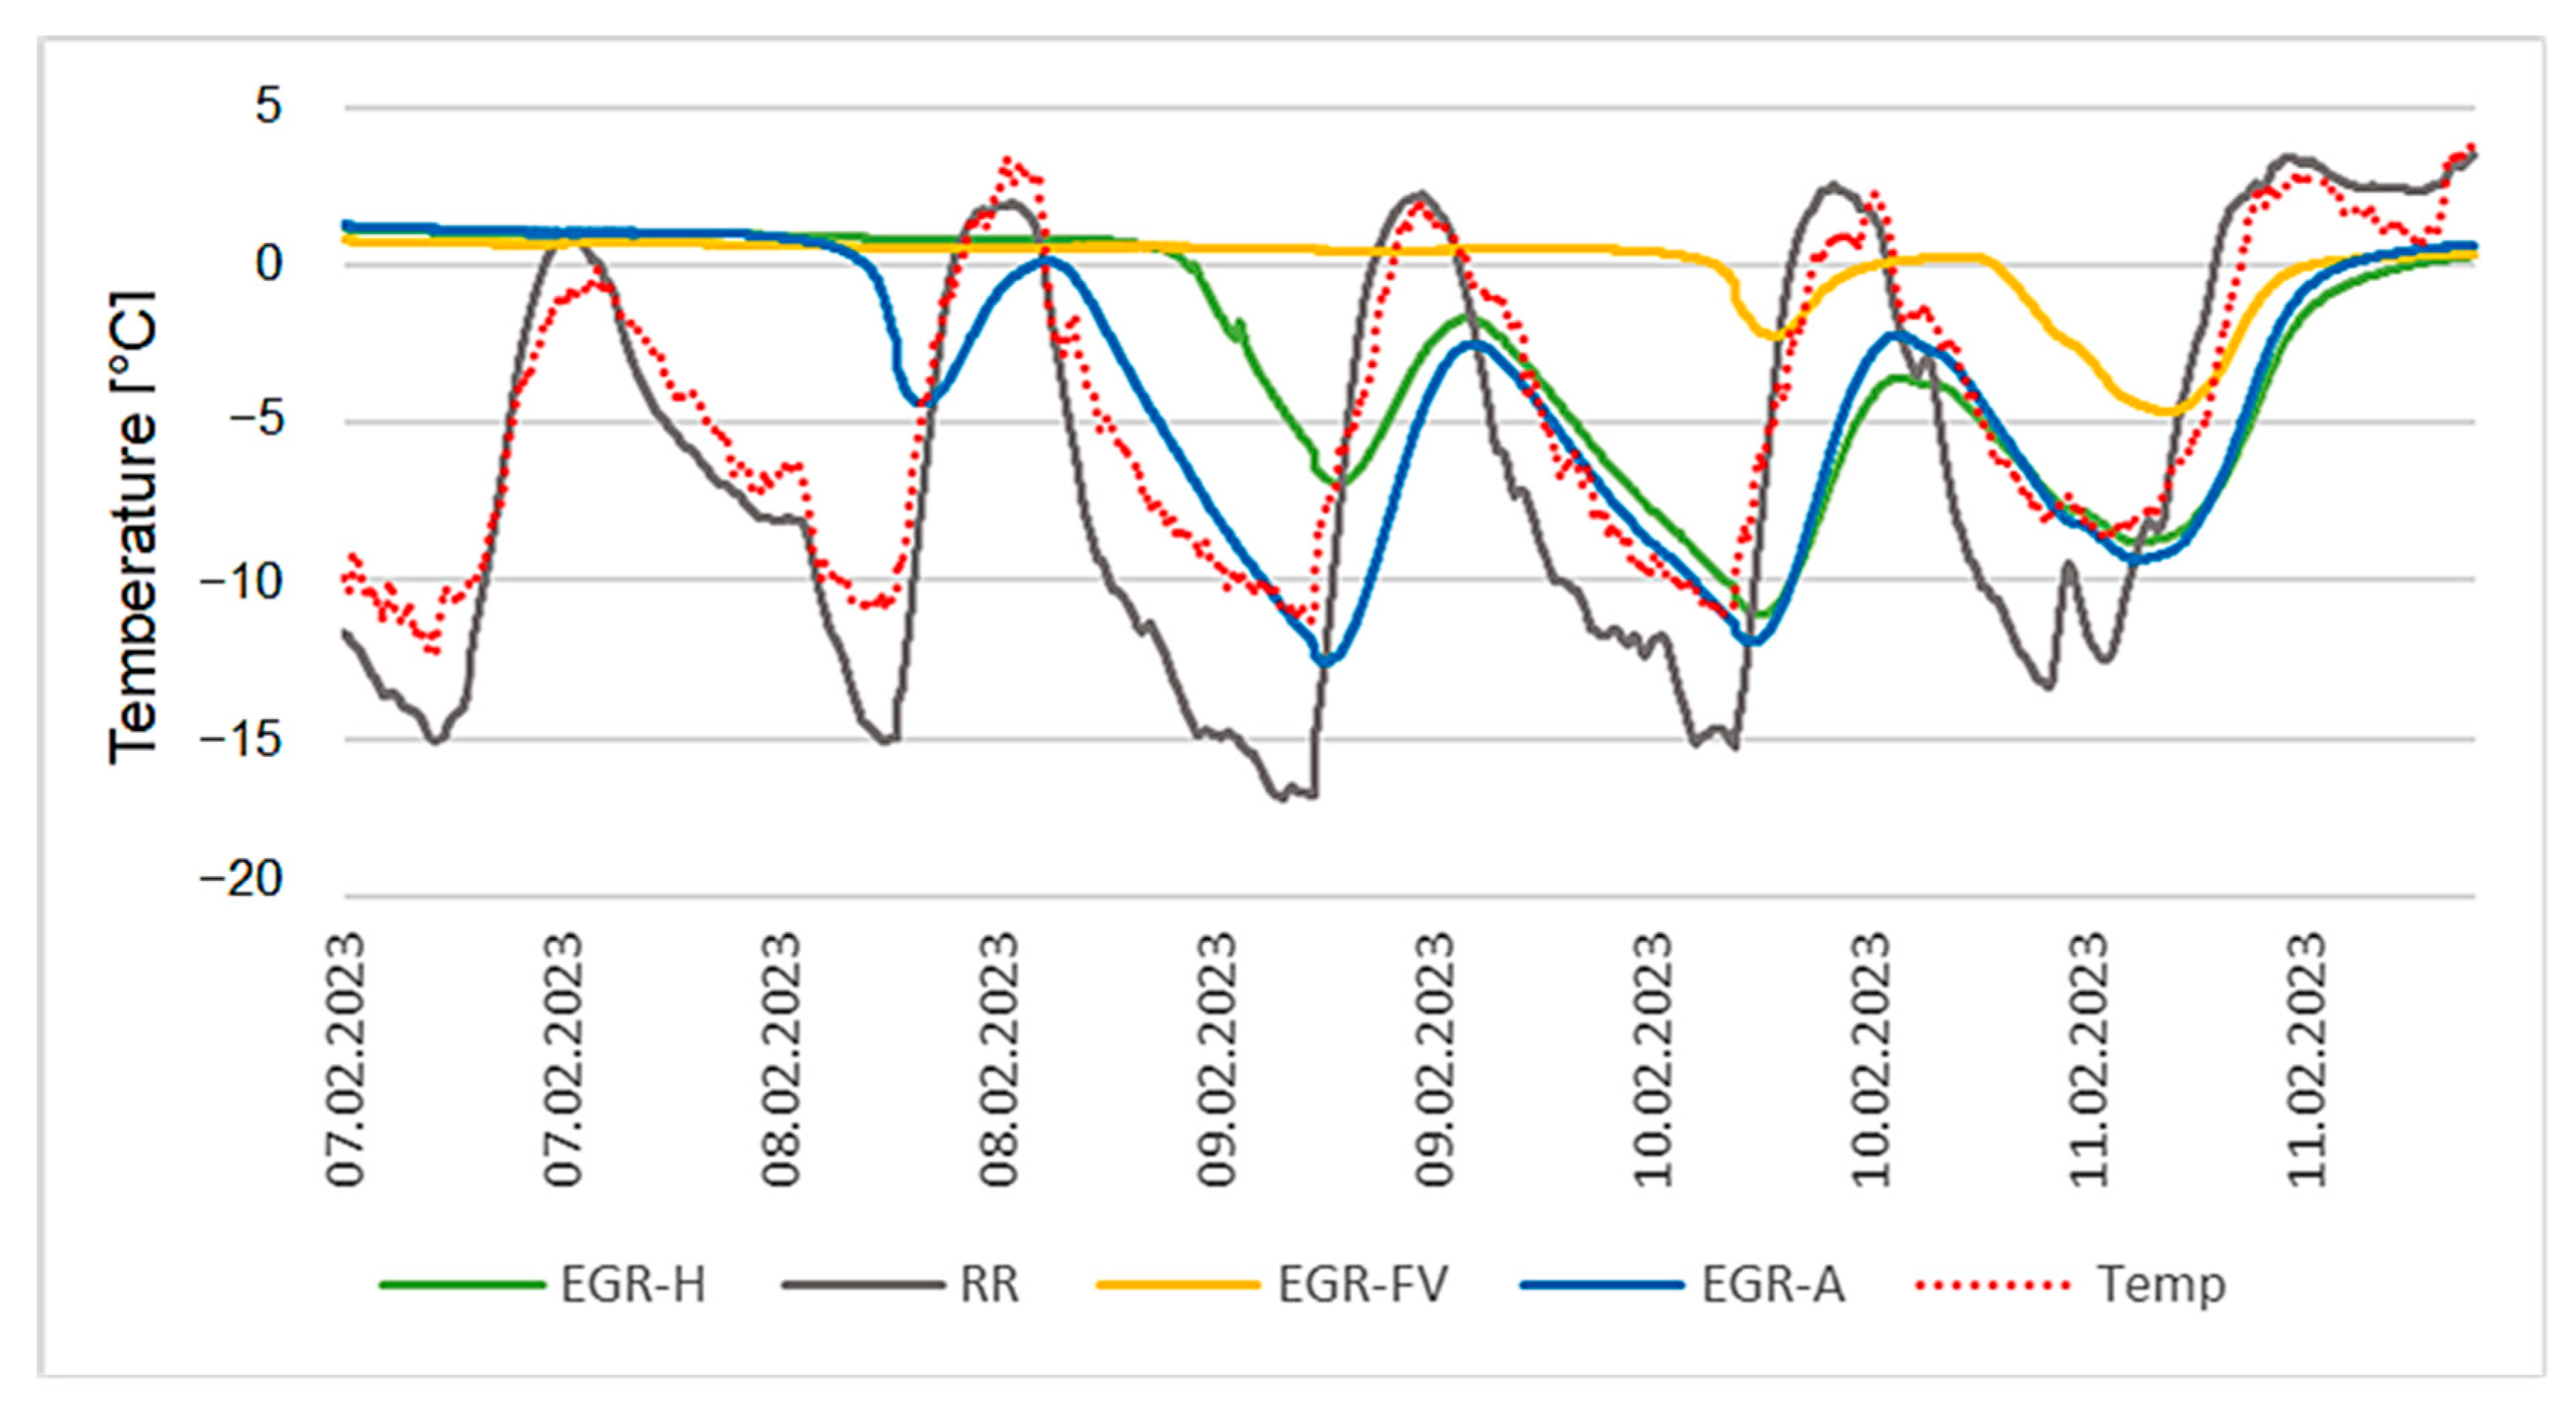
Figure 16 shows the temperatures at the M level. In this case, the composition using PV panels again has the best results, where the temperature was maintained at an almost constant 0 °C. In the case of the vegetation samples, their maximum values at the M level are reduced compared to the surface temperatures by 3 °C, which is caused by the additional layer of the Stered board and the substrate layer. However, here, again, there were significant differences from the results of the measurements in paper [
32], where the temperature at the M level was kept at 0 °C. In this research, the maximum temperature oscillation of the vegetation samples occurs in the case of EGR-A and it ranges from 0 °C to −13 °C. These measurements refute the claim of the advantage of having an EGR in winter, as it cannot significantly limit the temperature fluctuation at the waterproofing-layer level due to its shallow vegetation layer. The difference in temperature reduction at the surface and at the M level in the case of EGR-A is a maximum of 3 °C. There is also a 3.5 h phase shift in minimum temperature relative to the reference roof. The surface temperature values of the vegetation roofs at the M level are close to the outdoor air temperatures. The difference in temperature variation between the reference roof and the vegetation roofs is 4 °C.
The heat flux through the roof structure without snow already has a more interesting course with visible fluctuations during the day, as can be seen in
Figure 17. The vegetation layer, in its composition, dampens and reduces the amount of heat coming out of the building. However, in contrast, the RR performs more favourably during the day when the surface temperature is increased, and so its amount of heat flux is reduced. On average, over the days, this results in balanced heat flux density values for each variant.
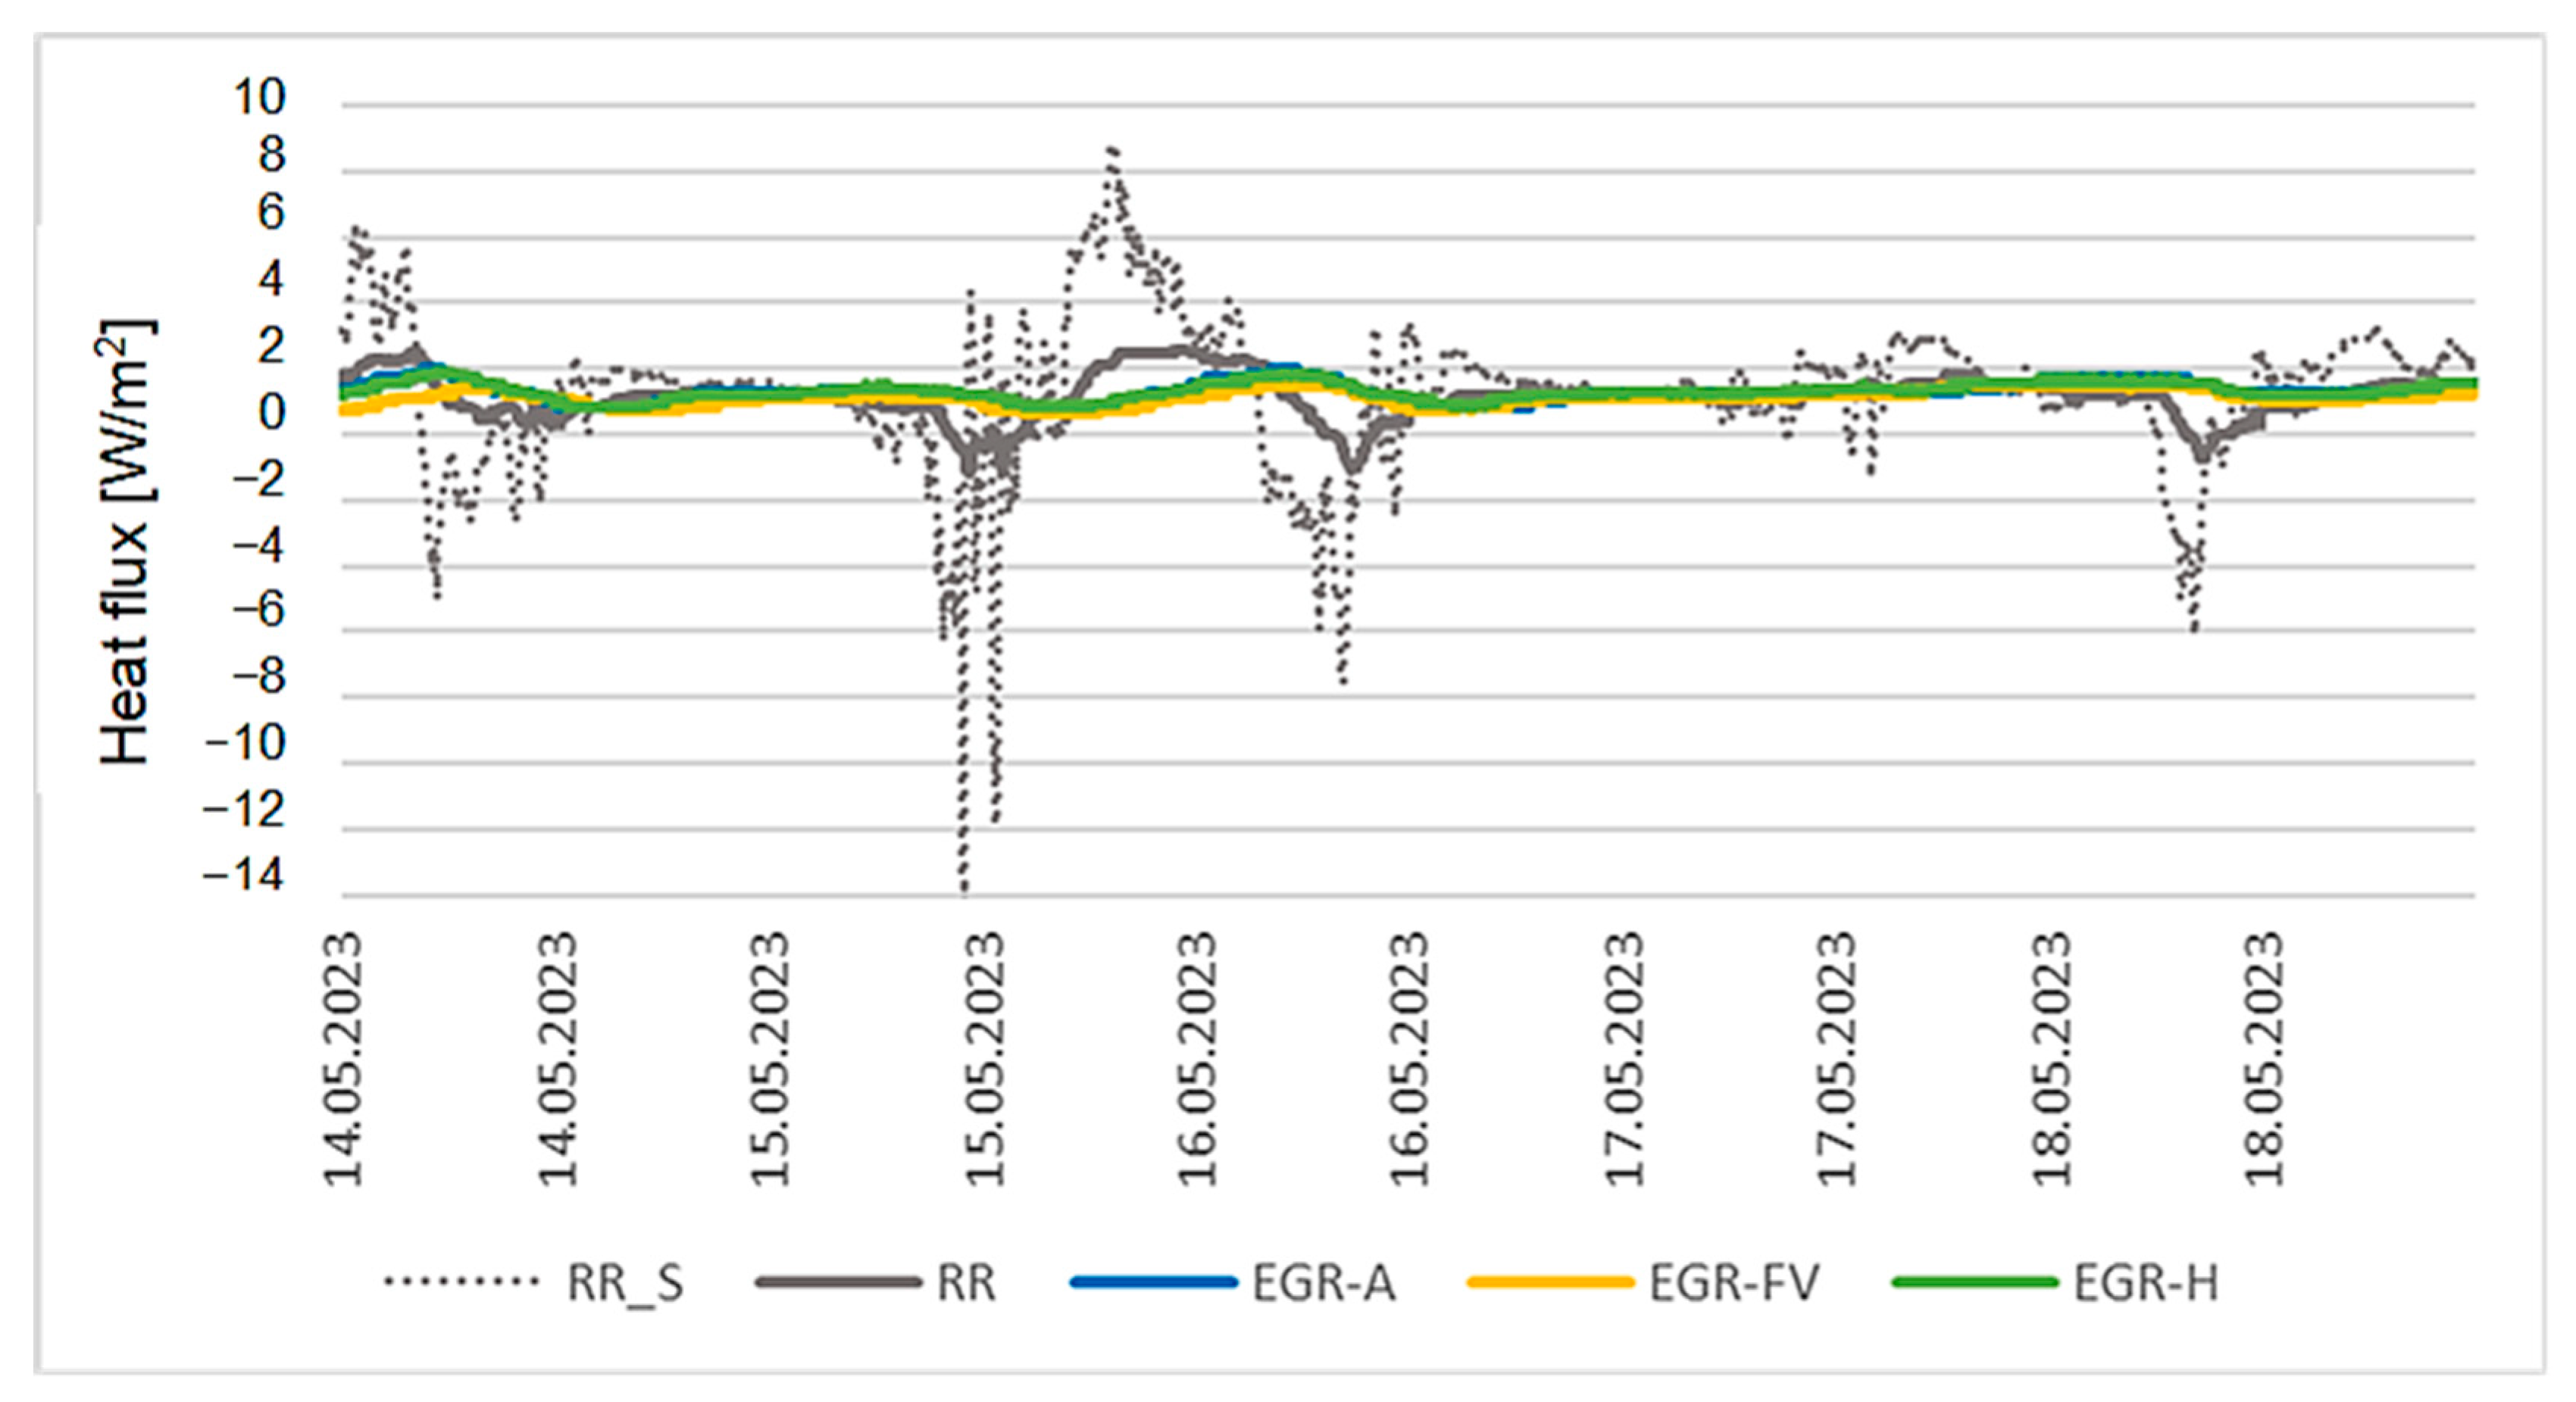
3.4. Summer with Cloudy Weather
A typical summer with cloudy skies is characterized by a low amount of direct solar radiation (a value close to the average of solar radiation on a typical clear-sky day in winter) but a relatively stable outdoor air temperature (noticeably higher temperature compared to a clear-sky winter day). For the period considered, the outdoor air temperature ranged from 10 °C to 13 °C. As mentioned above, direct solar radiation is the dominant factor in the increase in surface temperatures. Since it did not reach high values during this period, the surface temperature of the vegetation compositions was in a similar range to the outdoor air temperature, as can be seen in the graph in
Figure 18. Isolated temperature rise anomalies were shown by the reference roof when higher surface temperatures were measured during the day. A more significant undercooling of the surface temperature also occurred for EGR-A, which is mainly due to insufficient sensor backfill. This sensor significantly replicated the temperature pattern that occurred in the RR, due to the sensor being insufficiently covered by the substrate layer. During this period, the benefit of using a green roof is not strongly felt. The most favourable waveforms were achieved by the sample using FV panels. The maximum temperature difference at night between RR and EGR-FV was up to 5 °C in favour of EGR-FV. In contrast, during the day it damped the largest temperature fluctuations. The maximum temperature difference during the day was 3.5 °C. An exception was demonstrated in the thermal resistance of the sample using FV panels, where the temperature stabilised at higher values for a longer period than for the other samples.
A similar temperature pattern to that of the compositions’ surface also takes place at the M level, as can be seen in
Figure 19. The additional vegetation layers’ compositions dampen the oscillations in temperature and provide a smoother temperature path (a reduction in sudden fluctuations to extremes). The temperature at the M level is comparable to the surface temperature. This is also due to the fact that the interior had a higher temperature than its exterior surface. In this case, the composition maintained thermal stability even in the interior, and there was not such a large temperature fluctuation in the composition of the whole structure. In the EGR samples, there was also a significant phase shift in the temperature at the surface and at M level. The maximum difference during the day was up to 3.5 h.
The heat flux was also steady at this time (
Figure 20), as there were no significant temperature fluctuations. However, the values still show a slight heat loss, as during this period the indoor air temperature was higher than the outdoor air temperature. However, the loss values are very low. They range from 0 W/m
2 to 2 W/m
2. An isolated fluctuation in this value was obtained in the case of the measurement of a plate placed under the M at a time of semi-cloudy weather. A more pronounced oscillation occurs in this HFP, which is labelled RR_S. The HFP was placed directly under the M. In the other cases, the HFPs are placed under a layer of TI, which causes a reduction in the oscillation of their heat flux.
3.5. Summer with Sunny Weather
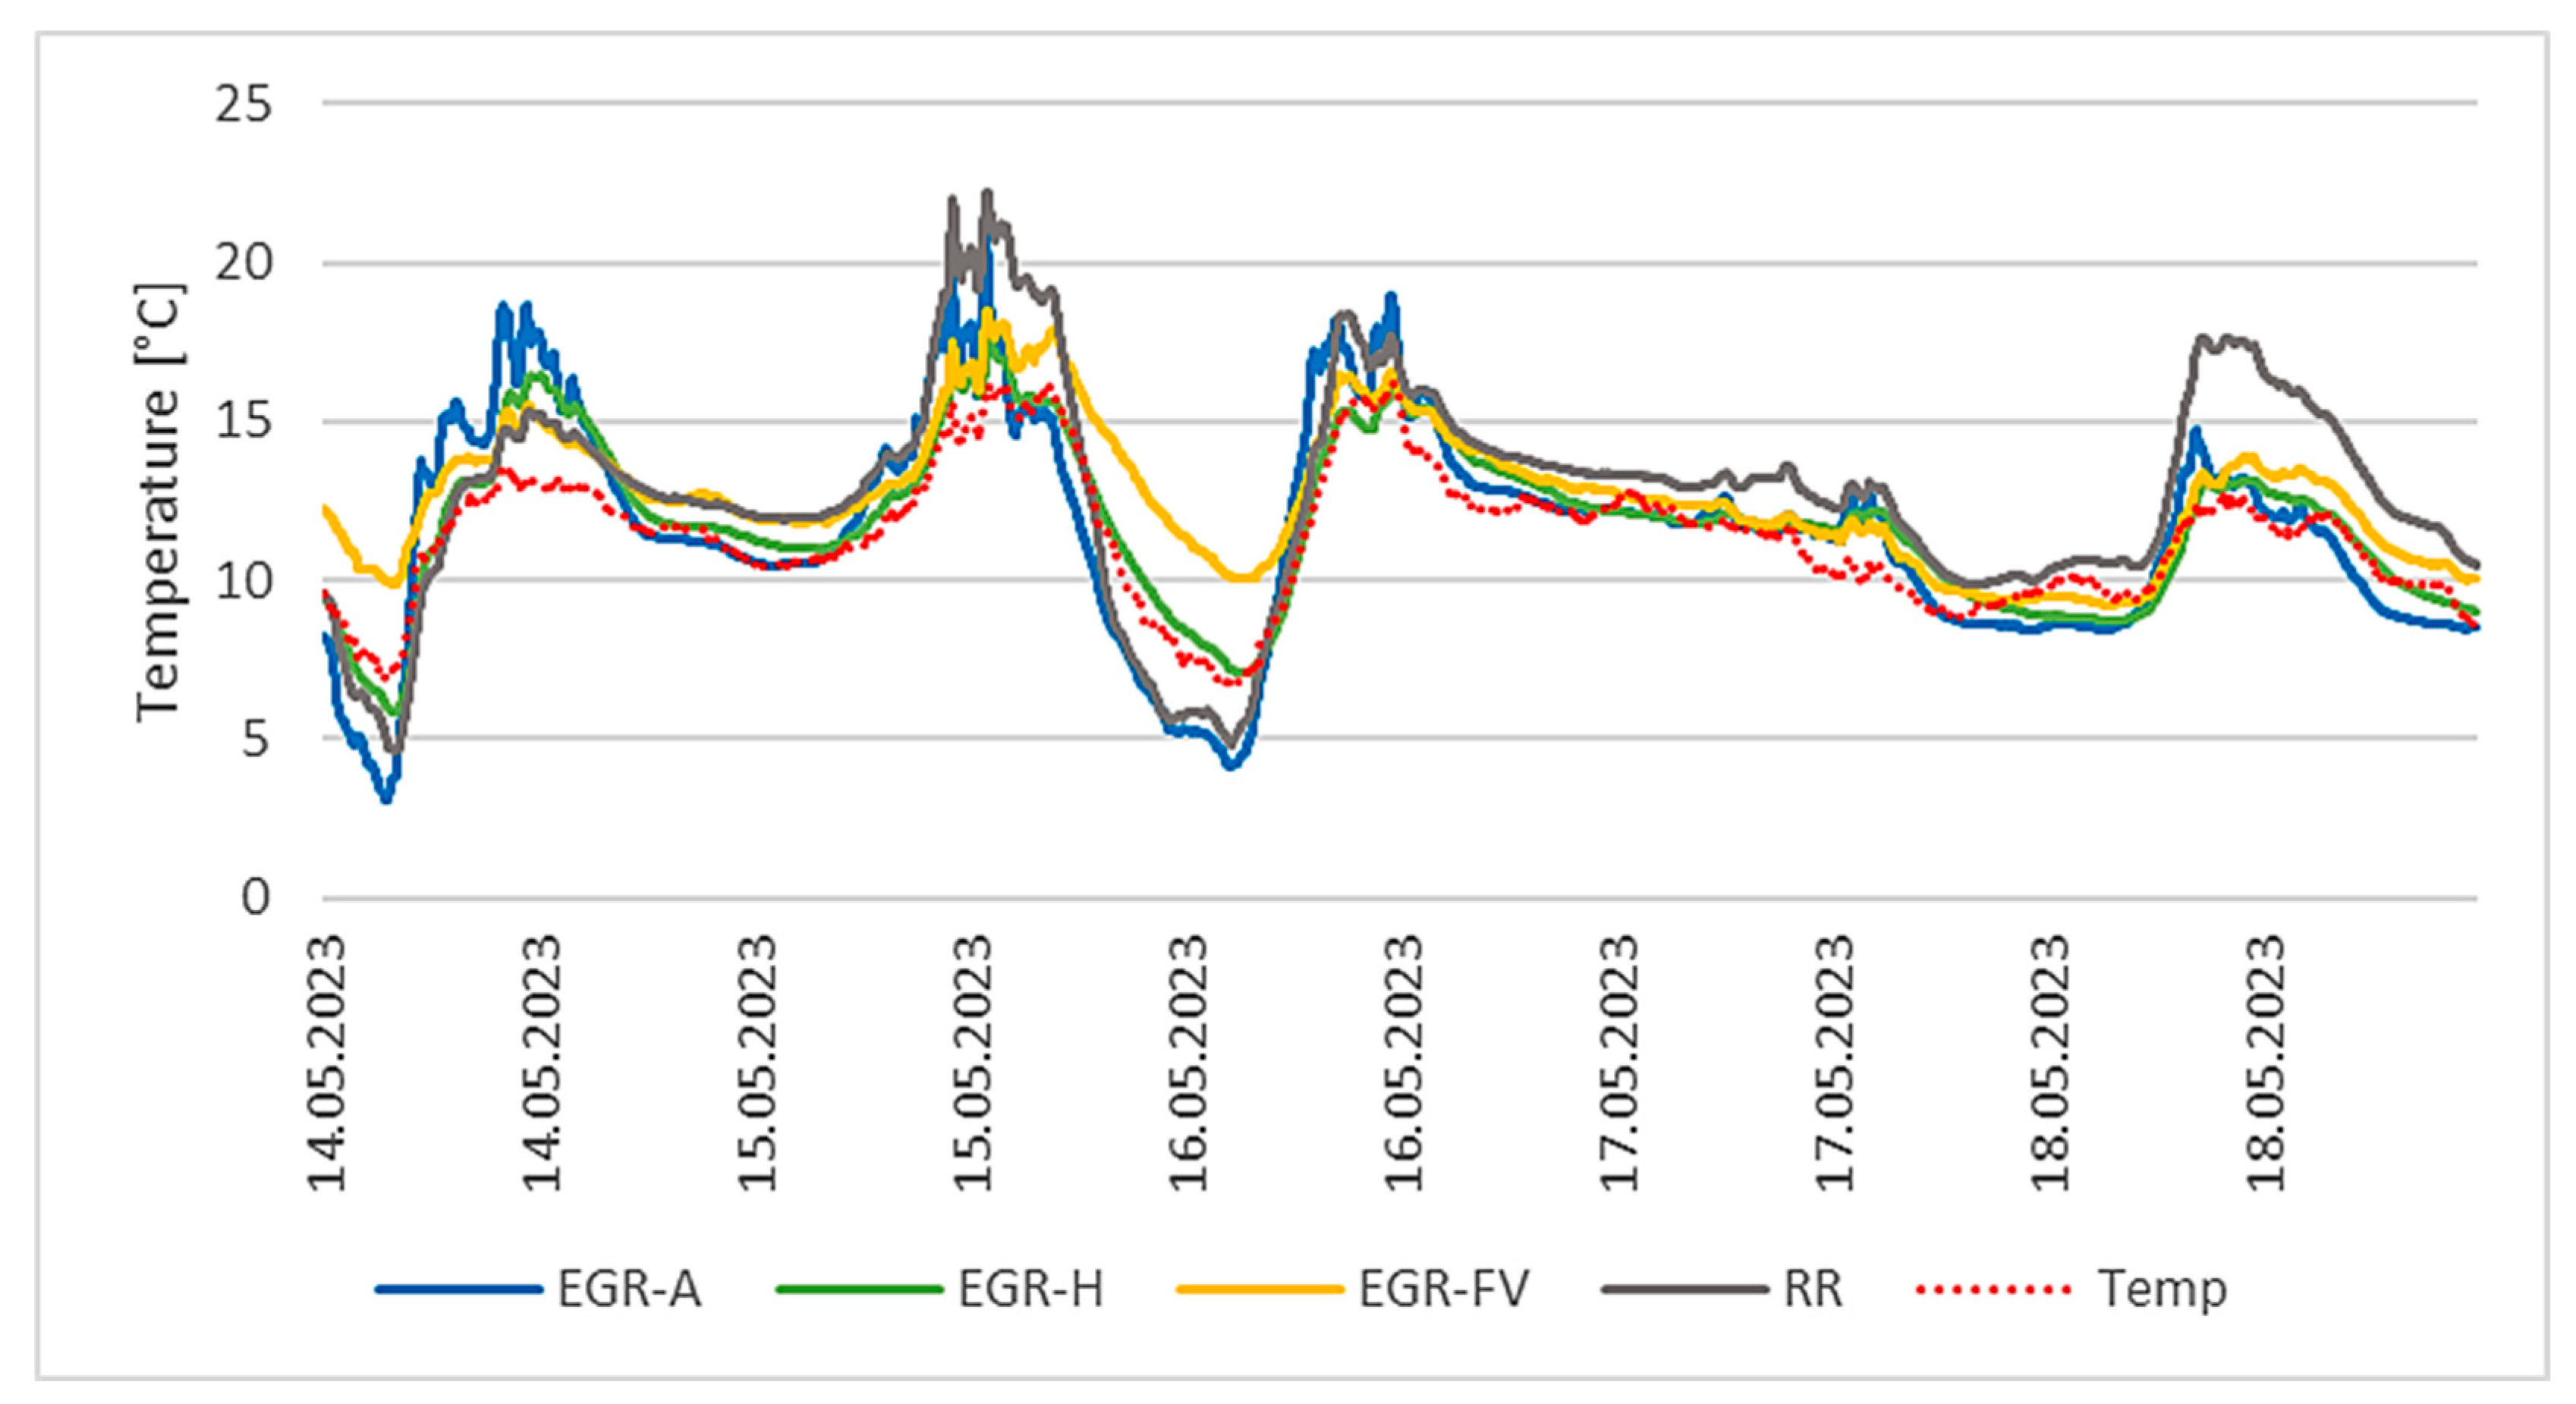
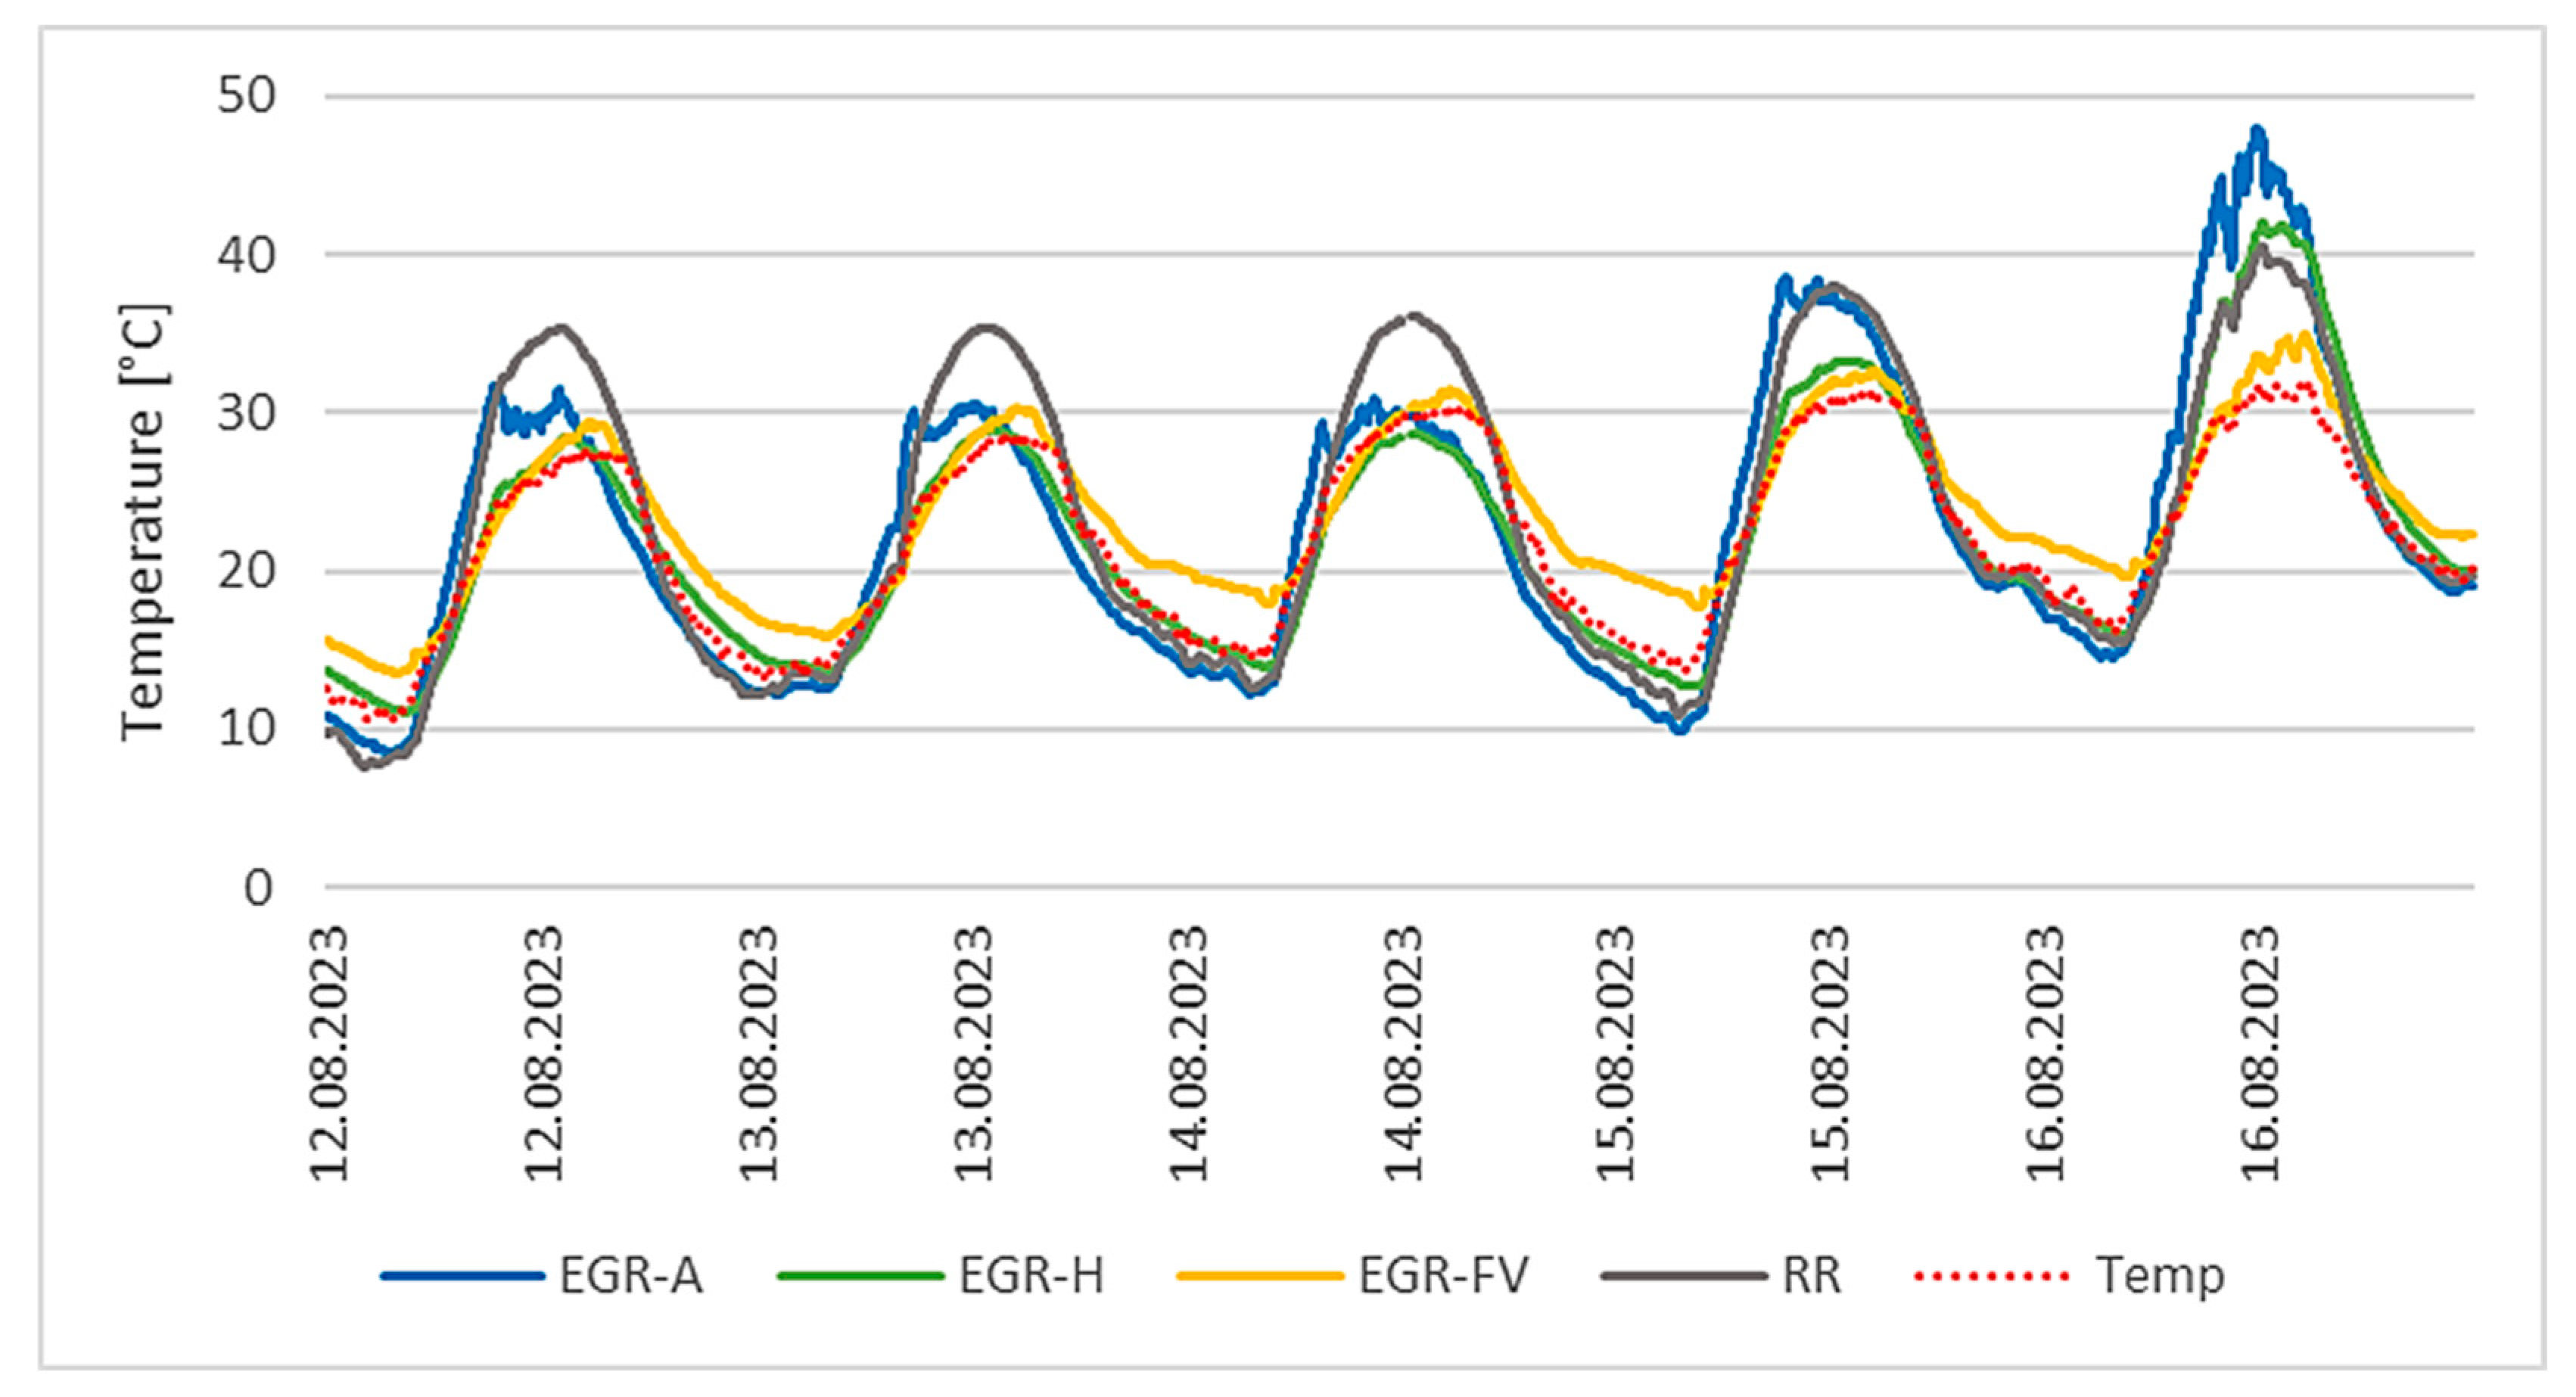
A period with representative values for solar radiation and outdoor air temperature was selected to present the results for the summer period with typical sunny weather. This period occurred after a number of rainy days. This can also be noticed in the graph in
Figure 21. During the first half of the period under study, the vegetation layers reached lower surface temperatures. However, this changed in the second half of the period. As the vegetation canopy’s composition is relatively “young”, there has not yet been surface coverage, which leads to a significant increase in its surface temperature in the summer period. Thus, the benefits described earlier are not manifested as they would be with a composition with normal vegetation coverage. It can be seen that the surface temperature difference between the EGR and RR at the time, just after irrigation, is 3 °C in favour of EGR. However, at the end of the study period, when the sample had dried out, the difference is up to 8 °C in favour of the RR. During this observation period, the increase in surface temperature is 4.5 °C for RR and 15.5 °C for the EGR-A sample. The importance of EGR irrigation is also confirmed in paper [
37], where they measured a temperature reduction of 6.4 °C just after irrigation. The graph shows a significantly higher surface temperature on green roofs due to their significantly darker surface than in the case of light-coloured waterproofing. The increase in surface temperature follows the increase in solar radiation and not primarily the increase in the outside air temperature. It is common knowledge that outdoor surfaces heat up faster than the outdoor air itself. The most favourable results appear to be in favour of a vegetated roof using FV panels. In this case, the shading effect of the FV panels again has an important role. Although the panels themselves overheat, this does not affect the temperature at the surface of the structure below them. The temperature difference across the observed week for the EGR-FV sample is 4.5 °C, which represents a 71% reduction in surface temperature increase compared to EGR-A.
In summer, the aim is to eliminate heat transport into the building and thus ensure energy savings in terms of cooling. One of the implications of this is precisely the attempt to reduce the temperature in the structure’s roof composition. This has a significant effect, especially during the irrigation of the vegetation layers during prolonged days of heat without the presence of rain. As we can notice in
Figure 21, which describes the surface temperature’s evolution, the hydro-accumulation capacity of green roofs can favourably eliminate temperatures in the post-watering (post-rain) period.
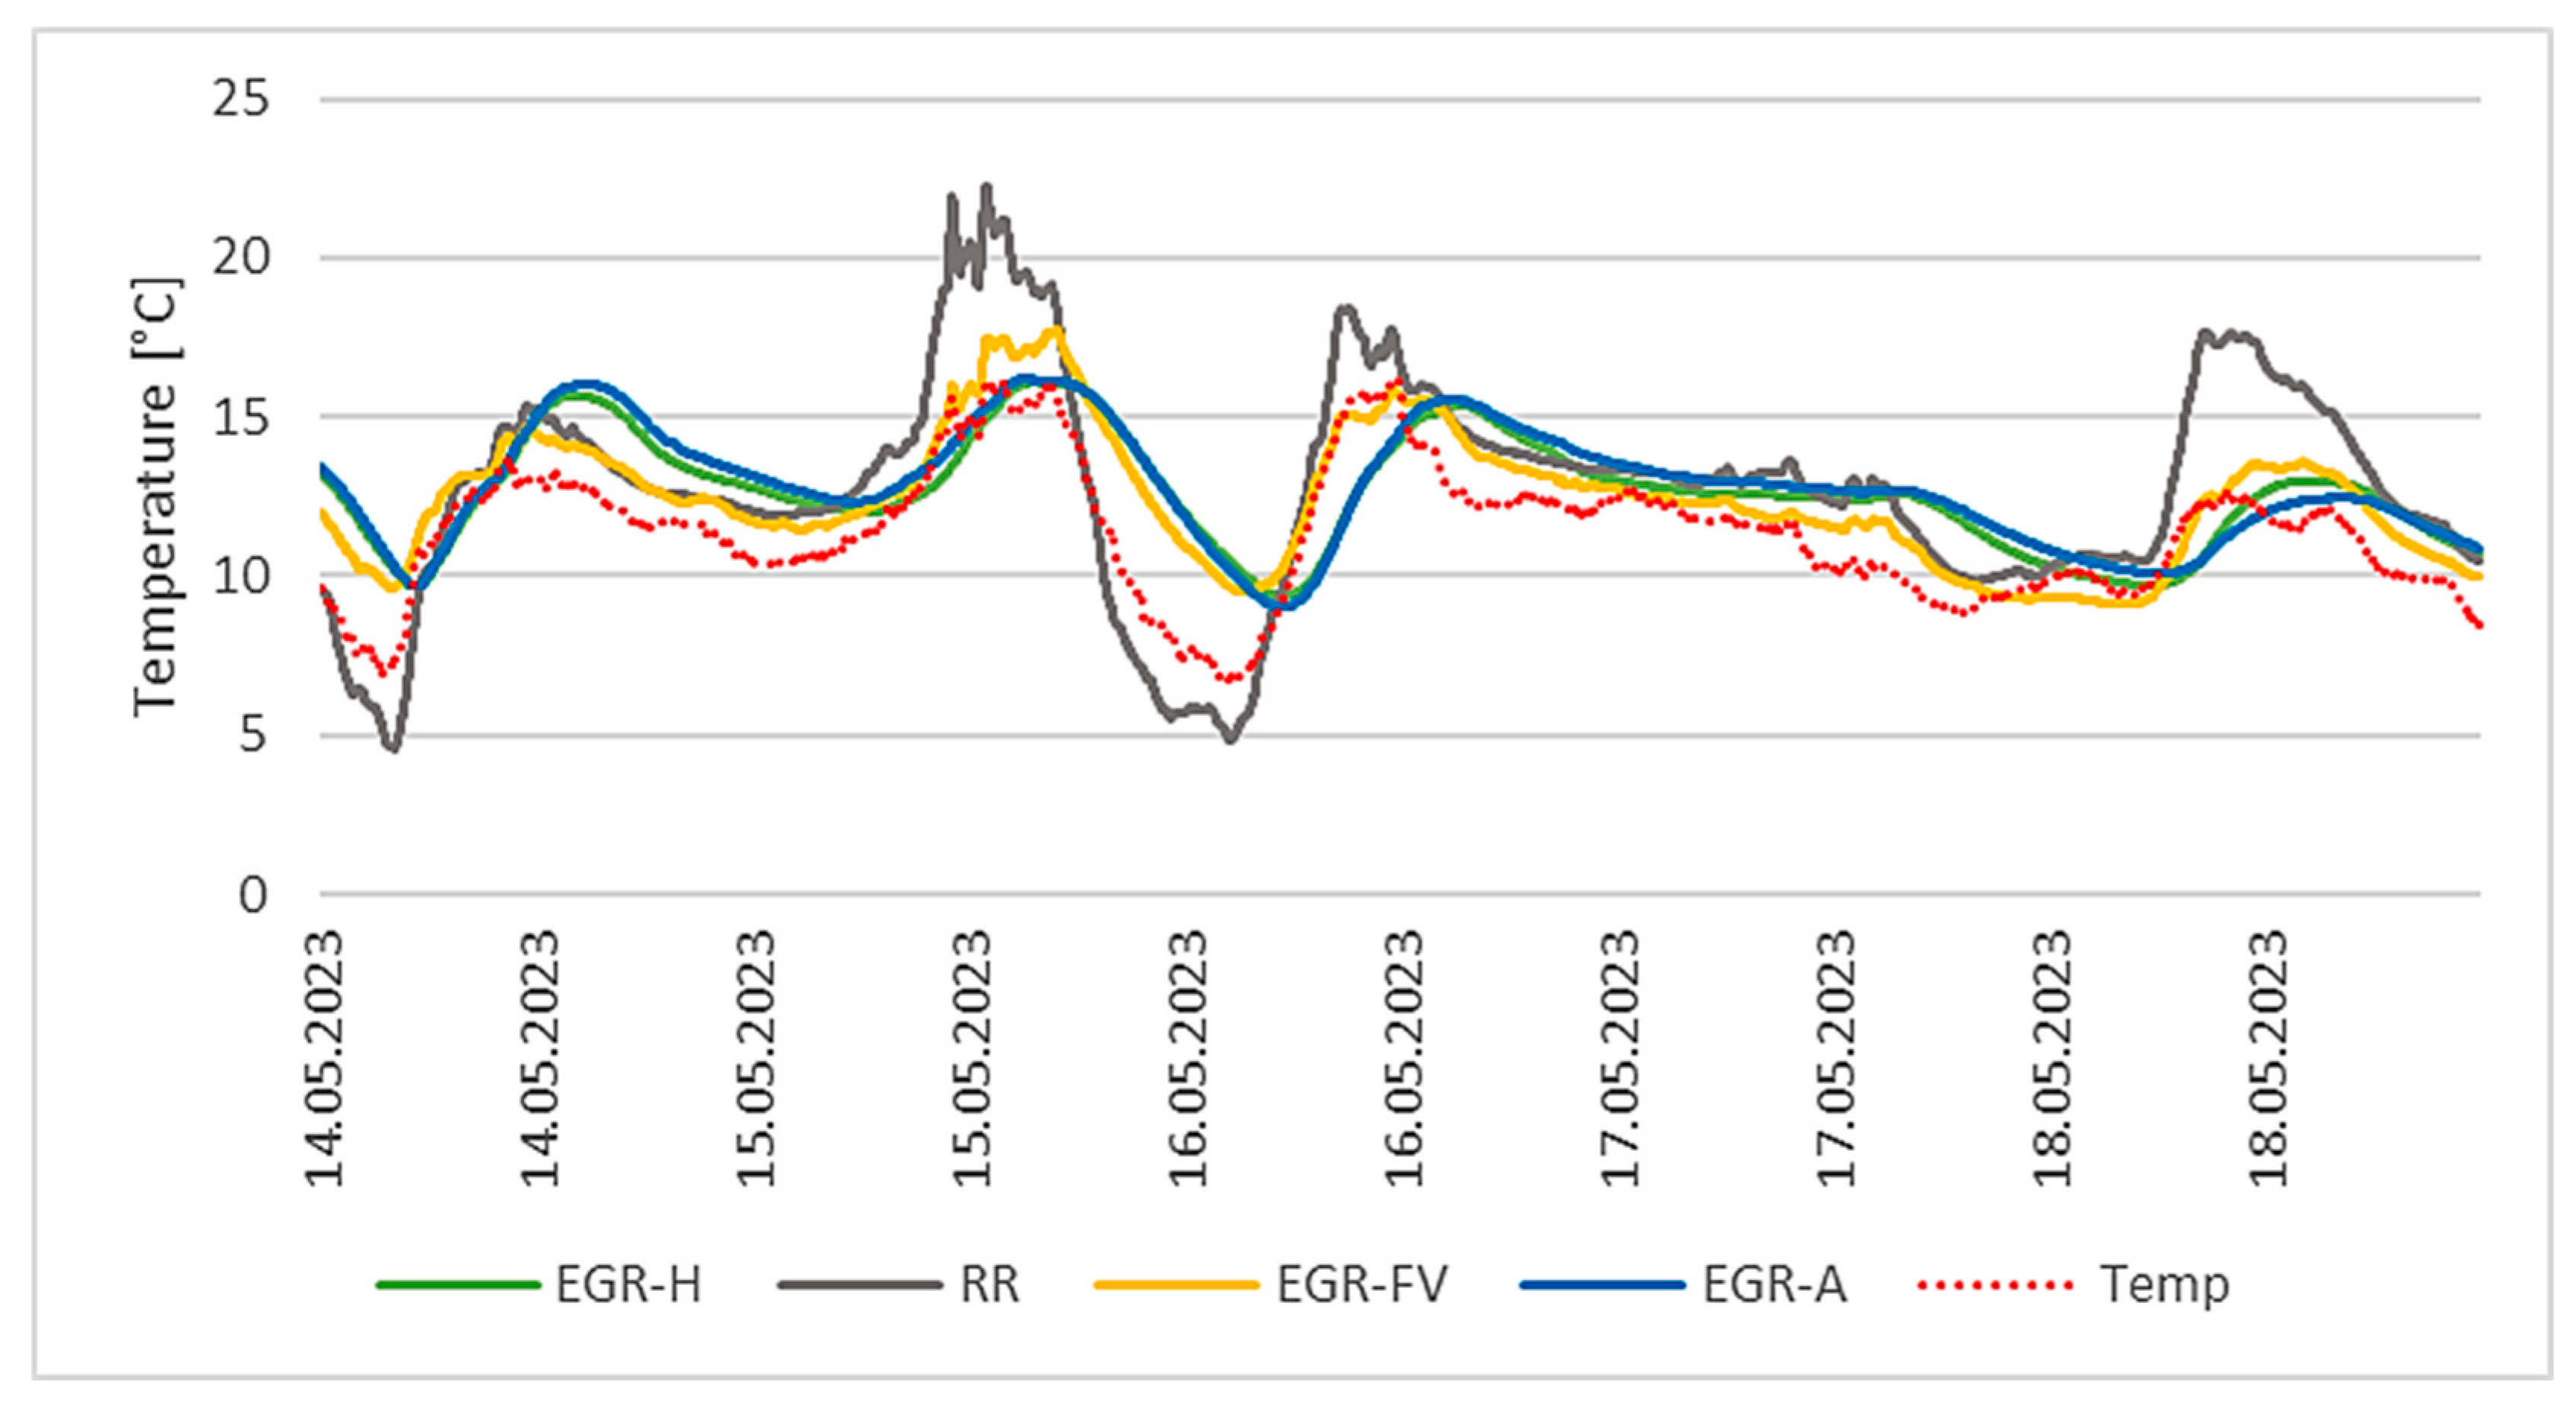
Figure 22 shows the roof temperatures at the M level. The graph shows the temperature reduction at the M level due to the evaporative cooling of the irrigated layers above the M. The maximum temperature difference obtained between the surface temperature and the M level temperature during this observation period was up to 10 °C and this was for EGR-A. It is also possible to note a temporal shift of the maximum temperatures, in the case of the vegetation samples. However, the temperature difference at the M level increases radically due to the drying of the sample. The temperature difference for EGR-A at the beginning of the observation week and at the end of the observation week is up to 9.5 °C. However, the difference for the EGR-FV sample is only 6.5 °C. The phase shift in temperature has also changed. It was 3 h at the beginning of the week, and it was reduced to only 1 h at the end of the week. Here, the importance of active EGR irrigation was observed to be a significant factor.
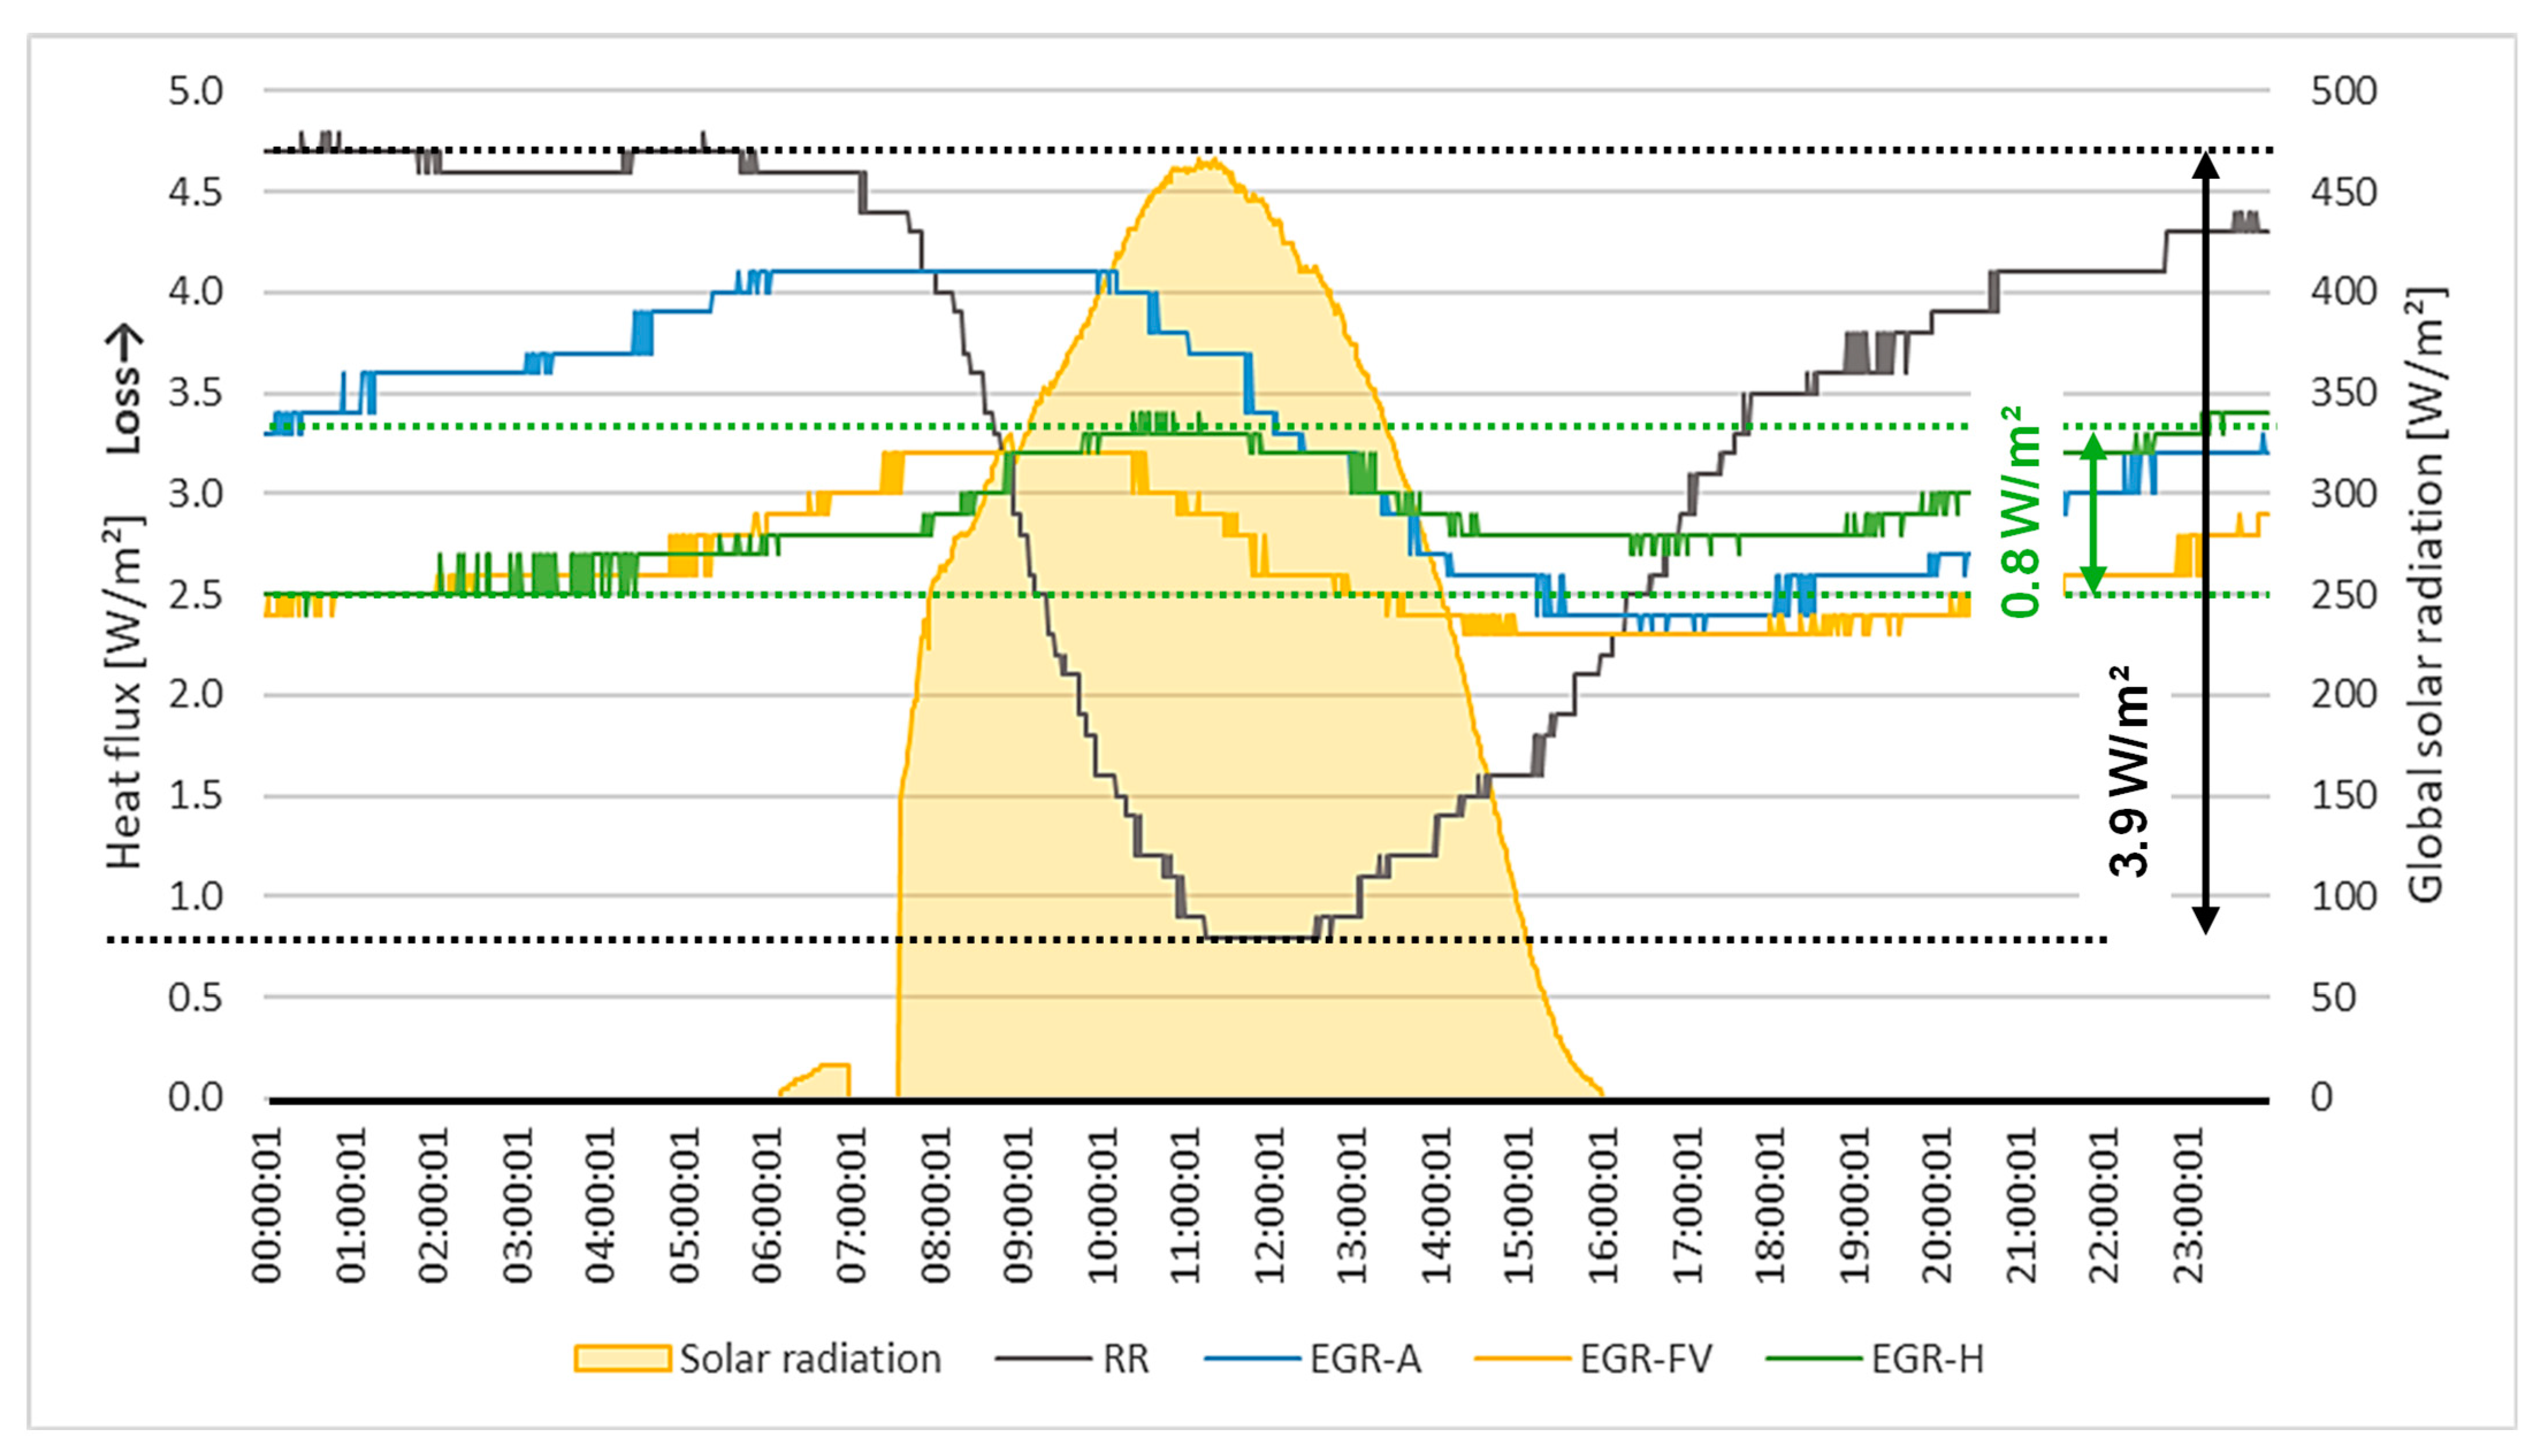
In
Figure 23, the transition from heat loss to heat gain during the day can be seen for all types of roof composition variations observed. The graph shows a higher oscillation of heat flux for the reference roof than for the vegetated roof compositions. This is where significant differences occur in their heat gains during the day and heat losses during the night. The reduction in the oscillation in the EGR case is mainly due to the ability of its vegetation layer and active irrigation to stabilise the temperature regime, which reduces the increase in its surface temperature at the times with the highest global radiation values. The composition with FV panels shows the most stable behaviour of the observed roof samples. It is also possible to notice a significant time shift in the transition from heat losses to heat gains in a comparison between the reference roof and the EGR. This time shift causes the heat gains to occur significantly later in the day in the EGR case than in the RR case. The time shift of this transition is up to 5.5 h.
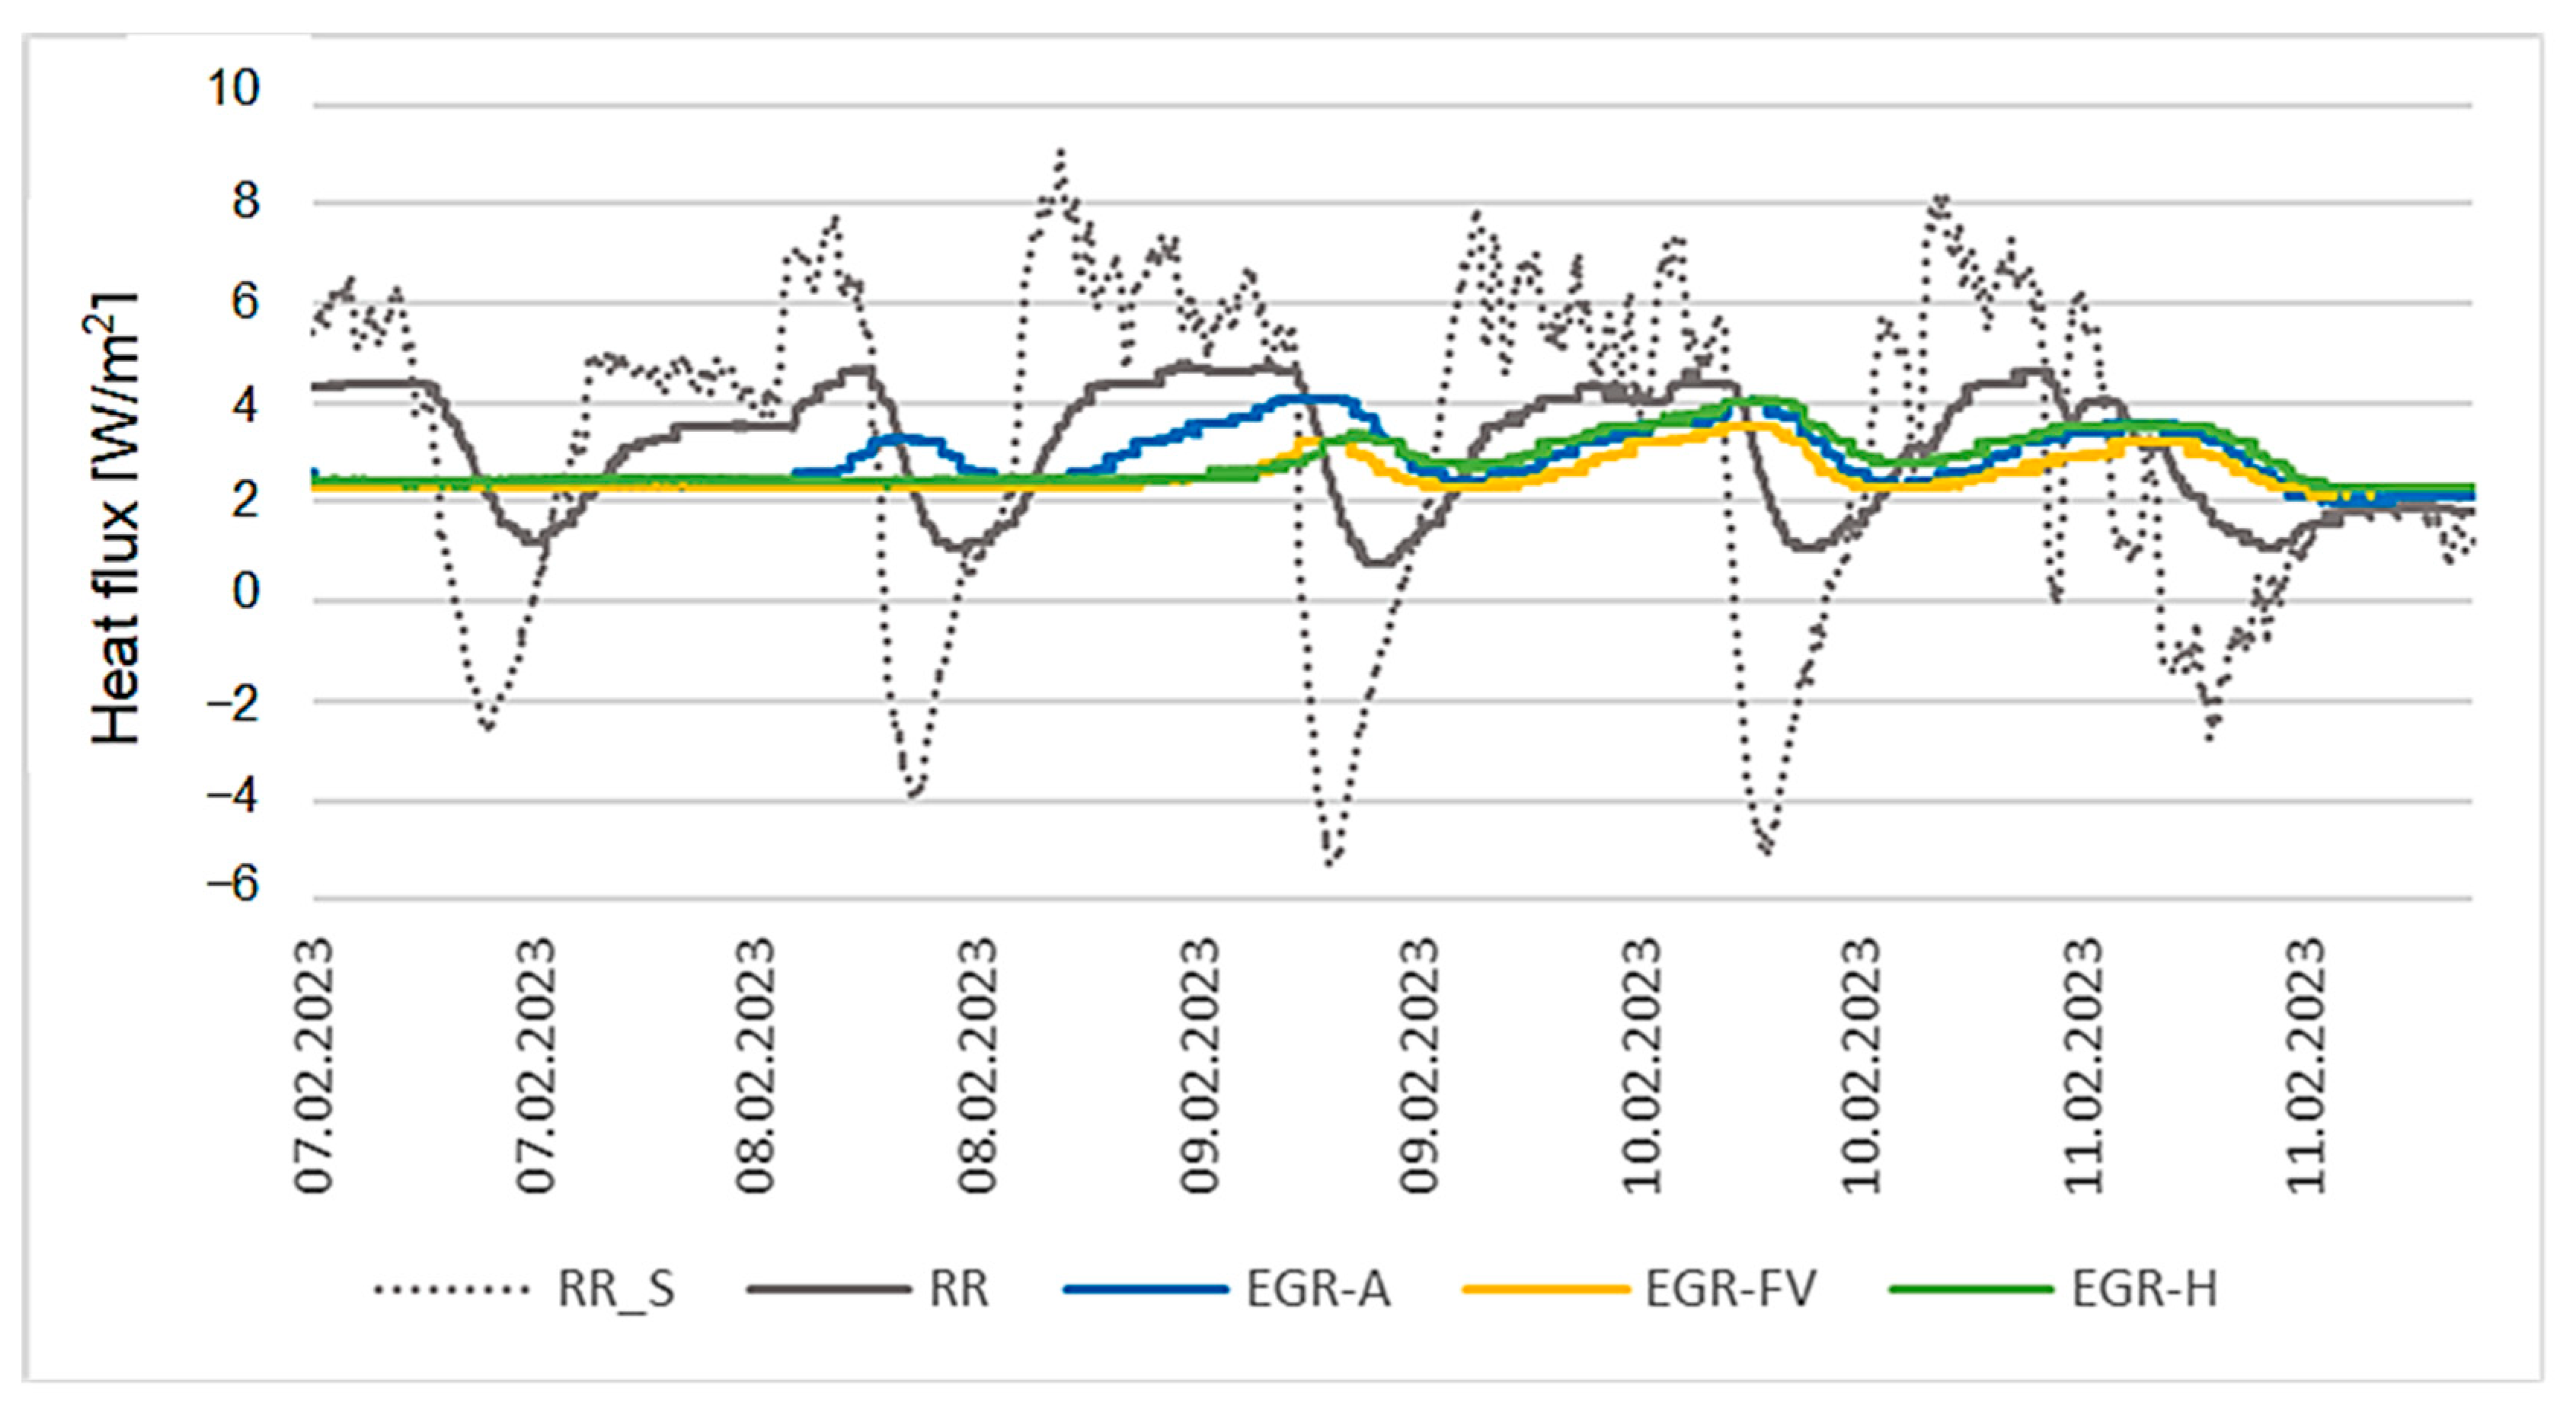
3.6. Heat Flux Analysis Selected Representative Days from the Winter and Summer Period
Figure 14,
Figure 17,
Figure 20, and
Figure 23 present the heat flux trends across each sample. The heat flux trends with the largest oscillation are achieved by the sample with unprotected waterproofing, either in the winter or in the summer period. The samples with additional layers dampen the oscillation of the heat flux. All samples showed heat loss in the winter period. More interesting trends occur in the summer period. Here, there is a blending of heat gain and heat loss through the structure. In the summer period, the aim is to achieve the smallest possible heat gains, which require additional cooling. For a better interpretation of the results, a single day was selected and the heat flow behaviour of the winter and summer periods was analysed in more detail, as can be seen in
Figure 24 and
Figure 25.
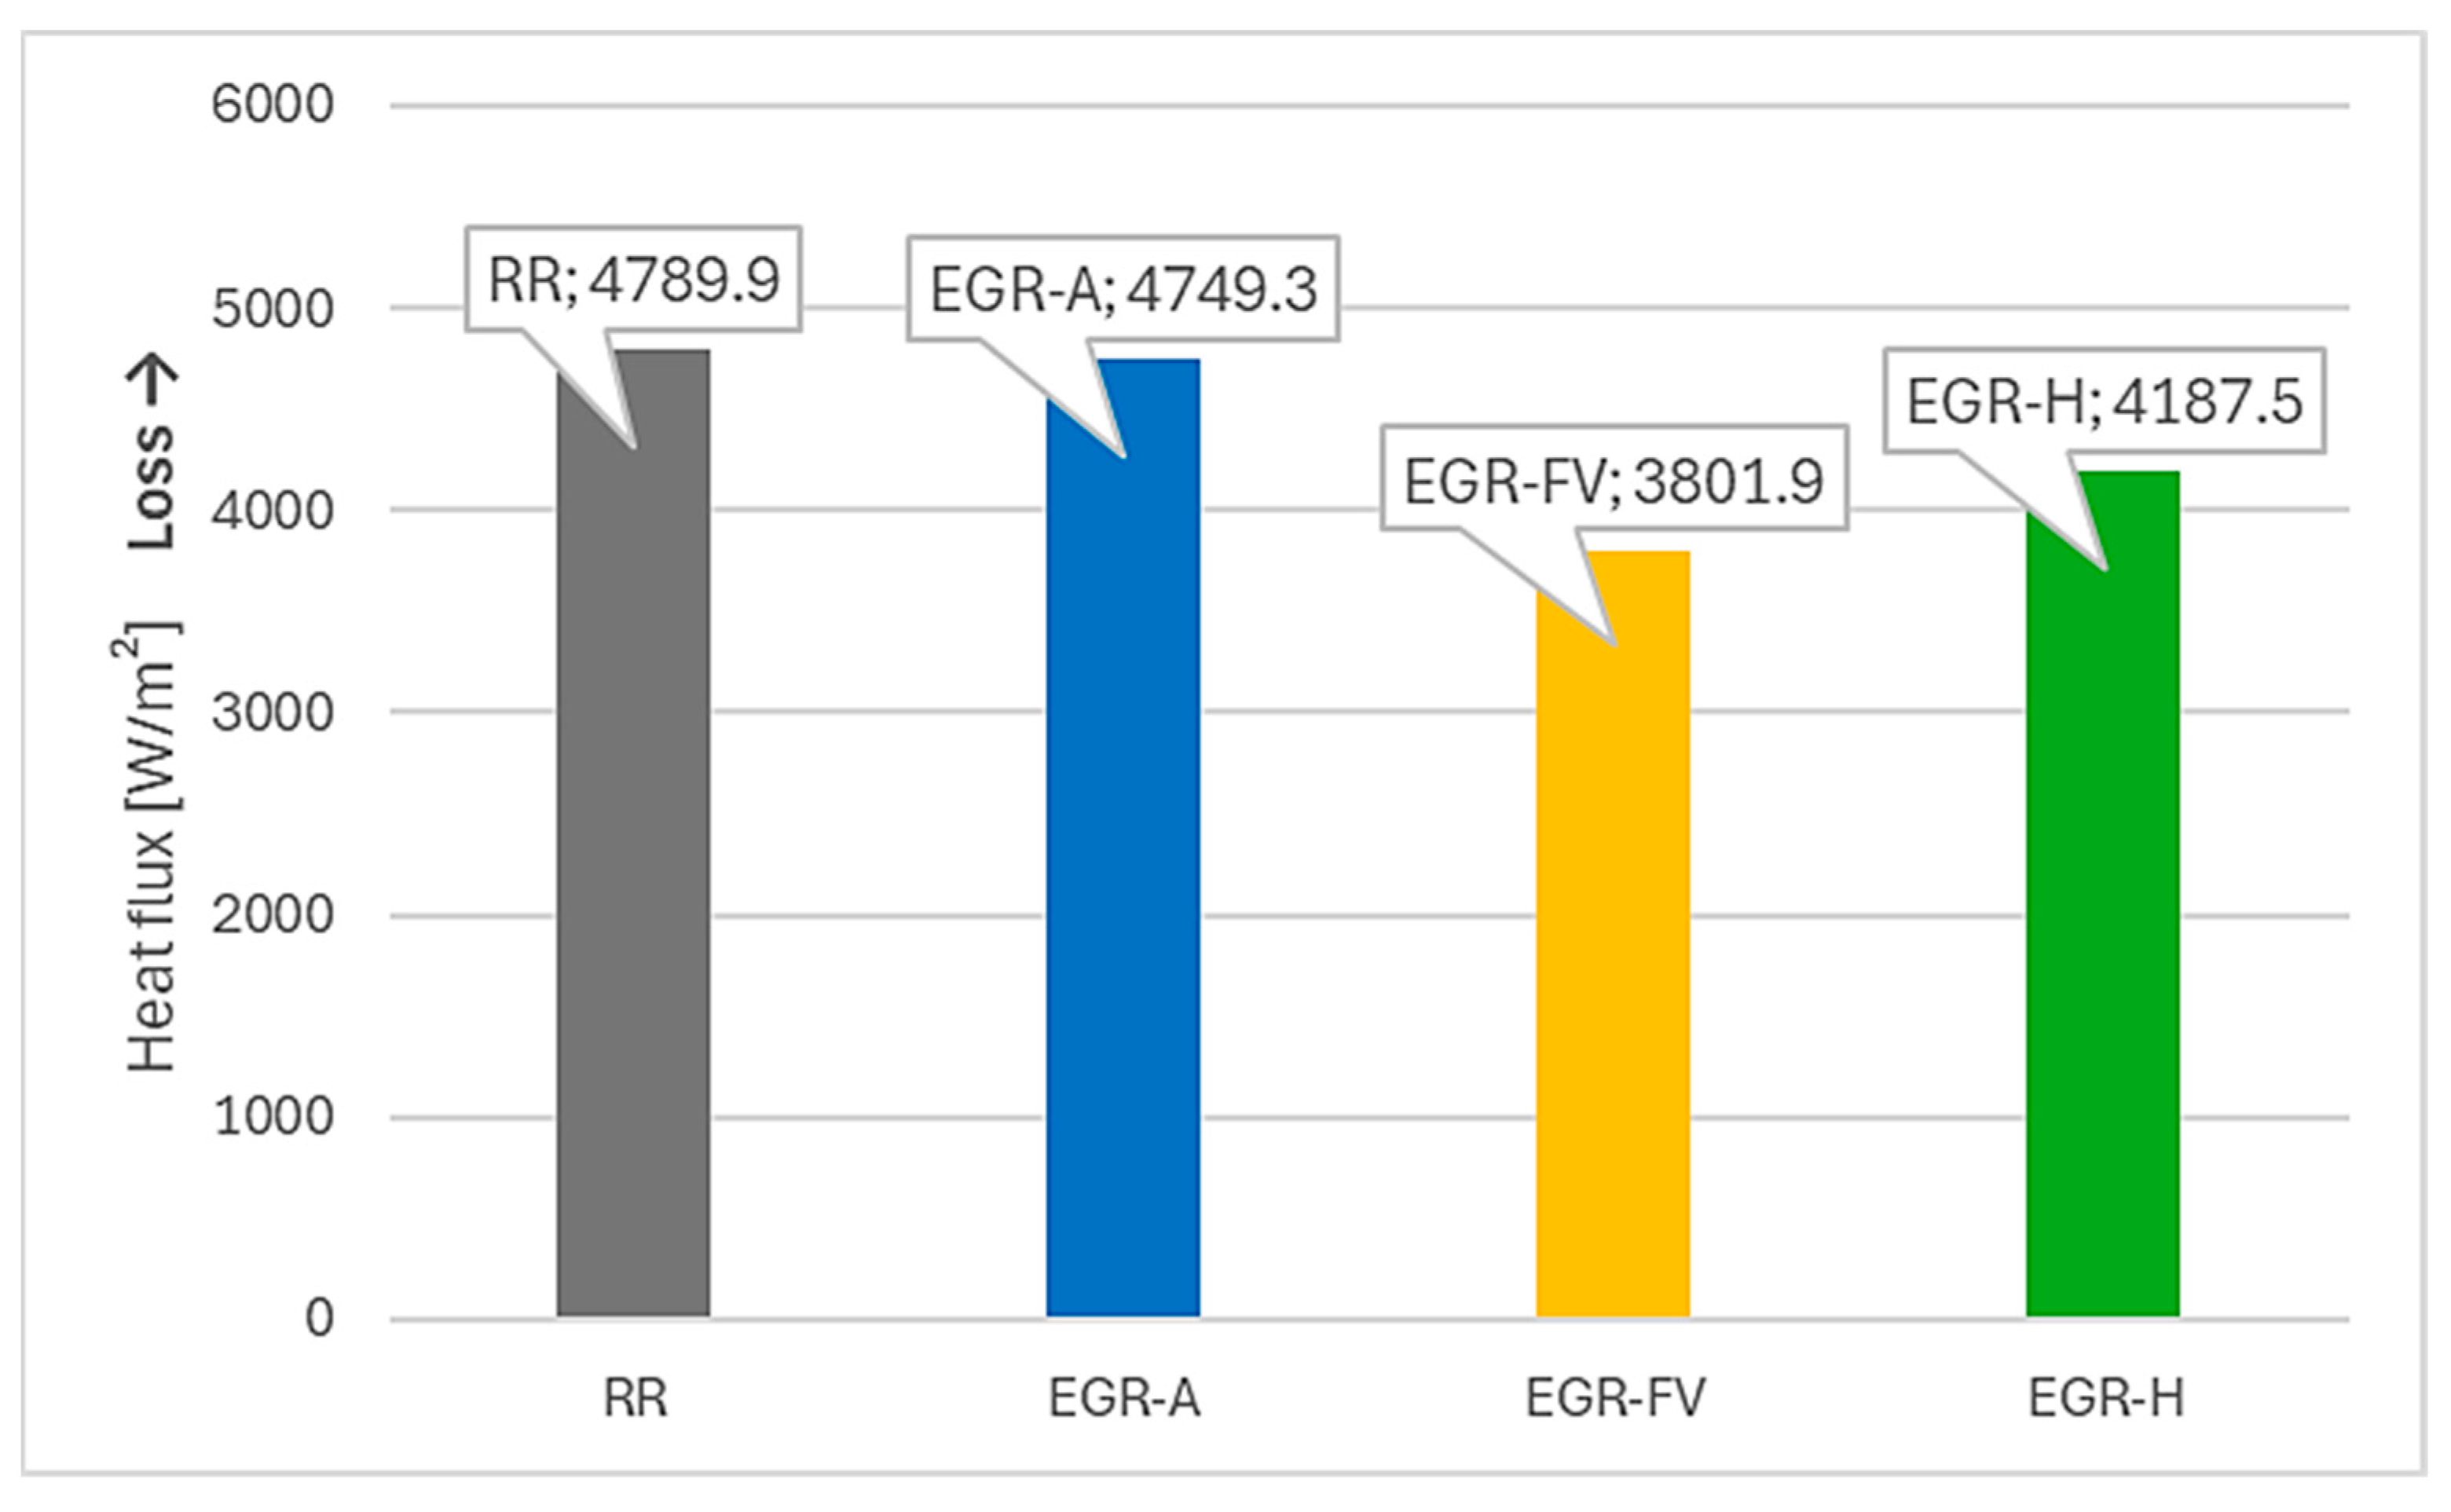
From the winter period, the date 09.02.2023 was selected, which was a clear day without snow cover, to demonstrate the behaviour of heat flow without the intervention of the snow layer as an additional insulating thermal layer. From the summer period, the date 12.08.2023 was selected, which was also clear and sunny, with typical solar radiation and outdoor air temperature behaviours for the summer period.
A significant link in the results is the reduction in the heat flux’s fluctuation. An oscillation reduction of more than 3 W/m
2 was achieved in both periods. In a detailed analysis of the selected day, the oscillation of the heat flux within the composition of the reference roof can be observed more thoroughly. This sample has reduced heat losses due to daytime overheating compared to the EGR samples, but it similarly has larger losses at night due to the subcooling of its external surface. Thus, in the diurnal heat flux sum, the RR achieves a similar overall heat flux to the other EGRs, which can be seen in
Figure 25.
In
Figure 25, we can notice that the sample using PV panels achieved the lowest heat loss at this time. Compared to the RR, this is a reduction in heat loss of almost 21%. This is mainly due to the shielding of the sample by the panels, which prevents the sample from undercooling and also prevents heat accumulation in the space under the PV panel during the day. The vegetation samples, in this case, do not show significant differences in their elimination of heat losses. The difference between the RR and EGR is in the range of 0.1–12%. The small vegetation layer fails to provide a sufficient accumulation layer to limit the heat lost through the structure during the winter period.
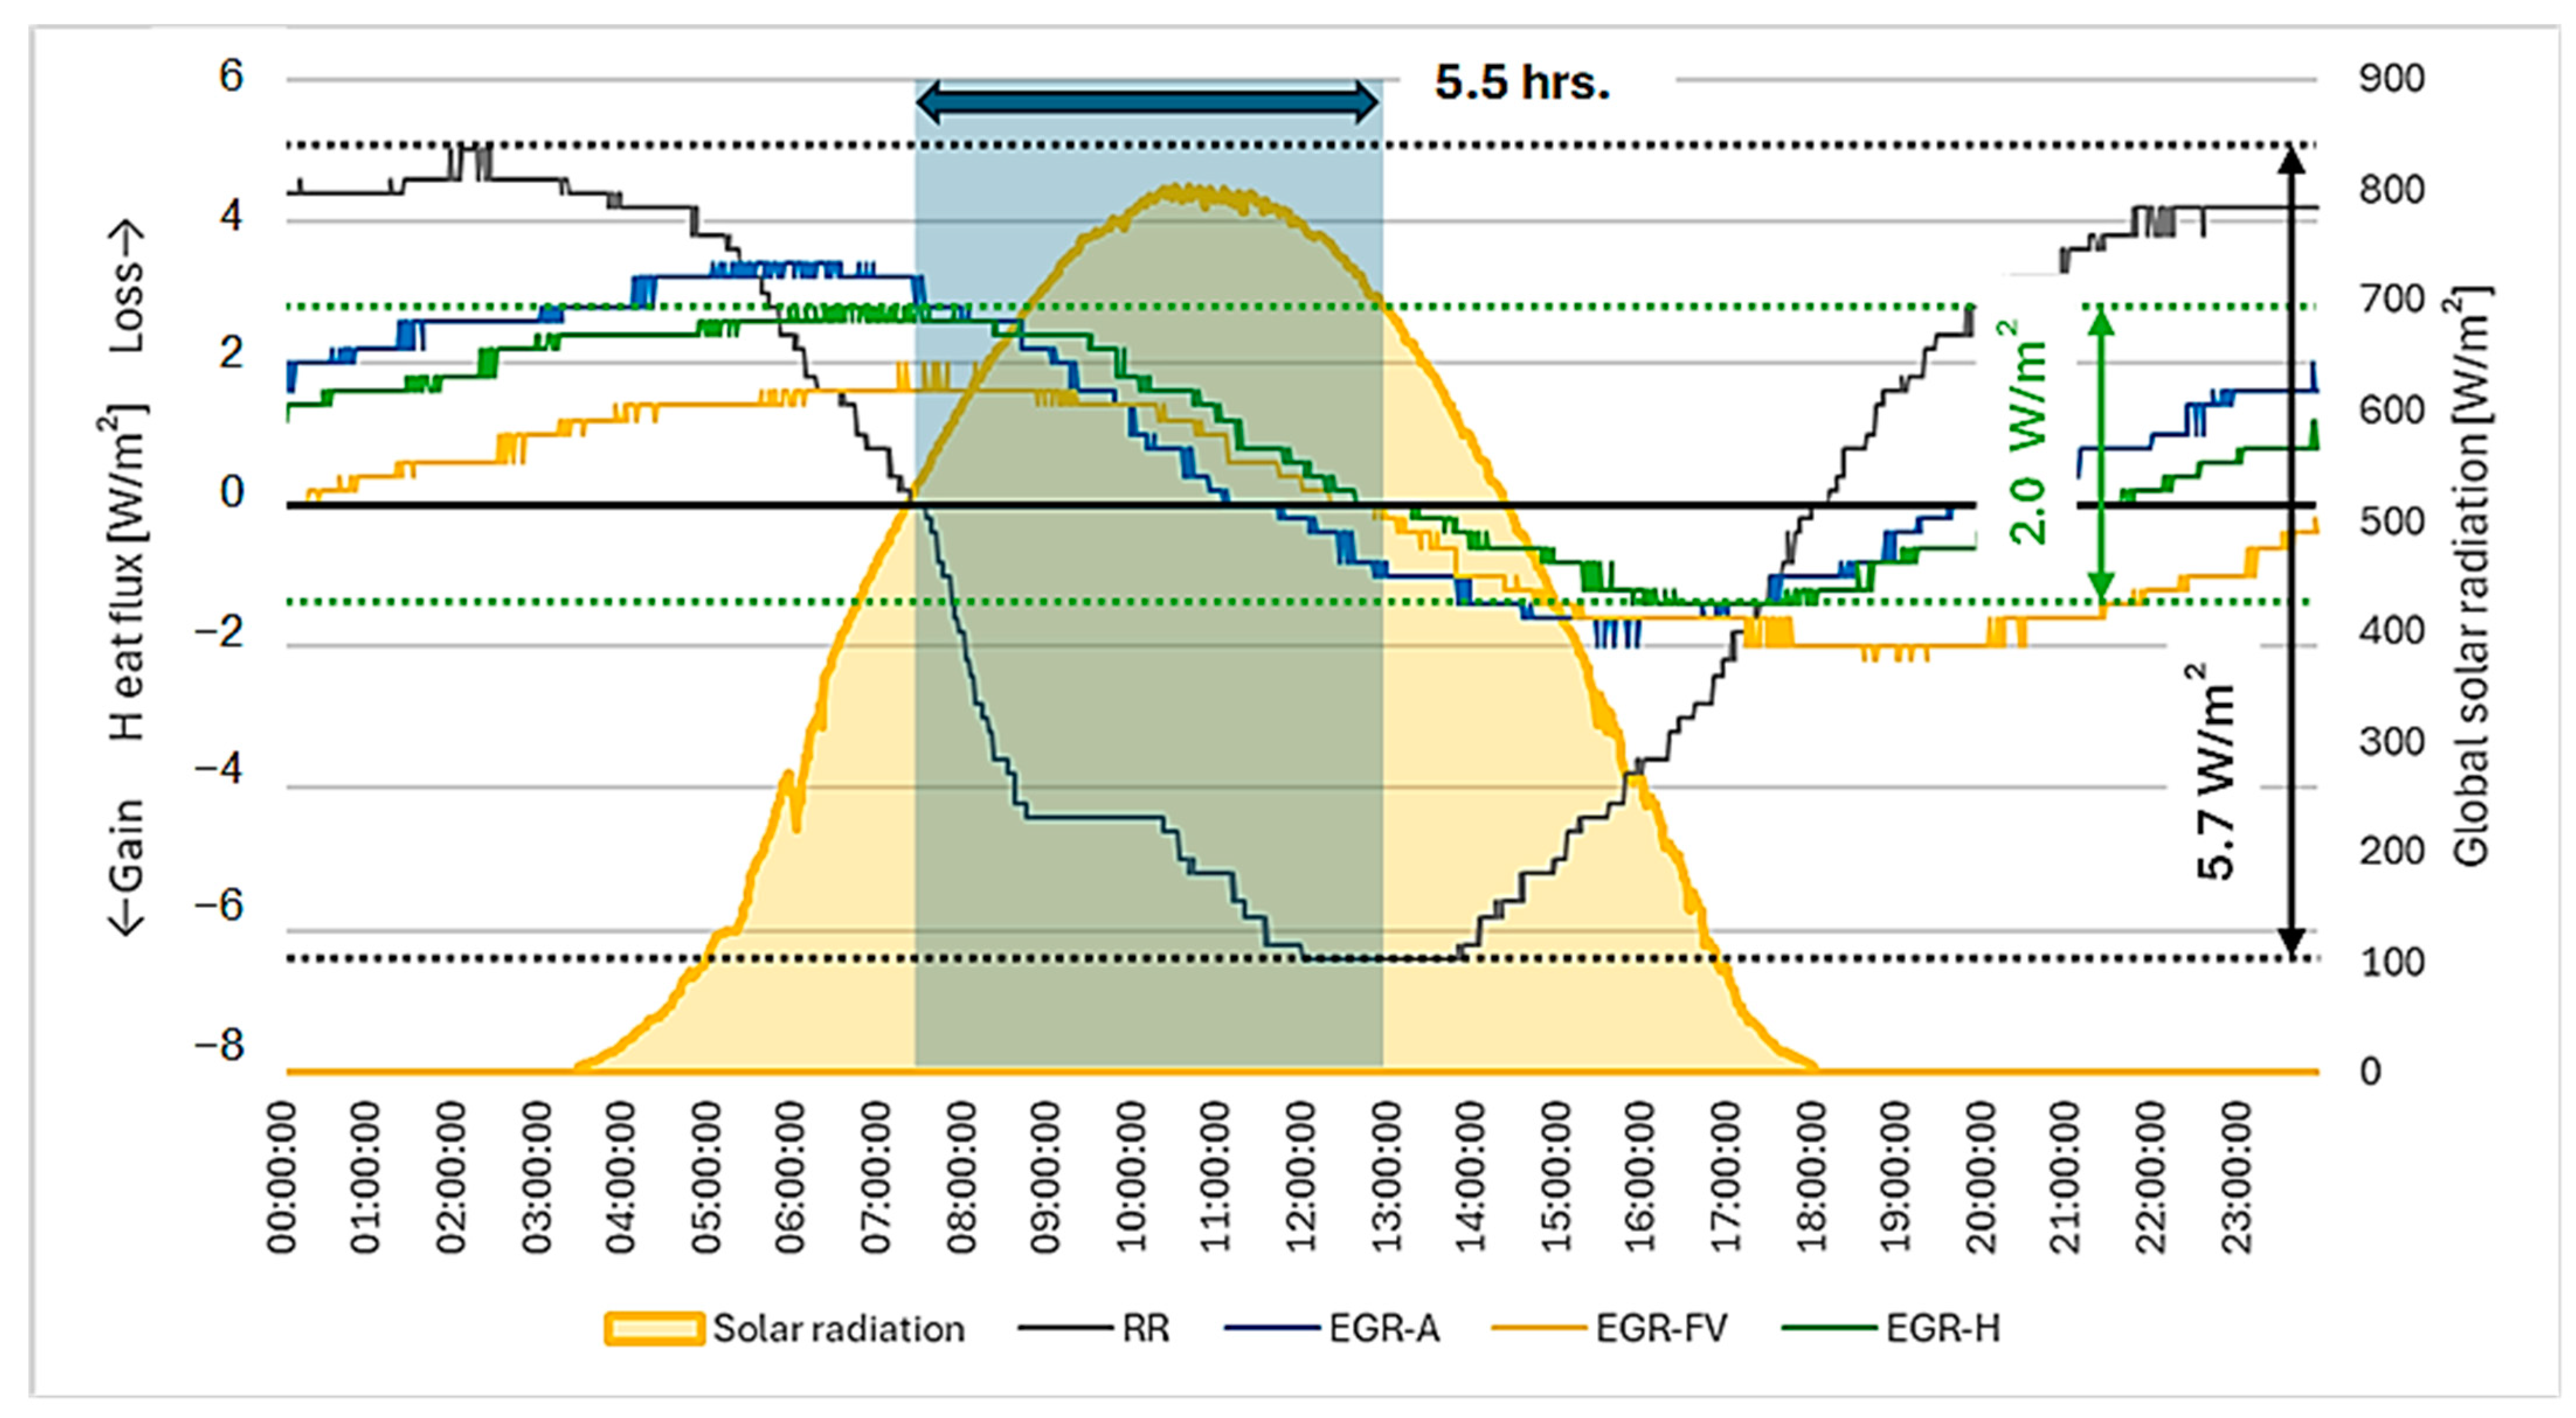
The more interesting occurrences in the heat flux transport took place in the summer period and on the selected day 12.08.2023, as can be noticed in
Figure 26. In addition to a significant reduction in heat gains, there is also a time shift of the transition from heat losses to heat gains of more than 5 h in the comparison of the RR and EGR-H. This phase shift is significantly affected by the irrigation method, since the energy from solar radiation is used in the form of latent heat for evaporation. In cases of water shortage, a similar overheating of the layer occurs as in the case of the RR. The heat gains in the case of the EGR occur only in the afternoon, with a reduction compared to the RR of up to almost 68%. A significant disadvantage in the case of vegetated roofs is the heat accumulation capacity in the composition of their vegetation layers, which becomes apparent in the evening and at night. Thus, heat gains also occur at night. Since the performance of the RR is strongly dependent only on solar radiation, some thermal inertia from the other layers of the vegetation compositions is provided in the case of the EGR samples.
Also, in the summer period, the highest increments were again recorded for the RR. However, across this complex diurnal pattern, this sample compensates for its heat losses in the night, which implies that the sample’s heat gain is almost equal to 0 in its diurnal sum, as can be noticed in
Figure 26. The other vegetated roof samples show more dominant values of heat losses compared to heat gains, which is a desirable outcome, especially in the summer months—passively cooling the indoor environment and thus reducing the cooling costs of buildings. The difference in heat gains between the EGR and RR ranges between 81 and 86% in favour of the EGR. This is mainly due to the reduced temperature in the immediate vicinity of the surface of the vegetation sample, which is caused by evaporative cooling during the day.
Increased heat gains are also evident in the case of the FV panel sample, where heat accumulation in the space below the panels has a major role in transporting heat indoors, even at night when the ambient air temperature is already significantly lower than in this space. Based on the numerical evaluation of the graph in
Figure 27, the EGR-FV sample shows the highest heat gains during the observed day. However, it is very important to point out the heat flux pattern observed during the daytime, which can be seen in the graph in
Figure 26. It is the RR that shows the highest values of heat gains at the time when the solar radiation intensity is the highest and the greatest overheating of the surfaces occurs. At that point, the EGR-FV sample is still experiencing heat loss. The increase in its heat gain value only occurs in the afternoon, when the outdoor temperature is decreasing. At this time, heat release from under the FV panels starts to occur, which will cause an increase in its heat gains. This occurs until nighttime, while the interior is heated in this way during the night hours.
In the analysis of heat transport through the building, conclusions were drawn on the percentage redistribution of its energy consumption. During the day 12.08.2023, the total amount of solar energy incident on the roof was 393.235 kW/m
2, which represents an energy of 23.59 MJ. The average temperature during this day was 19.3 °C. According to [
38], the latent heat of evaporation is λET = 2.45 MJ per 1 mm of water at an air temperature of 20 °C. The daily ET recorded by the weather station was 4.67 mm. This implies that 11,44 MJ was consumed in ET during the day. This represents 48.5% of the total energy incident on the surface. The heat flux through the RR was almost five times greater than that through the EGR (
Figure 27). The difference in heat transport through the structure was 19%.
4. Conclusions
The measured results demonstrate the behaviour of an extensive vegetated roof in comparison with a reference roof finished with a light-coloured waterproofing membrane shortly after fabrication. Due to their different compositions, it is possible to directly compare these different locations with each other. The results were focused on the analysis of temperature and heat flux patterns for selected representative days from the winter and summer periods. The following conclusions can be drawn from this research:
Measurements confirmed the importance of the leaf area index as one of the main indicators of the shading effect. As the vegetation composition on this roof is relatively new, full vegetation cover has not occurred. The impact of the absence of vegetation can be observed, especially in the summer period, in the surface temperatures seen in
Figure 18 and
Figure 21. During summer days, the surface temperature is up to 9 °C higher than the reference roof in the case of the roof with a vegetation composition. This is due to the albedo effect—a significantly darker substrate surface than the light surface of the waterproofing—and also due to the absence of transpiration cooling, which is a consequence of the evaporation from vegetation.
An important aspect of this assessment is the actual composition of the vegetation’s structure. As these are extensive compositions of vegetation, the design is made with minimal requirements for the vegetation layer. The vegetated roof is designed for the lowest possible maintenance and with the lowest possible load increment. However, this is reflected in the heat transport through the composition itself. As pointed out in
Figure 19 and
Figure 22, the temperature at the M level reaches similar values as the RR sample does. This statement refutes the notion that the vegetation layer protects the M from temperature fluctuations during the day during non-irrigated periods.
The main aspect of the reduction in the temperature oscillation at the M level is the presence of water in the substrate. As can be seen in
Figure 22, at the time of saturation of the vegetation after the rainy season, the temperature difference is almost 8 °C. Gradually, as the sample dries out, and is irrigated only by drip irrigation with a limited water supply, the EGR and RR temperatures in the M level balance. Since EGRs are classified as “maintenance-free” designs, the absence of irrigation during the summer heat impedes their benefits. The question remains whether the money spent on increased water can offset the money spent on additional cooling in the summer. This would be the impetus for an article looking at the economics of EGR designs.
The results in
Figure 24 and
Figure 26 analyse the heat flux transport through the building. In winter, when the sky is clear, the positive contribution of passive solar energy is shown. The latter was evident during the day, when passive gains reduced the heat loss through the RR. The difference in heat loss between the RR and EGR at identical times was up to 2.6 W/m
2 in favour of the RR. However, these reduced losses were compensated for during the night. Their maximum heat loss difference on a considered day in the winter period, without snow, was only 13%.
However, when a summer day just after rain was analysed, a significant evaporative cooling effect was shown. The difference in the roofs’ heat gains was up to almost 86% during the analysed day in the summer period with sunny skies. The heat gain during the day was up to almost seven times higher in the case of the RR. This has an impact on the economic aspect of the energy requirement for cooling.
This paper has led us to think about the exact expression of specific heat transfer coefficients or thermal resistance at different times during the year. As the data obtained have very dynamic values, the final value would be determined by averaging, neglecting daily values, so that the increased surface temperature due to direct solar radiation would not degrade the results. The results of these heat transfer coefficient (U) values, as well as a numerical analysis of the data, will be part of another forthcoming paper. The aim of this paper was to point out the difference in the obtained data of the observed roof compositions.
From the analysis in 3.6 for a selected sunny day, it was concluded that 48.5% of the incident energy was consumed for evaporation by vegetation, 31.5% was consumed for photosynthesis and heat accumulation in the vegetation layer, and only 19% was transferred to the interior in the form of increased heat gains.
It is important to note that this roof does not contain a massive storage layer in the form of a slab, as in conventional buildings, which also has an impact on these results. The fact that the roof has almost no accumulation layer affects its overall heat transfer and thus the transport of heat flux through the roof skin. However, these test specimens were applied to a commonly constructed type of production hall to observe the advantages/disadvantages of applying vegetated surfaces to industrial plants.
As the vegetation grows, these roof compositions will be re-evaluated over the coming years. This will ensure that its evaluation will not only be within the seasonality of a single year, and it will also emphasize the behaviour of vegetation structures throughout their actual life cycle, with the implications of their time requirements.


