Abstract
Healthcare facilities (HCFs) are complex building structures that are becoming more challenging with ever-changing codes and regulations. Previously completed projects become a basis for future guidance regarding costs and scope. A robust normalization framework to assess previously completed projects with today’s costs and location will benefit various stakeholders. The current study provides a complete picture for normalizing the overall project cost and phase cost by life cycle and HCF cost elements. This study aims to develop a cost normalization approach tailored to HCF-specific cost elements to extend the normalization framework for the overall project cost. Further, the researchers developed a distinct framework for normalizing the effect of shell space on the normalization of Total Installed Cost (TIC) to establish fixed cost adjustment rates for cold and warm shell spaces in HCFs, which can increase the accuracy of cost normalization of the overall project cost. This study identified an appropriate set of cost indices for normalizing HCF cost elements using publicly available indices. The cost elements identified for normalization included HCF-specific and Construction Specifications Institute Master Format (CSIMF) cost elements for assigning individual normalization procedures. This study provides individual and unique approaches for normalizing all identified cost elements, such as mechanical, concrete, etc. The initial framework was evaluated through a case study analysis that developed into the proposed approach built upon the collaborative efforts of academic researchers and industry experts. This study introduced shell space cost adjustment rates for warm and cold shell spaces to further develop a space normalization framework. This paper addresses the challenges of normalizing HCF project costs using the breakdown of HCF cost elements. Moreover, the paper provides the HCF’s overall cost normalization approach, emphasizing cost elements that allow accurate comparisons between various HCFs for early scope and cost guidance.
1. Introduction
“The healthcare sector is characterized by high capital investment, increasing technological sophistication, and a competitive marketplace” [1]. The scale, function, technology, and materials for construction require further improvements in the post-pandemic era, and the industrialization degree of the assembly and automation systems adopted has become much higher [2]. Furthermore, the healthcare industry’s Earnings Before Interest, Taxes, Depreciation, and Amortization (EBITDA) grew by 5% between 2017 and 2019; however, these earnings remained flat during 2020 and 2021. Further predictions expect a growth rate of 6% between the years 2021 and 2025, adding USD 31 billion in HCF profits [3]. These trends predict the healthcare and pharma sectors to be some of the fastest-growing sectors in the United States, suggesting a high demand for the construction of new healthcare facilities and renovation of existing facilities. According to [4], COVID-19 was a major driving force that brought change in healthcare facilities’ design, operations, and sustainability efforts.
Healthcare projects are complex to design, build, and operate in the industry [5], requiring extensive planning for successful delivery. Furthermore, the efficient delivery of healthcare projects requires managing a diverse set of data variables that influence the scope of the project and its estimated cost [6]. The timing of key decisions in the project life cycle can significantly affect costs; therefore, early identification of factors that influence overall project costs is extremely important to healthcare facility owners [1,6]. The complexities in design and facility planning often raise the need for flexible, adaptable, and multifunctional solutions to meet the rapidly changing demands of the industry [7]. Healthcare projects require extreme precision during the design and construction phases and, therefore, need a robust benchmarking program and a cost normalization framework. These analytics assist HCF owners and the construction management team in validating the normalized costs based on similar projects from peers [1].
As a part of the benchmarking program, [8,9] developed frameworks for normalizing the overall project cost and project cost by life-cycle phases, respectively; however, the challenges of extensive planning in healthcare necessitate a cost normalization framework for individual HCFs, specific cost elements to allow the comparison of different healthcare systems across the nations [1,10].
Benchmarking is “the process of establishing a standard of excellence and comparing a business function or activity, a product, or an enterprise as a whole with that standard” [11]. Benchmarking is a performance tool that compares similar projects that extrapolate data into useful comparative metrics. A normalization framework is at the heart of a benchmarking program, and its success depends on its customization to the program, facility type, and detailed cost elements of the facility. Internal benchmarking describes comparisons within an organization, while external benchmarking involves comparing the subject company or property to external organizations. External benchmarking is defined as “the process of identifying, understanding, and adapting outstanding practices from organizations anywhere in the world to help an organization improve its performance” [8,12]. External benchmarking builds a consortium of peers or like-minded organizations to support comparisons of similar facilities through various performance parameters. Therefore, facilities with different systems, locations, and costs need to be normalized to today’s costs at a common location for meaningful comparisons. The external benchmarking application allows one company to evaluate another company’s ideas, practices, or methods and, if possible, apply them to its own business [13,14].
Many factors impact cost benchmarking. For instance, a shell space in HCF affects cost comparisons, specifically the dollars per Building Gross Square Feet (USD /BGSF) metric. Shell space can be defined as the space constructed within the exterior building shell that is left unfinished to meet the future requirements of the facility [15]. Shell space is categorized into cold and warm shell space—wherein the cold shell is defined as an HCF’s non-habitable space with no finishes or walls, no flooring, no lighting, and no air conditioning. On the other hand, a warm shell is completed with fittings and air conditioning ducts, electrical distribution, and fire suppression [6]. The program of a facility planned with shell space is less than a wholly developed facility since the square footage of unfinished floors (because the cost of the shell space is less than the fully built space) is not added to the BGSF. Therefore, the current paper addresses the challenge of comparing a facility with shell space and another entirely built-out facility. Hence, without separate consideration for the shell space cost, the normalized Total Installed Cost (TIC) for the complete facility becomes inconsistent. A separate framework for normalizing shell space costs can lead to a more accurate cost normalization of the overall project cost. Therefore, this study addresses space normalization as a separate entity and develops different cost adjustment factors for warm and cold shell spaces.
This study has identifies HCF-specific and CSIMF cost elements and develops individual normalization methods adhering to the specificity of each cost element. Furthermore, this study develops a space normalization methodology validated through various case study examples. The objectives of this study are to:
- Identify and recommend a set of indices that best suit the time and location adjustments.
- Evaluate the applicability of the normalization framework for TIC towards phase costs and HCF-specific cost elements.
- Develop/complete the overall normalization approach to healthcare facilities costs: the overall cost, cost elements, and an adjustment for shell space.
- Specific normalization framework for CSIMF cost elements.
- Identify adjustment rates to develop a prototype space normalization procedure.
Further, this study outlines the challenges and considerations associated with the cost indices applicable to cost normalization and discusses the limitations and the availability of future improvements for the framework.
2. Literature Review—Selection of Indices
In order to collect and record data for benchmarking across the healthcare sector, project costs from different times and locations need to be normalized to a comparable scale using different benchmarking frameworks developed through previous research. Previous studies on benchmarking have developed a unique framework for normalizing the overall project cost [8] and the project cost through different life-cycle phases [9]. Each framework developed a normalization approach for the program’s overall cost. This study, by extension, has studied construction cost elements specific to HCFs and developed a framework to normalize individual cost elements, including CSIMF cost elements.
According to [8], TIC is defined as “the total actual project cost (excluding the cost of land) from programming/front-end planning through commissioning, including capitalized amounts expended for in-house salaries, overhead, travel, etc.” The authors of [8] developed a normalization framework for TIC based on this definition. Furthermore, according to [16,17], construction costs for HCFs largely depend upon local conditions such as material/equipment costs, labor, and suppliers/contractors. The authors of [9] define construction costs as “all cost elements associated and included within the project phases.” Based on these findings, a benchmarking framework for healthcare projects measuring performance at the phase level has been developed by collecting data across all five construction phases—programming, engineering/design, procurement, construction, and commissioning of a project [18]. In extension, a framework to normalize HCF cost elements such as material, equipment, labor, contractor overhead, local taxes, project management costs, and other CSIMF cost elements is developed in this study.
The normalization framework will ultimately provide quantitative information to support decision making on the specific project scope and improvement of work processes used to execute healthcare projects. Benchmarking is impacted by cost normalization; therefore, selecting appropriate indices for normalization is necessary. As all the programs primarily use publicly available indices and each index is built differently, a brief understanding of the indices is essential for a normalization framework.
2.1. Cost Indices
Cost indices measure the fluctuation in prices of certain construction elements over time and/or location using a standard series of values [19]. Cost indices are primarily divided into input, output, and selling price indices. Various publicly available indices provide a variety of alternatives for adjusting time and location. According to [20], inaccurate selection and application of location adjustment indices (input or output) results in significant cost adjustment fluctuations. Therefore, a basic understanding is developed before selecting specific indices to normalize HCF cost elements.
2.1.1. Input Price Indices
Input price indices focus on inputs to the construction processes, such as materials, equipment, and labor. The main objective of input indices is to track and reflect changing market conditions with respect to the costs of these components individually. Input indices help organizations track and understand the differences between material, equipment, and labor costs at different locations for construction cost comparisons [20]. This entails the compilation of weighted indices of wages and materials costs. Table 1 illustrates that the RSMeans [21], ENR (Engineering News-Record), and Marshal & Swift Building Cost Index (BCI) are input indices developed using the standard factor method. Based on the number of comparison cities, RSMeans is typically used for location adjustment in the normalization process for a case where the midpoint of the construction phase and locations are defined [8]. BCI derives an index specific to location without reference to time.

Table 1.
Input Price Indices.
ENR’s Construction Cost Index (CCI) and the RSMeans Historical Cost Index (RSMHCI) represent the general trend of construction costs in reference to time. CCI provides an average of 20 cities, while RSMHCI reflects an average of 30 cities [22]. While the ENR BCI and ENR CCI apply to general construction costs, the main difference between BCI and CCI is consideration of the labor component. While CCI uses 200 h of common labor multiplied by the 20-city average rate for wages and fringe benefits, BCI uses 68.38 h of skilled labor multiplied by the 20-city wage-fringe-average for three trades—bricklayers, carpenters, and structural ironworkers. The BCI and CCI material components utilize 25 cwt (hundredweight; cwt = centum weight) of fabricated standard structural steel at the 20-city average price, 1.128 tons of bulk Portland cement priced locally, and 1088 board ft of 2 × 4 lumber priced locally [23]. Primarily, the ENR indices measure the costs to purchase this hypothetical package of goods compared to what it was in the base year.
2.1.2. Output Price Indices
Output price indices measure changes in the price of the output of specific activities in the construction processes [19]. These generally include materials, labor, equipment hires, land preparation costs, bathroom/kitchen fittings, overhead, profits, and trade margins [24]. Output price indices compare the change in construction costs of a proposed structure by time or location. They require a more wide-ranging data collection but are preferred since they capture the effects of productivity, profit margins, and labor tradeoffs on the overall project cost [20,25].
Three types of indices can help develop output-based price indices: the model price index, hedonic price index, and bid/unit price index [26]. These output indices include the cost of labor, materials, the use of fuel and equipment, job overhead, profit, taxes, etc. Under the model price index, the output-based indices compare the construction cost of a hypothetical structure by location and/or time [8]. The quality of the final product is used as a measure in constructing the hedonic price index [26]. Hedonic price indices are component pricing types using cross-section regression to estimate component prices. Based on the indices’ properties, the model price index under output-based price indices synchronizes effectively with the construction sector. A bid/unit price index estimates specific types of engineered construction costs based on their unit bid prices. Hence, this index has limited application to HCF construction.
As illustrated in Table 2, the Producer Price Index (PPI) measures the changes in prices paid for production sold outside the industry [27]. The PPI calculates the average change in selling prices for domestic producers’ output over time. The prices included in the PPI are from the first commercial transaction for many products and services. The PPI for new healthcare building construction (NAICS code 236224) from the Bureau of Labor Statistics (BLS) is based on the North American Industry Classification System (NAICS) [27]. By simulating multiple vernacular building types, the model price index allows for construction heterogeneity and is more sensitive to market shift situations. The Mortenson Construction Cost Index is calculated quarterly by pricing a representative non-residential construction project in geographies throughout the country. Similarly, the Turner Building Cost Index [28] measures costs in the non-residential construction market in the country. The Rider Levett Bucknall (RLB) Cost Relativity Index [29] calculates the construction cost differential between two selected cities worldwide.
Table 2.
Output Price Indices.
2.1.3. Selling Price Index (SPI)
The Selling Price Index (SPI) evaluates the average variation in the building’s selling price over time. As a result, this index assesses the changes in construction output costs paid by the owner. The SPI measures the total cost of completed construction, including materials, labor, equipment, contractor’s margins, overhead expenses, land, direct and indirect selling expenses, and the seller’s profit margins. The SPI can be used to adjust construction project costs over time. One example of an SPI is the DoD (Department of Defense) Selling Price Index (DoD-SPI), which represents an average of three widely accepted construction price indices, namely, the RLB Construction Cost Index (output), Turner Construction Cost Index (output), and Saylor Subcontracting Index [30,31].
Saylor discontinued issuing their index in October 2009; therefore, the current third index utilized in the DoD calculation is the BLS PPI for NAICS 236223. The DoD created the SPI to precisely reflect actual (historical) market escalation as experienced by the DoD as the project owner for the construction type in the portfolio [31]. Previously, the DoD (Table 3) used the Engineering News-Record Building Cost Index (ENR BCI). The ENR BCI tracks the costs of three basic materials and one skilled labor type but does not account for other pricing influences (such as risk and competition) impacting the project owner’s total delivered price.
Table 3.
Selling Price Indices.
As discussed in the background study, selecting appropriate indices is vital to reflect cost normalization accurately. Due to the abundance of publicly available cost indices, it is a challenge to determine the most suitable indices for adjusting the detailed cost breakdown. Therefore, this study further evaluated the publicly available input and output indices to determine the most suitable indices for normalizing HCF-specific and CSIMF cost elements for location and time.
2.2. Cost Normalization
Cost normalization refers to adjusting total project costs from different times and locations to comparable standards by adjusting all cost data to a common time and location [32]. Absolute metrics require normalization since the measures are external and of different values; however, cost normalization is unnecessary for relative metrics due to internal measures of the same values using planned versus actual data [17]. Currency, time, and location adjustments are the three required steps of cost normalization to evaluate accurate project costs [16]. In order to analyze cost performance using absolute metrics, cost data must be normalized from the project location and time to the reference location and time [1,17]. According to [1], the HCF benchmarking program and the Hanscomb Means International Construction Cost Index use Chicago, IL, as a reference location. Furthermore, the normalization approach established for TIC also uses Chicago as a reference city for the currency, location, and time adjustment [8]. The detailed normalization procedure for TIC is illustrated in Table 4 for a hypothetical healthcare project in Indianapolis, with 2012 as the midpoint of construction.
Table 4.
Standard Normalization procedure.
2.2.1. Currency Conversion
Due to extensive globalization, many construction companies have entered international markets and delivered healthcare projects while paid in local currencies [16]. Therefore, currency conversion is the first crucial step in normalization when the costs of international projects are paid in the local currency. This step-in cost normalization is designed to accommodate the future expansion of healthcare benchmarking to include international healthcare owners and contractors. Currency conversion allows seamless expansion of the healthcare benchmarking program to include foreign projects. In this globalizing economy, multiple equilibrium structures and frameworks of currency exchange exist using trade links between countries [33]. Therefore, any cost data could be converted to a single currency unit of the United States (U.S.) dollar. Currency conversion can be applied to all cost elements of healthcare facilities.
2.2.2. Location Adjustment
Comparing two projects built at different locations requires adjusting cost elements that vary from one geographical location to another [16]. This allows the healthcare benchmarking program to expand to include healthcare projects located in different places with different aspects of local environments. According to [1], the design, Architectural/Engineering (A/E), Construction Manager (CM), and capital medical equipment costs remain the same across the nationwide markets or regional conditions and, therefore, do not need to be adjusted for location. Therefore, post currency conversion, the design, A/E, CM, and capital medical equipment costs are deducted from the total project cost, and the net cost is normalized for the location—Chicago, IL. For projects in the U.S., the TIC can be normalized for the location using Equation (1).
Equation (1): Location Adjustment Using the City Cost Indexes (RSMeans data, 2023):
For projects outside of the U.S., TIC can be normalized for location using Equation (2).
Equation (2): Adjustment from the National Average (RSMeans data, 2023):
2.2.3. Escalation/Time Adjustment
Because the cost of an item has a time value, it is essential to know the year in which funds were spent. For example, a cost element of USD 100 in 1990 is more expensive than the same cost element in 2005 based on inflation growth over 15 years, which means that the cost element in 1990 will cost more when converted to a 2005 equivalent cost [34]. Time adjustment is the third and final step of cost normalization, where the net cost after location adjustment is converted from the midpoint of construction in Chicago to the present cost of the project in Chicago [16]. At this stage, the design, A/E, CM, and capital medical equipment costs eliminated from the location adjustment are normalized separately for time to reach the final comparable normalized cost of a cost element or the total project cost. According to [16], the midpoint of the construction phase in the project life cycle is when the majority of project expenditures occur. The construction phase costs are also significantly affected by the local conditions, such as construction labor, equipment, suppliers, and material costs [16,17]. Therefore, location and time adjustments both use the midpoint of the construction phase for normalization. A more accurate result could be achieved by adjusting every project transaction, but extensive efforts are required.
Equation (3): Time Adjustment for the National Average Using the Historical Cost Index (RSMeans data, 2023):
2.3. Space Normalization
Space normalization works through dimensional metrics for a shell space. Two types of shell space are prevalent in healthcare institutions. The first is the cold shell space, which is unfit for occupancy and does not include finishes or walls. Fire separation requirements are based on the intended use and local regulations by the authority having jurisdiction. A cold-shell constructed space typically does not have plumbing, electrical, heating, ventilation, or air conditioning (HVAC) systems. Sometimes, the main mechanical unit(s) may be absent. The second is a warm shall space and is constructed with basic electrical, plumbing, and HVAC systems but does not include walls, flooring, or other finishes. However, the basic infrastructure provided makes it operational for occupancy and cost effective for tenants. In dimensional metrics, warm- and cold-shelled spaces are measured in terms of BGSF and Departmental Gross Square Footage (DGSF). Specific exterior envelope materials are also assessed in terms of their ratios to the exterior surface area. These spaces can be found in various facility types. They can significantly impact the cost per BGSF since they add square footage despite being unfinished, accounting for a substantial cost in constructing a new facility. The presence of a shell space—warm or cold—adds to the total square footage of the building despite the space being underdeveloped. Therefore, when calculating the BGSF, differences between the cost of a shell space and the built-out structure develop inconsistencies in the normalized BGSF for the total square footage of the building. This challenge can be mitigated by developing separate adjustment factors for warm and cold shell spaces, which copes with the inaccuracy in the total normalized BGSF. Since space adjustment for the final metric computations is distinctive to healthcare benchmarking methods, it is essential to study space-based adjustments for healthcare facilities.
Based on the background study, this paper is an extension to an approach to the normalization of the TIC and phase-based project cost; however, there is a gap in the research regarding normalizing cost elements of HCFs. Due to the complexity of HCFs, this paper proposes another possible approach for normalizing healthcare facility costs, i.e., by normalizing individual HCF cost elements. In addition, it is necessary to know how to normalize CSIMF cost elements (i.e., HVAC, foundations, etc.), which is the study’s focus. CSI UniFormat is a categorization system for various building components, systems, and assemblies, offering a structured approach for design and operational considerations throughout a building’s existence. This paper does not include procedures for normalizing cost elements based on CSI UniFormat. The previous benchmarking and normalization methods lack guidance on space adjustments for two identical building structures, while this study paves the ground for space normalization of healthcare facilities.
3. Methodology
3.1. Selection of Cost Indices
Multiple healthcare industry leaders, subject matter experts, and researchers (steering committee) within the National Healthcare Facilities Benchmarking Program (NHCFBP) developed standardized definitions for metrics relevant to HCFs and identified HCF-specific and CSIMF cost elements most relevant to HCFs. The Healthcare Facilities Benchmarking Program developed the metrics framework for the category costs, schedule, safety, rework, and changes unique to HCFs. Cost metrics included relative and absolute metrics, where absolute metrics like the dollar per square foot needed normalization for time and location for meaningful comparisons [1]. A comparative analysis of all the publicly available cost indices within the framework was conducted. This study presents a cost normalization framework for construction cost elements, adhering to the previously established guidelines of a normalization framework for TIC and phase-based approaches. The cost indices reviewed in the background study were first compared based on their use in the healthcare sector, designated purpose, public availability, representation of market conditions, and consideration of construction cost elements. Appropriate indices for normalization by HCF-specific and CSIMF cost elements with respect to location and time adjustment were established through this study.
During the steering committee discussions, certain criteria were established before reviewing the available cost indices for an appropriate selection. First, the indices were reviewed for their particular use in the healthcare sector, as many cost indices have been created to suit a particular industry or establish cost adjustment in a certain way [35]. Selection of the most suitable cost index is critical to developing preliminary cost estimates with an accuracy of +/−20% [36]. Second, they were reviewed for their designated purpose, i.e., for location and/or time adjustment. Third, the indices were reviewed to gauge their representation of the wide pool of identified cost elements, such as material, labor, equipment, contractor expenses, profit margins, local taxes, etc. Table 5 illustrates a detailed study of the available indices and their applicability to the cost elements. Lastly, the index values were reviewed based on their reflection of the economic trends and local market conditions to establish their reliable use for time adjustment (Figure 1). Due to the wide availability of input and output indices, all the available cost indices were compared over time to examine the impact of the 2008 economic downturn (Figure 1).
Table 5.
Applicability of indices to construction cost elements.
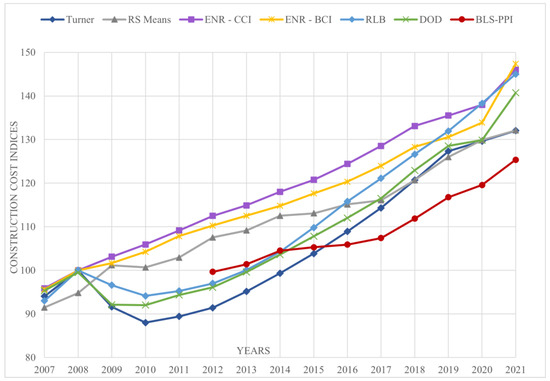
Figure 1.
Comparison of Cost indices (Normalized to 2008 = 100).
As a result, RSMeans CCI, ENR—CCI, ENR—BCI, Turner Cost Index, RLB, and BLS-PPI NAICS 236224 (BLS, 2016) were observed to have a specific use in the healthcare sector. Further, RSMeans CCI and RLB were observed to have been designed for location adjustment; therefore, their public availability was considered. RSMeans CCI collects data in over 970 cities in the U.S. In contrast, RLB collects data in over 12 cities in the U.S., as illustrated in Table 5. Both RSMeans and RLB track cost data for specific cost elements, indicating that both indices reflect changing market conditions. However, when compared based on their stability post-2008 economic downturn, the RSMeans CCI was observed to have shown more stability in terms of economic growth than RLB. After carefully analyzing the above-mentioned decision criteria, the RSMeans CCI was chosen for location adjustment of the HCF-specific and CSIMF cost elements. The Hanscomb Means International Cost Index was chosen for international projects, as the previous cost normalization frameworks used the same index for location adjustment [1,8,9]. For validation, the RSMeans CCI and RLB were compared using a hypothetical example to calculate the difference between the initial and normalized value using both indices (Table 6). As the normalized cost using RSMeans was closer to the initial value than the normalized value using RLB, the RSMeans CCI was chosen for location adjustment within the United States. For time adjustment, the RSMeans HCI, ENR-BCI, ENR-CCI, Turner Cost Index, RLB, and BLS-PPI were considered for further comparison. Indices, namely Turner, RLB, and BLS-PPI, were observed to track cost data beyond the material, labor, and equipment costs as opposed to the RSMeans HCI, ENR-CCI, and ENR-BCI. Furthermore, RLB and BLS-PPI represented cost elements beyond material and labor productivity as opposed to the Turner cost index. However, compared to their reflection of the changing market conditions and stability post-2008 economic downturn, the Turner cost index demonstrated the highest fluctuation, whereas the RSMeans HCI and BLS-PPI showed great stability (Figure 1). In Figure 1, the sources for the comparison of cost indices were, RSMeans data, 2023; Turner Construction Company, 2023; ENR, 2022; DoD, 2023; RLB, 2022; BLS, 2016. Also, all the available index values were normalized to the reference year 2008 with an index value of 100 to understand the stability of the index values.
Table 6.
Comparison of Cost indices (Normalized to 2008 = 100).
Since BLS-PPI was a relatively new cost index—developed in 2012, it was not affected by the 2008 economic downturn. Since RLB represented a Global Construction Cost Relativity Index, as opposed to BLS-PPI, which was focused on the market conditions in the U.S., this study chose a similar approach as the normalization framework for TIC [8] by ultimately choosing a hybrid index of RLB and BLS-PPI [26] for time adjustment for projects before 2012. For normalizing cost elements of projects after 2012, BLS-PPI’s new healthcare building construction with the base year of 2012 was chosen for normalization. This analysis was validated using a hypothetical example to calculate the difference between the initial and normalized values using both indices, as shown in Table 6.
3.2. Normalization Framework for CSIMF Cost Elements
The normalization framework developed in this study adheres explicitly to CSIMF cost elements. This framework follows a similar approach to the normalization procedures for each identified cost element, as proposed by [8], for the overall project cost (Appendix A); however, it is altered to cater to MasterFormat cost elements (Figure 2). The three key elements critically influencing cost normalization for project benchmarking are (1) project currency, (2) project location, and (3) the point in time considered for cost normalization, which were the basis of designing this framework (Figure 2).
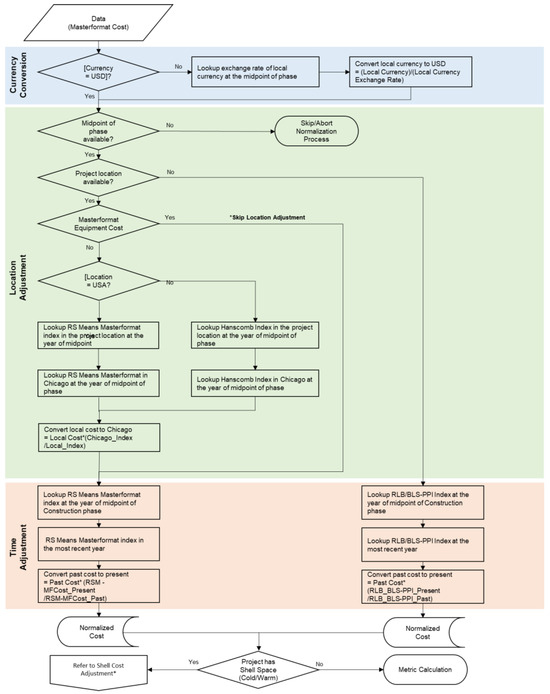
Figure 2.
Normalization framework for CSIMF cost elements. * If TIC is available, also calculate BGSF and consider the existence of cold/warm shell space. Adjust the BGSF using shell space adjustment factors and refer to space-based normalization.
Currency conversion is proposed as a first step for projects outside of the U.S., with respect to the appropriate market exchange rate to U.S. dollars at the midpoint of construction. As [8] established, the next two steps in normalization consider the project location and the time at the midpoint of the construction phase. However, in the absence of the midpoint of the construction phase, the entire normalization process is advised to be aborted altogether. As a first step, an appropriate set of cost indices was identified through a complete evaluation of publicly available cost indices. Since RSMeans represented the most stability, including changing market conditions, and a set of indices tailored to the CSI MasterFormat (MF) cost elements, it was chosen as the most suitable cost index for normalization. Therefore, the framework proposed by the RSMeans MasterFormat (MF) index for location adjustment at the midpoint of the construction phase. An inconsistency was observed while developing this framework concerning the CSIMF divisions. Differences in the division I.D.s and descriptions of cost elements were observed in the CSIMF before and after 2005. Due to the lack of a previous study based on the normalization of CSIMF cost elements, this challenge has yet to be addressed. Therefore, Appendix C outlines a detailed mapping of each cost element conducted to cope with these differences. Each question I.D., MF division, and the question name referring to each CSI division were considered during this process to gauge the appropriate steps to be followed for normalization.
The Hanscomb Means International Cost Index should be used for location adjustment for international projects. Depending upon the availability of the project location, the process either continues for location adjustment using the RSMeans MasterFormat index or proceeds for time adjustment using the RLB/BLS-PPI index in the most recent year. Similarly, suppose the breakdown of MasterFormat costs is unavailable. In that case, this framework proposes that the available costs should be normalized for time using the RSMeans MasterFormat index at the midpoint of the construction phase. Both location and time adjustment should use the standard normalization equations. If a shell space, either warm or cold, exists within a structure, the framework proposes shell cost adjustment at this stage. The cost adjustment for the shell space cost is discussed in the next section. This initial framework (Figure 2) was validated using a case study illustrated in Appendix B and established post-discussion with the steering committee.
3.3. Space-Based Normalization Framework for TIC
To complete the normalization approach for healthcare facility costs, the effects of shell spaces on overall project costs were studied through background study. A shell space in a healthcare facility was observed to be crucial in normalizing the project cost per BGSF due to the additional square footage, irrespective of the finishes. A cold shell is a non-habitable space within a building with no finishes or mechanical systems, whereas a warm shell includes heating, ventilation, and air conditioning. A need for a separate normalization of shell space costs was established through background study, as inconsistencies were observed in the normalized cost per BGSF of healthcare projects with warm or cold shell spaces present. Two healthcare projects cannot be compared appropriately if one includes a shell space while the other does not. To be comparable, the shell space in one structure must be separated from the total square footage. Once separated, both the structures have a similar built-out program and finished spaces, and a more accurately comparable cost per BGSF can be evaluated.
This study conducted a detailed discussion with the steering committee and healthcare sector experts to understand the impact of shell space on the overall cost per BGSF. Dollar per square foot values for a 100,000-square-foot facility that is completely built out compared to another 100,000-square-foot facility with a 20,000-square-foot shell space will be distinct. Researchers populated similar examples of HCFs and normalized ratios by dividing the square footage of such spaces to calculate the overall impact on the BGSF. The steering committee was presented with the range of ratios resulting from the calculations for validation. Based on the feedback, to adjust the square footage or cost of such facilities for meaningful comparison, fixed cost adjustment rates of 0.35 for warm shell and 0.50 for cold shell were identified. The proposed cost adjustment factors were validated by implementing the adjustment rates into a case study. As shown in Table 7, a hypothetical healthcare project (MOB) is normalized for a shell space using a fixed adjustment rate of 0.5 or 0.35, depending upon the type of the shell space. This case study demonstrates the adjustment of total BGSF by deducting the adjusted square footage for a cold shell space using 0.5 as an adjustment factor. For a warm shell space, 0.35 would be used as the adjustment rate.
Table 7.
Shell space adjustment.
As the first step, the total square footage—BGSF–of the cold shell space was multiplied by the adjustment rate 0.5 to evaluate the cost of equivalent square footage due to shell space. This value is then deducted from the total project BGSF to evaluate the final equivalent square footage of a building—BGSF. The resulting value for the BGSF excludes unfinished shell spaces and will provide a more accurate and comparable BGSF for evaluating the cost per BGSF. A similar approach for other areas of space in healthcare facilities can be used to identify newer crosswalks for a better parametric assessment of cost and space.
4. Case Study—Methodology Demonstration and Validation—Normalization of CSIMF Cost Elements
This study proposed a tailored normalization framework for MasterFormat cost elements, as illustrated in Figure 2. This study conducted a detailed identification and assessment of individual cost elements to validate this framework. Further, depending on the data availability to ensure calculations for different scenarios, a healthcare project based in St. Louis, Missouri, was identified to implement the proposed framework. The project has been sourced from the Healthcare Facility Database (HCFD), which was developed as a resource for the healthcare community as part of the NHCFBP discussed in [1] to ensure reliability and accuracy in evaluations and generalization of findings. The identified HCF-specific and CSIMF cost elements were assigned individual steps in normalization, as the design, A/E, CM, and capital medical equipment costs would only require time adjustment. The previous framework for TIC was applied to individual phase costs and the HCF cost elements (Appendix A); however, a separate framework for CSIMF cost elements was applied as described in Appendix B based on Figure 2. From the summary of cost indices and the discussion with the steering team, the RSMeans CCI index was used for location adjustment, and BLS-PPI NAICS 236224 was used for time adjustment.
4.1. Normalization of CSIMF Cost Elements with Comparison to the Construction Phase Cost
Healthcare facilities are complex building structures that require flexible and adaptable solutions for effective facility management. Therefore, extra attention is required to the details of the design and project costs. The background study shows that this concern has been addressed before by proposing external benchmarking and cost normalization frameworks for HCFs. Previous research on the subject matter has established a normalization framework for TIC; however, it does not consider CSIMF cost elements.
The CSIMF cost element normalization did not require currency conversion, as the chosen case study was based in the U.S. For step 1—Location Adjustment (LA), RSMeans MasterFormat index for St. Louis (Missouri) at the midpoint of construction—2012 was used to normalize the cost of CSIMF cost elements to a baseline location—Chicago at the midpoint of construction—2012. As the location of this project was known and based in the U.S., RSMeans MasterFormat indices for 2012 and 2022 were chosen as appropriate indices for time adjustment.
Table 8 illustrates an example of CSIMF cost elements and their normalization procedure. A similar approach was utilized for normalizing all other CSIMF cost elements (Appendix C). Since CSIMF cost elements represent a breakdown of the construction phase cost, the combined normalized cost of CSIMF cost elements is compared to the normalized construction phase cost. As illustrated in Table 9, a delta of USD 2,774,361 (Δ) was observed between the final normalized costs. This delta was further normalized using the RSMeans MasterFormat cost indices and added to the normalized cost of CSIMF cost elements. As evident in Table 9, the normalized costs of CSIMF cost elements and the construction phase cost reached a comparable final value and were validated through the proposed framework. It should be noted that no design, A/E, CM, or capital medical equipment costs were deducted for normalization since CSIMF cost elements primarily represent the construction phase costs only. For example, CSIMF Division 11 represents a total equipment cost; however, it is not equivalent to the capital medical equipment cost, and therefore, it should be normalized for location.
Table 8.
Normalization of CSIMF cost elements—Example.
Table 9.
Comparison of construction phase cost and CSIMF elements’ costs.
4.2. Normalization of HCF-Specific Cost Elements with Comparison to Project Life-cycle Phase Costs
In previous studies, implementing the normalization framework established for TIC has not considered normalizing individual phase costs and HCF-specific cost elements. Therefore, this study established applicability by a separate normalization framework tailored to HCF-specific cost elements.
In Table 10 above, the framework for TIC normalizes the individual phase costs and HCF-specific cost elements, presenting a robust approach towards normalization. Comparing the almost equivalent values obtained from the total normalized phase (of project life cycle) costs, i.e., USD 13,411,825, and the total of normalized HCF-specific cost elements, i.e., USD 13,411,827, validates the framework’s approach (Table 10).
Table 10.
Application of framework for TIC towards phase cost and HCF-specific elements.
5. Results and Discussion
Healthcare projects require extreme precision during the design and construction phases. Therefore, a robust benchmarking program and a cost normalization framework are developed with the help of industry and real-life projects. The background study addresses a cost normalization framework for TIC but does not consider HCF-specific cost elements and CSIMF division costs. It suggests an alternative approach to normalizing healthcare cost elements such as medical equipment costs within HCF and CSIMF cost elements, such as HVAC and foundations, etc. Unlike previous benchmarking and normalization methods that lack guidance on adjusting space for two identical building structures, this research also establishes a foundation for the space normalization of healthcare facilities.
5.1. Selection of Cost Indices
The RSMeans CCI was selected for adjusting the location of HCF-specific and CSIMF cost elements. In evaluating their resilience following the 2008 economic downturn, it was observed that the RSMeans CCI demonstrated greater stability in economic growth compared to RLB. Additionally, it provided many cities (970) covering most of the US as options for normalization. For time adjustment, a hybrid index of RLB and BLS-PPI was selected for projects before 2012. Further, for projects after 2012, BLS-PPI NAICS 236224, with the base year of 2012, was chosen for normalization. BLS-PPI NAICS 236224 is designed specifically for healthcare projects with the added stability of the BLS index with expected permanence.
5.2. Normalization Framework for HCF-Specific Cost Elements and CSIMF Cost Elements
The study validated the proposed framework for TIC to normalize individual phase costs and HCF-specific cost elements. Further, the framework was tested by finding the values of normalized CSIMF cost elements and the construction phase cost comparable. The results indicated that 1) the final normalized cost of the healthcare facility remains the same irrespective of the approach used for normalization, i.e., using TIC, individual phase costs, or HCF-specific cost elements, and 2) the final normalized cost of the construction phase can be determined by normalizing the total construction phase cost or individual CSIMF cost elements (Table 9). However, a delta (Δ) difference, in Section 4.1, was observed between the final normalized construction phase cost and the total of individually normalized CSIMF cost elements. This delta was further normalized and added to the normalized cost of CSIMF cost elements to arrive at a comparable value.
5.3. Space-Based Normalization
In the case study analysis and with feedback from the steering committee, the adjustment cost factors were identified as follows:
- (1)
- Total BGSF modification is validated by subtracting the adjusted square footage for a cold shell space, employing a 0.5 adjustment factor.
- (2)
- In the case of a warm shell space, the adjustment rate was identified as 0.35.
6. Conclusions and Path Forward
In conclusion, this research study aimed to develop a comprehensive normalization framework for HCF costs.
(1) The study identified and recommended a set of indices best suited for time and location adjustments to achieve this goal: RSMeans CCI index and BLS-PPI NAICS 236224, along with the expected results via a case study. Selection of the most suitable cost index can assist various stakeholders, such as estimators, healthcare system facility managers, etc., with early estimates and condition assessments of the facilities.
(2) These adjustments were determined by building upon a previously established framework, revealing a shortfall in applying CSIMF cost elements. Therefore, evaluating the normalization framework applicable to TIC for phase costs and HCF-specific cost elements informed the development of a specific normalization framework for CSIMF cost elements. The case study analysis justified the presence of a cost accuracy gap limited to the construction phase of a project. Normalization of the construction phase cost and mapping to total normalized costs using CSIMF cost elements validated the framework developed for CSIMF costs.
The current study outlined HCF cost normalization approaches for overall project costs, individual phase costs, and individual cost elements. The overarching findings have significant implications for HCF owners seeking to improve the accuracy of cost projections and benchmarking procedures. The CSIMF framework capitalizes on cost elements that enable pre-construction stakeholders to understand the detailed factors affecting overall project costs. The benefit of early cost indicators promotes positive overall project health in terms of cost accuracy. Further metrics calculated using the normalized costs are intended to understand if the project phase has efficiently used financial or human resources.
(3) Additionally, establishing fixed cost adjustment rates for cold (0.5) and warm (0.35) shell spaces reveals significant impacts when included in the overall project costs. Therefore, cost adjustments for shell spaces must further consider time and location constraints separately in the overall project cost to improve normalization accuracy.
Looking to the future, the study identified combinations of input and output indices inclusive of factors such as escalation. To best understand escalation and its relationship to the input and output indices of the normalization framework, a sensitivity analysis is recommended for various scenarios. While this study does not provide an in-depth analysis of escalation, it does provide foundational elements that lead toward applications of indices affecting healthcare cost predictions for accuracy in determining overall project costs.
Author Contributions
Conceptualization, V.S. and C.H.C.; Methodology, V.S.; Formal analysis, V.S. and P.B.; Investigation, V.S. and C.H.C.; Resources, V.S., C.H.C. and D.G.; Writing—original draft, V.S.; Writing—review & editing, V.S., C.H.C., D.G. and P.B.; Supervision, V.S., C.H.C. and D.G. All authors have read and agreed to the published version of the manuscript.
Funding
This research received no external funding.
Data Availability Statement
Data is contained within the article and Appendix A, Appendix B and Appendix C. The data presented in this study are available in Appendix A, Appendix B and Appendix C.
Conflicts of Interest
The authors declare no conflicts of interest.
Appendix A
Figure A1 discusses the normalization procedure and framework for Total Installed Cost (TIC).
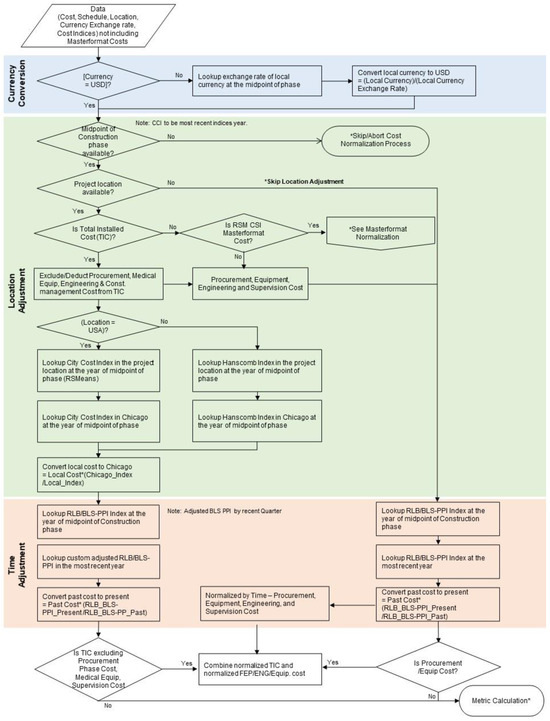
Figure A1.
Normalization procedure and framework for TIC. (* refer to Section 2.2 for Cost normalization procedure and Table 4 for calculation).
Appendix B
This appendix tabulates the normalization of Phase costs, HCF-specific and CSIMF cost elements through a case study.
Table A1.
Case study—Normalization of Phase costs 1.
Table A1.
Case study—Normalization of Phase costs 1.
| ID | Cost Category | Question Name— Revised | Cost (USD) | Normalization Method | Location Adjustment 2 | Time Adjustment 3 |
|---|---|---|---|---|---|---|
| Cost after LA (USD) | Final Normalized Cost (USD) | |||||
| 101 | Phase cost | FEP—Actual Cost | USD 10,806 | LA and TA | USD 12,345 | USD 18,202 |
| 103 | Phase cost | Detail Design (DD)—Actual Cost 1 | USD 437,253 | TA | - | USD 644,696 |
| 105 | Phase cost | Procurement— Actual Cost 1 | USD 1,740,773 | TA | - | USD 2,566,636 |
| 107 | Phase cost | Construction— Actual Cost 1 | USD 6,013,294 | LA and TA | USD 6,869,733 | USD 10,128,894 |
| 113 | Phase cost | Activation/ Move-in—Actual Cost | USD 31,701 | LA and TA | USD 36,216 | USD 53,397 |
| TOTAL | USD 8,233,827 | USD 6,918,294 | USD 13,411,825 | |||
1 Using normalization framework for TIC. 2 LA: RSMeans Missouri 2012 = 199.5; RSMeans Chicago 2012—226.9. 3 TA: BLS-PPI 2012 = 100; BLS-PPI 2021 = 132.7.
Table A2.
Case study—Normalization of HCF-specific cost elements 1.
Table A2.
Case study—Normalization of HCF-specific cost elements 1.
| ID | Cost Category | Question Name— Revised | Cost (USD) | Normalization Method | Location Adjustment 2 | Time Adjustment 3 |
|---|---|---|---|---|---|---|
| Cost after LA (USD) | Final Normalized Cost (USD) | |||||
| 2147 | HC-specific costs | Total Site development on-site | USD 348,781 | LA and TA | USD 398,456 | USD 587,493 |
| 2148 | HC-specific costs | Site development off-site | USD 258,009 | LA and TA | USD 294,756 | USD 434,595 |
| 2149 | HC-specific costs | Building Construction (including excavation within 5′ of the building) | USD 5,025,365 | LA and TA | USD 5,741,099 | USD 8,464,810 |
| 2155 | HC-specific costs | Furnishings | USD 13,001 | LA and TA | USD 14,853 | USD 21,899 |
| 2152 | HC-specific costs | Owner’s miscellaneous | USD 124,198 | LA and TA | USD 141,886 | USD 209,201 |
| 2156 | HC-specific costs | Artwork and plants | USD 26,417 | LA and TA | USD 30,179 | USD 44,497 |
| 2157 | HC-specific costs | IT | USD 108,822 | LA and TA | USD 124,321 | USD 183,302 |
| 2195 | HC-specific costs | Roof garden | USD 1,300 | LA and TA | USD 1,485 | USD 2,190 |
| 2197 | HC-specific costs | Mechanical tunnel | USD 118,208 | LA and TA | USD 135,044 | USD 199,112 |
| 2159 | HC-specific costs | Commissioning cost | USD 31,701 | LA and TA | USD 36,216 | USD 53,397 |
| 2151 | HC-specific costs | CM Pre-construction fees | USD 35,194 | TA | - | USD 51,891 |
| 2158 | HC-specific costs | Project management and agent fees | USD 178,589 | TA | - | USD 263,316 |
| 2150 | HC-specific costs | Professional fees (A/E and Consulting Engineers) | USD 448,059 | TA | - | USD 660,629 |
| 2153 | HC-specific costs | Capital Medical equipment | USD 947,070 | TA | - | USD 1,396,381 |
| 2338 | Medical equipment | Reused medical equipment | USD 131,365 | TA | - | USD 193,687 |
| 2339 | Medical equipment | Food service equipment | USD 75,164 | TA | - | USD 110,824 |
| 2340 | Medical equipment | Security Systems | USD 37,269 | TA | - | USD 54,950 |
| 2341 | Medical equipment | Scrub sinks | USD 4,419 | TA | - | USD 6,515 |
| 2342 | Medical equipment | Sterilization equipment | USD 45,750 | TA | - | USD 67,455 |
| 2343 | Medical equipment | Cart washer | USD 3,997 | TA | - | USD 5,893 |
| 2344 | Medical equipment | Laboratory or pharmacy casework | USD 22,135 | TA | - | USD 32,636 |
| 2345 | Medical equipment | Patient monitoring system | USD 71,870 | TA | - | USD 105,967 |
| 2346 | Medical equipment | Nurse Call Systems | USD 5,712 | TA | - | USD 8,421 |
| 2347 | Medical equipment | OR lighting | USD 34,627 | TA | - | USD 51,055 |
| 2348 | Medical equipment | Headwalls | USD 33,795 | TA | - | USD 49,828 |
| 2351 | Medical equipment | Paper Towels, toilet accessories, soap dispensers | USD 13,413 | TA | - | USD 19,776 |
| 2352 | Medical equipment | Equipment seismic bracing | USD 5,524 | TA | - | USD 8,145 |
| 2353 | Medical equipment | Other | USD 84,075 | TA | - | USD 123,962 |
| TOTAL | USD 8,233,829 | USD 6,918,295 | USD 13,411,827 | |||
1 Using normalization framework for TIC. 2 LA: RSMeans Missouri 2012 = 199.5; RSMeans Chicago 2012—226.9. 3 TA: BLS-PPI 2012 = 100; BLS-PPI 2021 = 132.7.
Table A3.
Case study—Normalization of CSIMF cost elements 1.
Table A3.
Case study—Normalization of CSIMF cost elements 1.
| ID | Cost Category | Question Name— Revised | Cost (USD) | Normalization Method | Location Adjustment 2 | Time Adjustment 3 |
|---|---|---|---|---|---|---|
| Cost after LA (USD) | Final Normalized Cost (USD) | |||||
| 2165 | MasterFormat costs | Division 01—Total General Requirements | USD 172,907 | LA and TA | USD 196,692 | USD 209,681 |
| 2166 | MasterFormat costs | Division 03—Total Concrete | USD 437,850 | LA and TA | USD 550,477 | USD 572,304 |
| 2167 | MasterFormat costs | Division 04—Total Masonry | USD 372,291 | LA and TA | USD 461,599 | USD 529,893 |
| 2168 | MasterFormat costs | Division 05—Total Metals | USD 340,158 | LA and TA | USD 338,903 | USD 326,677 |
| 2169 | MasterFormat costs | Division 06—Total Wood and Plastics | USD 209,956 | LA and TA | USD 281,142 | USD 242,371 |
| 2170 | MasterFormat costs | Division 07—Total Thermal and Moisture Protection | USD 324,250 | LA and TA | USD 369,136 | USD 415,592 |
| 2171 | MasterFormat costs | Division 08—Total Doors and Windows | USD 350,859 | LA and TA | USD 391,892 | USD 422,840 |
| 2172 | MasterFormat costs | Division 09—Total Finishes | USD 413,720 | LA and TA | USD 535,522 | USD 546,890 |
| 2173 | MasterFormat costs | Division 10—Total Specialties | USD 1,713 | LA and TA | USD 1,790 | USD 1,875 |
| 2174 | MasterFormat costs | Division 11—Total Equipment | USD 16,502 | LA and TA | USD 17,241 | USD 18,062 |
| 2175 | MasterFormat costs | Division 12—Total furnishings | USD 13,001 | LA and TA | USD 13,583 | USD 14,230 |
| 2176 | MasterFormat costs | Division 13—Total Special Construction | USD 17,724 | LA and TA | USD 18,518 | USD 19,399 |
| 2177 | MasterFormat costs | Division 14—Total conveying systems | USD 112,876 | LA and TA | USD 117,930 | USD 123,546 |
| 2178 | MasterFormat costs | Division 21—Total Fire Suppression | USD 68,034 | LA and TA | USD 76,894 | USD 84,536 |
| 2179 | MasterFormat costs | Division 22—Total Plumbing | USD 284,185 | LA and TA | USD 321,191 | USD 353,112 |
| 2180 | MasterFormat costs | Division 23—Total HVAC | USD 480,775 | LA and TA | USD 543,380 | USD 597,384 |
| 2182 | MasterFormat costs | Division 26—Total Electrical | USD 564,130 | LA and TA | USD 616,096 | USD 721,636 |
| 2183 | MasterFormat costs | Division 27—Total communications | USD 106,822 | LA and TA | USD 116,662 | USD 136,647 |
| 2184 | MasterFormat costs | Division 28—Total electrical safety and security | USD 52,287 | LA and TA | USD 54,628 | USD 57,230 |
| 2186 | MasterFormat costs | Division 31—Total Earthwork | USD 606,790 | LA and TA | USD 627,648 | USD 699,704 |
| 2187 | MasterFormat costs | Division 32—Total Exterior Improvements | USD 323,291 | LA and TA | USD 334,404 | USD 372,795 |
| 2188 | MasterFormat costs | Division 33—Total Utilities | USD 112,766 | LA and TA | USD 116,642 | USD 130,033 |
| 2191 | MasterFormat costs | Division 007200— Contractor’s General Conditions | USD 323,223 | LA and TA | USD 367,685 | USD 391,967 |
| 2192 | MasterFormat costs | Division 008100— Contractor’s Fee | USD 138,214 | LA and TA | USD 157,227 | USD 167,610 |
| 2193 | MasterFormat costs | Division 007316— Insurance | USD 56,423 | LA and TA | USD 64,184 | USD 68,423 |
| 2602 | MasterFormat costs | Division 25—Total integrated automation | USD 51,755 | LA and TA | USD 54,072 | USD 56,647 |
| 2603 | MasterFormat costs | Division 02—Total Existing Conditions (natural) | USD 4,396 | LA and TA | USD 4,547 | USD 5,069 |
| 2607 | MasterFormat costs | Division 007318—Bonds | USD 56,388 | LA and TA | USD 64,144 | USD 68,380 |
| TOTAL | USD 6,013,286 | USD 6,813,829 | USD 7,354,533 | |||
1 Using normalization framework for CSIMF cost elements. 2 LA: RSMeans CSIMF Missouri 2012; RSMeans CSIMF Chicago 2012. 3 TA: BLS-PPI 2012 = 100; BLS-PPI 2021 = 132.7.
Appendix C
This appendix tabulates the data mapping for the MasterFormat divisions prior to 2005 and after 2005.
Table A4.
MasterFormat divisions—data mapping.
Table A4.
MasterFormat divisions—data mapping.
| RSMEANS CSI DIVISIONS (PRIOR TO 2005) | RSMEANS CSI DIVISIONS (2005) | QUESTIONNAIRE DESCRIPTION (16.2) | CSI Division ID | |||
|---|---|---|---|---|---|---|
| 01590 | Equipment Rental | 015433 | Contractor Equipment | None | None | 1 |
| 02 | Site Construction | 0241, 31–34 | Site and Infrastructure, Demolition | Div. 2 | Total Existing Conditions (natural) | 2 |
| 02 | Site Construction | 0241, 31–35 | Site and Infrastructure, Demolition | Div. 31 | Total Earthwork | 2 |
| 02 | Site Construction | 0241, 31–36 | Site and Infrastructure, Demolition | Div. 32 | Total Exterior Improvements | 2 |
| 02 | Site Construction | 0241, 31–37 | Site and Infrastructure, Demolition | Div. 33 | Total Utilities | 2 |
| 02 | Site Construction | 0241, 31–38 | Site and Infrastructure, Demolition | Div. 34 | Total Transportation | 2 |
| 03 | Concrete | 03 | Concrete | Div. 3 | Total Concrete | 3 |
| 04 | Masonry | 04 | Masonry | Div. 4 | Total Masonry | 4 |
| 05 | Metals | 05 | Metals | Div. 5 | Total Metals | 5 |
| 06 | Wood & Plastics | 06 | Wood, Plastics, and Composites | Div. 6 | Total Wood and Plastics | 6 |
| 07 | Thermal and Moisture Protection | 07 | Thermal and Moisture Protection | Div. 7 | Total Thermal and Moisture Protection | 7 |
| 08 | Doors and Windows | 08 | Openings | Div. 8 | Total Doors and Windows | 8 |
| 09 | Finishes | 09 | Finishes | Div. 9 | Total Finishes | 9 |
| 10–14 | Divs. 10–14 | Covers | Divs. 10–14, 25, 28, 41, 43, 44, 46 | Div. 10 | Total Specialties | 10 |
| 10–14 | Divs. 10–14 | Covers | Divs. 10–14, 25, 28, 41, 43, 44, 47 | Div. 11 | Total Equipment | 10 |
| 10–14 | Divs. 10–14 | Covers | Divs. 10–14, 25, 28, 41, 43, 44, 48 | Div. 12 | Total Furnishings | 10 |
| 10–14 | Divs. 10–14 | Covers | Divs. 10–14, 25, 28, 41, 43, 44, 49 | Div. 13 | Total Special Construction | 10 |
| 10–14 | Divs. 10–14 | Covers | Divs. 10–14, 25, 28, 41, 43, 44, 50 | Div. 14 | Total Conveying Systems | 10 |
| 10–14 | Divs. 10–14 | Covers | Divs. 10–14, 25, 28, 41, 43, 44, 51 | Div. 25 | Total Integrated Automation | 10 |
| 10–14 | Divs. 10–14 | Covers | Divs. 10–14, 25, 28, 41, 43, 44, 52 | Div. 28 | Total Electrical Safety and Security | 10 |
| 10–14 | Divs. 10–14 | Covers | Divs. 10–14, 25, 28, 41, 43, 44, 53 | Div. 41 | Total Material Processing and Handling Equip | 10 |
| 10–14 | Divs. 10–14 | Covers | Divs. 10–14, 25, 28, 41, 43, 44, 54 | Div. 44 | Total Pollution and Waste Control Equipment | 10 |
| 10–14 | Divs. 10–14 | Covers | Divs. 10–14, 25, 28, 41, 43, 44, 55 | Div. 46 | Total Water and Wastewater Equip. | 10 |
| 15 | Mechanical | 21, 22, 23 | Fire Suppression, Plumbing and HVAC | Div. 21 | Total Fire Suppression | 11 |
| 15 | Mechanical | 21, 22, 24 | Fire Suppression, Plumbing and HVAC | Div. 22 | Total Plumbing | 11 |
| 15 | Mechanical | 21, 22, 25 | Fire Suppression, Plumbing and HVAC | Div. 23 | Total HVAC | 11 |
| 16 | Electrical | 26, 27, 3370 | Electrical, Communications and Util. | Divi. 26 | Total Electrical | 12 |
| 16 | Electrical | 26, 27, 3371 | Electrical, Communications and Util. | Div. 27 | Total Communications | 12 |
| 16 | Electrical | 26, 27, 3372 | Electrical, Communications and Util. | Div. 48 | Total Electrical Power Generation | 12 |
| 0–16 | Weighted Average | MF2010 | Weighted Average | Div. 01 | Total General Requirements | 13 |
| 0–16 | Weighted Average | MF2010 | Weighted Average | Div. 008300 | Construction Contingency | 13 |
| 0–16 | Weighted Average | MF2010 | Weighted Average | Div. 007200 | Contractor’s General Conditions | 13 |
| 0–16 | Weighted Average | MF2010 | Weighted Average | Div. 007210 | Supervision Cost | |
| 0–16 | Weighted Average | MF2010 | Weighted Average | Div. 008100 | Contractor’s Fee | 13 |
| 0–16 | Weighted Average | MF2010 | Weighted Average | Div. 007316 | Insurance | 13 |
| 0–16 | Weighted Average | MF2010 | Weighted Average | Div. 007318 | Bonds | 13 |
| 0–16 | Weighted Average | MF2010 | Weighted Average | Div. 008700 | Local Taxes | 13 |
| 0–17 | Weighted Average | MF2010 | Weighted Average | Div. 00 | USD Subtotal Division 0 Cost | 13 |
References
- Sharma, V.; Caldas, C.; Mulva, S. Development of metrics and an external benchmarking program for Healthcare Facilities. Int. J. Constr. Manag. 2021, 21, 615–630. Available online: https://www.tandfonline.com/doi/full/10.1080/15623599.2019.1573490 (accessed on 25 April 2023). [CrossRef]
- Maier, D. The Influence of the COVID-19 Pandemic on the Construction Technology Works. In Proceedings of the 37th IBIMA Conference, Cordoba, Spain, 30–31 May 2021; Available online: https://www.researchgate.net/publication/353394199_The_influence_of_the_COVID-19_Pandemic_on_the_Construction_Technology_works (accessed on 25 April 2023).
- Singhal, S.; Patel, N. The Future of US Healthcare: What’s Next for the Industry Post-COVID-19. McKinsey & Company, 2022. Available online: https://www.mckinsey.com/industries/healthcare/our-insights/the-future-of-us-healthcare-whats-next-for-the-industry-post-covid-19 (accessed on 25 April 2023).
- Little, J. Three Key Trends Guiding Healthcare Construction in 2022. Charlotte, NC. Available online: https://premierinc.com/newsroom/blog/three-key-trends-guiding-healthcare-construction-in-2022 (accessed on 25 April 2023).
- Enache-Pommer, E.; Horman, M.J.; Messner, J.I.; Riley, D. A Unified Process Approach to Healthcare Project Delivery: Synergies between Greening Strategies, Lean Principles, and BIM. ASCE Library, Construction Research Congress. 2010. Available online: https://ascelibrary.org/doi/10.1061/41109%28373%29138 (accessed on 25 April 2023).
- Sharma, V.; Caldas, C.H.; Mulva, S.P. Identification and Prioritization of Factors Affecting the Overall Project Cost of Healthcare Facilities. ASCE Libr. J. Constr. Eng. Manag. 2020, 146, 04019106. Available online: https://ascelibrary.org/doi/10.1061/%28ASCE%29CO.1943-7862.0001692 (accessed on 25 April 2023). [CrossRef]
- Lu, J.; Price, A. Dealing with Complexity Through More Robust Approaches to the Evidence-Based Design of Healthcare Facilities. Health Environ. Res. Des. J. 2011, 4, 3–7. Available online: https://journals.sagepub.com/doi/full/10.1177/193758671100400401 (accessed on 25 April 2023). [CrossRef] [PubMed]
- Sharma, V.; Yun, S.; Oliveira, D.P.; Mulva, S.P.; Caldas, C.H. Development of a cost normalization procedure for National Health Care Facility Benchmarking. In Proceedings of the 5th International Construction Specialty Conference of the Canadian Society for Civil Engineering (ICSC), Vancouver, BC, Canada, 7–10 June 2015; Available online: https://open.library.ubc.ca/soa/cIRcle/collections/52660/items/1.0076452 (accessed on 25 April 2023).
- Choi, J.; Yun, S.; de Oliveira, D.P. Developing a cost normalization framework for phase-based performance assessment of Construction Projects. Can. J. Civ. Eng. 2016, 43. Available online: https://cdnsciencepub.com/doi/abs/10.1139/cjce-2016-0223 (accessed on 25 April 2023). [CrossRef]
- Van Lent, W.A.; de Beer, R.D.; van Harten, W.H. International Benchmarking of specialty hospitals. A series of case studies on Comprehensive Cancer Centres. BMC Health Serv. Res. 2010, 10, 1–11. [Google Scholar] [CrossRef] [PubMed]
- Benson, H.R. An introduction to benchmarking in Healthcare. Radiol. Manag. 1994, 16, 35–39. Available online: https://pubmed.ncbi.nlm.nih.gov/10139084/ (accessed on 25 April 2023).
- Kumar, A.; Antony, J.; Dhakar, T.S. Integrating quality function deployment and benchmarking to achieve greater profitability. Benchmarking: Int. J. 2006, 13, 290–310. Available online: https://www.emerald.com/insight/content/doi/10.1108/14635770610668794/full/html (accessed on 25 April 2023). [CrossRef]
- Kozak, M.; Rimmington, M. Benchmarking: Destination attractiveness and small hospitality business performance. Int. J. Contemp. Hospit. Manag. 1998, 10. Available online: https://www.emerald.com/insight/content/doi/10.1108/09596119810227767/full/html (accessed on 25 April 2023). [CrossRef]
- Malec, H.A. Benchmarking barometers for products and Processes. Qual. Reliab. Eng. Int. 1994, 10, 455–465. [Google Scholar] [CrossRef]
- Roark, K.; Brooks, B.; Kilgore, K. Costs and benefits of shell space construction. Healthc. Financ. Manag. J. Healthc. Financ. Manag. Assoc. 1993, 47, 46–52. [Google Scholar]
- Dai, J.; Mulva, S.; Suk, S.-J.; Kang, Y. Cost Normalization for Global Capital Projects Benchmarking. Construction Research Congress. Available online: https://ascelibrary.org/doi/10.1061/9780784412329.241 (accessed on 25 April 2023).
- Hwang, B.G.; Thomas, S.R.; DeGezelle, D.; Caldas, C.H. Development of a benchmarking framework for Pharmaceutical Capital Projects. Constr. Manag. Econ. 2008, 26, 177–195. [Google Scholar] [CrossRef]
- Yun, S.; Choi, J.; de Oliveira, D.P.; Mulva, S.P. Development of performance metrics for phase-based Capital Project Benchmarking. Int. J. Proj. Manag. 2016, 34, 389–402. [Google Scholar] [CrossRef]
- Faithful Gould. Construction Cost Indices: Their Creation and Use. 2016. Available online: https://www.fgould.com/americas/articles/construction-cost-indices-their-creation-and-use/ (accessed on 19 February 2023).
- McCabe, B.Y.; O’Grady, J.; Walker, F. A Study of Construction Cost Sources. In Proceedings of the Annual Conference of the Canadian Society for Civil Engineering, Montréal, QC, Canada, 5–8 June 2002. [Google Scholar]
- RSMeans Data. City Cost Indexes. Gordian. 2023. Available online: https://www.rsmeansonline.com/ReferenceItems/DetailInfo/2 (accessed on 25 April 2023).
- Mulva, S.P.; Dai, J. Healthcare facility benchmarking. Health Environ. Res. Des. J. 2009, 3, 28–37. Available online: https://journals.sagepub.com/doi/10.1177/193758670900300104 (accessed on 25 April 2023). [CrossRef] [PubMed]
- Zevin, A. Cost Report—Indexes. 2022. Available online: https://digital.bnpmedia.com/publication/?i=742817&article_id=4244030&view=articleBrowser (accessed on 15 April 2023).
- Anon. Construction price indices: Sources and methods; Statistical Office of the European Communities, OECD: Paris, France, 1997. [Google Scholar]
- Sawhney, A.; Walsh, K.D.; Brown, A. International comparison of cost for the construction sector: Towards a conceptual model. Civ. Eng. Environ. Syst. 2004, 21, 151–167. [Google Scholar] [CrossRef]
- Mohammadian, R.; Seymour, S. An Analysis of Some Construction Price Index Methodologies. Statistics Canada, Analytical Series, Prices Division. 1997. Available online: https://www150.statcan.gc.ca/n1/en/pub/62f0014m/62f0014m1996002-eng.pdf?st=0k7CfUJ4 (accessed on 25 April 2023).
- U.S. Bureau of Labor Statistics. Producer Price Index for New Health Care Building Construction Sector, NAICS 236224. 2016. Available online: https://www.bls.gov/ppi/factsheets/producer-price-index-data-for-nonresidential-building-construction-sector-new-health-care-building-construction-naics-236224.htm (accessed on 25 April 2023).
- Turner Construction Company. Cost Index. Turner Construction Company, 2023. Available online: https://www.turnerconstruction.com/cost-index (accessed on 25 April 2023).
- RLB. North America Quarterly Construction Cost Report. Rider Levett Bucknall, 2022. Available online: https://www.rlb.com/americas/insight/rlb-construction-cost-report-north-america-q4-2022/ (accessed on 25 April 2023).
- Department of Defense. UFC 3-701-01 DOD Facilities Pricing Guide, with Change 2. National Institute of Building Sciences. 2023. Available online: https://www.wbdg.org/ffc/dod/unified-facilities-criteria-ufc/ufc-3-701-01 (accessed on 25 April 2023).
- NAVFAC. NAVFAC Building Cost Index (BCI) 2022-Q4. National Institute of Building Sciences. 2023. Available online: https://www.wbdg.org/FFC/NAVFAC/CEG/NAVFAC_BCI_2022_Q4.pdf (accessed on 25 April 2023).
- Ahn, J.; Ji, S.H.; Ahn, S.J.; Park, M.; Lee, H.S.; Kwon, N.; Lee, E.B.; Kim, Y. Performance evaluation of normalization-based CBR models for improving construction cost estimation. Autom. Construct. 2020, 119, 103329. [Google Scholar] [CrossRef]
- Rey, H. International Trade and Currency Exchange. Rev. Econ. Stud. 2001, 68, 443–464. Available online: http://www.helenerey.eu/AjaxRequestHandler.ashx?Function=GetSecuredDOC&DOCUrl=App_Data/helenerey_eu/Published-Papers_en-GB/_Documents_2012-13/71518040710_67186463733_restud.pdf (accessed on 25 April 2023). [CrossRef]
- United States Government Accountability Office. Gao Cost Estimating and Assessment Guide: Best Practices for Developing and Managing Capital Program Costs. GAO Applied Research and Applied Methods. United States Government Accountability Office: Washington, DC, USA, 2009. Available online: https://www.gao.gov/products/gao-09-3sp (accessed on 25 April 2023).
- Remer, D.S.; Lin, S.; Yu, N.; Hsin, K. An update on cost and scale-up factors, international inflation indexes and location factors. Int. J. Prod. Econ. 2008, 114, 333–346. [Google Scholar] [CrossRef]
- Choi, J.; Yun, S.; Oliveira, D.; Mulva, S.; Kang, Y. Cost Normalization Procedure for Phase-Based Performance Measurement. In Proceedings of the 6th International Conference on Construction Engineering and Project Management, Busan, Republic of Korea, 11–14 October 2015; pp. 72–76. Available online: https://koreascience.kr/article/CFKO201534159154275.pdf (accessed on 25 April 2023).
Disclaimer/Publisher’s Note: The statements, opinions and data contained in all publications are solely those of the individual author(s) and contributor(s) and not of MDPI and/or the editor(s). MDPI and/or the editor(s) disclaim responsibility for any injury to people or property resulting from any ideas, methods, instructions or products referred to in the content. |
© 2024 by the authors. Licensee MDPI, Basel, Switzerland. This article is an open access article distributed under the terms and conditions of the Creative Commons Attribution (CC BY) license (https://creativecommons.org/licenses/by/4.0/).