Author Contributions
Conceptualization, O.F.S. and M.Z.O.; methodology, O.F.S. and M.Z.O.; software, O.F.S.; validation, O.F.S. and M.Z.O.; formal analysis, O.F.S.; investigation, O.F.S.; resources, O.F.S. and M.Z.O.; data curation, O.F.S.; writing—original draft preparation, O.F.S.; writing—review and editing, O.F.S. and M.Z.O.; visualization, O.F.S.; supervision, O.F.S. and M.Z.O.; project administration, M.Z.O.; funding acquisition, O.F.S. and M.Z.O. All authors have read and agreed to the published version of the manuscript.
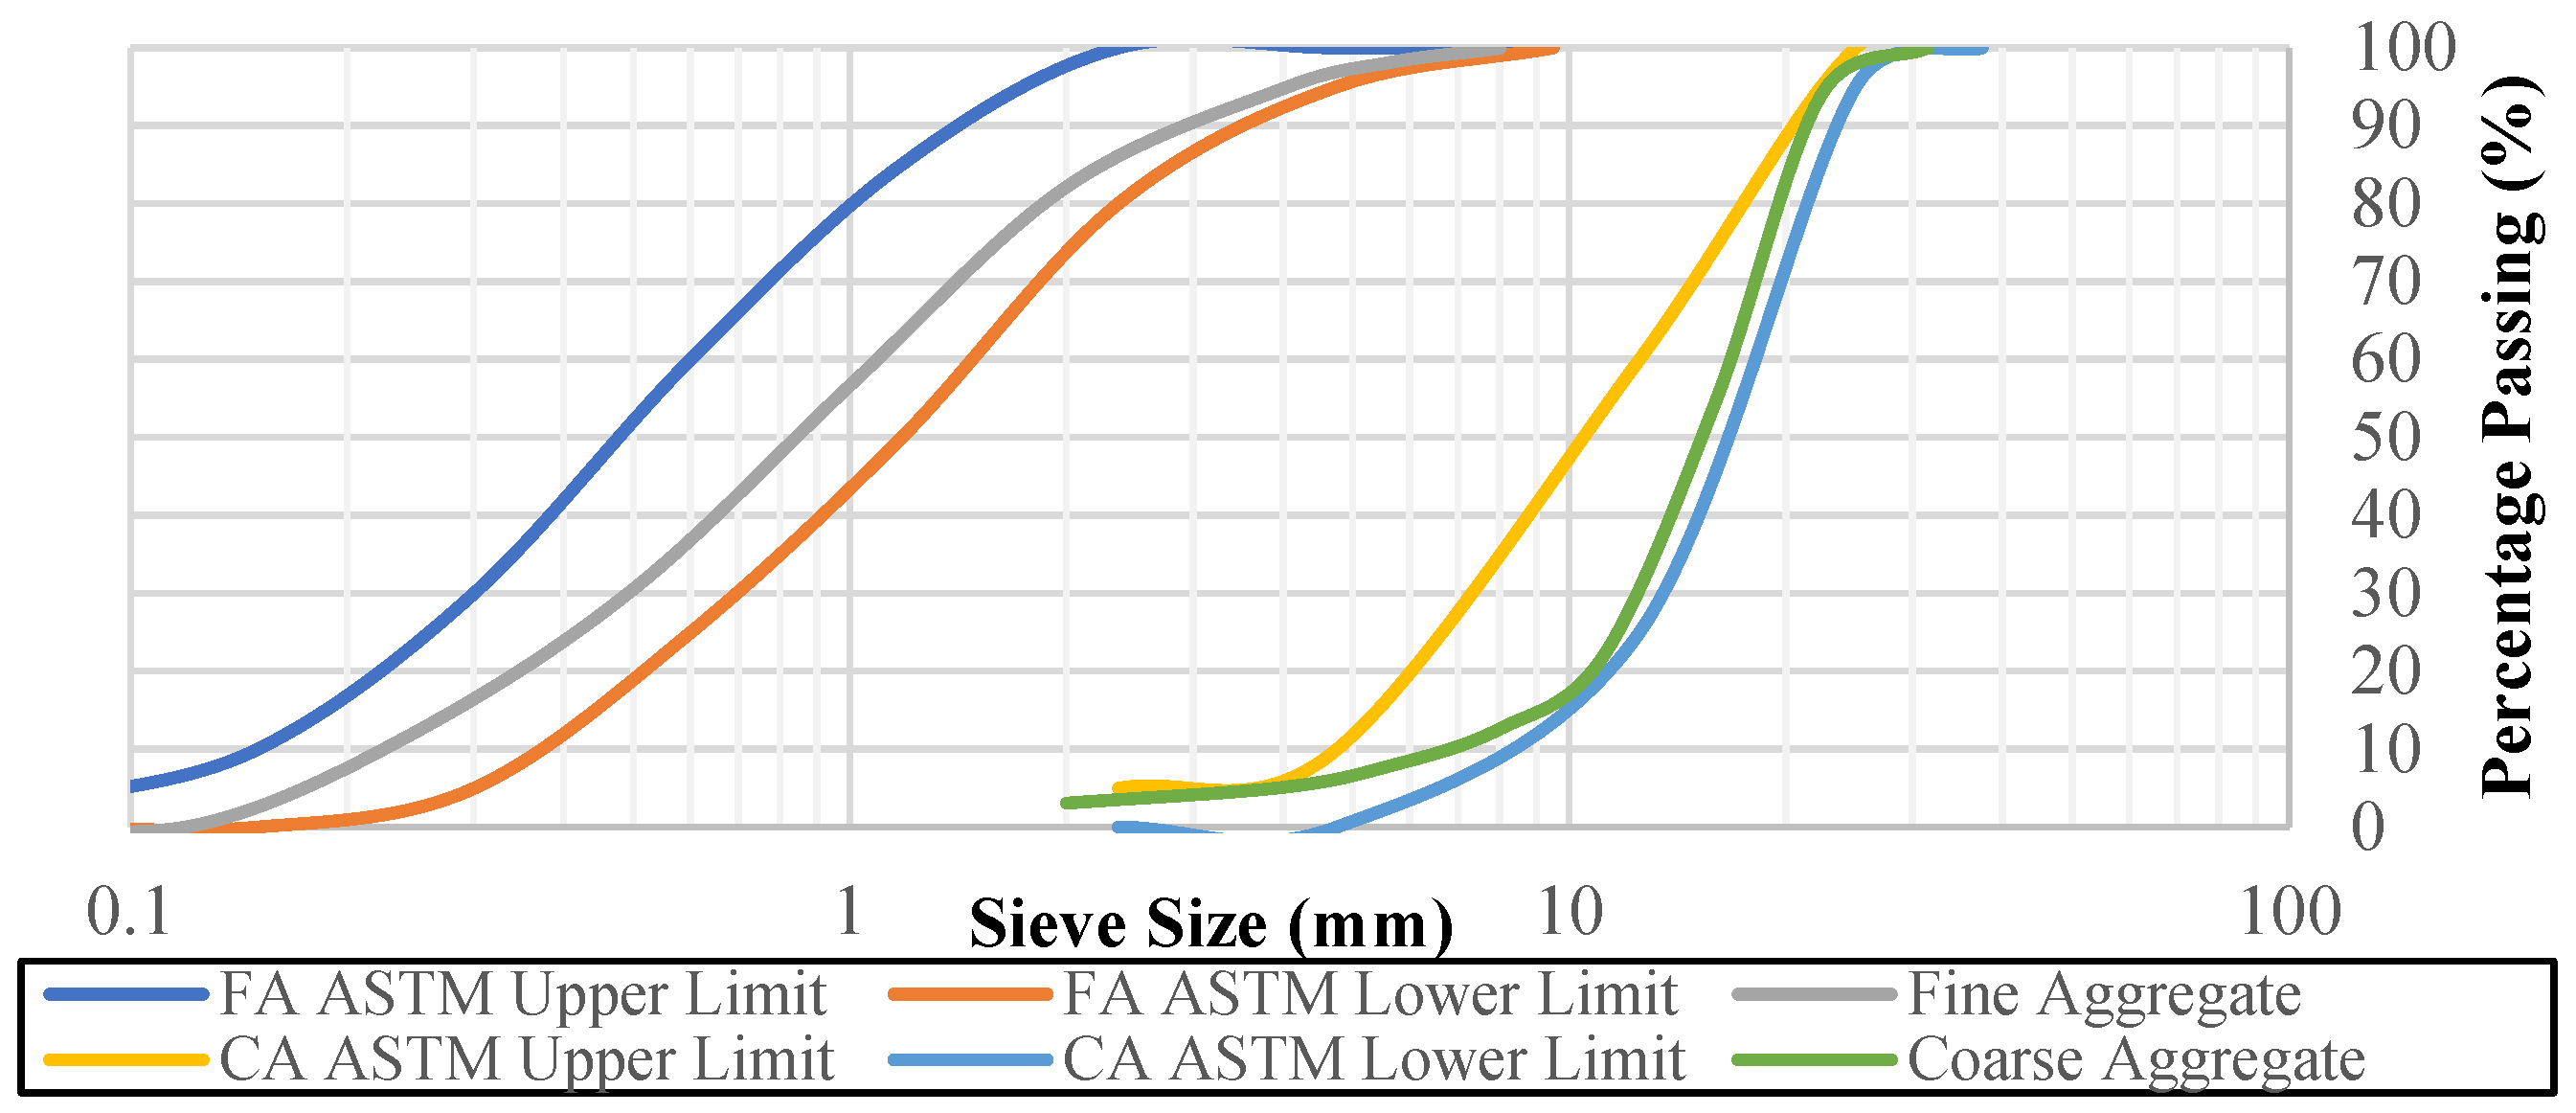
Figure 1.
Grading curves of aggregates.
Figure 1.
Grading curves of aggregates.
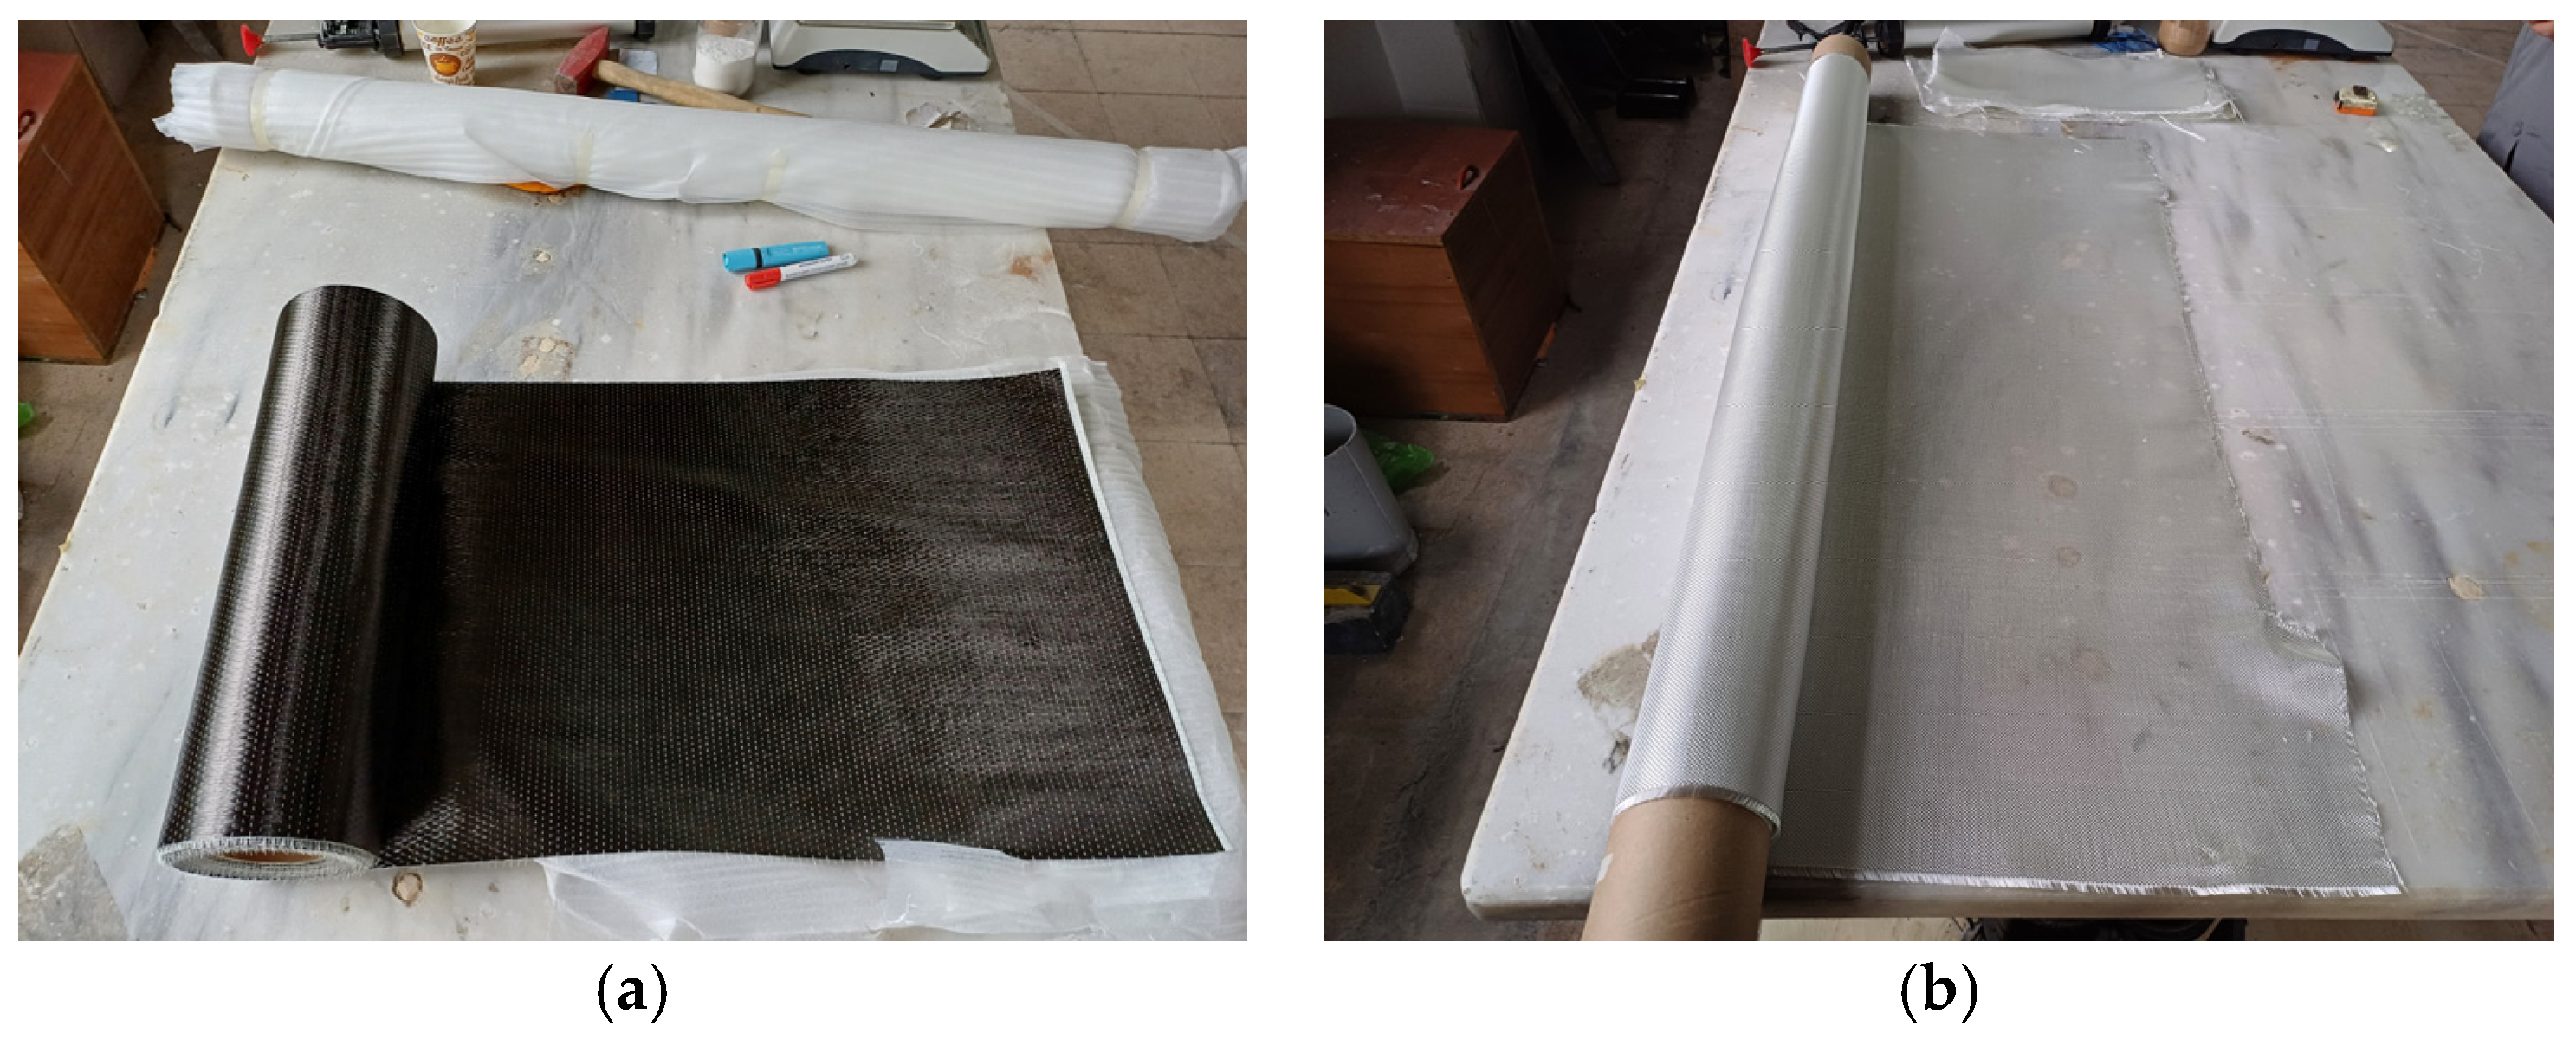
Figure 3.
FRP types: (a) CFRP, (b) GFRP.
Figure 3.
FRP types: (a) CFRP, (b) GFRP.
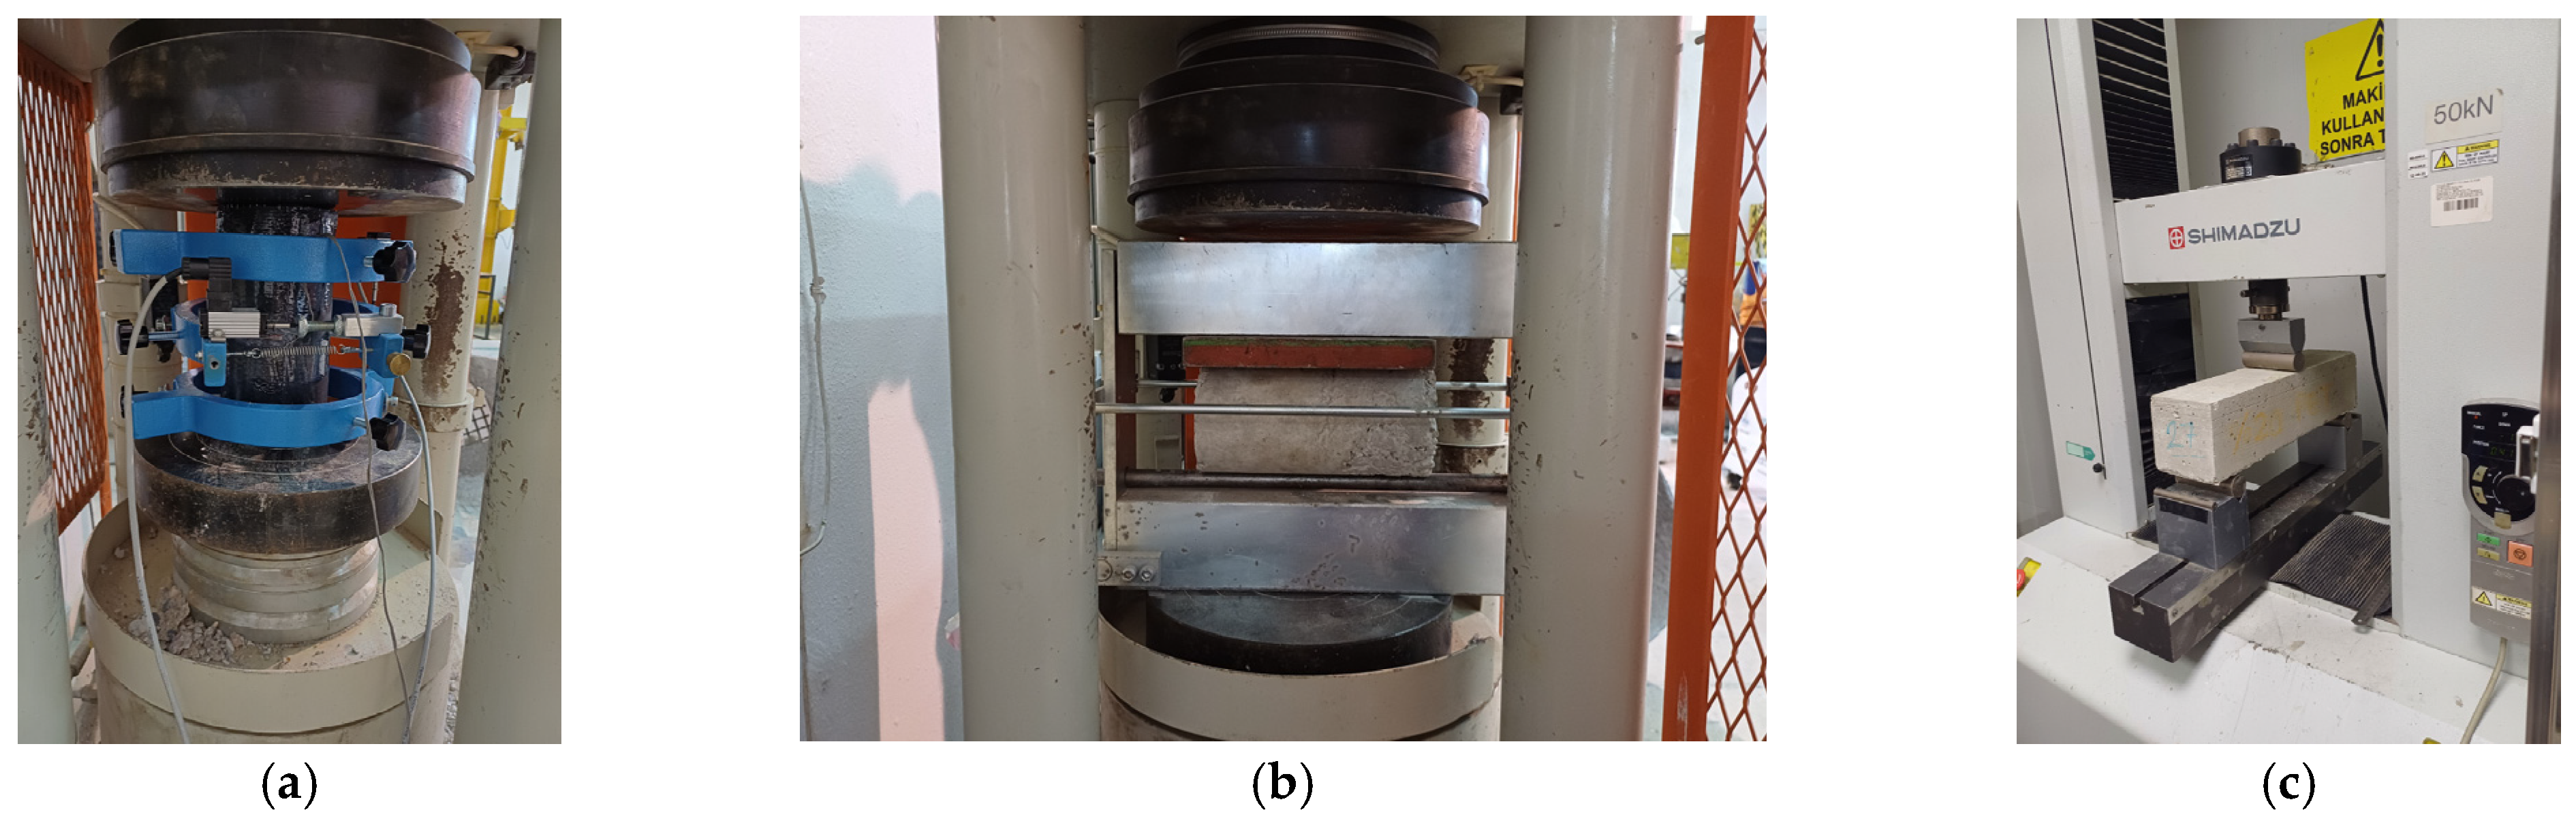
Figure 4.
Experimental setups: (a) compressive, (b) splitting tensile, (c) flexural.
Figure 4.
Experimental setups: (a) compressive, (b) splitting tensile, (c) flexural.
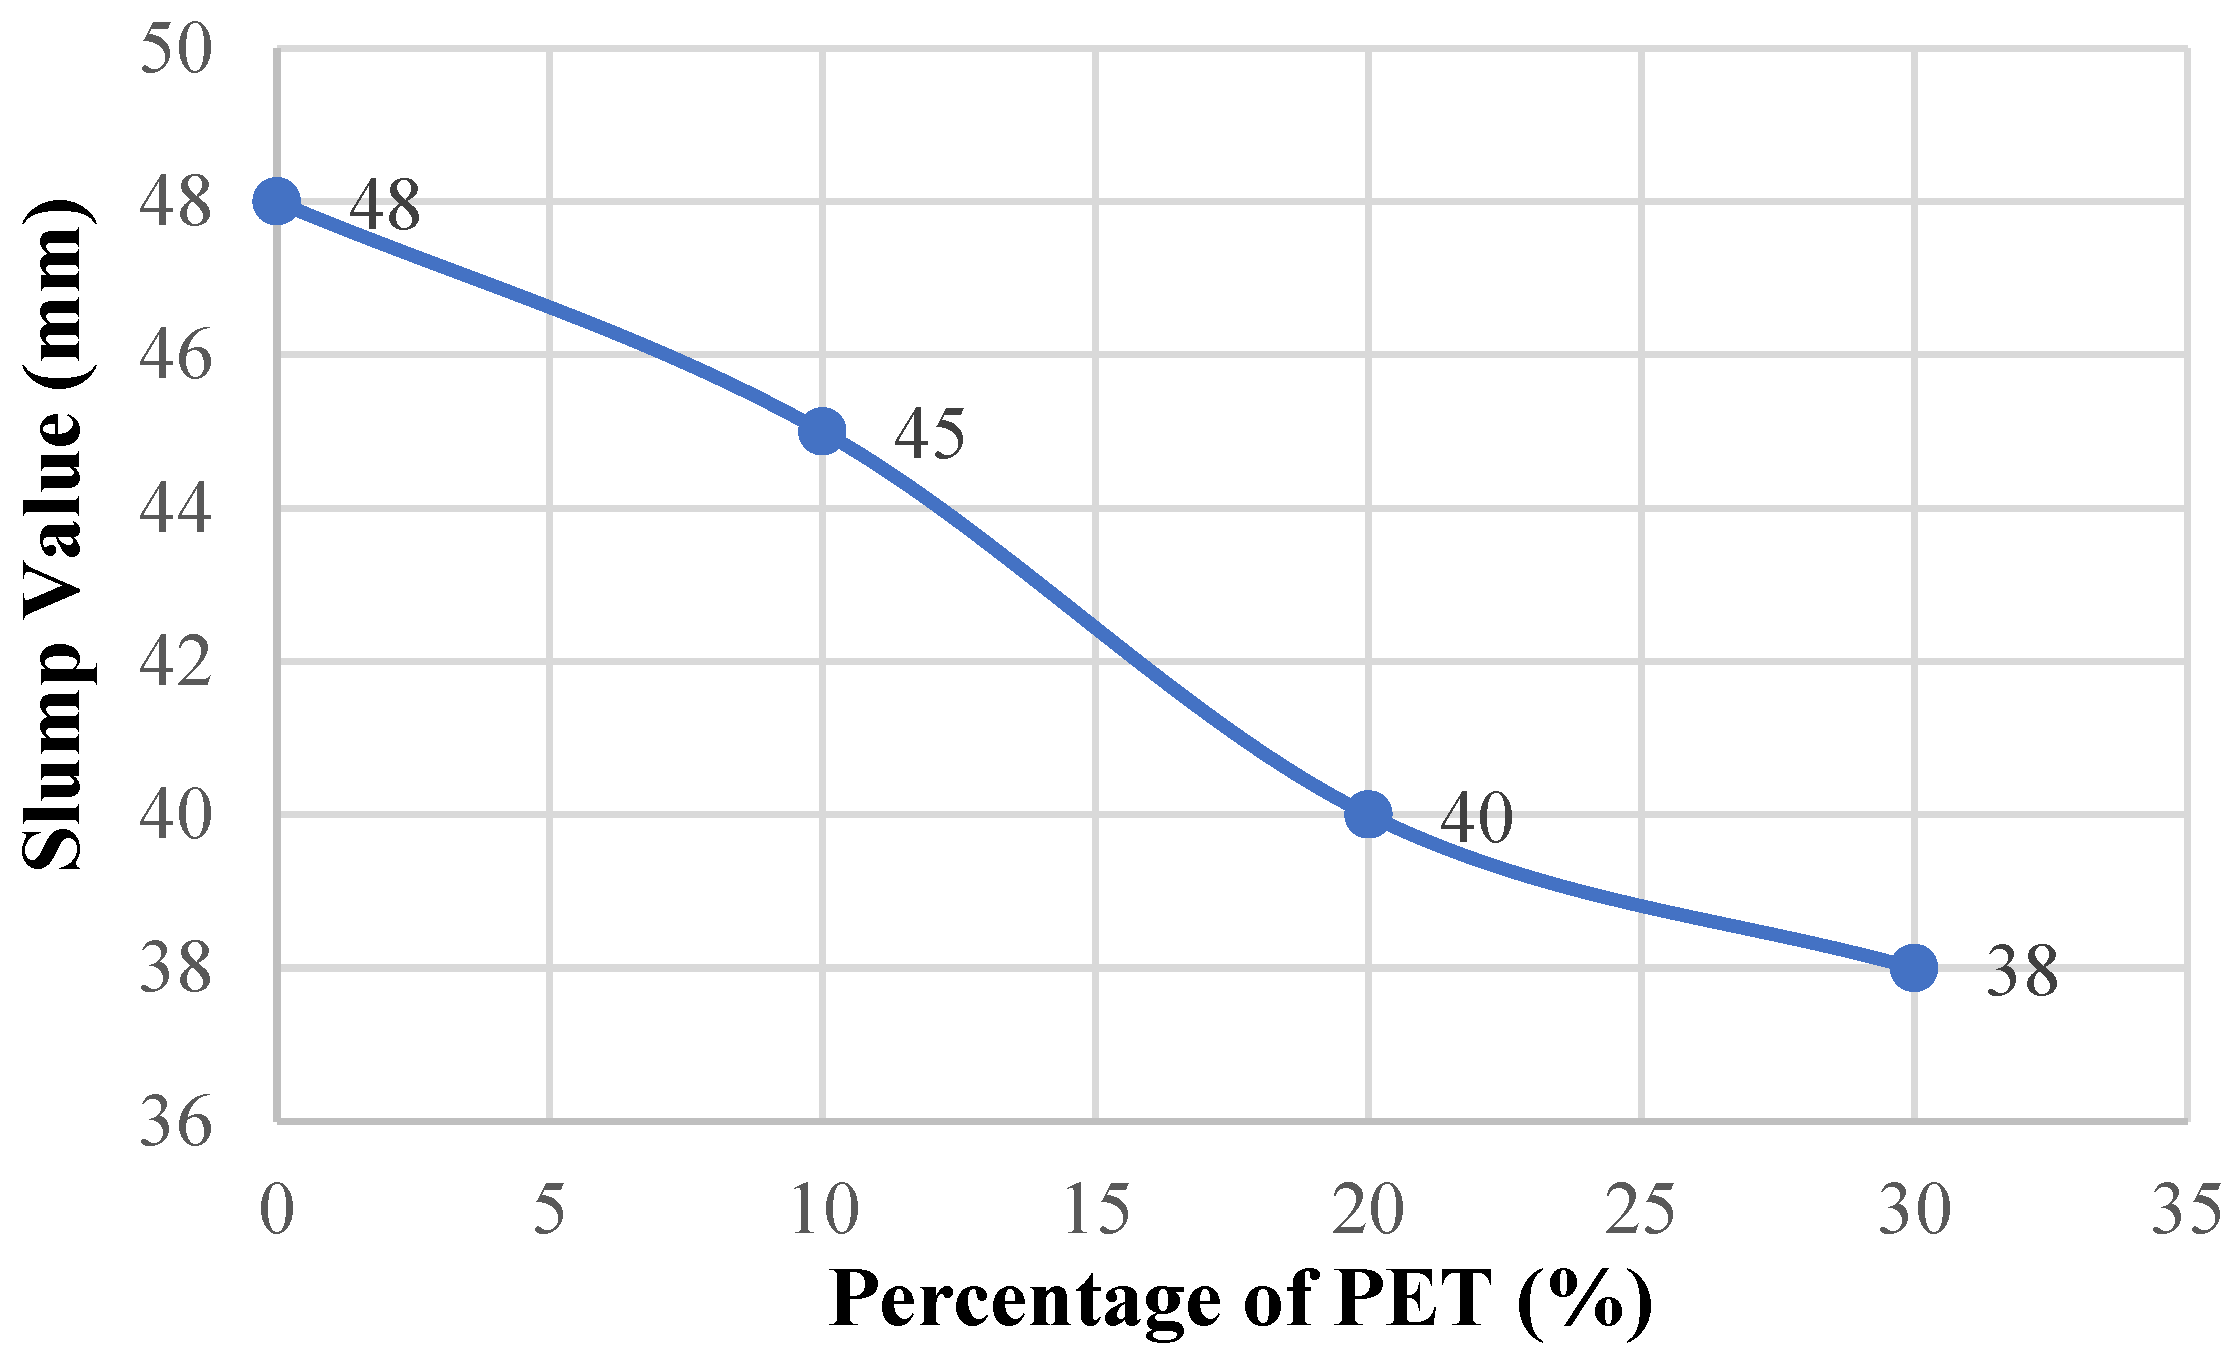
Figure 5.
Slump–percentage of PET graph.
Figure 5.
Slump–percentage of PET graph.
Figure 6.
Density–percentage of PET graph.
Figure 6.
Density–percentage of PET graph.
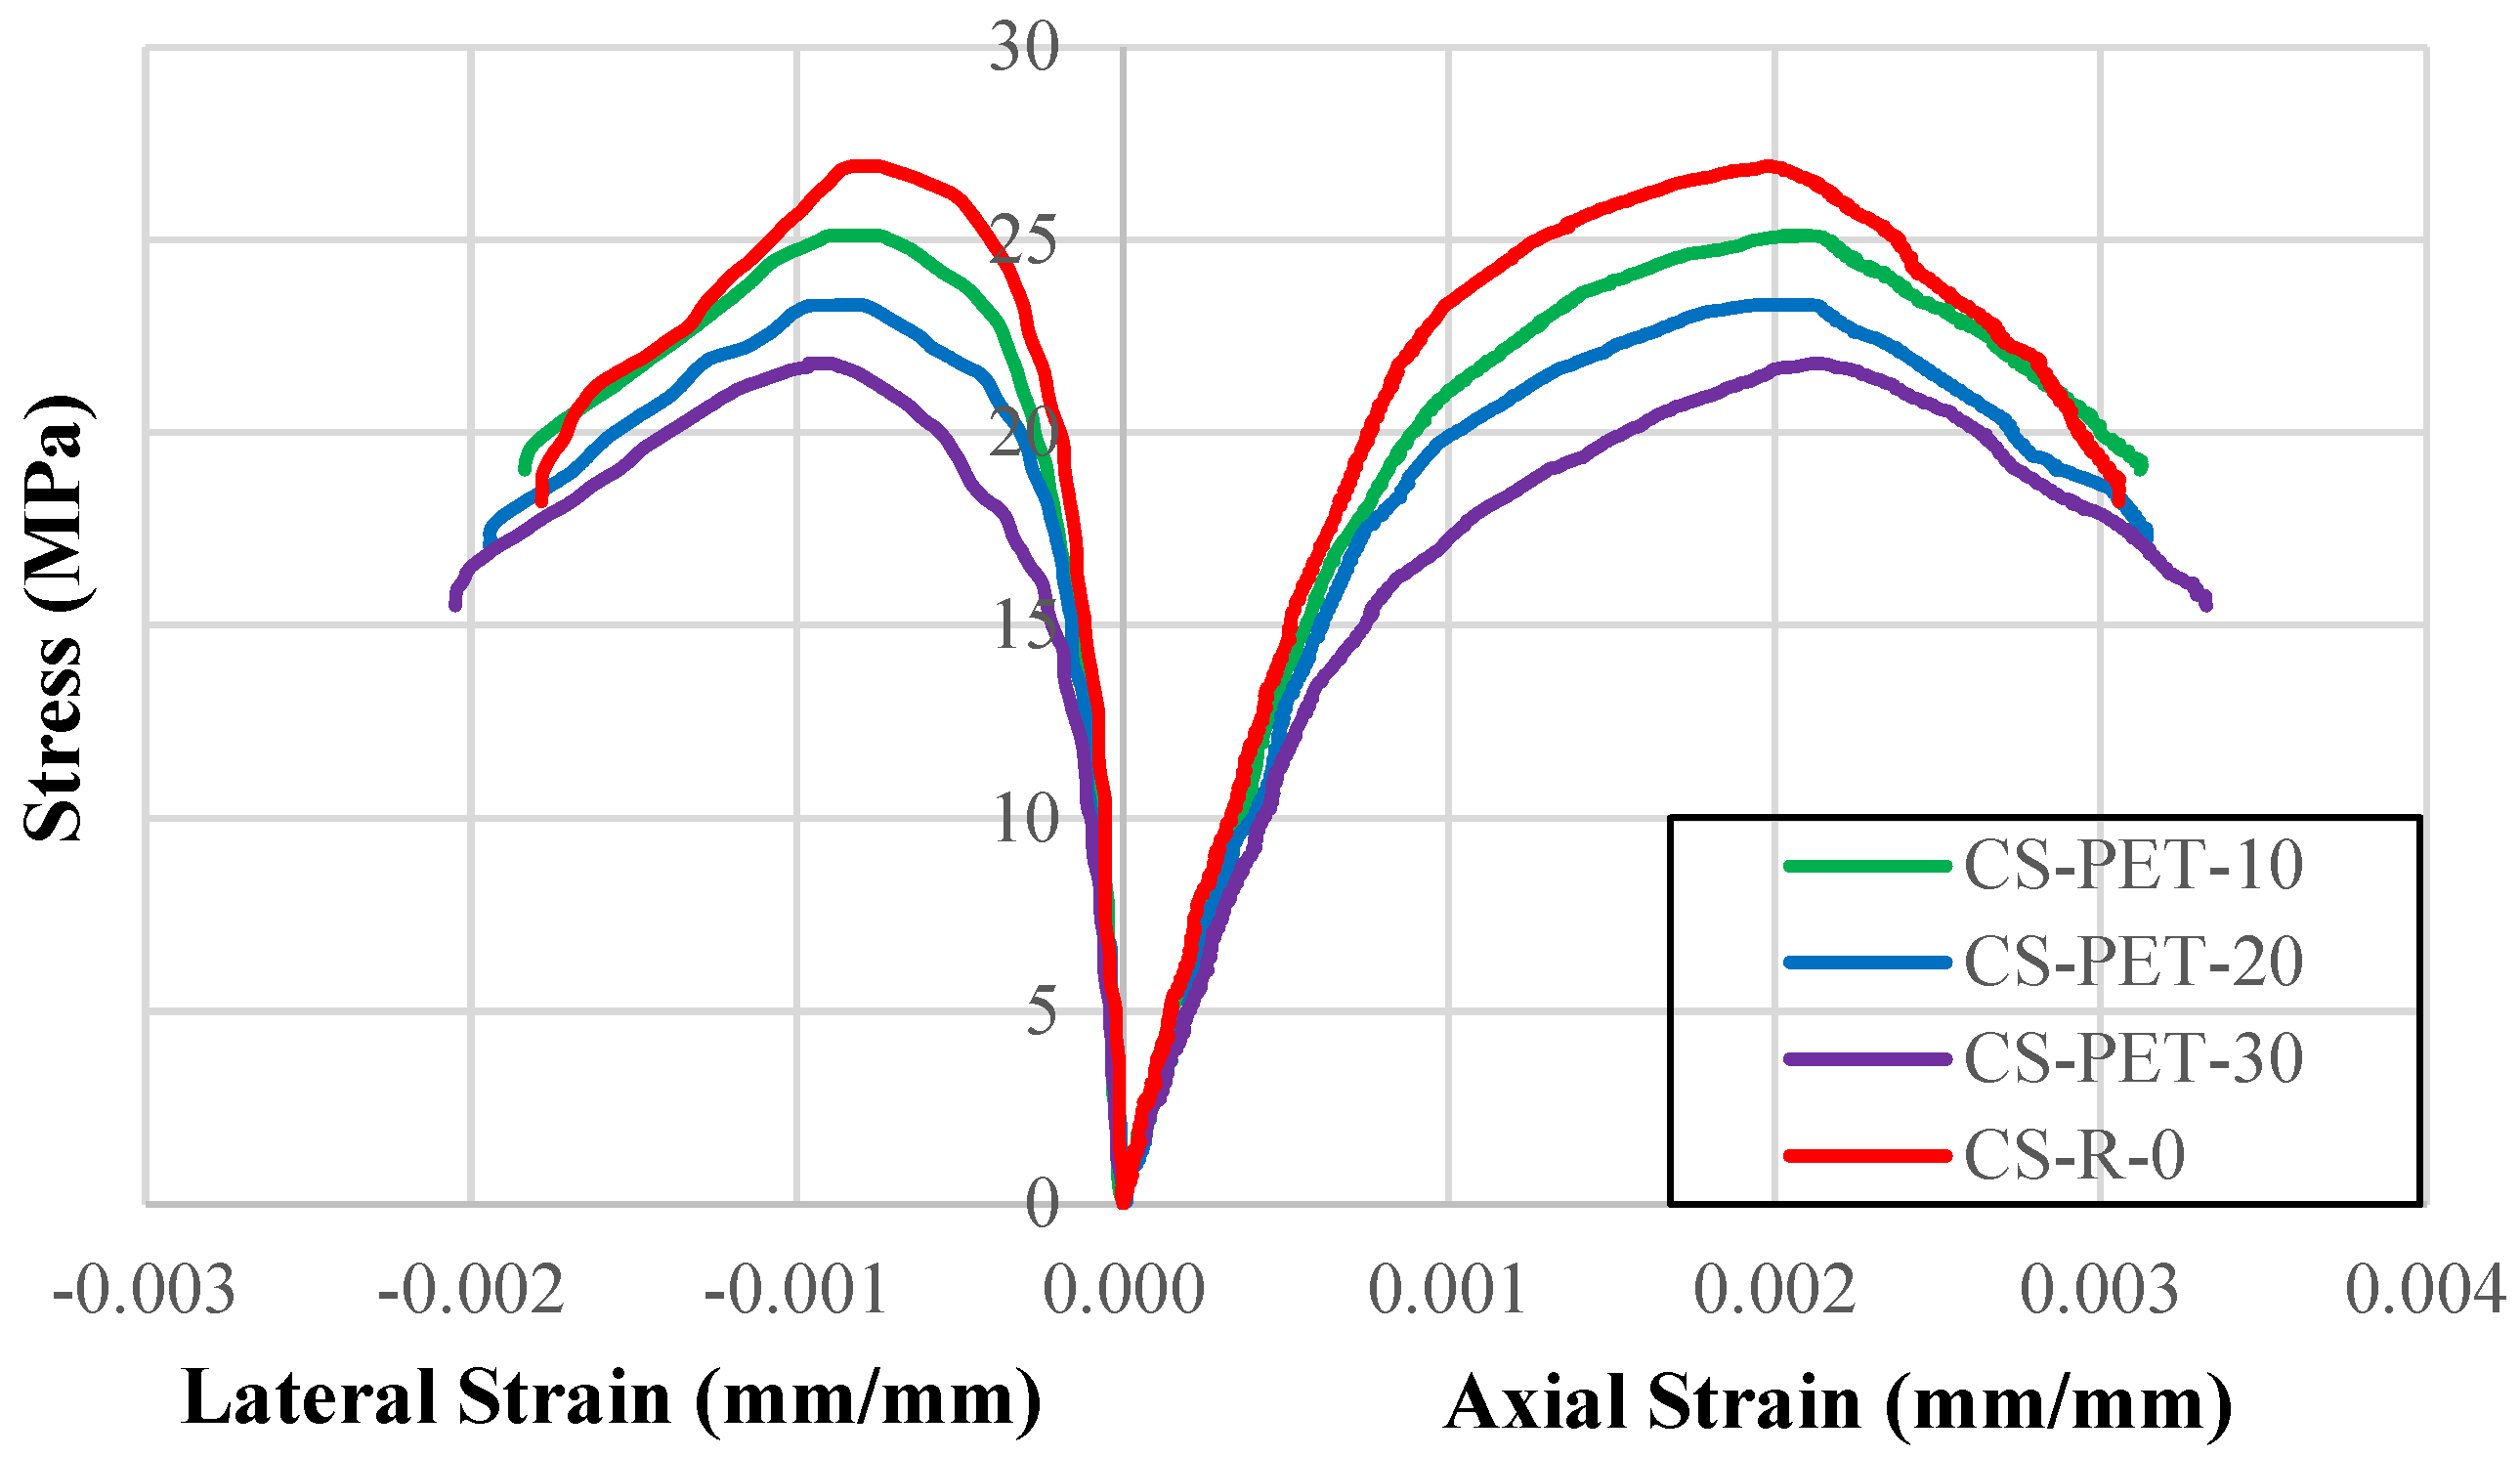
Figure 7.
Stress–strain graphs of samples without FRP.
Figure 7.
Stress–strain graphs of samples without FRP.
Figure 8.
Stress–strain graphs of samples with FRP.
Figure 8.
Stress–strain graphs of samples with FRP.
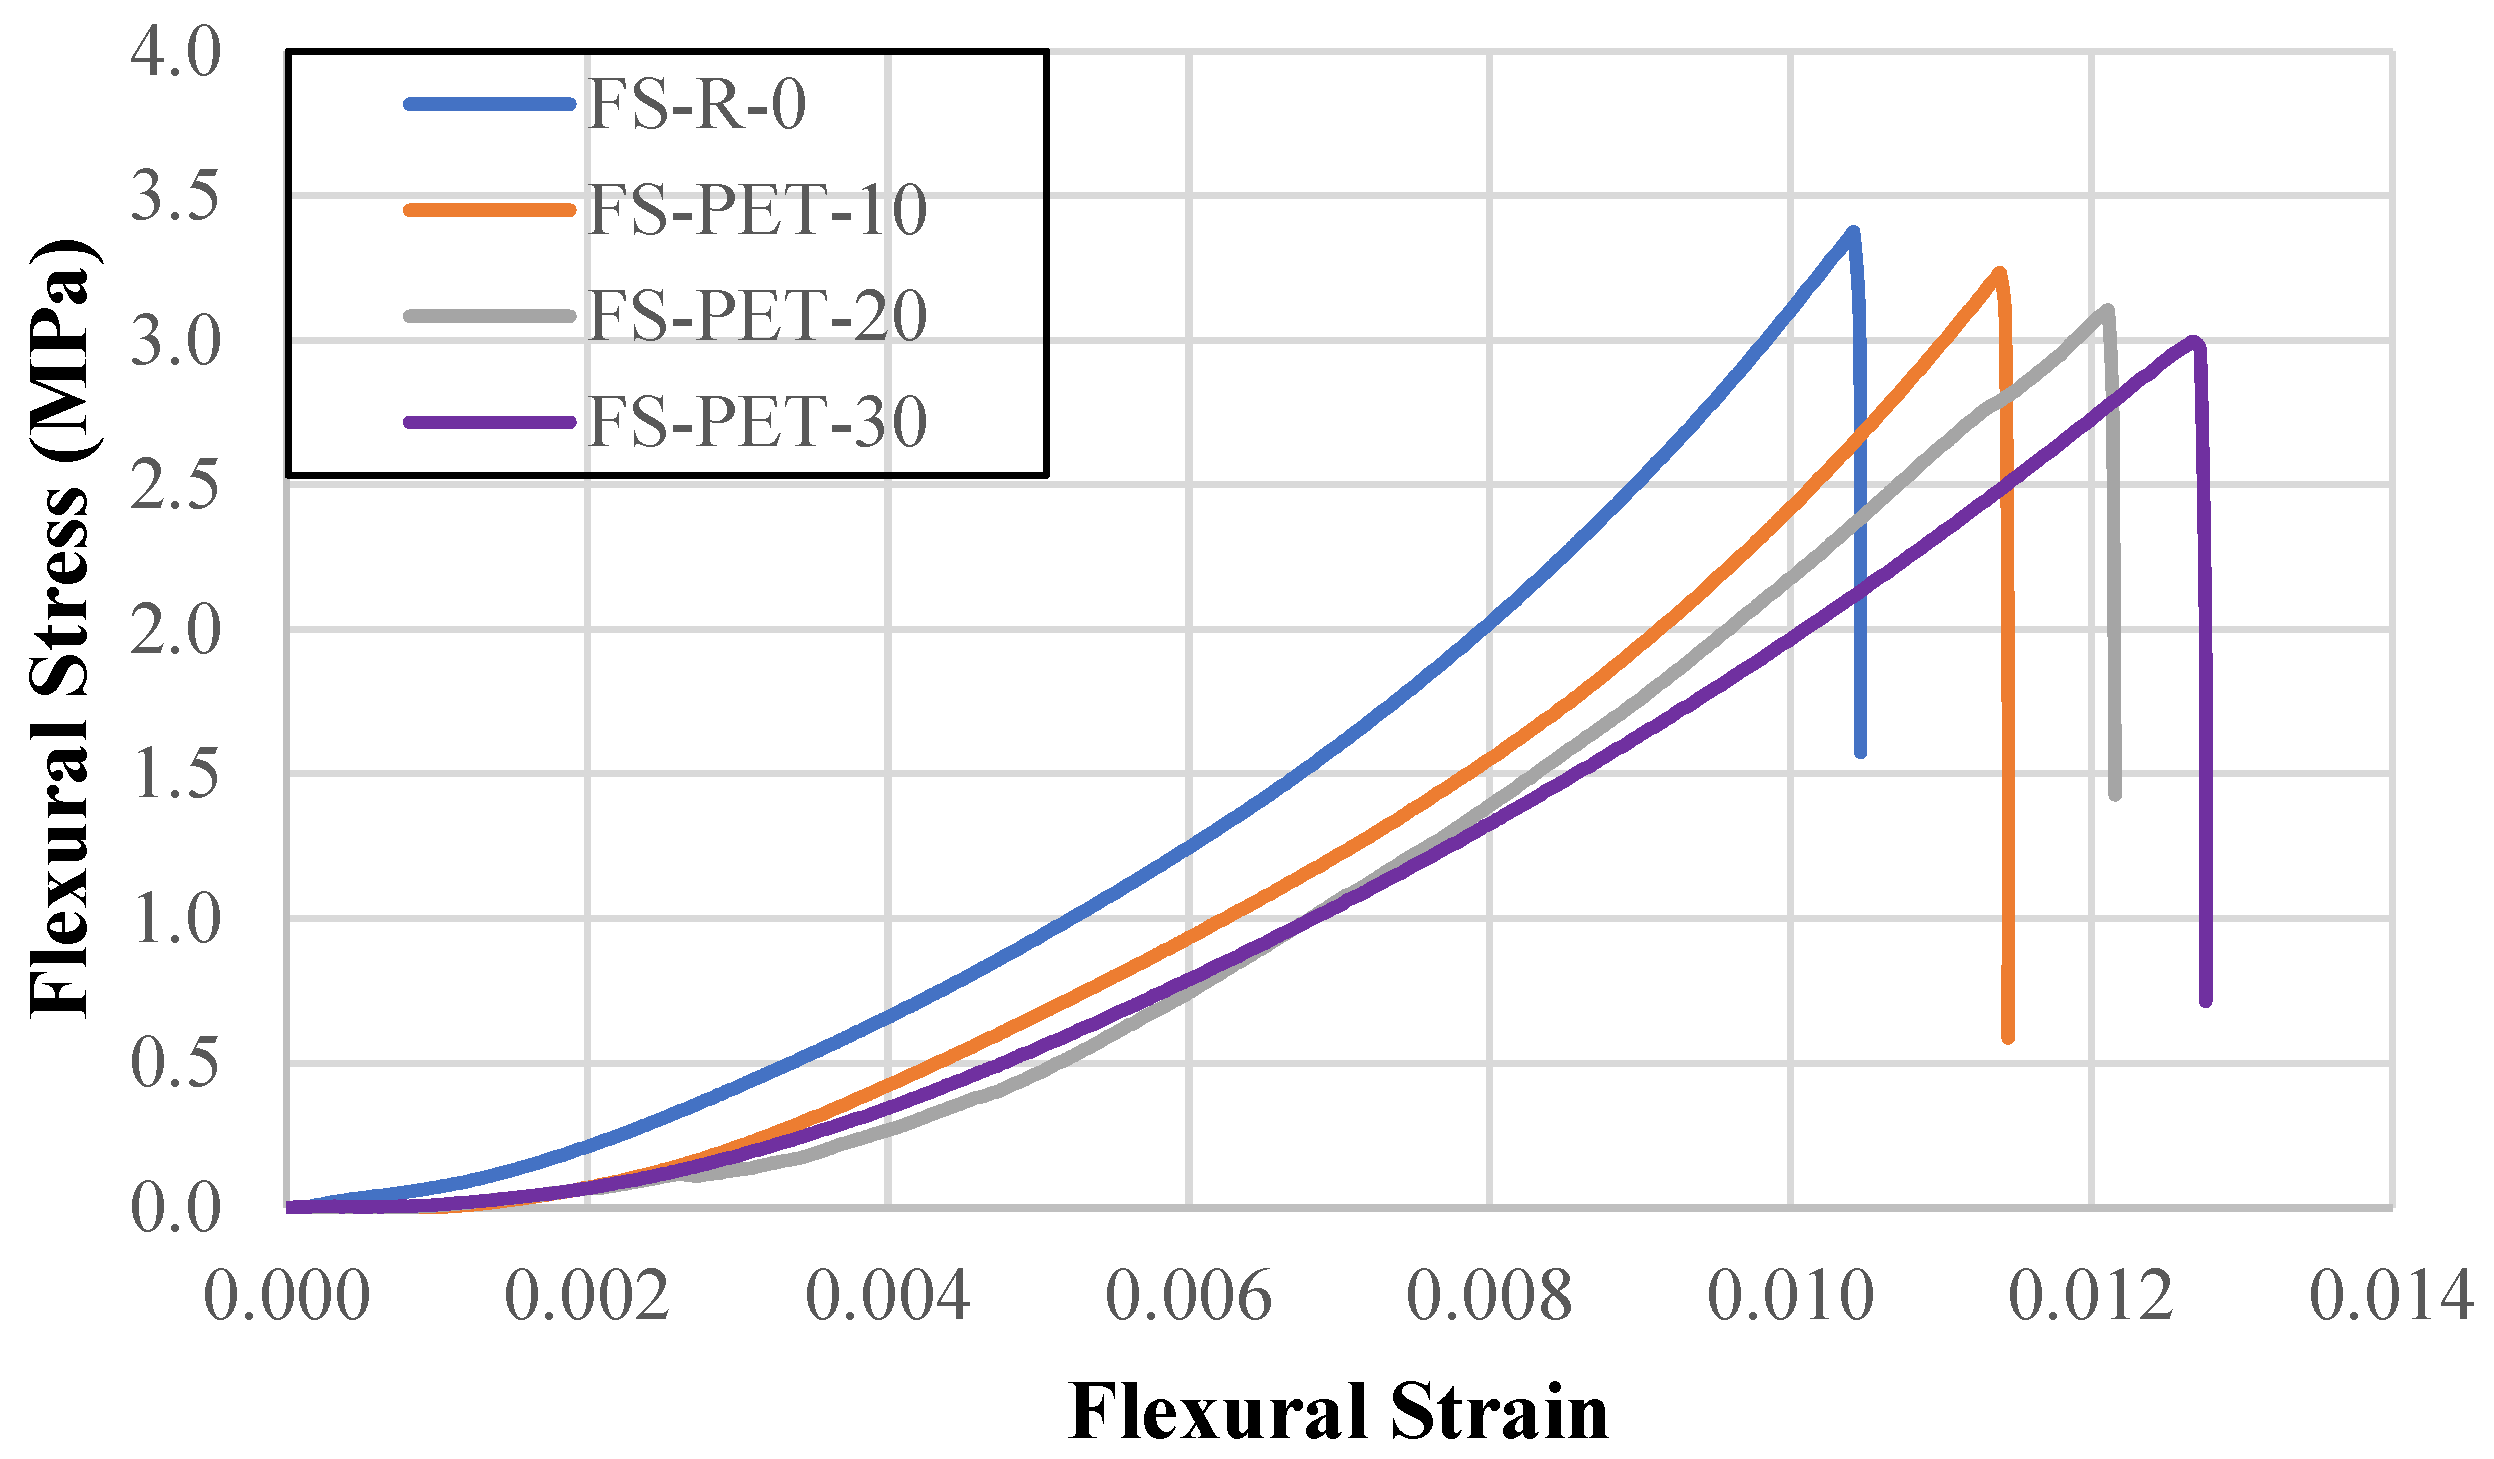
Figure 9.
Flexural stress–flexural strain graph of samples without FRP.
Figure 9.
Flexural stress–flexural strain graph of samples without FRP.
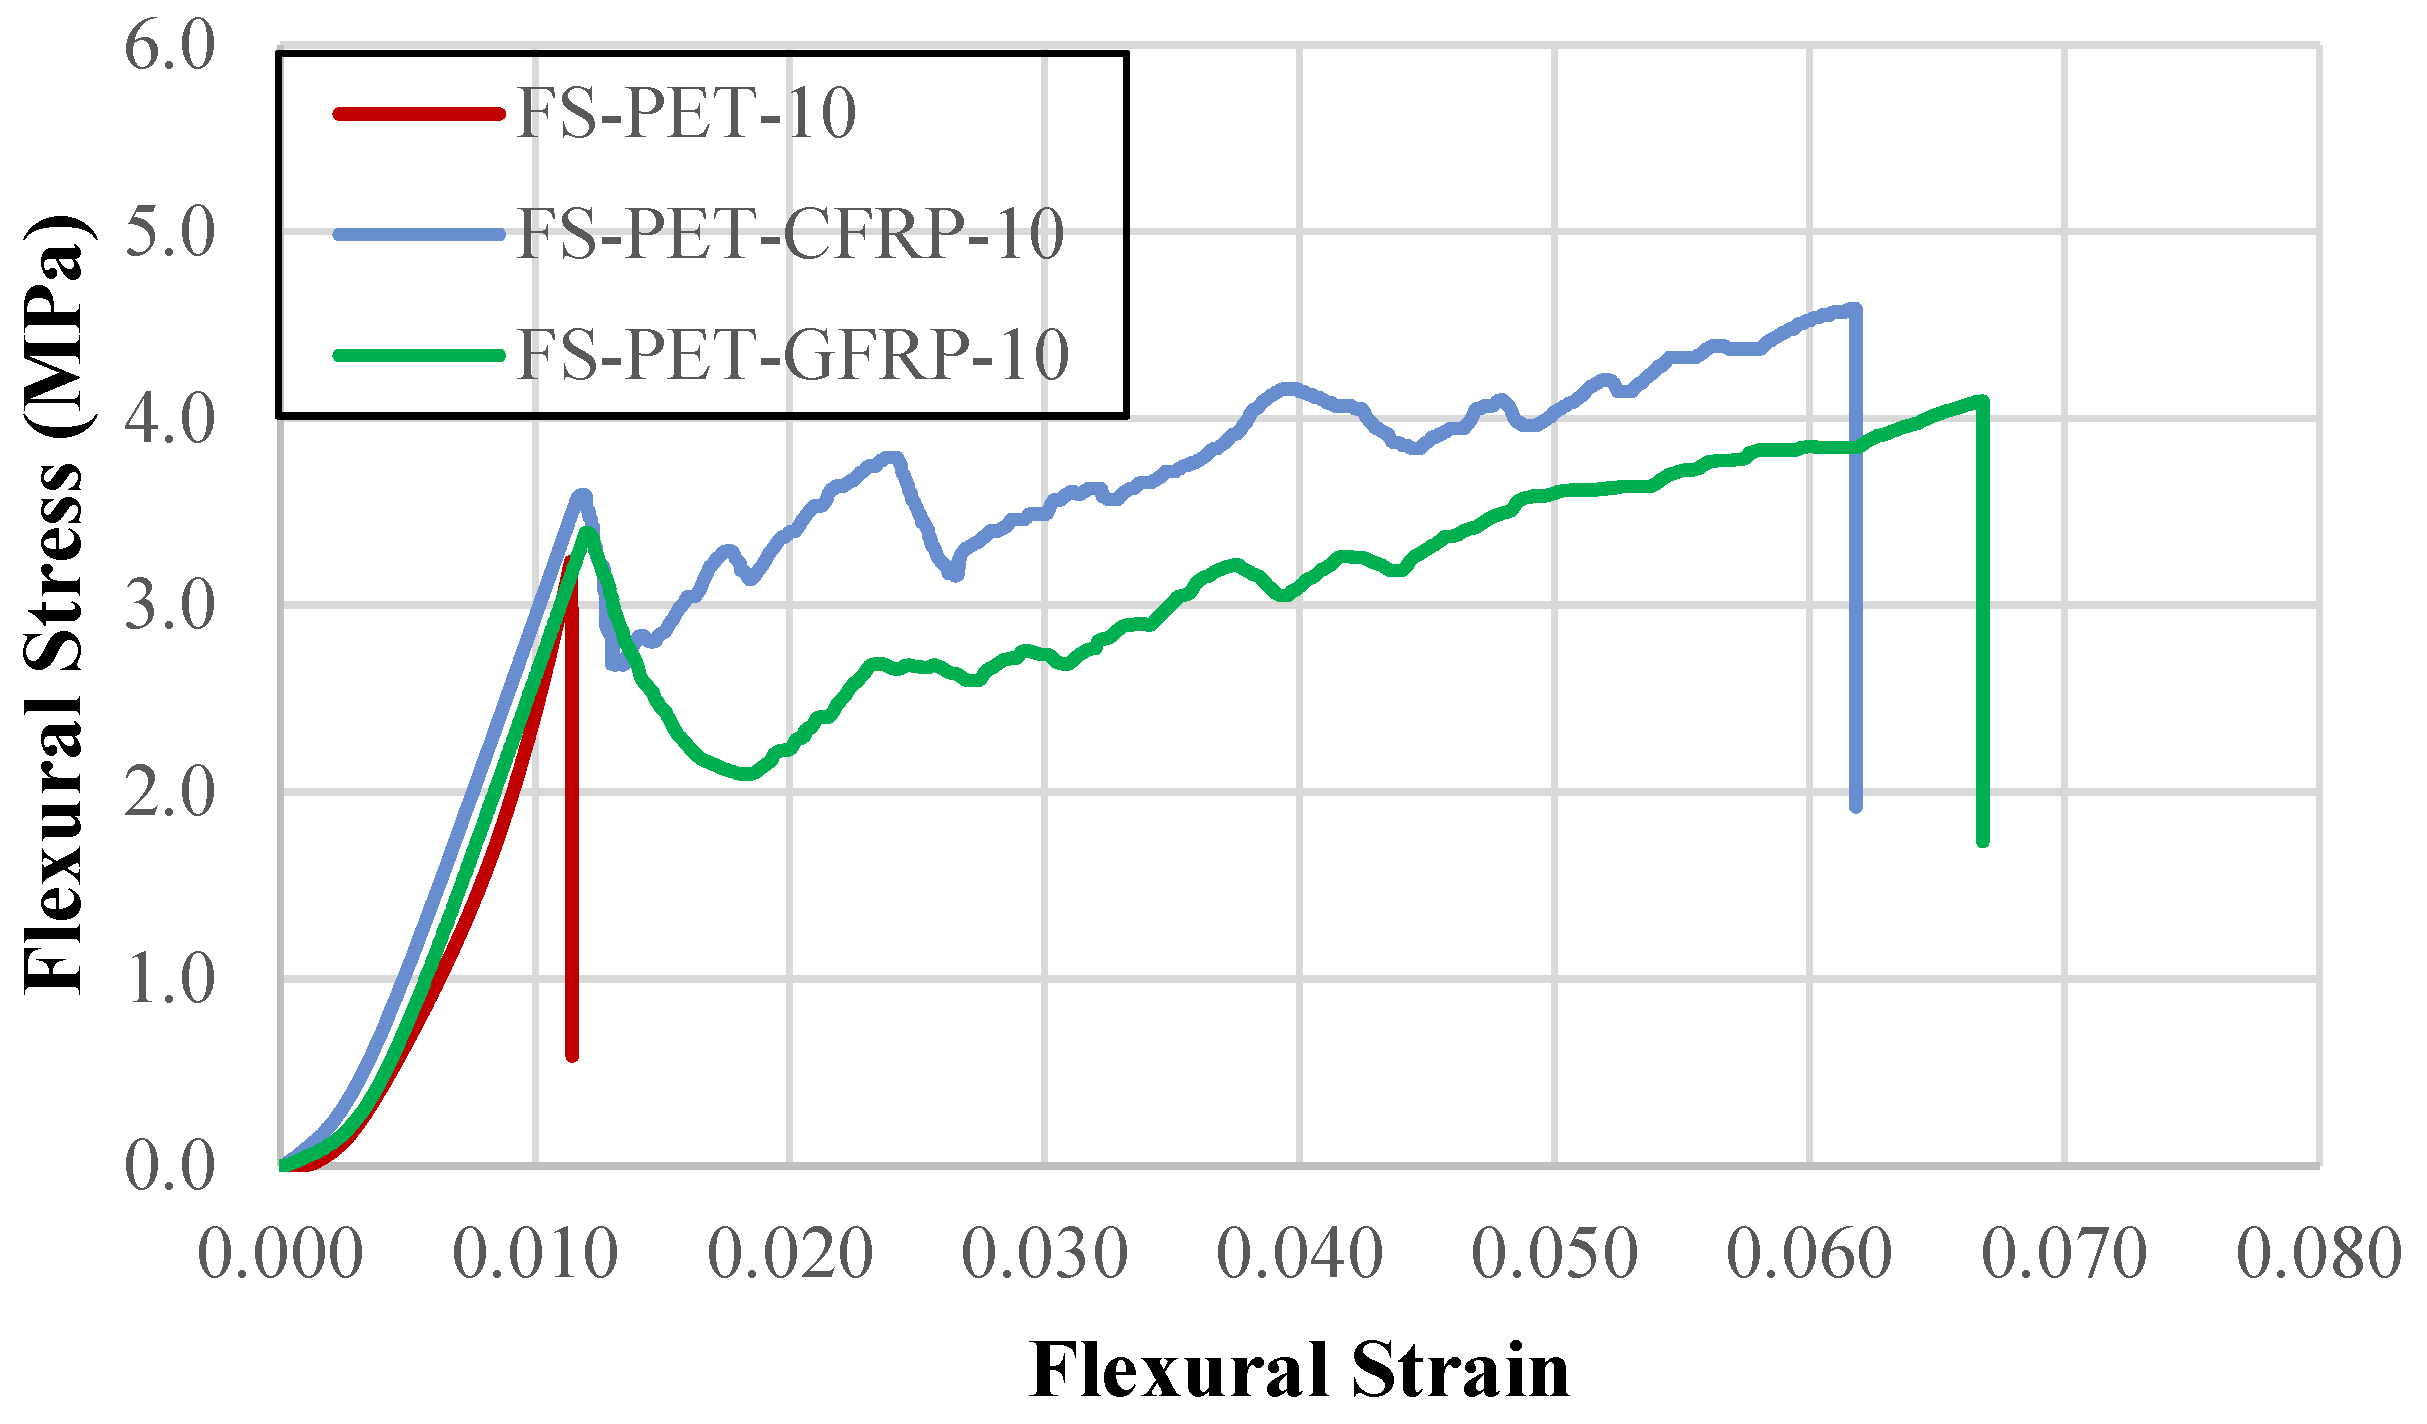
Figure 10.
Flexural stress–flexural strain graphs of samples with FRP.
Figure 10.
Flexural stress–flexural strain graphs of samples with FRP.
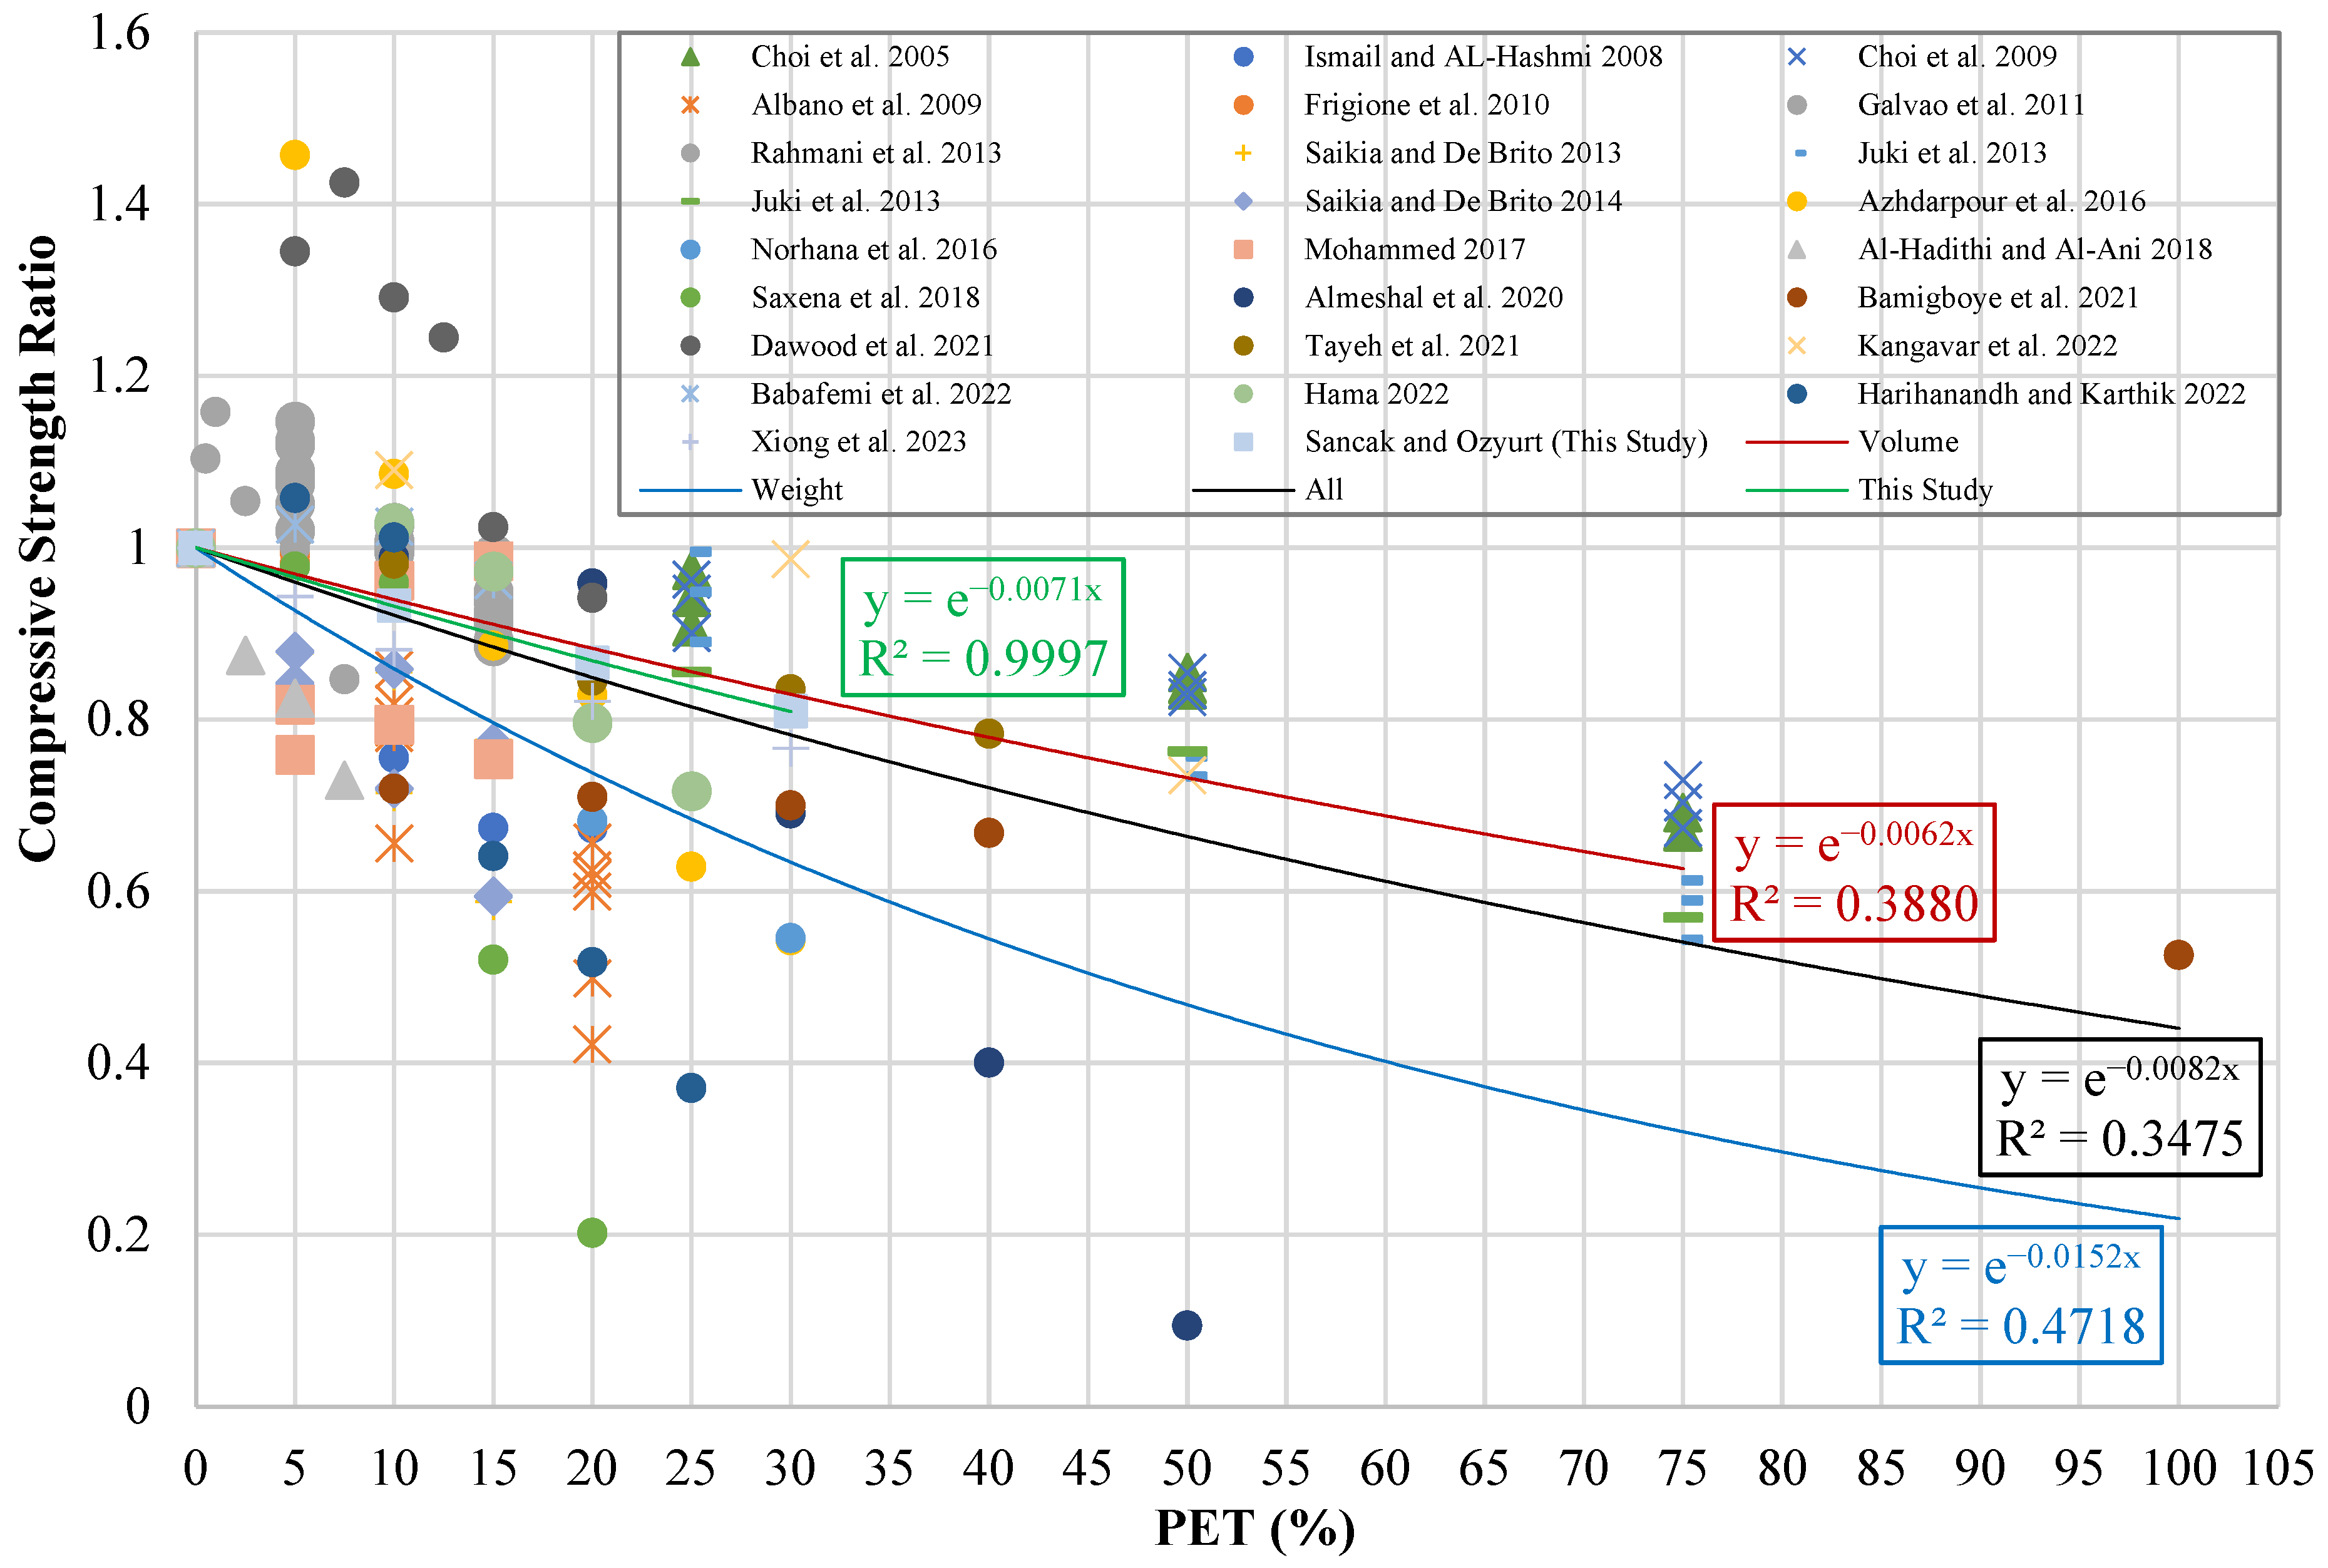
Figure 11.
Compressive strength ratio–PET (%) graph [
11,
12,
13,
14,
15,
16,
17,
18,
19,
20,
21,
22,
23,
24,
25,
26,
27,
28,
29,
30,
31,
32,
33,
34,
35].
Figure 11.
Compressive strength ratio–PET (%) graph [
11,
12,
13,
14,
15,
16,
17,
18,
19,
20,
21,
22,
23,
24,
25,
26,
27,
28,
29,
30,
31,
32,
33,
34,
35].
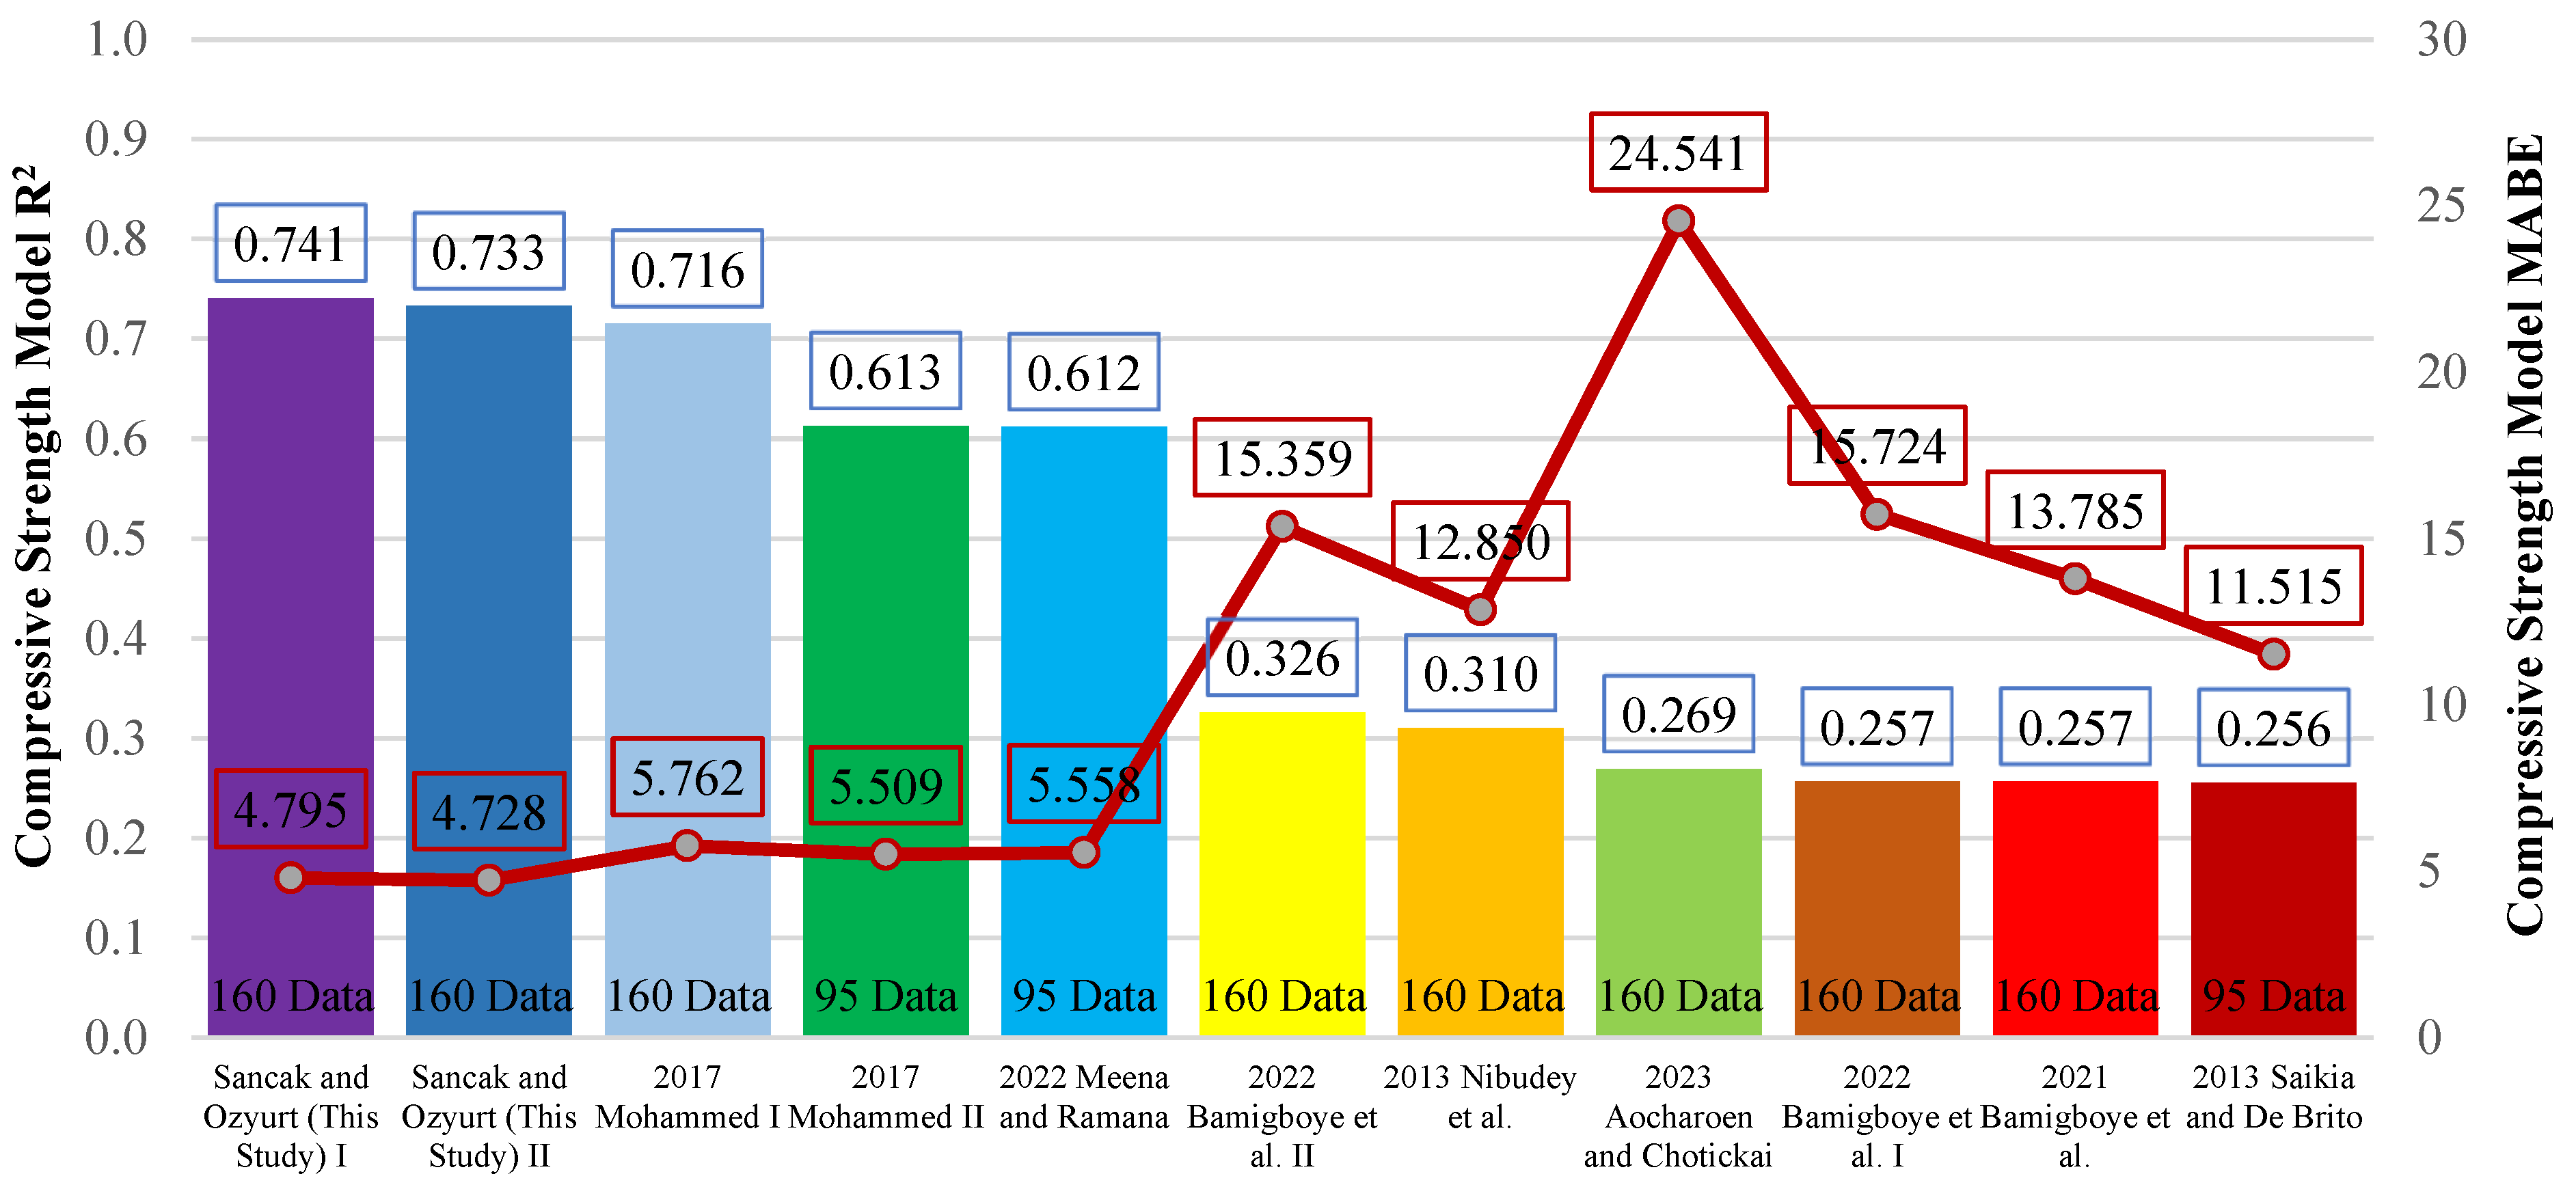
Figure 12.
Comparison of R
2 and MABE for compressive strength models [
15,
19,
32,
36,
37,
38,
39].
Figure 12.
Comparison of R
2 and MABE for compressive strength models [
15,
19,
32,
36,
37,
38,
39].
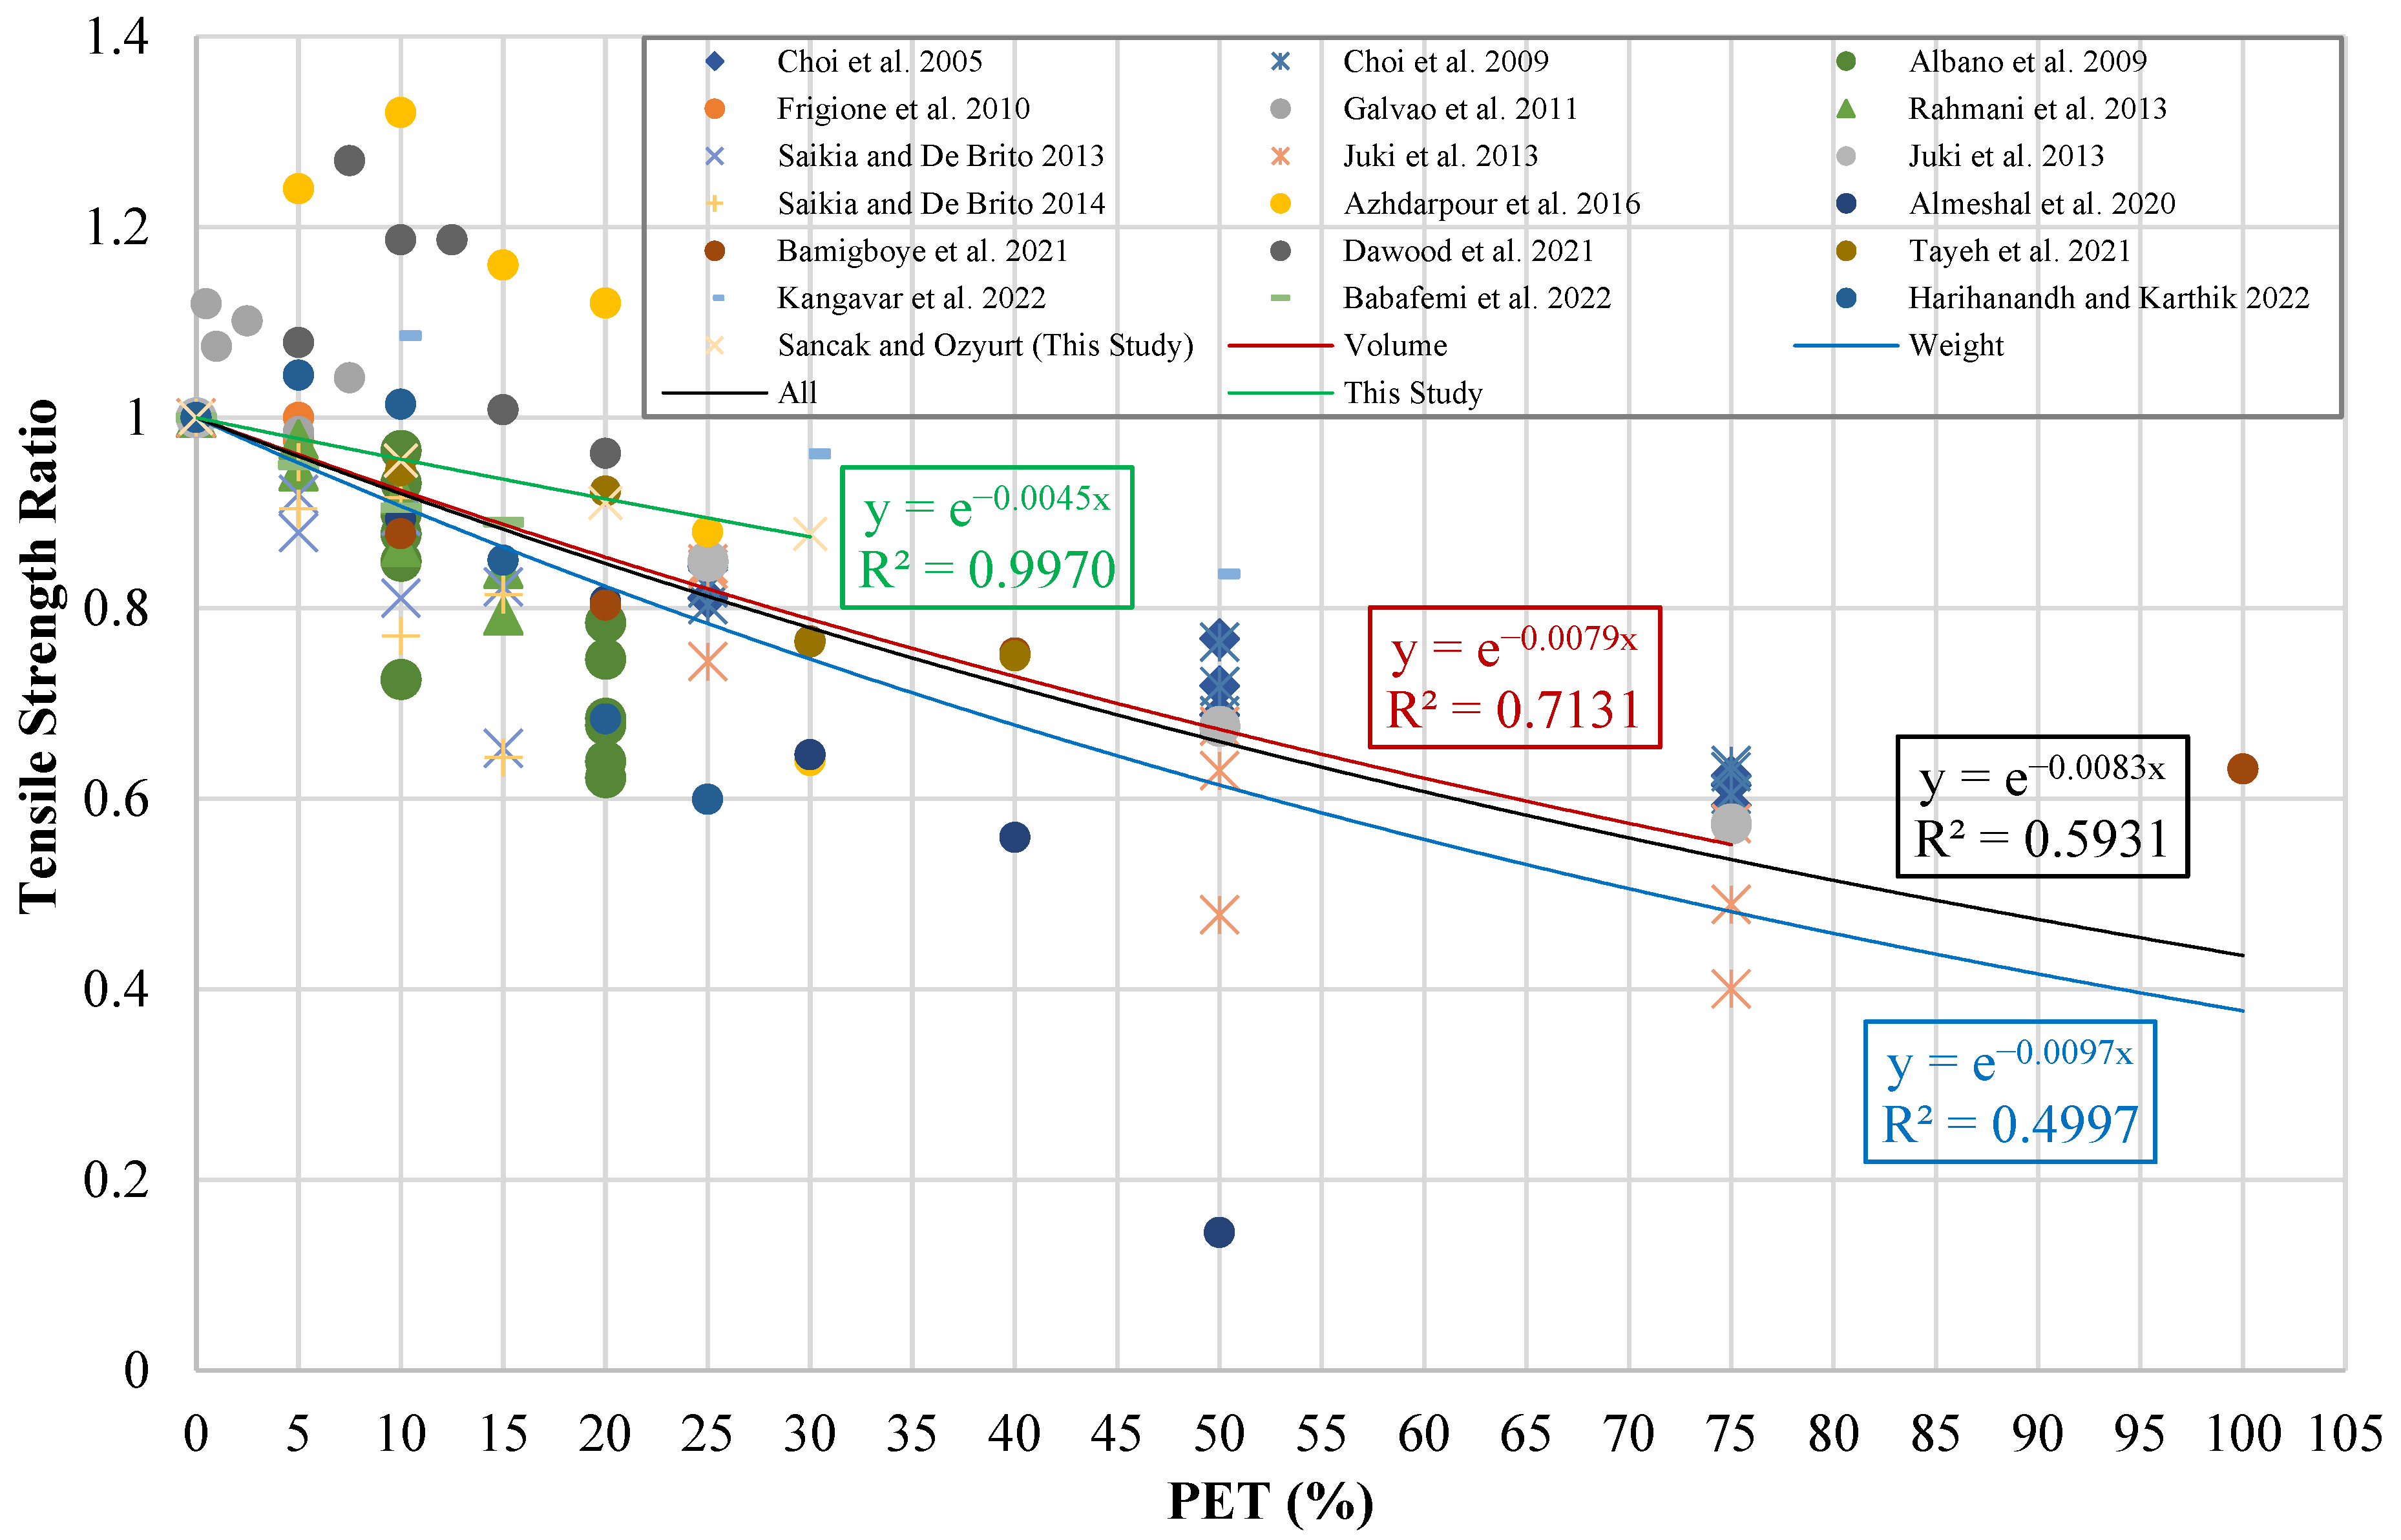
Figure 13.
Tensile strength ratio–PET (%) graph [
11,
12,
13,
14,
15,
16,
17,
18,
21,
22,
26,
27,
28,
31,
32,
33,
34,
35].
Figure 13.
Tensile strength ratio–PET (%) graph [
11,
12,
13,
14,
15,
16,
17,
18,
21,
22,
26,
27,
28,
31,
32,
33,
34,
35].
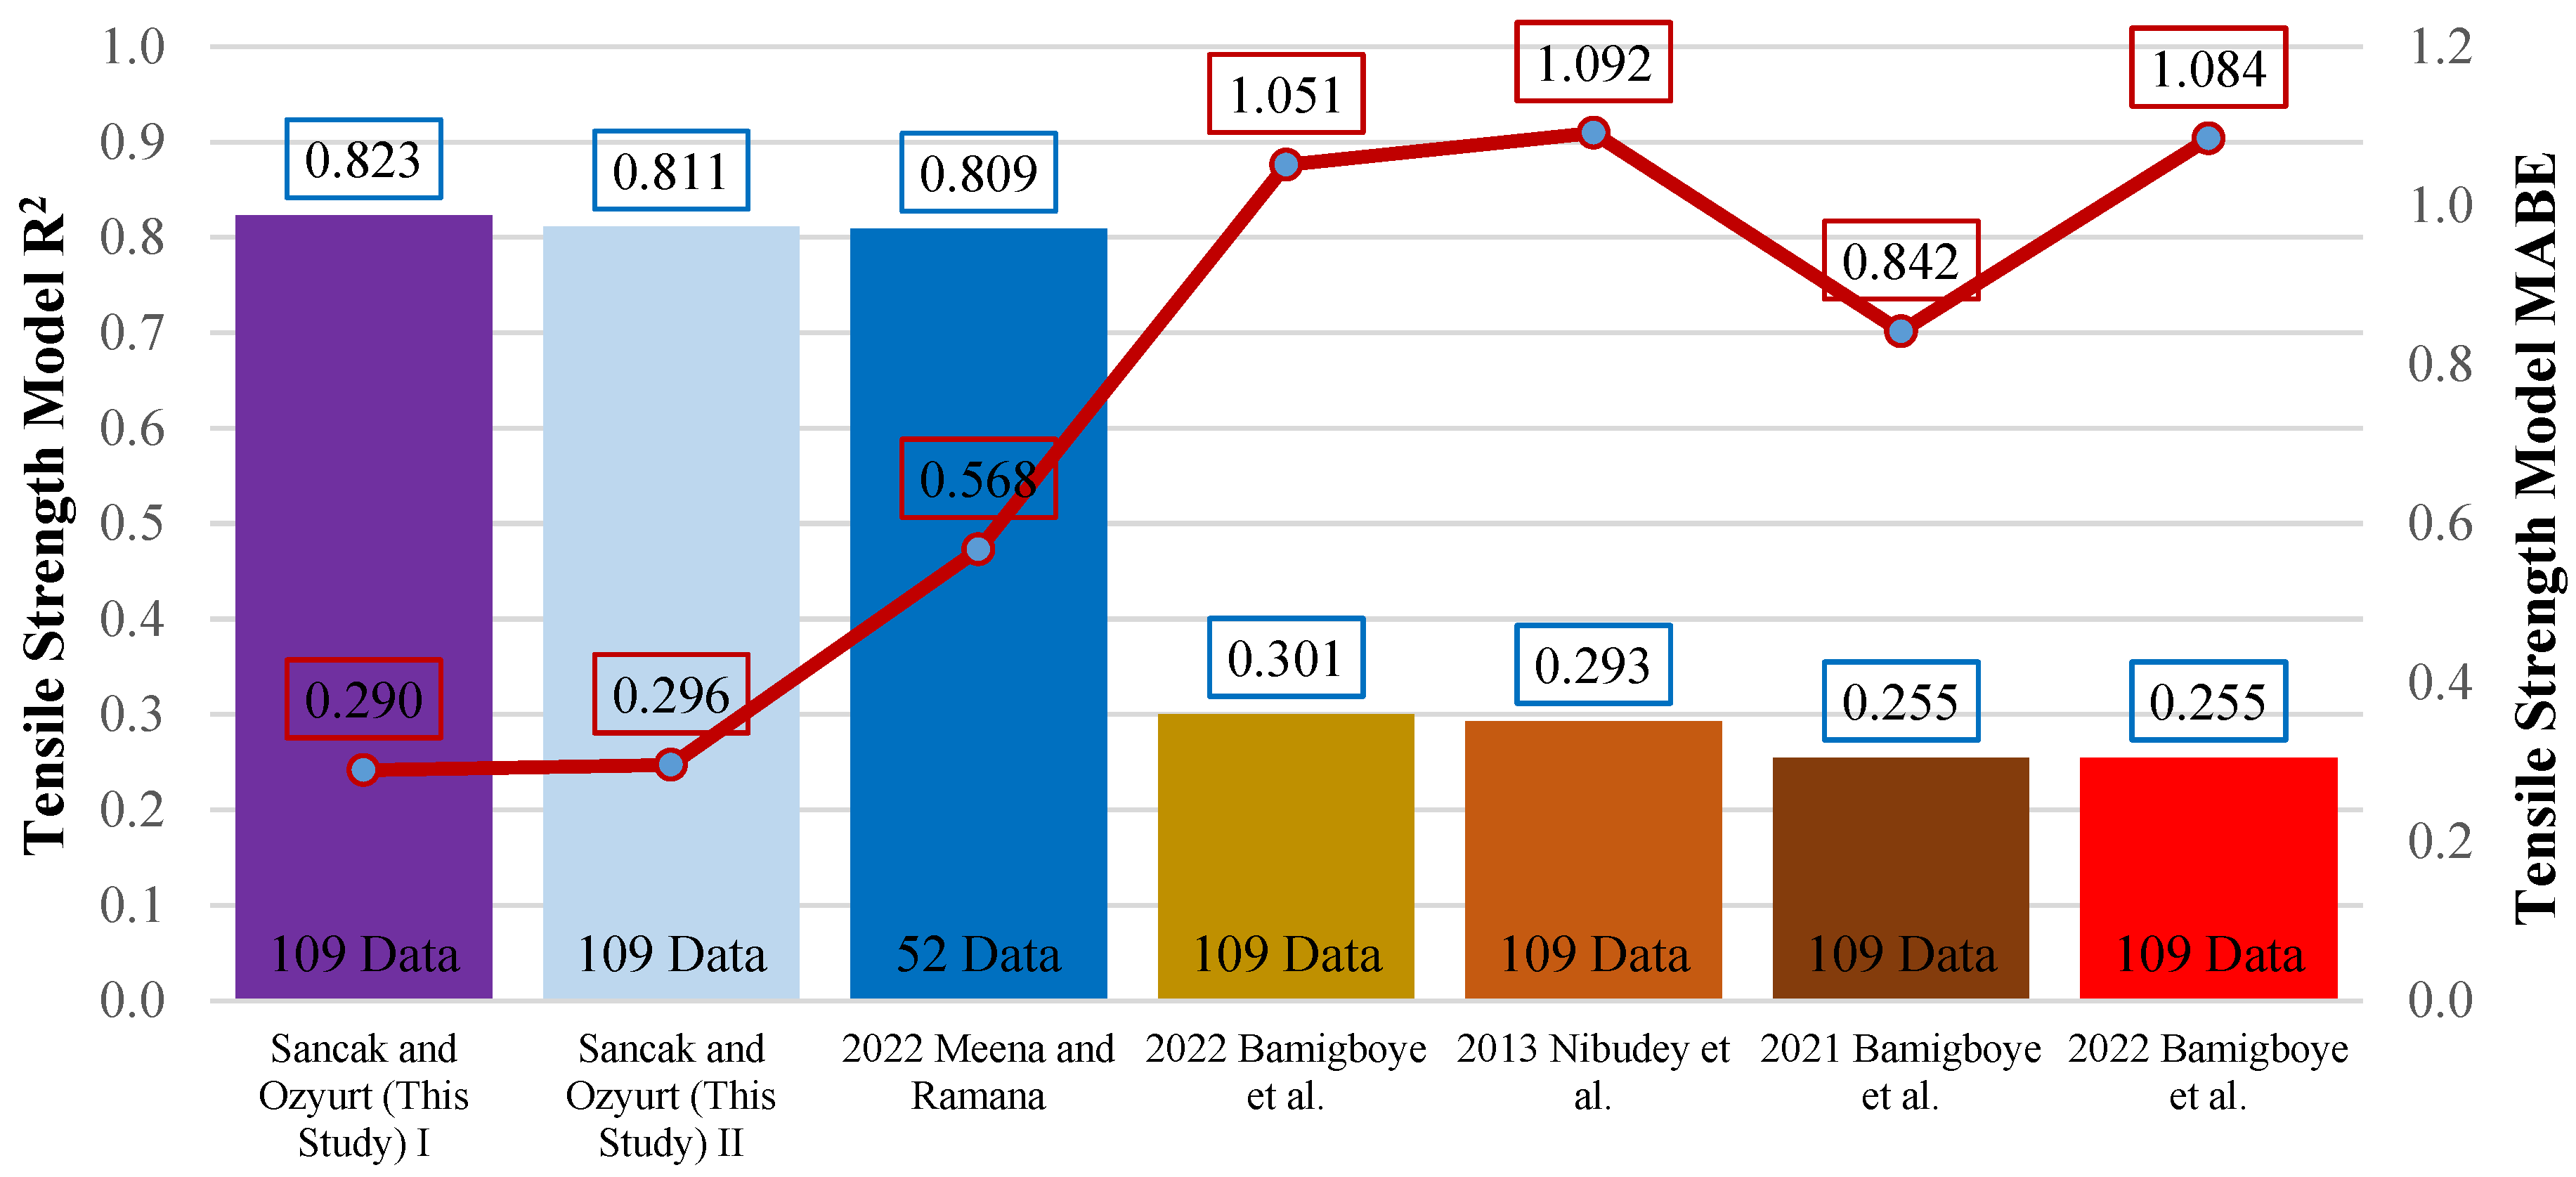
Figure 14.
Comparison of R
2 and MABE for models of the connection between tensile strength and PET (%) [
32,
36,
37,
38].
Figure 14.
Comparison of R
2 and MABE for models of the connection between tensile strength and PET (%) [
32,
36,
37,
38].
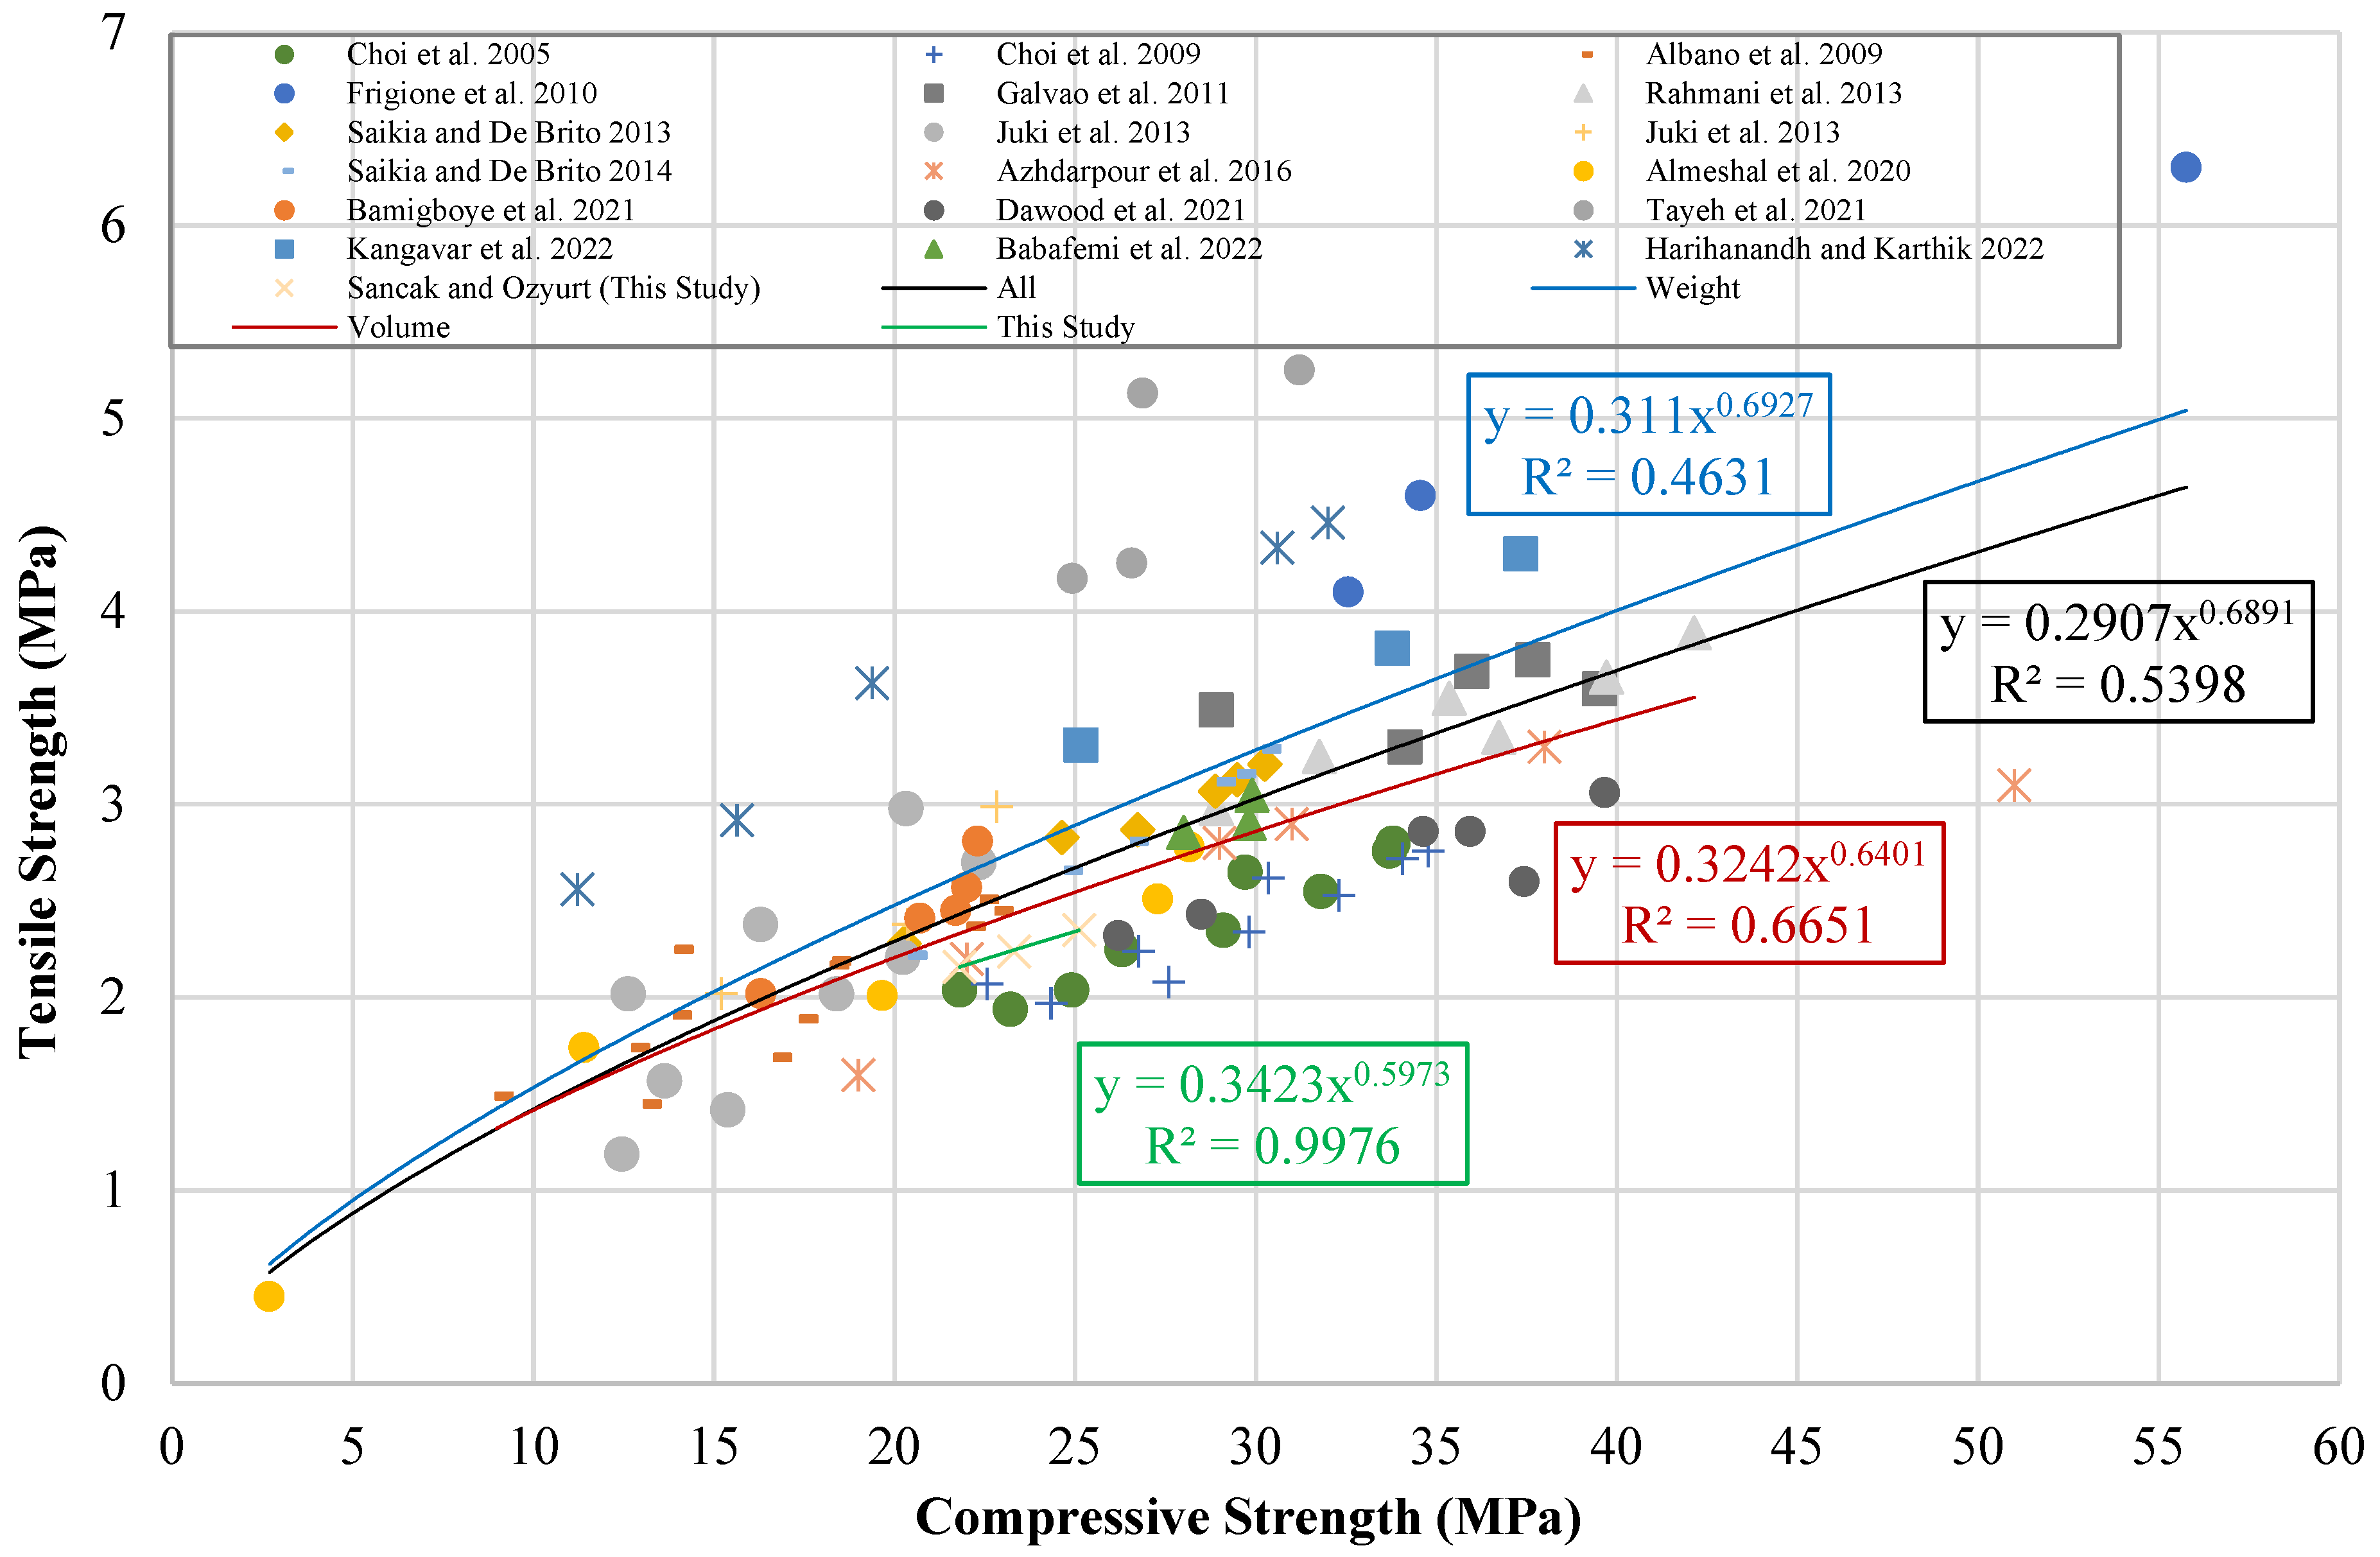
Figure 15.
Tensile strength–compressive strength graph [
11,
12,
13,
14,
15,
16,
17,
18,
21,
22,
26,
27,
28,
31,
32,
33,
34,
35].
Figure 15.
Tensile strength–compressive strength graph [
11,
12,
13,
14,
15,
16,
17,
18,
21,
22,
26,
27,
28,
31,
32,
33,
34,
35].
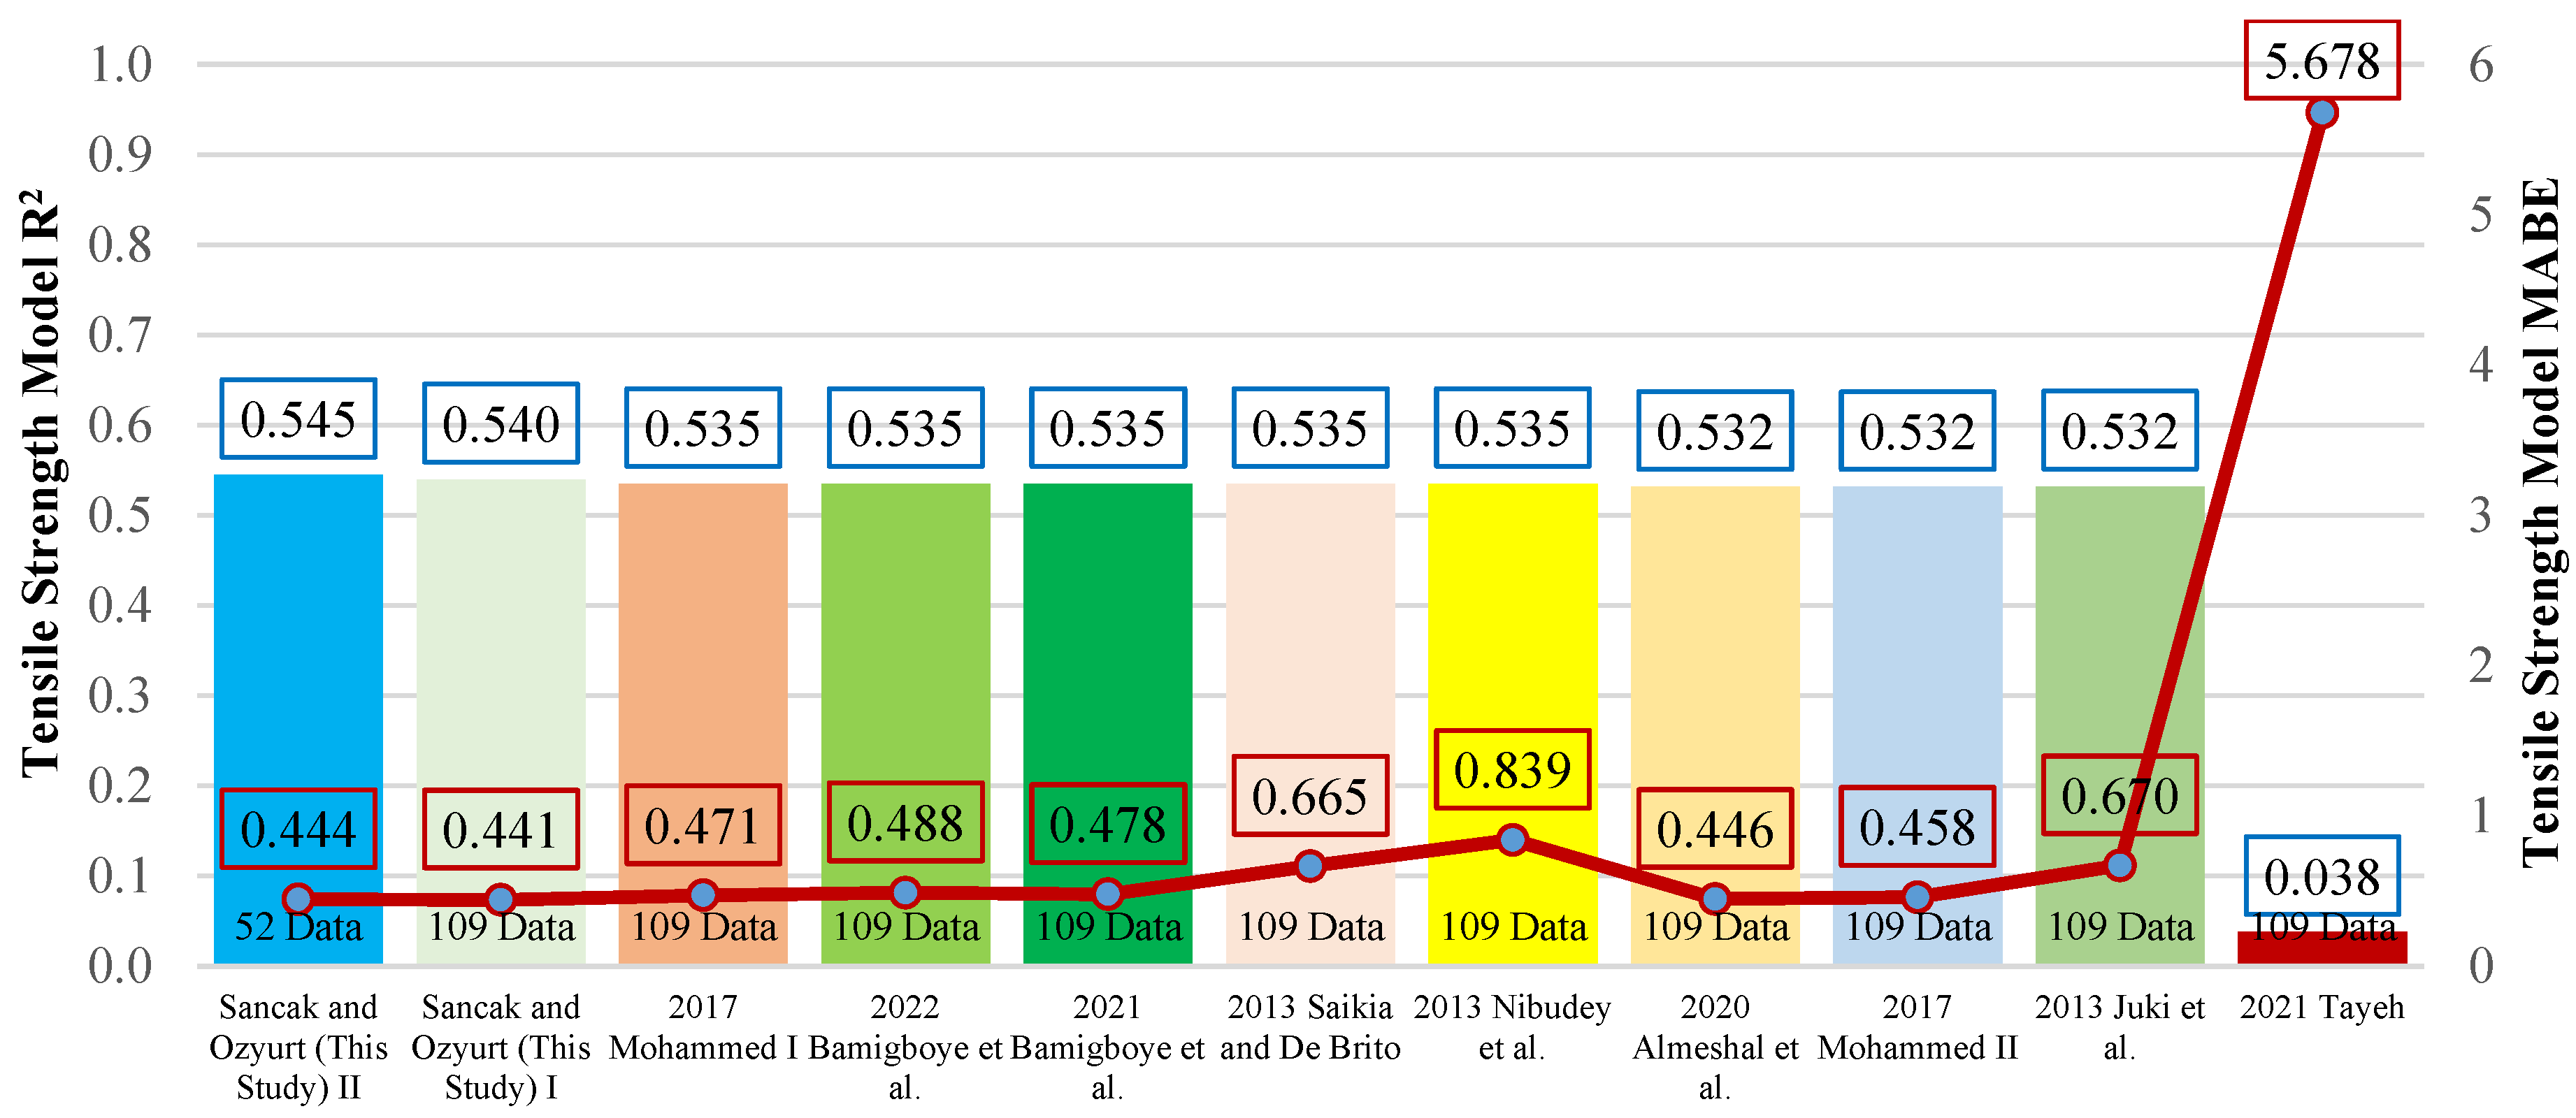
Figure 16.
Comparison of R
2 and MABE for models of the connection between tensile strength and compressive strength [
15,
17,
31,
32,
34,
36,
37,
40].
Figure 16.
Comparison of R
2 and MABE for models of the connection between tensile strength and compressive strength [
15,
17,
31,
32,
34,
36,
37,
40].
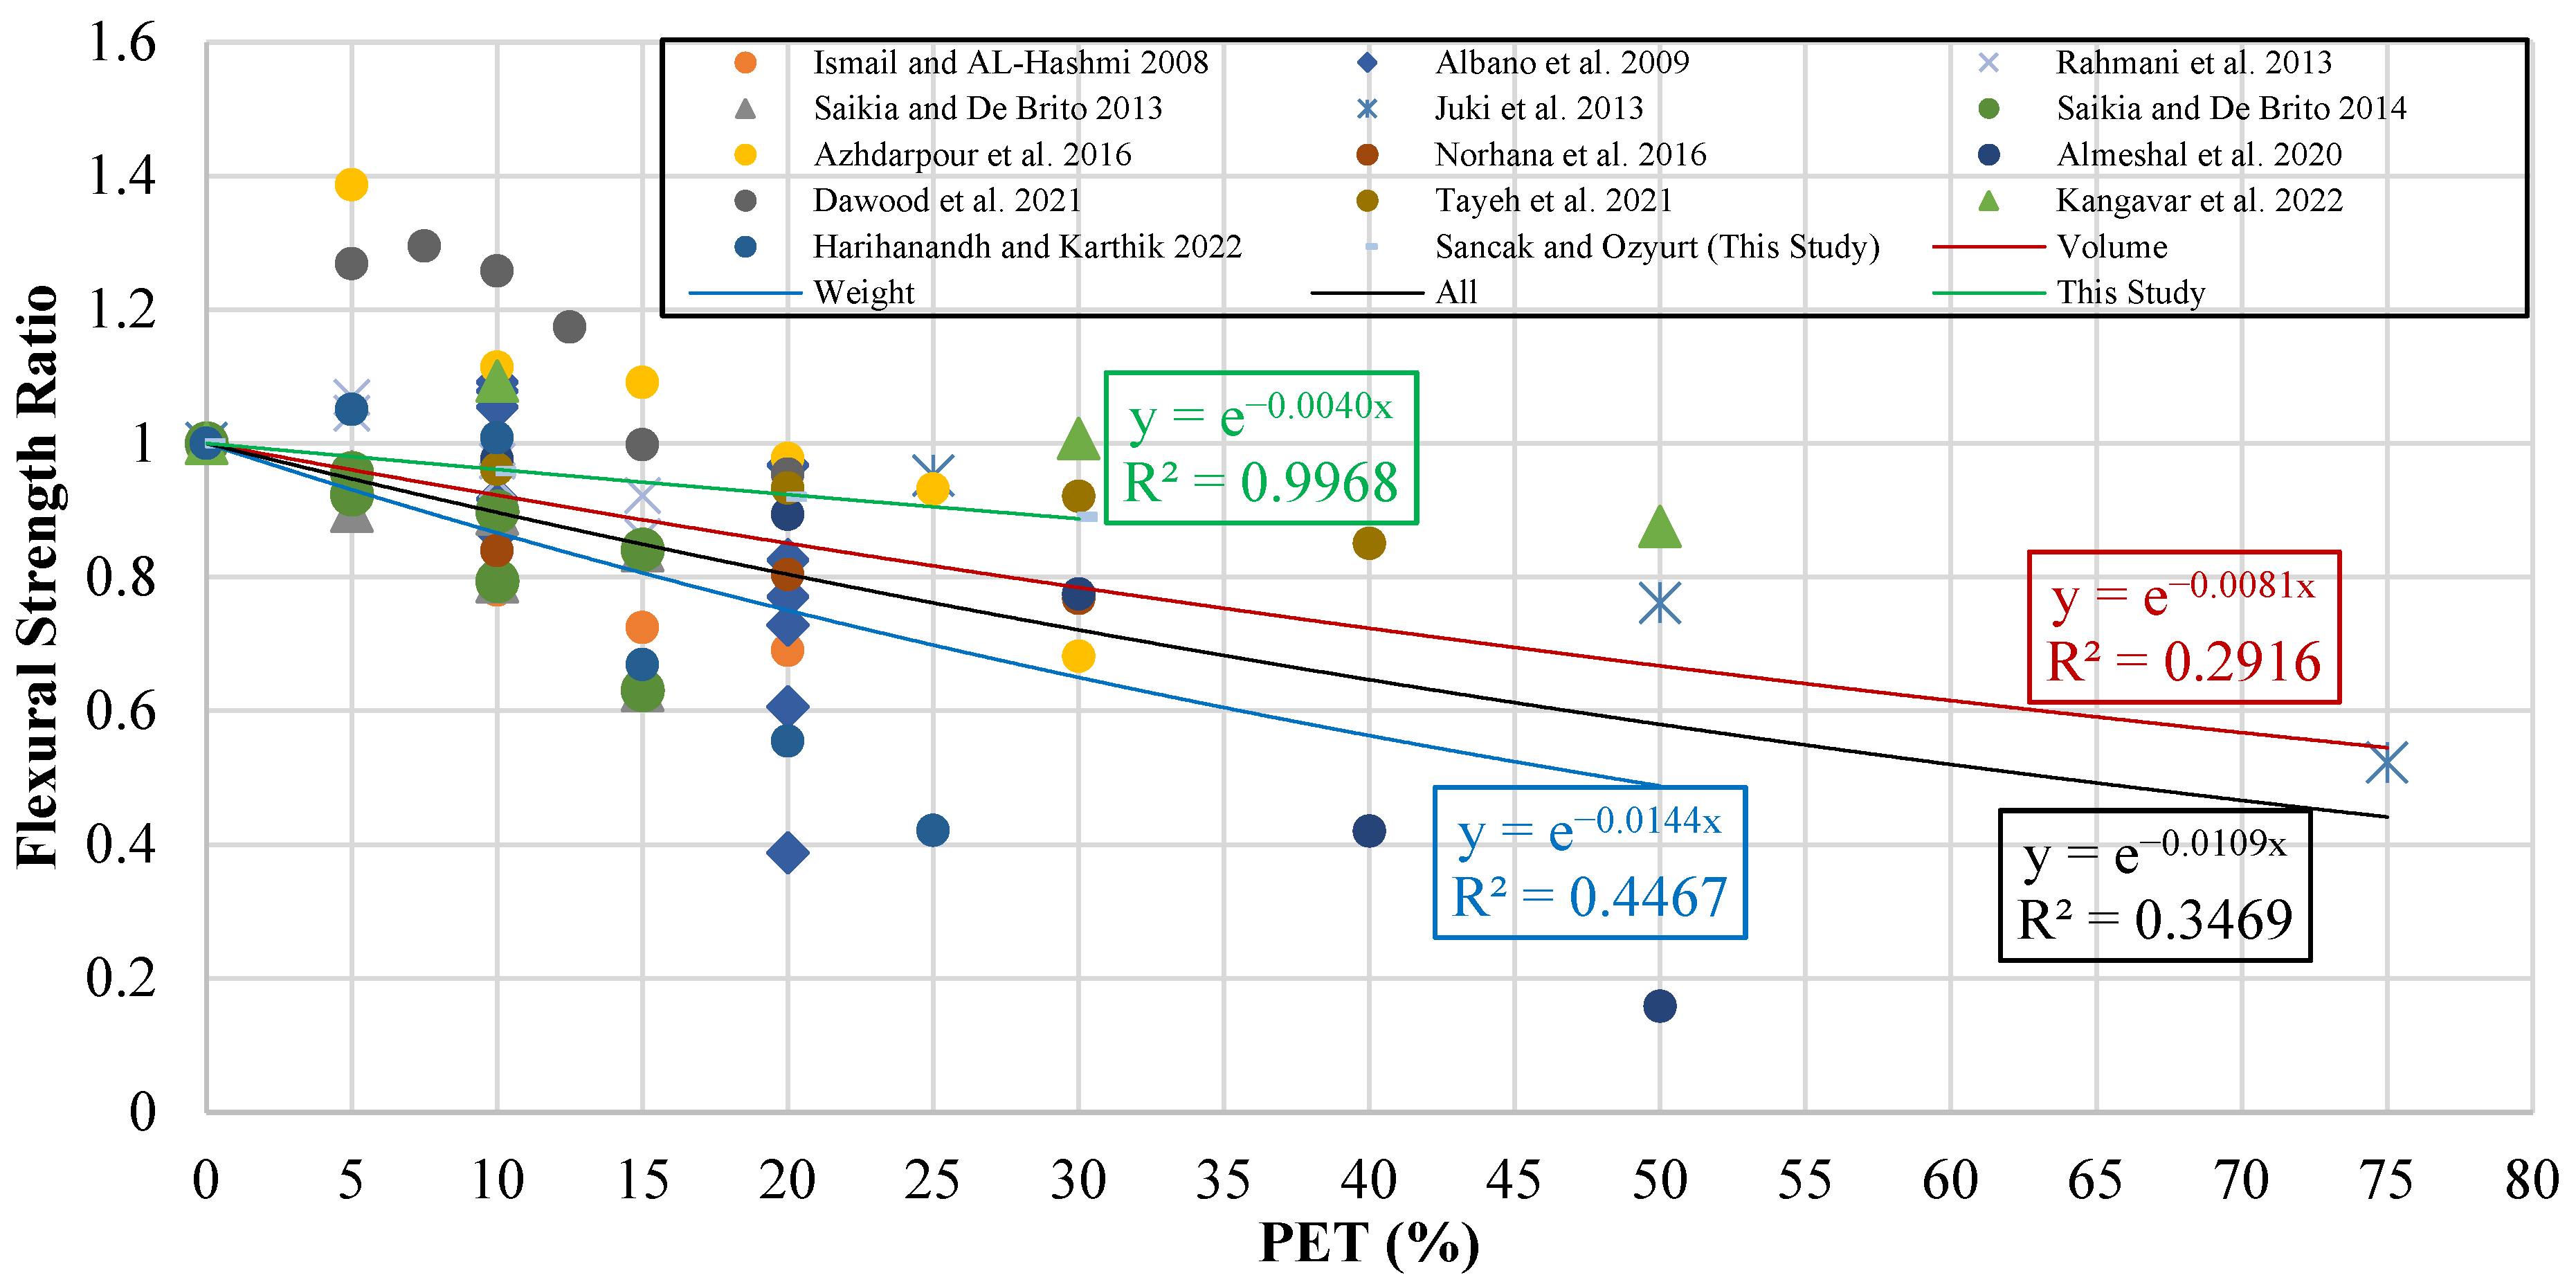
Figure 17.
Flexural strength ratio–PET (%) graph [
13,
14,
15,
17,
18,
21,
25,
28,
29,
31,
33,
34,
35].
Figure 17.
Flexural strength ratio–PET (%) graph [
13,
14,
15,
17,
18,
21,
25,
28,
29,
31,
33,
34,
35].
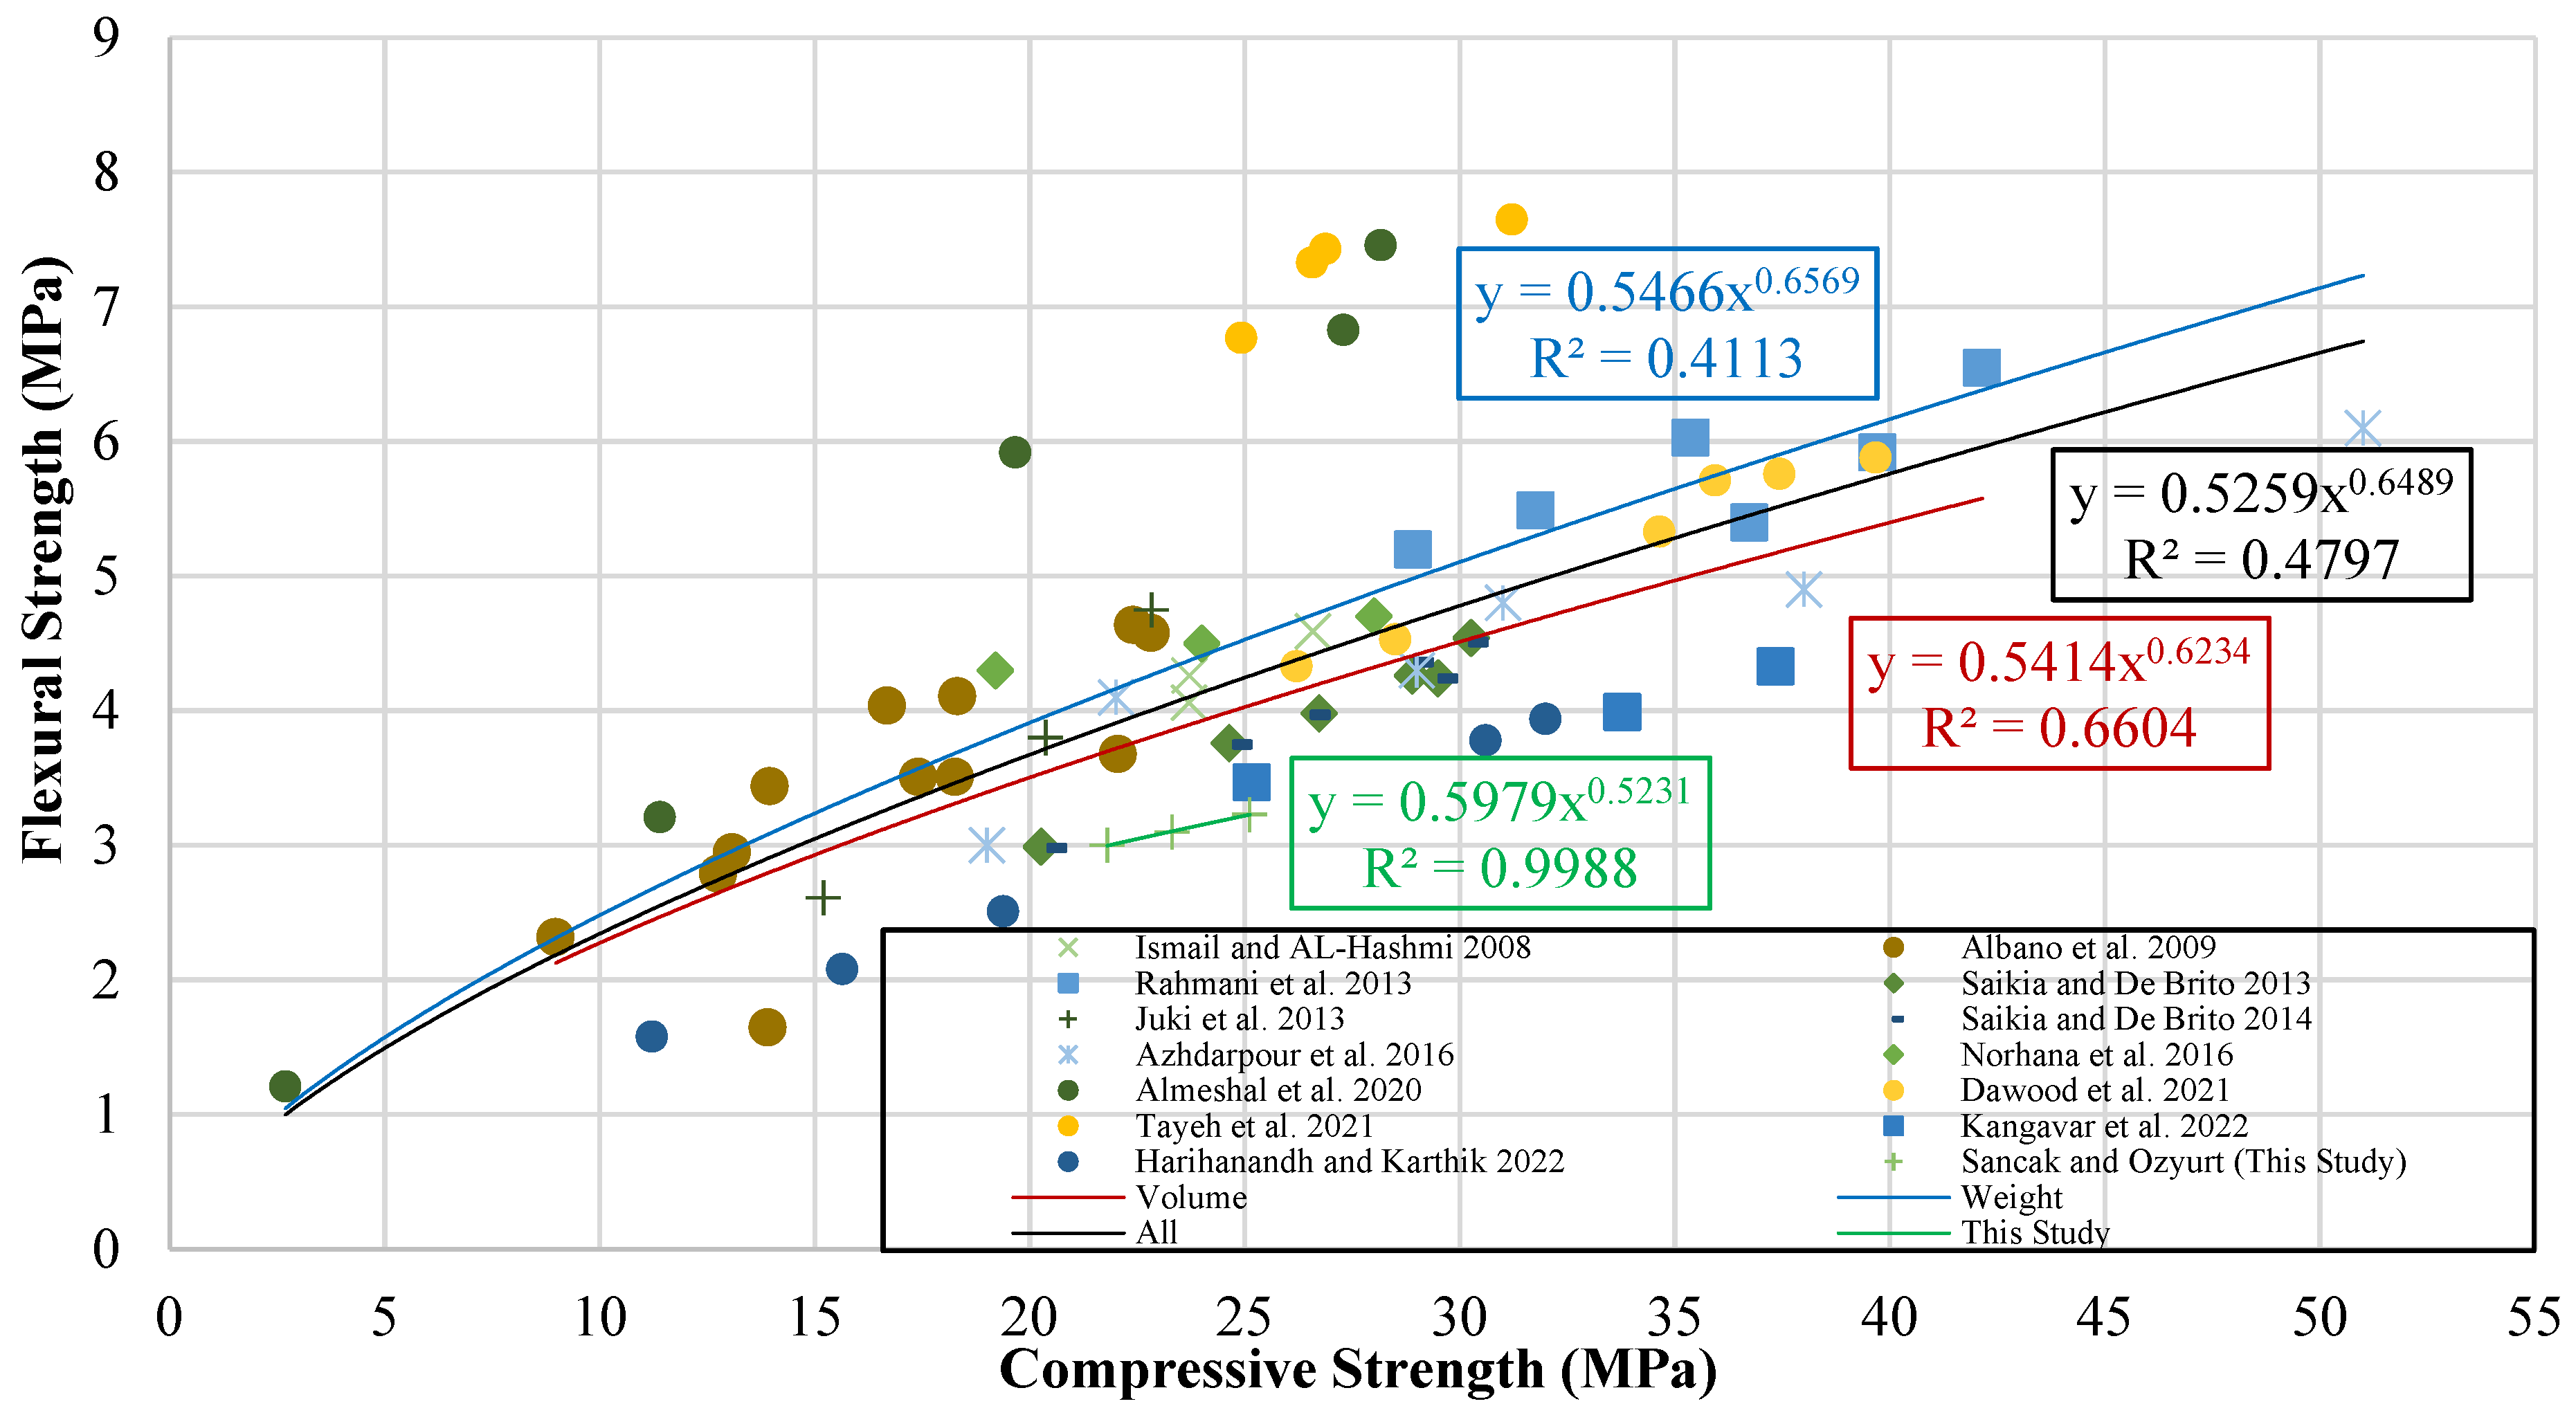
Figure 18.
Flexural strength–compressive strength graph [
13,
14,
15,
17,
18,
21,
25,
28,
29,
31,
33,
34,
35].
Figure 18.
Flexural strength–compressive strength graph [
13,
14,
15,
17,
18,
21,
25,
28,
29,
31,
33,
34,
35].
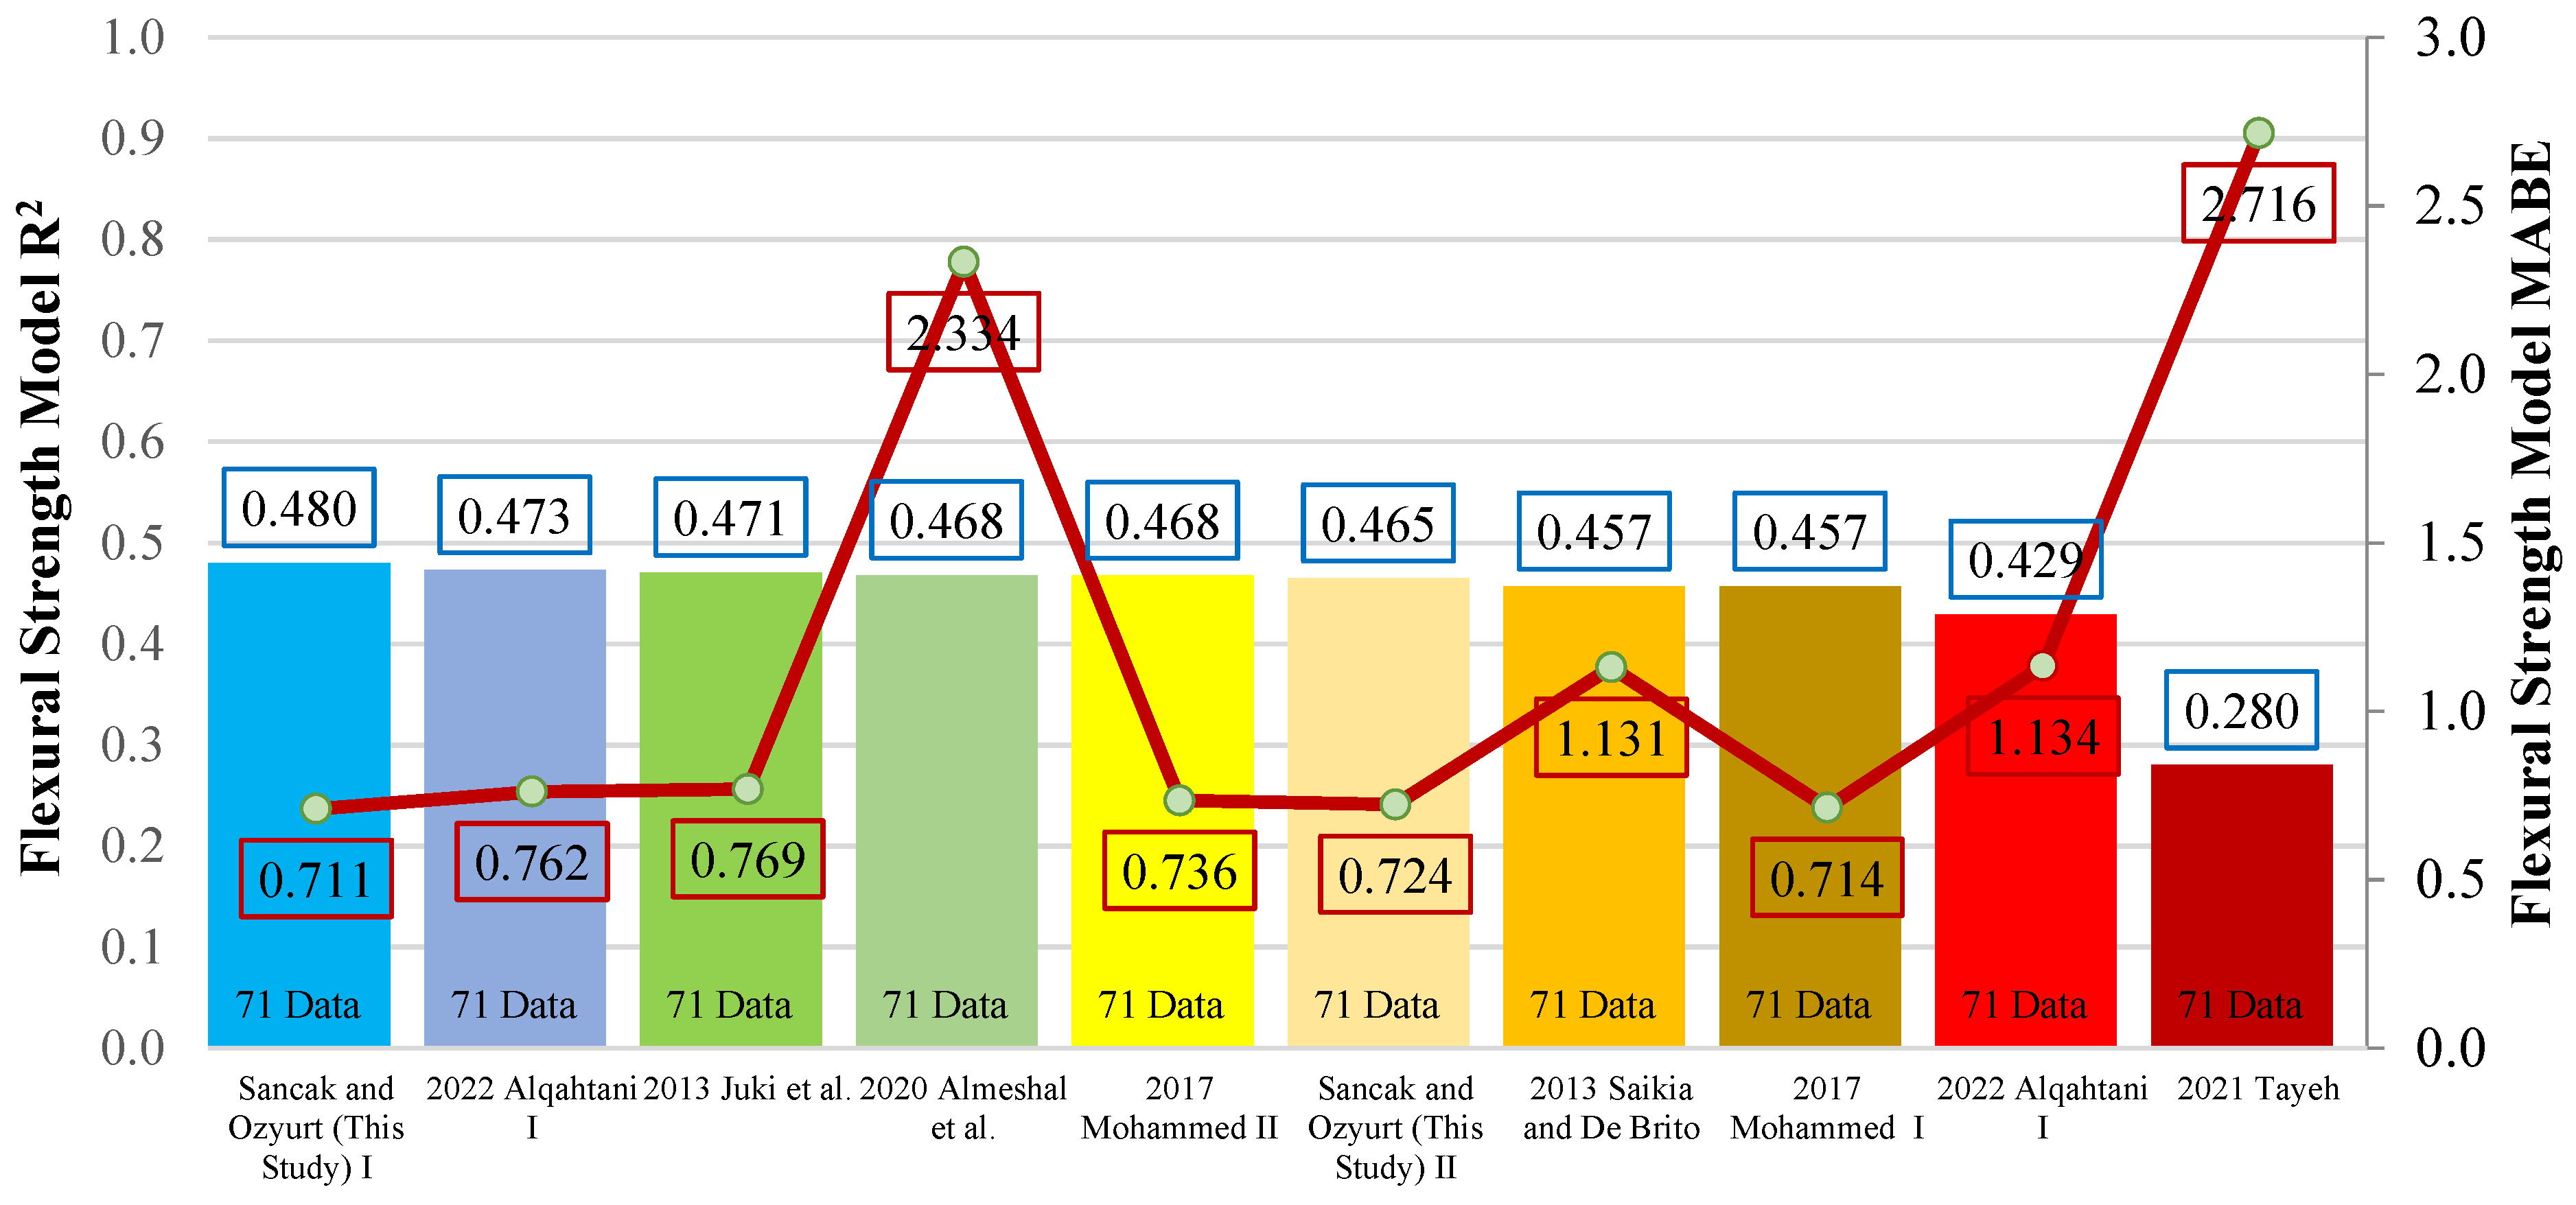
Figure 19.
Comparison of R
2 and MABE for models of the connection between flexural strength and compressive strength [
15,
17,
31,
34,
40,
41].
Figure 19.
Comparison of R
2 and MABE for models of the connection between flexural strength and compressive strength [
15,
17,
31,
34,
40,
41].
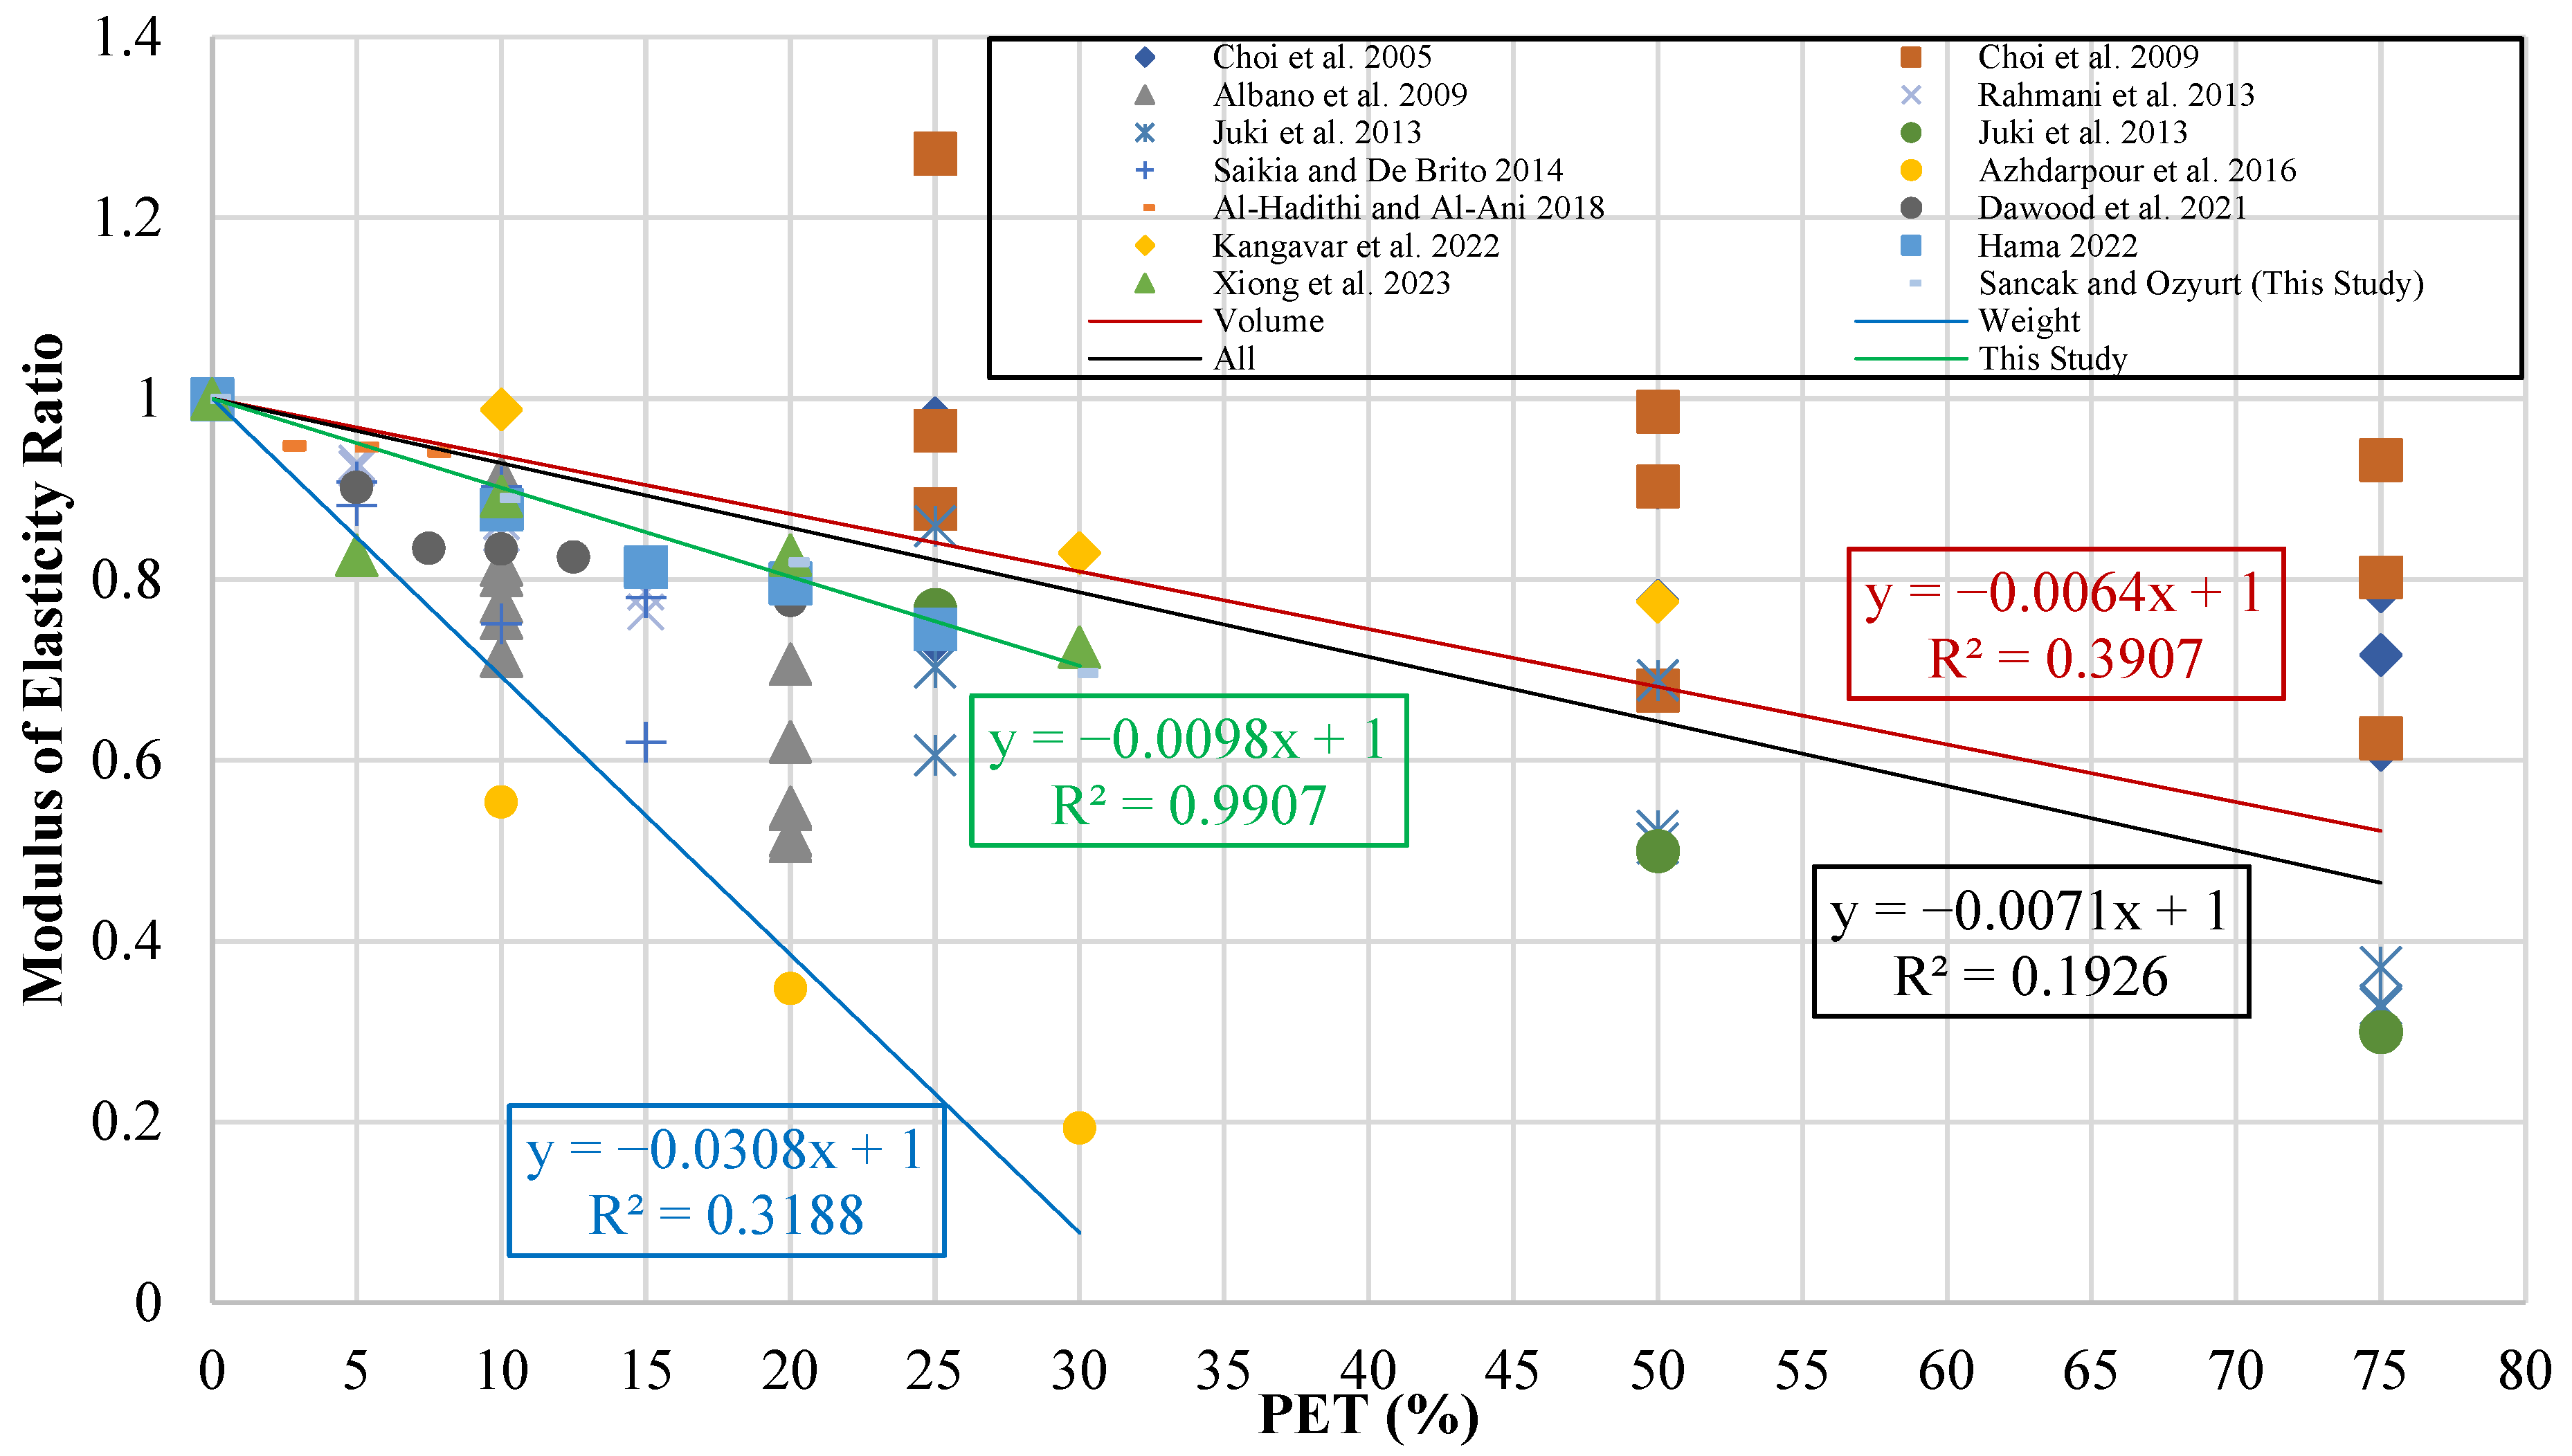
Figure 20.
Modulus of elasticity ratio–PET (%) graph [
11,
12,
13,
14,
16,
17,
18,
20,
21,
23,
24,
28,
33].
Figure 20.
Modulus of elasticity ratio–PET (%) graph [
11,
12,
13,
14,
16,
17,
18,
20,
21,
23,
24,
28,
33].
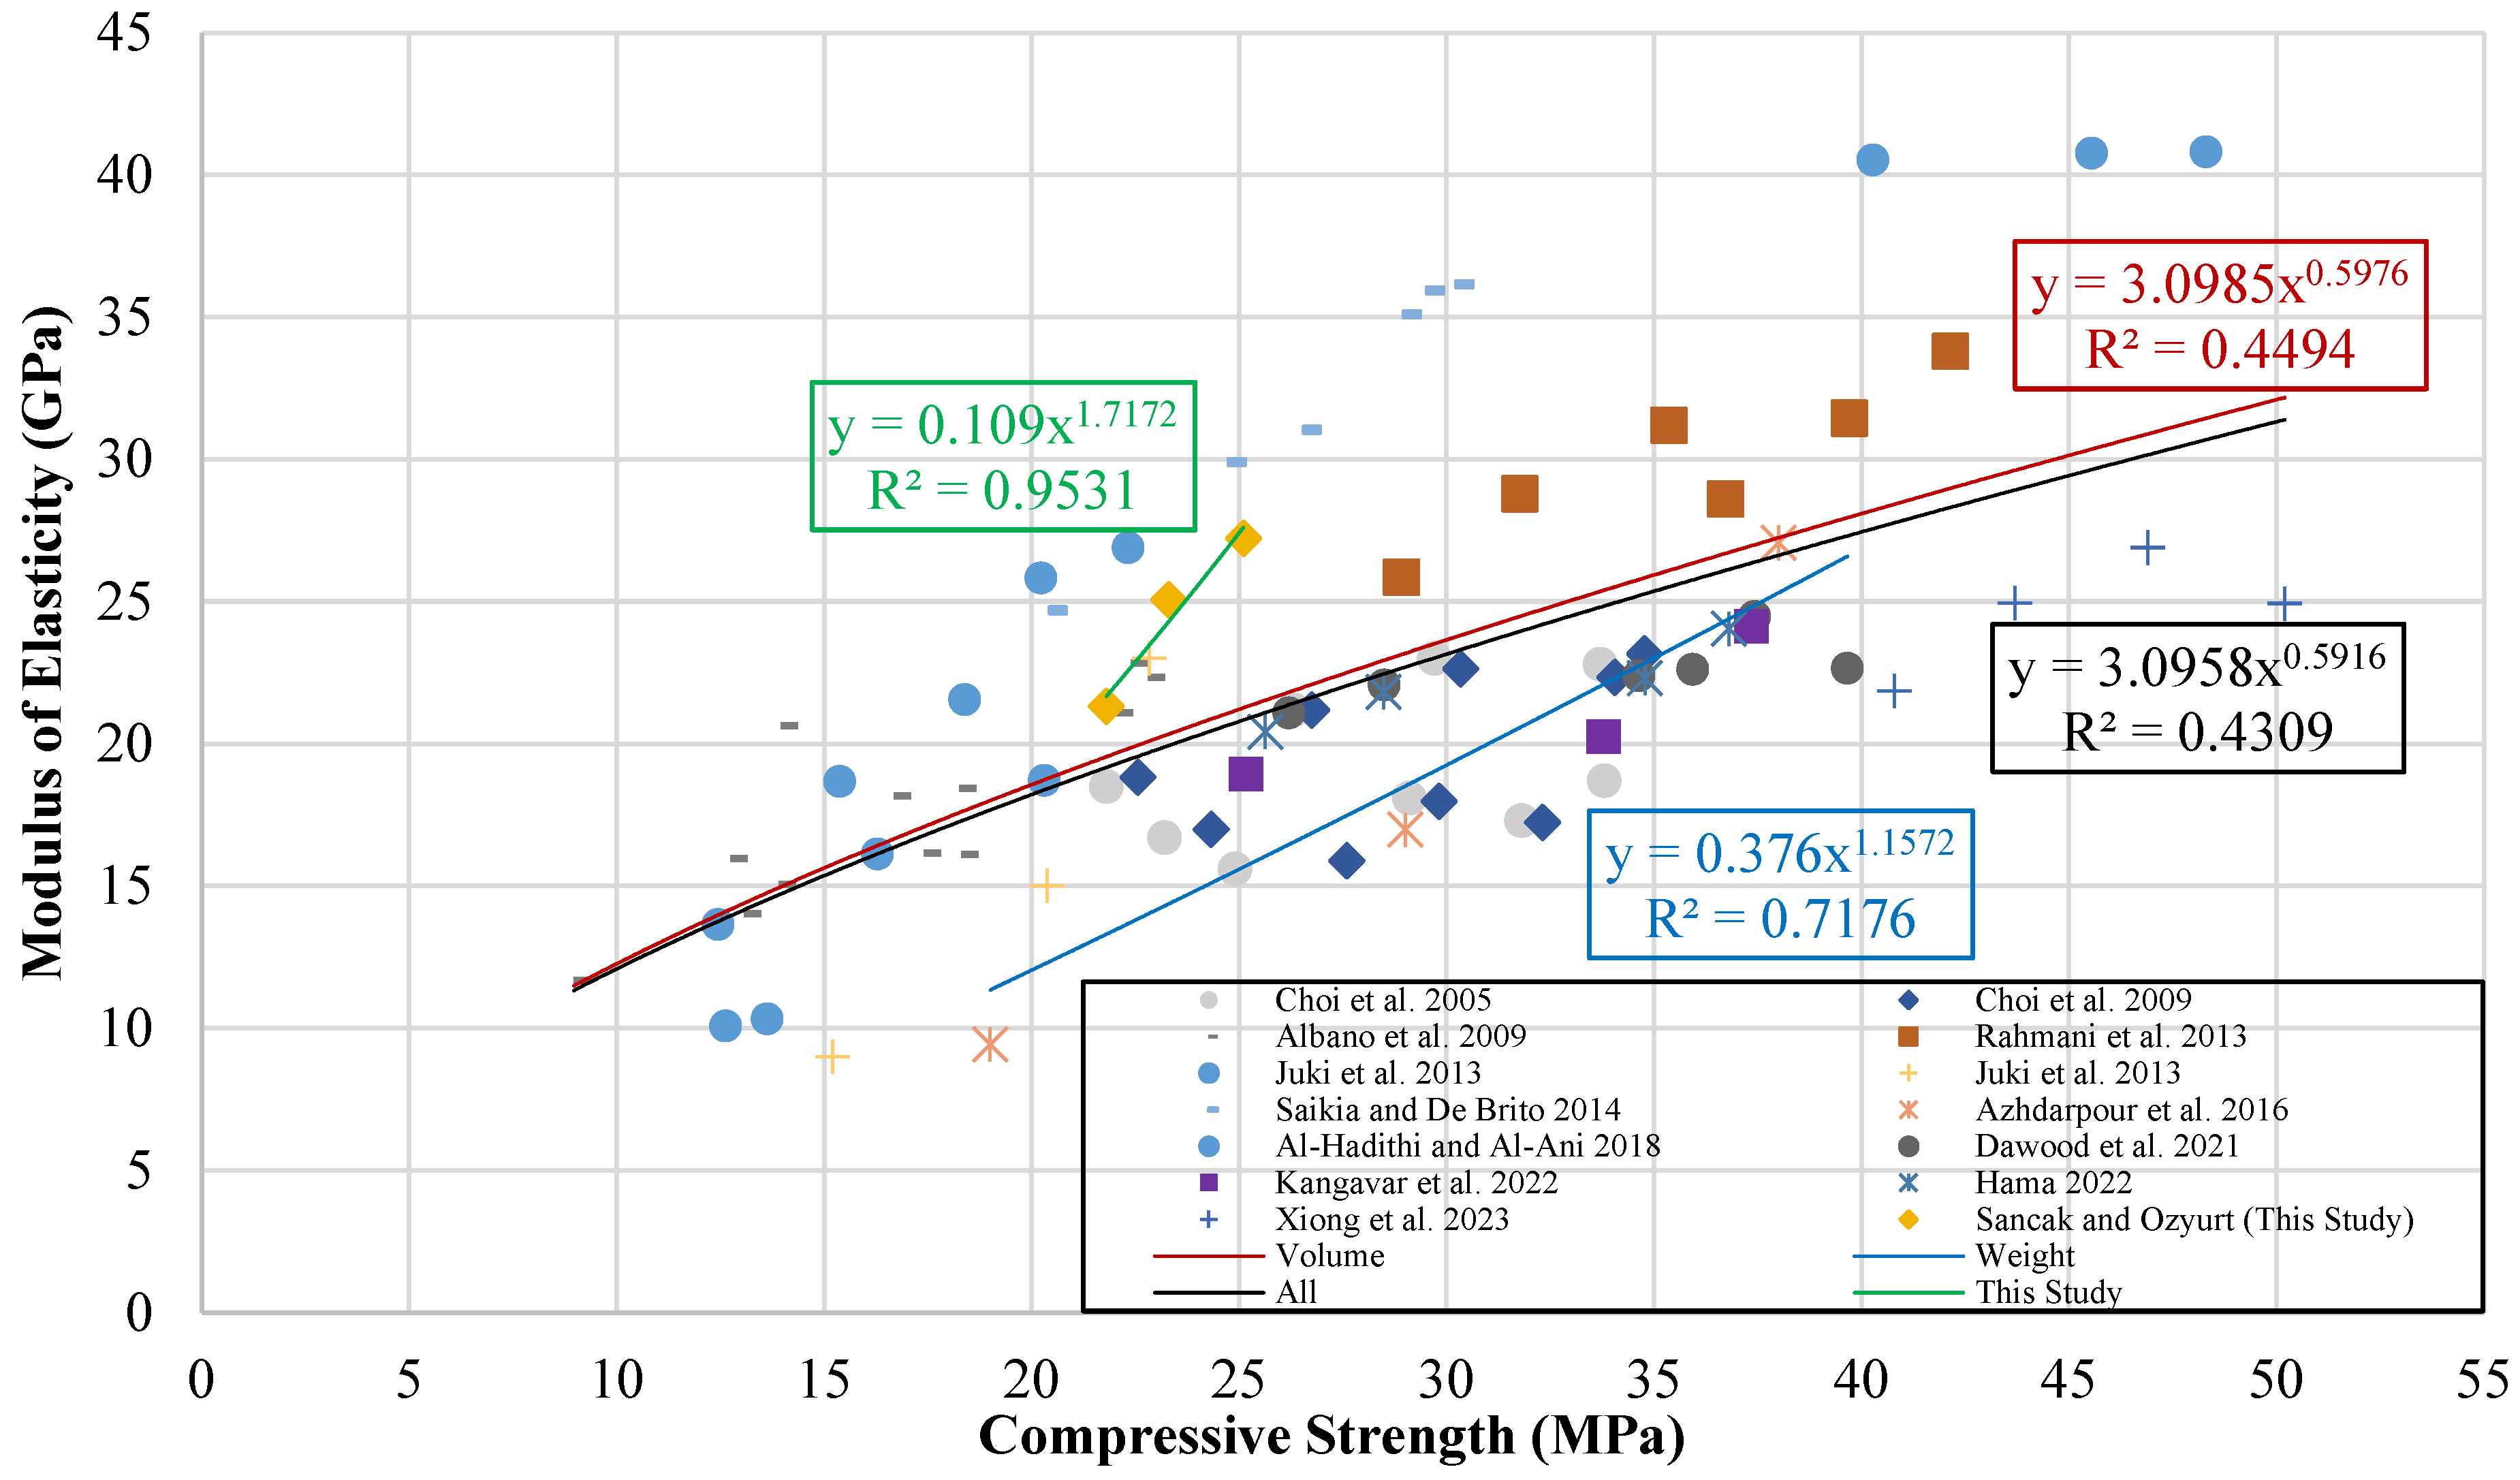
Figure 21.
Modulus of elasticity–compressive strength graph [
11,
12,
13,
14,
16,
17,
18,
20,
21,
23,
24,
28,
33].
Figure 21.
Modulus of elasticity–compressive strength graph [
11,
12,
13,
14,
16,
17,
18,
20,
21,
23,
24,
28,
33].
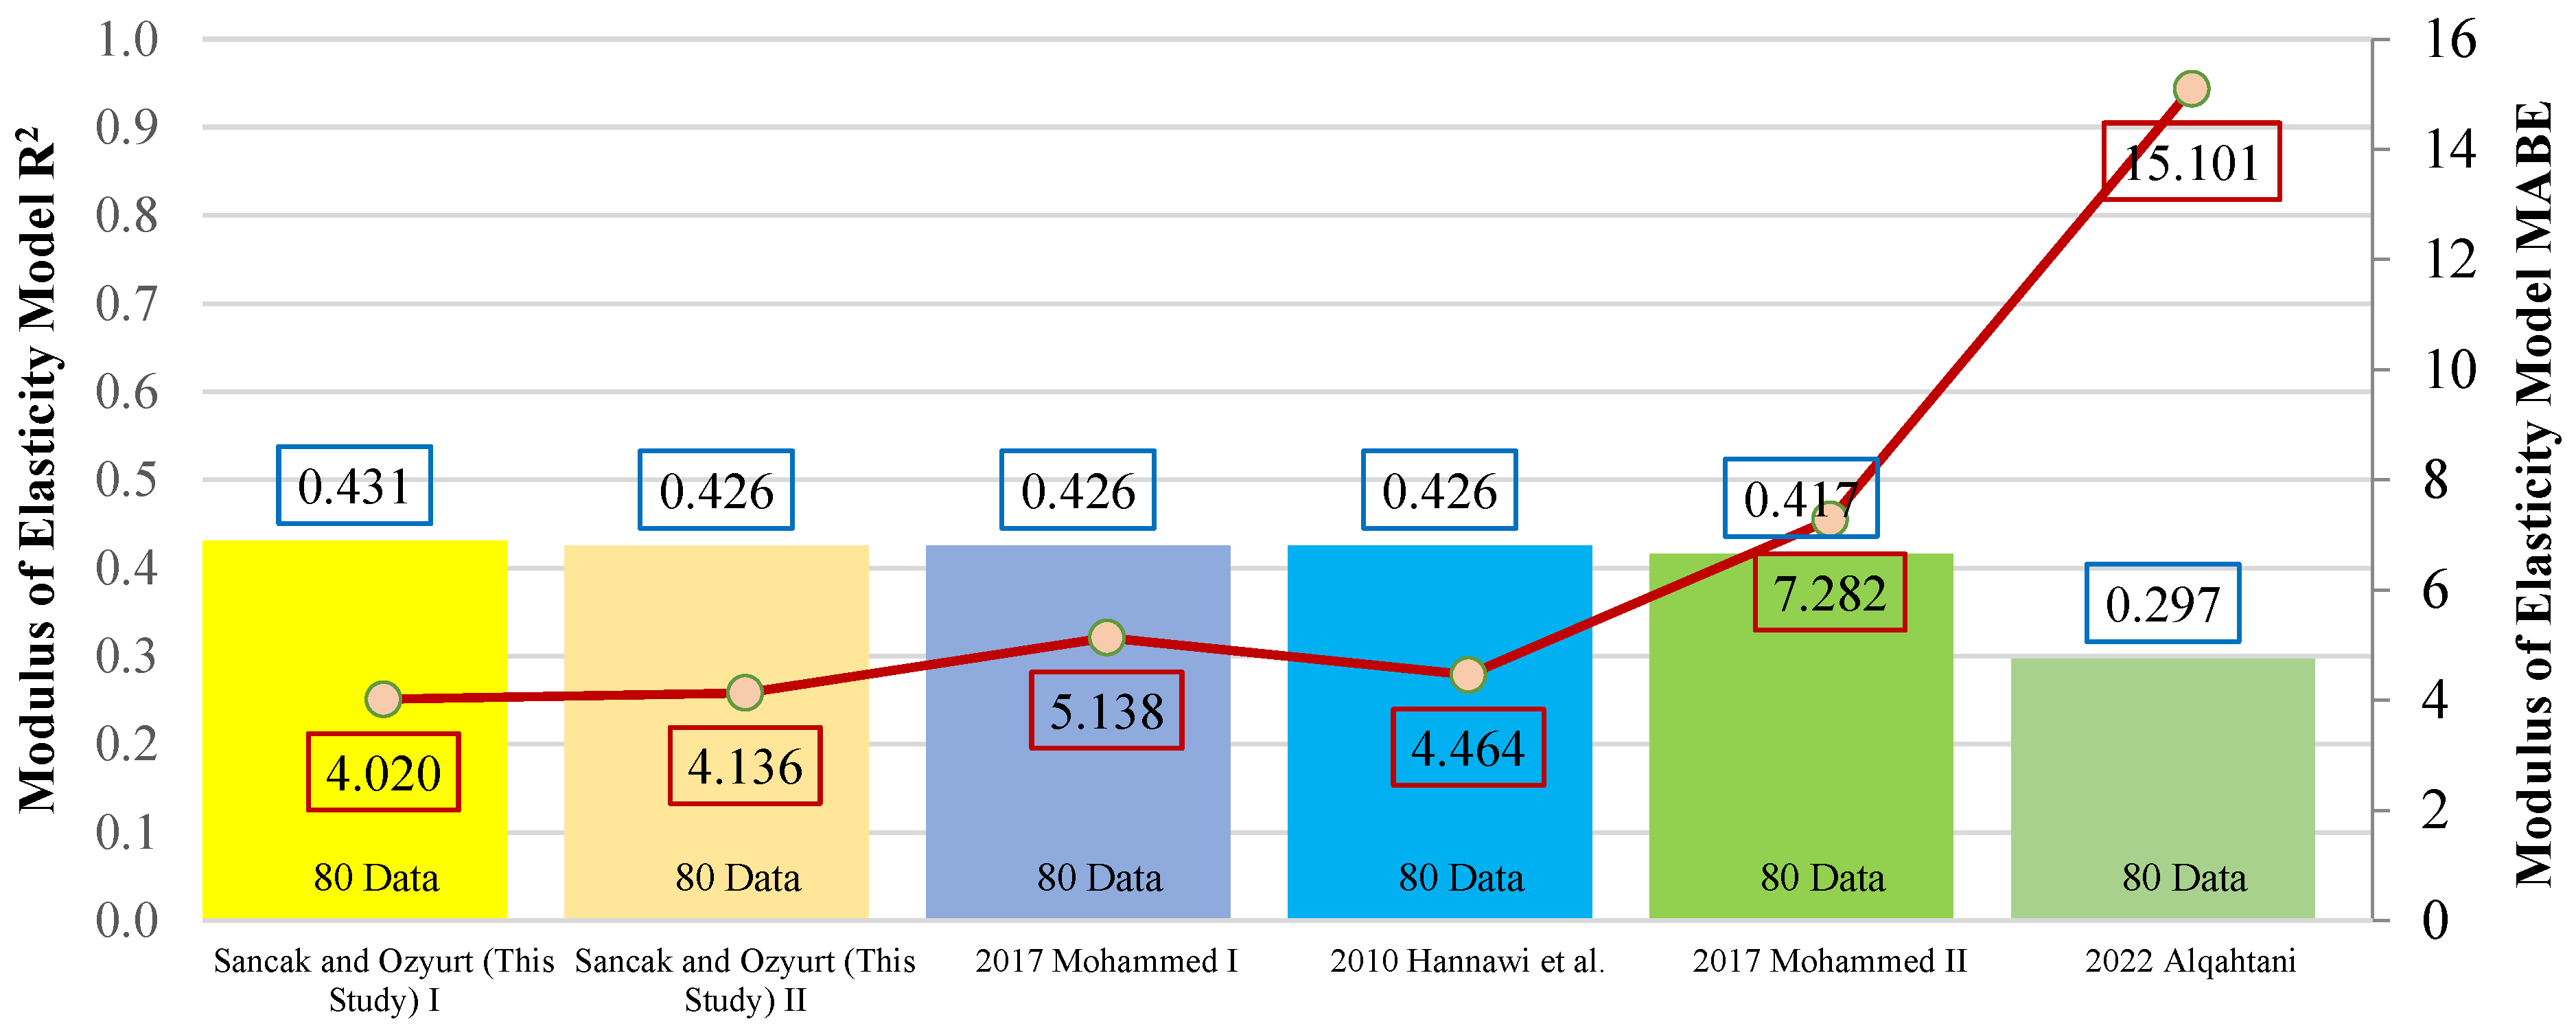
Figure 22.
Comparison of R
2 and MABE for models of the connection between modules of elasticity and compressive strength [
40,
41,
42].
Figure 22.
Comparison of R
2 and MABE for models of the connection between modules of elasticity and compressive strength [
40,
41,
42].
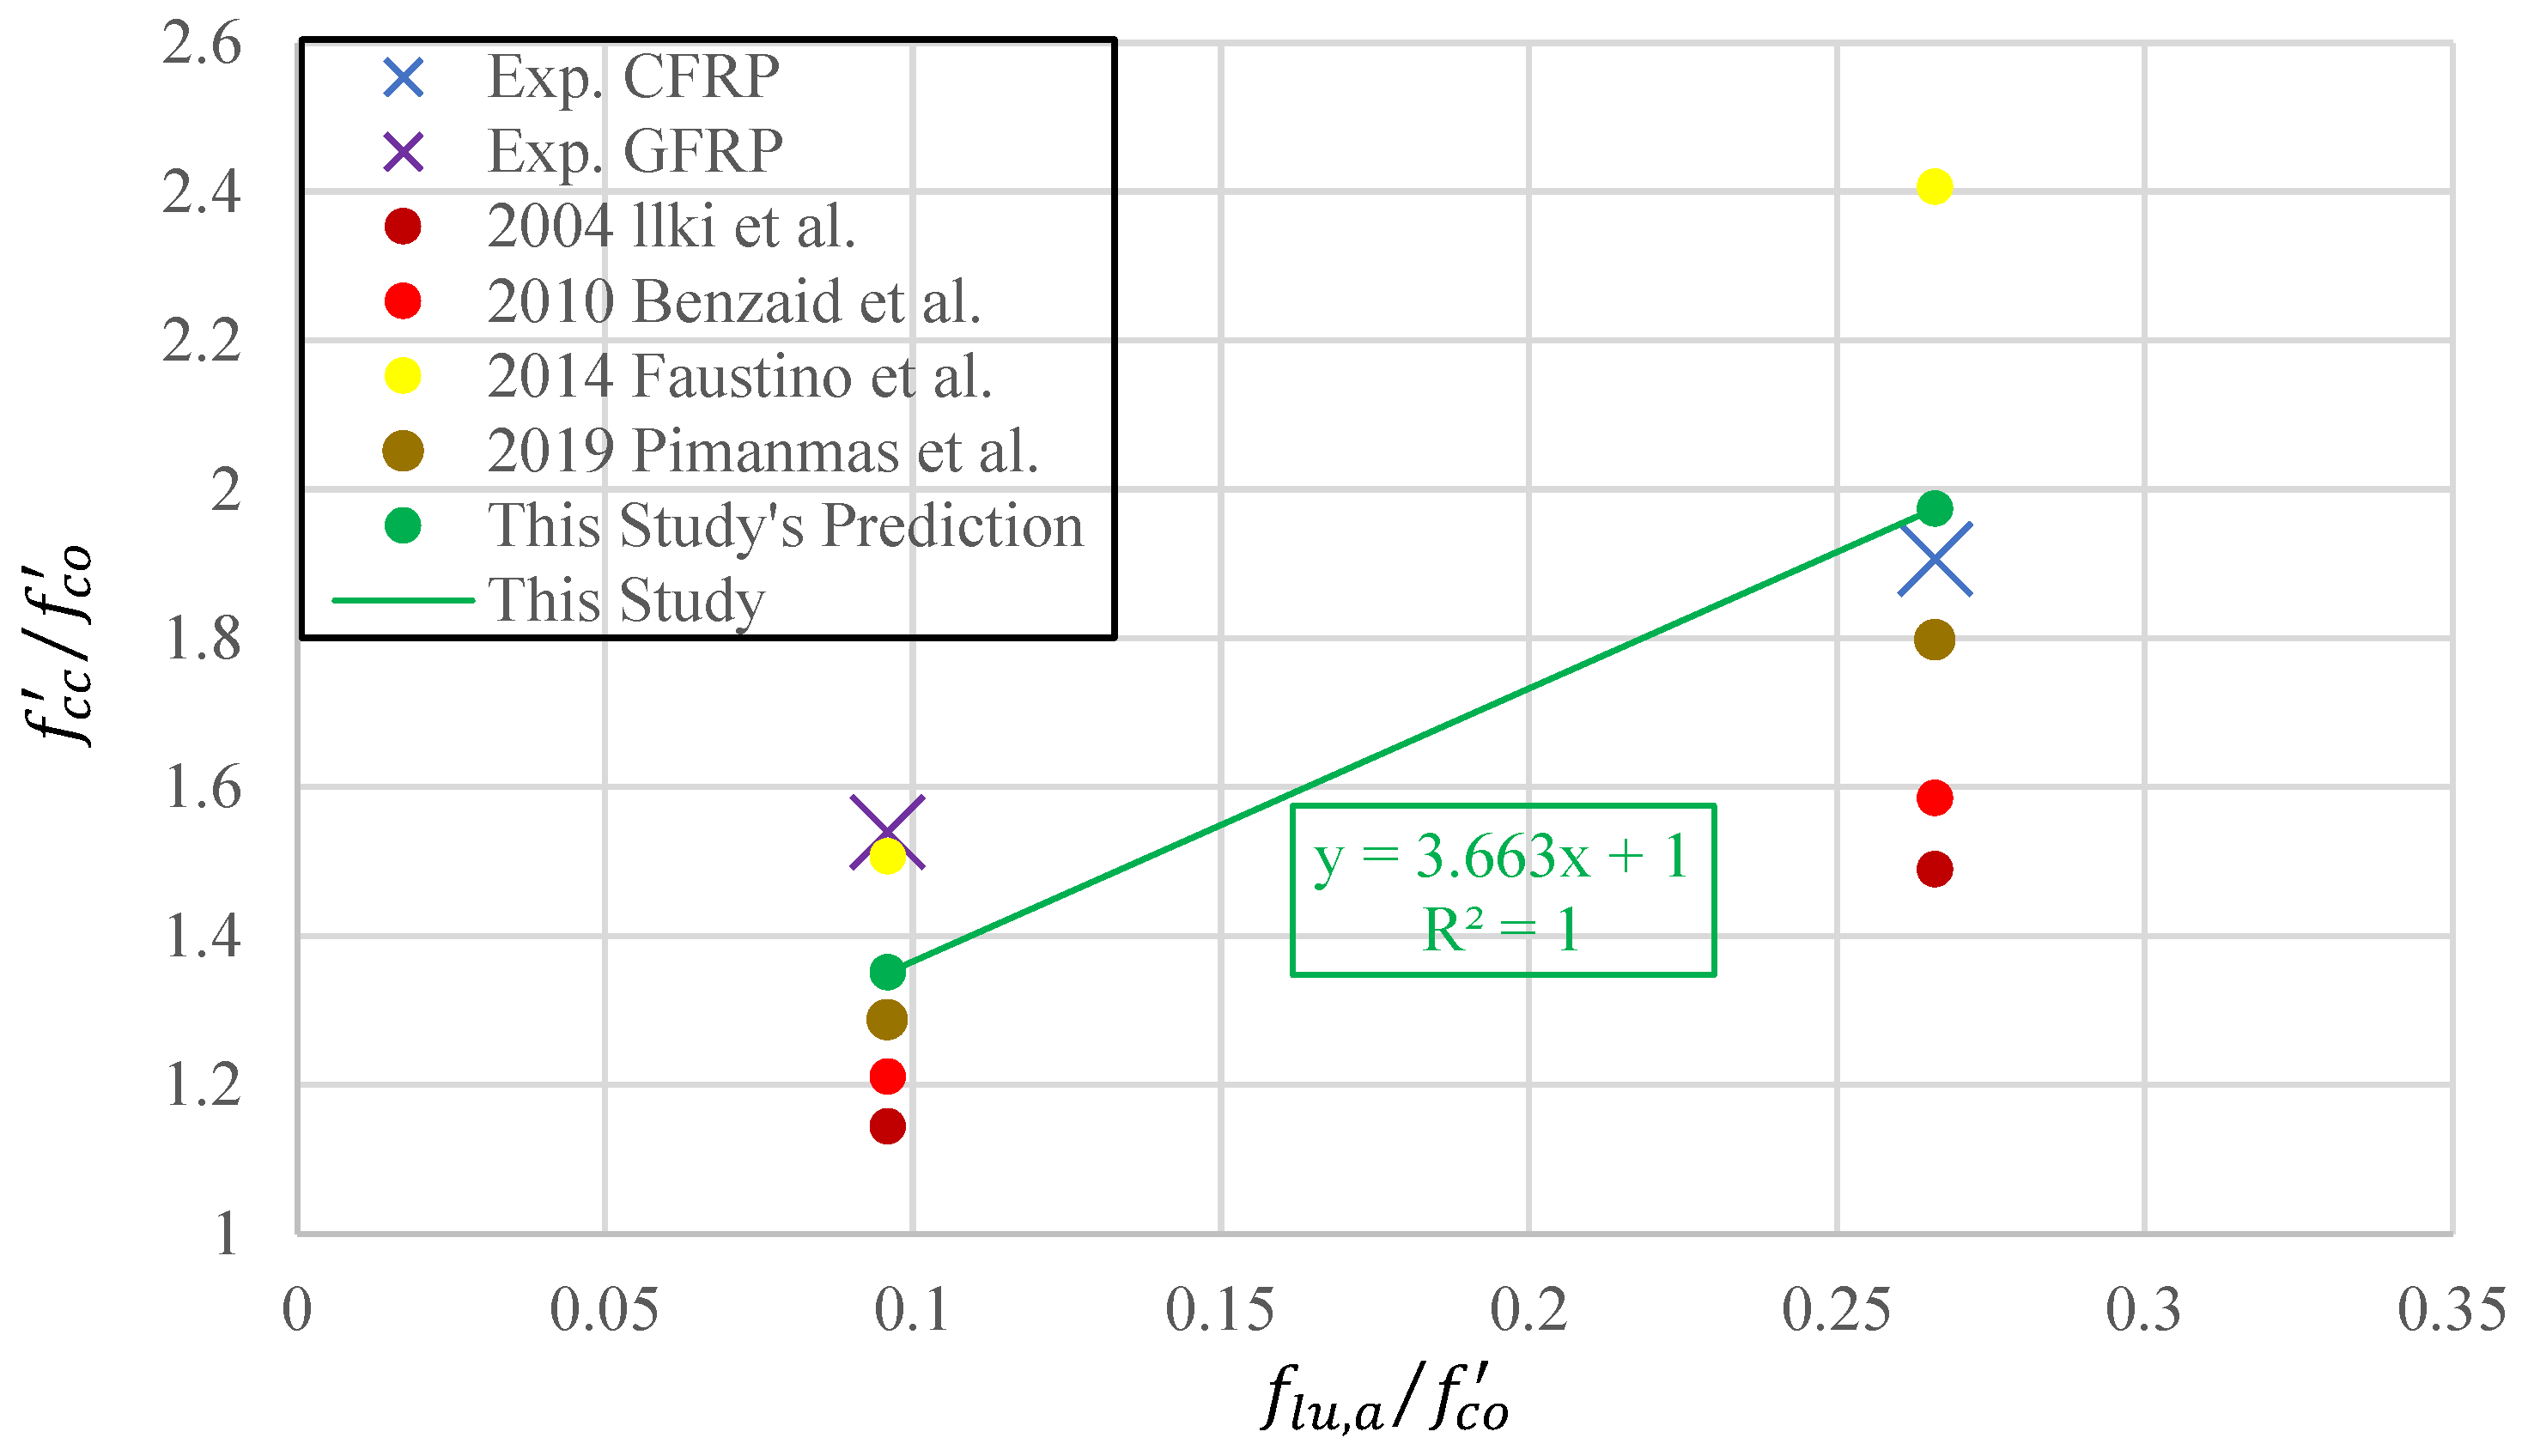
Figure 23.
Experimental data and model predictions for compressive strength under FRP-wrapping effect [
50,
51,
52,
53].
Figure 23.
Experimental data and model predictions for compressive strength under FRP-wrapping effect [
50,
51,
52,
53].
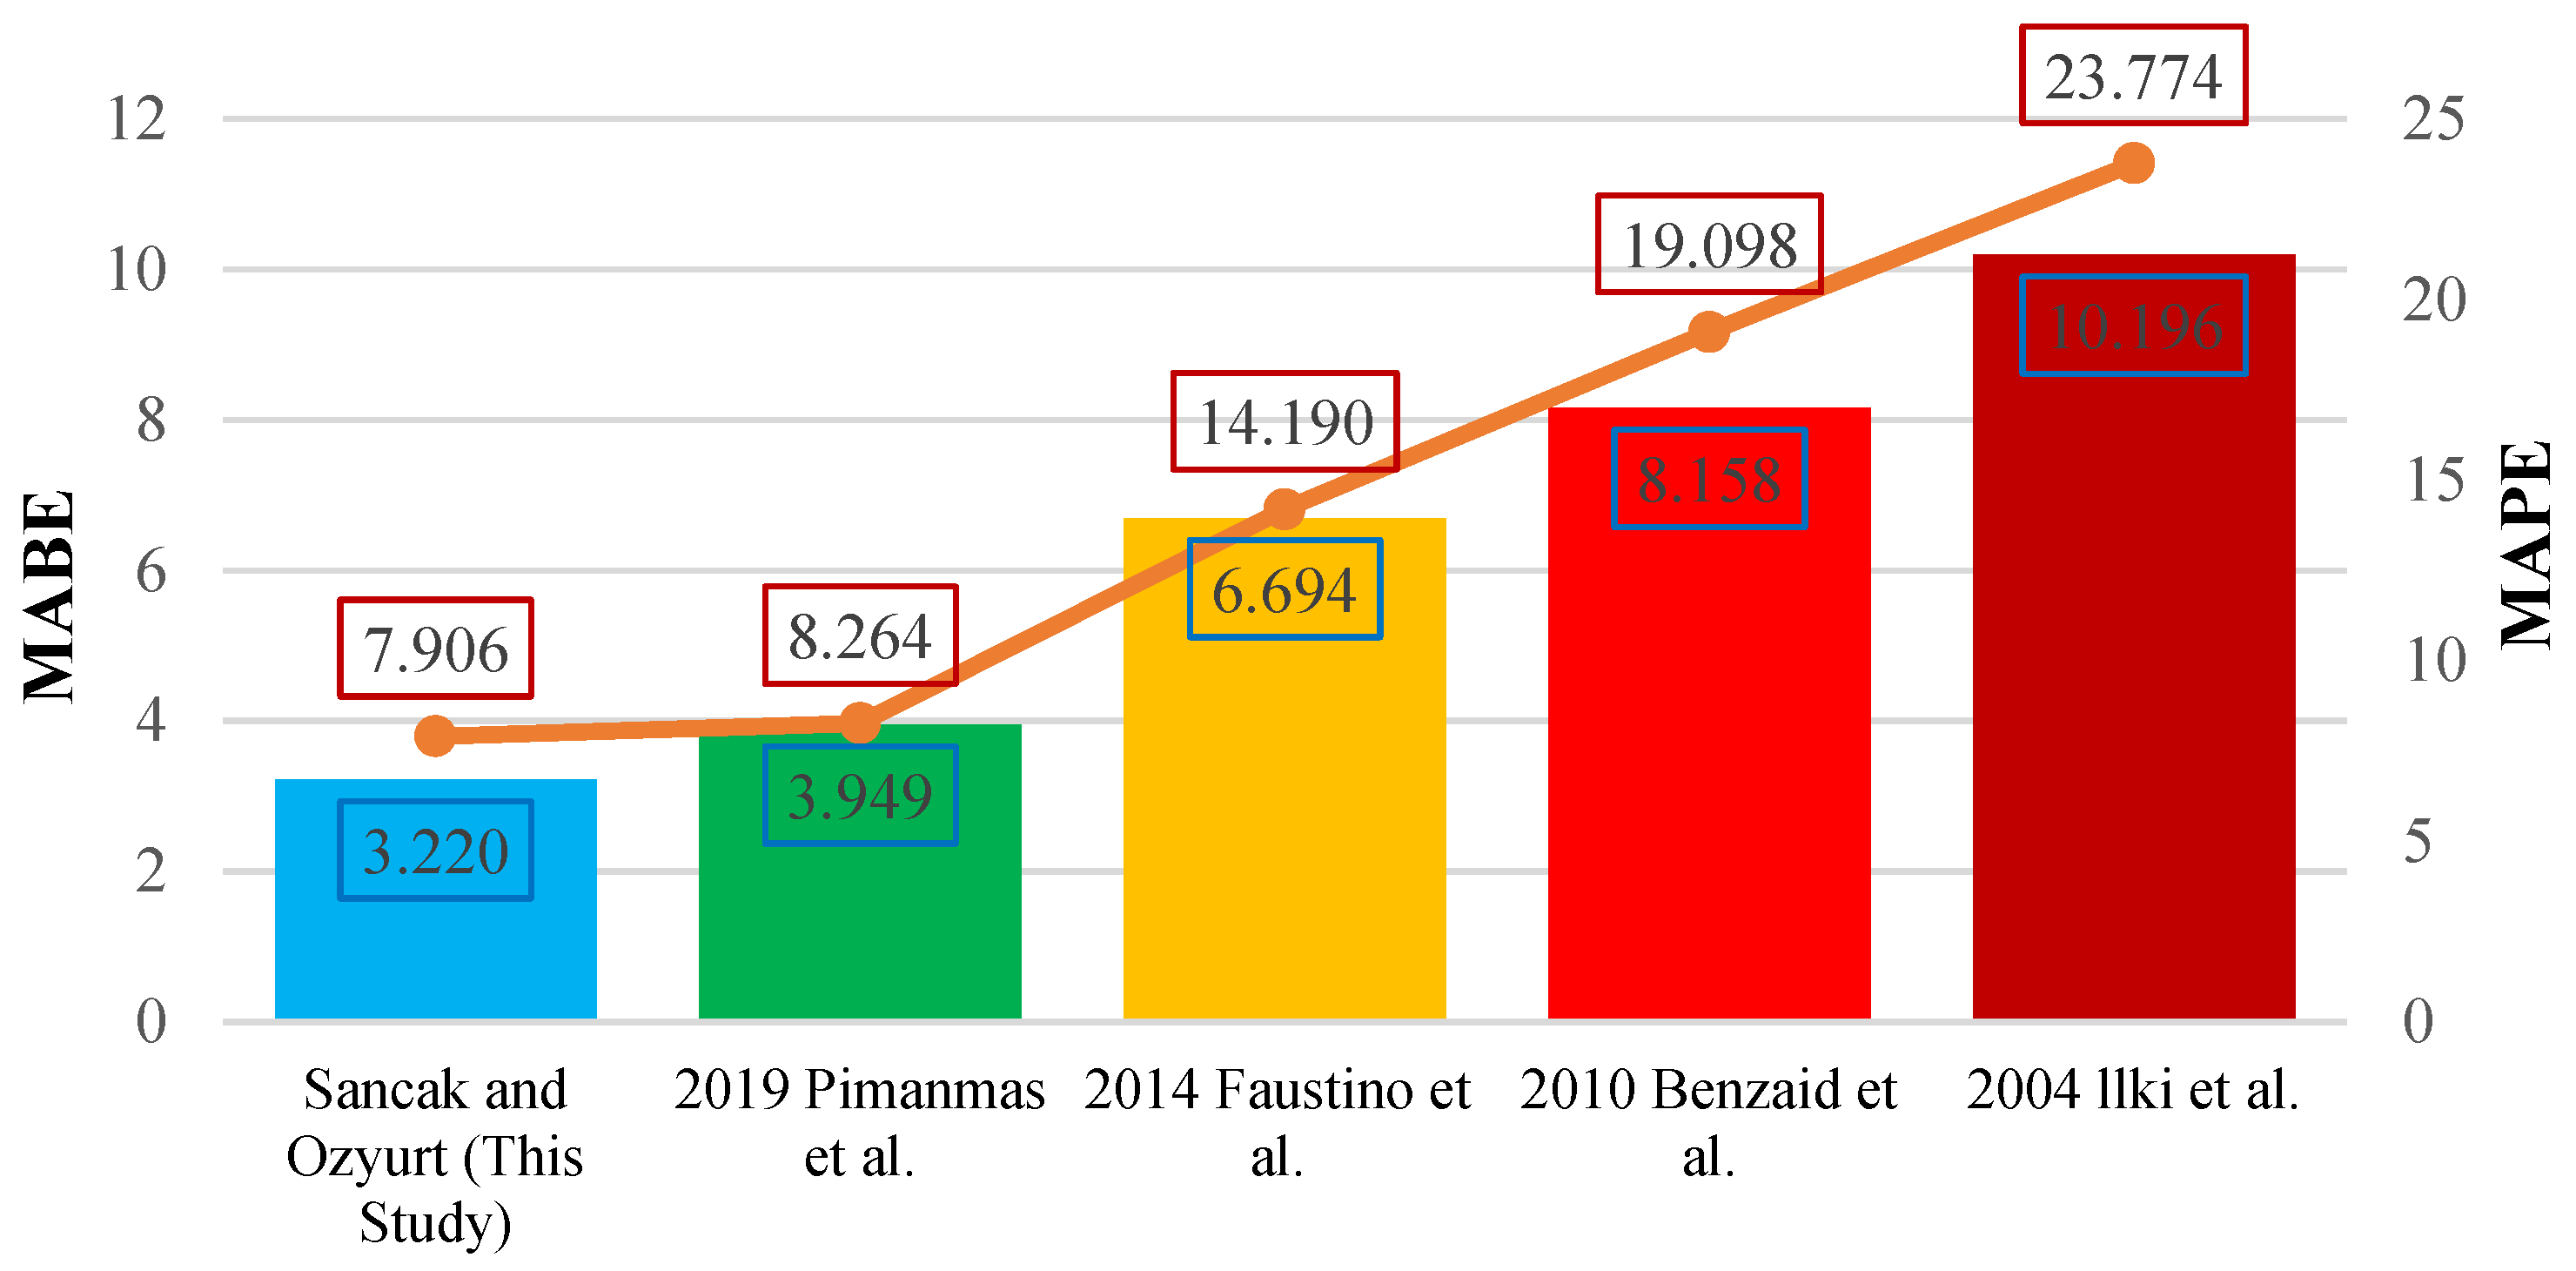
Figure 24.
Comparison of MABE and MAPE for compressive strength models under FRP-wrapping effect [
50,
51,
52,
53].
Figure 24.
Comparison of MABE and MAPE for compressive strength models under FRP-wrapping effect [
50,
51,
52,
53].
Figure 25.
Experimental data and model predictions for ultimate axial strain under FRP-wrapping effect [
50,
51,
52,
53].
Figure 25.
Experimental data and model predictions for ultimate axial strain under FRP-wrapping effect [
50,
51,
52,
53].
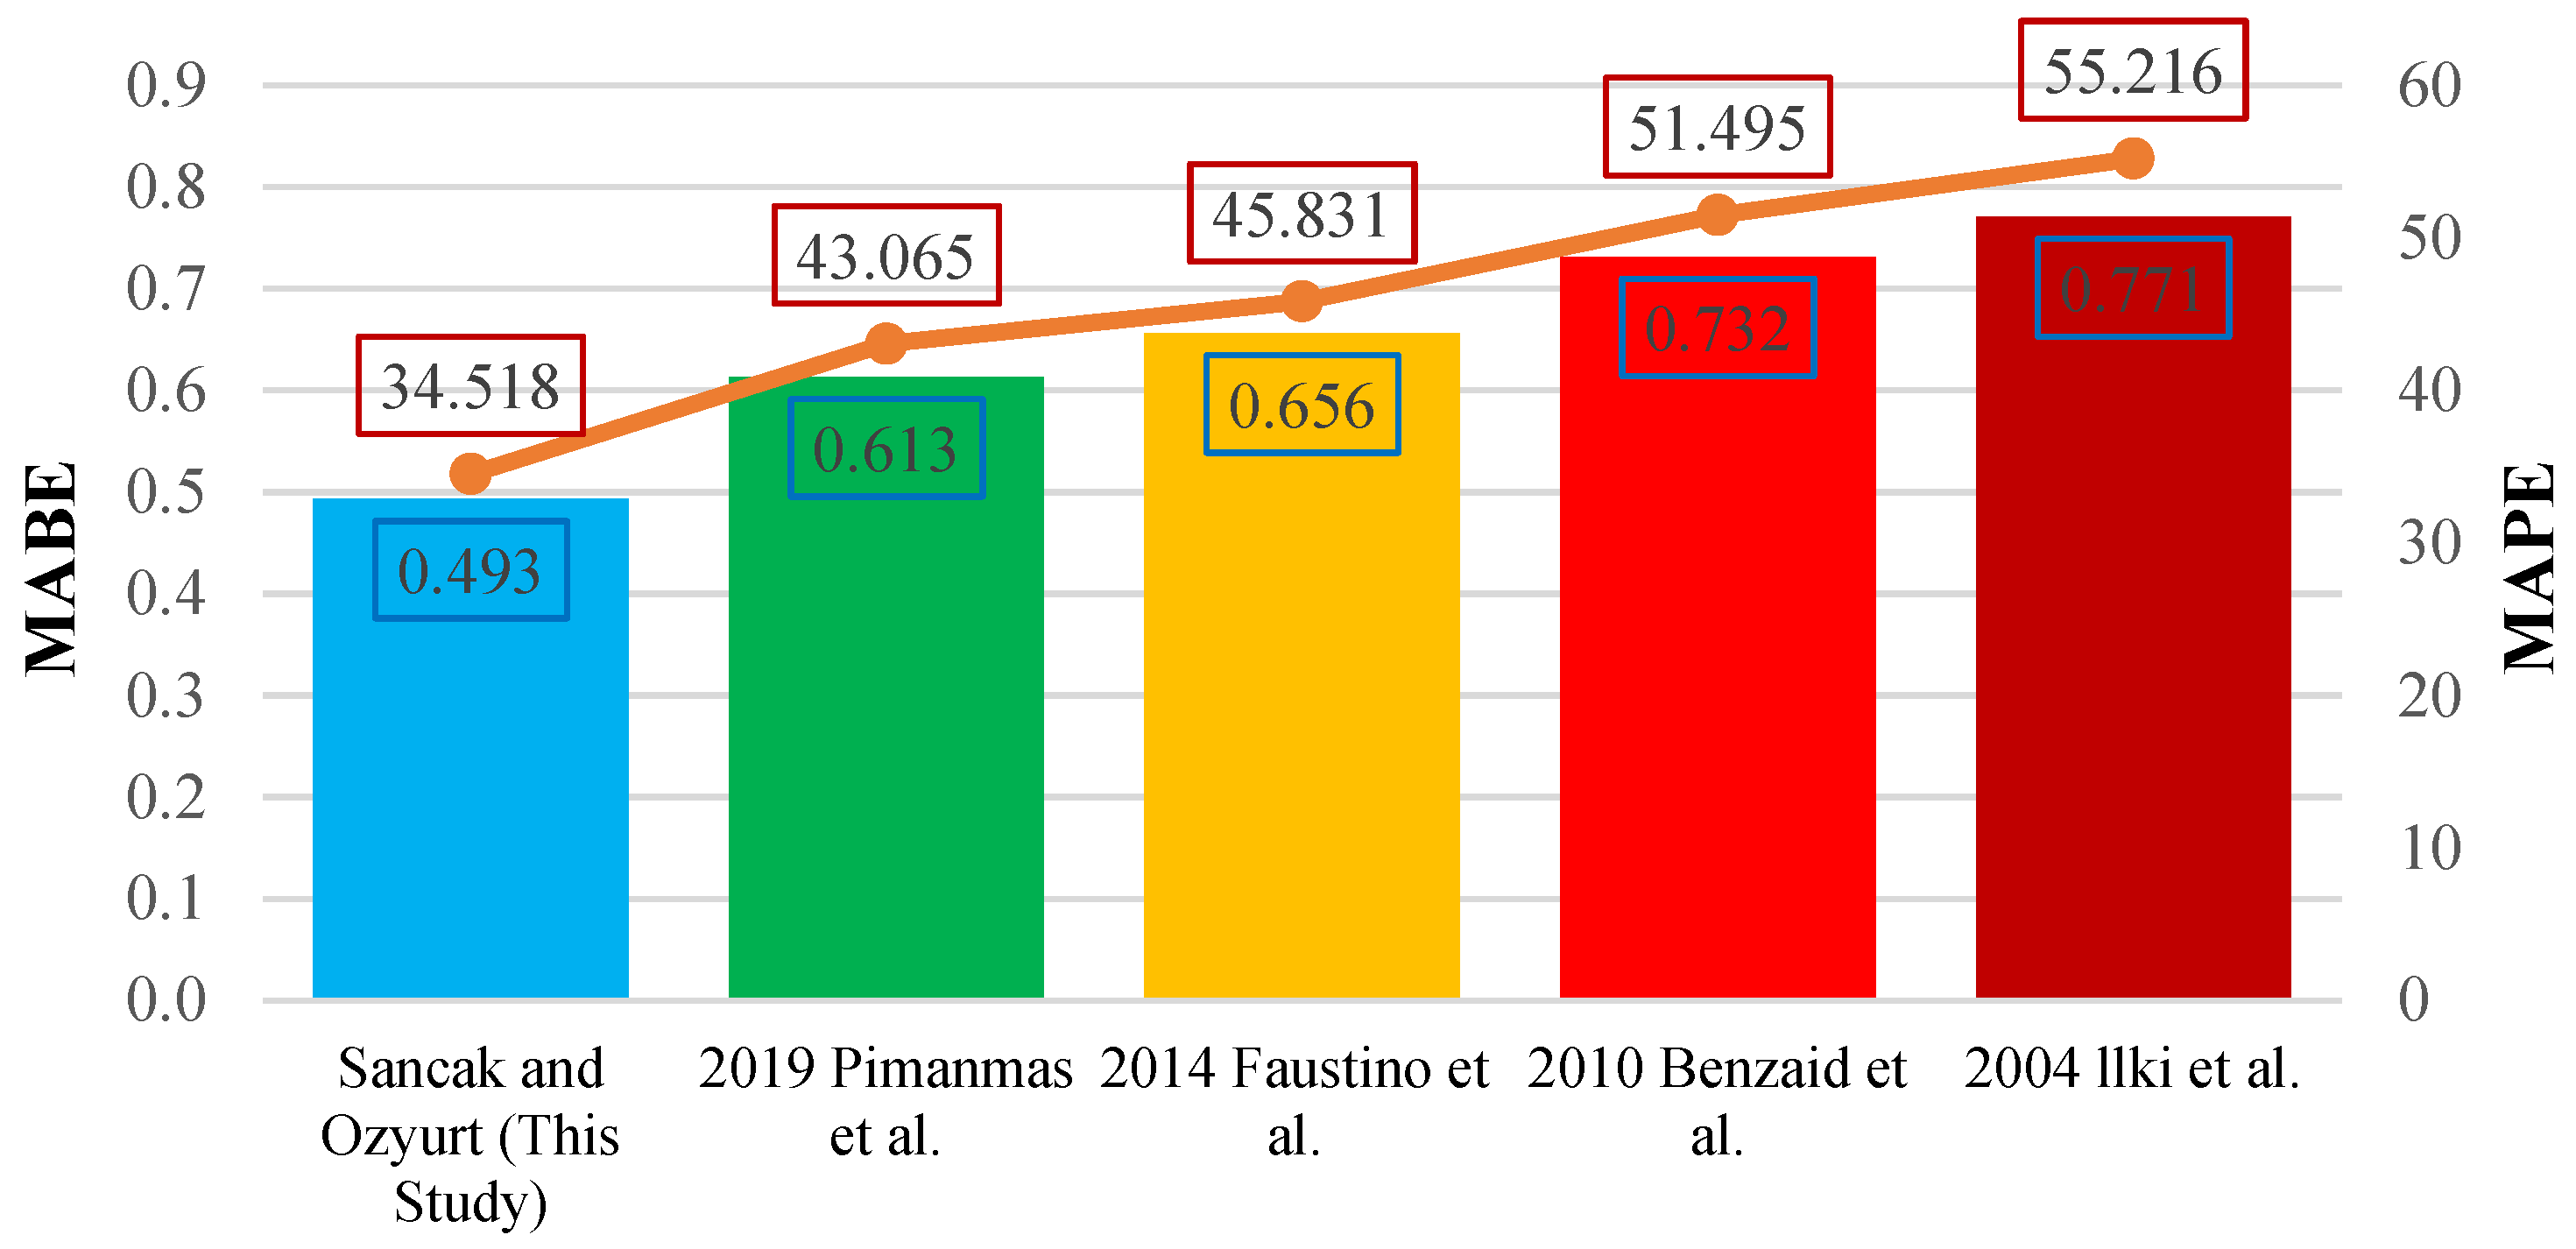
Figure 26.
Comparison of MABE and MAPE for ultimate axial strain models under FRP-wrapping effect [
50,
51,
52,
53].
Figure 26.
Comparison of MABE and MAPE for ultimate axial strain models under FRP-wrapping effect [
50,
51,
52,
53].
Table 1.
Cement properties.
Table 1.
Cement properties.
| Chemical Property | Analysis Result | EN 197-1 Standard Limit Values |
| Lower Limit | Upper Limit |
| SO3 (%) | 2.97 | - | 4.0 |
| Cl (%) | 0.0081 | - | 0.1000 |
| Na2O (%) | 0.67 | - | - |
| K2O (%) | 0.28 | - | - |
| Loss on Ignition (Fire Loss) (%) | 3.48 | - | 5.0 |
| Insoluble Residue (%) | 0.77 | - | 5.0 |
| Physical Property | Analysis Result | EN 197-1 Standard Limit Values |
| Lower Limit | Upper Limit |
| Specific Gravity | 3.13 | - | - |
| Specific Surface (Blaine) (cm2/g) | 3600 | - | - |
| Soundness (Le Chatelier) (mm) | 2.0 | - | 10 |
| Initial Setting Time (min) | 160 | 60 | - |
| 2-Day Compressive Strength (MPa) | 31.0 | 20 | - |
| 7-Day Compressive Strength (MPa) | 44.5 | - | - |
| 28-Day Compressive Strength (MPa) | 55.6 | 42.5 | 62.5 |
Table 2.
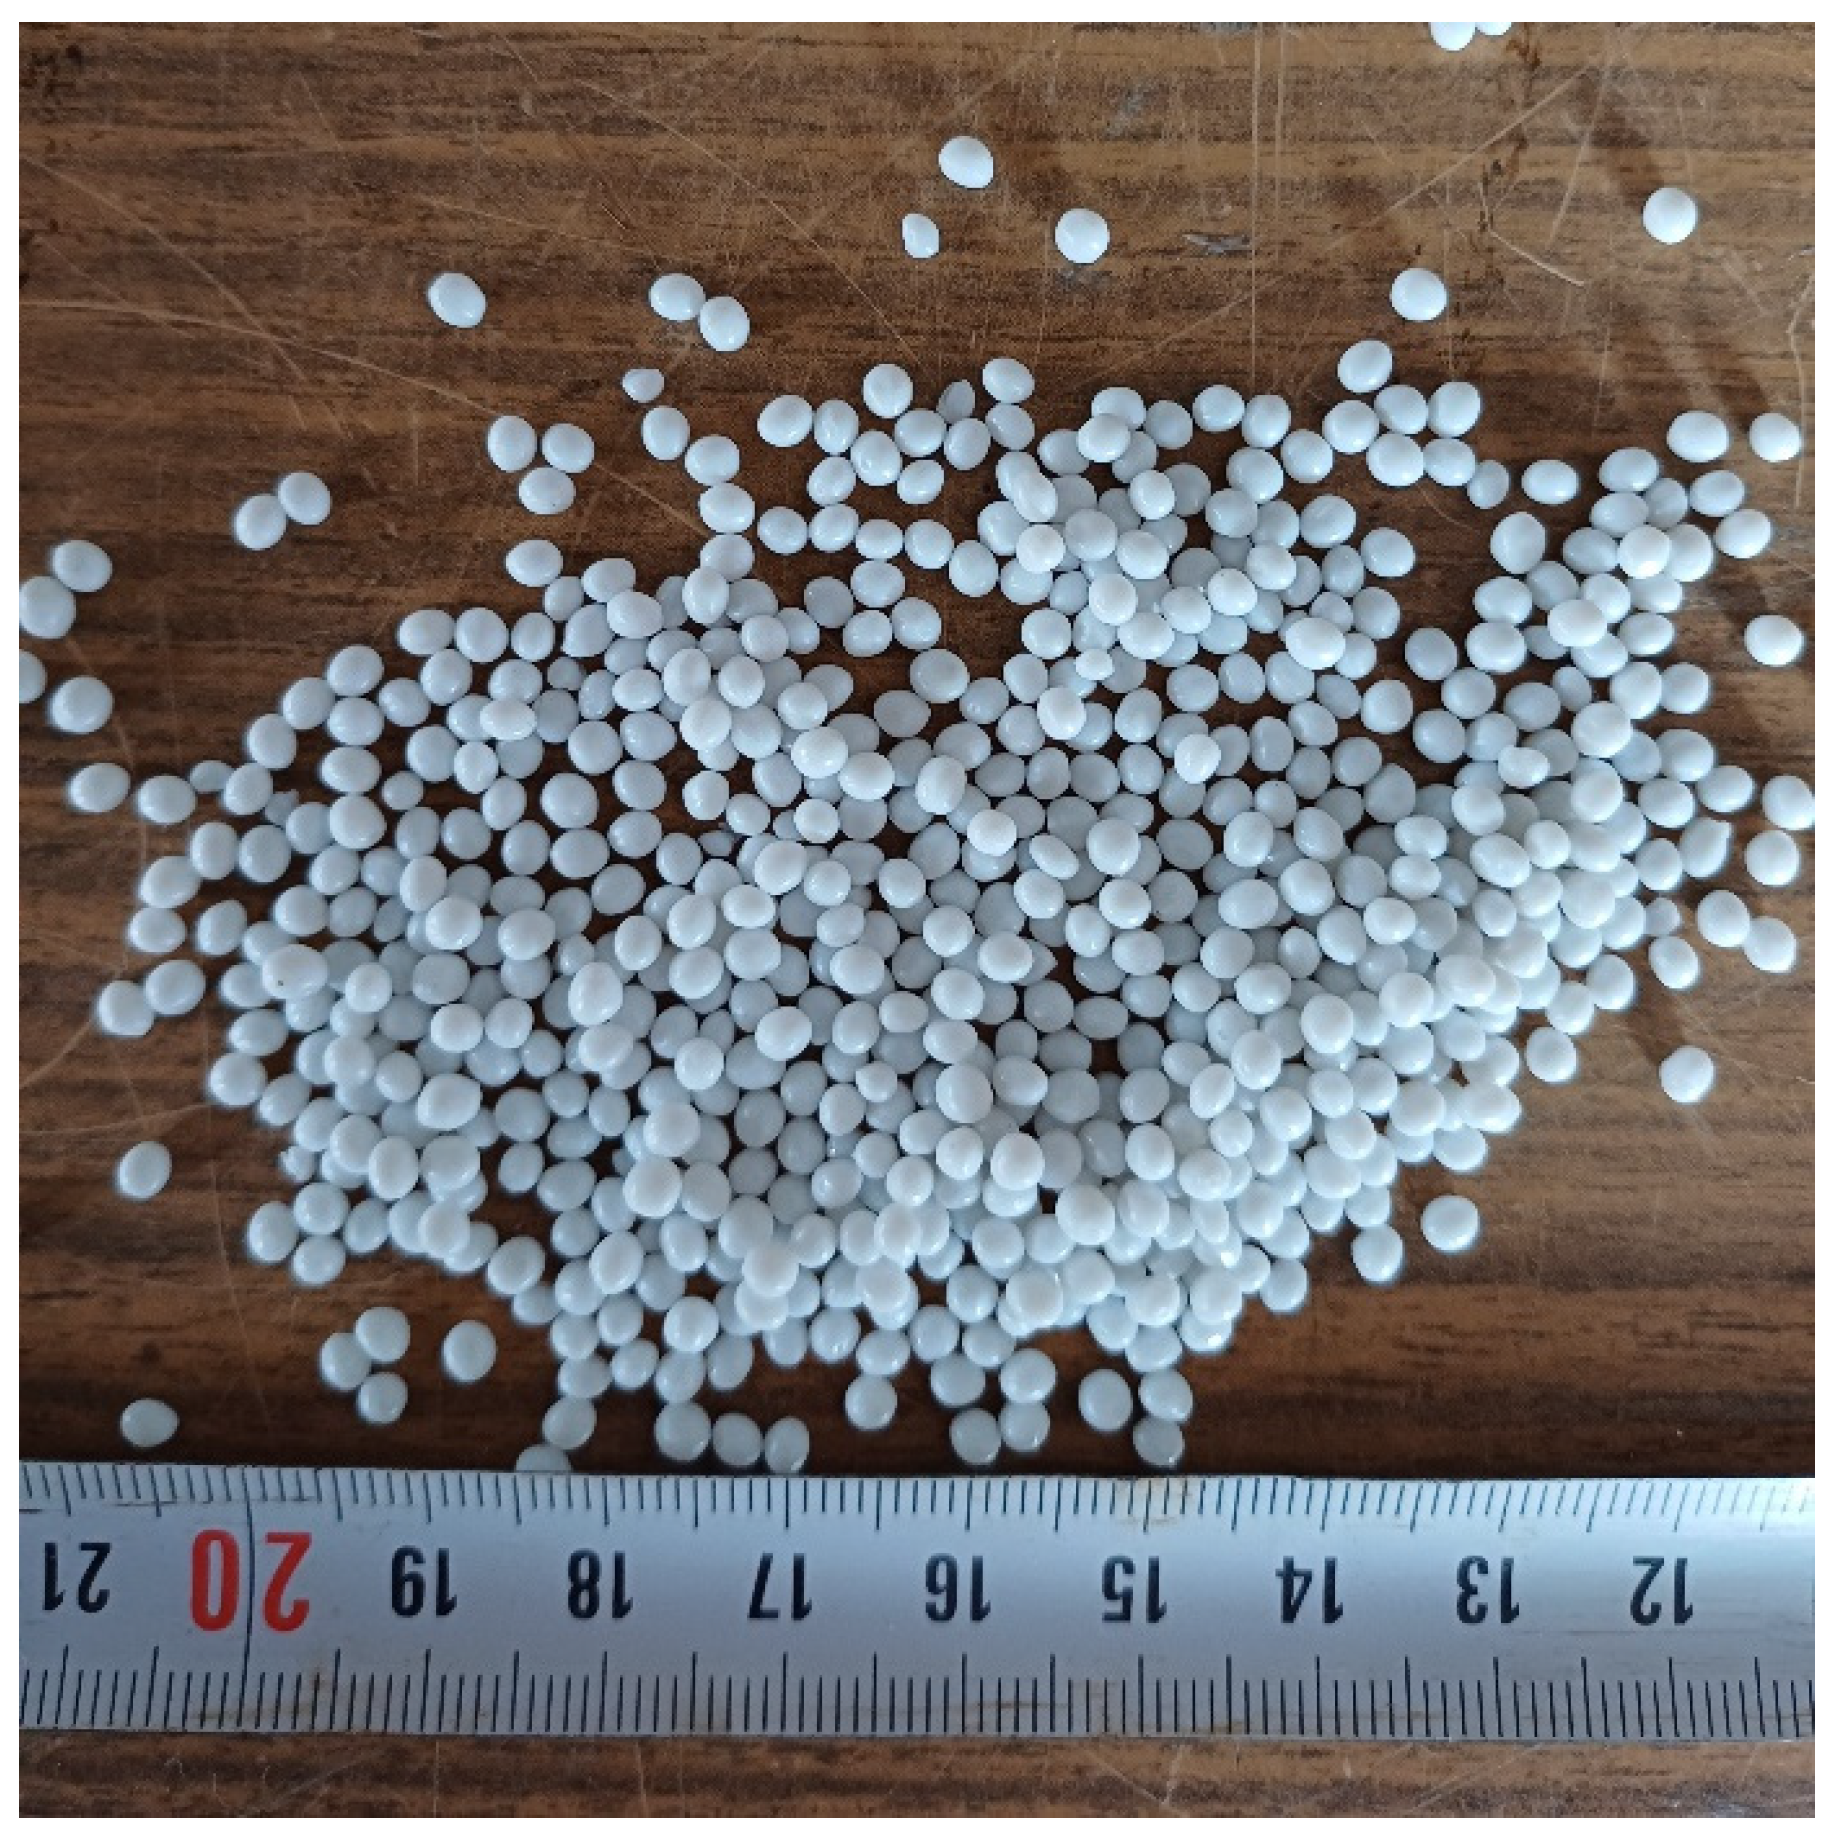
Properties of aggregates and PET granules.
Table 2.
Properties of aggregates and PET granules.
| | Coarse | Fine | PET |
|---|
| Specific Gravity | 2.7 | 2.6 | 1.38 |
| Unit Weight (kg/m3) | 1950 | 1800 | 1280 |
| Size (mm) | 2–22.4 | 0–8 | 2 |
Table 3.
CFRP and GFRP properties.
Table 3.
CFRP and GFRP properties.
| | CFRP | GFRP |
|---|
| Weaving Type | Unidirectional | Plain |
| Weight | 300 g/m2 | 200 g/m2 |
| Tensile strength (MPa) | 3000 | 1500 |
| Modulus of Elasticity (GPa) | 230 | 80 |
| Ultimate strain (%) | 1.3 | 1.9 |
| Thickness (mm) | 0.17 | 0.15 |
Table 4.
Epoxy properties.
Table 4.
Epoxy properties.
| | Concrete
Adhesion | Compressive Strength | Tensile Strength | Flexural Strength | Time to Reach Full Strength |
|---|
| Teknobond 300 Tix | (Rupture from Concrete) | | | | 7 days |
Table 5.
Concrete samples.
Table 5.
Concrete samples.
| Sample Name | Water (kg/m3) | Cement (kg/m3) | Gravel (kg/m3) | Sand (kg/m3) | PET (kg/m3) | PET Content Vol (%) | Strength Test | FRP Type |
|---|
| CS-R-0 | 195 | 390 | 1060 | 730 | - | - | Compressive | - |
| CS-PET-10 | 195 | 390 | 1060 | 657 | 51.91 | 10 | Compressive | - |
| CS-PET-20 | 195 | 390 | 1060 | 584 | 103.82 | 20 | Compressive | - |
| CS-PET-30 | 195 | 390 | 1060 | 511 | 155.73 | 30 | Compressive | - |
| STS-R-0 | 195 | 390 | 1060 | 730 | - | - | Splitting tensile | - |
| STS-PET-10 | 195 | 390 | 1060 | 657 | 51.91 | 10 | Splitting tensile | - |
| STS-PET-20 | 195 | 390 | 1060 | 584 | 103.82 | 20 | Splitting tensile | - |
| STS-PET-30 | 195 | 390 | 1060 | 511 | 155.73 | 30 | Splitting tensile | - |
| FS-R-0 | 195 | 390 | 1060 | 730 | - | - | Flexural | - |
| FS-PET-10 | 195 | 390 | 1060 | 657 | 51.91 | 10 | Flexural | - |
| FS-PET-20 | 195 | 390 | 1060 | 584 | 103.82 | 20 | Flexural | - |
| FS-PET-30 | 195 | 390 | 1060 | 511 | 155.73 | 30 | Flexural | - |
| CS-PET-CFRP-10 | 195 | 390 | 1060 | 657 | 51.91 | 10 | Compressive | Carbon |
| CS-PET-GFRP-10 | 195 | 390 | 1060 | 657 | 51.91 | 10 | Compressive | Glass |
| STS-PET-CFRP-10 | 195 | 390 | 1060 | 657 | 51.91 | 10 | Splitting tensile | Carbon |
| STS-PET-GFRP-10 | 195 | 390 | 1060 | 657 | 51.91 | 10 | Splitting tensile | Glass |
| FS-PET-CFRP-10 | 195 | 390 | 1060 | 657 | 51.91 | 10 | Flexural | Carbon |
| FS-PET-GFRP-10 | 195 | 390 | 1060 | 657 | 51.91 | 10 | Flexural | Glass |
Table 6.
Experimental results.
Table 6.
Experimental results.
PET
Content Vol (%) | FRP Type | Compressive Strength (MPa) | Splitting Tensile Strength (MPa) | Flexural Strength (MPa) | Modulus of Elasticity (MPa) | Density (kg/m3) | Slump (mm) |
|---|
| - | - | 26.91 | 2.46 | 3.37 | 30,574.17 | 2307.88 | 48 |
| 10 | - | 25.11 | 2.35 | 3.23 | 27,221.85 | 2271.66 | 45 |
| 20 | - | 23.31 | 2.24 | 3.10 | 25,061.49 | 2234.49 | 40 |
| 30 | - | 21.80 | 2.16 | 3.00 | 21,320.87 | 2177.94 | 38 |
| 10 | Carbon | 47.86 | 3.45 | 4.59 | 27,512.26 | 2271.66 | 45 |
| 10 | Glass | 38.66 | 3.04 | 4.09 | 27,465.83 | 2271.66 | 45 |
Table 7.
Compressive strength test results of samples without FRP.
Table 7.
Compressive strength test results of samples without FRP.
| Sample Name | | at Maximum Stress | at Maximum Stress |
|---|
| CS-R-0 | 26.91 | 0.001967 | 0.000747 |
| CS-PET-10 | 25.11 | 0.002023 | 0.000769 |
| CS-PET-20 | 23.31 | 0.002116 | 0.000857 |
| CS-PET-30 | 21.80 | 0.002123 | 0.000908 |
Table 8.
Compressive strength test results of samples with FRP.
Table 8.
Compressive strength test results of samples with FRP.
| Sample Name | (MPa) | (MPa) | | | | |
|---|
| CS-PET-CFRP-10 | 25.11 | 47.86 | 0.002023 | 0.013819 | 0.000769 | 0.008538 |
| CS-PET-GFRP-10 | 25.11 | 38.66 | 0.002023 | 0.014469 | 0.000769 | 0.010028 |
Table 9.
Splitting tensile strength test results.
Table 9.
Splitting tensile strength test results.
| Sample Name | Split Tensile Strength (MPa) |
|---|
| CS-R-0 | 2.46 |
| CS-PET-10 | 2.35 |
| CS-PET-20 | 2.24 |
| CS-PET-30 | 2.16 |
| CS-PET-CFRP-10 | 3.45 |
| CS-PET-GFRP-10 | 3.04 |
Table 10.
Flexural strength test results of samples without FRP.
Table 10.
Flexural strength test results of samples without FRP.
| Sample Name | Maximum Flexural Stress (MPa) | Maximum Flexural Strain |
|---|
| CS-R-0 | 3.37 | 0.010467 |
| CS-PET-10 | 3.23 | 0.011447 |
| CS-PET-20 | 3.10 | 0.012158 |
| CS-PET-30 | 3.00 | 0.012759 |
Table 11.
Flexural strength test results of samples with FRP.
Table 11.
Flexural strength test results of samples with FRP.
| Sample Name | Maximum Flexural Stress (MPa) | Maximum Flexural Strain |
|---|
| CS-PET-CFRP-10 | 4.59 | 0.061819 |
| CS-PET-GFRP-10 | 4.09 | 0.066795 |
Table 12.
Elasticity modules of the samples.
Table 12.
Elasticity modules of the samples.
| Sample Name | | |
|---|
| CS-R-0 | 30,574.17 | - |
| CS-PET-10 | 27,221.85 | - |
| CS-PET-20 | 25,061.49 | - |
| CS-PET-30 | 21,320.87 | - |
| CS-PET-CFRP-10 | 27,512.26 | 1704.56 |
| CS-PET-GFRP-10 | 27,465.83 | 988.90 |
Table 13.
Statistical metrics.
Table 13.
Statistical metrics.
| Metric | Equation | Information |
|---|
| R2 | | This method shows how well a model predicts measured data, with an R2 value between 0 and 1. A value closer to 1 indicates better performance [46,56,57]. |
| MABE | | MABE represents the absolute bias error and reflects the quality of the correlation. A value close to zero is preferred. It gives insight into the long-term performance of the prediction models [46,56]. |
| MAPE | | MAPE measures the average percentage of absolute prediction errors relative to the actual data values. A lower MAPE indicates better model performance [46,56,57]. |
Table 14.
PET-substituted concrete experimental database.
Table 14.
PET-substituted concrete experimental database.
| Type of Substitution | Year | Reference | 28-day CS Test (mm) | 28-Day TS Test (mm) | 28-Day FS Test (mm) | PET Specific Gravity | PET Bulk Density (kg/m3) | PET Size (mm) | PET (%) | Concrete Density (kg/m3) | W/C Ratio | 28-day CS (MPa) | 28-Day Cylindrical CS (MPa) | 28-Day TS (MPa) | 28-Day Cylindrical TS (MPa) | 28-Day FS (MPa) | MoE (GPa) | Slump (mm) |
|---|
| Vol | 2005 | Choi et al. [11] | 100 × 200 cylinders | 100 × 200 cylinders | | | | | 0 | 2300 | 0.53 | 31.5 | | 3.27 | | | 23.5 | 100 |
| | | | 100 × 200 cylinders | 100 × 200 cylinders | | 1.39 | 844 | 5–15 | 25 | 2220 | 0.53 | 29.7 | | 2.65 | | | 23 | 153 |
| | | | 100 × 200 cylinders | 100 × 200 cylinders | | 1.39 | 844 | 5–15 | 50 | 2130 | 0.53 | 26.3 | | 2.25 | | | 21.2 | 199 |
| | | | 100 × 200 cylinders | 100 × 200 cylinders | | 1.39 | 844 | 5–15 | 75 | 2010 | 0.53 | 21.8 | | 2.04 | | | 18.5 | 223 |
| | | | 100 × 200 cylinders | 100 × 200 cylinders | | | | | 0 | 2300 | 0.49 | 34.6 | | 3.27 | | | 23.3 | 105 |
| | | | 100 × 200 cylinders | 100 × 200 cylinders | | 1.39 | 844 | 5–15 | 25 | 2230 | 0.49 | 33.7 | | 2.76 | | | 22.8 | 154 |
| | | | 100 × 200 cylinders | 100 × 200 cylinders | | 1.39 | 844 | 5–15 | 50 | 2120 | 0.49 | 29.1 | | 2.35 | | | 18.1 | 180 |
| | | | 100 × 200 cylinders | 100 × 200 cylinders | | 1.39 | 844 | 5–15 | 75 | 2000 | 0.49 | 23.2 | | 1.94 | | | 16.7 | 214 |
| | | | 100 × 200 cylinders | 100 × 200 cylinders | | | | | 0 | 2300 | 0.45 | 37.2 | | 3.32 | | | 25.5 | 135 |
| | | | 100 × 200 cylinders | 100 × 200 cylinders | | 1.39 | 844 | 5–15 | 25 | 2260 | 0.45 | 33.8 | | 2.8 | | | 18.7 | 169 |
| | | | 100 × 200 cylinders | 100 × 200 cylinders | | 1.39 | 844 | 5–15 | 50 | 2160 | 0.45 | 31.8 | | 2.55 | | | 17.3 | 184 |
| | | | 100 × 200 cylinders | 100 × 200 cylinders | | 1.39 | 844 | 5–15 | 75 | 1940 | 0.45 | 24.9 | | 2.04 | | | 15.6 | 205 |
| Vol | 2009 | Choi et al. [12] | 100 × 200 cylinders | 100 × 200 cylinders | | | | | 0 | 2300 | 0.53 | 32.05 | | 3.26 | | | 23.45 | 100 |
| | | | 100 × 200 cylinders | 100 × 200 cylinders | | 1.39 | 844 | 5–15 | 25 | 2218.29 | 0.53 | 30.34 | | 2.62 | | | 22.63 | 153 |
| | | | 100 × 200 cylinders | 100 × 200 cylinders | | 1.39 | 844 | 5–15 | 50 | 2130.59 | 0.53 | 26.75 | | 2.24 | | | 21.19 | 199 |
| | | | 100 × 200 cylinders | 100 × 200 cylinders | | 1.39 | 844 | 5–15 | 75 | 2011.55 | 0.53 | 22.56 | | 2.07 | | | 18.83 | 223 |
| | | | 100 × 200 cylinders | 100 × 200 cylinders | | | | | 0 | 2300 | 0.49 | 36.1 | | 3.26 | | | 18.22 | 105 |
| | | | 100 × 200 cylinders | 100 × 200 cylinders | | 1.39 | 844 | 5–15 | 25 | 2228.19 | 0.49 | 34.77 | | 2.76 | | | 23.16 | 154 |
| | | | 100 × 200 cylinders | 100 × 200 cylinders | | 1.39 | 844 | 5–15 | 50 | 2117.39 | 0.49 | 29.82 | | 2.34 | | | 17.97 | 180 |
| | | | 100 × 200 cylinders | 100 × 200 cylinders | | 1.39 | 844 | 5–15 | 75 | 1997.53 | 0.49 | 24.33 | | 1.97 | | | 16.99 | 214 |
| | | | 100 × 200 cylinders | 100 × 200 cylinders | | | | | 0 | 2300 | 0.45 | 37.81 | | 3.31 | | | 25.43 | 135 |
| | | | 100 × 200 cylinders | 100 × 200 cylinders | | 1.39 | 844 | 5–15 | 25 | 2260.35 | 0.45 | 34.06 | | 2.72 | | | 22.34 | 169 |
| | | | 100 × 200 cylinders | 100 × 200 cylinders | | 1.39 | 844 | 5–15 | 50 | 2160.28 | 0.45 | 32.31 | | 2.53 | | | 17.23 | 184 |
| | | | 100 × 200 cylinders | 100 × 200 cylinders | | 1.39 | 844 | 5–15 | 75 | 1941.45 | 0.45 | 27.59 | | 2.08 | | | 15.89 | 205 |
| Vol | 2009 | Albano et al. [13] | 150 × 300 cylinders | 150 × 300 cylinders | ASTM C 78
[58] | | | | 0 | | 0.5 | 27.86 | | 2.79 | | 4.25 | 29.48 | 86.9 |
| | | | 150 × 300 cylinders | 150 × 300 cylinders | ASTM C 78 | | | 2.6 | 10 | | 0.5 | 22.81 | | 2.45 | | 4.58 | 22.33 | 64.7 |
| | | | 150 × 300 cylinders | 150 × 300 cylinders | ASTM C 78 | | | 2.6–11.4 | 10 | | 0.5 | 22.4 | | 2.51 | | 4.64 | 22.85 | 74.5 |
| | | | 150 × 300 cylinders | 150 × 300 cylinders | ASTM C 78 | | | 11.4 | 10 | | 0.5 | 22.04 | | 2.37 | | 3.68 | 21.1 | 69.4 |
| | | | 150 × 300 cylinders | 150 × 300 cylinders | ASTM C 78 | | | 2.6 | 20 | | 0.5 | 17.4 | | 1.89 | | 3.51 | 16.16 | 42.1 |
| | | | 150 × 300 cylinders | 150 × 300 cylinders | ASTM C 78 | | | 2.6–11.4 | 20 | | 0.5 | 18.31 | | 2.19 | | 4.11 | 16.1 | 49.5 |
| | | | 150 × 300 cylinders | 150 × 300 cylinders | ASTM C 78 | | | 11.4 | 20 | | 0.5 | 13.9 | | 1.91 | | 1.65 | 15.06 | 0.01 |
| | | | 150 × 300 cylinders | 150 × 300 cylinders | ASTM C 78 | | | | 0 | | 0.6 | 21.26 | | 2.33 | | 3.83 | 22.59 | 79.3 |
| | | | 150 × 300 cylinders | 150 × 300 cylinders | ASTM C 78 | | | 2.6 | 10 | | 0.6 | 16.68 | | 1.69 | | 4.04 | 18.18 | 40 |
| | | | 150 × 300 cylinders | 150 × 300 cylinders | ASTM C 78 | | | 2.6–11.4 | 10 | | 0.6 | 18.25 | | 2.17 | | 3.51 | 18.44 | 52.6 |
| | | | 150 × 300 cylinders | 150 × 300 cylinders | ASTM C 78 | | | 11.4 | 10 | | 0.6 | 13.95 | | 2.25 | | 3.44 | 20.64 | 30.3 |
| | | | 150 × 300 cylinders | 150 × 300 cylinders | ASTM C 78 | | | 2.6 | 20 | | 0.6 | 13.07 | | 1.45 | | 2.95 | 14.02 | 23 |
| | | | 150 × 300 cylinders | 150 × 300 cylinders | ASTM C 78 | | | 2.6–11.4 | 20 | | 0.6 | 12.75 | | 1.74 | | 2.79 | 15.97 | 20 |
| | | | 150 × 300 cylinders | 150 × 300 cylinders | ASTM C 78 | | | 11.4 | 20 | | 0.6 | 8.97 | | 1.49 | | 2.32 | 11.68 | 0.01 |
| Vol | 2013 | Rahmani et al. [14] | 100 × 200 cylinders | | | | | | 0 | | 0.42 | 42.12 | | | | | | |
| | | | 100 × 200 cylinders | | | 1.11 | 464 | <7 | 5 | | 0.42 | 44.27 | | | | | | |
| | | | 100 × 200 cylinders | | | 1.11 | 464 | <7 | 10 | | 0.42 | 41.94 | | | | | | |
| | | | 100 × 200 cylinders | | | 1.11 | 464 | <7 | 15 | | 0.42 | 38.75 | | | | | | |
| | | | 100 × 200 cylinders | | | | | | 0 | | 0.54 | 33.39 | | | | | | |
| | | | 100 × 200 cylinders | | | 1.11 | 464 | <7 | 5 | | 0.54 | 37.55 | | | | | | |
| | | | 100 × 200 cylinders | | | 1.11 | 464 | <7 | 10 | | 0.54 | 33.68 | | | | | | |
| | | | 100 × 200 cylinders | | | 1.11 | 464 | <7 | 15 | | 0.54 | 29.57 | | | | | | |
| | | | 150 × 300 cylinders | 150 × 300 cylinders | 100 × 100 × 500 | | | | 0 | 2281.58 | 0.42 | 38.71 | | 3.98 | | 6.27 | 36.38 | 70 |
| | | | 150 × 300 cylinders | 150 × 300 cylinders | 100 × 100 × 500 | 1.11 | 464 | <7 | 5 | 2258.6 | 0.42 | 42.14 | | 3.89 | | 6.55 | 33.8 | 60 |
| | | | 150 × 300 cylinders | 150 × 300 cylinders | 100 × 100 × 500 | 1.11 | 464 | <7 | 10 | 2238.85 | 0.42 | 39.71 | | 3.66 | | 5.92 | 31.45 | 50 |
| | | | 150 × 300 cylinders | 150 × 300 cylinders | 100 × 100 × 500 | 1.11 | 464 | <7 | 15 | 2209.43 | 0.42 | 36.73 | | 3.35 | | 5.4 | 28.61 | 40 |
| | | | 150 × 300 cylinders | 150 × 300 cylinders | 100 × 100 × 500 | | | | 0 | 2221.83 | 0.54 | 31.58 | | 3.76 | | 5.64 | 33.81 | 80 |
| | | | 150 × 300 cylinders | 150 × 300 cylinders | 100 × 100 × 500 | 1.11 | 464 | <7 | 5 | 2207.28 | 0.54 | 35.36 | | 3.55 | | 6.03 | 31.2 | 65 |
| | | | 150 × 300 cylinders | 150 × 300 cylinders | 100 × 100 × 500 | 1.11 | 464 | <7 | 10 | 2175.87 | 0.54 | 31.76 | | 3.25 | | 5.49 | 28.79 | 50 |
| | | | 150 × 300 cylinders | 150 × 300 cylinders | 100 × 100 × 500 | 1.11 | 464 | <7 | 15 | 2147.68 | 0.54 | 28.91 | | 2.98 | | 5.2 | 25.85 | 35 |
| | | | 50 cubes | | | | | | 0 | | 0.42 | 55.4 | 44.32 | | | | | |
| | | | 50 cubes | | | 1.11 | 464 | <7 | 5 | | 0.42 | 59.51 | 47.61 | | | | | |
| | | | 50 cubes | | | 1.11 | 464 | <7 | 10 | | 0.42 | 55.5 | 44.40 | | | | | |
| | | | 50 cubes | | | 1.11 | 464 | <7 | 15 | | 0.42 | 52.07 | 41.66 | | | | | |
| | | | 50 cubes | | | | | | 0 | | 0.54 | 46.17 | 36.94 | | | | | |
| | | | 50 cubes | | | 1.11 | 464 | <7 | 5 | | 0.54 | 49.8 | 39.84 | | | | | |
| | | | 50 cubes | | | 1.11 | 464 | <7 | 10 | | 0.54 | 45.88 | 36.70 | | | | | |
| | | | 50 cubes | | | 1.11 | 464 | <7 | 15 | | 0.54 | 42.09 | 33.67 | | | | | |
| | | | 100 cubes | | | | | | 0 | | 0.42 | 54.49 | 43.59 | | | | | |
| | | | 100 cubes | | | 1.11 | 464 | <7 | 5 | | 0.42 | 55.56 | 44.45 | | | | | |
| | | | 100 cubes | | | 1.11 | 464 | <7 | 10 | | 0.42 | 52.55 | 42.04 | | | | | |
| | | | 100 cubes | | | 1.11 | 464 | <7 | 15 | | 0.42 | 50.46 | 40.37 | | | | | |
| | | | 100 cubes | | | | | | 0 | | 0.54 | 41.85 | 33.48 | | | | | |
| | | | 100 cubes | | | 1.11 | 464 | <7 | 5 | | 0.54 | 48.01 | 38.41 | | | | | |
| | | | 100 cubes | | | 1.11 | 464 | <7 | 10 | | 0.54 | 43.09 | 34.47 | | | | | |
| | | | 100 cubes | | | 1.11 | 464 | <7 | 15 | | 0.54 | 41.57 | 33.26 | | | | | |
| | | | 150 cubes | | | | | | 0 | | 0.42 | 52.2 | 41.76 | | | | | |
| | | | 150 cubes | | | 1.11 | 464 | <7 | 5 | | 0.42 | 53.24 | 42.59 | | | | | |
| | | | 150 cubes | | | 1.11 | 464 | <7 | 10 | | 0.42 | 50.52 | 40.42 | | | | | |
| | | | 150 cubes | | | 1.11 | 464 | <7 | 15 | | 0.42 | 46.59 | 37.27 | | | | | |
| | | | 150 cubes | | | | | | 0 | | 0.54 | 41.1 | 32.88 | | | | | |
| | | | 150 cubes | | | 1.11 | 464 | <7 | 5 | | 0.54 | 44.76 | 35.81 | | | | | |
| | | | 150 cubes | | | 1.11 | 464 | <7 | 10 | | 0.54 | 39.94 | 31.95 | | | | | |
| | | | 150 cubes | | | 1.11 | 464 | <7 | 15 | | 0.54 | 38.52 | 30.82 | | | | | |
| Vol | 2013 | Saikia and De Brito [15] | NP EN 12390-3
[59] | NP EN 12390-6
[60] | NP EN 12390-5
[61] | | | | 0 | 2409.41 | 0.53 | 43.07 | 34.46 | 3.49 | | 4.74 | | |
| | | | NP EN 12390-3 | NP EN 12390-6 | NP EN 12390-5 | 1.34 | 555 | 0.5–4 | 5 | 2347.61 | 0.57 | 36.11 | 28.89 | 3.07 | | 4.26 | | |
| | | | NP EN 12390-3 | NP EN 12390-6 | NP EN 12390-5 | 1.34 | 555 | 0.5–4 | 10 | 2304.07 | 0.6 | 30.79 | 24.63 | 2.83 | | 3.76 | | |
| | | | NP EN 12390-3 | NP EN 12390-6 | NP EN 12390-5 | 1.34 | 555 | 0.5–4 | 15 | 2231.04 | 0.64 | 25.33 | 20.26 | 2.28 | | 2.99 | | |
| | | | NP EN 12390-3 | NP EN 12390-6 | NP EN 12390-5 | 1.34 | 827 | 0.5–4 | 5 | 2364.47 | 0.53 | 37.82 | 30.26 | 3.21 | | 4.54 | | |
| | | | NP EN 12390-3 | NP EN 12390-6 | NP EN 12390-5 | 1.34 | 827 | 0.5–4 | 10 | 2339.89 | 0.52 | 36.86 | 29.49 | 3.13 | | 4.24 | | |
| | | | NP EN 12390-3 | NP EN 12390-6 | NP EN 12390-5 | 1.34 | 827 | 0.5–4 | 15 | 2304.07 | 0.52 | 33.41 | 26.73 | 2.87 | | 3.98 | | |
| Vol | 2013 | Juki et al. [16] | BS 1881-Part 116-83
[62] | BS 1881: Part 117
[63] | | | | | 0 | 2386.18 | 0.45 | 31.34 | 25.07 | 3.21 | | | 31.29 | |
| | | | BS 1881-Part 116-83 | BS 1881: Part 117 | | | | <5 | 25 | 2290.85 | 0.45 | 27.91 | 22.33 | 2.7 | | | 26.89 | |
| | | | BS 1881-Part 116-83 | BS 1881: Part 117 | | | | <5 | 50 | 2209.76 | 0.45 | 22.99 | 18.39 | 2.02 | | | 21.55 | |
| | | | BS 1881-Part 116-83 | BS 1881: Part 117 | | | | <5 | 75 | 2041.87 | 0.45 | 17.04 | 13.63 | 1.57 | | | 10.33 | |
| | | | BS 1881-Part 116-83 | BS 1881: Part 117 | | | | | 0 | 2371.95 | 0.55 | 26.76 | 21.41 | 3.52 | | | 30.87 | |
| | | | BS 1881-Part 116-83 | BS 1881: Part 117 | | | | <5 | 25 | 2315.04 | 0.55 | 25.39 | 20.31 | 2.98 | | | 18.71 | |
| | | | BS 1881-Part 116-83 | BS 1881: Part 117 | | | | <5 | 50 | 2249.59 | 0.55 | 20.36 | 16.29 | 2.38 | | | 16.12 | |
| | | | BS 1881-Part 116-83 | BS 1881: Part 117 | | | | <5 | 75 | 2232.52 | 0.55 | 15.78 | 12.62 | 2.02 | | | 10.07 | |
| | | | BS 1881-Part 116-83 | BS 1881: Part 117 | | | | | 0 | 2380.49 | 0.65 | 25.39 | 20.31 | 2.97 | | | 36.73 | |
| | | | BS 1881-Part 116-83 | BS 1881: Part 117 | | | | <5 | 25 | 2286.59 | 0.65 | 25.28 | 20.22 | 2.21 | | | 25.82 | |
| | | | BS 1881-Part 116-83 | BS 1881: Part 117 | | | | <5 | 50 | 2262.4 | 0.65 | 19.22 | 15.38 | 1.42 | | | 18.68 | |
| | | | BS 1881-Part 116-83 | BS 1881: Part 117 | | | | <5 | 75 | 2185.57 | 0.65 | 15.56 | 12.45 | 1.19 | | | 13.65 | |
| Vol | 2013 | Juki et al. [17] | 100 × 200 cylinders | 100 × 200 cylinders | 100 × 100 × 500 | | | | 0 | 2372.59 | 0.55 | 26.69 | | 3.52 | | 4.99 | 30 | |
| | | | 100 × 200 cylinders | 100 × 200 cylinders | 100 × 100 × 500 | | | <5 | 25 | 2343.22 | 0.55 | 22.83 | | 2.99 | | 4.75 | 23 | |
| | | | 100 × 200 cylinders | 100 × 200 cylinders | 100 × 100 × 500 | | | <5 | 50 | 2322.79 | 0.55 | 20.37 | | 2.38 | | 3.8 | 15 | |
| | | | 100 × 200 cylinders | 100 × 200 cylinders | 100 × 100 × 500 | | | <5 | 75 | 2231.94 | 0.55 | 15.2 | | 2.02 | | 2.61 | 9 | |
| Vol | 2014 | Saikia and De Brito [18] | 150 cubes | 100 × 150 cylinders | 150 × 150 × 600 | | | | 0 | 2387 | 0.53 | 42.96 | 34.37 | 3.45 | | 4.72 | 39.79 | 127 |
| | | | 150 cubes | 100 × 150 cylinders | 150 × 150 × 600 | 1.32 | 555 | 0.5–4 | 5 | 2336 | 0.57 | 36.2 | 28.96 | 3.12 | | 4.36 | 35.1 | 122 |
| | | | 150 cubes | 100 × 150 cylinders | 150 × 150 × 600 | 1.32 | 555 | 0.5–4 | 10 | 2290 | 0.6 | 30.92 | 24.74 | 2.66 | | 3.75 | 29.9 | 122 |
| | | | 150 cubes | 100 × 150 cylinders | 150 × 150 × 600 | 1.32 | 555 | 0.5–4 | 15 | 2243 | 0.64 | 25.53 | 20.42 | 2.22 | | 2.98 | 24.69 | 120 |
| | | | 150 cubes | 100 × 150 cylinders | 150 × 150 × 600 | 1.36 | 827 | 0.5–4 | 5 | 2347 | 0.53 | 37.78 | 30.22 | 3.29 | | 4.51 | 36.15 | 122 |
| | | | 150 cubes | 100 × 150 cylinders | 150 × 150 × 600 | 1.36 | 827 | 0.5–4 | 10 | 2297 | 0.52 | 36.9 | 29.52 | 3.16 | | 4.24 | 35.94 | 122 |
| | | | 150 cubes | 100 × 150 cylinders | 150 × 150 × 600 | 1.36 | 827 | 0.5–4 | 15 | 2254 | 0.52 | 33.19 | 26.55 | 2.81 | | 3.97 | 31.04 | 132 |
| Vol | 2017 | Mohammed [19] | 100 × 200 cylinders | | | | | | 0 | 2375 | 0.5 | 33.07 | | | | | | |
| | | | 100 × 200 cylinders | | | | 353 | 3–12 | 5 | 2362 | 0.5 | 27.05 | | | | | | |
| | | | 100 × 200 cylinders | | | | 353 | 3–12 | 10 | 2407 | 0.5 | 31.82 | | | | | | |
| | | | 100 × 200 cylinders | | | | 353 | 3–12 | 15 | 2348 | 0.5 | 32.57 | | | | | | |
| | | | 100 × 200 cylinders | | | | | | 0 | 2350 | 0.5 | 31.36 | | | | | | |
| | | | 100 × 200 cylinders | | | | 353 | 3–12 | 5 | 2303 | 0.5 | 23.81 | | | | | | |
| | | | 100 × 200 cylinders | | | | 353 | 3–12 | 10 | 2317 | 0.5 | 24.92 | | | | | | |
| | | | 100 × 200 cylinders | | | | 353 | 3–12 | 15 | 2314 | 0.5 | 23.66 | | | | | | |
| Vol | 2018 | Al-Hadithi and Al-Ani [20] | | | | | | | 0 | 2350.51 | 0.29 | 69 | 55.20 | | | | 43.06 | |
| | | | | | | 1.29 | 447 | <4.75 | 2.5 | 2339.36 | 0.29 | 60.38 | 48.30 | | | | 40.81 | |
| | | | | | | 1.29 | 447 | <4.75 | 5 | 2331.92 | 0.29 | 56.93 | 45.54 | | | | 40.76 | |
| | | | | | | 1.29 | 447 | <4.75 | 7.5 | 2313.35 | 0.29 | 50.35 | 40.28 | | | | 40.52 | |
| Vol | 2022 | Kangavar et al. [21] | 100 × 200 cylinders | 100 × 200 cylinders | 150 × 150 × 700 | | | | 0 | 2417 | 0.45 | 34.23 | | 3.96 | | 3.96 | 24.41 | 98 |
| | | | 100 × 200 cylinders | 100 × 200 cylinders | 150 × 150 × 700 | 1.34 | 1380 | <4.75 | 10 | 2340 | 0.45 | 37.34 | | 4.3 | | 4.33 | 24.13 | 98 |
| | | | 100 × 200 cylinders | 100 × 200 cylinders | 150 × 150 × 700 | 1.34 | 1380 | <4.75 | 30 | 2125 | 0.45 | 33.78 | | 3.81 | | 3.99 | 20.25 | 94 |
| | | | 100 × 200 cylinders | 100 × 200 cylinders | 150 × 150 × 700 | 1.34 | 1380 | <4.75 | 50 | 1845 | 0.45 | 25.16 | | 3.31 | | 3.47 | 18.93 | 90 |
| Vol | 2022 | Babafemi et al. [22] | 100 cubes | 100 cubes | | | | | 0 | | 0.5 | 36.37 | 29.10 | 4.01 | 3.21 | | | 100 |
| | | | 100 cubes | 100 cubes | | 1.47 | | <3 | 5 | | 0.5 | 37.37 | 29.90 | 3.81 | 3.05 | | | 100 |
| | | | 100 cubes | 100 cubes | | 1.47 | | <3 | 10 | | 0.5 | 37.27 | 29.82 | 3.63 | 2.90 | | | 124 |
| | | | 100 cubes | 100 cubes | | 1.47 | | <3 | 15 | | 0.5 | 35 | 28.00 | 3.57 | 2.86 | | | 135 |
| Vol | 2022 | Hama [23] | 150 × 300 cylinders | | | | | | 0 | 2428 | 0.42 | 35.76 | | | | | 27.4 | 96 |
| | | | 150 × 300 cylinders | | | 1.36 | | <4.75 | 10 | 2392 | 0.42 | 36.8 | | | | | 24.05 | 94 |
| | | | 150 × 300 cylinders | | | 1.36 | | <4.75 | 15 | 2374 | 0.42 | 34.78 | | | | | 22.31 | 92 |
| | | | 150 × 300 cylinders | | | 1.36 | | <4.75 | 20 | 2358 | 0.42 | 28.48 | | | | | 21.82 | 86 |
| | | | 150 × 300 cylinders | | | 1.36 | | <4.75 | 25 | 2340 | 0.42 | 25.63 | | | | | 20.42 | 80 |
| Vol | 2023 | Xiong et al. [24] | 150 × 300 cylinders | | | | | | 0 | 2454 | 0.44 | 53.2 | | | | | 30.15 | 235 |
| | | | 150 × 300 cylinders | | | | | ≤1.6 | 5 | 2424 | 0.44 | 50.2 | | | | | 24.93 | 215 |
| | | | 150 × 300 cylinders | | | | | ≤1.6 | 10 | 2420 | 0.44 | 46.9 | | | | | 26.9 | 200 |
| | | | 150 × 300 cylinders | | | | | ≤1.6 | 20 | 2412 | 0.44 | 43.7 | | | | | 24.94 | 205 |
| | | | 150 × 300 cylinders | | | | | ≤1.6 | 30 | 2389 | 0.44 | 40.8 | | | | | 21.87 | 180 |
| Vol | 2024 | Sancak and Ozyurt | 100 × 200 cylinders | 100 × 200 cylinders | 100 × 100 × 400 | | | | 0 | 2307.88 | 0.5 | 26.91 | | 2.46 | | 3.37 | 30.57 | 48 |
| | | | 100 × 200 cylinders | 100 × 200 cylinders | 100 × 100 × 400 | 1.39 | 1280 | 2 | 10 | 2271.66 | 0.5 | 25.11 | | 2.35 | | 3.23 | 27.22 | 45 |
| | | | 100 × 200 cylinders | 100 × 200 cylinders | 100 × 100 × 400 | 1.39 | 1280 | 2 | 20 | 2234.49 | 0.5 | 23.31 | | 2.24 | | 3.1 | 25.06 | 40 |
| | | | 100 × 200 cylinders | 100 × 200 cylinders | 100 × 100 × 400 | 1.39 | 1280 | 2 | 30 | 2177.94 | 0.5 | 21.8 | | 2.16 | | 2.3 | 21.32 | 38 |
| Wei | 2008 | Ismail and AL-Hashmi [25] | 150 cubes | | ASTM C293
[64] | | | | 0 | 2399.02 | 0.53 | 44 | 35.20 | | | 5.88 | | 75 |
| | | | 150 cubes | | ASTM C293 | | 368.7 | 0.5–12 | 10 | 2307.11 | 0.53 | 33.23 | 26.58 | | | 4.59 | | 24 |
| | | | 150 cubes | | ASTM C293 | | 368.7 | 0.5–12 | 15 | 2244.68 | 0.53 | 29.64 | 23.71 | | | 4.26 | | 9 |
| | | | 150 cubes | | ASTM C293 | | 368.7 | 0.5–12 | 20 | 2223.87 | 0.53 | 29.63 | 23.70 | | | 4.06 | | 3 |
| Wei | 2010 | Frigione et al. [26] | 150 cubes | 150 × 300 cylinders | | | | | 0 | | 0.45 | 68 | 54.40 | 6.1 | | | | |
| | | | 150 cubes | 150 × 300 cylinders | | 1.32 | 660 | <2.36 | 5 | | 0.45 | 67.5 | 54.00 | 6 | | | | |
| | | | 150 cubes | 150 × 300 cylinders | | 1.32 | 660 | <2.36 | 0 | | 0.55 | 41.5 | 33.20 | 4.2 | | | | |
| | | | 150 cubes | 150 × 300 cylinders | | 1.32 | 660 | <2.36 | 5 | | 0.55 | 40.7 | 32.56 | 4.1 | | | | |
| | | | 150 cubes | 150 × 300 cylinders | | | | | 0 | | 0.45 | 70 | 56.00 | 6.3 | | | | |
| | | | 150 cubes | 150 × 300 cylinders | | 1.32 | 660 | <2.36 | 5 | | 0.45 | 69.7 | 55.76 | 6.3 | | | | |
| | | | 150 cubes | 150 × 300 cylinders | | 1.32 | 660 | <2.36 | 0 | | 0.55 | 44 | 35.20 | 4.7 | | | | |
| | | | 150 cubes | 150 × 300 cylinders | | 1.32 | 660 | <2.36 | 5 | | 0.55 | 43.2 | 34.56 | 4.6 | | | | |
| Wei | 2011 | Galvao et al. [27] | NBR 5739/07
[65] | NBR 7222/94
[66] | | | | | 0 | | 0.45 | 34.13 | | 3.35 | | | | |
| | | | NBR 5739/07 | NBR 7222/94 | | 1.32 | | 1.2–12.5 | 0.5 | | 0.45 | 37.67 | | 3.75 | | | | |
| | | | NBR 5739/07 | NBR 7222/94 | | 1.32 | | 1.2–12.5 | 1 | | 0.45 | 39.52 | | 3.6 | | | | |
| | | | NBR 5739/07 | NBR 7222/94 | | 1.32 | | 1.2–12.5 | 2.5 | | 0.45 | 35.98 | | 3.69 | | | | |
| | | | NBR 5739/07 | NBR 7222/94 | | 1.32 | | 1.2–12.5 | 5 | | 0.45 | 34.13 | | 3.3 | | | | |
| | | | NBR 5739/07 | NBR 7222/94 | | 1.32 | | 1.2–12.5 | 7.5 | | 0.45 | 28.9 | | 3.49 | | | | |
| Wei | 2016 | Azhdarpour et al. [28] | 150 × 300 cylinders | 150 × 300 cylinders | 130 × 150 × 450 | | | | 0 | 2158.05 | 0.5 | 35 | | 2.5 | | 4.4 | 48.87 | |
| | | | 150 × 300 cylinders | 150 × 300 cylinders | 130 × 150 × 450 | 1.38 | | 0.05–4.9 | 5 | 2119.02 | 0.5 | 51 | | 3.1 | | 6.1 | | |
| | | | 150 × 300 cylinders | 150 × 300 cylinders | 130 × 150 × 450 | 1.38 | | 0.05–4.9 | 10 | 2087.93 | 0.5 | 38 | | 3.3 | | 4.9 | 27.06 | |
| | | | 150 × 300 cylinders | 150 × 300 cylinders | 130 × 150 × 450 | 1.38 | | 0.05–4.9 | 15 | 2050.12 | 0.5 | 31 | | 2.9 | | 4.8 | | |
| | | | 150 × 300 cylinders | 150 × 300 cylinders | 130 × 150 × 450 | 1.38 | | 0.05–4.9 | 20 | 2014.15 | 0.5 | 29 | | 2.8 | | 4.3 | 16.98 | |
| | | | 150 × 300 cylinders | 150 × 300 cylinders | 130 × 150 × 450 | 1.38 | | 0.05–4.9 | 25 | 1979.39 | 0.5 | 22 | | 2.2 | | 4.1 | | |
| | | | 150 × 300 cylinders | 150 × 300 cylinders | 130 × 150 × 450 | 1.38 | | 0.05–4.9 | 30 | 1935.49 | 0.5 | 19 | | 1.6 | | 3 | 9.44 | |
| Wei | 2016 | Norhana et al. [29] | 100 cubes | | 100 × 100 × 500 | | | | 0 | | 0.5 | 44 | 35.20 | | | 5.6 | | |
| | | | 100 cubes | | 100 × 100 × 500 | | | <5 | 10 | | 0.5 | 35 | 28.00 | | | 4.7 | | |
| | | | 100 cubes | | 100 × 100 × 500 | | | <5 | 20 | | 0.5 | 30 | 24.00 | | | 4.5 | | |
| | | | 100 cubes | | 100 × 100 × 500 | | | <5 | 30 | | 0.5 | 24 | 19.20 | | | 4.3 | | |
| Wei | 2018 | Saxena et al. [30] | 100 cubes | | | | | | 0 | | 0.45 | 26.7 | 21.36 | | | | | |
| | | | 100 cubes | | | | | <4.75 | 5 | | 0.45 | 26.11 | 20.89 | | | | | |
| | | | 100 cubes | | | | | <4.75 | 10 | | 0.45 | 25.61 | 20.49 | | | | | |
| | | | 100 cubes | | | | | <4.75 | 15 | | 0.45 | 13.89 | 11.11 | | | | | |
| | | | 100 cubes | | | | | <4.75 | 20 | | 0.45 | 5.4 | 4.32 | | | | | |
| Wei | 2020 | Almeshal et al. [31] | BS 1881
[67] | ASTM C 496
[68] | ASTM C 293
[64] | | | | 0 | 2394.91 | 0.54 | 35.6 | 28.48 | 3.11 | | 7.64 | | 89 |
| | | | BS 1881 | ASTM C 496 | ASTM C 293 | | 1410 | 0.075–4 | 10 | 2369.21 | 0.54 | 35.2 | 28.16 | 2.78 | | 7.46 | | 78 |
| | | | BS 1881 | ASTM C 496 | ASTM C 293 | | 1410 | 0.075–4 | 20 | 2297.42 | 0.54 | 34.11 | 27.29 | 2.51 | | 6.83 | | 62 |
| | | | BS 1881 | ASTM C 496 | ASTM C 293 | | 1410 | 0.075–4 | 30 | 2211.46 | 0.54 | 24.58 | 19.66 | 2.01 | | 5.92 | | 44 |
| | | | BS 1881 | ASTM C 496 | ASTM C 293 | | 1410 | 0.075–4 | 40 | 1992.73 | 0.54 | 14.25 | 11.40 | 1.74 | | 3.21 | | 23 |
| | | | BS 1881 | ASTM C 496 | ASTM C 293 | | 1410 | 0.075–4 | 50 | 1806.12 | 0.54 | 3.36 | 2.69 | 0.45 | | 1.21 | | 10 |
| Wei | 2021 | Bamigboye et al. [32] | ASTM. C39/C39M-20
[69] | 100 × 200 cylinders | | | | | 0 | | 0.55 | 31 | | 3.2 | | | | 30 |
| | | | ASTM. C39/C39M-20 | 100 × 200 cylinders | | | | 0.075–5 | 10 | | 0.55 | 22.3 | | 2.81 | | | | 45 |
| | | | ASTM. C39/C39M-20 | 100 × 200 cylinders | | | | 0.075–5 | 20 | | 0.55 | 22 | | 2.57 | | | | 60 |
| | | | ASTM. C39/C39M-20 | 100 × 200 cylinders | | | | 0.075–5 | 30 | | 0.55 | 21.7 | | 2.45 | | | | 100 |
| | | | ASTM. C39/C39M-20 | 100 × 200 cylinders | | | | 0.075–5 | 40 | | 0.55 | 20.7 | | 2.41 | | | | 105 |
| | | | ASTM. C39/C39M-20 | 100 × 200 cylinders | | | | 0.075–5 | 100 | | 0.55 | 16.3 | | 2.02 | | | | 40 |
| Wei | 2021 | Dawood et al. [33] | 150 cubes | 100 × 200 cylinders | 100 × 100 × 500 | 1.38 | | 0.6–3 | 0 | 2361.39 | 0.41 | 34.79 | 27.83 | 2.41 | | 4.54 | 27.14 | 160 |
| | | | 150 cubes | 100 × 200 cylinders | 100 × 100 × 500 | 1.38 | | 0.6–3 | 5 | 2355.57 | 0.41 | 46.79 | 37.43 | 2.6 | | 5.76 | 24.47 | 140 |
| | | | 150 cubes | 100 × 200 cylinders | 100 × 100 × 500 | 1.38 | | 0.6–3 | 7.5 | 2303.61 | 0.41 | 49.58 | 39.66 | 3.06 | | 5.88 | 22.65 | 130 |
| | | | 150 cubes | 100 × 200 cylinders | 100 × 100 × 500 | 1.38 | | 0.6–3 | 10 | 2296.58 | 0.41 | 44.92 | 35.94 | 2.86 | | 5.71 | 22.62 | 120 |
| | | | 150 cubes | 100 × 200 cylinders | 100 × 100 × 500 | 1.38 | | 0.6–3 | 12.5 | 2278.16 | 0.41 | 43.3 | 34.64 | 2.86 | | 5.33 | 22.39 | 100 |
| | | | 150 cubes | 100 × 200 cylinders | 100 × 100 × 500 | 1.38 | | 0.6–3 | 15 | 2223.04 | 0.41 | 35.62 | 28.50 | 2.43 | | 4.53 | 22.06 | 80 |
| | | | 150 cubes | 100 × 200 cylinders | 100 × 100 × 500 | 1.38 | | 0.6–3 | 20 | 2193.79 | 0.41 | 32.75 | 26.20 | 2.32 | | 4.33 | 21.08 | 60 |
| Wei | 2021 | Tayeh et al. [34] | 100 cubes | 150 × 300 cylinders | 100 × 100 × 500 | 0.9–0.96 | | 0.075–2 | 0 | 2448.34 | 0.51 | 39.76 | 31.81 | 5.56 | | 7.96 | | 103 |
| | | | 100 cubes | 150 × 300 cylinders | 100 × 100 × 500 | 0.9–0.96 | | 0.075–2 | 10 | 2442.22 | 0.51 | 39.01 | 31.21 | 5.25 | | 7.65 | | 138 |
| | | | 100 cubes | 150 × 300 cylinders | 100 × 100 × 500 | 0.9–0.96 | | 0.075–2 | 20 | 2400.41 | 0.51 | 33.59 | 26.87 | 5.13 | | 7.43 | | 175 |
| | | | 100 cubes | 150 × 300 cylinders | 100 × 100 × 500 | 0.9–0.96 | | 0.075–2 | 30 | 2396.33 | 0.51 | 33.21 | 26.57 | 4.25 | | 7.33 | | 233 |
| | | | 100 cubes | 150 × 300 cylinders | 100 × 100 × 500 | 0.9–0.96 | | 0.075–2 | 40 | 2343.31 | 0.51 | 31.15 | 24.92 | 4.17 | | 6.77 | | 299 |
| Wei | 2022 | Harihanandh and Karthik [35] | 150 cubes | | 100 × 100 × 500 | | | | 0 | | 0.45 | 37.8 | 30.24 | 4.27 | | 3.75 | | 120 |
| | | | 150 cubes | | 100 × 100 × 500 | | | 1–2 | 5 | | 0.45 | 39.99 | 31.99 | 4.46 | | 3.94 | | 110 |
| | | | 150 cubes | | 100 × 100 × 500 | | | 1–2 | 10 | | 0.45 | 38.25 | 30.60 | 4.33 | | 3.78 | | 70 |
| | | | 150 cubes | | 100 × 100 × 500 | | | 1–2 | 15 | | 0.45 | 24.225 | 19.38 | 3.63 | | 2.51 | | 20 |
| | | | 150 cubes | | 100 × 100 × 500 | | | 1–2 | 20 | | 0.45 | 19.55 | 15.64 | 2.92 | | 2.08 | | 0 |
| | | | 150 cubes | | 100 × 100 × 500 | | | 1–2 | 25 | | 0.45 | 14.02 | 11.22 | 2.56 | | 1.58 | | 0 |
Table 15.
Derived equations for compressive strength and proposed developed models.
Table 15.
Derived equations for compressive strength and proposed developed models.
| Type of Data | Type of Curve | Proposed Model | Data Point | R2 | MABE | MAPE |
|---|
| Experimental Data of This Study | Exponential | | 3 | 0.999 | 0.045 | 0.194 |
| Linear | | 3 | 0.997 | 0.097 | 0.423 |
| Volume Substitution Data | Exponential | | 110 | 0.805 | 3.314 | 13.396 |
| Linear | | 110 | 0.802 | 3.318 | 13.519 |
| Weight Substitution Data | Exponential | | 50 | 0.682 | 5.277 | 32.116 |
| Linear | | 50 | 0.619 | 5.274 | 35.261 |
| All Data | Exponential | | 160 | 0.741 | 4.795 | 22.352 |
| Linear | | 160 | 0.733 | 4.728 | 22.814 |
Table 16.
Suggested models and performances for compressive strength.
Table 16.
Suggested models and performances for compressive strength.
| Year | Reference | Data Point | R2 | MABE | MAPE |
|---|
| 2013 | Nibudey et al. [36] * | | | | |
| | | 160 | 0.310 | 12.850 | 64.509 |
| 2013 | Saikia and De Brito [15] | | | | |
| | | 95 | 0.256 | 11.515 | 47.258 |
| 2017 | Mohammed [19] | | | | |
| | I. | 160 | 0.716 | 5.762 | 24.549 |
| | II. | 95 | 0.613 | 5.509 | 24.018 |
| 2021 | Bamigboye et al. [32] | | | | |
| | | 160 | 0.257 | 13.785 | 41.693 |
| 2022 | Bamigboye et al. [37] ** | | | | |
| | I.
| 160 | 0.257 | 15.724 | 46.976 |
| | II.
| 160 | 0.326 | 15.359 | 46.312 |
| 2022 | Meena and Ramana [38] | | | | |
| | | 95 | 0.612 | 5.558 | 16.651 |
| | if | | | | |
| 2023 | Aocharoen and Chotickai [39] ** | | | | |
| | | 160 | 0.269 | 24.541 | 108.874 |
| 2024 | Sancak and Ozyurt (this study) | | | | |
| | I.
| 160 | 0.741 | 4.795 | 22.352 |
| | II.
| 160 | 0.733 | 4.728 | 22.814 |
Table 17.
Derived equations and proposed developed models for the connection between tensile strength and PET substitution percentage.
Table 17.
Derived equations and proposed developed models for the connection between tensile strength and PET substitution percentage.
| Type of Data | Type of Curve | Proposed Model | Data Point | R2 | MABE | MAPE |
|---|
| Experimental Data of This Study | Exponential | | 3 | 0.994 | 0.007 | 0.312 |
| Linear | | 3 | 0.992 | 0.010 | 0.447 |
| Volume Substitution Data | Exponential | | 69 | 0.776 | 0.222 | 9.968 |
| Linear | | 69 | 0.765 | 0.239 | 10.771 |
| Weight Substitution Data | Exponential | | 40 | 0.840 | 0.407 | 20.755 |
| Linear | | 40 | 0.812 | 0.396 | 21.893 |
| All Data | Exponential | | 109 | 0.823 | 0.290 | 14.275 |
| Linear | | 109 | 0.811 | 0.296 | 14.901 |
Table 18.
Suggested models and their performances for the connection between tensile strength and PET substitution percentage.
Table 18.
Suggested models and their performances for the connection between tensile strength and PET substitution percentage.
| Year | Reference | Data Point | R2 | MABE | MAPE |
|---|
| 2013 | Nibudey et al. [36] * | | | | |
| | | 109 | 0.293 | 1.092 | 52.831 |
| 2021 | Bamigboye et al. [32] | | | | |
| | | 109 | 0.255 | 0.842 | 28.760 |
| 2022 | Bamigboye et al. [37] ** | | | | |
| | I.
| 109 | 0.255 | 1.084 | 36.799 |
| | II.
| 109 | 0.301 | 1.051 | 35.657 |
| 2022 | Meena and Ramana [38] | | | | |
| | | 52 | 0.809 | 0.568 | 17.698 |
| | if | | | | |
| 2024 | Sancak and Ozyurt (this study) | | | | |
| | I.
| 109 | 0.823 | 0.290 | 14.275 |
| | II.
| 109 | 0.811 | 0.296 | 14.901 |
Table 19.
Derived equations and proposed developed models for the connection between tensile strength and compressive strength.
Table 19.
Derived equations and proposed developed models for the connection between tensile strength and compressive strength.
| Type of Data | Type of Curve | Proposed Model | Data Point | R2 | MABE | MAPE |
|---|
| Experimental Data of This Study | Power | | 3 | 0.998 | 0.004 | 0.162 |
| Linear | | 3 | 0.998 | 0.003 | 0.138 |
| Volume Substitution Data | Power | | 69 | 0.665 | 0.303 | 12.327 |
| Linear | | 69 | 0.672 | 0.295 | 12.120 |
| Weight Substitution Data | Power | | 40 | 0.463 | 0.704 | 21.796 |
| Linear | | 40 | 0.317 | 1.559 | 60.953 |
| All Data | Power | | 109 | 0.540 | 0.441 | 15.297 |
| Linear | | 109 | 0.545 | 0.444 | 16.333 |
Table 20.
Suggested models and their performances for the connection between tensile strength and compressive strength.
Table 20.
Suggested models and their performances for the connection between tensile strength and compressive strength.
| Year | Reference | Data Point | R2 | MABE | MAPE |
|---|
| 2013 | Nibudey et al. [36] * | | | | |
| | | 109 | 0.535 | 0.839 | 32.306 |
| 2013 | Juki et al. [17] | | | | |
| | | 109 | 0.522 | 0.670 | 27.486 |
| 2013 | Saikia and De Brito [15] | | | | |
| | | 109 | 0.535 | 0.665 | 23.161 |
| 2017 | Mohammed [40] | | | | |
| | I.
| 109 | 0.535 | 0.471 | 17.639 |
| | II.
| 109 | 0.532 | 0.458 | 16.554 |
| 2020 | Almeshal et al. [31] | | | | |
| | | 109 | 0.532 | 0.446 | 16.472 |
| 2021 | Tayeh [34] | | | | |
| | | 109 | 0.038 | 5.678 | 326.375 |
| 2021 | Bamigboye et al. [32] | | | | |
| | | 109 | 0.535 | 0.478 | 16.737 |
| 2022 | Bamigboye et al. [37] ** | | | | |
| | | 109 | 0.535 | 0.488 | 16.892 |
| 2024 | Sancak and Ozyurt (this study) | | | | |
| | I.
| 109 | 0.540 | 0.441 | 15.297 |
| | II.
| 109 | 0.545 | 0.444 | 16.333 |
Table 21.
Derived equations and proposed developed models for the connection between flexural strength and PET substitution percentage.
Table 21.
Derived equations and proposed developed models for the connection between flexural strength and PET substitution percentage.
| Type of Data | Type of Curve | Proposed Model | Data Point | R2 | MABE | MAPE |
|---|
| Experimental Data of This Study | Exponential | | 3 | 0.996 | 0.010 | 0.321 |
| Linear | | 3 | 0.994 | 0.013 | 0.430 |
| Volume Substitution Data | Exponential | | 39 | 0.656 | 0.451 | 13.933 |
| Linear | | 39 | 0.650 | 0.457 | 14.289 |
| Weight Substitution Data | Exponential | | 32 | 0.607 | 1.058 | 27.280 |
| Linear | | 32 | 0.578 | 0.936 | 27.362 |
| All Data | Exponential | | 71 | 0.607 | 0.700 | 20.542 |
| Linear | | 71 | 0.593 | 0.670 | 20.980 |
Table 22.
Derived equations and proposed developed models for the connection between flexural strength and compressive strength.
Table 22.
Derived equations and proposed developed models for the connection between flexural strength and compressive strength.
| Type of Data | Type of Curve | Proposed Model | Data Point | R2 | MABE | MAPE |
|---|
| Experimental Data of This Study | Power | | 3 | 0.999 | 0.003 | 0.099 |
| Linear | | 3 | 0.999 | 0.002 | 0.064 |
| Volume Substitution Data | Power | | 39 | 0.660 | 0.500 | 13.507 |
| Linear | | 39 | 0.671 | 0.484 | 13.195 |
| Weight Substitution Data | Power | | 32 | 0.411 | 0.958 | 20.972 |
| Linear | | 32 | 0.376 | 1.025 | 24.735 |
| All Data | Power | | 71 | 0.480 | 0.711 | 16.913 |
| Linear | | 71 | 0.465 | 0.724 | 17.889 |
Table 23.
Suggested models and their performances for the connection between flexural strength and compressive strength.
Table 23.
Suggested models and their performances for the connection between flexural strength and compressive strength.
| Year | Reference | Data Point | R2 | MABE | MAPE |
|---|
| 2013 | Juki et al. [17] | | | | |
| | | 71 | 0.471 | 0.769 | 18.906 |
| 2013 | Saikia and De Brito [15] | | | | |
| | | 71 | 0.457 | 1.131 | 23.352 |
| 2017 | Mohammed [40] | | | | |
| | I.
| 71 | 0.457 | 0.714 | 16.832 |
| | II.
| 71 | 0.468 | 0.736 | 17.165 |
| 2020 | Almeshal et al. [31] | | | | |
| | | 71 | 0.468 | 2.334 | 59.287 |
| 2021 | Tayeh [34] | | | | |
| | | 71 | 0.280 | 2.716 | 89.538 |
| 2022 | Alqahtani [41] * | | | | |
| | I.
| 71 | 0.473 | 0.762 | 16.857 |
| | II.
| 71 | 0.429 | 1.134 | 26.352 |
| 2024 | Sancak and Ozyurt (this study) | | | | |
| | I.
| 71 | 0.480 | 0.711 | 16.913 |
| | II.
| 71 | 0.465 | 0.724 | 17.889 |
Table 24.
Derived equations and proposed developed models for the connection between modulus of elasticity and PET substitution percentage.
Table 24.
Derived equations and proposed developed models for the connection between modulus of elasticity and PET substitution percentage.
| Type of Data | Type of Curve | Proposed Model | Data Point | R2 | MABE | MAPE |
|---|
| Experimental Data of This Study | Linear | | 3 | 0.977 | 0.367 | 1.488 |
| Volume Substitution Data | Linear | | 71 | 0.710 | 3.871 | 21.014 |
| Weight Substitution Data | Linear | | 9 | 0.654 | 5.024 | 26.330 |
| All Data | Linear | | 80 | 0.506 | 4.440 | 25.313 |
Table 25.
Suggested models and their performances for the connection between modulus of elasticity and PET substitution percentage.
Table 25.
Suggested models and their performances for the connection between modulus of elasticity and PET substitution percentage.
| Year | Reference | Data Point | R2 | MABE | MAPE |
|---|
| 2023 | Aocharoen and Chotickai [39] * | | | | |
| | | 80 | 0.449 | 14.167 | 82.097 |
| 2024 | Sancak and Ozyurt (this study) | | | | |
| | | 80 | 0.506 | 4.440 | 25.313 |
Table 26.
Derived equations and proposed developed models for the connection between modulus of elasticity and compressive strength.
Table 26.
Derived equations and proposed developed models for the connection between modulus of elasticity and compressive strength.
| Type of Data | Type of Curve | Proposed Model | Data Point | R2 | MABE | MAPE |
|---|
| Experimental Data of This Study | Power | | 3 | 0.953 | 0.500 | 2.033 |
| Linear | | 3 | 0.959 | 0.465 | 1.909 |
| Volume Substitution Data | Power | | 71 | 0.449 | 4.188 | 18.611 |
| Linear | | 71 | 0.442 | 4.295 | 19.761 |
| Weight Substitution Data | Power | | 9 | 0.718 | 2.171 | 11.215 |
| Linear | | 9 | 0.727 | 2.118 | 11.901 |
| All Data | Power | | 80 | 0.431 | 4.020 | 18.289 |
| Linear | | 80 | 0.426 | 4.136 | 19.424 |
Table 27.
Suggested models and their performances for the connection between modulus of elasticity and compressive strength.
Table 27.
Suggested models and their performances for the connection between modulus of elasticity and compressive strength.
| Year | Reference | Data Point | R2 | MABE | MAPE |
|---|
| 2010 | Hannawi et al. [42] | | | | |
| | | 80 | 0.426 | 4.464 | 20.814 |
| 2017 | Mohammed [40] | | | | |
| | I.
| 80 | 0.426 | 5.138 | 24.434 |
| | II.
| 80 | 0.417 | 7.282 | 33.516 |
| 2022 | Alqahtani [41] * | | | | |
| | | 80 | 0.297 | 15.101 | 69.878 |
| 2024 | Sancak and Ozyurt (this study) | | | | |
| | I.
| 80 | 0.431 | 4.020 | 18.289 |
| | II.
| 80 | 0.426 | 4.136 | 19.424 |
Table 28.
FRP-confined concrete sample results and FRP properties.
Table 28.
FRP-confined concrete sample results and FRP properties.
| Sample Name | D (cm) | H (cm) | (MPa) |
(%) | (MPa) | (GPa) |
(%) | (mm) | (MPa) |
(%) | (%) | |
|---|
| CS-PET-CFRP-10 | 10 | 20 | 25.11 | 0.2023 | 3000 | 230 | 1.3043 | 0.17 | 47.86 | 1.3819 | 0.8538 | 0.655 |
| CS-PET-GFRP-10 | 10 | 20 | 25.11 | 0.2023 | 1500 | 80 | 1.8750 | 0.15 | 38.66 | 1.4469 | 1.0028 | 0.535 |
Table 29.
Performance of FRP-confined concrete models for compressive strength.
Table 29.
Performance of FRP-confined concrete models for compressive strength.
| Year | Reference | Data Point | MABE | MAPE |
|---|
| 2004 | Ilki et al. [50] | | | |
| | | 2 | 10.196 | 23.774 |
| 2010 | Benzaid et al. [51] | | | |
| | | 2 | 8.158 | 19.098 |
| 2014 | Faustino et al. [52] | | | |
| | | 2 | 6.694 | 14.190 |
| 2019 | Pimanmas et al. [53] | | | |
| | | 2 | 3.949 | 8.264 |
| 2024 | Sancak and Ozyurt (this study) | | | |
| | | 2 | 3.220 | 7.906 |
Table 30.
Performance of FRP-confined concrete models for ultimate axial strain.
Table 30.
Performance of FRP-confined concrete models for ultimate axial strain.
| Year | Reference | Data Point | MABE | MAPE |
|---|
| 2004 | Ilki et al. [50] | | | |
| | | 2 | 0.771 | 55.216 |
| 2010 | Benzaid et al. [51] | | | |
| | | 2 | 0.732 | 51.495 |
| 2014 | Faustino et al. [52] | | | |
| | | 2 | 0.656 | 45.831 |
| 2019 | Pimanmas et al. [53] | | | |
| | | 2 | 0.613 | 43.065 |
| 2024 | Sancak and Ozyurt (this study) | | | |
| | | 2 | 0.493 | 34.518 |


