1. Introduction
Due to the fast-paced and high-intensity nature of modern life, health problems associated with sedentary behavior have become more prevalent [
1]. In response, recent studies have focused on the link between outdoor activities and overall health. For example, Mouratidis, through a literature review, delineates the relationship between urban design, outdoor activities, and quality of life, highlighting that urban planning directly impacts residents’ subjective well-being by improving the accessibility and comfort of facilities and services in public spaces [
2]. Research by Dong et al. and Feng et al. indicate that higher accessibility to facilities, public transportation, and green spaces is associated with greater satisfaction in daily commuting [
3,
4]. Gomes et al. demonstrated in their pilot feasibility study that outdoor activities have a positive impact on general health [
5]. Similarly, Coventry et al. conducted a systematic review and meta-analysis, concluding that nature-based outdoor activities significantly enhance both physical and mental health, as well as overall well-being [
6]. Cindrich et al. explored the connection between outdoor activity duration and mental health, showing that increased time outdoors can help reduce stress and promote health maintenance [
7]. However, Korpela et al. identified that specific features of outdoor spaces elicit diverse emotional responses, which can substantially influence the duration of outdoor activities [
8]. Consequently, designing OMS that cater to the emotional needs of users and encourage prolonged outdoor activity is of critical importance for public health and well-being.
OMSs, as a crucial component of urban environments, have increasingly drawn the attention of designers due to their capacity to significantly enhance citizens’ daily activities and leisure experiences [
9]. The optimized design of OMS not only affects the functionality and sustainability of public spaces but also directly impacts residents’ quality of life [
10]. Research by Pazhuhan et al. confirms that OMS, with its enhanced social sustainability, can influence urban livability and residents’ satisfaction [
11]. Mouratidis also affirms that the built environment can influence social life and interpersonal relationships [
12]. Therefore, in the fast-paced modern living environment, OMS has gradually become an important topic in urban design. Wang et al. defined OMSs as small-scale urban public spaces, characterized by a human-centered approach to spatial scale and form [
13]. McPhearson and Marshall described OMSs as small spaces embedded in linear infrastructures, such as roads and bridges, or located between buildings, on rooftops, along pathways, and near pedestrian routes [
14]. Whyte interpreted small and micro public spaces as “deliberately created urban open areas designed to facilitate human interaction and social activities” [
15]. Similarly, Song et al. defined OMSs as small open spaces, typically enclosed by buildings, vegetation, or other physical barriers, that provide recreational and leisure functions and are conveniently accessible to local residents, often serving secondary purposes like parking [
16]. Dong and Liu further emphasized OMS as small squares or public green spaces located along streets or within communities, that have a significant impact on residents’ daily lives [
17]. Building on these definitions, the present study focuses on micro public spaces within outdoor urban environments, characterized by features such as overhead shelter and seating, serving functional, comfort, and esthetic purposes [
18]. The design of OMS has traditionally been a designer-led process [
19]. Ni and Cattaneo employed semi-structured interviews, questionnaires, and other qualitative methods to identify the factors influencing users’ spatial activity intentions during the early stages of community micro-space construction [
20]. While these methods provide valuable insights into users’ emotional needs, they exhibit clear limitations in terms of quantifying these needs. Fors argued that purely qualitative analyses struggle to capture the specific details of users’ requirements with precision, potentially leading to a disconnect between the final design and the actual needs of users [
21]. Such discrepancies can result in underutilized outdoor spaces and wasted resources. Consequently, the challenge of accurately capturing users’ emotions and incorporating them into OMS design is becoming increasingly critical in the field of urban design.
To address the aforementioned challenges, this study introduces the concept of emotional design into the field of urban design. Kansei Engineering (KE), a key approach in emotional design, places emphasis on integrating emotional factors into the design process [
22]. Nagamachi defined KE as a methodology for translating users’ perceptions and intentions into specific design parameters, thereby enabling designers to better understand and meet users’ needs [
23]. KE has been successfully applied in various domains, including automotive design [
24], product design [
25], mobile terminals [
26], and service design [
27]. In recent years, KE has increasingly been applied to various fields of urban design, particularly in improving the functionality of spaces and enhancing user experiences through emotional analysis. In a study by Caratelli and Misiri, the semantic differential (SD) method was employed to map users’ perceptions to relevant semantic descriptions, integrating the KE framework to create user-centered public spaces. The results demonstrated that designs based on common emotional patterns among users significantly enhanced the satisfaction and well-being within community spaces [
28]. Similarly, Castilla et al. found that using KE to assess the relationship between lighting variables and users’ emotional responses effectively guided the optimization of classroom lighting, improving both spatial efficiency and the emotional atmosphere [
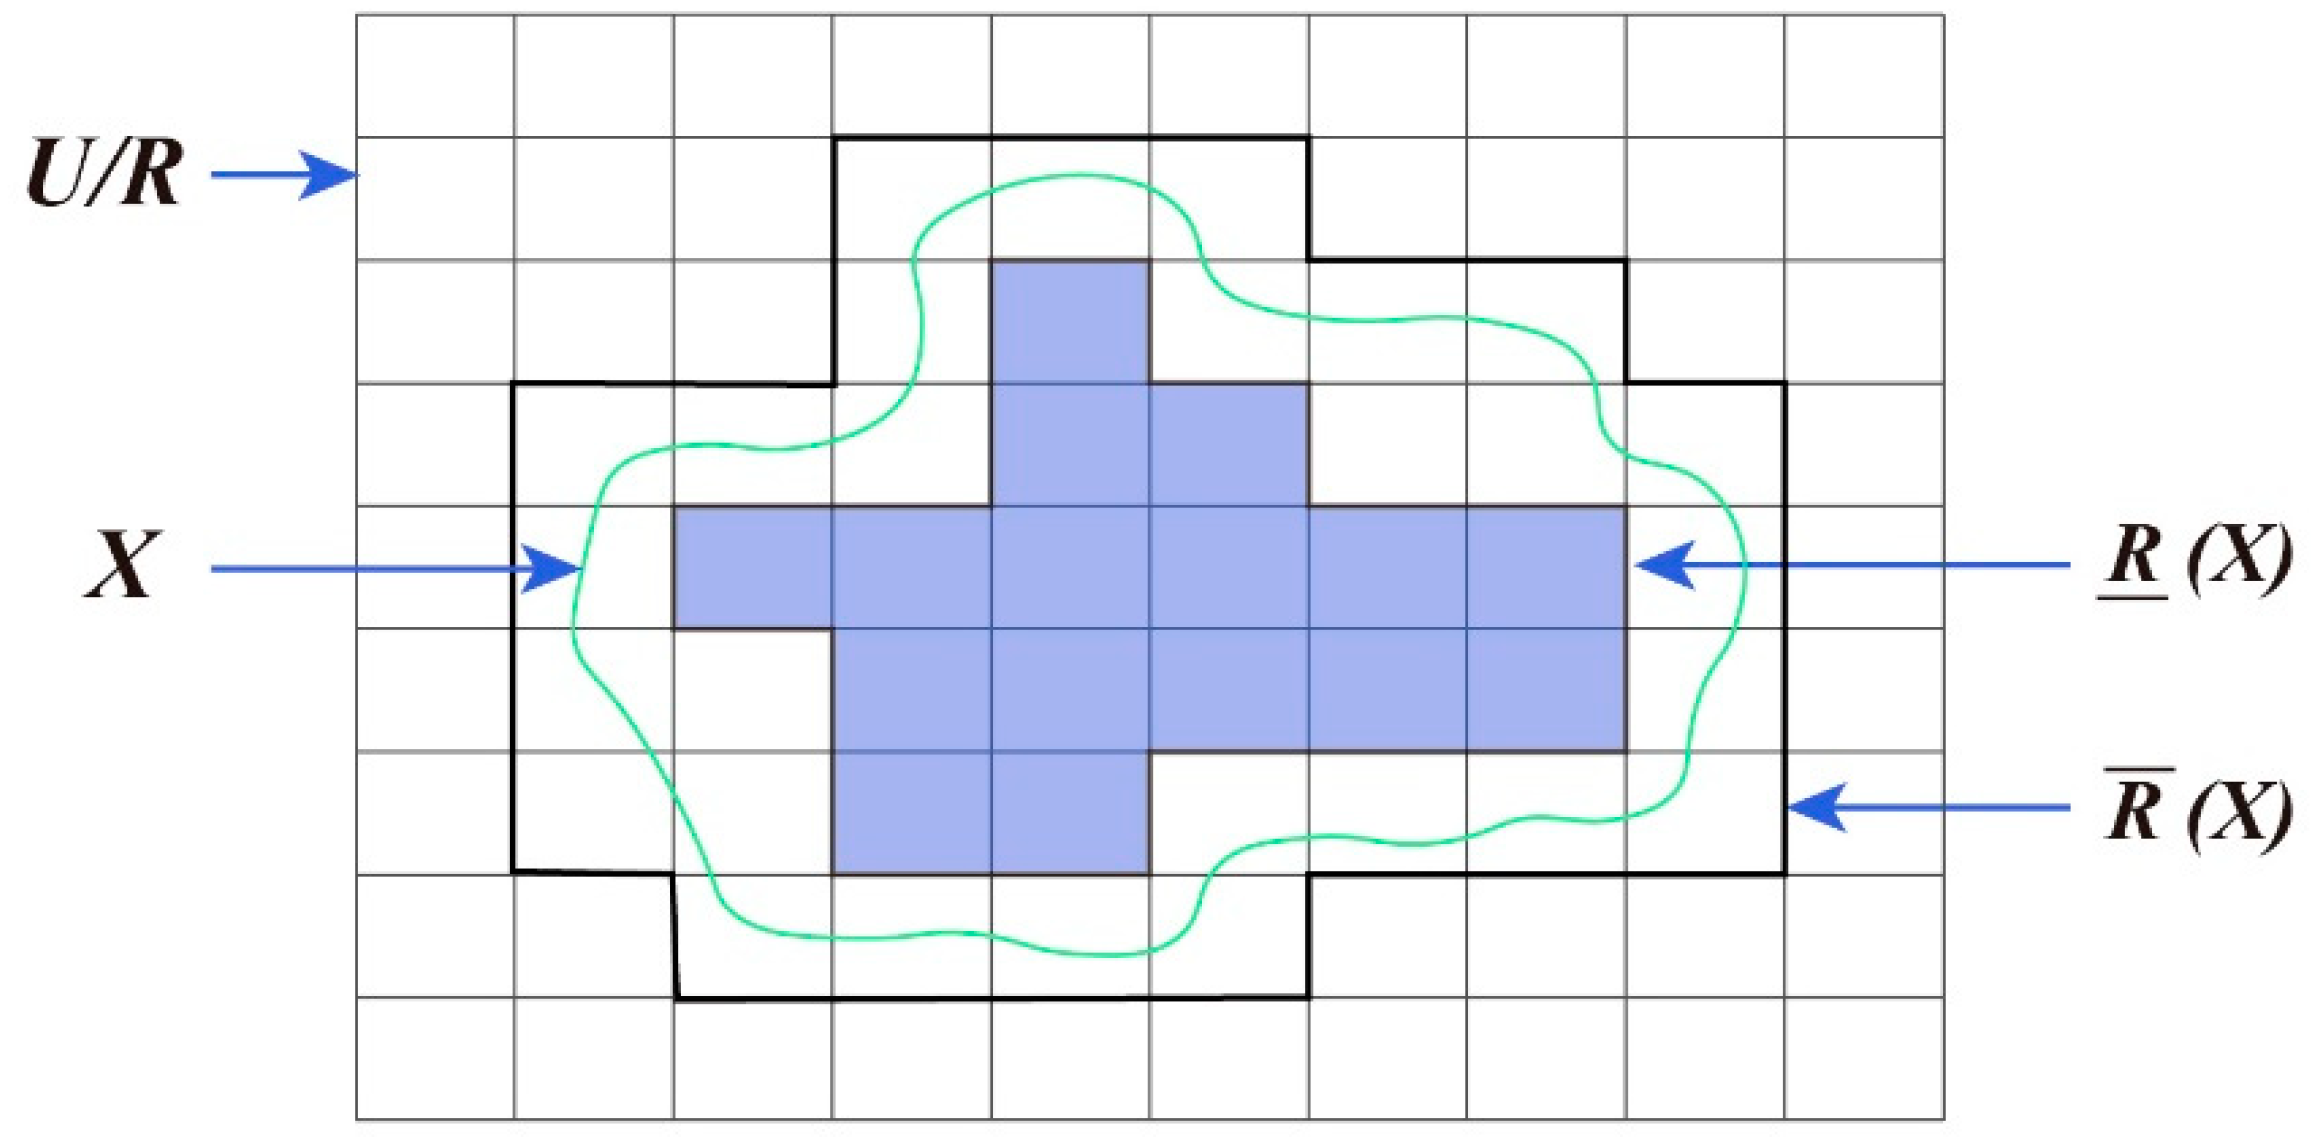
29]. Although the KE method has been applied in urban design to some extent, existing research predominantly focuses on the optimization of specific aspects of emotional design (such as lighting, noise control, spatial layout, etc.). Moreover, current studies often face challenges when handling complex and numerous design features, which can place a computational burden on KE. Therefore, to ensure the quality of decision-making remains unchanged, this study combines Rough Set Theory (RST) with KE. Through a data-driven optimization approach, redundant design features are eliminated, thus improving the computational efficiency of the algorithm. RST can perform design attribute reduction without relying on any additional knowledge [
30], addressing the issue of the subjective determination of OMS design features in previous studies. With advancements in machine learning technologies, methods such as Backpropagation Neural Networks (BPNNs) [
31], Interactive Genetic Algorithms (IGAs) [
32], Convolutional Neural Networks (CNNs) [
33], and Generative Adversarial Networks (GANs) [
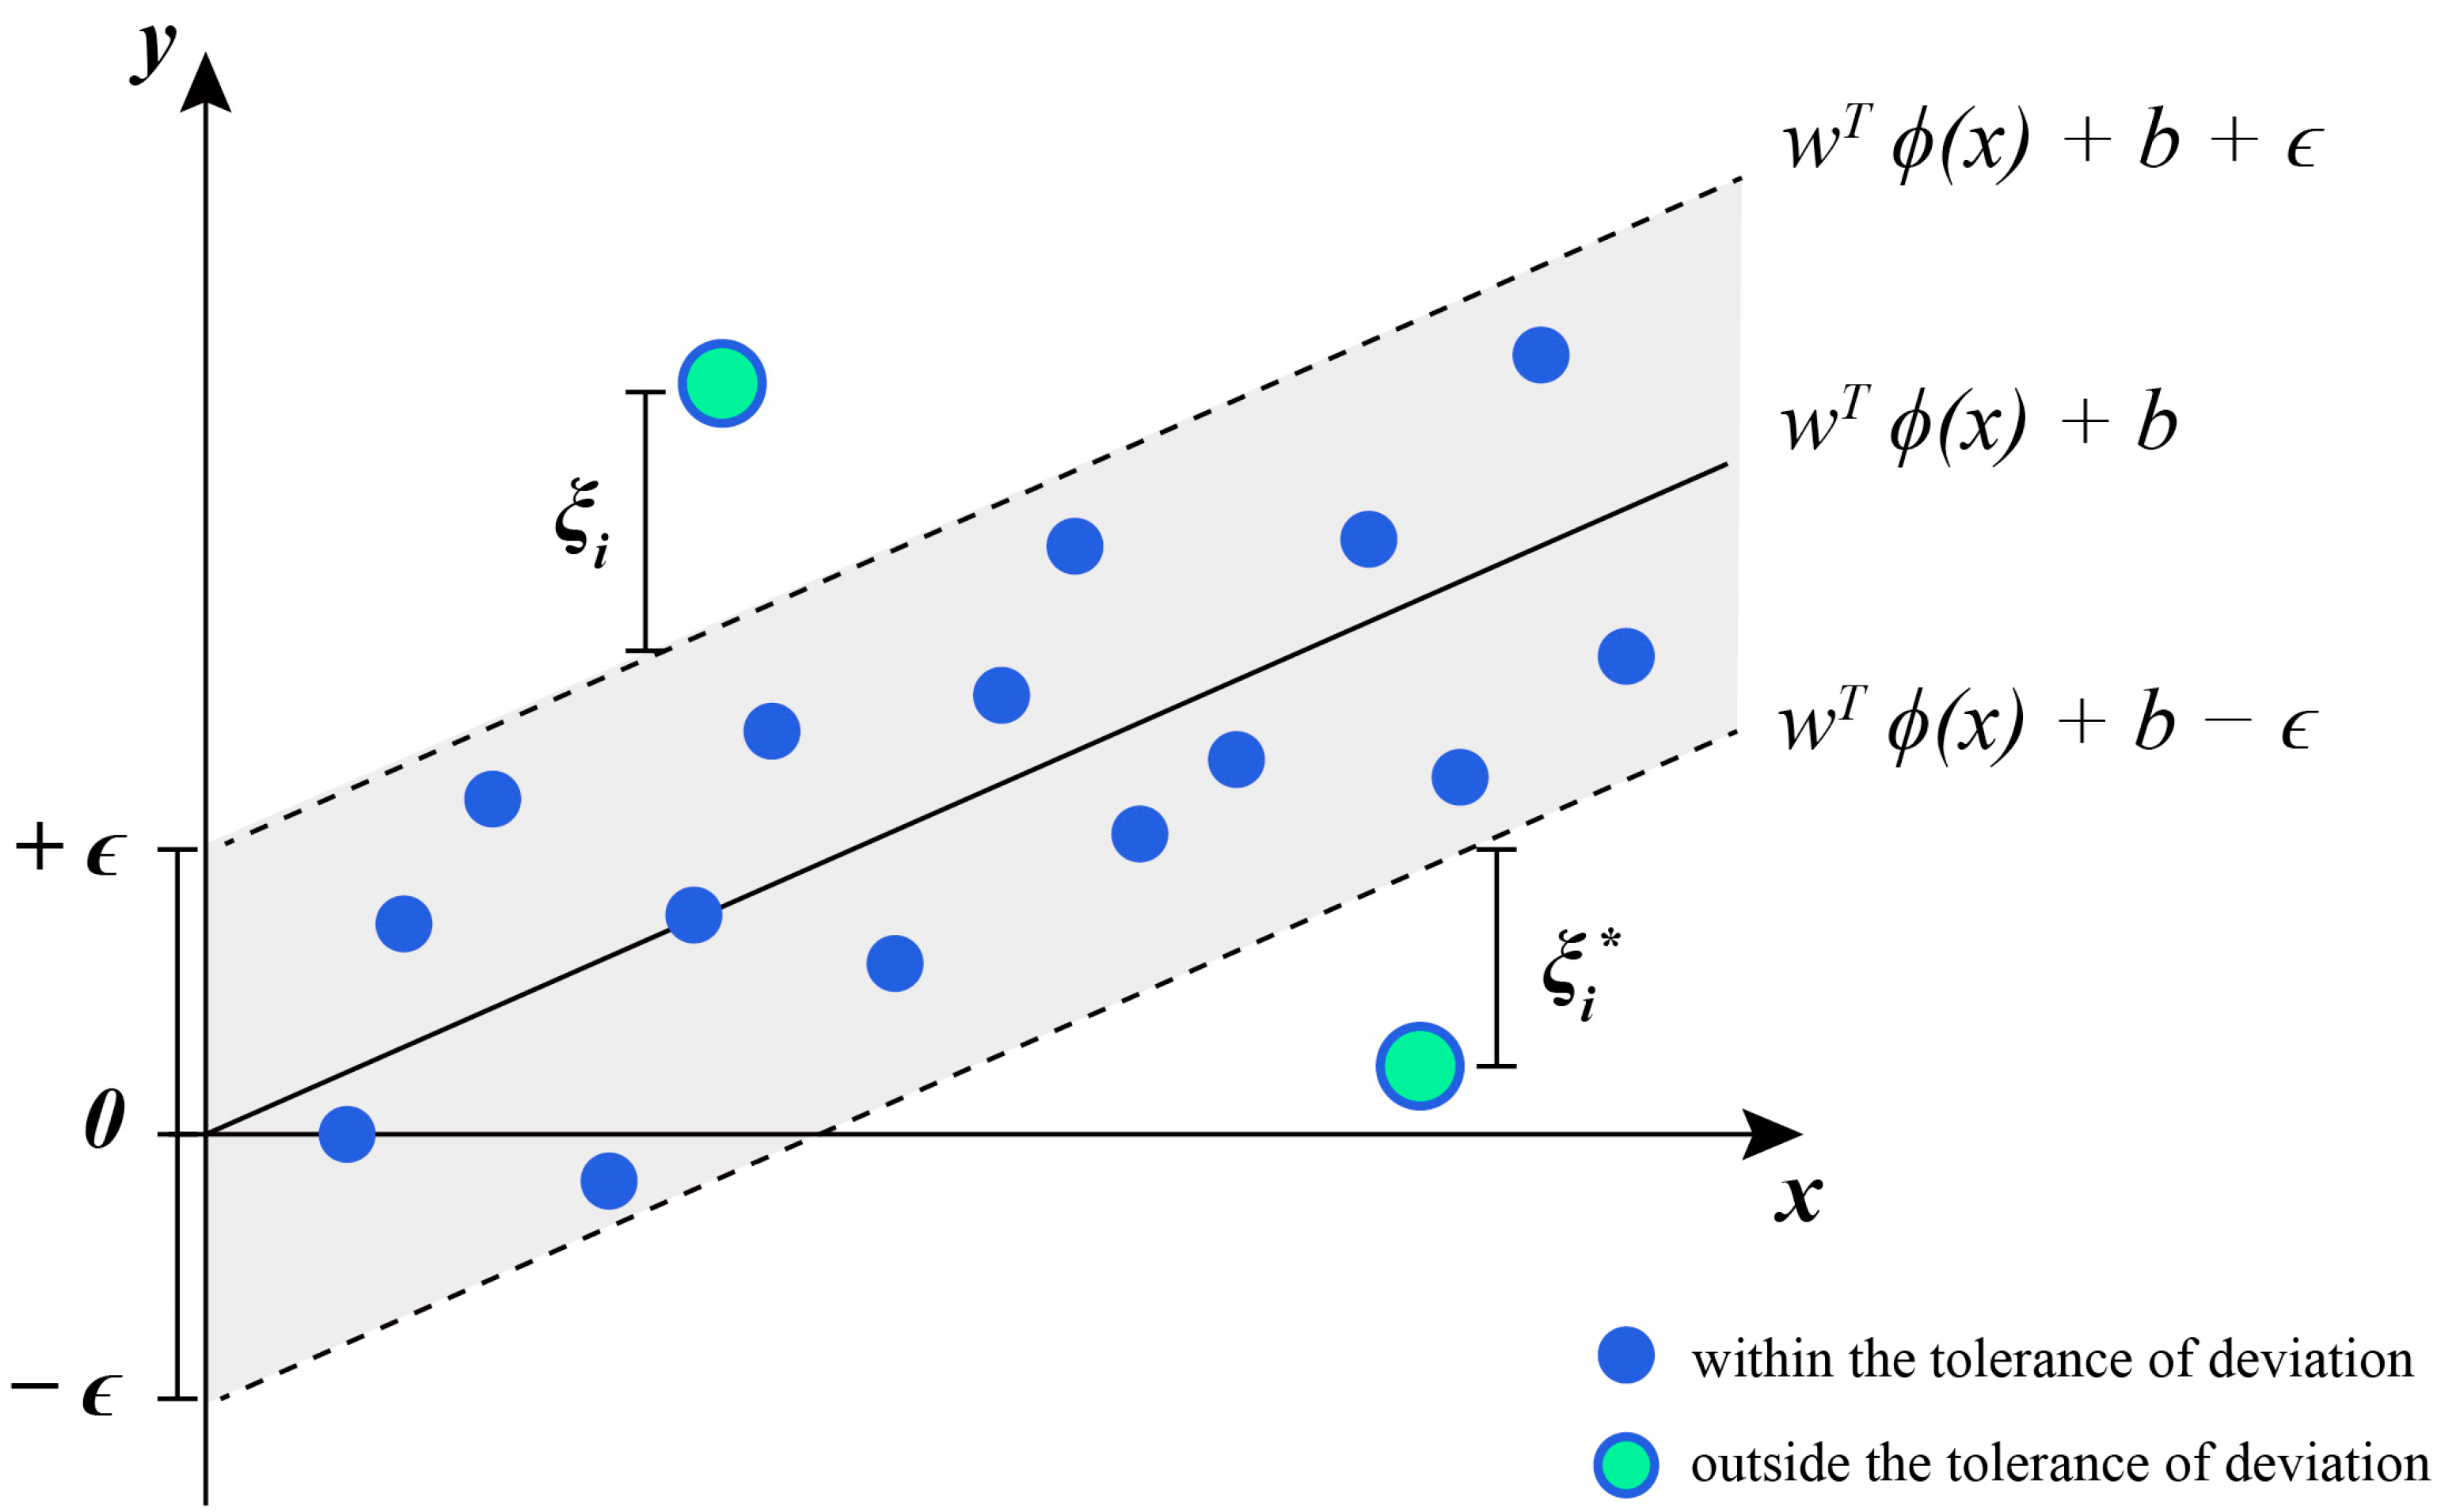
34] have been extensively studied to handle the complex, nonlinear relationships between users’ emotions and design features. Among these methods, Support Vector Regression (SVR) stands out as a powerful machine learning model, excelling in the processing of high-dimensional and nonlinear data [
35]. SVR enhances the accuracy and reliability of design outcomes, ensuring alignment with users’ actual needs. However, the challenge of parameter selection in SVR limits its optimization potential, potentially leading to instability in the model’s generalization ability [
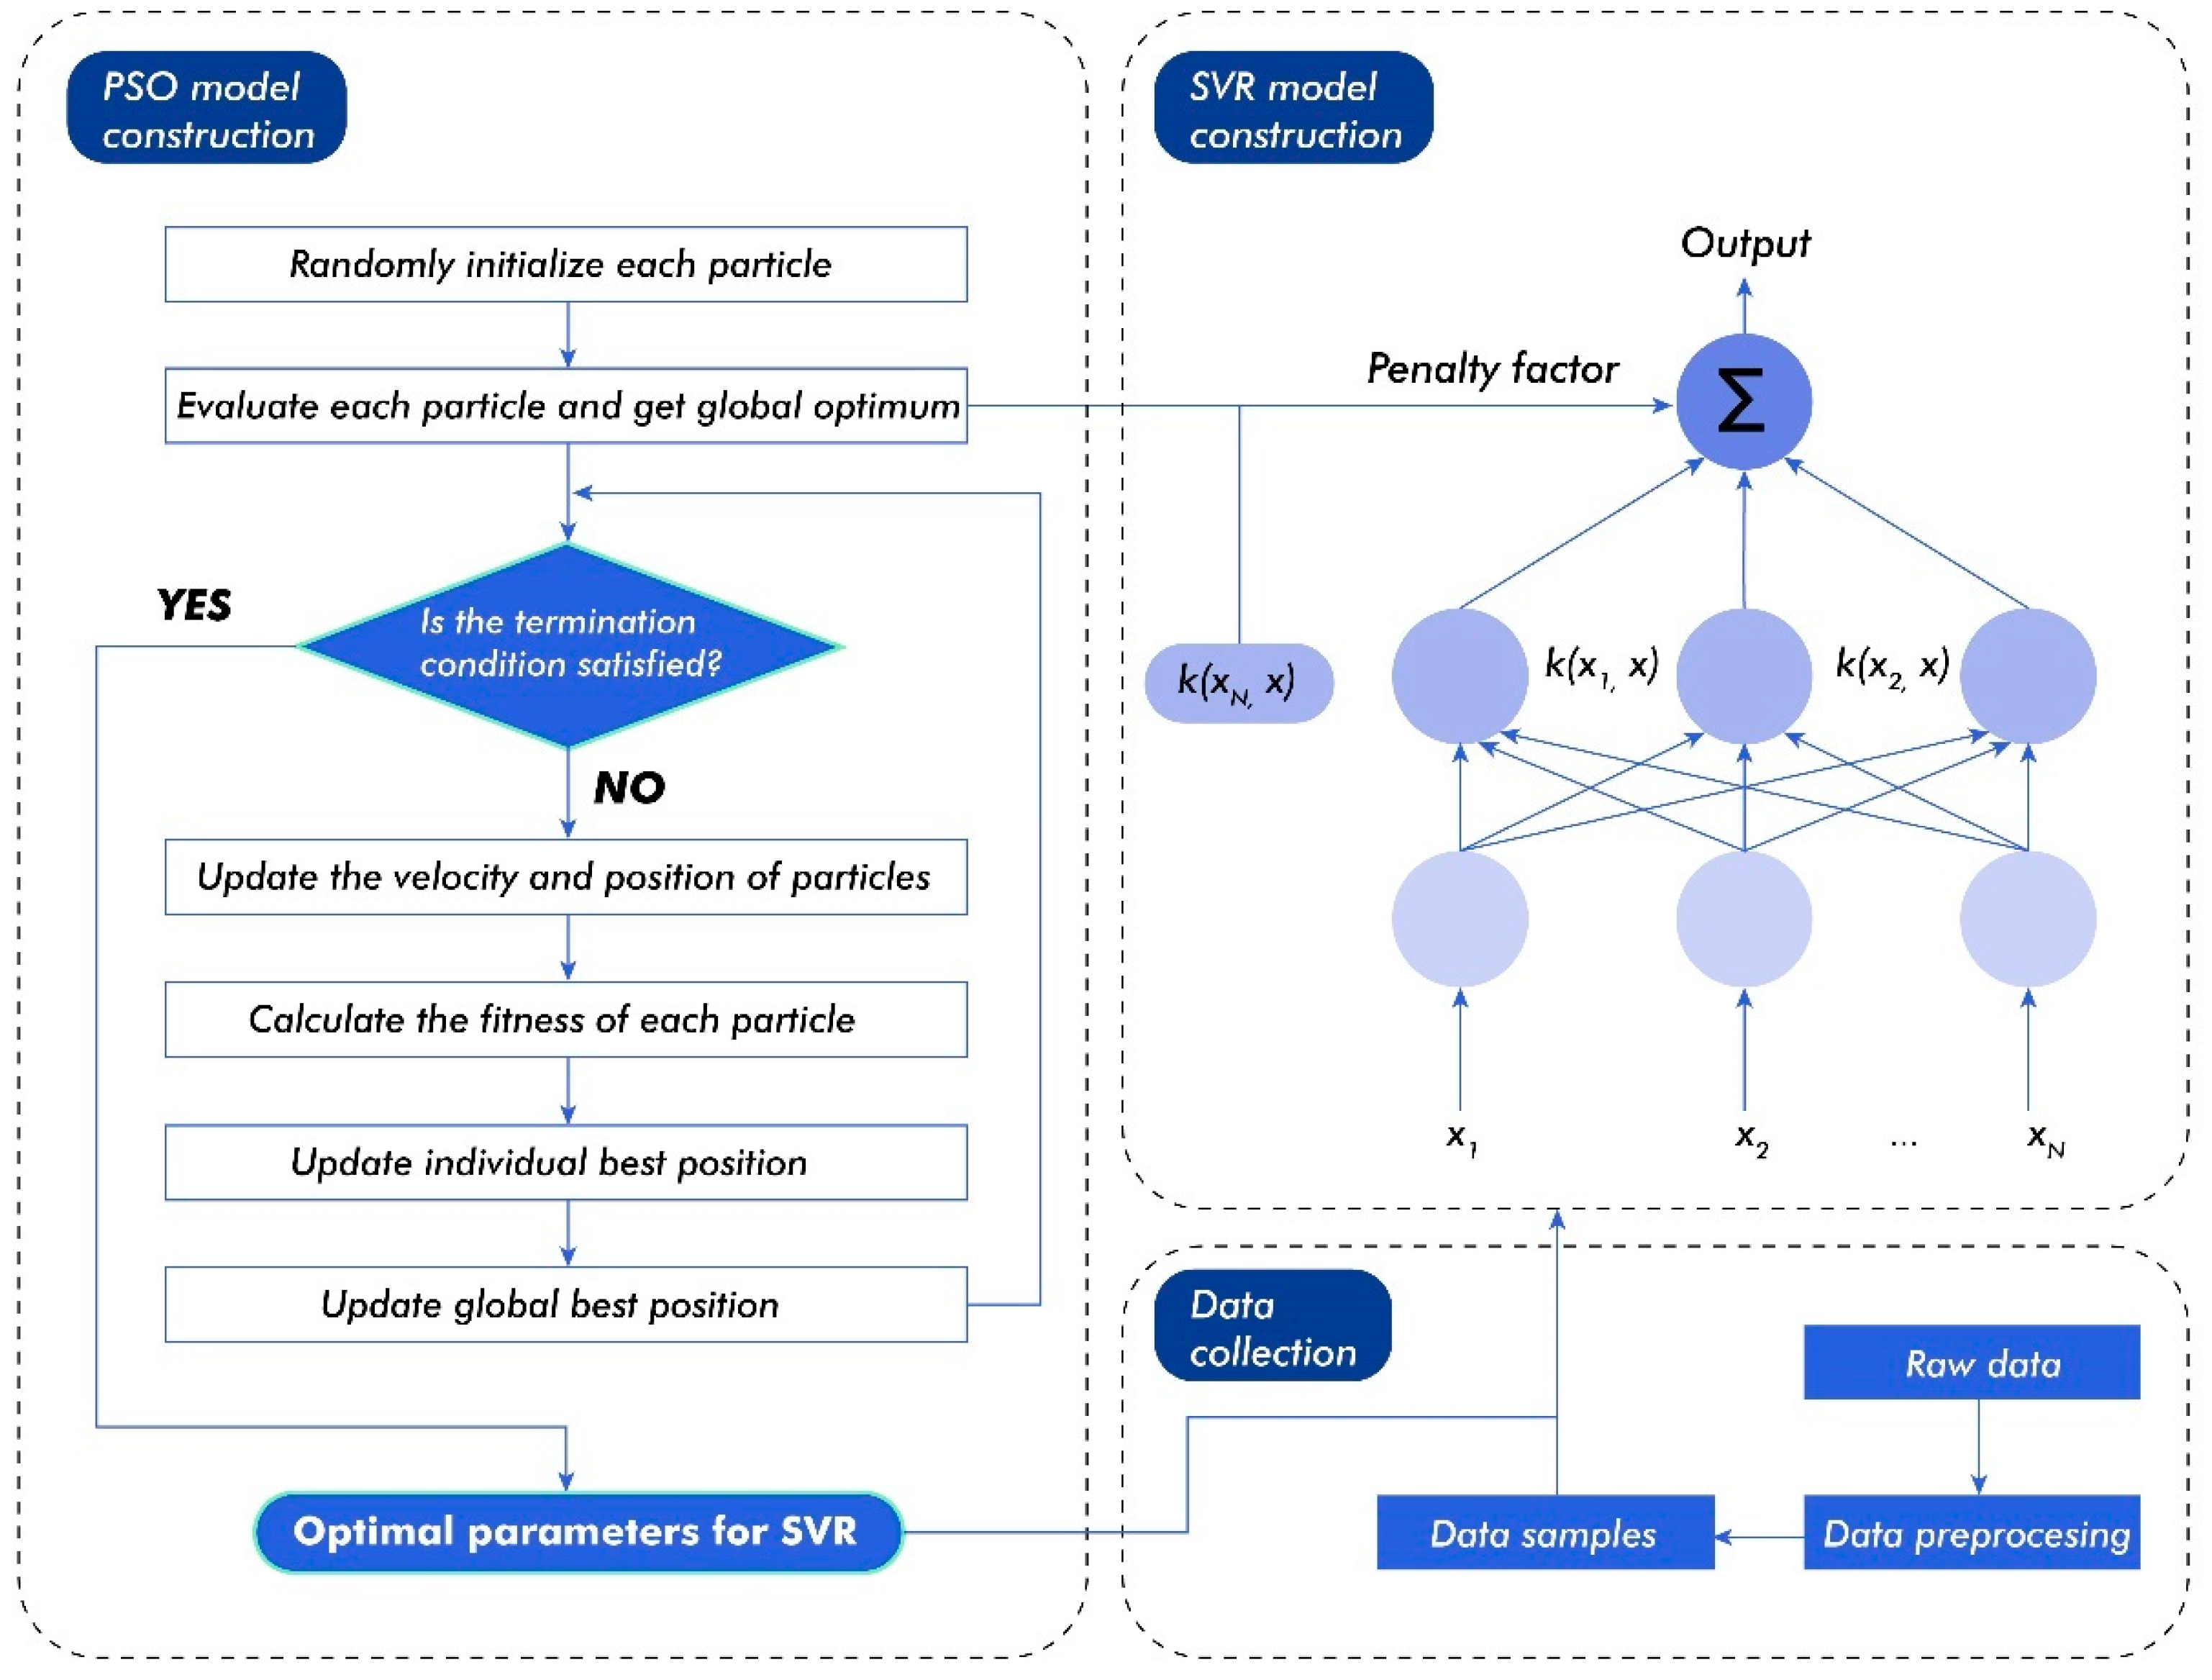
36]. To address this limitation, this study introduces Particle Swarm Optimization (PSO) to adjust SVR’s key parameters [
37], automating the parameter optimization process and significantly improving the model’s generalization ability and prediction accuracy in complex design problems [
38]. The integration of PSO not only optimizes parameter configurations but also enhances the model’s ability to adapt to varying design requirements.
Therefore, this study proposes a novel urban design framework based on the KE method, integrating RST and PSO-SVR algorithms. This framework combines emotional analysis with data-driven optimization algorithms, enabling accurate prediction of the design features of OMS that enhance activity duration in real urban environments, thus providing more personalized and emotionally driven designs. The main contributions of this study are as follows: (1) To more effectively model the nonlinear relationship between users’ emotions and design features, an improved SVR model based on PSO is proposed, which enhances prediction accuracy. (2) RST is employed to reduce the design feature set of OMS, thereby improving design efficiency. (3) The application of KE in urban design fosters cross-disciplinary development by incorporating emotional design principles. (4) From the perspective of health and well-being, the research method proposed in this paper generates a set of OMS design schemes that provide valuable insights and references for urban design research and practice. The structure of this paper is as follows:
Section 2 details the methods applied in this study.
Section 3 outlines the design process of OMS and presents the design results. In
Section 4, we compare the proposed method with alternative approaches and evaluate the study’s design outcomes. Finally,
Section 5 highlights the innovative aspects of this research and offers suggestions for future studies.
3. Research Process and Results
3.1. Proposed Research Framework
This study aims to integrate artificial intelligence technology into the design of OMS environments that can enhance individuals’ outdoor activity intentions, addressing both health and sustainable development needs. To achieve this goal, a mixed-methods research approach was employed, combining qualitative and quantitative models [
75]. Initially, 10 emotional descriptors were extracted through questionnaire surveys and expert interviews. These descriptors were then used to establish an emotional dataset, utilizing factor analysis (FA) and clustering techniques [
76]. Additionally, 11 design features of OMS were identified through morphological analysis. RST was applied to reduce these features, ultimately identifying five key design features that significantly influence users’ outdoor activities. Subsequently, PSO-SVR was used to develop a model that accurately maps the relationship between users’ emotional intentions and the identified key design features, resulting in a set of design schemes aimed at effectively promoting outdoor activities. In the experimental phase, OMS renderings were generated based on the model’s output. To verify the feasibility of the proposed method in real-world OMS design, 201 participants from diverse backgrounds, age groups, and genders were invited to evaluate their satisfaction with the designs.
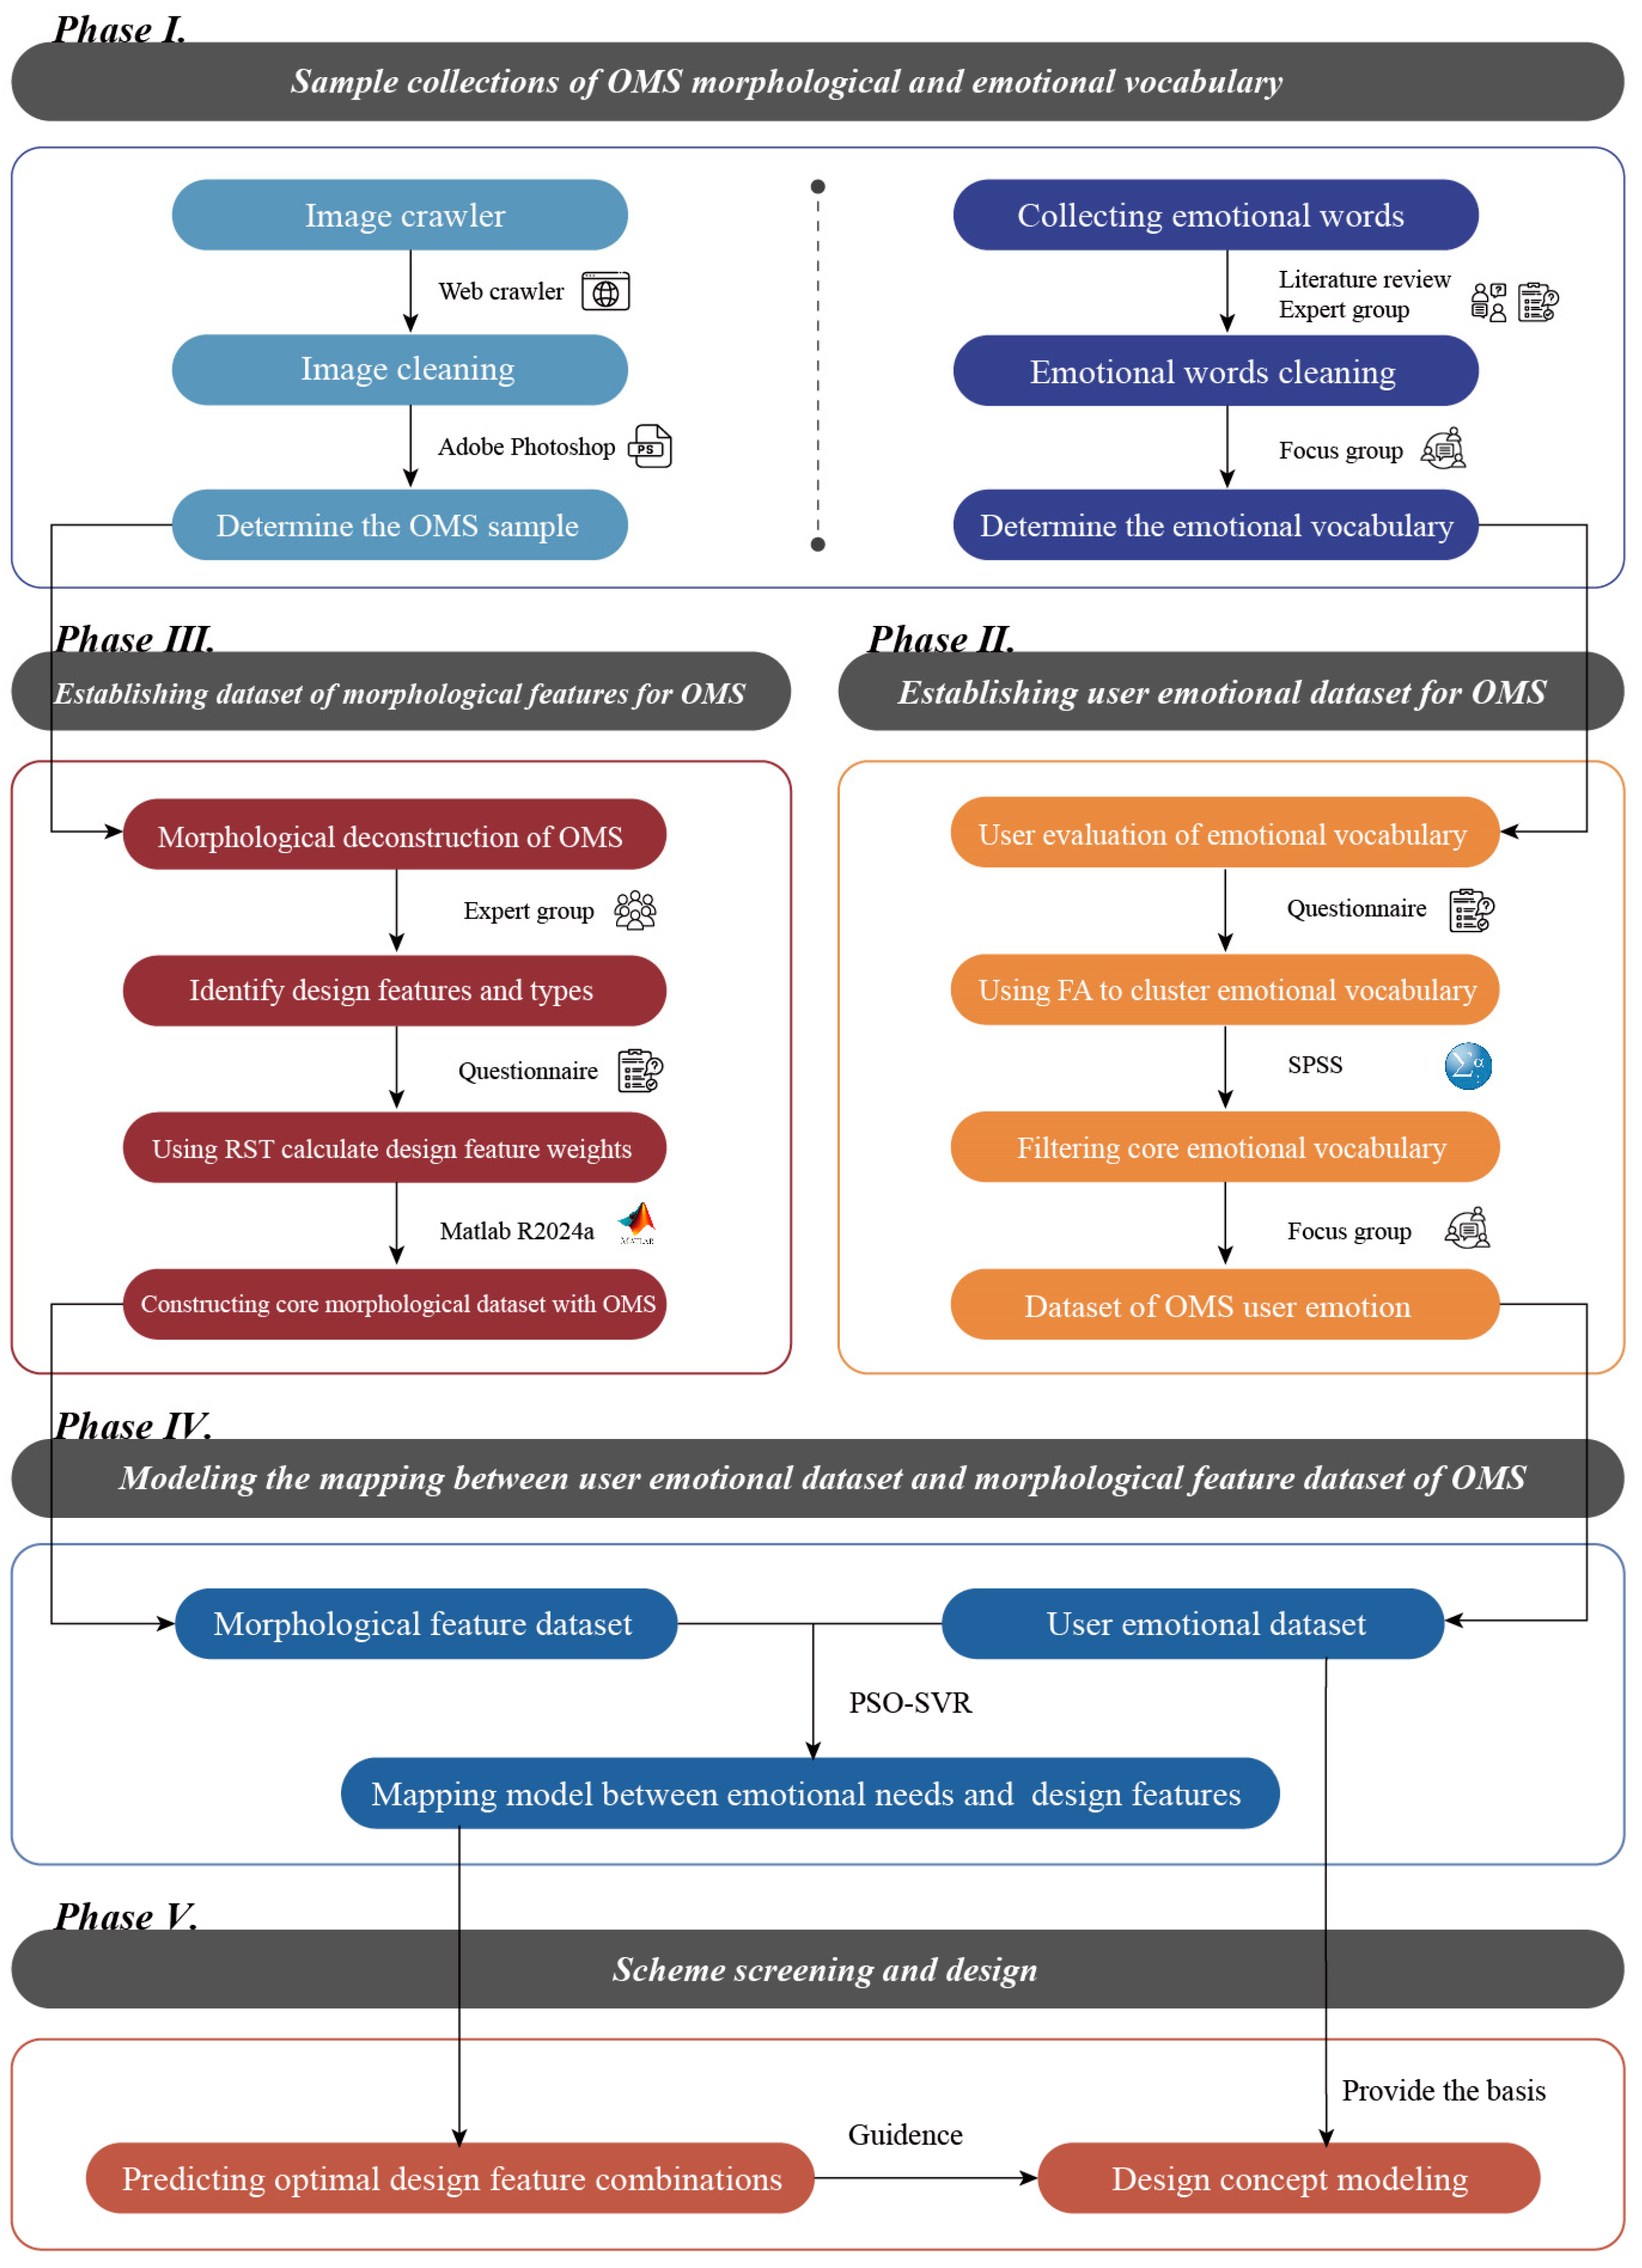
The research was conducted as follows: First, emotional descriptors representing users’ emotional responses to OMS were extracted using FA. Next, morphological analysis was applied to assess OMS design features, which were then reduced by RST to pinpoint the features most significantly impacting outdoor activity duration. Finally, through the collection and processing of questionnaire data, a relationship matrix was established linking emotional evaluations with design features. PSO-SVR was then used to develop the optimal training model corresponding to different Kansei images. The overall research framework and detailed process are illustrated in
Figure 4.
3.2. Sample Collections of OMS Morphological and Emotional Descriptors
This study adopted a perspective on OMS design and selected representative samples for in-depth analysis. A total of 100 OMS samples, conforming to the scope of the study, were extensively collected through design-related websites. These samples encompass various types of settings, including parks, pedestrian streets, squares, and green spaces, ensuring the diversity and broad representativeness of the sample. To mitigate the potential influence of design familiarity on participant evaluations and avoid bias in emotional assessments, a focus group consisting of five PhD students specializing in urban design, architecture, and environmental design was convened. The group reviewed and excluded images that were either ambiguous, overly obstructed, or from widely recognized designs. This measure helped eliminate participants’ inherent preferences for well-known designs, ensuring their emotional feedback accurately reflected perceptions of different design elements. Given that this study focuses on the environmental perception of OMS, images of selected samples did not isolate the OMS from its surrounding environment, allowing participants to experience a complete environmental context. Furthermore, to avoid visual distractions, any people present in the images were removed using Adobe Photoshop 2024.
In the sample selection process, we aimed to ensure the diversity of the data samples for subsequent machine learning model training, while also considering computational resources and efficiency. The sample size was carefully controlled to avoid prediction degradation or overfitting due to either too few or too many samples. Therefore, 60 representative and diverse OMS images were ultimately selected, covering different design types, colors, materials, and design languages. These images comprehensively reflect the diverse impacts of design elements on user perception in real-world settings. The final set of samples was integrated into a 6 × 10 OMS sample database (
Figure 5), which serves as the foundation for the subsequent emotional analysis and design optimization in this study.
To select emotional descriptors suitable for OMS design, this study followed a series of screening and validation steps. First, through a literature review, we revisited relevant 10 studies in KE and urban design, especially studies exploring the relationship between emotional responses and the environment. During this process, 50 emotional descriptors related to public spaces and outdoor activities were collected, including comfort, pleasure, relaxation, safety, and attractiveness. These words were extracted from existing emotional design studies, providing a strong theoretical basis and practical applicability. Subsequently, five experts in urban design (each holding a relevant PhD) were invited to participate in the screening process. The role of the experts was to assess the operability and broad applicability of these emotional descriptors in different urban environments based on their experience in emotional design and public space. The experts focused on the applicability and quantifiability of the words, assisting in the removal of those difficult to apply in urban design (such as “artistic” or “beautiful”), as well as overly general or abstract terms, resulting in a refined list of 35 words.
Next, to further validate the relevance of these emotional descriptors to user perceptions and their impact on outdoor activity duration, a focus group of eight individuals who regularly engage in outdoor activities (at least three times per week, each session lasting over 30 min) was organized. The purpose of the focus group was to discuss and refine the initial set of 35 emotional descriptors based on actual user emotional responses, ensuring that these words authentically represented users’ emotional experiences in OMS. As a result, words with ambiguous meanings or high similarity (e.g., “leisurely”) were removed.
After expert evaluation and user focus group screening, 10 representative and quantifiable emotional descriptors were selected. These words comprehensively reflect users’ emotional experiences in OMS and have strong potential for quantitative analysis. To avoid sequence bias, all selected emotional descriptors were randomly ordered and numbered, as shown in
Table 1. Through this process, we ensured the scientific validity, representativeness, and quantifiable feasibility of the selected emotional descriptors, providing a solid foundation for subsequent emotional analysis and the construction of the design optimization model.
3.3. Establishment of KE Dataset for OMS
3.3.1. User Emotional Dataset for OMS
In the field of KE, FA [
77] is a key statistical method that is widely used to simplify data and reveal the latent structure of data. Especially in the emotional design of OMS, the technique is of great value for understanding and analyzing users’ emotion. In the process of emotional design of OMS, a large number of emotional descriptors often reveal the common emotional features of users. With FA, these multi-dimensional emotional words can be effectively reduced to fewer dimensions; complex emotional data can be transformed into more understandable and applicable latent factors, thereby optimizing design and improving users’ experience.
To quantitatively correlate users’ emotion with OSM design, 10 emotional descriptors are collected, and 50 participants use a 5-point Likert scale to score. Based on these data, relevant evaluations are carried out on 60 OMS samples. An OSM emotional evaluation matrix containing 50 users’ evaluations (25 males and 25 females, engaging in outdoor activities at least three times per week, aged between 20 and 65 years) is collected and constructed. In order to explore the latent consistency of these emotional descriptors and reduce the information burden, a factor analysis is performed by using IBM SPSS Statistics 27 software. The KMO measure value is 0.875 (when the KMO value is >0.8, it indicates that the experimental data are suitable for factor analysis); Bartlett’s sphericity test value is 529.466 (degree of freedom = 45) and the significance level is
p < 0.001. These results confirm that the dataset is suitable for factor analysis (
Table 2).
In the total variance explanation of users’ perception measurement scale, the cumulative contribution rate of the first four indicators is 86.879% > 85% (
Table 3). Therefore, it is shown that the dataset can be effectively reduced to four types of factors.
Table 4 presents the rotated component matrix of 10 emotional descriptors obtained through Principal Component Analysis (PCA). Following the standard procedures of PCA and the rotation process, only variables highly correlated with the principal components are retained to enhance the matrix’s simplicity and interpretability. In the rotated component matrix, certain emotional descriptors are categorized into specific emotional groups based on their interrelationships and the emotional meanings they convey. Emotional descriptors such as vibrant, safe, spacious, relaxed, colorful and casual are classified as “sense of coziness”. “Safe”, “spacious”, “relaxed” and “casual” all express the sense of coziness, while “colorful” and “vibrant” can enhance the appeal of the environment and make the outdoor space more comfortable. Meanwhile, “enjoyable” and “softy” convey dynamic connotations, so they are classified as “sense of dynamism”. “Sheltered” and “orderly” are classified as a “sense of covertness” and “sense of order”, respectively. After extracting the core emotional descriptors from users, the focus group evaluated the appropriateness of these four emotional terms. Following the discussion, the group approved and finalized the selection of the emotional descriptors: a sense of coziness, sense of dynamism, sense of covertness, and sense of order. These terms were subsequently used to construct the emotional dataset for OMS users.
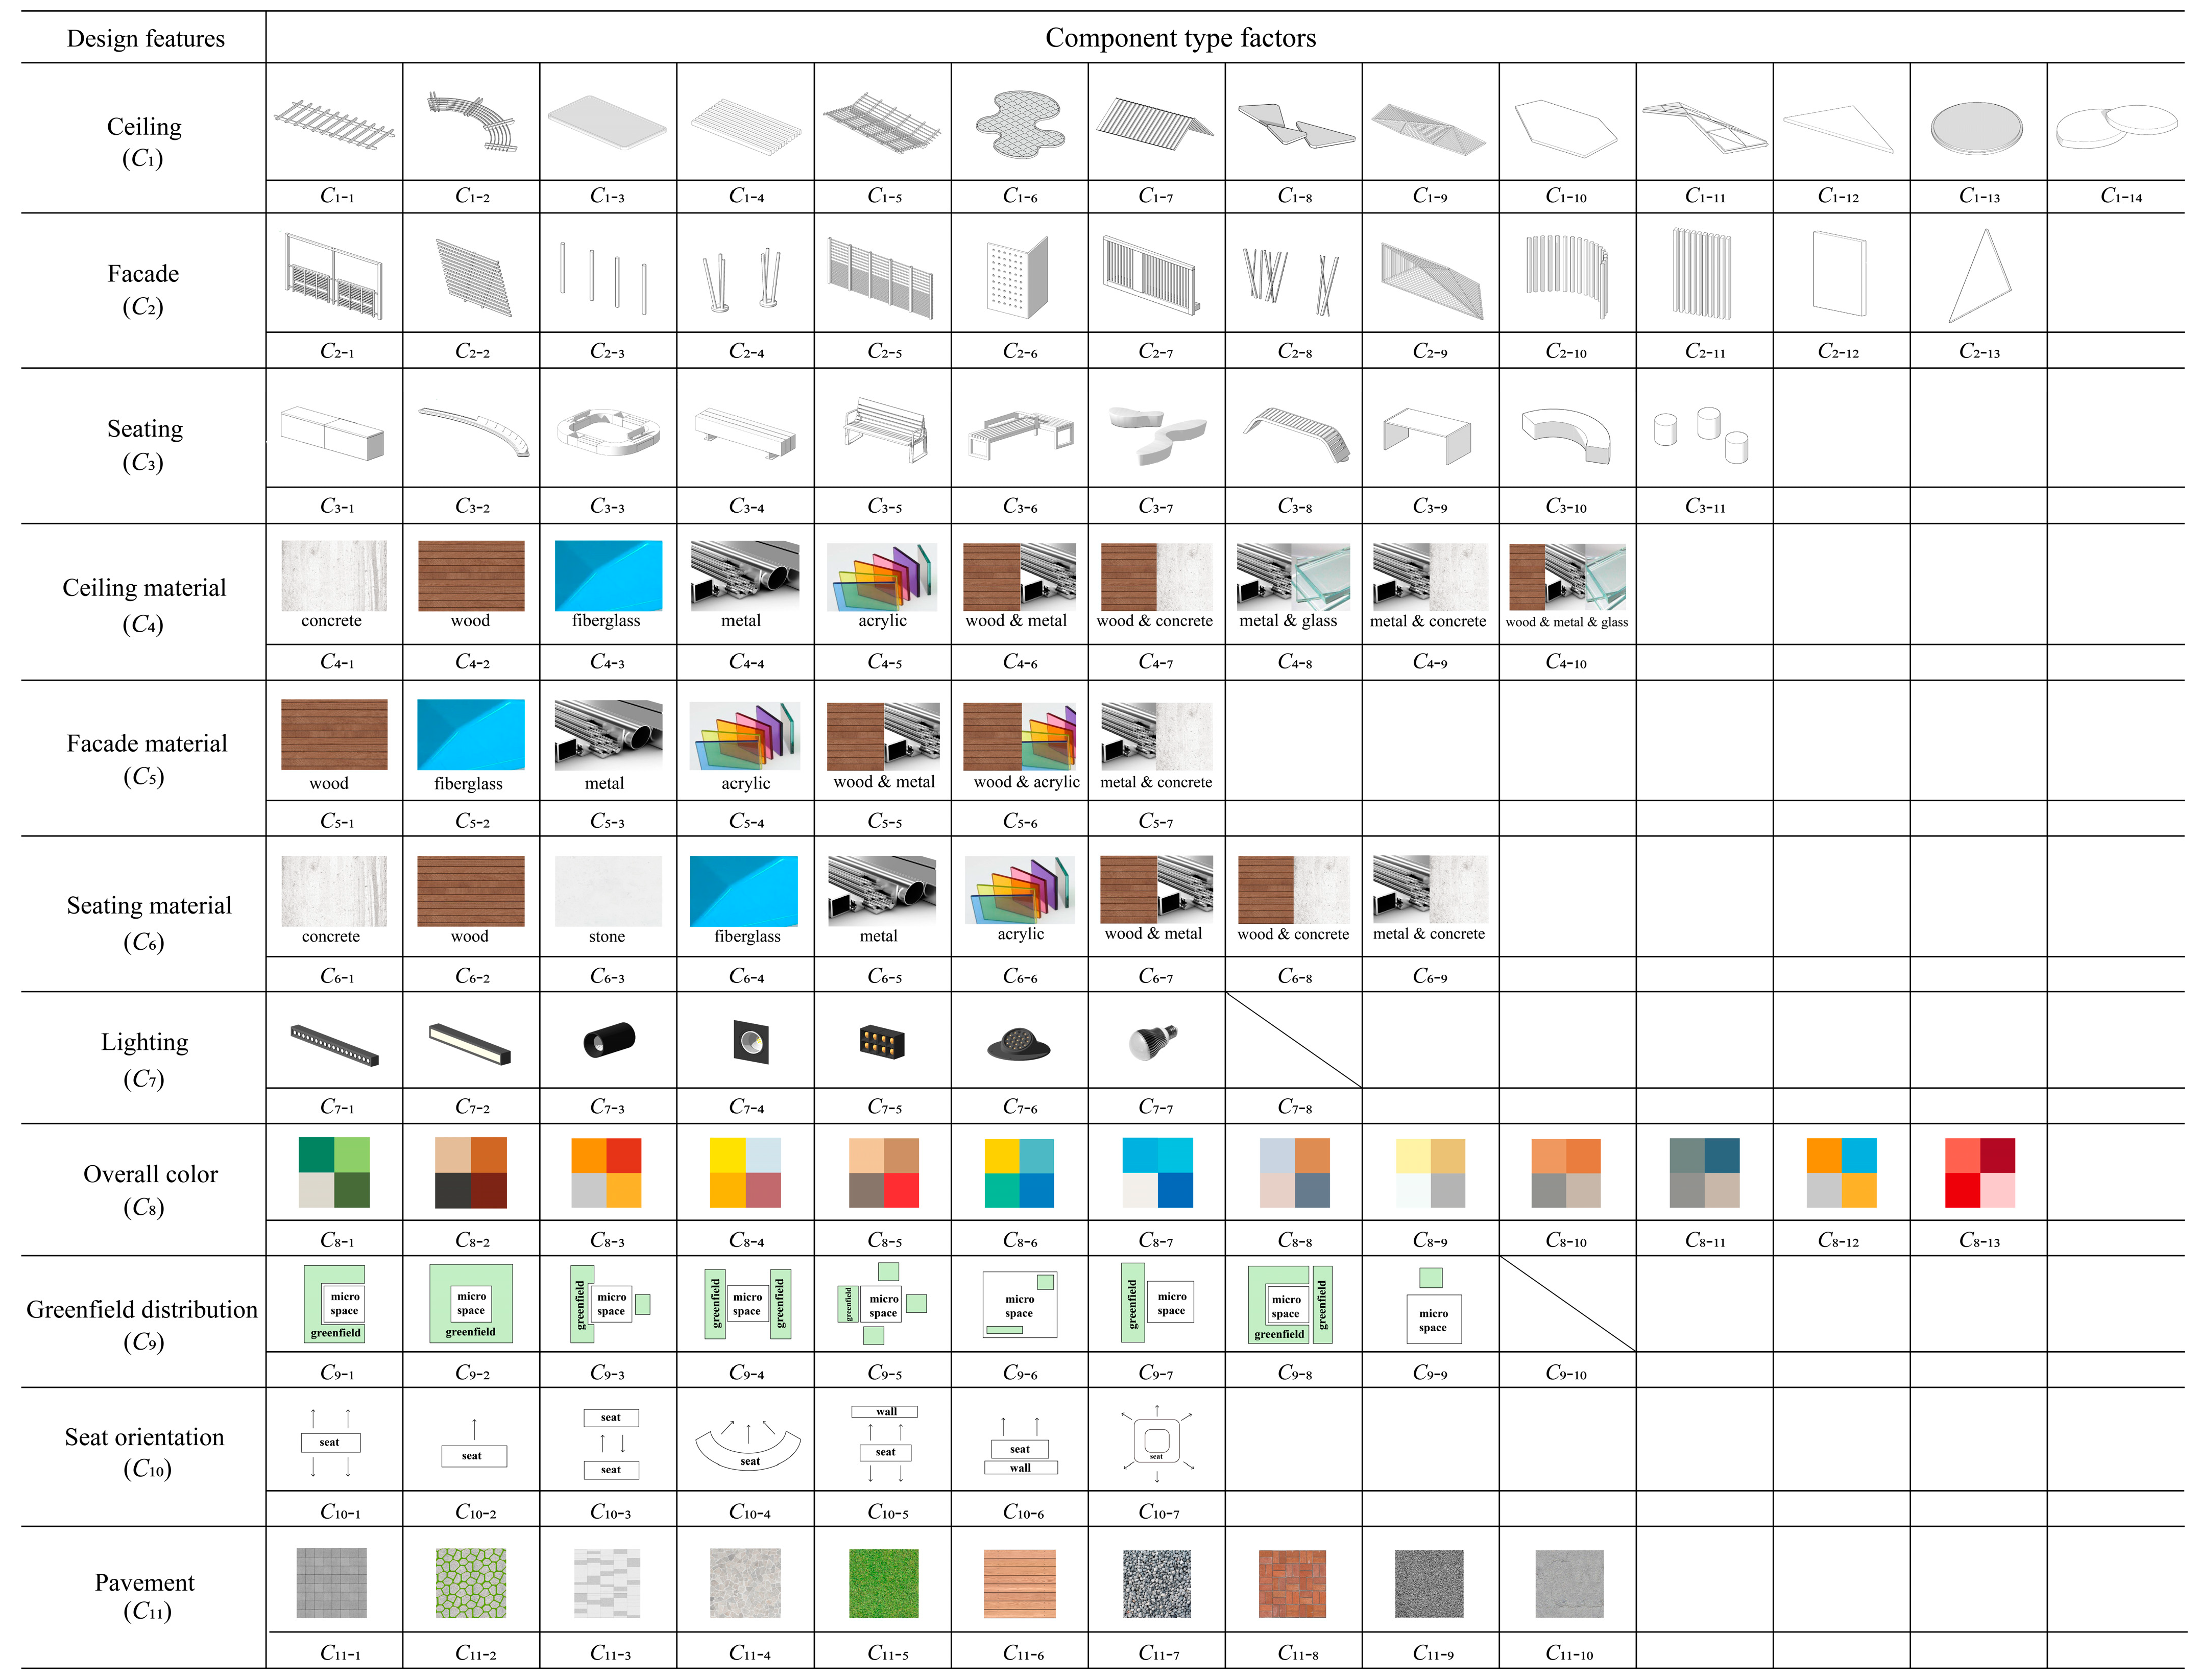
3.3.2. Construction of OMS Key Morphological Dataset Based on RST
In order to obtain the core morphological dataset with visual sequence features, we first performed a morphological classification and reconstruction of OMS. To ensure the representatives and objectivity of the design feature extraction results, five experts of the design field (with relevant doctoral or master’s degrees) were invited to form an expert team to analyze 60 OMS samples in the sample database. After expert discussion, the OMS was divided into 11 design features, which are the ceiling (C
1), facade (C
2), seating (C
3), ceiling material (C
4), facade material (C
5), seating material (C
6), lighting (C
7), overall color (C
8), greenfield distribution (C
9), seat orientation (C
10) and pavement (C
11). Each design feature was further subdivided into multiple design types, totaling 112. The types of three design features, namely the ceiling, facade, and seating, were modeled and expressed by the 3D modeling software Sketch Up 2024, as shown in
Figure 6.
Given that different design features vary in their importance for enhancing users’ outdoor activity duration, features with minimal or no influence on this outcome can lead to inaccurate predictions in the subsequent model. To address this, the RST algorithm was applied to reduce the 11 design features, thereby improving recognition accuracy. First, the 60 representative OMS samples obtained in the previous phase were mapped to design types using a morphological analysis table. Then, 100 participants (50 males and 50 females0, aged 20 to 65, all of whom spend time outdoors at least three a week) were selected for a survey assessing the ability of the 60 OMS samples and the 112 design types corresponding to 11 design features to enhance outdoor activity duration. The survey results were scored using a 5-point Likert scale, where 5 represents the highest enhancement of activity duration, 3 indicates an average effect, and 1 denotes no intention to enhance activity duration. Due to the strong continuity of the original Kansei evaluation data, it is necessary to discretize the continuous data for analysis. According to the features of evaluation data distribution, the discretization method is as follows: the evaluation grade of interval [1, 2, 89] is 1; the evaluation grade of interval [2.98, 3.98] is 2; the evaluation level of the interval [3.98, 5] is 3. The RST condition attribute is 11 design features, which is expressed as
C; the decision attribute is the extent to which OMS improves the outdoor activity duration, which is expressed as
D; the converted discrete values are shown in
Table A1.
Through the application of the attribute reduction algorithm in MATLAB R2024a software, the key design features that have an important impact on the improvement in outdoor activity duration are determined, namely the seating (C3), facade material (C5), lighting (C7), seat orientation (C10) and pavement (C11); the weights are 0.0625, 0.25, 0.25, 0.25, 0.1875, respectively.
3.3.3. Modeling the Mapping Between User Emotional Dataset and Morphological Dataset of OMS
After the FA of the first stage, the four most representative OMS emotional descriptors were combined with the 60 OMS sample’s key design features of the previous stage to construct a 5-point Likert Scale. In total, 100 people were invited to participate in the Kansei evaluation experiment, half of whom were male and half female between the age of 20 and 65, including furniture designers, landscape architects, architectural designers and end users. The matrix between the design features of emotional descriptors samples and the Kansei evaluation value was constructed, as shown in
Table A2.
At this stage, the mathematical model of PSO-SVR was used for programming calculation, thus obtaining the set point and mapping function of optimization parameters. The collected sample data were divided into a training set and a test set proportionally, of which 90% (54 samples in total) were used to train the model and the remaining 10% (6 samples in total) were used to verify the model’s predictive performance. Firstly, the key design features of the sample were taken as input data, and the adjective of “sense of coziness” in the Likert score was used as the output value. The RBF was used to map the input value to the high-dimensional feature space; the PSO algorithm was introduced to search and optimize the key parameters of SVR globally, and a model was constructed in the feature space. Meanwhile, the coefficient of determination (R
2) and root mean square error (RMSE) were used as the evaluation indexes of model prediction accuracy [
22,
78], as shown in formula (14–15). In the formula,
n is the number of samples;
xi and
represent the actual score and predicted score of the time
i;
is the average value of samples in the test set.
The data were imported into the file M based on MATLAB scripts, and the PSO algorithm tuning SVR was introduced to train and test the model again. The optimal penalty factor and kernel function parameters were found by adjusting the parameters of PSO algorithm. The population size of PSO was set to 50 and the maximum number of iterations was set to 50; both individual cognitive factor C1 and social factor C2 were set to 2. After several training sessions, the final root mean square error (RMSE = 0.14658) gradually converged and the optimized parameter was set as follows: C = 6.1409, γ = 0.01. The fitness curve (
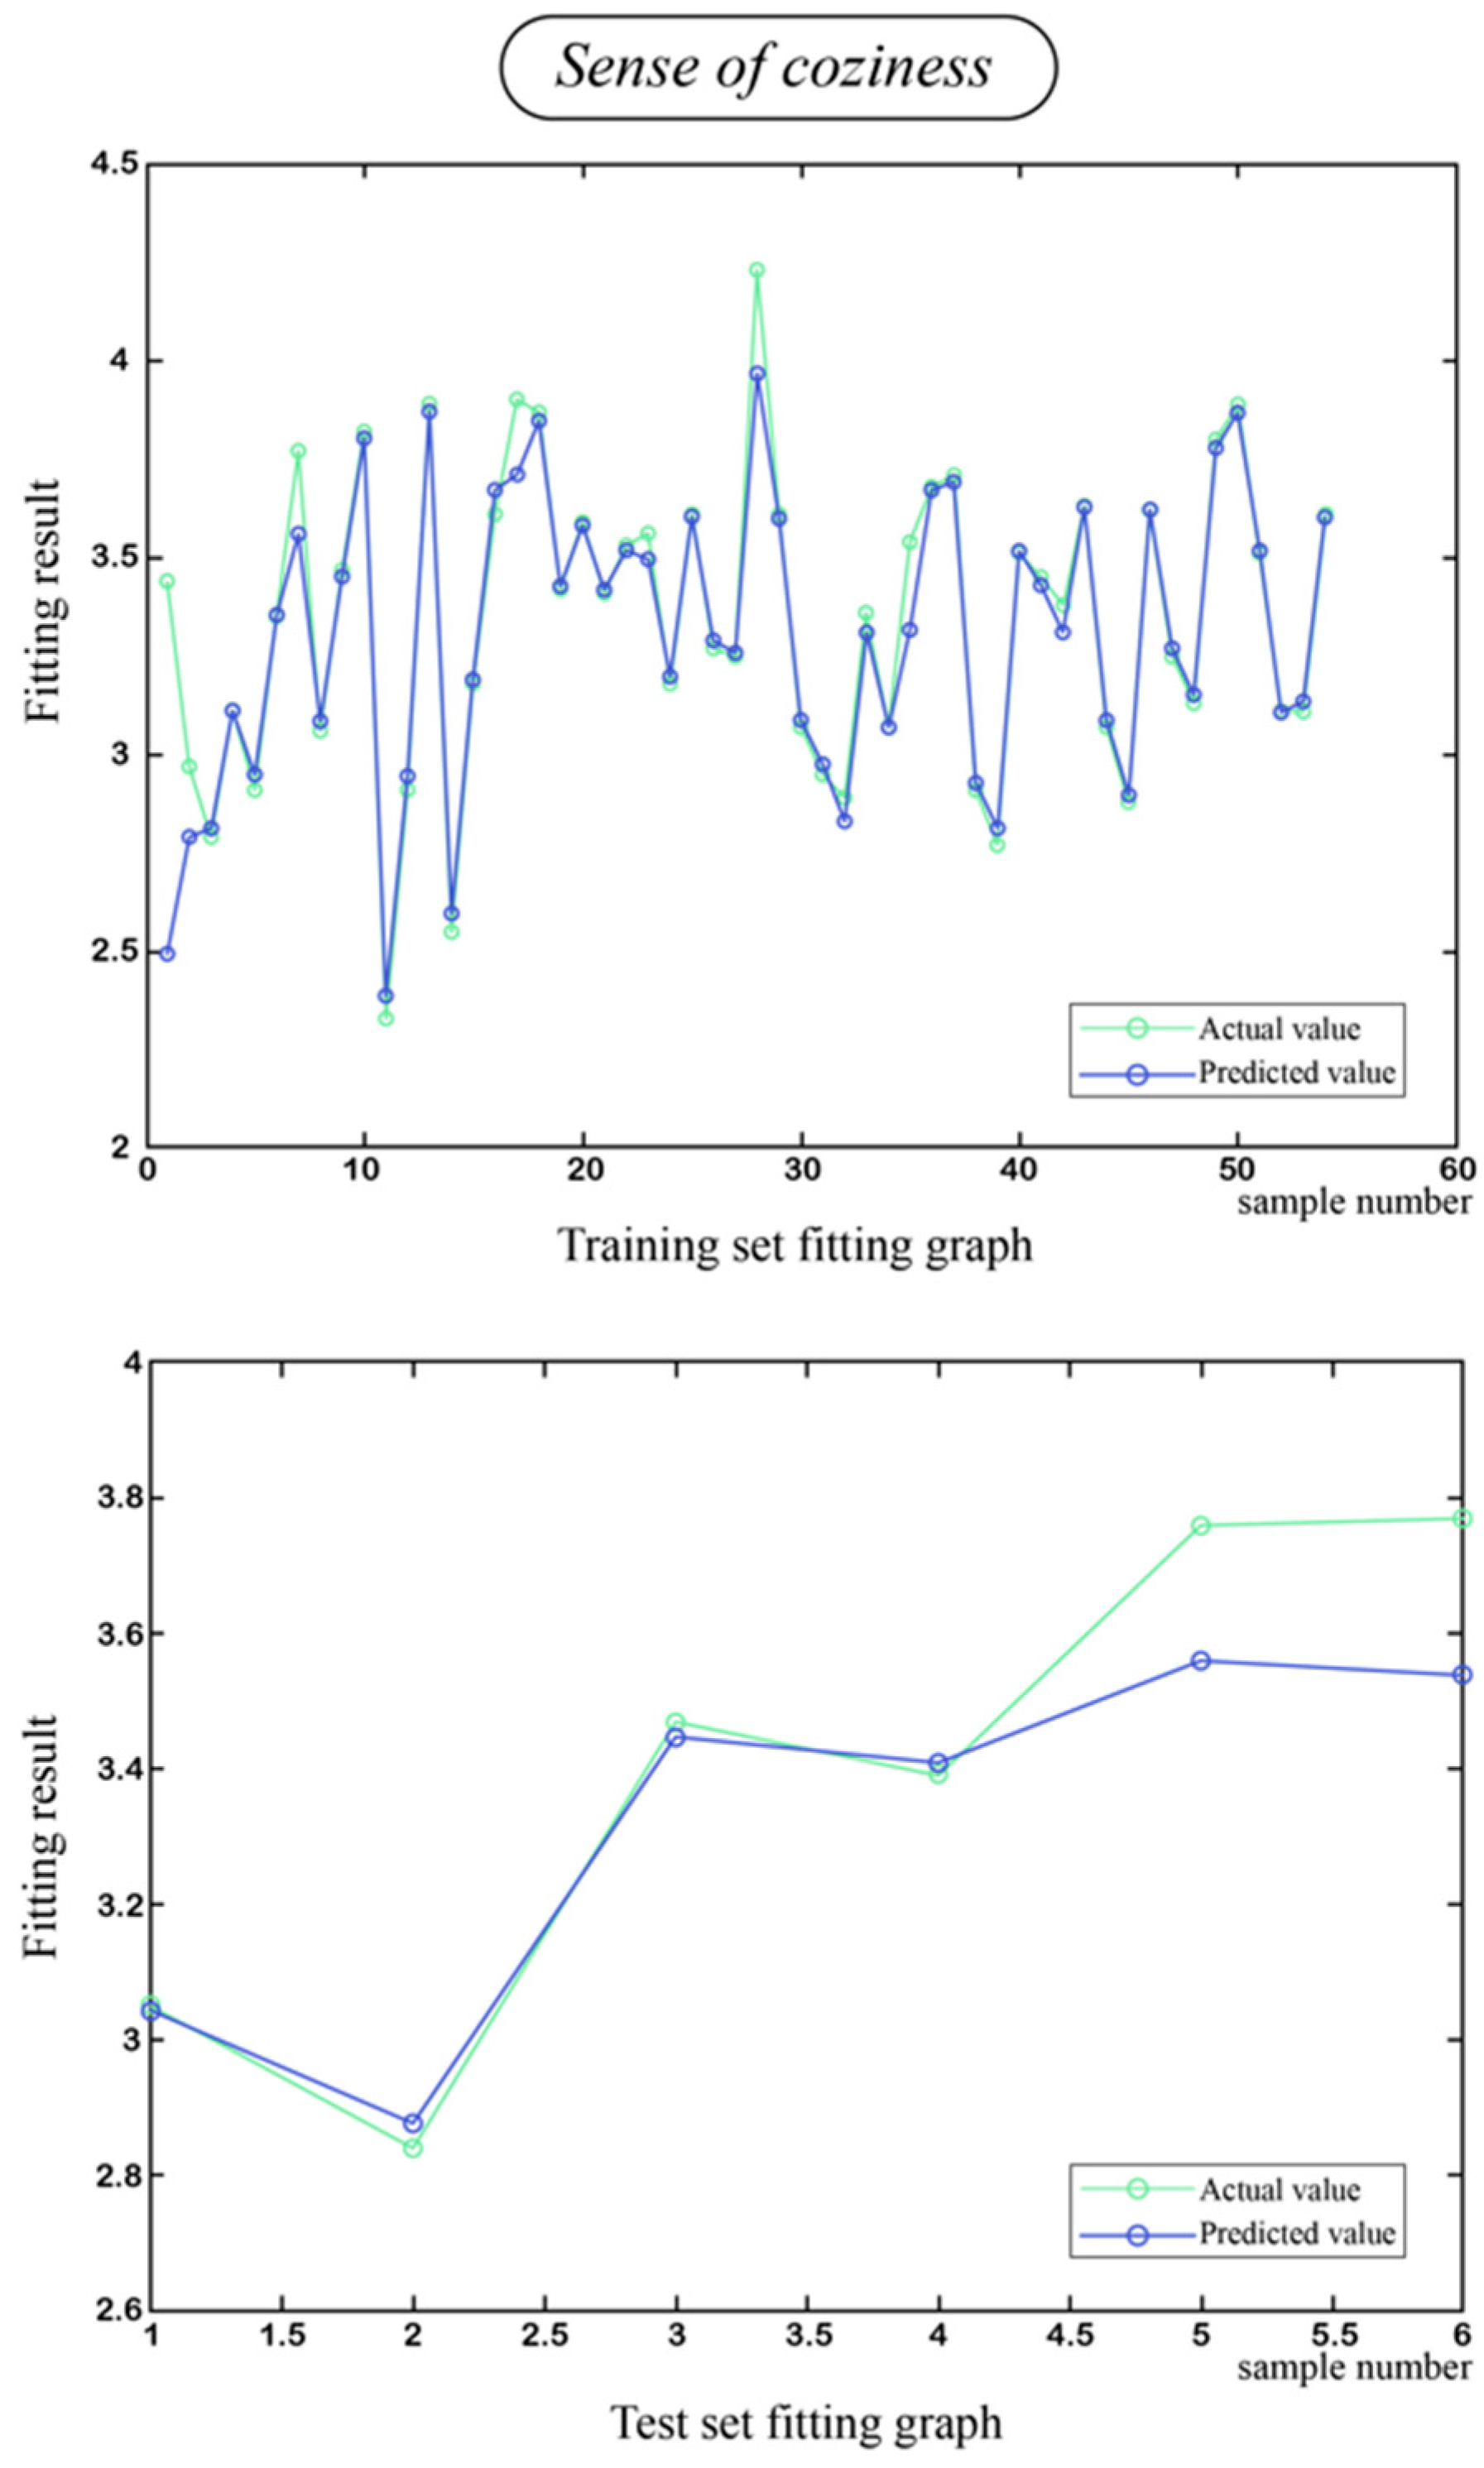
Figure 7) shows the effectiveness of the PSO algorithm on parameter optimization in the process of model training and verifies that the selection of the best training parameters was reasonable and effective. The fitting diagram of training process is shown in
Figure 8. In order to verify the performance of the model, the actual value of the test set was compared with the predicted value. The results show that the two matched well with each other, the training set and test set R
2 (0.85983, 0.95107), and the RMSE on the test set is 0.12645.
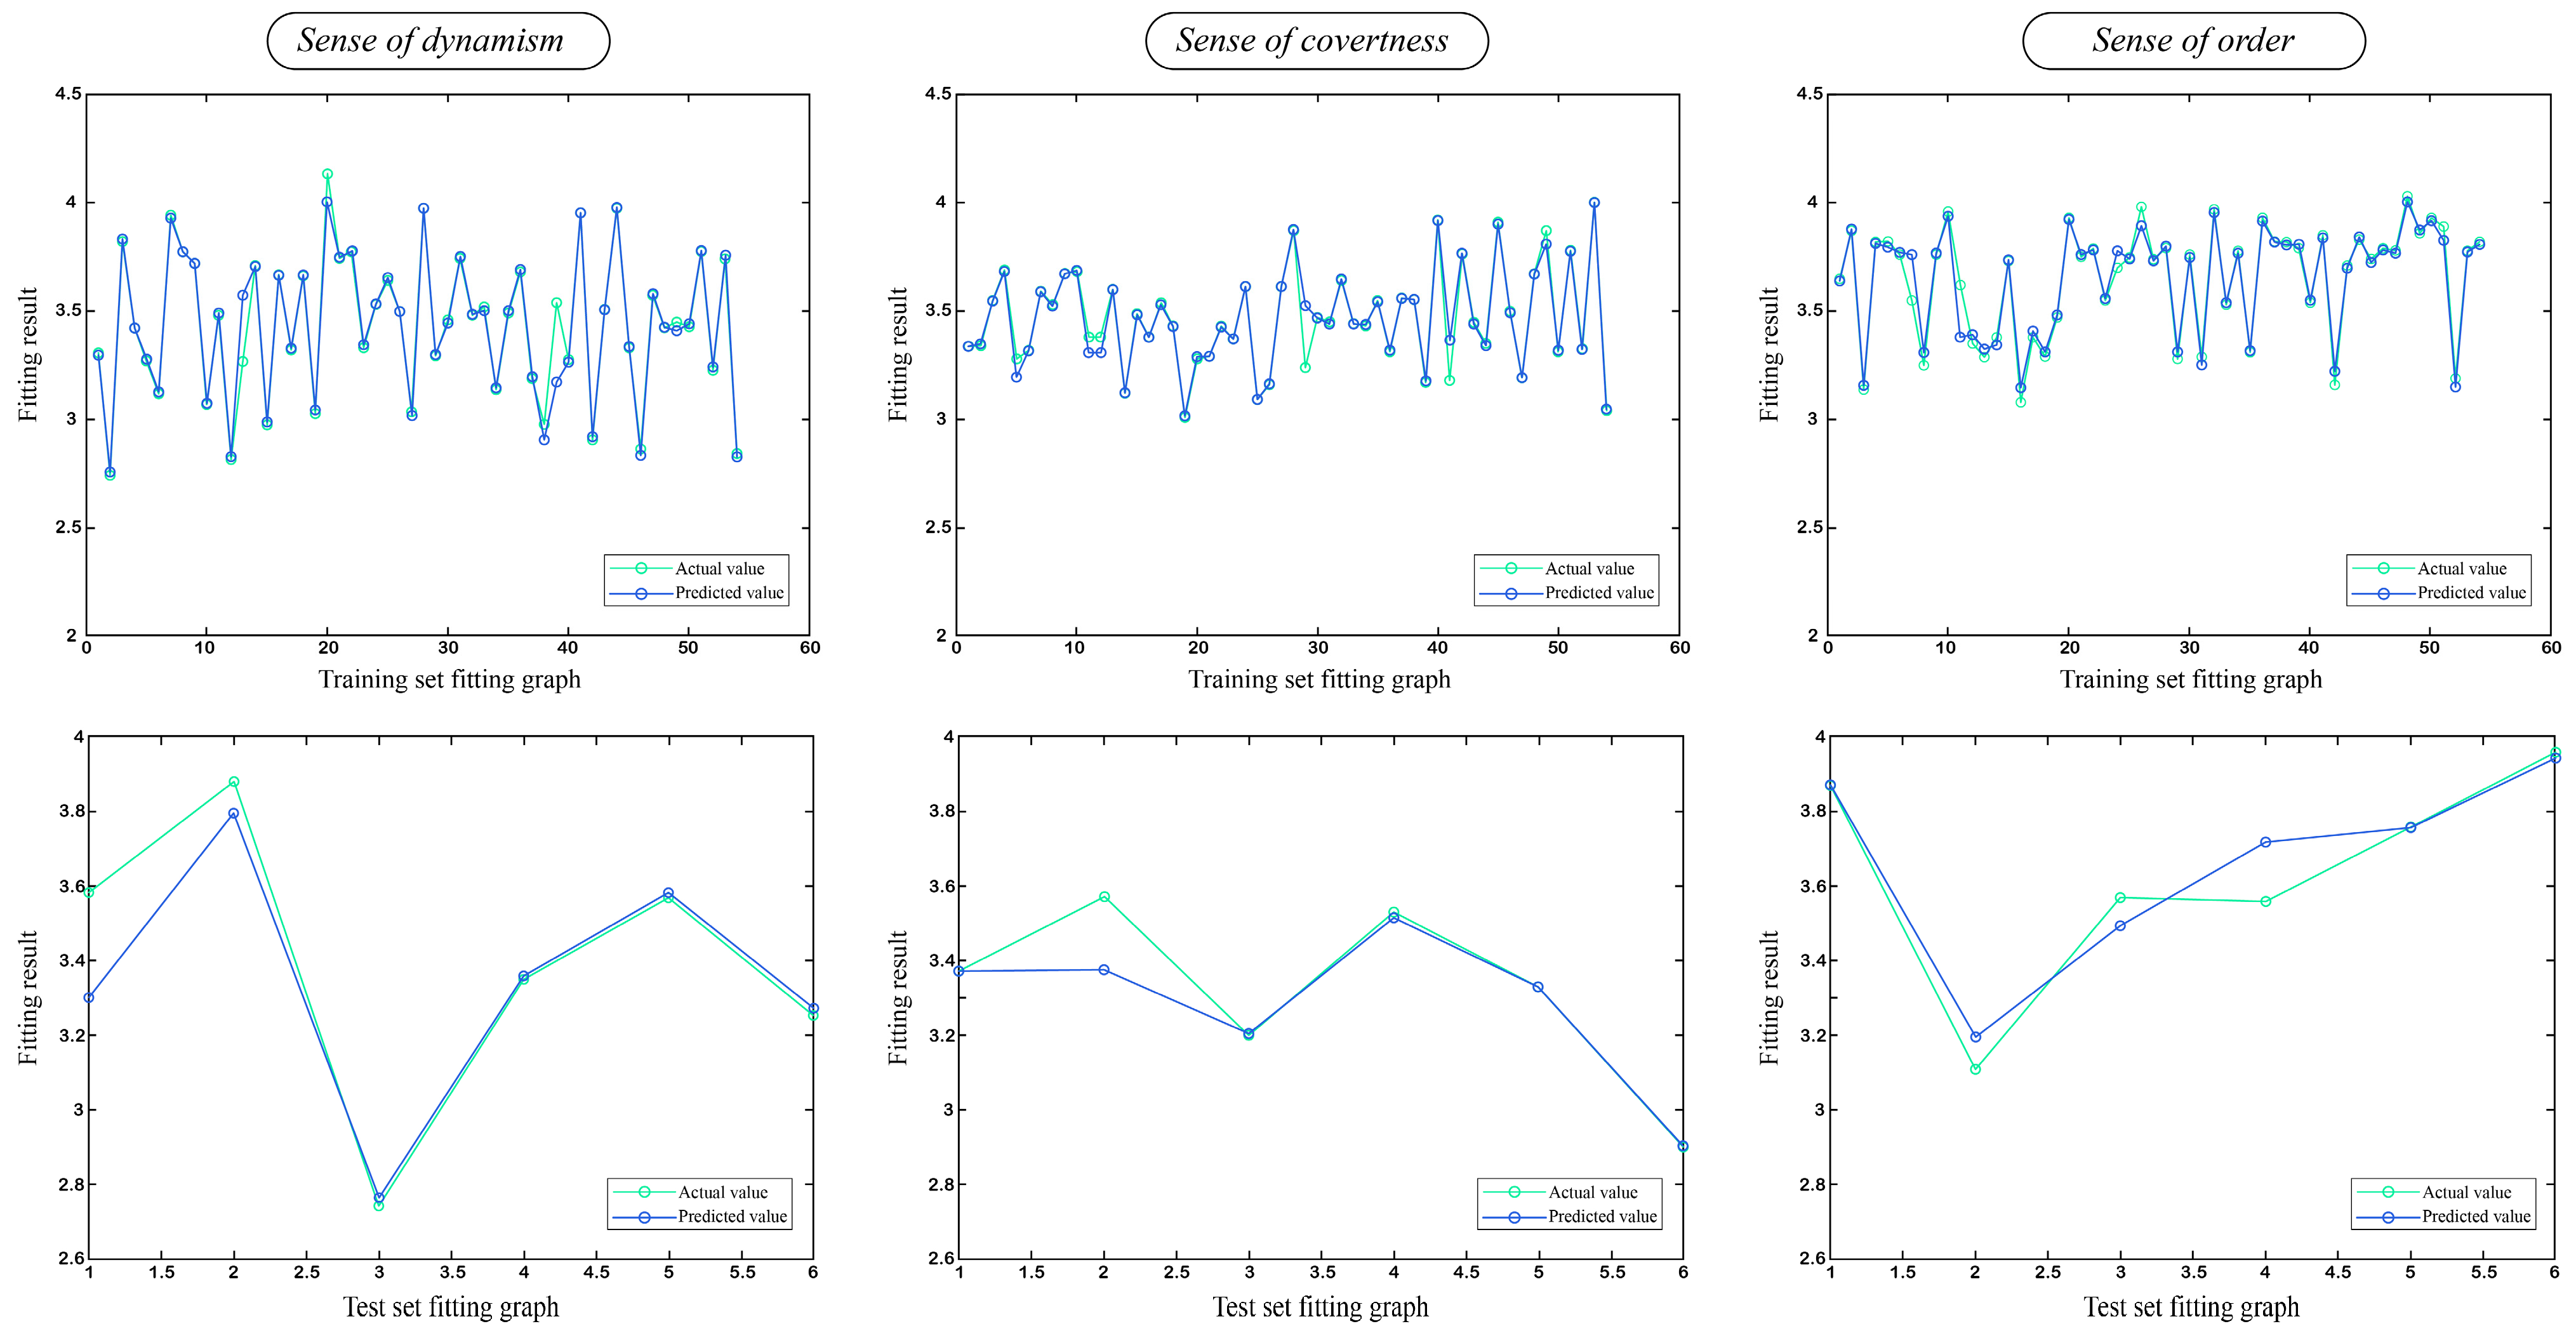
Figure 9 shows the prediction errors between the predicted and actual values on the test set, with the overall error range between −0.2 and 0.4. The figure illustrates that the model performs reliably on most samples, with a high prediction accuracy. However, there is still room for improvement in some samples (e.g., samples 1 and 6), and future optimization efforts could focus on handling these outliers. In addition, the experimental results show that the constructed PSO-SVR model has high prediction accuracy and can be used to establish the mapping relationship between users’ Kansei semantics and OMS design elements. Similarly, we can compare the prediction results of the training sets for the remaining three emotional descriptors, “sense of dynamism”, “sense of covertness” and “sense of order” (
Figure 10), and the parameter results of the emotional descriptors (
Figure 11).
Finally, in order to obtain the optimal OMS design feature combination for improving the outdoor activity duration, as well as the design combination with the highest average value of emotional descriptors evaluation, the RST was used to reduce five key features in this study, each of which has the types 11, 7, 8, 7, and 10, respectively. Therefore, there were a total of 11 × 7 × 8 × 7 × 10 = 43,120 sets of design schemes. By computer-coding all combinations and using them as input layer parameters of PSO-SVR, the Kansei value corresponding to each combination was calculated. For each sample, the evaluation values of the four emotional descriptors were averaged first, and then the maximum value was selected as the criterion to measure the effect of improving the outdoor activity duration. Through this method, the maximum average value of perception evaluation is 4.3870869, and the corresponding design feature combination is the optimal combination for OMS design to improve outdoor activity duration. The corresponding number of design groups is 1, 1, 8, 7 and 10. This method ensures that the evaluation of each emotional descriptors is balanced and provides a quantitative basis for OMS design optimization.
3.4. Analysis of Design Results
To validate the effectiveness of the proposed algorithm, the authors conducted an in-depth analysis of the computed design scheme based on experimental results. In the morphological analysis, the core design elements were selected from
Figure 6, with seating (C
3-1), facade material (C
5-1), lighting (C
7-8), seat orientation (C
10-7) and pavement (C
11-10) as the core design elements, for comprehensive design optimization. In this study, based on the design feature weights output by the algorithm in
Section 3.3.2, five key design elements were identified to influence the duration of outdoor activities. Among them, facade material, lighting, and seating orientation had the same weight (each 0.25), pavement had a weight of 0.1875, and seating had the lowest weight of 0.0625. The equal weights of facade material, lighting, and seating orientation indicate their critical roles in enhancing space comfort, functionality, and user emotional experience. The facade material affects both the visual perception and tactile experience of the space. Although lighting is an important design feature, the combination that scored the highest in the specific design plan had “no lighting” for lighting (8th lighting), indicating that lighting did not have a direct impact on users’ outdoor activity preferences. The seating orientation, however, optimized the space’s social functionality and facilitated user interaction. While ground paving has a relatively low weight, it plays a supportive role in ensuring the convenience and safety of long-term use. Seating, with the lowest weight, reflects its functional role as a supplementary design element. Despite the importance of seating for rest and social interaction, its direct impact on activity duration is smaller compared to other design elements that affect the functionality and emotional experience of the space.
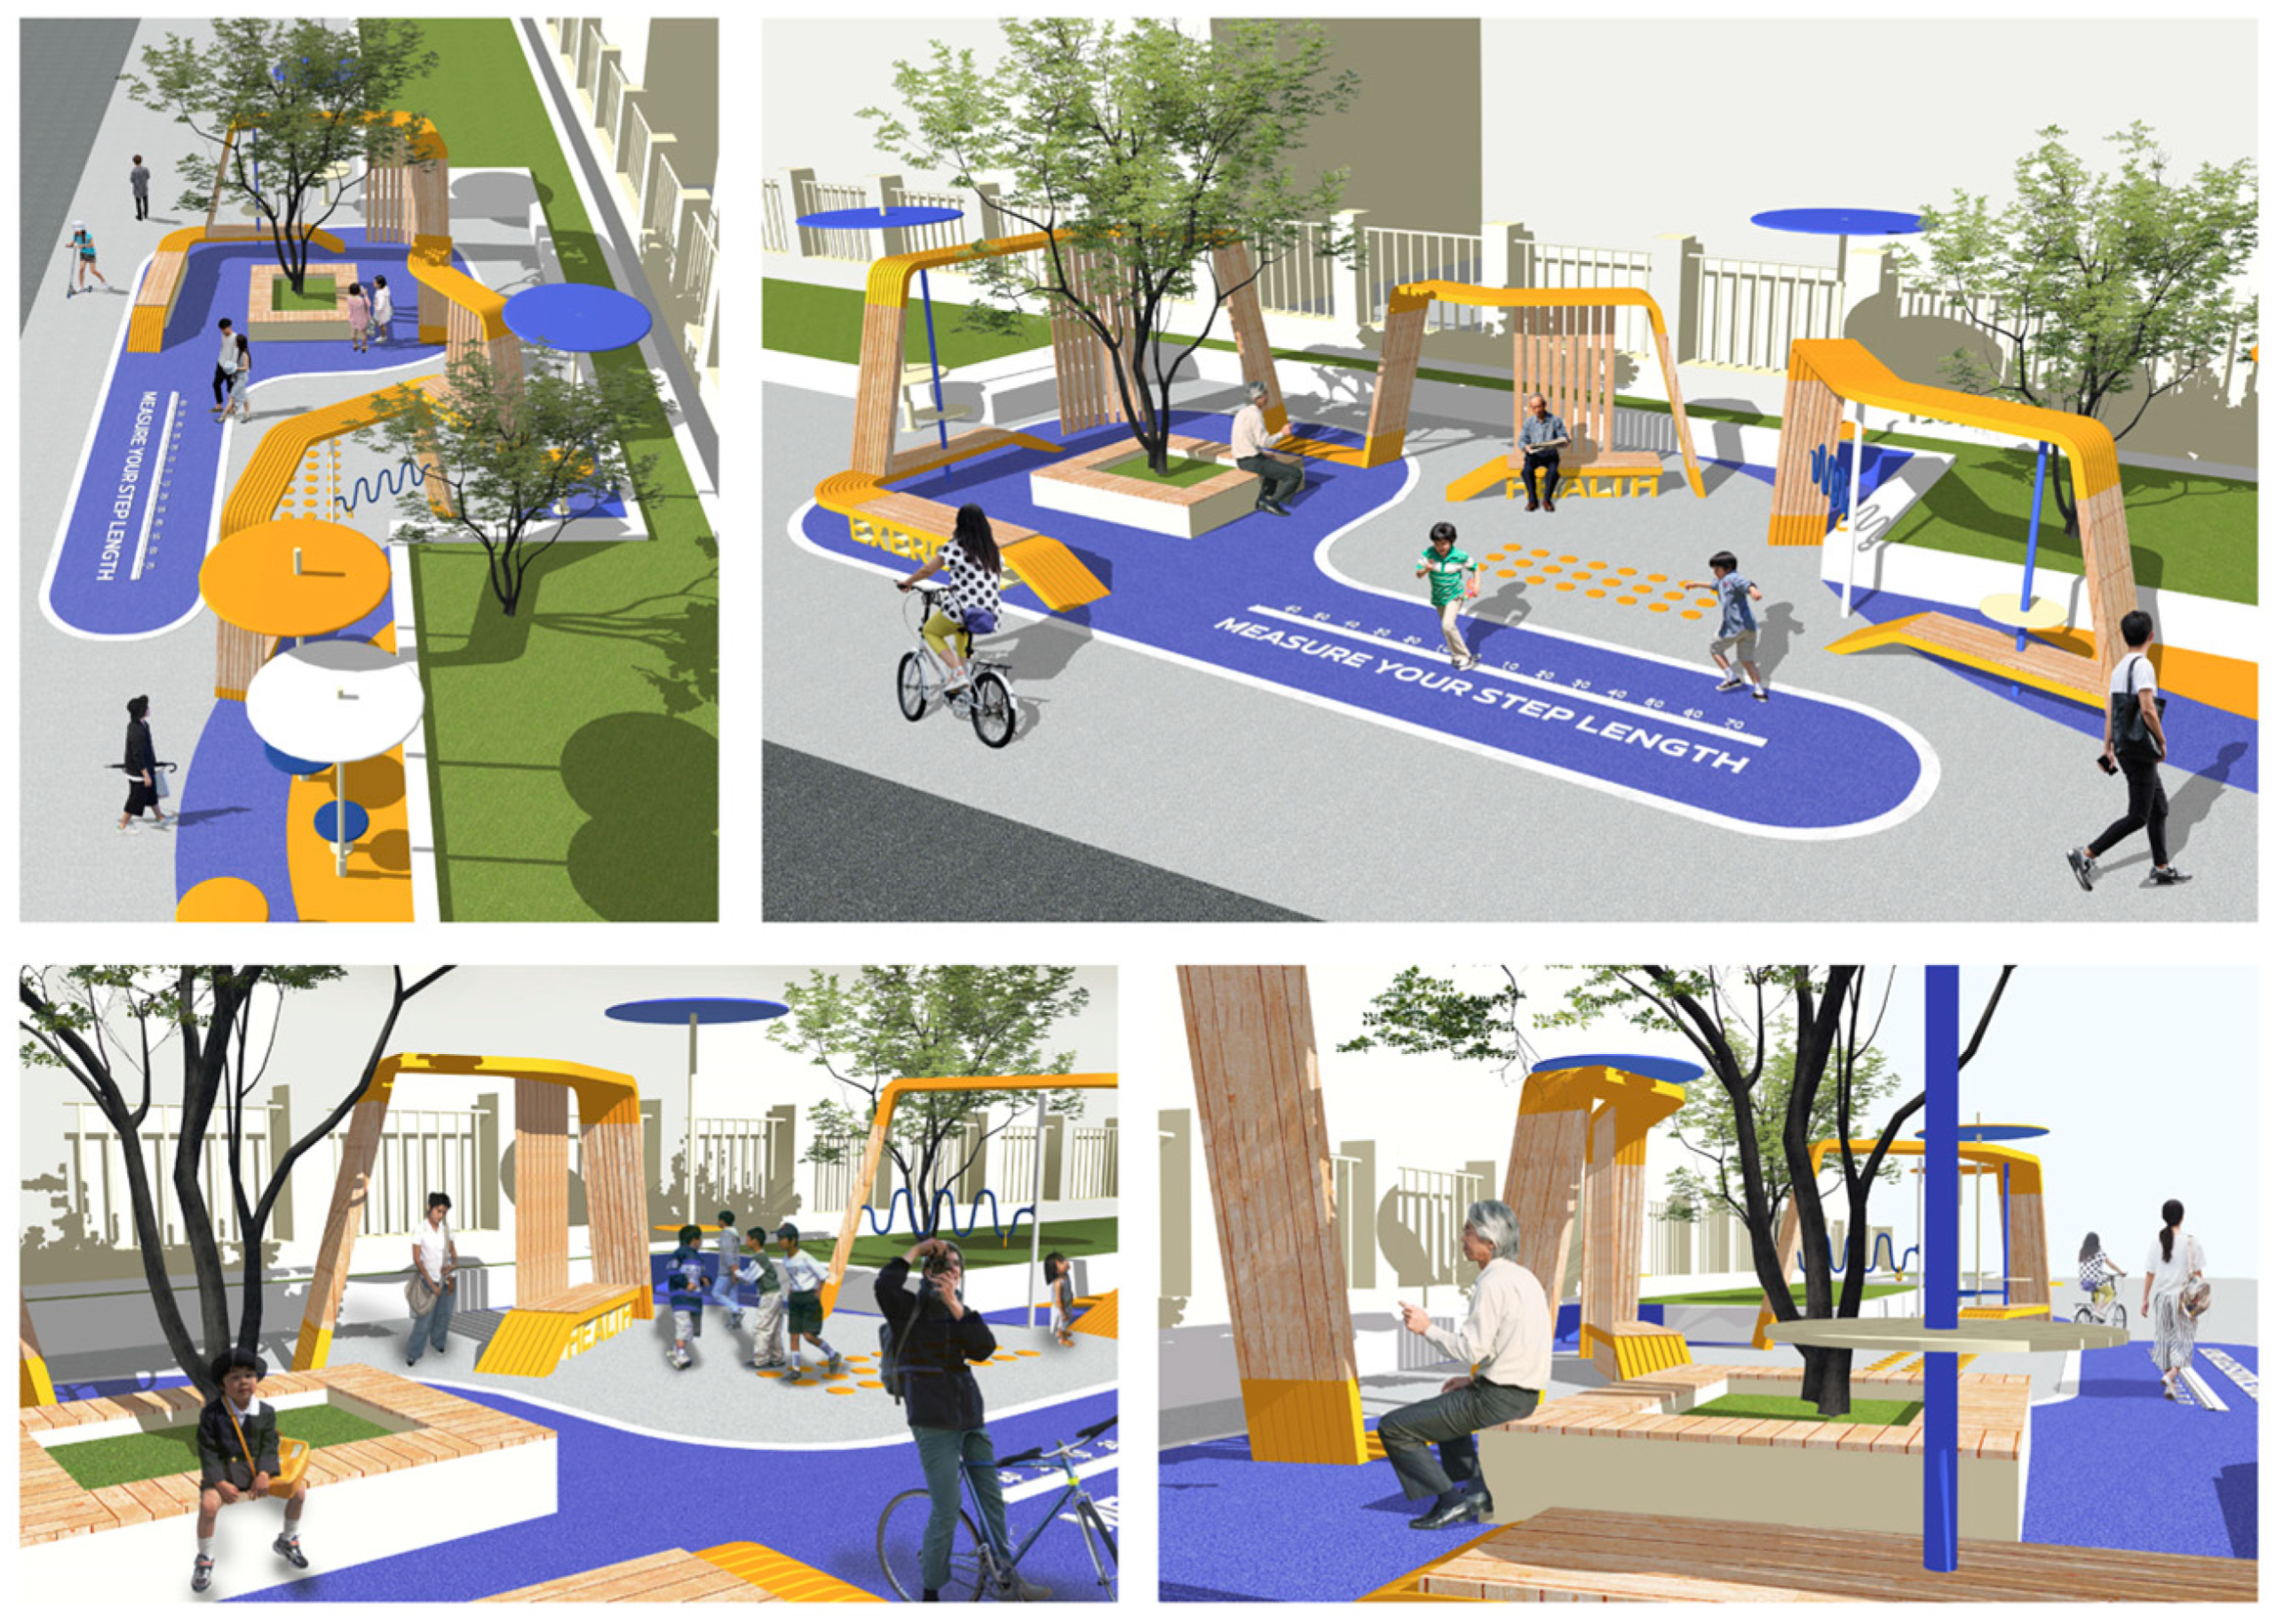
Before deriving the design, we held in-depth discussions with five experts from fields related to spatial design regarding the optimal design feature matching results provided by the algorithm, and explored how these results could be applied in design scenarios. Therefore, the high consistency between the feature weights and actual design priorities is reflected in the following aspects: Firstly, the high priority of facade material in the design reflects its significant role in enhancing the space’s esthetics, comfort, and safety. To enhance comfort, the optimal design group used wood material (C5-1); the combination of this with colors (yellow and blue) and the use of curved shapes contributed to enhancing the space’s dynamism. The seating orientation design, by promoting social interaction, optimized users’ experience within the space. A seat orientation (C10-7), with an open surrounding layout, was chosen to further enhance the overall functionality of the design. For the ground paving design, pavement material (C11-10) with bright colors was selected to ensure both durability and comfort. Seating serves a supplementary role in the actual design, with an emphasis on comfort and functionality. C3-1 was used for seating; it is highly ergonomic, and a simple, straightforward seat shape was chosen. To create a sense of covertness, the design connected the top and facade with a consistent design language, forming a unified visual effect. Finally, by emphasizing design order and regularity, the overall integrity and coherence of the design were ensured.
In summary, the allocation of design feature weights is based on the result of a scientifically optimized algorithm, which helps to avoid subjective assumptions by designers in the practical design process. The alignment between the feature weights and the priorities in actual design ensures that the design solution not only maximizes user experience but also meets the functional and emotional requirements for real-world applications.
SketchUp was used as the 3D modeling tool in the design process and Enscape was used as the renderer. The final design result is shown in
Figure 12. It should be noted that this design scheme is intended solely as a reference for optimizing OMS design., and it still needs to be adjusted appropriately according to specific situations in practical application.
4. Discussion and Evaluation
4.1. Adaptiveness of PSO-SVR in This Study Compared to Other Machine Learning Models
In this study, to better understand the impact of OMS design features on users’ emotions and effectively enhance outdoor activity duration, we first determined the weights of Kansei indicators and design features to provide data support for the subsequent design process. Previous research has explored similar methodologies: Yang et al. [
79] combined the Kano model and Quality Function Deployment (QFD) to identify key design fields and technical challenges in new product innovation, while Sheng et al. [
80] used the Analytic Hierarchy Process (AHP) to build a color factor model for military cabin design; Garg et al. [
81] employed Principal Component Analysis (PCA) to reduce feature dimensions, revealing redundant information in the feature space.
However, these traditional methods have limitations, including subjectivity, high computational complexity, and insufficient data support. To address these issues, RST was employed for attribute reduction, providing a more objective and accurate evaluation of the influence of design features on emotional factors. RST does not rely on external information for attribute reduction, making it particularly well suited for establishing a mapping relationship between users’ emotional intentions and design features in KE.
Traditional linear statistical models, such as AHP and QFD, exhibit limitations in handling subjective and uncertain user emotion data. With the rapid advancement of artificial intelligence, technologies such as Convolutional Neural Networks (CNNs), Genetic Algorithms (GAs), Backpropagation Neural Networks (BPNNs) and Random Forests (RFs) have been widely applied in constructing mapping models between product design features and user emotions. However, these machine learning methods exhibit distinct advantages and disadvantages when addressing complex problems, particularly in terms of computational efficiency, ease of implementation, and model complexity (
Table 5). BPNNs have an advantage in handling nonlinear relationships but are prone to overfitting. As the network depth increases, the computational complexity and training time grow significantly, resulting in lower computational efficiency, particularly for large datasets or complex tasks, making them less suitable for practical implementation. RFs, while reducing the risk of overfitting, require a large computational load during training and prediction, especially when the dataset is large or the feature dimension is high, which can make them relatively slow. CNNs excel in image processing and spatial feature extraction but have a complex structure and training process, requiring substantial computational resources, especially when dealing with high-dimensional data, which leads to significant computational time consumption. GRAs are suitable for handling small samples and simple relationships with low computational complexity, but they perform poorly when faced with complex nonlinear problems. IGAs, while performing well in multi-objective optimization, have a slower convergence rate and a higher loss rate in the early stages of optimization, leading to lower computational efficiency. In contrast, PSO-SVR combines the global search capability of PSO with the powerful regression ability of SVR, enabling the effective handling of high-dimensional and complex data, particularly excelling in cases of fuzzy data representation and complex reasoning. The global search capability of PSO allows it to find the optimal solution in fewer iterations, significantly improving computational efficiency.
To further validate the superiority of PSO-SVR, we applied the dataset to traditional machine learning models, including BPNN, RF, and SVR, and compared their performance with the proposed PSO-SVR model to evaluate their generalization ability and robustness. The performance of the four models was assessed on four datasets in the form of scatter plots (
Figure 13). In the scatter plots, the results of the training and test sets for all four models under different emotional data were presented with linear fits. Both RF and BPNN exhibited poor performance on the training and test sets across all four emotional datasets. Although SVR performed well on the training set, it showed inferior performance on the test set compared to PSO-SVR. Therefore, PSO-SVR outperformed the other three models on both the training and test sets. This indicates that SVR, by optimizing model parameters, improves its handling of nonlinear data, allowing PSO-SVR to excel in terms of both accuracy and generalization ability. Its computational efficiency and ease of implementation make it a more ideal choice.
By extracting key design features using RST and developing a nonlinear mapping model with PSO-SVR, this study successfully processes large-scale Kansei data, significantly improving both prediction accuracy and computational efficiency. Compared to traditional knowledge engineering methods, the novelty of this study lies in PSO-SVR’s optimization capabilities, which effectively resolve issues related to computational complexity and model fitting. As a result, this study provides a fast, effective, and accurate tool for Kansei research in OMS design.
4.2. Evaluation of the Design Scheme
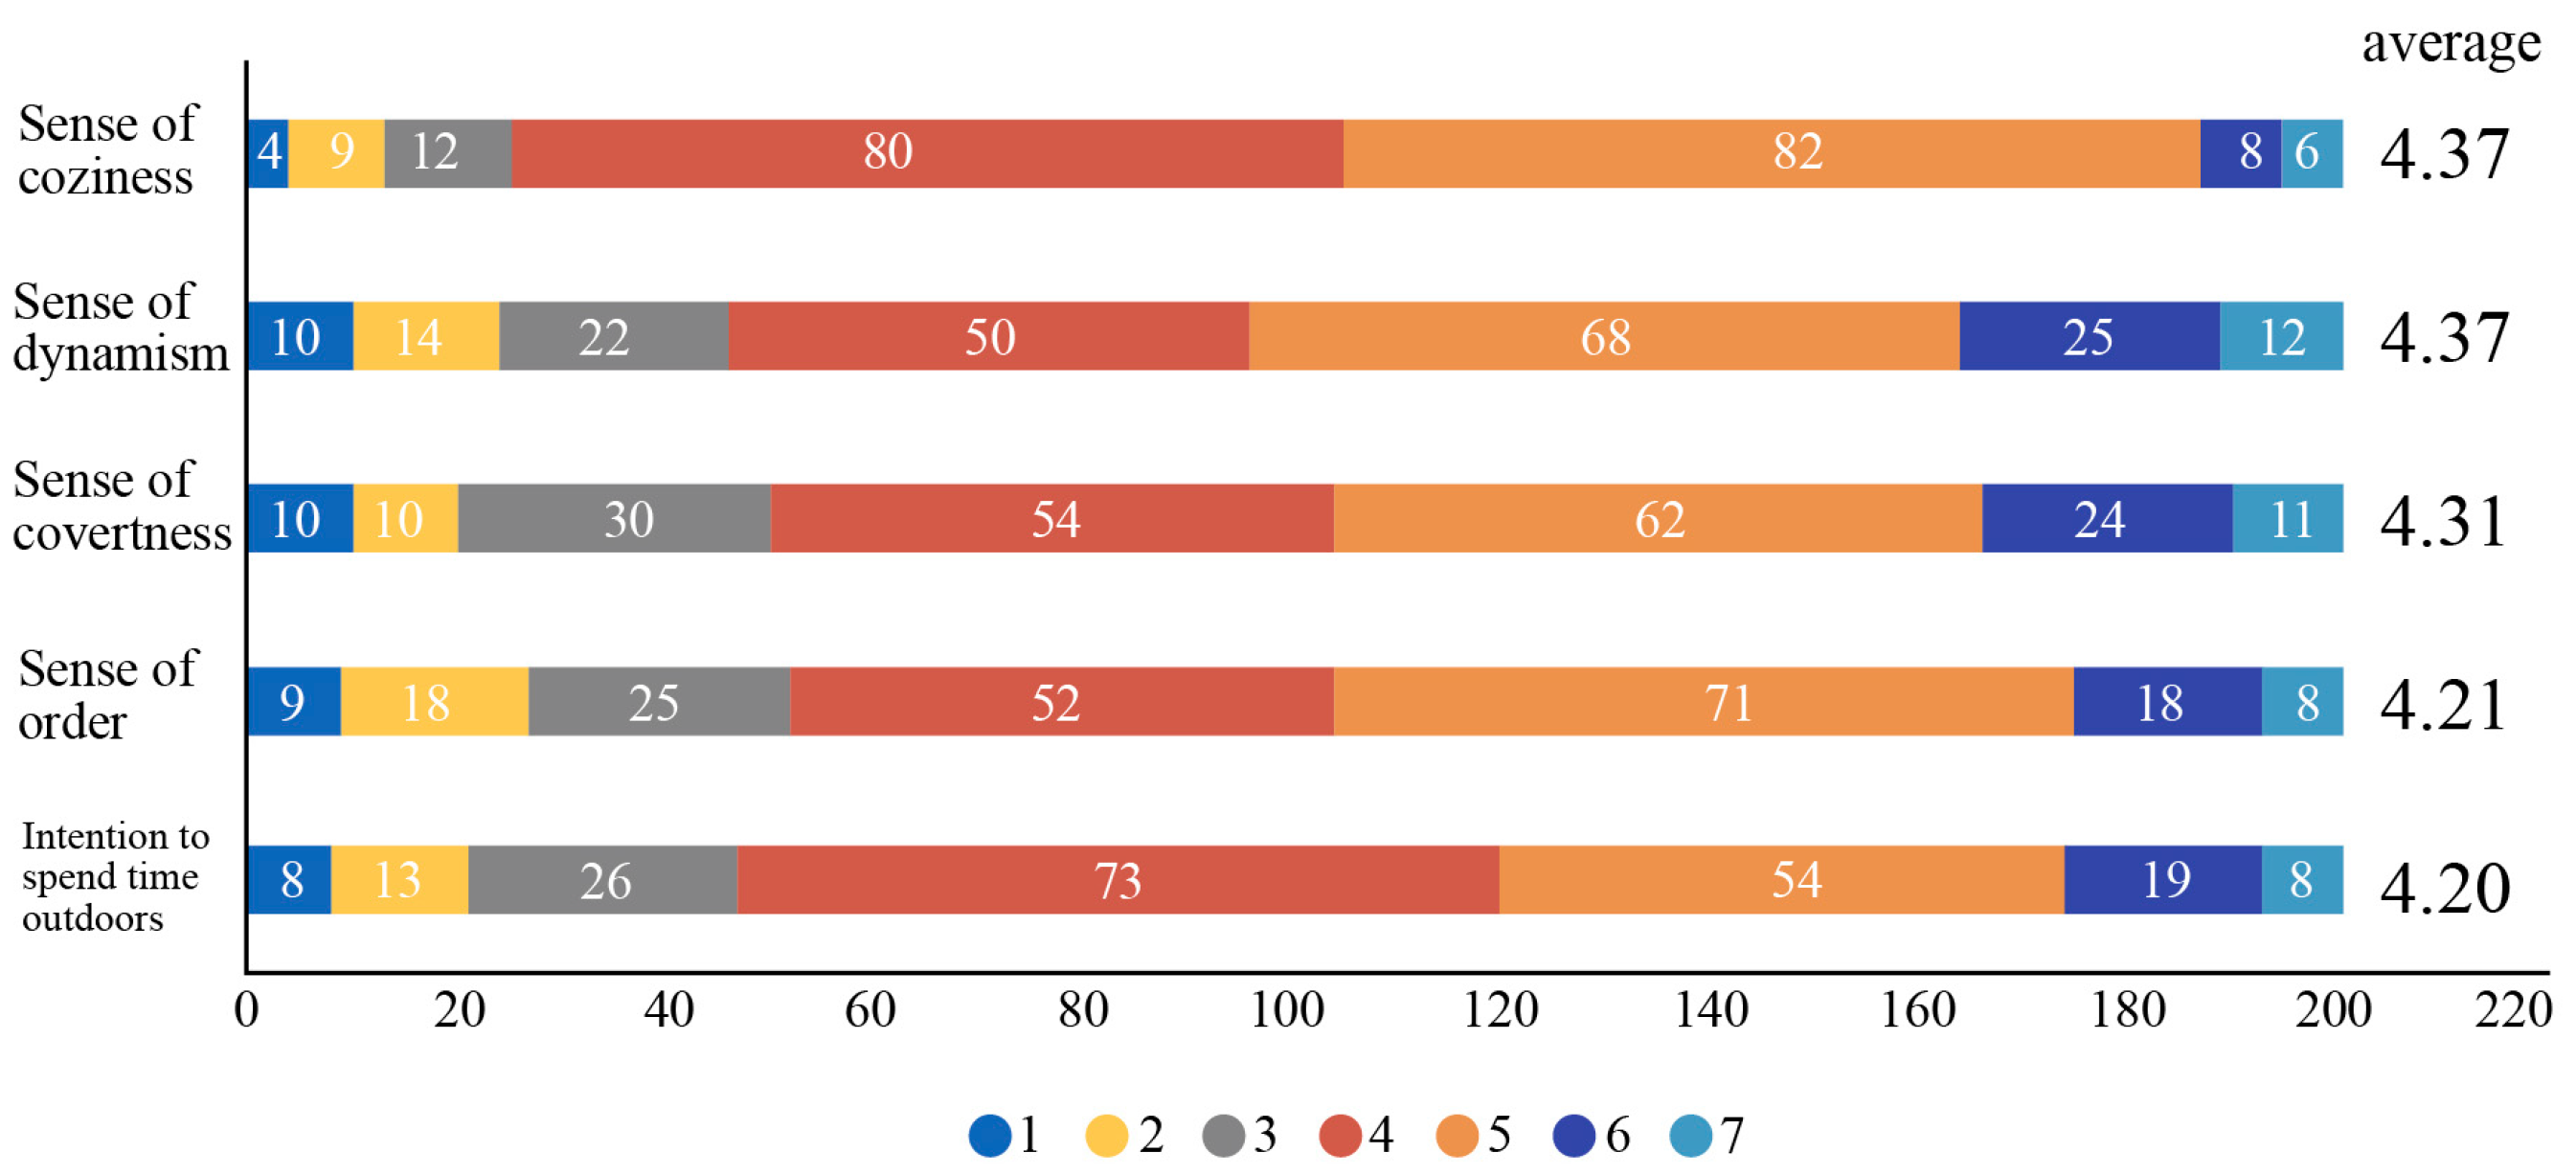
To verify the feasibility of the proposed method in OMS design and its practical impact on enhancing users’ outdoor activity duration, we recruited 201 participants for evaluation. The participants varied across different age groups, genders, and cultural backgrounds, ensuring the broad representativeness and diversity of the results. The age range of the participants was from 20 to 65 years, with an average age of 32 years, and the gender ratio was 105:96 (male: female). To better reflect diverse user needs, we also considered participants’ cultural and professional backgrounds. These participants had a wide range of professional backgrounds, including experts in urban design, architecture, environmental art, public space management, as well as ordinary citizens and students with practical experience using OMS. In addition to age, gender, and cultural background, this study specifically considered participants’ outdoor activity experience and frequency of space use. Among the participants, 138 were frequent outdoor activity participants, with most engaging in outdoor activities more than three times per week, each lasting over 30 min. This ensured that they had sufficient practical experience with OMS. The remaining 63 participants were infrequent outdoor activity participants, typically engaging in outdoor activities no more than twice a week, in shorter durations. This group mainly included office workers and retirees, whose feedback could reflect the differing needs of various user groups, and the study aimed to determine outdoor activity intentions among this group through well-designed OMS facilities.
The evaluation was conducted through a questionnaire, where users were asked to assess whether the OMS design in
Figure 12 met the emotional intentions of comfort, dynamism, covertness, and orderliness, as well as whether it could influence their intention to increase outdoor activity duration. A 7-point Likert scale was used, with 1 indicating “strongly disagree” and 7 indicating “strongly agree”. According to the survey results, the scores for sense of coziness (4.37), sense of dynamism (4.37), sense of covertness (4.31), and sense of order (4.21). were all above the median score of 4, indicating that the optimization of these emotional descriptors effectively enhanced users’ spatial experience and increased their intention to engage in longer outdoor activities (4.2). These results suggest that optimizing OMS design can significantly improve users’ emotional satisfaction and promote longer outdoor activities. The specific data are summarized in
Figure 14.
The results clearly demonstrate that the OMS designed using the method proposed in this study has a positive effect on both satisfying emotional intentions and increasing users’ intention to engage in outdoor activities for longer durations. The social and physical environment of a region can impact the well-being of its residents [
82]. Research by Pazhuhan et al. emphasizes the influence of urban environmental design on residents’ quality of life (QoL), particularly highlighting the importance of comfort, social interaction, and spatial safety for residents’ mental health and social well-being. The findings of this study are highly consistent with this perspective, indicating that the optimized OMS design, by enhancing emotional features, can effectively increase users’ activity intentions. This not only enhances their physical and mental health but also promotes social interaction, indirectly improving quality of life. Through the analysis of user feedback, this study further confirms the validity of the proposed design method, providing practical theoretical support and empirical evidence for future OMS designs.
5. Conclusions
This study aimed to optimize the design of OMS by integrating RST and PSO-SVR to enhance outdoor activity duration and improve users’ outdoor experiences. In the field of urban design, OMS not only impacts residents’ daily quality of life but also has a profound influence on health and well-being. Therefore, addressing how to combine users’ emotions with spatial design features and optimizing them scientifically is both a challenging and urgent issue. While some research has explored the application of emotional design in outdoor spaces, there remains room for improvement in accurately mapping emotional data to spatial design features.
To incorporate emotional elements into OMS design and establish a more accurate emotional prediction model, this study proposes a method that combines RST and PSO-SVR within the framework of KE. FA was used to reduce the dimensionality of emotional words, successfully extracting representative core emotional descriptors, thereby providing a more accurate foundation for the mapping between emotions and spatial design features. A morphological decomposition table was used to summarize the 112 component features of OMS. RST was then applied for attribute reduction, effectively identifying the five key design features (seating, facade material, lighting, seating orientation, and pavement) that have the most significant impact on user emotions. These features played a central role in subsequent model optimization. The improved PSO-SVR model was employed to fit the nonlinear relationship between user emotions and morphological features, ultimately predicting the optimal configuration of OMS design. Based on this predicted configuration, an optimized design solution was proposed and validated through an evaluation by 201 users. The evaluation results indicated that the scores for the four emotional descriptors and the intention to prolong outdoor activity duration were all above the median value of 4 on the scale. This suggests that the optimized design significantly enhances users’ emotional experiences and activity intentions. These findings validate the effectiveness of the proposed method in enhancing the emotional aspect of OMS design and promoting users’ intention to engage in longer outdoor activities. In comparison with other traditional mapping models (such as BPNN, RF, and SVR), PSO-SVR demonstrated superior accuracy and generalization ability in emotional prediction, significantly outperforming these conventional methods. This discovery not only proves the superiority of PSO-SVR but also provides important empirical evidence and theoretical support for the integration of emotional design and spatial optimization in future research.
From a practical perspective, this study proposes the integration of KE, RST, and PSO-SVR as an auxiliary design tool to help designers identify user emotional needs, optimize the selection of design features, and allocate weights during the initial design phase. This approach provides scientific guidance for real-world OMS design applications. Considering the emotional differences among various user groups, designers can dynamically adjust the parameters of the model based on specific scenarios and target user groups, thereby tailoring designs to meet diverse needs. This approach helps further improve the precision and effectiveness of the design, driving the personalization and accuracy of OMS design.
In summary, this study offers an optimization framework for OMS design based on user emotions, providing both methodological and theoretical support for future design practices. The proposed method fosters the development of public spaces that better meet user needs, driving continuous innovation in urban design, and enhancing the contribution of cities to human health and well-being.
The main contributions of this study are as follows:
- (1)
Artificial intelligence technology is introduced to assist designers in decision-making, integrating computer science and data science into the field of urban design.
- (2)
RST-based reduction and algorithmic models are combined to establish a new OMS design process that translates users’ emotional needs into specific design features, providing practical guidance for design.
- (3)
By optimizing the parameter configuration of the SVR model through PSO, the accuracy and generalization capabilities of the model in handling complex data are significantly improved, demonstrating the potential of the PSO-SVR algorithm in urban design.
However, there are limitations in this study that need further improvement:
- (1)
Users’ emotional needs evolve over time and in response to changing circumstances, but the emotional mapping model used in this study does not fully account for these dynamic changes. Future research will focus on continuously collecting user feedback and emotional fluctuation data, regularly updating the model parameters to maintain its efficiency over extended use. The preliminary concept aims to dynamically adjust the weights of design features using real-time data streams (such as sensor data, user behavior data, etc.), which will help the design better accommodate the emotional needs of different users at various time intervals. Additionally, incremental learning techniques will be employed to dynamically incorporate new data, ensuring the model’s flexibility and accuracy while capturing the temporal changes in user emotional needs. This approach will enable the design to better align with the long-term needs of users.
- (2)
The cultural backgrounds of the user group in this study are relatively homogeneous, which may limit the generalizability of the results to other cultures or regions. Future research should consider cross-cultural comparative studies to explore the differences in users’ emotions and design preferences across different cultural backgrounds, aiming to develop more globally applicable design methods.


