Abstract
In the context of high academic pressure and inadequate physical activity (PA) among adolescents, it is important to study how the physical environment and students’ perceptions affect their physical activity during school recess. An empirical study was conducted in four secondary schools in Xi’an to gather data on students’ physical activity using DJI Mini Drone recordings and self-reported questionnaires. Three physical activity indices—concentration, type richness and intensity—were visualized and quantified for intercomparison. This study found that physical environmental factors such as the building shape complexity and green space proportion significantly affected the PA concentration and intensity indices, whereas the campus area per student, the average distance to PA facilities and the number of PA facilities indicated a strong correlation with the PA richness index at the school level. Additionally, perceived environmental factors like space safety, facilities enjoyment and visual accessibility exerted influence on the PA intensity and frequency at the individual level. The study’s results confirmed previous findings from a social–ecological perspective and provide a comprehensive assessment framework that includes the spatial organization/spatial quality of the school and the perceived variables of safety, comfort, aesthetics, accessibility and functionality. By incorporating spatial, perceptual and behavioral aspects, this approach provides an efficient and integrated analytical methodology to promote adolescents’ health in school.
1. Introduction
1.1. Background
The World Health Organization recommends that school-aged adolescents should engage in at least 60 min of moderate–vigorous-intensity physical activity (MVPA) daily [1]. However, survey results reveal that over 80% of adolescents globally are physically inactive, with 85% of girls and 78% of boys not meeting the WHO recommended level [2]. In China, statistics show that the rates of overweight and obesity among adolescents have reached 25.2% and 8.5%, respectively [3]. It has been proved that physical inactivity not only leads to obesity but is also associated with chronic and cardiovascular diseases [4], and has a negative impact on the mental health of adolescents, potentially increasing the risk of depression.
It is evident that adequate physical activity is an effective way to promote health [5]. However, due to increased study pressure and new lifestyle trends in the network era, students are less willing to participate in physical activities and more inclined to be sedentary in their leisure time [6]. Therefore, it is urgent for this group to address these serious challenges by practicing healthier behaviors. Given that students spend most of their time at school, it is considered the ideal place to implement interventions and improve physical activity [7]. These findings emphasize a great opportunity to increase physical activity (PA) during the school day [8]. Studies have shown a connection between school-based physical education (PE) programs and overall student PA [9]. Additionally, research has indicated that integrating PA into the school curriculum beyond PE class has benefits for students’ health, social well-being and academic achievement [10]. Encouraging students to participate in MVPA such as jogging, chasing games and ball games during school recess can promote both their physical and mental well-being. Effective interventions for increasing school-based PA often involve multiple components, evidence-based strategies, regular activity breaks and family involvement [11]. However, it is not entirely clear how the built or physical school environment has the direct, mediating or modifying impacts on these interventions [12]. Collaborative efforts in public health and architecture have suggested that school design can significantly contribute to preventing obesity [13]. Despite growing research on PA-related outcomes and the school physical environment, this body of work has not been consolidated to inform school design practice and research [14]. Therefore, it is of great practical significance to study the influence of the school environment on students’ physical activity and to promote students’ health by improving campus space quality.
1.2. Literature Review
The physical environment has a significant impact on people in various ways. It presents a wide range of stimuli for our senses to react to. We experience the world through sight, hearing, smell and touch, which is stimulated by our surroundings [15]. As a result, we develop individual cognition and behavior based on our environment. In other words, the physical environment affects people’s well-being in terms of both mind and body. For adolescents, previous reviews have shown that school environments, including ventilation and sunlight, can impact students’ cognitive performance, and the absence of these factors can lead to health-related symptoms [16]. In addition to air quality, links to nature, lighting and temperature in schools, the design of the physical space is equally important to consider. A study that examined how the built environment within and around classroom spaces influences student learning provides suggestions for designers to create dynamically configurable spaces [17]. It is more important to recognize that designed environments are very heavily dependent on the physical, organizational and social context within which they are created. The causal relationships between building design and behavior are complex. Buildings and sites are deliberately designed to support a set of activities. However, as individuals use buildings daily, they are affected by physical aspects of the building and site, such as the availability of space for different functions and aesthetics. The relationships between policy and behavior are also complex and can plausibly affect physical activity. Furthermore, each of these relationships is potentially mediated and moderated by individual knowledge and attitudes. From this, a social–ecological model has been adopted for exploring the relationship of design to physical activity in an attempt to capture these multiple relationships [18]. Meanwhile, previous studies on the influence of the school environment on adolescents’ physical activity have mostly been from a social–ecological perspective [19,20]. According to the theoretical model, McLeroy divided the influencing factors of adolescents’ health behaviors successively into the following five levels: individual, interpersonal, organizational, community and public policy levels [21]. Stokols proposed that effective health behavior change involves joint intervention and interaction at multiple levels [22,23]. Summarizing previous studies, Sallis proposed a detailed ecological model that divides physical activities into the following four types: leisure, transportation, housework and occupation, each in different contexts. He emphasized the importance of the physical environment (equipment, stairs, etc.) and perceived environment (safety, comfort, accessibility, etc.) as variables. He also proposed a list of environmental factors, such as walkability and facilities, that can be observed and measured, thus promoting research on the health effects of the built environment [24].
According to the social–ecological framework, numerous observational and experimental studies (including cross-sectional studies, longitudinal intervention studies, cluster matched studies, etc.) have been conducted to examine the physical activity levels of students during school recess [25,26,27]. Various methods, such as GPS, accelerometers and self-reported questionnaires, were used to collect data on students’ physical activity levels [28,29]. These studies have identified multiple factors that influence physical activity, including individual factors (age, gender, grade level, BMI, interest and enjoyment), social environmental factors (encouragement and support from friends/teachers, and supervision), policy and organizational factors (physical education, recess duration and organized activities) and physical environmental factors (the size of the physical activity area, access to facilities and the play surface) [30,31,32]. Perceived environmental factors, such as the perceived availability and comfort of the facilities, were also found to be significant in promoting physical activity. However, research in this area has been limited, with Fein being one of the few to explore the relationship between the perceived availability and importance of physical environmental resources (the neighborhood, home and school environments) in relation to physical activity levels among youth [33]. This area of research inquiry has been under-investigated. In conclusion, for architects and designers, as well as school planners, educators and public health professionals, physical activity design research for school architecture can provide an opportunity to engage scientists in transdisciplinary perspectives toward improved knowledge of the school environment’s impact [34].
1.3. Study Aims
This study provides a focused examination of the impact of school-based physical and perceived environmental factors on secondary school students’ physical activity during recess, and delves into how the school environment (including buildings and sites) can be intentionally designed to influence students’ perception and then to promote their physical activity, both from the school level and the individual level. In addition to PA intensity (vigorous/moderate/low), visualizing the types of PA richness (different types) and their locations/concentrations (PA spatial distribution) in school from the three categories makes this study comprehensive and distinct (Figure 1). The research questions guiding this study are as follows:

Figure 1.
Methodical framework of this study.
Research Question 1: From the whole-school level, what are the students’ PA richness, spatial distribution and intensity in each sample school? How do school physical environmental factors relate to students’ physical activity characteristics?
Research Question 2: From the individual student level, how do school perceived environmental factors relate to the intensity and frequency of physical activity among students?
The research objective is to identify the important environmental factors in motivating students to be physically active in school by surveying four secondary schools, and to discuss how these findings can be applied in the design/plan of school buildings and sites.
2. Materials and Methods
2.1. Study Design, Study Settings and Participants
This cross-sectional study was located in Xi’an, Shaanxi, China, while strictly adhering to ethical standards to protect the rights and confidentiality of the study participants. Four secondary schools in the old town of Xi’an were selected as research objects. Sample schools had varying site areas ranging from 14,665 m2 to 24,845 m2, and class sizes ranging from 25 to 48. The school building layouts predominantly featured “L” or “U” shapes, as well as courtyard enclosures with various combinations. These schools were constructed over a span of time from the 1950s to the 2010s, rendering them different and representative. Two matched groups were established, each consisting of two schools with similar layouts but noticeable differences in functional composition (facilities configuration, etc.), spatial quality (building spatial hierarchy, etc.) and greening landscape (greenery, etc.). Leveraging these differences, a comparative analysis was conducted within each matched group.
According to Cohen’s recommendation [35], we meticulously observed and recorded the physical activity patterns of students in the sample schools over a four-day period from March to May 2023. During observation period, 3 to 6 activity area observers and 1 DJI Mini Drone (DJI Mavic 2 pro) operation observer were set, respectively, with good weather conditions. Relevant personnel were trained in advance to be familiar with the DJI Mini Drone flight route, video recording operation and coding of various PA types based on the OSRAC-P Manual. The Observational System for Recording Physical Activity (OSRAC) is a focal child system to collect information about the behavioral and contextual circumstances. This rigorous preparation enhanced the efficiency of both ground and aerial observations. Aligned with the school schedule, our daily observations captured each 10-min break between classes, a 30–40 min lunch break and a 35–45 minutes free play session after school. A total of 2616 secondary school students were involved in the recess PA survey, including 1857 boys and 749 girls from 7th to 12th grade (Figure 2).

Figure 2.
Urban location, community and surroundings, site plan and DJI Mini Drone view of the PA records of the four sample schools.
2.2. Data Collection
2.2.1. School Characteristics
The physical environment of a school is multifaceted, encompassing the spatial organization and spatial quality. Spatial organization is influenced by factors such as the size of PA areas per student, the building shape complexity and the average distance to PA facilities. Meanwhile, spatial quality is determined by factors like the green space proportion, the shelter proportion and the number of PA facilities [36]. These factors have been meticulously documented in Table 1, obtained through rigorous methods including field investigation and DJI Mini Drone ortho-photos.

Table 1.
Description of parameters of school physical and perceived environmental characteristics.
Equally crucial is students’ perceptions of the school environment, which span variables such as safety, comfort, aesthetics, accessibility and functionality. A comprehensive five-level Likert scale questionnaire, containing 16 campus environment description items (Table 1), was designed to capture students’ subjective evaluations. A higher score indicates a more positive perception. The questionnaire was designed to be easily comprehensible for secondary school students, who completed it individually on paper during brief breaks, with the entire process taking no more than 10 min. Meanwhile, unstructured interviews were conducted in the sample schools with students selected randomly in each grade to record their perceptions and feelings about the schools.
2.2.2. Physical Activity Data
The observation of the PA areas in the schools included playgrounds, squares, courtyards and roof platforms (Figure 3). The number of participants, their gender, activity type and intensity in each activity area were collected through field observations and DJI Mini Drone recordings. The activity types were categorized as social and leisure activities (walking, chatting, watching, chasing, etc.), ball activities (basketball, football, badminton, table tennis, etc.), track-and-field activities (running, long jump, etc.), equipment activities (rope skipping, shuttlecock kicking, single and parallel bars, etc.) and transportation activities (up and down stairs to classrooms, etc.). In terms of the activity intensity, levels were classified as low (1.6 MET to 2.9 MET), moderate (3.0 MET to 5.9 MET) and high (≥6.0 MET) (Figure 4) [37]. Additionally, another group of students from six grades completed self-reported questionnaires according to the PAQ-A (Physical Activity Questionnaire for Adolescents made by the University of Saskatchewan, Canada, conducted on the reliability and validity) to provide information on their daily frequency of outside physical activity between classes and the duration of outside physical activity during lunch breaks. Both school characteristic data and physical activity data were collected using several different tools. For these multi-source data, it is explained that triangulating the data by using multiple other sources can enhance the credibility [38].

Figure 3.
Classification for outside public space as observing PA areas.

Figure 4.
Sankey map of students’ physical activity distribution for different sexes, intensity levels and types in the four sample schools.
2.3. Data Processing Methods and Analysis
To gain insights into the students’ physical activity at the school level, this study investigated the following three categories: the PA type, PA spatial distribution and PA intensity. The study employed the following methods: first, individual students’ physical activity during recess was captured by the DJI Mini Drone over four observation days and then recorded in ArchGIS with precise geographic coordinates marked on the campus map. Attribute information such as gender, activity type and intensity was also input into the system. This allowed for the visualization of the spatial distribution of different PA types and their intensity levels at each school. Secondly, the outdoor areas where physical activity was observed at each school were divided into a 10 × 10 m grid using fishnet creation in ArchGIS, providing complete coverage of the outdoor spaces. Each student’s activity point was then assigned to the corresponding grid within this system (Figure 5) [39]. Quantitative calculations were conducted for each grid, treating them as spatial units across three key categories of physical activity (PA). These categories encompass the PA concentration level, PA richness level and PA overall intensity level. The PA concentration level involves tallying the total number of physically active students in each spatial unit. The PA richness level counts the total number of different types of physical activities in each spatial unit. The PA overall intensity level calculates the total activity intensity of all physically active individuals in each spatial unit. The grid values representing physical activity in these three categories were then meticulously analyzed using the fishnet tool in ArcGIS. Varied grade intervals were assigned using the natural breaks classification method, with darker colors representing higher grades and lighter colors indicating lower grades.
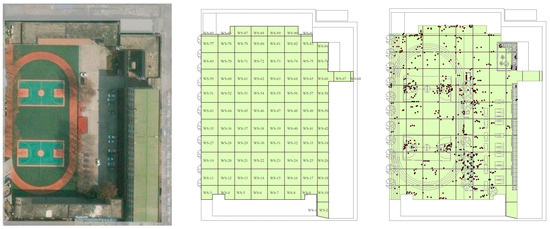
Figure 5.
Grid division, coding and physical activity placement of outdoor public space on a sample campus (taking the WS school as an example).
3. Results
3.1. Space Distribution Characteristics of PA in Three Categories from School Level
3.1.1. Quantization and Visualization of PA Spatial Units (Grids) in Three Categories
The attribute table in ArcGIS was used to calculate the points for physically active students, the types of physical activity and intensity levels in each spatial unit. Across all spatial units in the sample schools, the total number of physically active students in each grid ranged from 1 to 35, the total number of PA types in each grid ranged from 1 to 5 and the total scores of PA intensity levels in each grid ranged from 1 to 65 (the individuals with low PA, moderate PA and vigorous PA were assigned 1 to 3 points, respectively). Table 2 illustrates that, by calculating the mean value of physical activity across all grids, significant differences in the three PA categories were found among the sample schools. The DB school had the highest mean values for PA concentration levels (10.58), PA richness levels (1.95) and PA intensity levels (15.65), while the WKC school had the lowest mean values of 5.74, 1.62 and 9.95, respectively. This indicates that, among the surveyed schools, the DB school contained the most abundant PA types, the highest PA intensity and the largest number of physically active students.
Table 2.
Statistical PA characteristics of spatial units (grids) in each sample campus.
The four selected schools were visualized in three categories, including the PA concentration levels, PA richness levels and PA intensity levels, according to the grading division by the fishnet analysis in ArchGIS. The color of the grids, ranging from light to dark, represented grading from low to high. As shown in Figure 6, in terms of the PA concentration levels, high-grade space units (level 4~5) were mainly concentrated around the basketball court and table tennis court. These two types of sports are popular to watch, and their venues are relatively small, resulting in a high number of students participating in these activities and onlookers around the venue, leading to a relatively concentrated area. In terms of the PA richness levels, high-grade space units (level 4~5) were mainly concentrated in the track-and-field ground, where students would choose to run, jog, skip rope, long jump, walk and engage in other physical activities. Therefore, the track-and-field ground is the area where the number and types of physical activities are concentrated. In terms of the PA intensity levels, high-grade space units (level 4~5) were mainly concentrated in the basketball court, track-and-field ground and hard-paved squares. For example, both the DB school and WS school have limited campus land area and a compact functional layout. Due to the number of sports venues, numerous students choose to engage in physical activities such as badminton and basketball in the hard-paved square instead of a specific court.
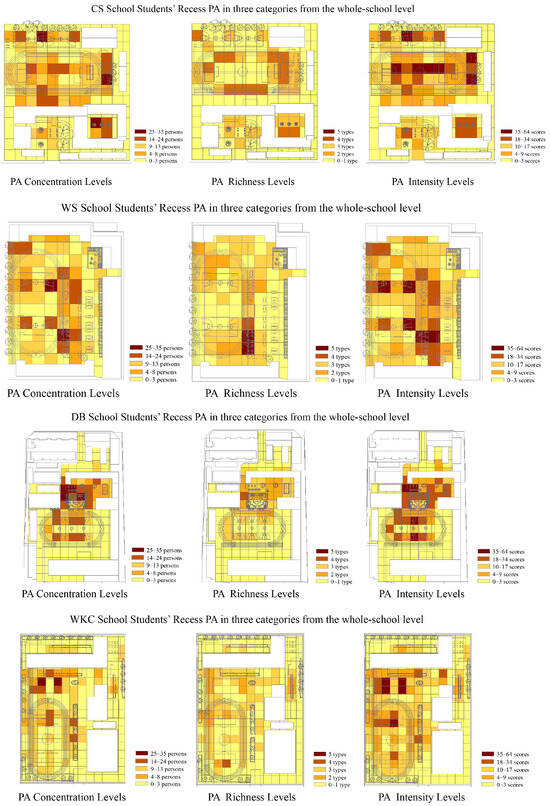
Figure 6.
Spatial distribution (grids) of PA in three categories in each sample school.
3.1.2. Quantization of PA in Three Categories from Whole-School Level
The previous section focused on analyzing the recess physical activity (PA) in outdoor public spaces at the spatial unit (grid) level. In contrast, this section examines the overall characteristics of recess PA at the school-wide level by selecting specific indicators. This allows for a comparison of the differences in PA patterns among the schools. The selected indicators are based on the following three categories: the PA concentration level, PA richness level and PA intensity level. These are referred to as the PA concentration index, PA richness index and PA intensity index. The table below provides an overview of the overall characteristics and specific quantification methods of the PA index constructed from these three categories (Table 3).
Table 3.
Overall characteristics and quantification methods of PA indices in each category.
The PA concentration index is a useful tool for comparing different schools and making comprehensive evaluations more meaningful. The PA richness index is represented by Shannon’s Diversity Index (SHDI), which helps describe and measure community biodiversity and balance in ecology. SHDI is commonly used to measure land use richness in landscape ecology [40], and, in this study, it is used to evaluate the PA richness. A higher SHDI value indicates a more even distribution of different types of PA, meaning a stronger diversity of PA. The PA intensity index measures the total PA energy consumption per unit of time and space. The PA intensity value is quantified in METs and then converted into metabolic energy consumption in Kcal (1 MET = 0.0167 Kcal/kg/min) [41]. This converted value allows for the recording of instantaneous energy consumption under each time slice of PA, which aligns with the instantaneous sampling technology of the DJI Mini Drone as an observation tool in this study. To ensure comparability, three indices with different measurement units were standardized through nondimensionalization and normalization, converting the raw data to a range of zero to one. The final calculation results and comparison are presented in Figure 7. Upon comprehensive analysis, it is apparent that the physical activity pattern characteristics in the four schools can be categorized into the following three types: the WS school demonstrates relatively high values in all three indices, while the DB and CS schools exhibit high PA concentration and type richness index values, along with relatively low PA intensity index values. In contrast, the WKC school showcases a relatively high PA richness index value, coupled with relatively low PA concentration and intensity index values. Subsequent analysis will delve into the physical environmental factors in the schools that impact these results. Each school has its unique environmental characteristics, such as the WKC school’s campus building with a large number of roofed activity terraces and the DB school’s richly landscaped central garden. By comparing each school’s PA index results and clarifying their key school environmental variables, we as designers are able to target the campus renewal and design with efficient strategies and recommendations.
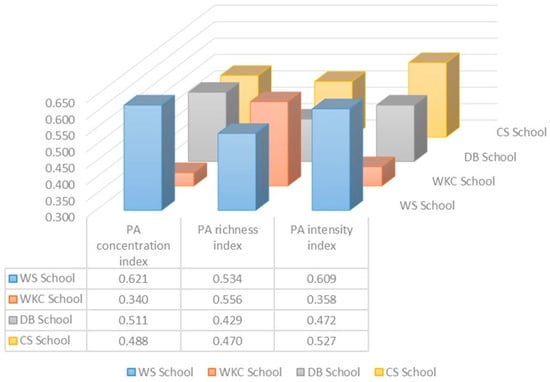
Figure 7.
Comparison of PA indices in three categories in each sample school.
3.2. Physical Environmental Factors Influenced on Recess PA from School Level
A correlation model was developed to explore the relationship between students’ outdoor physical activity (PA) characteristics and school physical environmental factors. The outdoor PA characteristics were divided into the following two parts: the number of physically active students in different activity spaces and PA indices in three categories. The correlation analysis results, obtained using the correl function in Excel and presented in Table 4 and Table 5, revealed interesting associations. Specifically, the number of physically active students in courtyards showed a strong negative correlation with the building shape complexity and with the shelter proportion (Table 4). Furthermore, the results in Table 5 indicated a high correlation of the PA concentration index with the building shape complexity and green space proportion. Additionally, the PA richness index showed a significant correlation with the campus area per student and the average distance to the PA facilities. These findings underscore the importance of school physical environmental factors in influencing students’ outdoor PA characteristics (Figure 8 and Figure 9).
Table 4.
Correlation between physical environmental factors and PA student numbers in different public space.
Table 4.
Correlation between physical environmental factors and PA student numbers in different public space.
| Correlates | Spatial Organization | Spatial Quality | ||||
|---|---|---|---|---|---|---|
| Campus Area Per Student | Building Shape Complexity | Average Distance to PA Facilities | Green Space Proportion | Shelter Proportion | Number of PA Facilities | |
| Coeff. | Coeff. | Coeff. | Coeff. | Coeff. | Coeff. | |
| PA student numbers on playgrounds | 0.032 | −0.347 | 0.255 | 0.152 | 0.466 | 0.402 |
| PA student numbers in squares | 0.103 | 0.306 | −0.108 | −0.011 | −0.398 | −0.248 |
| PA student numbers in courtyards | −0.617 | −0.934 | −0.434 | 0.472 | −0.754 | 0.122 |
Table 5.
Correlation between physical environmental factors and PA indices in three categories.
Table 5.
Correlation between physical environmental factors and PA indices in three categories.
| Correlates | Spatial Organization | Spatial Quality | ||||
|---|---|---|---|---|---|---|
| Campus Area Per Student | Building Shape Complexity | Average Distance to PA Facilities | Green Space Proportion | Shelter Proportion | Number of PA Facilities | |
| Coeff. | Coeff. | Coeff. | Coeff. | Coeff. | Coeff. | |
| PA concentration index | 0.025 | 0.945 | −0.190 | −0.899 | 0.331 | −0.687 |
| PA richness index | 0.927 | 0.111 | 0.894 | 0.624 | 0.491 | 0.745 |
| PA intensity index | 0.023 | 0.871 | −0.132 | −0.892 | 0.474 | −0.599 |

Figure 8.
Matrix diagram of the correlation between physical environmental factors and PA student numbers in different public spaces.

Figure 9.
Matrix diagram of the correlation between physical environmental factors and PA indices in three categories.
3.3. Perceived Environmental Factors Influencing Recess PA from Individual Level
In Table 6, students’ subjective evaluation scores for 16 campus environmental factors across five variables are presented. Overall, the students rated the safety and accessibility relatively high, while the comfort, aesthetics and functionality received relatively low ratings. Specifically, privacy comfort (B4), facilities enjoyment (C2), characteristic design style (C3) and service facilities improved (E1) were identified as environmental factors with lower ratings (Figure 10). These lower-rated options are more associated with light physical activities (LPAs) such as leisure and social activities like chatting, jogging and walking. This suggests that the attractiveness of public spaces on campus could be enhanced through characteristic style design, interesting facilities, improved privacy and service facilities in order to encourage more LPA engagement.
Table 6.
Respondents’ opinions (evaluations) of the perceived environmental factors (n = 424).
Table 6.
Respondents’ opinions (evaluations) of the perceived environmental factors (n = 424).
| Variables | Parameters | Very Bad | Bad | Moderate | Good | Very Good | Mean ± SD | |||||
|---|---|---|---|---|---|---|---|---|---|---|---|---|
| No. | % | No. | % | No. | % | No. | % | No. | % | |||
| A Safety | A1 Path safety | 7 | 1.7 | 14 | 3.3 | 142 | 33.5 | 140 | 33.0 | 121 | 28.5 | 3.83 ± 0.93 |
| A2 Equipment safety | 9 | 2.1 | 38 | 9.0 | 210 | 49.5 | 131 | 30.9 | 36 | 8.5 | 3.35 ± 0.84 | |
| A3 Facilities safety | 10 | 2.4 | 21 | 5.0 | 191 | 45.0 | 130 | 30.6 | 72 | 17.0 | 3.55 ± 0.91 | |
| B Comfort | B1 Pavement comfort | 15 | 3.5 | 27 | 6.4 | 214 | 50.5 | 108 | 25.5 | 60 | 14.1 | 3.40 ± 0.93 |
| B2 Body comfort | 29 | 6.8 | 53 | 12.5 | 200 | 47.2 | 98 | 23.1 | 44 | 10.4 | 3.18 ± 1.01 | |
| B3 Space scale comfort | 19 | 4.5 | 42 | 9.9 | 190 | 44.8 | 110 | 25.9 | 63 | 14.9 | 3.37 ± 1.00 | |
| B4 Privacy comfort | 39 | 9.2 | 72 | 17.0 | 208 | 49.0 | 64 | 15.1 | 41 | 9.7 | 2.99 ± 1.04 | |
| C Aesthetics | C1 Landscape richness | 21 | 5.0 | 43 | 10.1 | 190 | 44.8 | 97 | 22.9 | 73 | 17.2 | 3.37 ± 1.04 |
| C2 Equipment attractivity | 31 | 7.3 | 52 | 12.3 | 217 | 51.2 | 64 | 15.1 | 60 | 14.1 | 3.17 ± 1.05 | |
| C3 Characteristic design style | 33 | 7.8 | 52 | 12.2 | 217 | 51.2 | 72 | 17.0 | 50 | 11.8 | 3.13 ± 1.03 | |
| D Accessibility | D1 Facilities proximity | 23 | 5.5 | 47 | 11.1 | 185 | 43.6 | 90 | 21.2 | 79 | 18.6 | 3.37 ± 1.07 |
| D2 Interactive visibility | 25 | 5.9 | 44 | 10.4 | 191 | 45.0 | 92 | 21.7 | 72 | 17.0 | 3.33 ± 1.06 | |
| D3 Facilities connectivity | 23 | 5.4 | 27 | 6.4 | 167 | 39.4 | 112 | 26.4 | 95 | 22.4 | 3.54 ± 1.07 | |
| E Functionality | E1 Well-appointed service facilities | 32 | 7.6 | 62 | 14.6 | 193 | 45.5 | 93 | 21.9 | 44 | 10.4 | 3.13 ± 1.03 |
| E2 Well-appointed PA facilities | 21 | 5.0 | 64 | 15.1 | 209 | 49.3 | 85 | 20.0 | 45 | 10.6 | 3.16 ± 0.97 | |
| E3 Well-appointed markings | 29 | 6.8 | 47 | 11.1 | 211 | 49.8 | 86 | 20.3 | 51 | 12.0 | 3.20 ± 1.01 | |

Figure 10.
Line chart of the mean value and standard deviation of respondents’ evaluations on the perceived environmental factors.
This study gathered and summarized the data on the intensity and frequency of physical activity (PA) at an individual level based on students’ self-reported questionnaires. Additionally, a correlation analysis (Table 7) was conducted to examine the perceived environmental factors influencing PA. The findings suggest that perceived environmental factors have a more pronounced impact on the PA frequency. Particularly, strong correlations were observed with factors such as safety, privacy comfort, landscape aesthetics, visual and road accessibility and convenient service facilities (Figure 11). In contrast, the PA intensity appears to be less influenced by perceived environmental factors, although positive effects were identified for space safety, facilities enjoyment and visual accessibility.
Table 7.
Correlation between perceived environmental factors and the PA intensity/frequency (n = 424).
Table 7.
Correlation between perceived environmental factors and the PA intensity/frequency (n = 424).
| Variables | Parameters | PA Intensity | PA Frequency | ||
|---|---|---|---|---|---|
| Coeff. | Sig. | Coeff. | Sig. | ||
| A Safety | A1 Path safety | 0.091 | 0.060 | 0.158 ** | 0.001 |
| A2 Equipment safety | 0.088 | 0.071 | 0.139 ** | 0.004 | |
| A3 Facilities safety | 0.138 ** | 0.004 | 0.175 ** | 0.000 | |
| B Comfort | B1 Pavement comfort | 0.064 | 0.191 | 0.082 | 0.093 |
| B2 Body comfort | 0.022 | 0.646 | 0.068 | 0.160 | |
| B3 Space scale comfort | 0.076 | 0.117 | 0.112 * | 0.021 | |
| B4 Privacy comfort | 0.121 * | 0.012 | 0.125 ** | 0.010 | |
| C Aesthetics | C1 Landscape richness | 0.082 | 0.092 | 0.132 ** | 0.006 |
| C2 Equipment attractivity | 0.135 ** | 0.005 | 0.162 ** | 0.001 | |
| C3 Characteristic design style | 0.106 * | 0.029 | 0.117 * | 0.016 | |
| D Accessibility | D1 Facilities proximity | 0.068 | 0.165 | 0.116 * | 0.017 |
| D2 Interactive visibility | 0.136 ** | 0.005 | 0.157 ** | 0.001 | |
| D3 Facilities connectivity | 0.103 * | 0.034 | 0.173 ** | 0.000 | |
| E Functionality | E1 Well-appointed service facilities | 0.113 * | 0.020 | 0.140 ** | 0.004 |
| E2 Well-appointed PA facilities | 0.051 | 0.293 | 0.064 | 0.186 | |
| E3 Well-appointed markings | 0.056 | 0.249 | 0.071 | 0.143 | |
Note: p < 0.05 *; p < 0.01 **.

Figure 11.
Dot plot of the correlation between the perceived environmental factors and PA intensity/frequency.
4. Discussion
4.1. Study Aim 1: Impacts of Physical Environmental Characteristics on Recess PA
The building shape complexity plays a crucial role in determining the complexity of a building’s shape. It is calculated as the ratio of the exterior area of a building to the volume it encloses, which creates more visibility for PA activities from other parts of the building and the school [34]. By altering the building volume to create open spaces and activity platforms on the upper floors, we can not only enhance the open space efficiency but also significantly increase the number of physically active students. It is worth noting that, among the sampled schools, only the WKC school incorporated roof activity platforms with outdoor table tennis tables and other facilities, and these have become the main gathering spots for students to engage in outdoor activities. In high-density cities, the growing demand for efficient land use necessitates vertical building development. Therefore, integrating open, large and high-quality sports facilities such as roof platforms and rooftop gardens across different levels is a crucial design strategy to promote physical activity.
The accessibility and distance to outdoor PA facilities are critical factors in determining students’ engagement in physical activities. When open spaces are distant, adolescents tend to opt for nearby locations and static activities. Actually, accessible and nearby PA facilities called for dynamically configurable public spaces and flexible equipment. Redesigning and renovating school environments can positively impact students’ physical activity levels. This aligns with the research of Danish scholar Andersen [11,42]. In cases where remodeling the space is challenging, updating and adding signage in terms of color and material is a relatively cost-effective solution [43]. On one hand, having closer PA facilities and a greater number of PA equipment can simultaneously promote PA concentration, PA richness and PA intensity levels. On the other hand, a higher green space proportion can deter schools’ PA concentration and intensity levels. Natural elements for variety and visibility on and around the built structure would make the school pedestrian-friendly and pedestrian-safe [34]. In this scenario, students are more inclined to engage in scattered light physical activity (LPA) in the courtyard rather than gathering for moderate-to-vigorous physical activity (MVPA) on the playground.
4.2. Study Aim 2: Impacts of Perceived Environmental Characteristics on Recess PA
Visual accessibility is a crucial, yet often overlooked, factor influencing the intensity and frequency of physical activity. Research findings reveal that low-intensity physical activities, such as walking and spectators’ behavior, are more prevalent in building circulation areas facing the playground. Enhancing visual accessibility in public spaces through strategic design emphasizing transparency can effectively promote this type of activity. For example, according to Zimring, people are more likely to be active in buildings with visible, accessible, pleasing and supportive features, like motivational prompts and well-designed stairs [18]. Additionally, providing a safe and welcoming environment with proper lighting, comfortable seating and accessible vending machines can appeal to students engaging in social activities like group conversations. In summary, promoting physical activity on campus should not only prioritize MVPA, like ball games, but also consider and support LPA, such as social interactions.
5. Conclusions
This study delved into the school environmental factors that influence students’ physical activity during recess, examining both the physical space layout and students’ perceptions. It also introduced an evaluation framework encompassing physical factors such as spatial organization and quality, as well as perceived factors including safety, comfort, aesthetics, accessibility and functionality. The study collected data on students’ physical activity at both the school and individual levels. At the school level, three categories of physical activity measures—concentration, richness and intensity—were visualized and compared. At the individual level, students’ perceptions of the environment, types of physical activities and their frequencies were summarized through self-reported questionnaires. The findings revealed several of the following key insights: each school exhibited distinct physical activity characteristics, with some showing higher or lower measures. Furthermore, physical environmental factors such as the building shape complexity and green space proportion significantly influenced the physical activity concentration and intensity, while the campus area per student, the distance to PA facilities and the number of PA facilities strongly correlated with the richness of physical activity. Moreover, perceived environmental factors such as safety, enjoyment of the facilities and visual accessibility impacted individual physical activity intensity and frequency. In conclusion, the results offer valuable insights for school designers seeking to enhance students’ health.
While previous research focused less on considering both school physical and perceived environmental factors, this study has some limitations. In the first place, individual factors such as students’ sex, BMI and age, as well as organizational or policy factors such as physical education provision and teacher supervision, should not be disregarded when analyzing the influences of physical activity during recess. In the second place, according to the structure of the socio-ecological model, future studies should simultaneously examine correlations across all levels of this model, including social variables and organizational/policy variables. In the third place, the research samples were concentrated in the same region, and it was not possible to collect the bias of students’ perceptions of the school environment caused by the differences in climate and design styles in different geographical, political, cultural and policy backgrounds. As well as the data collection method of self-reporting, the questionnaire asked students to recall outside activity numbers and their duration daily, which inevitably caused a recall burden and memory bias under students’ subjective cognition. All of these led to a certain degree of limitation of the influencing factors and correlation laws. Therefore, our empirical study conducted in Xi’an aims to make a meaningful contribution to broader geographical and intellectual discussions.
Author Contributions
Conceptualization, Q.W.; methodology, Q.W.; software, Q.W.; validation, L.Z.; formal analysis, Q.W.; investigation, Q.W.; resources, Q.W.; data curation, Q.W.; writing—original draft preparation, Q.W.; writing—review and editing, Y.W.; visualization, Q.W.; supervision, Y.W.; project administration, Y.N.; funding acquisition, Y.W. All authors have read and agreed to the published version of the manuscript.
Funding
This research was funded by Social Science Foundation Project of Shaanxi Province, grant number 2023J025; the 2023 New Urbanization Special Research Foundation Project of Shaanxi Province, grant number 2023SCZH08.
Institutional Review Board Statement
All subjects gave their informed consent for inclusion before they participated in the study. The study was conducted in accordance with the Declaration of Helsinki, and the protocol was approved by the Ethics Committee of Xi’an University of Architecture and Technology (project identification code: 064184).
Informed Consent Statement
Informed consent was obtained from all subjects involved in the study.
Data Availability Statement
Data are available from the authors upon reasonable request.
Acknowledgments
The data used in this research were collected in spring 2023. The authors would like to thank the administration, teachers and students of the four participating schools.
Conflicts of Interest
The authors declare no conflicts of interest. The funders had no role in the design of the study; in the collection, analyses, or interpretation of data; in the writing of the manuscript; or in the decision to publish the results.
References
- Piercy, K.L.; Troiano, R.P.; Ballard, R.M.; Carlson, S.A.; Fulton, J.E.; Galuska, D.A.; George, S.M.; Olson, R.D. The physical activity guidelines for Americans. JAMA 2018, 320, 2020. [Google Scholar] [CrossRef]
- New WHO-Led Study Says Majority of Adolescents Worldwide Are Not Sufficiently Physically Active. Available online: https://www.who.int/news/item/22-11-2019-new-who-led-study-says-majority-of-adolescents-worldwide-are-not-sufficiently-physically-active-putting-their-current-and-future-health-at-risk#:~:text=The%20study%2C%20published%20in%20The%20Lancet%20Child%20%26,including%2085%25%20of%20girls%20and%2078%25%20of%20boys (accessed on 22 November 2019).
- Abarca-Gómez, L. Worldwide trends in body-mass index, underweight, overweight, and obesity from 1975 to 2016: A pooled analysis of 2416 population-based measurement studies in 1289 million children, adolescents, and adults. Lancet 2017, 390, 2627–2642. [Google Scholar] [CrossRef]
- Rey, O.; Vallier, J.-M.; Nicol, C.; Mercier, C.-S.; Maïano, C. Effects of combined vigorous interval training program and diet on body composition, physical fitness, and physical Self-Perceptions among obese adolescent boys and girls. Pediatr. Exerc. Sci. 2017, 29, 73–83. [Google Scholar] [CrossRef]
- McMahon, E.M.; Corcoran, P.; O’Regan, G.; Keeley, H.; Cannon, M.; Carli, V. Physical activity in European adolescents and associations with anxiety, depression and well-being. Eur. Child Adolesc. Psychiatry 2016, 26, 111–122. [Google Scholar] [CrossRef]
- Rutkauskaite, R.; Gisladottir, T.; Pihu, M.; Kjonniksen, L.; Visagurskiene, K.; Olafson, O.; Kull, M.; Rudzinska, I.; Fjørtoft, I. Schoolyard affordances for physical activity: A pilot study in 6 Nordic–Baltic countries. Sustainability 2021, 13, 11640. [Google Scholar] [CrossRef]
- Knuth, A.G.; Hallal, P. School environment and physical activity in children and adolescents: Systematic review. Rev. Bras. Atividade Física Saúde 2012, 17, 463–473. Available online: https://search.bvsalud.org/portal/resource/en/lil-677888 (accessed on 13 October 2024). [CrossRef]
- Nettlefold, L.; McKay, H.A.; Warburton, D.E.; McGuire, K.A.; Bredin, S.S.; Naylor, P.J. The challenge of low physical activity during the school day: At recess, lunch and in physical education. Br. J. Sports Med. 2011, 45, 813–819. [Google Scholar] [CrossRef]
- Durant, N.; Harris, S.K.; Doyle, S.; Person, S.; Saelens, B.E.; Kerr, J.; Norman, G.J.; Sallis, J.F. Relation of school environment and policy to adolescent physical activity. J. Sch. Health 2009, 79, 153–206. [Google Scholar] [CrossRef]
- Story, M.; Nanney, M.S.; Schwartz, M.B. Schools and obesity prevention: Creating school environments and policies to promote healthy eating and physical activity. Milbank Q. 2009, 87, 71–100. [Google Scholar] [CrossRef]
- Kriemler, S.; Meyer, U.; Martin, E.; van Sluijs, E.M.; Andersen, L.B.; Martin, B.W. Effect of school-based interventions on physical activity and fitness in children and adolescents: A review of reviews and systematic update. Br. J. Sports Med. 2011, 45, 923–930. [Google Scholar] [CrossRef]
- Gorman, N.; Lackney, J.A.; Rollings, K.; Huang, T.T. Designer schools: The role of school space and architecture in obesity prevention. Obesity 2007, 15, 2521–2530. [Google Scholar] [CrossRef]
- Hanks, A.S.; Just, D.R.; Wansink, B. Smarter lunchrooms can address new school lunchroom guidelines and childhood obesity. J. Pediatr. 2013, 162, 867–869. [Google Scholar] [CrossRef]
- Frerichs, L.; Brittin, J.; Sorensen, D.; Trowbridge, M.J.; Yaroch, A.L.; Siahpush, M.; Tibbits, M.; Huang, T.T. Influence of school architecture and design on healthy eating: A review of the evidence. Am. J. Public Health 2015, 105, e46–e57. [Google Scholar] [CrossRef]
- Clements-Croome, D. Sustainable intelligent buildings for people: A review. Intell. Build. Int. 2011, 3, 67–86. Available online: https://www.researchgate.net/publication/233441790_Sustainable_intelligent_buildings_for_people_A_review (accessed on 13 October 2024).
- Bakó-Biró, Z.; Clements-Croome, D.; Kochhar, N.; Awbi, H.; Williams, M. Ventilation rates in schools and pupils’ performance. Build. Environ. 2012, 48, 215–223. [Google Scholar] [CrossRef]
- Barrett, P.; Davies, F.; Zhang, Y.; Barrett, L. The Holistic Impact of Classroom Spaces on Learning in Specific Subjects. Environ. Behav. 2017, 49, 425–451. [Google Scholar] [CrossRef]
- Zimring, C.; Joseph, A.; Nicoll, G.L.; Tsepas, S. Influences of building design and site design on physical activity: Research and intervention opportunities. Am. J. Prev. Med. 2005, 28, 186–193. [Google Scholar] [CrossRef]
- Ridgers, N.D.; Salmon, J.; Parrish, A.-M.; Stanley, R.M.; Okely, A.D. Physical activity during school recess. Am. J. Prev. Med. 2012, 43, 320–328. [Google Scholar] [CrossRef]
- Morton, K.L.; Atkin, A.J.; Corder, K.; Suhrcke, M.; Van Sluijs, E.M.F. The school environment and adolescent physical activity and sedentary behaviour: A mixed-studies systematic review. Obes. Rev. 2015, 17, 142–158. [Google Scholar] [CrossRef]
- McLeroy, K.R.; Bibeau, D.; Steckler, A.; Glanz, K. An ecological perspective on health promotion programs. Health Educ. Q. 1988, 15, 351–377. [Google Scholar] [CrossRef]
- Stokols, D. Establishing and maintaining healthy environments: Toward a social ecology of health promotion. Am. Psychol. 1992, 47, 6–22. [Google Scholar] [CrossRef]
- Stokols, D.; Allen, J.; Bellingham, R.L. The Social Ecology of Health Promotion: Implications for Research and practice. Am. J. Health Promot. 1996, 10, 247–251. [Google Scholar] [CrossRef]
- Sallis, J.F.; Cervero, R.B.; Ascher, W.; Henderson, K.A.; Kraft, M.K.; Kerr, J. An ecological approach to creating active living communities. Annu. Rev. Public Health 2006, 27, 297–322. [Google Scholar] [CrossRef]
- Slingerland, M.; Haerens, L.; Cardon, G.; Borghouts, L. Differences in perceived competence and physical activity levels during single-gender modified basketball game play in middle school physical education. Eur. Phys. Educ. Rev. 2013, 20, 20–35. [Google Scholar] [CrossRef]
- McKenzie, T.L.; Sallis, J.F.; Prochaska, J.J.; Conway, T.L.; Marshall, S.J.; Rosengard, P. Evaluation of a Two-Year Middle-School Physical Education intervention: M-SPAN. Med. Sci. Sports Exerc. 2004, 36, 1382–1388. [Google Scholar] [CrossRef]
- Clevenger, K.A.; Erickson, K.T.; Grady, S.C.; Pfeiffer, K.A. Characterizing preschooler’s outdoor physical activity: The comparability of schoolyard location- and activity type-based approaches. Early Child. Res. Q. 2021, 56, 139–148. [Google Scholar] [CrossRef]
- Cradock, A.L.; Melly, S.J.; Allen, J.G.; Morris, J.S.; Gortmaker, S.L. Characteristics of school campuses and physical activity among youth. Am. J. Prev. Med. 2007, 33, 106–113.e1. [Google Scholar] [CrossRef]
- Button, B.; Trites, S.; Janssen, I. Relations between the school physical environment and school social capital with student physical activity levels. BMC Public Health 2013, 13, 1191. [Google Scholar] [CrossRef]
- Cohen, D.; Scott, M.; Wang, F.Z.; McKenzie, T.L.; Porter, D. School design and physical activity among middle school girls. J. Phys. Act. Health 2008, 5, 719–731. [Google Scholar] [CrossRef][Green Version]
- Haug, E.; Torsheim, T.; Sallis, J.F.; Samdal, O. The characteristics of the outdoor school environment associated with physical activity. Health Educ. Res. 2010, 25, 248–256. [Google Scholar] [CrossRef]
- Mårtensson, F.; Jansson, M.; Johansson, M.; Raustorp, A.; Kylin, M.; Boldemann, C. The role of greenery for physical activity play at school grounds. Urban For. Urban Green. 2014, 13, 103–113. [Google Scholar] [CrossRef]
- Fein, A.J.; Plotnikoff, R.C.; Wild, T.C.; Spence, J.C. Perceived environment and physical activity in youth. Int. J. Behav. Med. 2004, 11, 135–142. [Google Scholar] [CrossRef]
- Brittin, J.; Sorensen, D.; Trowbridge, M.; Lee, K.K.; Breithecker, D.; Frerichs, L.; Huang, T. Physical Activity Design Guidelines for School Architecture. PLoS ONE 2015, 10, e0132597. [Google Scholar] [CrossRef]
- Cohen, D.A.; McKenzie, T.L.; Sehgal, A.; Williamson, S.; Golinelli, D.; Lurie, N. Contribution of public parks to physical activity. Am. J. Public Health 2007, 97, 509–514. [Google Scholar] [CrossRef]
- Zhou, Y.; Qian, C.; Yang, Z. Outdoor Activity Space Design of Primary Schools Based on Children’s Behavioral Characteristics: Taking 10 Primary Schools in Nanjing as an Example. Huazhong Archit. 2023, 41, 80–84. [Google Scholar] [CrossRef]
- Ainsworth, B.E.; Haskell, W.L.; Whitt, M.C.; Jacobs, D.R.; Leon, A.S. Compendium of Physical Activities: An update of activity codes and MET intensities. Med. Sci. Sports Exerc. 2000, 32, S498–S516. [Google Scholar] [CrossRef]
- Ambrosini, V.; Bowman, C.; Collier, N. Using teaching case studies for management research. Strateg. Organ. 2010, 8, 206–229. [Google Scholar] [CrossRef]
- Fjørtoft, I.; Löfman, O.; Thorén, K.H. Schoolyard physical activity in 14-year-old adolescents assessed by mobile GPS and heart rate monitoring analysed by GIS. Scand. J. Public Health 2010, 38, 28–37. [Google Scholar] [CrossRef]
- Konopiński, M.K. Shannon diversity index: A call to replace the original Shannon’s formula with unbiased estimator in the population genetics studies. PeerJ 2020, 8, e9391. [Google Scholar] [CrossRef]
- Melzer, K.; Heydenreich, J.; Schutz, Y.; Renaud, A.; Kayser, B.; Mäder, U. Metabolic equivalent in adolescents, active adults and pregnant women. Nutrients 2016, 8, 438. [Google Scholar] [CrossRef]
- Andersen, H.B.; Christiansen, L.B.; Pawlowski, C.S.; Schipperijn, J. What we build makes a difference—Mapping activating schoolyard features after renewal using GIS, GPS and accelerometers. Landsc. Urban Plan. 2019, 191, 103617. [Google Scholar] [CrossRef]
- Stratton, G.; Mullan, E. The effect of multicolor playground markings on children’s physical activity level during recess. Prev. Med. 2005, 41, 828–833. [Google Scholar] [CrossRef]
Disclaimer/Publisher’s Note: The statements, opinions and data contained in all publications are solely those of the individual author(s) and contributor(s) and not of MDPI and/or the editor(s). MDPI and/or the editor(s) disclaim responsibility for any injury to people or property resulting from any ideas, methods, instructions or products referred to in the content. |
© 2024 by the authors. Licensee MDPI, Basel, Switzerland. This article is an open access article distributed under the terms and conditions of the Creative Commons Attribution (CC BY) license (https://creativecommons.org/licenses/by/4.0/).