
Microclimate-Adaptive Morphological Parametric Design of Streets and Alleys in Traditional Villages


Abstract
1. Introduction
2. Research Details
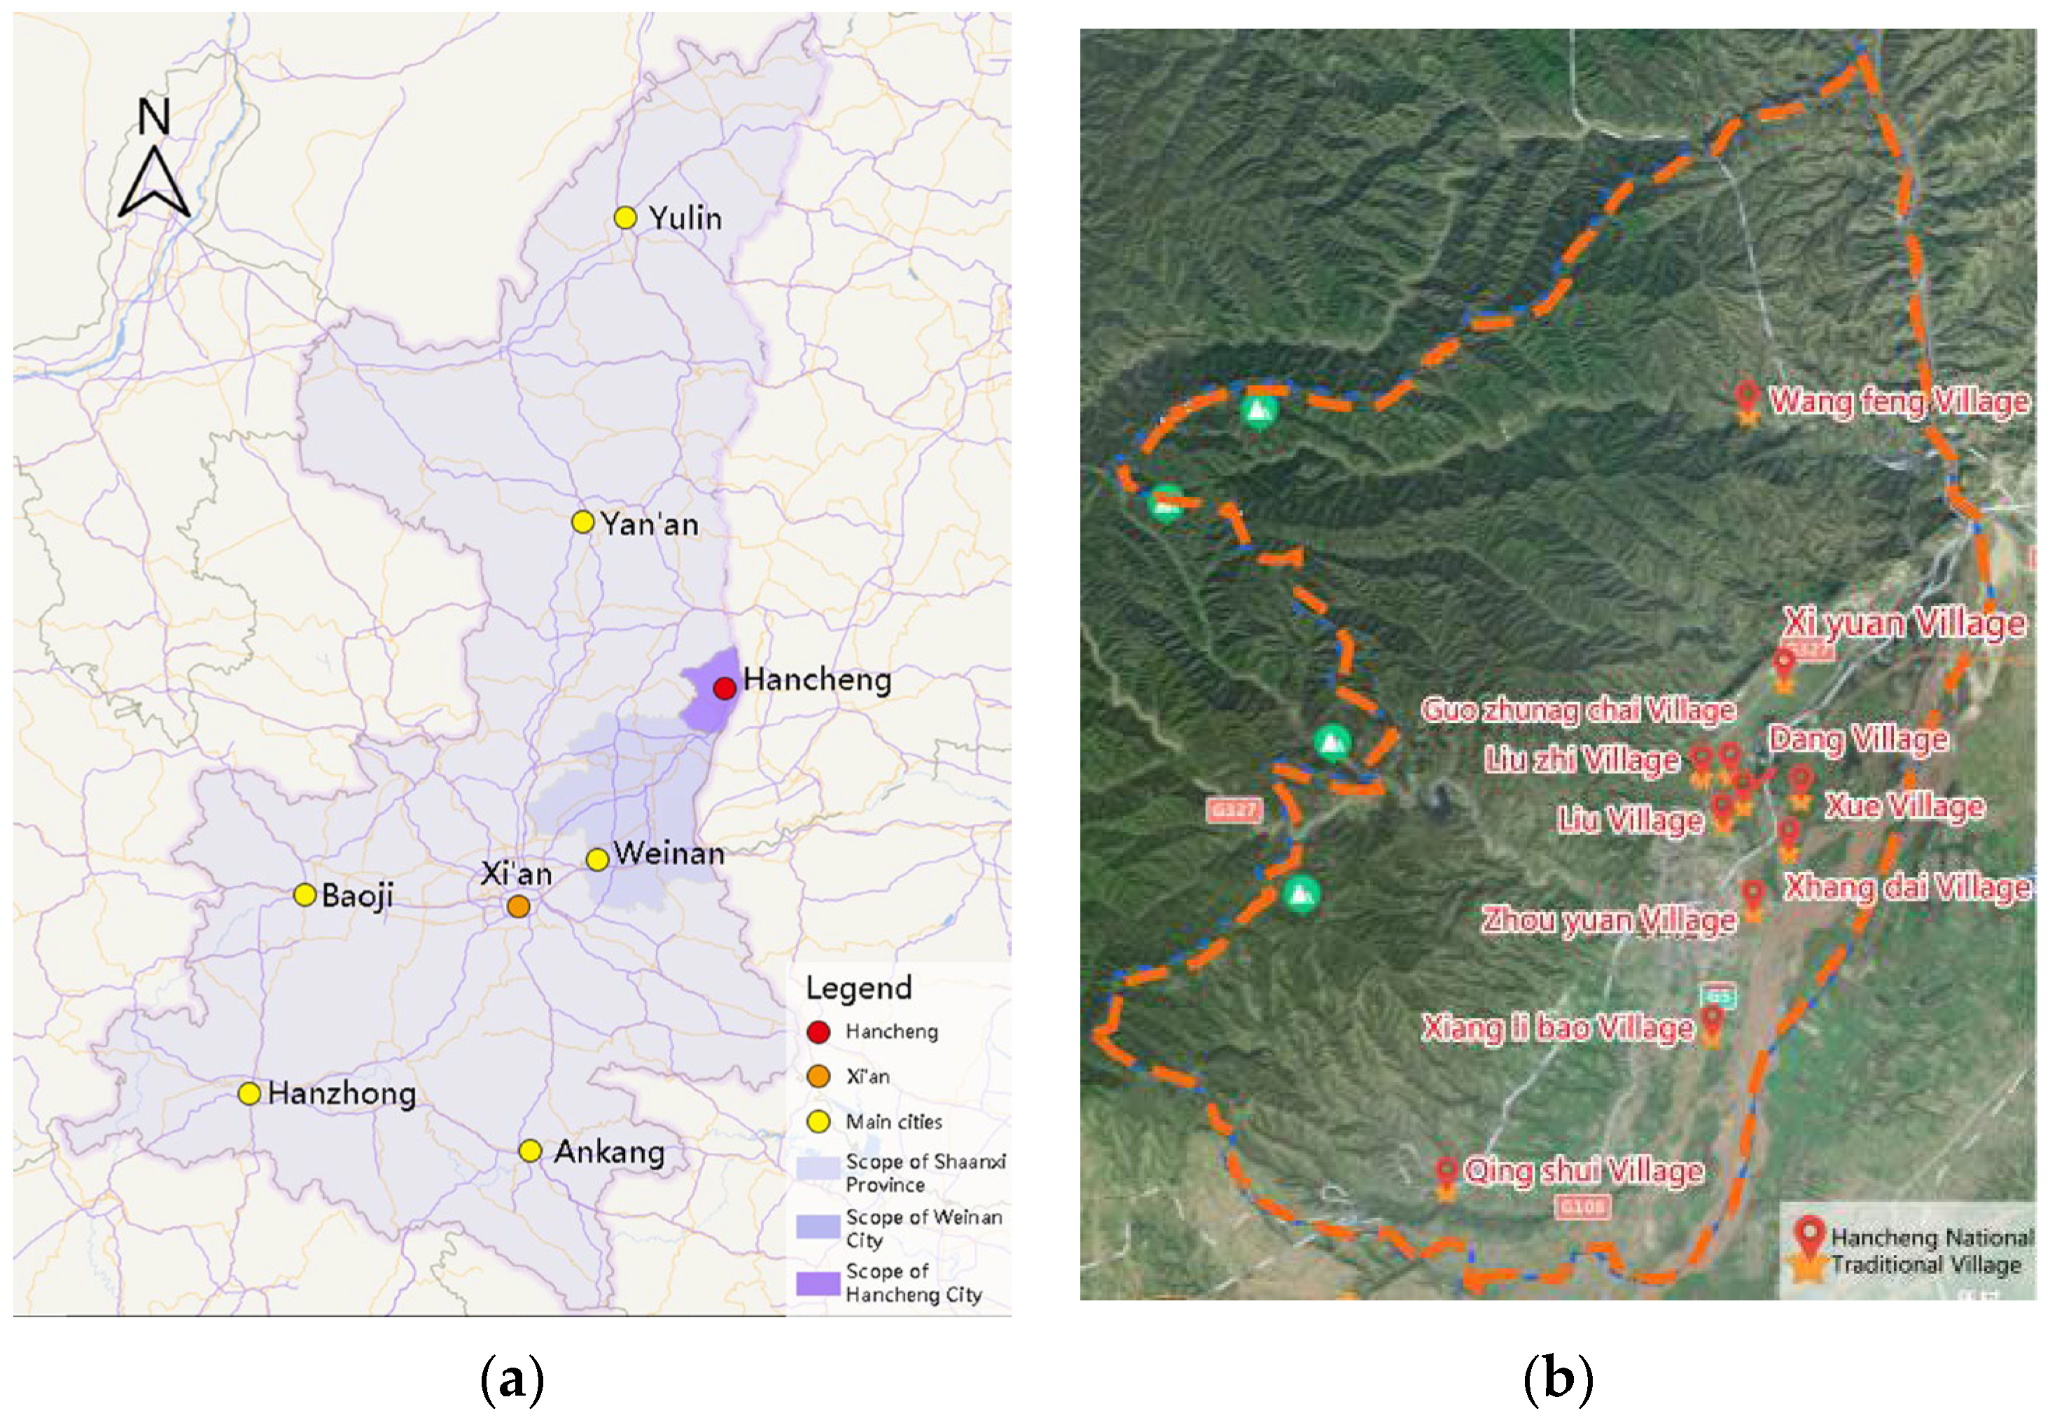
Subjects of the Study
3. Prototype Extraction of Traditional Street and Alley Space
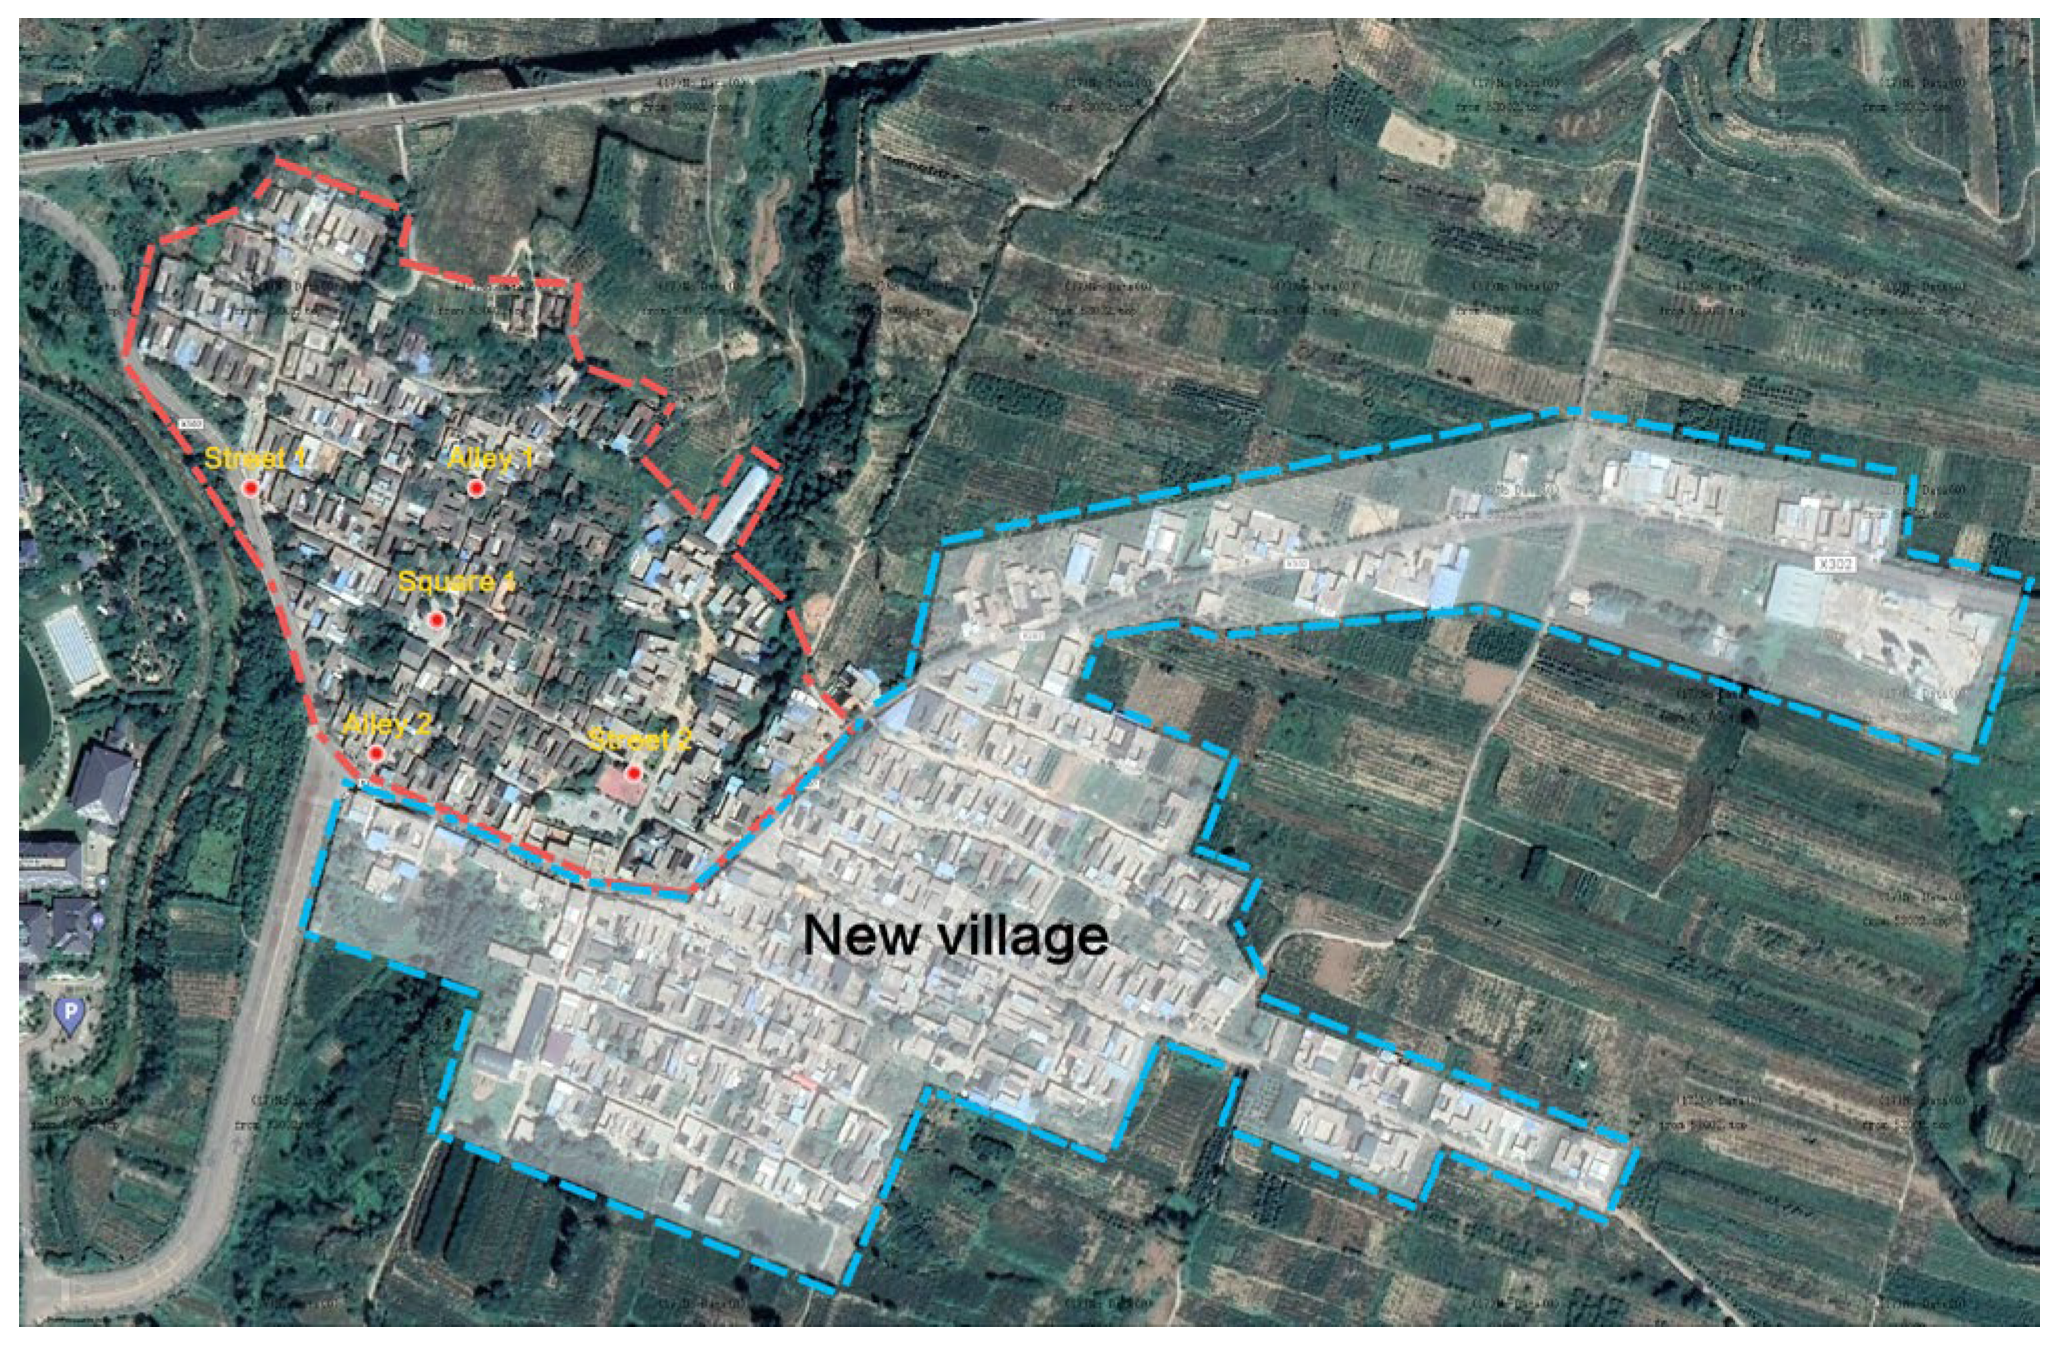
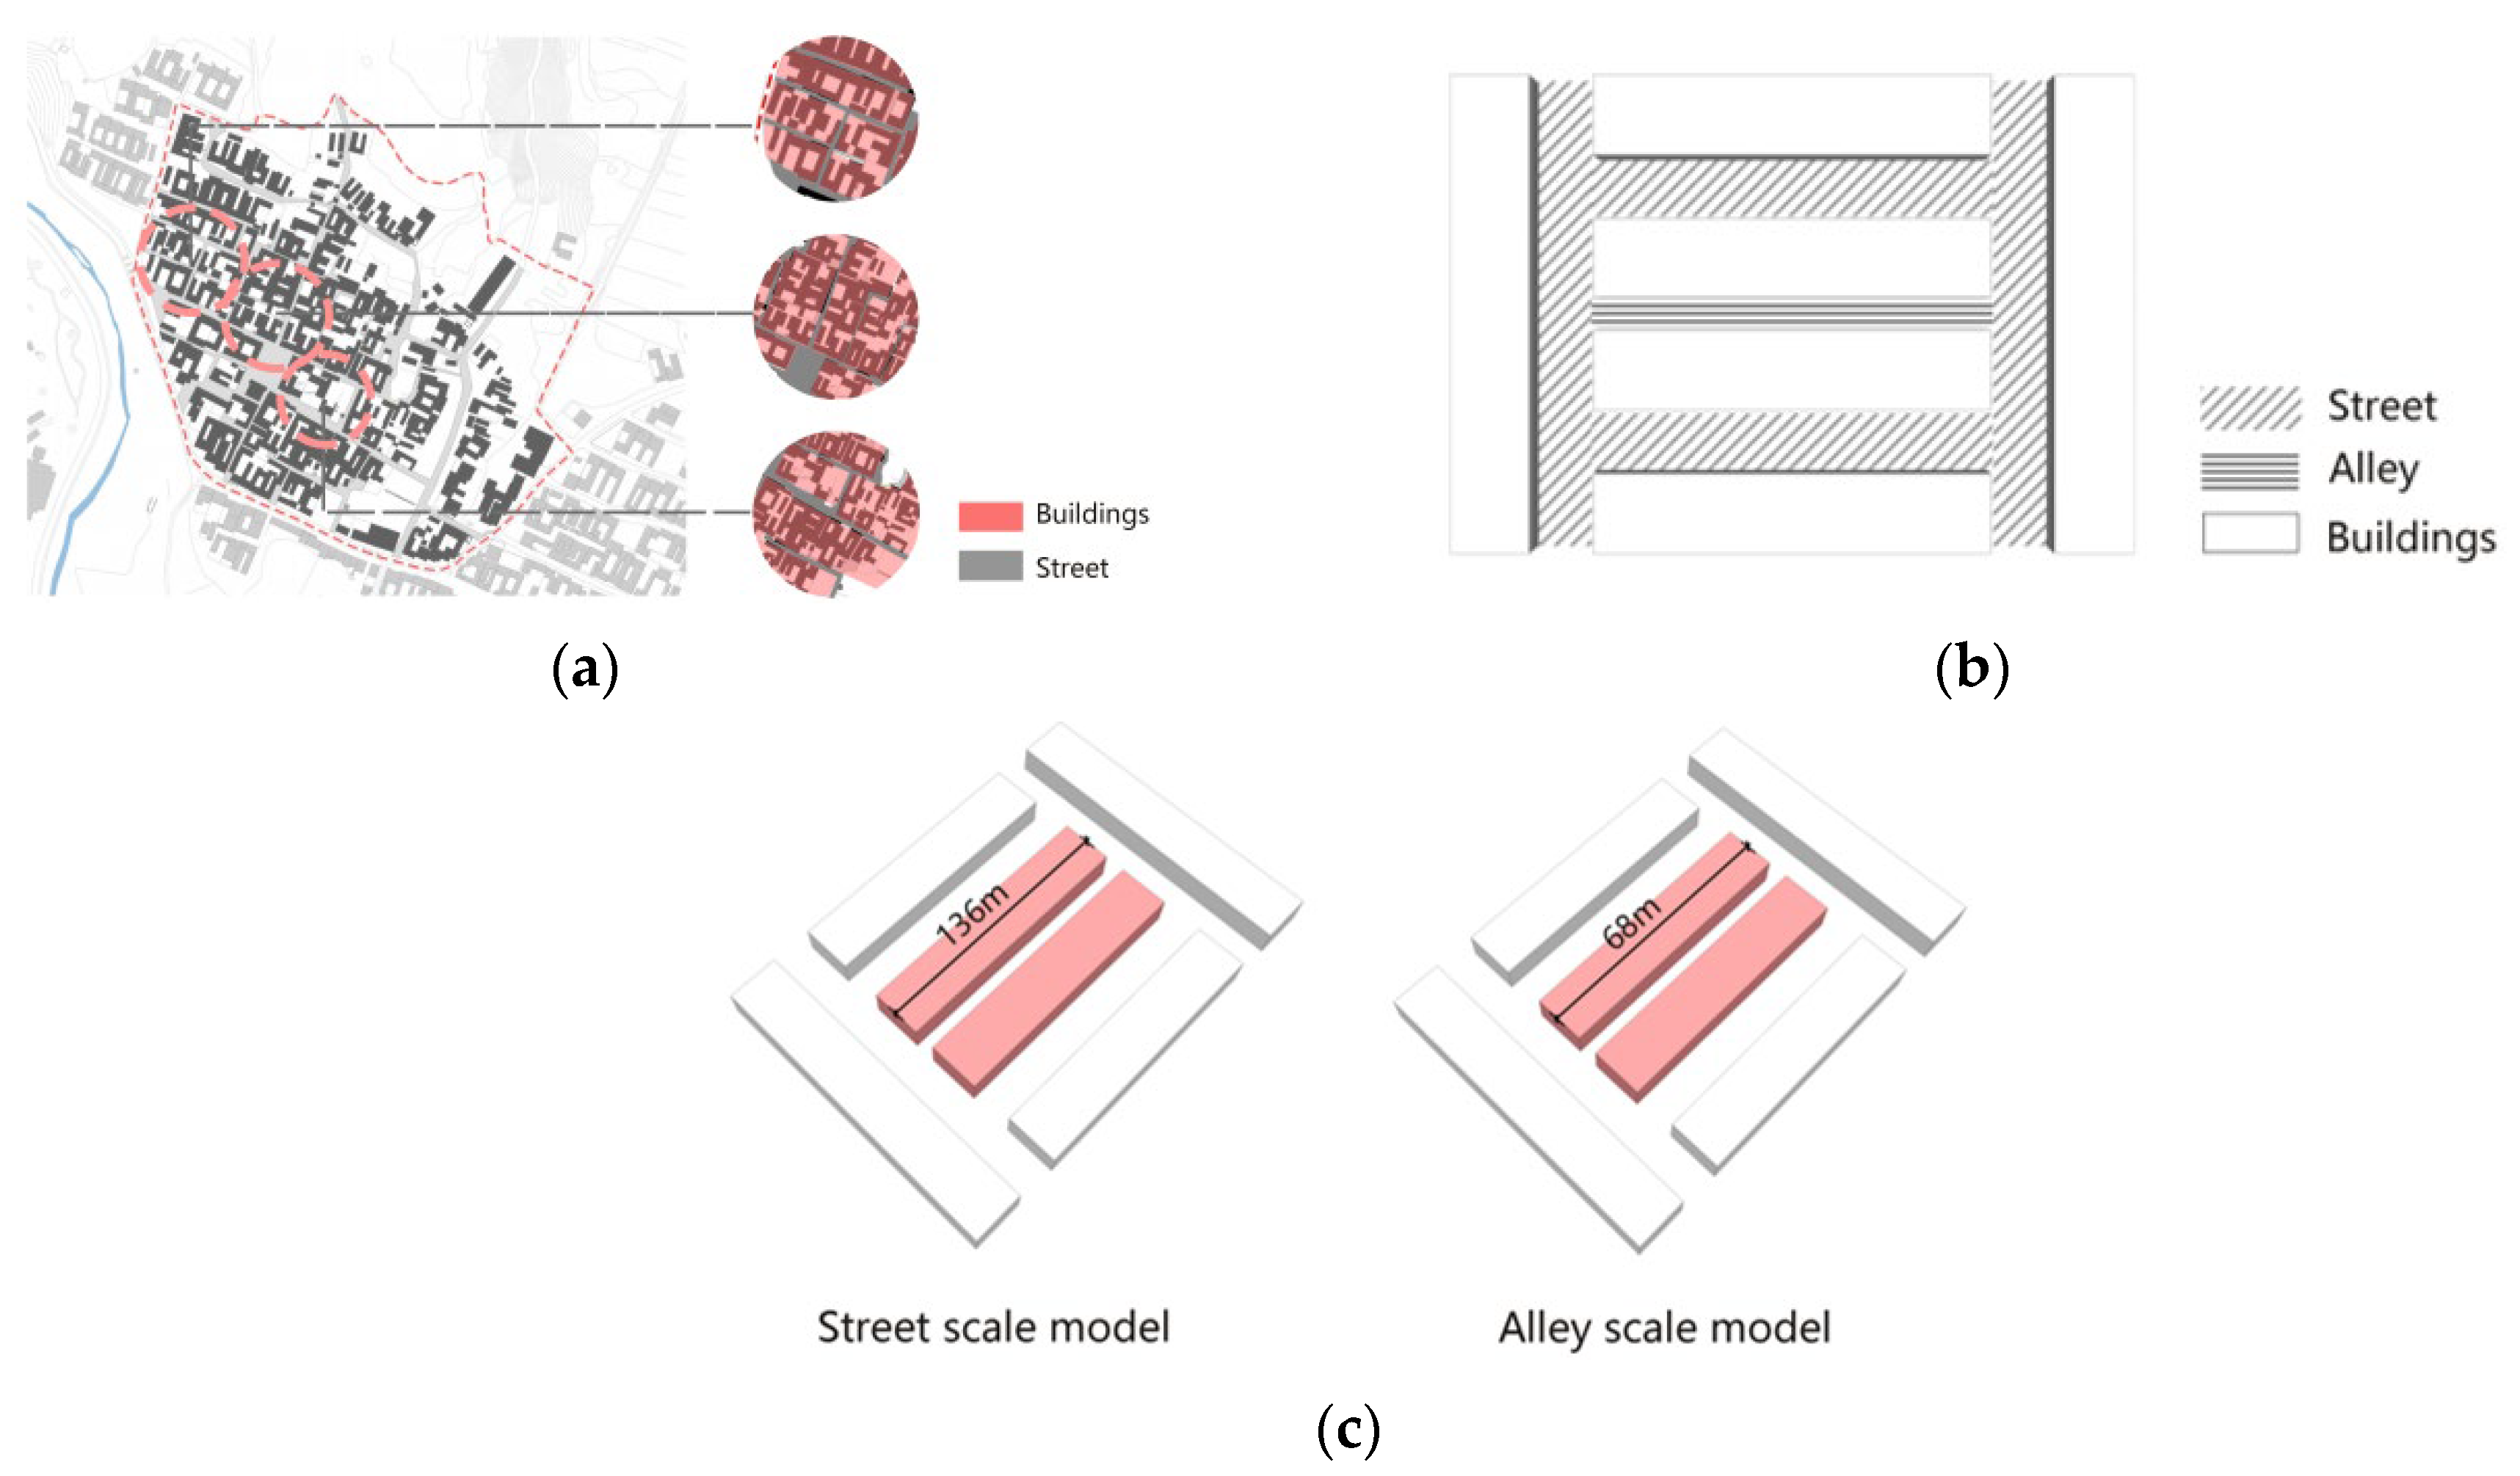
3.1. Overview of the Traditional Streets and Alleys of Qingshui Village
3.2. Field Microclimate Testing
3.2.1. Research Methods
- 1.
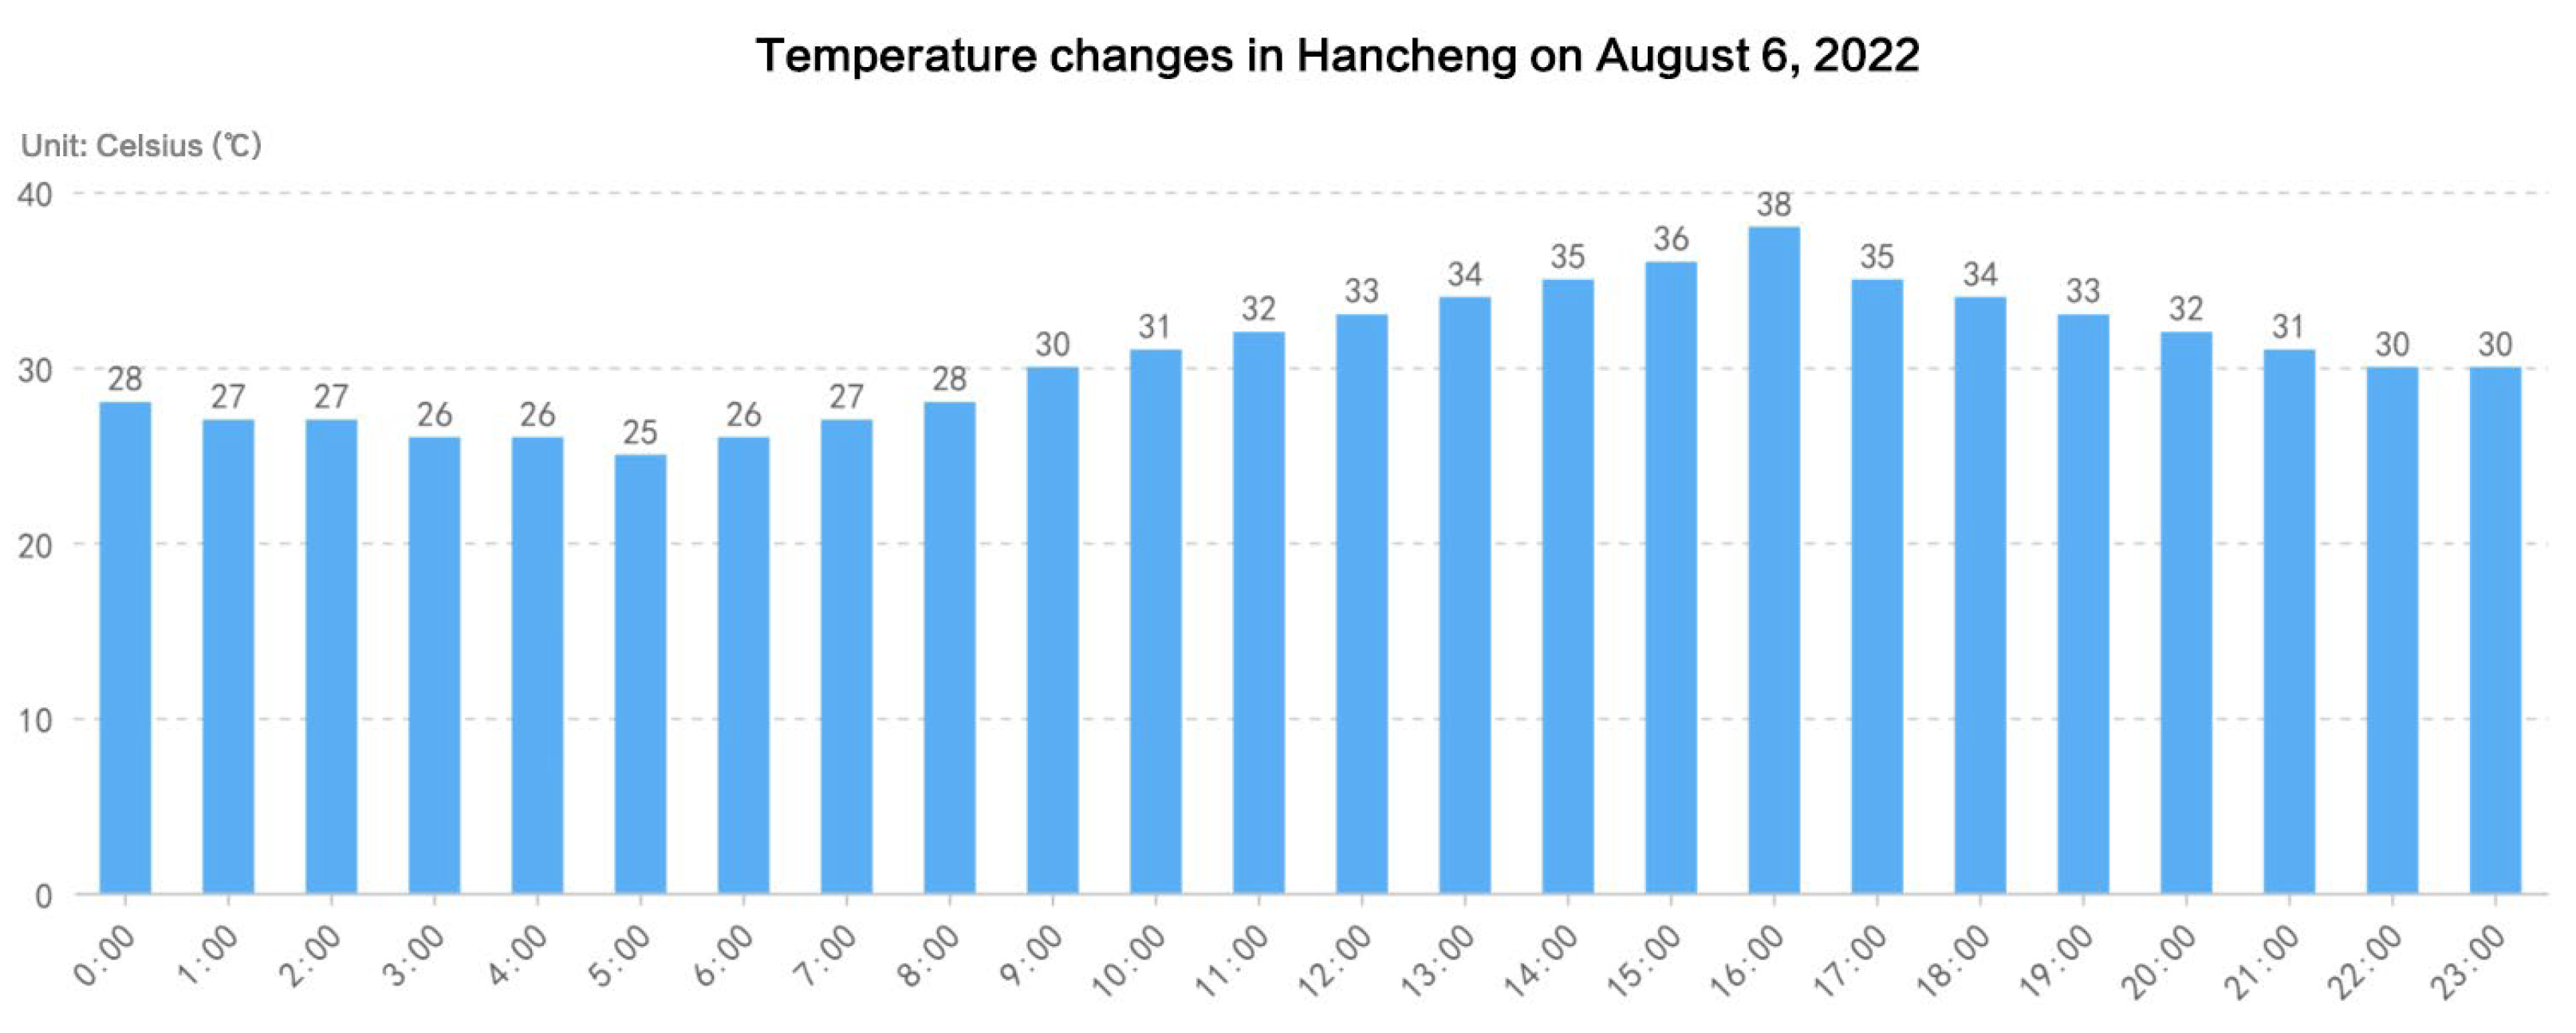
- Test time
- 2.
- Test object
- 3.
- Test methods
3.2.2. Evaluation Indicators
- 1.
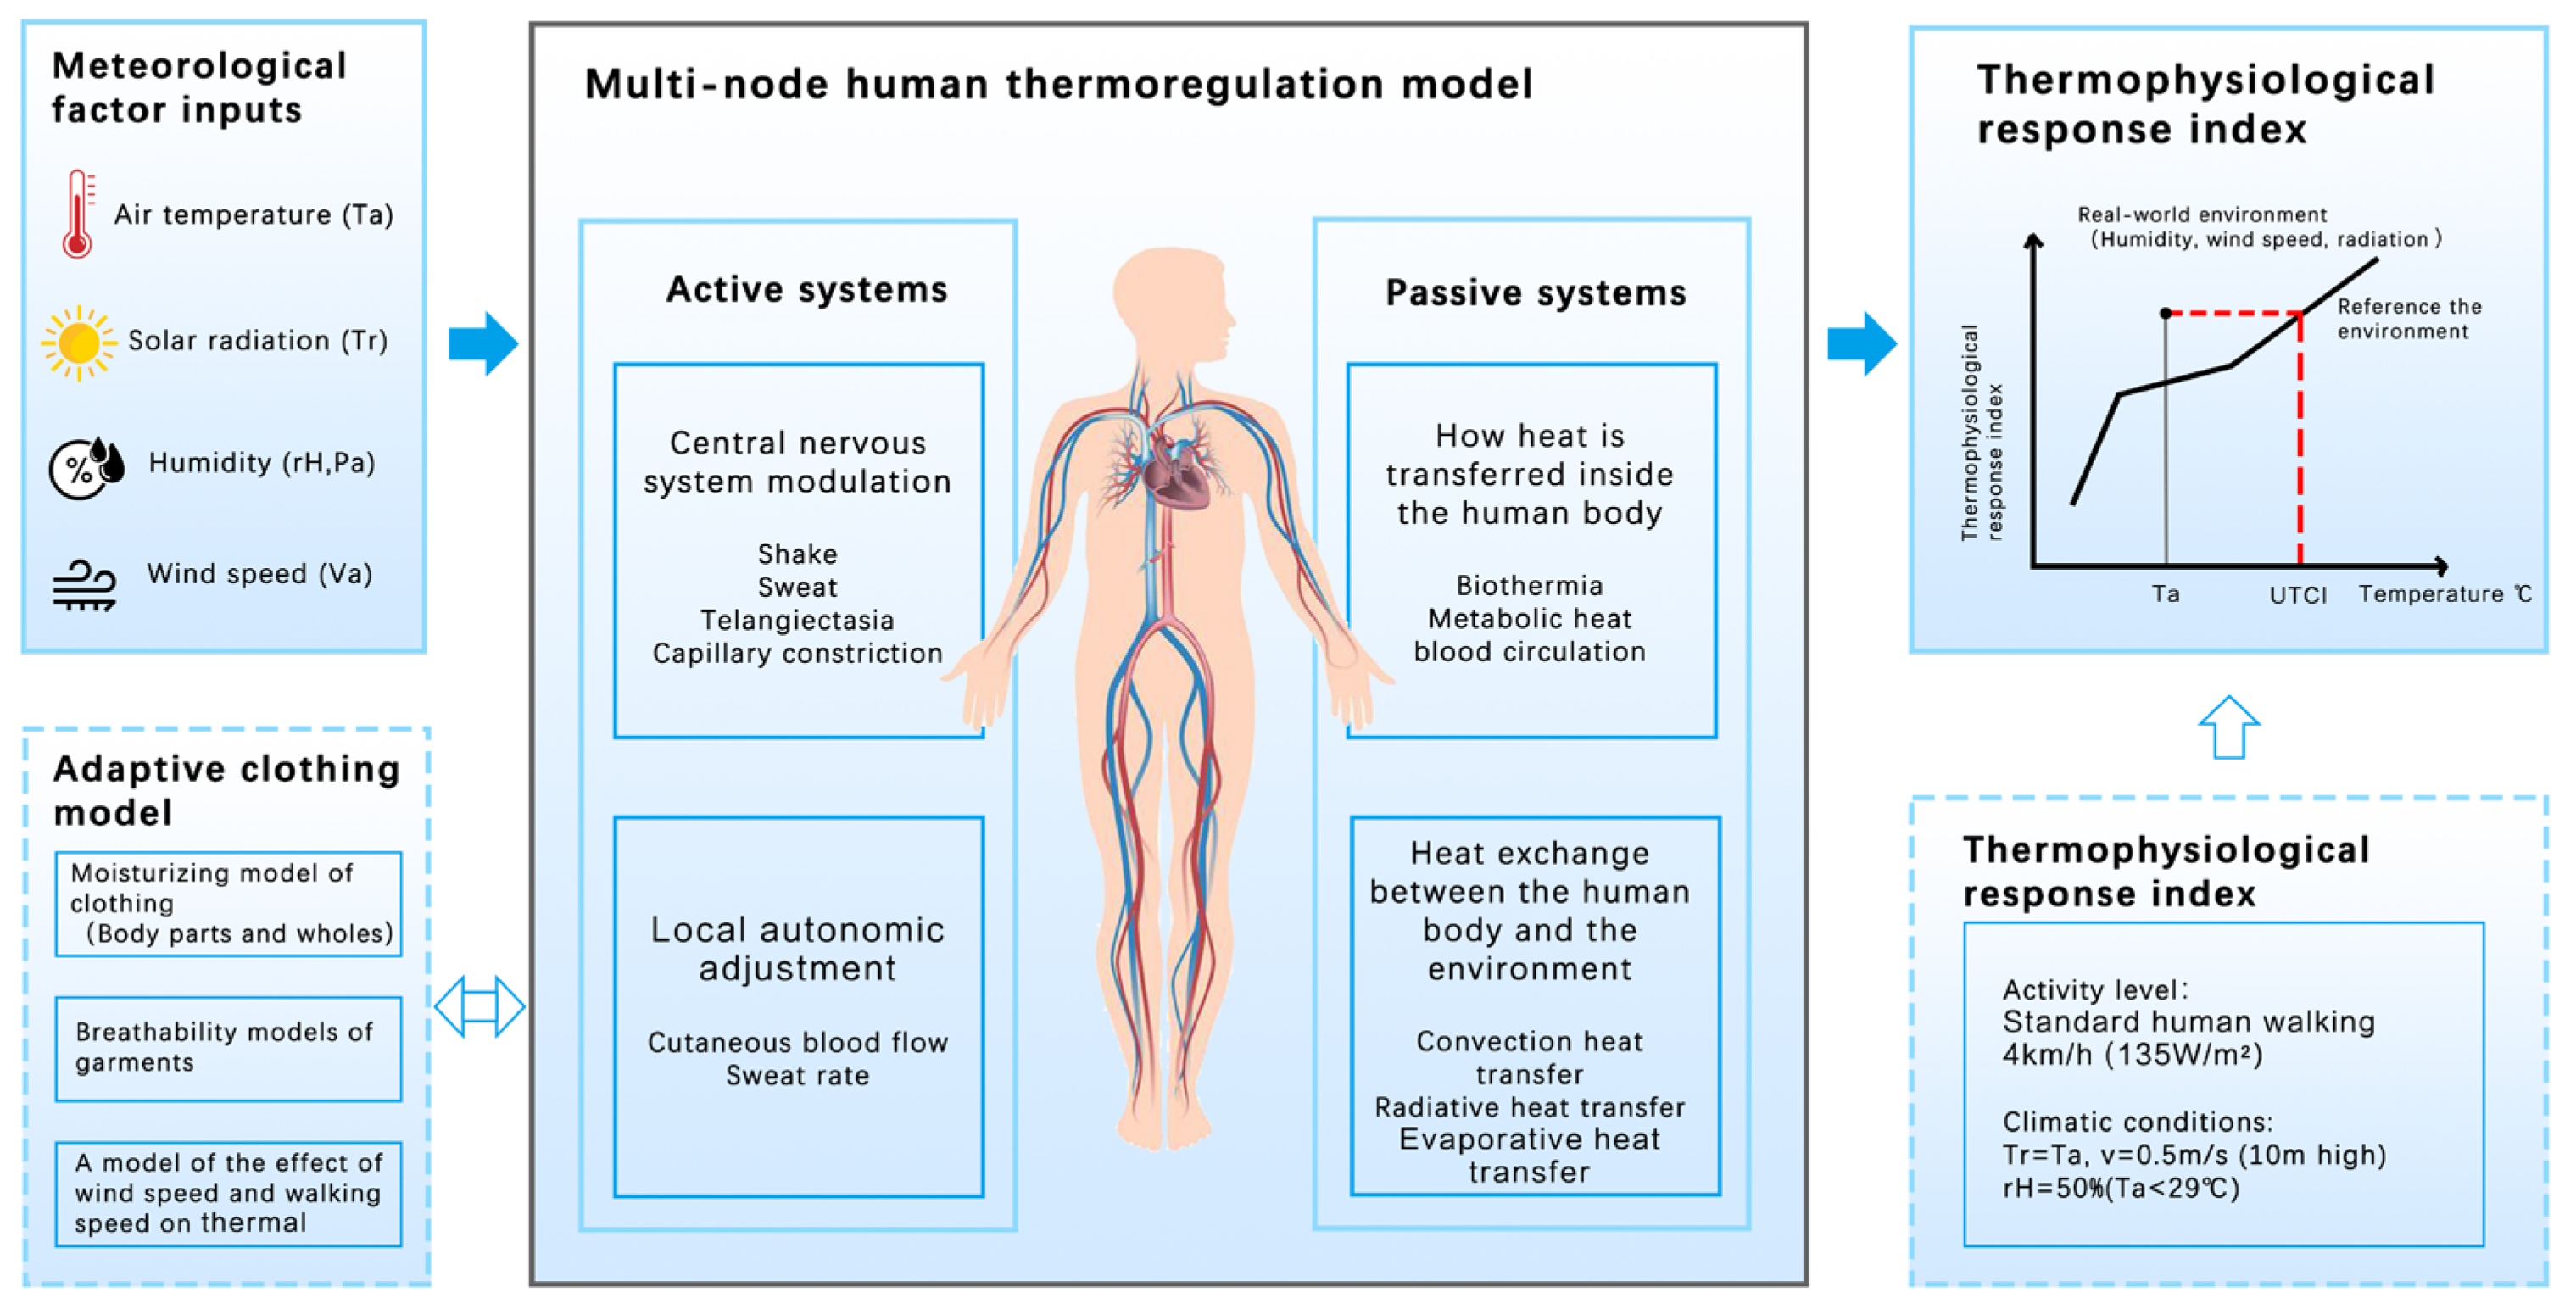
- Definition of the Universal Thermal Climate Index (UTCI)
- 2.
- UTCI calculation
- 3.
- Comfort evaluation indicators
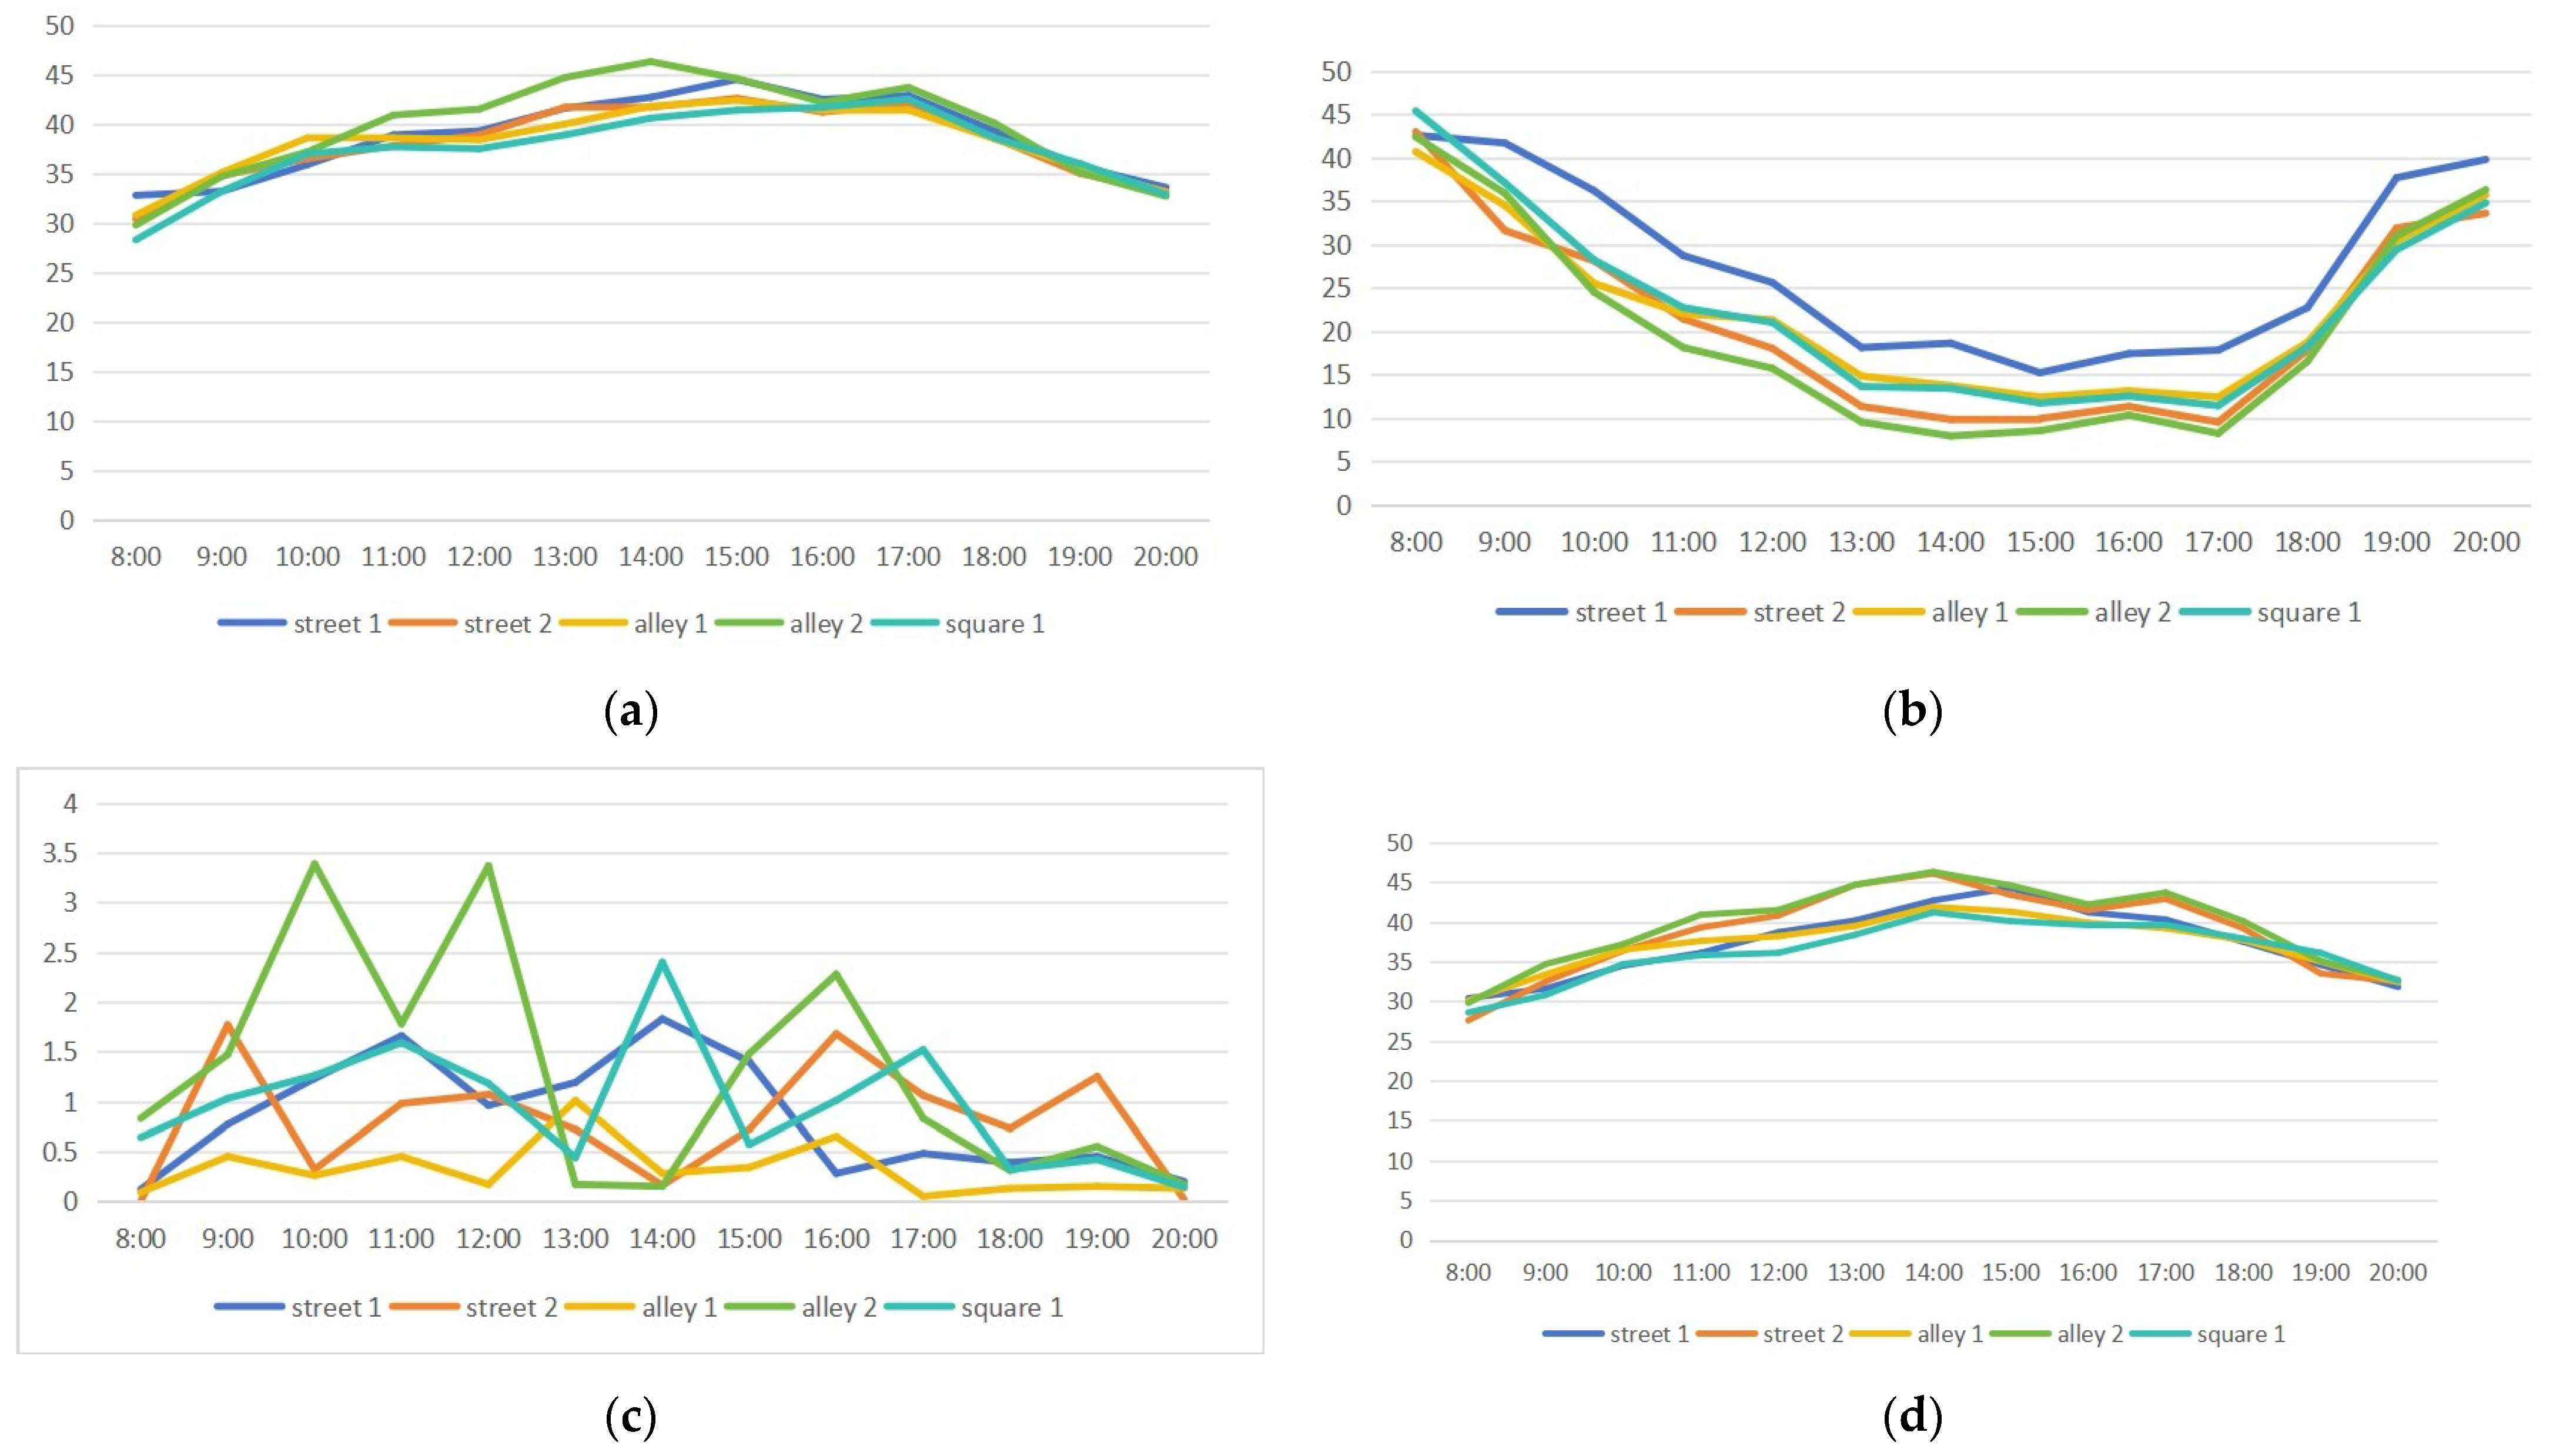
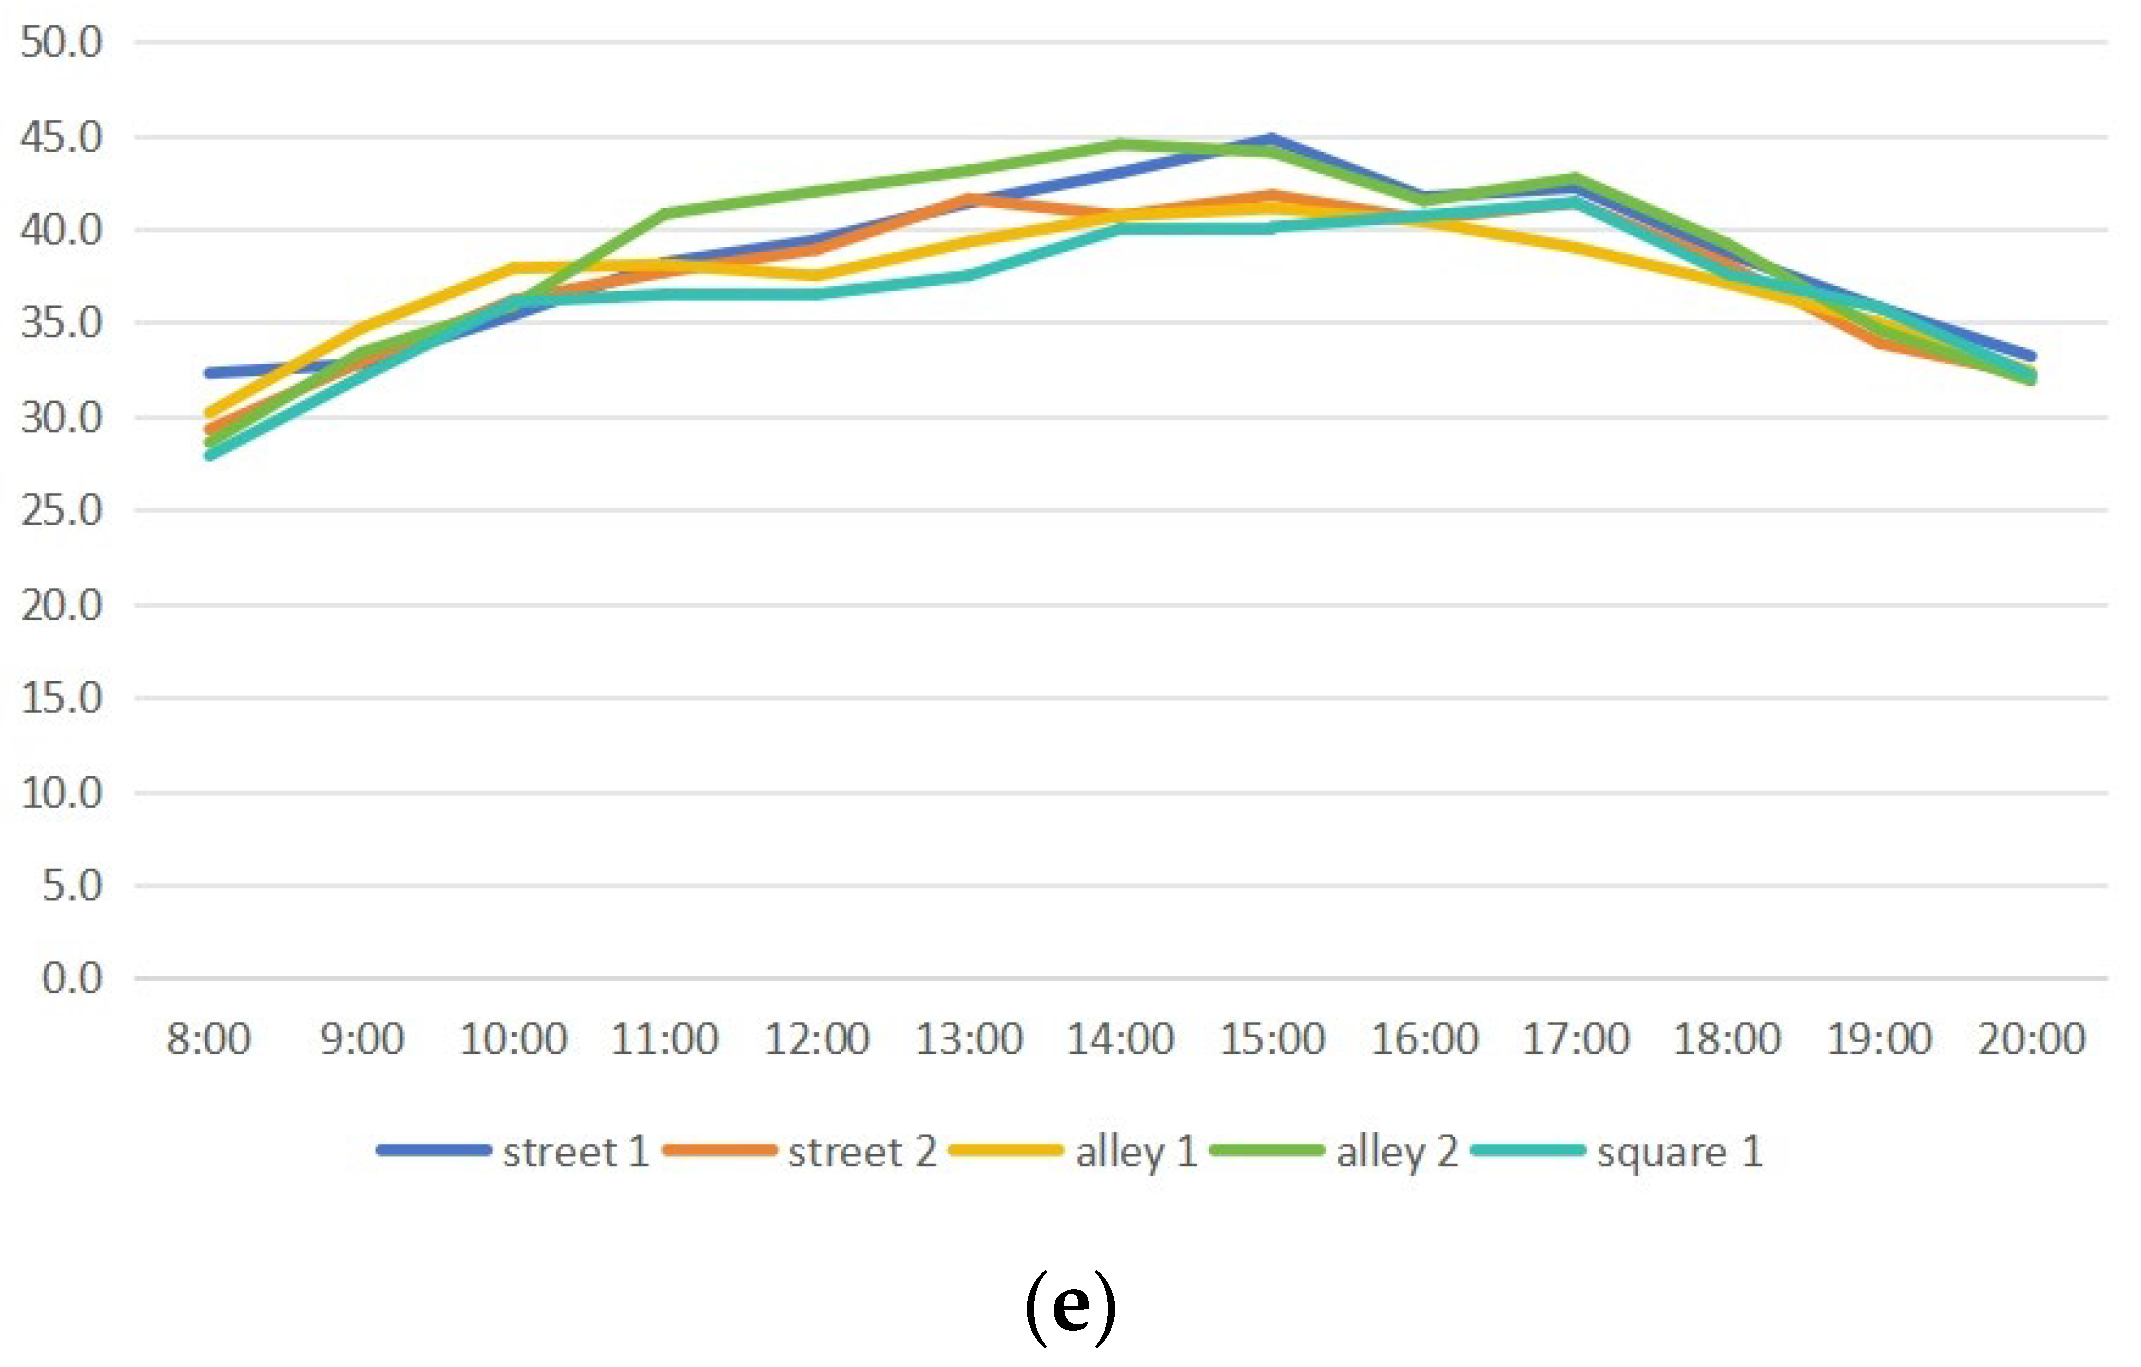
3.2.3. Test Data
3.3. Software Simulation and Verification
3.3.1. Use of Software
3.3.2. Microclimate Simulation
4. Extraction of Prototype and Morphological Elements of Traditional Villages
4.1. Prototype Extraction
4.2. Spatial Form Elements
- 1.
- Street aspect ratio
- 2.
- Open space
- 3.
- Street Lane Orientation

| Spatial Morphology Indicator | Graphical Representation | Describe |
|---|---|---|
| Aspect Ratio (H/W) | 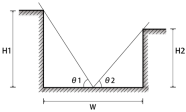 | The ratio of the average height of buildings on both sides of the street to the width of the street [31] |
| Open space |  | Public squares, event venues, private open spaces, etc. |
| Street orientation | 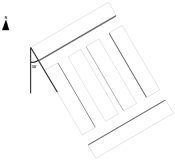 | The orientation of the street refers to the direction of the long axis of the street |
5. Experiments
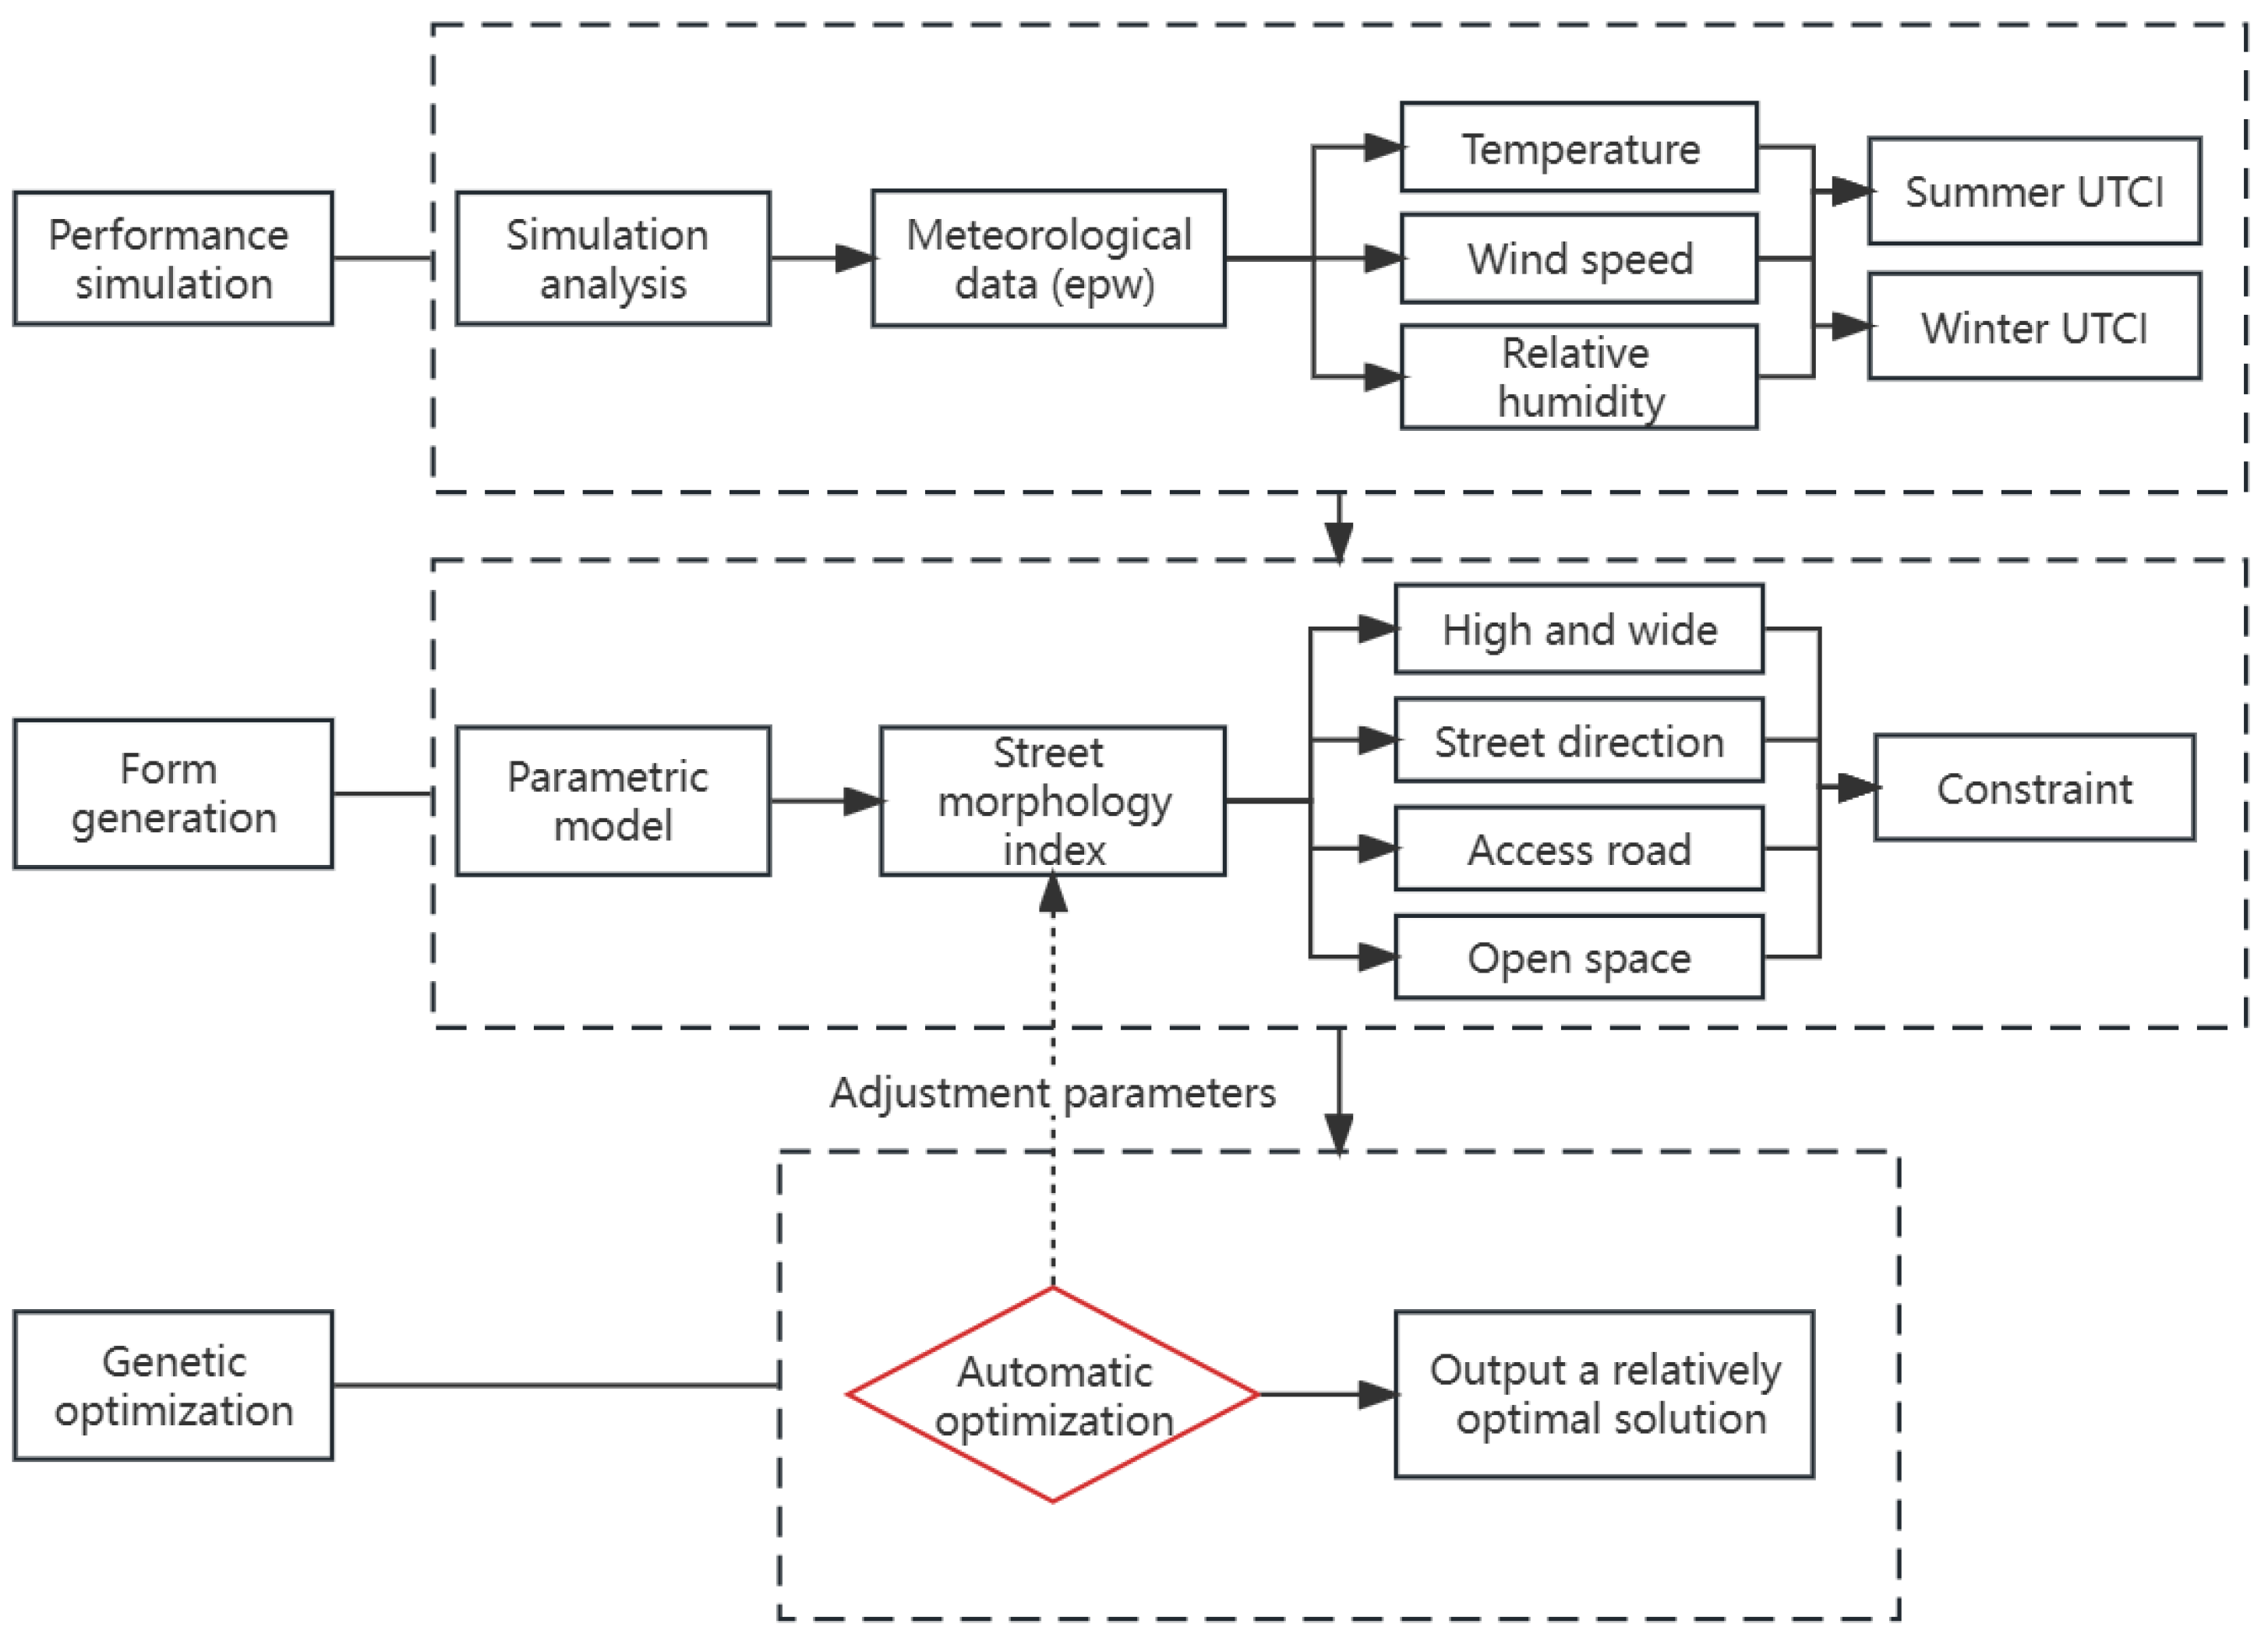
5.1. Morphogenesis
5.2. Performance Simulation
5.3. Genetic Optimization
5.4. Design of Experiments
6. Results and Discussion
6.1. Aspect Ratio and Orientation of Streets and Alleys
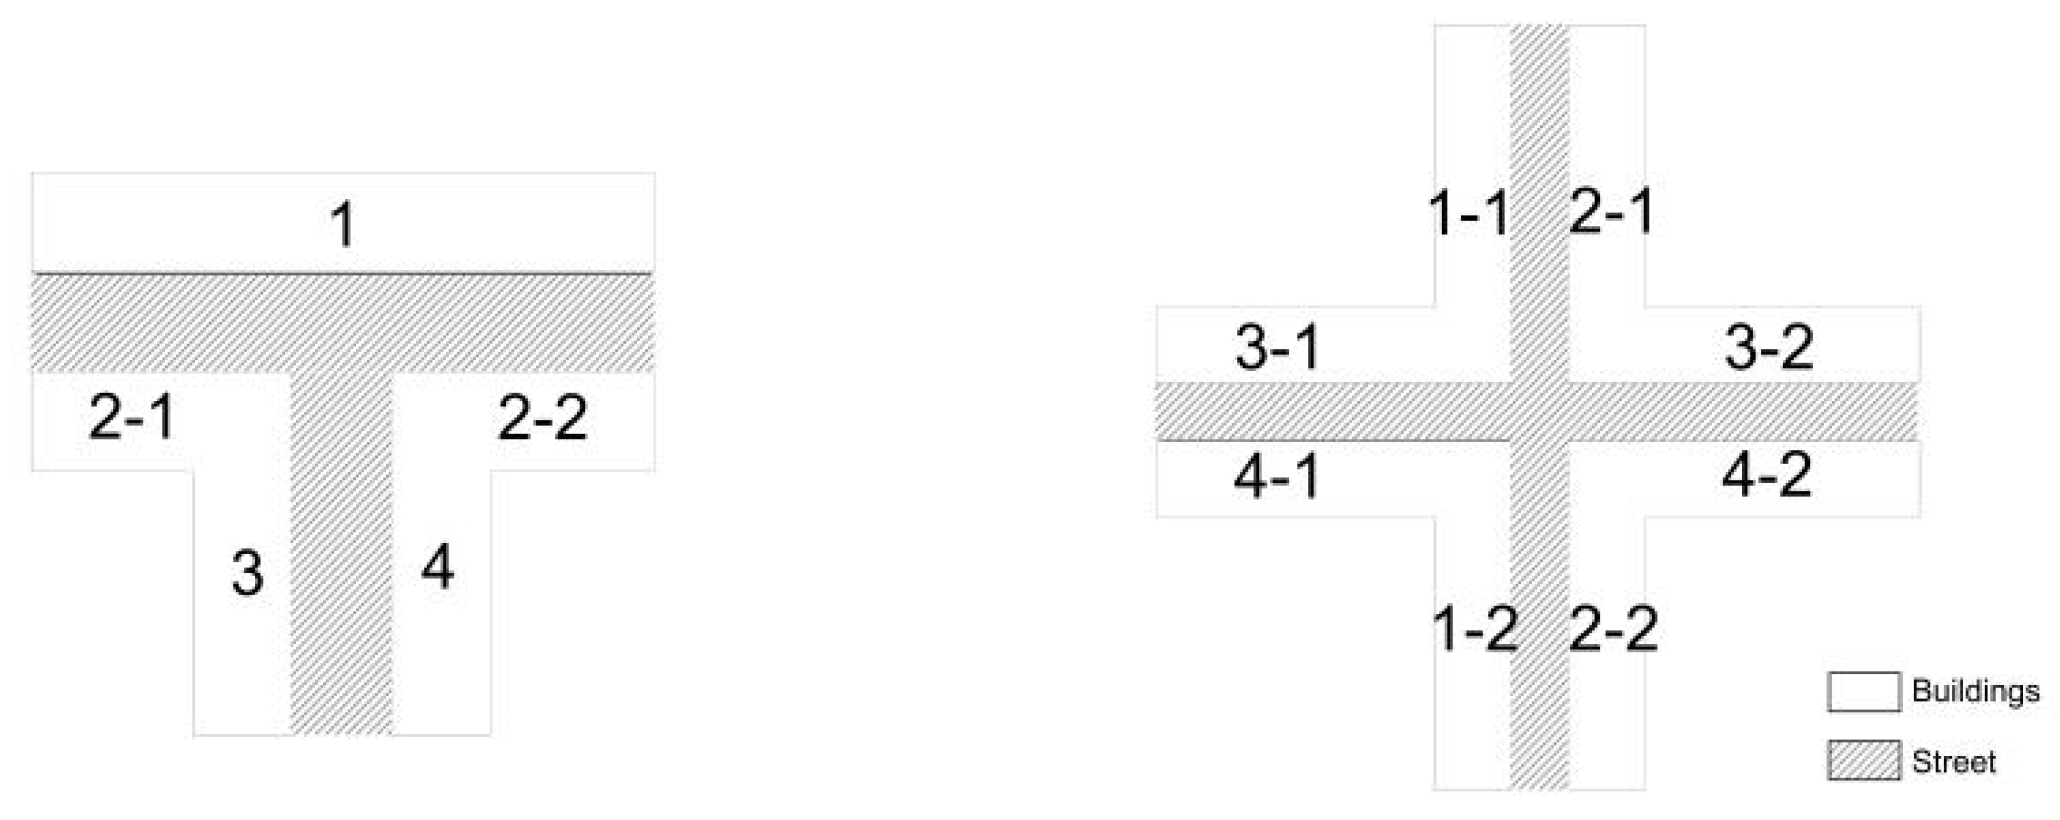
6.2. Street and Alley Forks
6.3. Street Open Space Form
7. Optimization Design Strategy for the Street Space
7.1. Street and Lane Scale, Orientation Design Strategy
7.2. Design of Street and Lane Branching Forms
7.3. Design of Open Spaces in Streets and Alleys
- Place for rest and communicationMost of the plazas in the village were used as places for rest and communication. The resting seats were generally arranged in the square to provide a resting and communication place for the residents. They combined with the green arrangement that helped the residents to feel more comfortable.
- Distribution center for people flowThe square in the village could also be employed as a distribution center for people flow. Due to the small-scale street space and the large flow of people, the evacuation of people in the street space was very important. Therefore, plaza-type node space could also be used as a staging area for human flow in the village to solve the problem of people evacuation.
7.4. Green Configuration Strategy
8. Conclusions
Author Contributions
Funding
Data Availability Statement
Conflicts of Interest
Abbreviations
| UTCI | Universal Thermal Climate Index |
| air temperature | |
| average radiation temperature | |
| wind speed | |
| water vapor pressure | |
| black-globe temperature | |
| diameter of the black-globe sensor | |
| emissivity | |
| calculated wind speed | |
| measured wind speed | |
| calculated wind speed height | |
| height of the original wind speed | |
| related to the characteristics of the underlying surface |
References
- Tumini, I.; Rubio-Bellido, C. Measuring climate change impact on urban microclimate: A case study of concepción. Procedia Eng. 2016, 161, 2290–2296. [Google Scholar] [CrossRef]
- Xiong, Y.; Zhang, J.; Yan, Y.; Sun, S.; Xu, X.; Higueras, E. Effect of the spatial form of Jiangnan traditional villages on microclimate and human comfort. Sustain. Cities Soc. 2022, 87, 104136. [Google Scholar] [CrossRef]
- Dimoudi, A.; Kantzioura, A.; Zoras, S.; Pallas, C.; Kosmopoulos, P. Investigation of urban microclimate parameters in an urban center. Energy Build. 2013, 64, 1–9. [Google Scholar] [CrossRef]
- Zhang, J.H.; Wang, N.; Guo, X. Research on the outdoor microclimate of cold residence. Appl. Mech. Mater. 2011, 99, 220–223. [Google Scholar] [CrossRef]
- Elbondira, T.A.; Tokimatsu, K.; Asawa, T.; Ibrahim, M.G. Impact of neighborhood spatial characteristics on the microclimate in a hot arid climate—A field based study. Sustain. Cities Soc. 2021, 75, 103273. [Google Scholar] [CrossRef]
- Chatzidimitriou, A.; Axarli, K. Street canyon geometry effects on microclimate and comfort; a case study in Thessaloniki. Procedia Environ. Sci. 2017, 38, 643–650. [Google Scholar] [CrossRef]
- Ma, L.J.; Zou, H.J.; Zhu, J.S. Study on prediction and assessment methods of outdoor wind environment of residential district-taking “Letian Home” in Leshan, Sichuan for example. Appl. Mech. Mater. 2011, 71, 3868–3873. [Google Scholar] [CrossRef]
- Li, L.; Zhang, L.J.; Zhang, N.; Hu, F.; Jiang, Y.; Xuan, C.Y.; Jiang, W.M. Study on the micro-scale simulation of wind field over complex terrain by RAMS/FLUENT modeling system. Wind. Struct. 2010, 13, 519–528. [Google Scholar] [CrossRef]
- Kim, K.; Cho, M. Development of the layout method for a high-rise housing complex using parametric algorithm. J. Asian Archit. Build. Eng. 2020, 19, 30–47. [Google Scholar] [CrossRef]
- Makki, M.; Showkatbakhsh, M.; Tabony, A.; Weinstock, M. Evolutionary algorithms for generating urban morphology: Variations and multiple objectives. Int. J. Archit. Comput. 2019, 17, 5–35. [Google Scholar] [CrossRef]
- Abdollahzadeh, N.; Biloria, N. Urban microclimate and energy consumption: A multi-objective parametric urban design approach for dense subtropical cities. Front. Archit. Res. 2022, 11, 453–465. [Google Scholar] [CrossRef]
- Abdollahzadeh, N.; Biloria, N. Outdoor thermal comfort: Analyzing the impact of urban configurations on the thermal performance of street canyons in the humid subtropical climate of Sydney. Front. Archit. Res. 2021, 10, 394–409. [Google Scholar] [CrossRef]
- Hancheng People’s Government Network. Available online: http://www.hancheng.gov.cn/zlk/hczj/hcnj/hcnj2019/fqgl/104476.htm (accessed on 15 October 2023).
- Yang, X.; Wang, M. Diversification and spatial differentiation of villages’ functional types in the new period of China: Results from hierarchical urban-rural spatial relations and townships size. Land 2022, 11, 171. [Google Scholar] [CrossRef]
- Available online: https://www.tianqishi.com/hancheng/20220806.html (accessed on 8 September 2023).
- Kong, Q.; Ge, Q.; Xi, J.; Zheng, J. Thermal comfort and its trend in key tourism cities of China. Geogr. Res. 2015, 34, 2238–2246. [Google Scholar]
- Bröde, P.; Fiala, D.; Błażejczyk, K.; Holmér, I.; Jendritzky, G.; Kampmann, B.; Tinz, B.; Havenith, G. Deriving the operational procedure for the Universal Thermal Climate Index (UTCI). Int. J. Biometeorol. 2012, 56, 481–494. [Google Scholar] [CrossRef] [PubMed]
- Dogan, A.; Kayaci, N.; Kanbur, B.B.; Demir, H. Experimental Investigation of Mean Radiant Temperature Trends for a Ground Source Heat Pump-Integrated Radiant Wall and Ceiling Heating System. Buildings 2023, 13, 2420. [Google Scholar] [CrossRef]
- Ren, J.; Shi, K.; Li, Z.; Kong, X.; Zhou, H. A Review on the Impacts of Urban Heat Islands on Outdoor Thermal Comfort. Buildings 2023, 13, 1368. [Google Scholar] [CrossRef]
- Available online: www.utci.org (accessed on 28 October 2023).
- Young, E.; Kastner, P.; Dogan, T.; Chokhachian, A.; Mokhtar, S.; Reinhart, C. Modeling outdoor thermal comfort along cycling routes at varying levels of physical accuracy to predict bike ridership in Cambridge, MA. Build. Environ. 2022, 208, 108577. [Google Scholar] [CrossRef]
- Available online: http://www.grasshopper3d.com/ (accessed on 5 November 2023).
- Available online: http://www.rhino3d.com/ (accessed on 5 November 2023).
- Chen, Y.; Zheng, L.; Yan, L. Research on the intelligent generation of the spatial form of the island city historic district Based on parameterization: Taking Macau Taipa Village as an example. J. Asian Archit. Build. Eng. 2023. [Google Scholar] [CrossRef]
- Available online: http://www.ladybug.tools/ (accessed on 5 November 2023).
- Roudsari, M.S.; Pak, M. Ladybug: A parametric environmental plugin for grasshopper to help designers create an environmentally-conscious design. In Proceedings of the BS 2013: 13th Conference of the International Building Performance Simulation Association (2013), Chambery, France, 25–28 August 2013; pp. 3128–3135. [Google Scholar]
- Samadi, S.; Noorzai, E.; Beltrán, L.O.; Abbasi, S. A computational approach for achieving optimum daylight inside buildings through automated kinetic shading systems. Front. Archit. Res. 2020, 9, 335–349. [Google Scholar] [CrossRef]
- De, B.; Mukherjee, M. Optimisation of canyon orientation and aspect ratio in warm-humid climate: Case of Rajarhat Newtown, India. Urban Clim. 2018, 24, 887–920. [Google Scholar] [CrossRef]
- Chatzidimitriou, A.; Yannas, S. Microclimate design for open spaces: Ranking urban design effects on pedestrian thermal comfort in summer. Sustain. Cities Soc. 2016, 26, 27–47. [Google Scholar] [CrossRef]
- Srivanit, M.; Jareemit, D. Modeling the influences of layouts of residential townhouses and tree-planting patterns on outdoor thermal comfort in Bangkok suburb. J. Build. Eng. 2020, 30, 101262. [Google Scholar] [CrossRef]
- Gao, W.; Hou, J.; Gao, Y.; Zhao, M.; Jia, M. Quantifying the Spatial Ratio of Streets in Beijing Based on Street-View Images. ISPRS Int. J. Geo-Inf. 2023, 12, 246. [Google Scholar] [CrossRef]
- Guo, W.; Cheng, B.; Wang, C.; Tang, X. Tree planting indices and their effects on summer park thermal environment: A case study of a subtropical satellite city, China. Indoor Built Environ. 2022, 31, 109–120. [Google Scholar] [CrossRef]


| Traditional Village | Street Plan | Street Characteristics |
|---|---|---|
| Qingshui Village |  | The ancient village road skeleton is composed of a number of main streets and lanes which converge at one point; the rest of the streets and lanes are connected to the skeleton horizontally and vertically. Roads by the West Rice—Dongzui Lane, Middle Lane, West Lane—at the head of the four main alleys, the main alleys, and secondary alleys are mostly “T”-shaped intersections, with the formation of a “T”-shaped pattern of streets and alleys. |
| Terrain | Street Layout | Schematic Plot | Street Form |
|---|---|---|---|
| Old mountain villages | Fishbone shape |  | Mainly T-shaped streets, crossover is rare |
| Dongju Alley, Ximi Alley Shangtou Alley | Donggou Road Middle Alley | Dongju Alley, Ximi Alley | |
|---|---|---|---|
| Aerial view |  |  |  |
| Schematic plot | 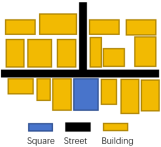 | 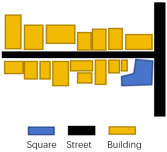 | 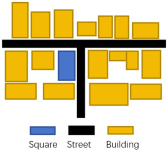 |
| Type | Location | Width (m) | Length (m) | Street Grade | Photograph | Space Perception |
|---|---|---|---|---|---|---|
| Straight line | Dongju Alley | 3.5 | 105 | Main street |  | Straight streets are strongly oriented, wide enough for cars, and narrow enough for pedestrians. But at the same time, the spatial experience is monotonous, with no landscape design, a lack of interest, and a poor sense of style. Very few linear streets have pagodas, small plazas, etc., to enrich the space of the streets. |
| Ximi Alley | 4.5 | 118 | Main street | 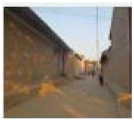 | ||
| Beiyan Road | 5.0 | --- | Main street | 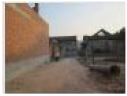 | ||
| Middle Alley | 4.0 | 147 | Main street | 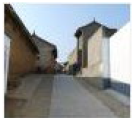 | ||
| Shangtou Alley | 3.5 | 175 | Main street | 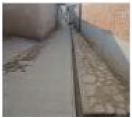 |
| Experimental Instruments | Diagram Form | Model | Measuring Range | Test Precision | Test Content | Time Interval |
|---|---|---|---|---|---|---|
| Standard black bulb thermometer |  | Heng xin AZ8778 (Manufacturer, Hengxin Industrial Co., Ltd., Taichung City, China) | 0–50 °C | ±0.6 °C | black-globe temperature | 30 min |
| Hot-wire anemometer |  | test 1340 (Manufacturer, TES ECONOMIC CORP. Taiwan, China) | 0–30 m | 0.01 m/s | wind speed | 30 min |
| Automatic recording of temperature and humidity meter |  | HOBO MX2301A (Manufacturer, Onset, Cape Cod, MA, USA) | −40–70 °C | ±0.2 °C | air temperature | 30 min (auto) |
| 0–100%RH | ±2.5%RH | relative humidity of the air |
| The Scope of the UTCI | Categories of Comfort |
|---|---|
| Below −40 °C | Extreme cold |
| −40 °C~−27 °C | Super-severe cold |
| −27 °C~−13 °C | Severe cold |
| −13 °C~0 °C | Moderate cold |
| 0 °C~9 °C | Mild cold |
| 9 °C~26 °C | Hotness |
| 26 °C~32 °C | Moderate fever |
| 32 °C~38 °C | Severe fever |
| 38 °C~46 °C | Super-severe heat |
| Above 46 °C | Extreme heat |
| Experiment | Control Variable | Morphological Parameters | Parameter Settings | Optimization Objectives | |
|---|---|---|---|---|---|
| Streets | Alley | ||||
| 1 | Street aspect ratio, Street direction | Street width | 6–10 m | 2–6 m | Outdoor thermal comfort during extremely hot and cold weeks |
| Building storey | 1–2 | 1 | |||
| Street direction | Northwest-Southeast Northeast-Southwest | ||||
| 2 | Street scale, Fork form, Height | Street width | 6–10 m | 2–6 m | Outdoor thermal comfort during extremely hot and cold weeks |
| Building storey | 1–2 | 1 | |||
| Fork form | T-shaped, cross-bonding | ||||
| 3 | Street scale, Open space form, Height | Street width | 8 m | Outdoor thermal comfort during extremely hot and cold weeks | |
| Building storey | 5 m | ||||
| Open space depth and width | 10–20 m | ||||
| Open space location | Both ends and middle | ||||
| No. | Building Height on the North Side (m) | Building Height on the South Side (m) | Street Width (m) | Street Direction | UTCI Value |
|---|---|---|---|---|---|
| 1 | 4.4 | 6.7 | 6.5 | Northeast-Southwest | 31.9 |
| 2 | 6.1 | 5.6 | 7.1 | Northeast-Southwest | 32.1 |
| 3 | 6.0 | 5.9 | 7.3 | Northeast-Southwest | 33.8 |
| 4 | 6.0 | 5.7 | 7.1 | Northeast-Southwest | 31.9 |
| 5 | 6.1 | 5.7 | 7.3 | Northeast-Southwest | 31.8 |
| No. | Building Height on the North Side (m) | Building Height on the South Side (m) | Alley Width (m) | Alley Direction | UTCI Value |
|---|---|---|---|---|---|
| 1 | 4.2 | 4.4 | 5.2 | Northeast-Southwest | 31.9 |
| 2 | 4.3 | 4.3 | 5.0 | Northeast-Southwest | 31.9 |
| 3 | 4.2 | 4.5 | 5.1 | Northeast-Southwest | 32.1 |
| 4 | 4.4 | 4.5 | 5.0 | Northeast-Southwest | 32.0 |
| 5 | 4.7 | 4.4 | 5.0 | North-South | 32.0 |
| Building Height of East-West Street (m) | Building Height of North-South Street (m) | Street Width | UTCI Value | ||||
|---|---|---|---|---|---|---|---|
| No. | 1 | 2-1 | 2-2 | 3 | 4 | ||
| 1 | 5.69 | 3.75 | 5.59 | 7.42 | 7.03 | 5.60 | 32.0 |
| 2 | 5.66 | 3.87 | 6.10 | 7.11 | 7.26 | 5.49 | 31.7 |
| 3 | 5.71 | 3.88 | 5.65 | 7.83 | 7.07 | 5.59 | 32.2 |
| 4 | 5.71 | 3.81 | 5.58 | 7.55 | 7.00 | 6.31 | 32.0 |
| 5 | 5.69 | 3.80 | 5.58 | 7.51 | 7.05 | 6.01 | 31.8 |
| Building Height of East-West Alley (m) | Building Height of North-South Alley (m) | Alley Width (m) | UTCI Value | ||||
|---|---|---|---|---|---|---|---|
| No. | 1 | 2-1 | 2-2 | 3 | 4 | ||
| 1 | 4.5 | 4.2 | 5.0 | 4.9 | 5.3 | 4.4 | 31.8 |
| 2 | 5.2 | 5.5 | 5.0 | 4.5 | 4.5 | 4.6 | 32.1 |
| 3 | 5.3 | 5.5 | 5.1 | 4.5 | 4.5 | 4.5 | 31.9 |
| 4 | 4.6 | 4.2 | 5.2 | 4.9 | 5.2 | 4.3 | 32.0 |
| 5 | 4.6 | 4.2 | 5.1 | 4.8 | 5.2 | 4.3 | 31.9 |
| Building Height of North-South Street (m) | Building Height of East-West Street (m) | Street Width (m) | UTCI Value | |||||||
|---|---|---|---|---|---|---|---|---|---|---|
| No. | 1-1 | 1-2 | 2-1 | 2-2 | 3-1 | 3-2 | 4-1 | 4.2 | ||
| 1 | 5.18 | 6.12 | 4.19 | 7.78 | 6.83 | 5.47 | 5.89 | 7.62 | 4.64 | 32.2 |
| 2 | 5.18 | 6.12 | 4.17 | 7.77 | 6.80 | 5.47 | 5.90 | 7.60 | 4.63 | 32.0 |
| 3 | 5.18 | 6.12 | 4.21 | 7.79 | 6.84 | 5.47 | 5.88 | 7.62 | 4.66 | 32.2 |
| 4 | 5.18 | 6.11 | 4.19 | 7.79 | 6.83 | 5.47 | 5.89 | 7.60 | 4.64 | 32.0 |
| 5 | 5.18 | 6.11 | 4.19 | 7.78 | 6.96 | 5.47 | 5.88 | 7.59 | 4.63 | 32.0 |
| Building Height of North-South Alley (m) | Building Height of East-West Alley (m) | Alley Width (m) | UTCI Value | |||||||
|---|---|---|---|---|---|---|---|---|---|---|
| No. | 1-1 | 1-2 | 2-1 | 2-2 | 3-1 | 3-2 | 4-1 | 4.2 | ||
| 1 | 5.6 | 4.5 | 4.5 | 5.2 | 5.4 | 4.7 | 5.3 | 5.7 | 3.2 | 31.7 |
| 2 | 5.6 | 4.5 | 4.5 | 5.3 | 5.3 | 4.5 | 5.3 | 5.7 | 3.2 | 31.7 |
| 3 | 5.6 | 4.5 | 4.5 | 5.3 | 5.4 | 4.7 | 5.3 | 5.7 | 3.3 | 31.9 |
| 4 | 5.6 | 4.7 | 4.5 | 5.3 | 5.3 | 4.4 | 5.3 | 5.4 | 3.2 | 32.0 |
| 5 | 5.7 | 4.4 | 4.7 | 5.4 | 5.4 | 4.7 | 5.4 | 5.7 | 3.2 | 31.9 |
| North Square | South Square | UTCI Value | ||||
|---|---|---|---|---|---|---|
| Width (m) | Depth (m) | Position | Width (m) | Depth (m) | Position | |
| 6.2 | 12 | East End | 7.4 | 12 | Middle | 32.0 |
| 6.5 | 10 | East End | 7.4 | 14 | Middle | 32.3 |
| 6.1 | 12 | East End | 7.5 | 13 | Middle | 31.9 |
| 6.3 | 11 | East End | 7.4 | 13 | Middle | 31.7 |
| 6.3 | 11 | East End | 7.3 | 12 | Middle | 32.0 |
Disclaimer/Publisher’s Note: The statements, opinions and data contained in all publications are solely those of the individual author(s) and contributor(s) and not of MDPI and/or the editor(s). MDPI and/or the editor(s) disclaim responsibility for any injury to people or property resulting from any ideas, methods, instructions or products referred to in the content. |
© 2024 by the authors. Licensee MDPI, Basel, Switzerland. This article is an open access article distributed under the terms and conditions of the Creative Commons Attribution (CC BY) license (https://creativecommons.org/licenses/by/4.0/).
Share and Cite
Lyu, Y.; Zhang, L.; Liu, X.; Ma, X. Microclimate-Adaptive Morphological Parametric Design of Streets and Alleys in Traditional Villages. Buildings 2024, 14, 152. https://doi.org/10.3390/buildings14010152
Lyu Y, Zhang L, Liu X, Ma X. Microclimate-Adaptive Morphological Parametric Design of Streets and Alleys in Traditional Villages. Buildings. 2024; 14(1):152. https://doi.org/10.3390/buildings14010152
Chicago/Turabian StyleLyu, Yufei, Lei Zhang, Xin Liu, and Xuan Ma. 2024. "Microclimate-Adaptive Morphological Parametric Design of Streets and Alleys in Traditional Villages" Buildings 14, no. 1: 152. https://doi.org/10.3390/buildings14010152
APA StyleLyu, Y., Zhang, L., Liu, X., & Ma, X. (2024). Microclimate-Adaptive Morphological Parametric Design of Streets and Alleys in Traditional Villages. Buildings, 14(1), 152. https://doi.org/10.3390/buildings14010152