Article

A Subpixel Concrete Crack Measurement Method Based on the Partial Area Effect

1
School of Civil Engineering, Chongqing Jiaotong University, Chongqing 400074, China
2
Merchant Chongqing Communication Research & Design Institute Co., Ltd., Chongqing 400067, China
3
School of Civil and Transportation Engineering, Shenzhen University, Shenzhen 518060, China
*
Author to whom correspondence should be addressed.
Buildings 2024, 14(1), 151; https://doi.org/10.3390/buildings14010151
Submission received: 22 November 2023 / Revised: 31 December 2023 / Accepted: 3 January 2024 / Published: 8 January 2024
(This article belongs to the Special Issue Concrete Structural Safety and Health Monitoring)

Abstract

:
To improve the accuracy of concrete crack measurement with a machine vision method in structural health monitoring and in technical status evaluation, a subpixel crack measurement method based on the partial area effect was proposed. (1) First, a pixelwise crack image segmentation method was established through a multi-step process of multi-threshold fusion and morphology operation, and a novel pixel degree crack width calculation method was developed with the extraction of the middle points, the center line and its normal, and the intersection of the center line normal and crack edges. (2) Then, a subpixel algorithm based on the partial area effect was introduced to locate vertical, horizontal, and oblique cracks in subpixel crack edges, and the subpixel crack width could be calculated along the crack center line pixelwise. (3) Finally, the proposed method was verified by indoor concrete beam crack measurement tests with a digital microscope, and the results show that the maximum relative errors of the subpixel width of the horizontal, vertical, and oblique straight cracks measured by the proposed method were 3.06%, 8.97%, and 5.16%, respectively. The absolute error of the crack length was less than 0.30 mm, and the measurement accuracy could reach 0.01 pixels. The subpixel crack measurement method provides a novel possible solution for structural health monitoring.

1. Introduction

Cracks in substantial concrete structures, including in-service bridges, tunnels, and dams, can pose a danger to the operational safety of the structures, and it is essential to conduct regular inspections and evaluations of cracks, along with long-term monitoring of their condition, to ensure that structures remain in optimal technical condition. The method of periodic inspection is mainly manual visual inspection, which is often not precise enough and prone to produce inconsistent results [1,2]. Long-term status monitoring is costly and time consuming, and it can only monitor changes in crack width. Moreover, the number of monitoring points is limited, making it suitable only for the status monitoring of a few specific cracks [3]. To enhance the safety status of structures and improve the efficiency of structural health monitoring, researchers have presently achieved automated physical inspections of structures [4]. Furthermore, these are capable of the automatic detection and segmentation of structures with damage [5].
In recent years, machine vision crack recognition methods based on deep learning have made great progress (black-box techniques) [6]. There are many networks applied in crack recognition, including residual networks (ResNet) [7], fully convolutional networks (FCN) [8], and convolutional neural networks (CNN) [9]. Dais used deep learning to identify cracks in masonry walls [10]. Zhang used the BC MobileNet network model to identify cracks in bridges [11]. And Wu used a U-net network model to identify road cracks [12]. Li proposed a convolutional neural network and naive Bayesian data fusion method, which solves the problems of inefficiency and low accuracy of traditional visual feature-based defect detection methods [13]. Wang utilized a ResNet to enhance measurement accuracy and crack recognition [14]. Ali studied the application of a convolutional neural network in crack detection, and the limitations of machine vision techniques (white-box techniques) and machine learning in crack recognition were discussed [15]. Deep learning and traditional image process methods can be combined to solve crack detection problems (grey-box techniques) [16]. Despite the success of deep learning techniques in concrete crack detection, the decision-making process of deep learning is characterized by its lack of interpretability. The accuracy of the results produced by deep learning techniques depends on the network used and requires large datasets for training, along with significant computational power.
The traditional image process method has the advantages of high interpretability and efficiency and does not demand a large dataset and computational power. Therefore, there is still a place for the development of the image process method. Researchers have established a variety of concrete crack image segmentation methods to extract cracks and calculate crack length and width. Tang used a bilateral filtering and image adaptive chunking method to achieve the detection of cracks in tunnels [17]. Sun proposed an improved seed fill algorithm and designed a concrete surface crack image recognition system that calculates the number of crack bars and their length and width [18]. Han combined deep learning with digital image technology and used the improved edge gradient method to locate and calculate the maximum width of the pixel crack [19]. Liu proposed an improved crack detection algorithm based on structural analysis, specifically targeting images of crack defects in underground tunnels [20]; addressing the challenges encountered in traditional pipeline crack detection, Altabey developed an image processing-based method for detecting pipeline cracks in complex environments [21]. Pantoja-Rosero proposed a novel algorithm to calculate displacement maps in tangential and normal directions in a crack skeleton from a binary image by a Euclidean transformation model and non-linear least squares-based optimization method [22]. However, the measurement precision of the traditional image process method is at a pixel level, which may result in significant errors in high-precision measurement conditions—for example, measuring minute cracks variations changed with time.
High-precision crack measurement is in urgent demand by infrastructure inspection and health monitoring services; China’s Technical Specification for Digital Image Inspection of Engineering Structures requires a minimum width measurement of 0.1 mm for digital image methods [23]. For highway bridges, the standard is even finer at 0.01 mm. These high-precision measurement requirements pose significant challenges for the selection of machine vision equipment, as well as data transmission and storage. The pixel parameter calculation method is inadequate for practical engineering requirements. Consequently, a subpixel-based location method has attracted extensive attention from researchers. Chen used a cubic polynomial fitting image edge to achieve subpixel localization [24], and Luo suggested an enhanced gray-moment subpixel edge detection algorithm, yielding a measurement accuracy of approximately 0.06~0.08 pixels [25]. Trujillo proposed a subpixel edge positioning approach that is based on the partial area effect and can eventually compute the subpixel coordinates, inclination, and curvature of the edges [26]. Subpixel location algorithms are promising in infrastructure crack width and length calculation, but they have not attracted enough attention from researchers and are not employed in high-precision crack measurement and crack parameter extraction.
In this paper, we present a novel white-box approach focused on enhancing the precision of crack measurements in concrete structures. Different from the crack segmentation method in the current literature, our approach incorporates a subpixel algorithm based on the partial area effect, and it significantly improves the precision of crack detection. This method is distinct in its ability to accurately locate both pixel and subpixel crack edges, an advancement over traditional pixel-based techniques.
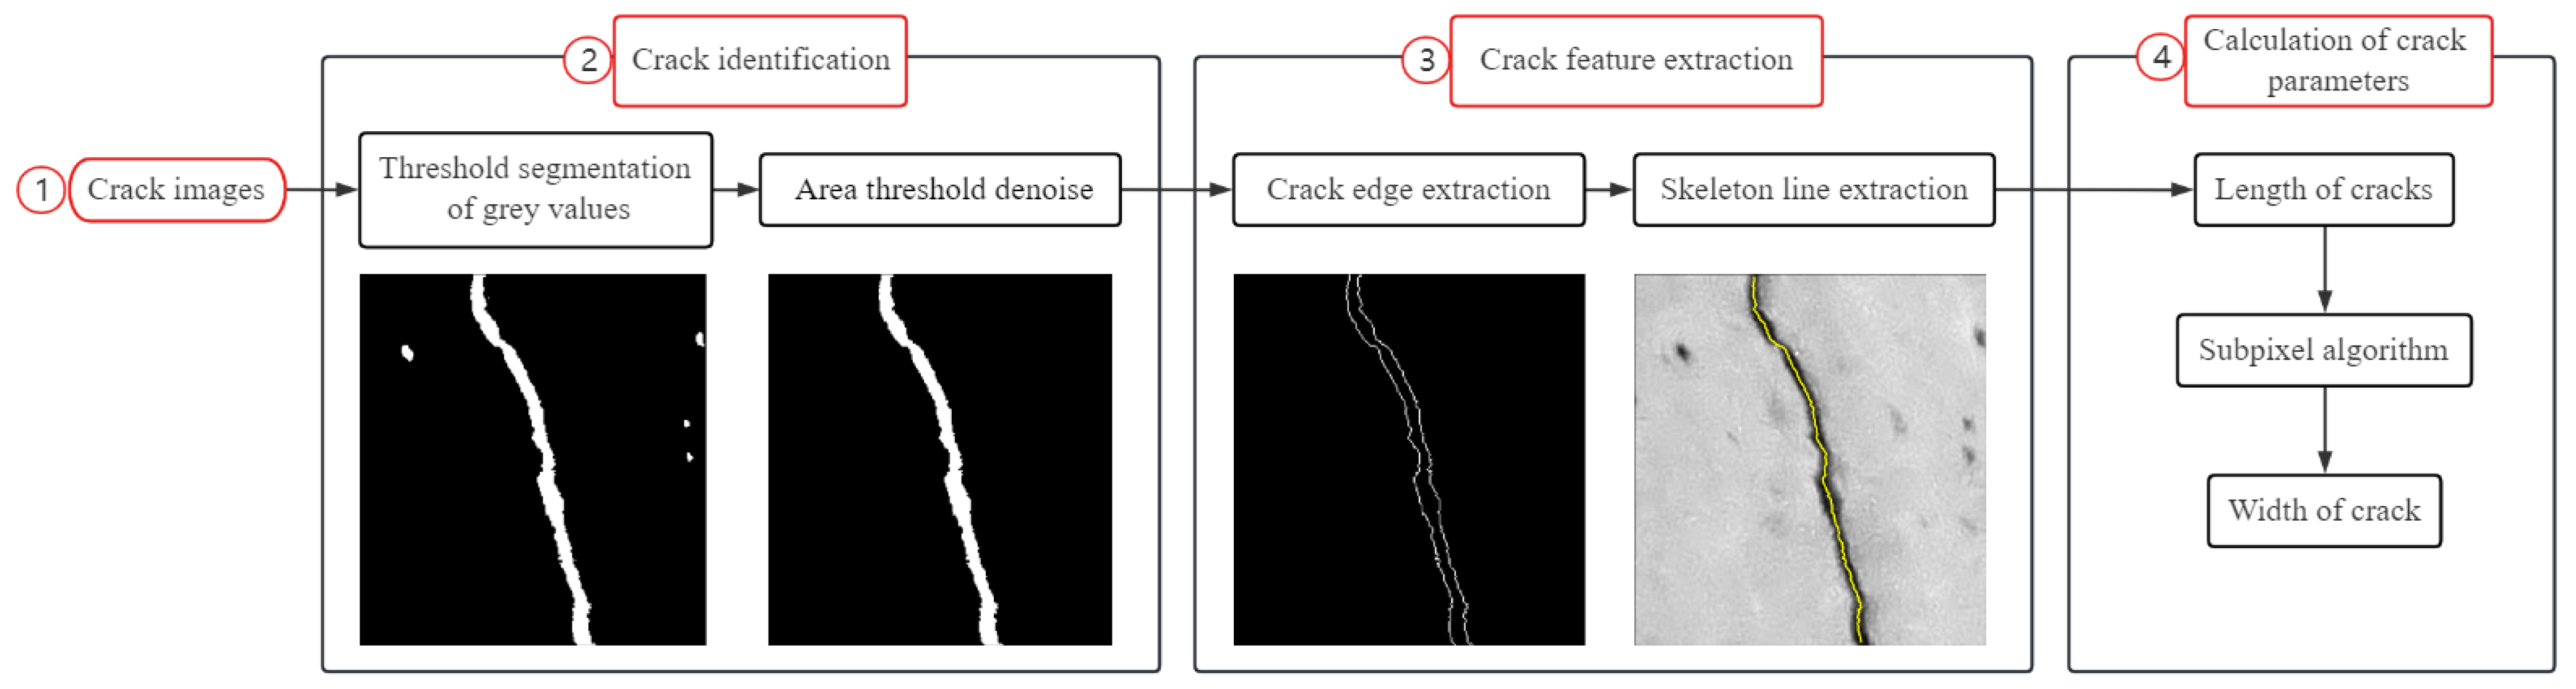
The measurement of cracks on concrete structure surface proposed in this paper mainly includes the following parts: ① Acquisition of crack images using a civil camera; ② Identification of crack images using grayscale threshold, area threshold and morphological operations; ③ Acquisition of crack edges and crack center lines by a 4-neighbourhood convolution kernel; ④ Calculation the crack precise width and length by subpixel algorithm of the partial area effect. As stated above, our approach is a process composed of crack image capture, identification, feature extraction and parameter calculation. The overall framework of crack image identification is shown in Figure 1.

2. Pixelwise Crack Image Segmentation and Parameters Extraction

In this section, we propose a multi-threshold segmentation method that integrates grayscale, area, and connection thresholds. This method is designed to denoise concrete crack images and detect cracks at the pixel level.
Common segmentation approaches, such as those based on thresholds, gradients, and regions, are considered standard. Our method advances these by combining multiple thresholds to enhance the precision and accuracy of crack segmentation in concrete structures.

2.1. Pixel Image Segmentation with Multi-Threshold Fusion

2.1.1. Grayscale Threshold Segmentation of Images

Grayscale threshold segmentation can separate crack areas in an image from the image background. A reasonable grayscale threshold T is the foundation for maximizing crack extraction and ensuring accurate results. When using a grayscale threshold for image crack segmentation, pixels smaller than grayscale threshold T are identified as cracks and assigned a value of 1; pixels greater than or equal to the grayscale threshold T are recognized as background and assigned a value of 0, i.e.,
I ( x , y ) = { 1 , F ( x , y ) < T 0 , F ( x , y ) T
where F ( x , y ) represents the grayscale value of any pixel in the original image, and I ( x , y ) represents the grayscale value of the pixel after grayscale threshold segmentation.
The grayscale threshold T is crucial for the accuracy of crack segmentation. If the grayscale threshold T is set too large, it will cause background pixels to be mistakenly recognized as cracks, resulting in oversegmentation. Conversely, if the grayscale threshold T is set too small, it will cause the crack pixels to be mistakenly recognized as background, resulting in undersegmentation. Common methods for grayscale threshold segmentation include the iterative method, the Otsu method, and the self-set threshold method.
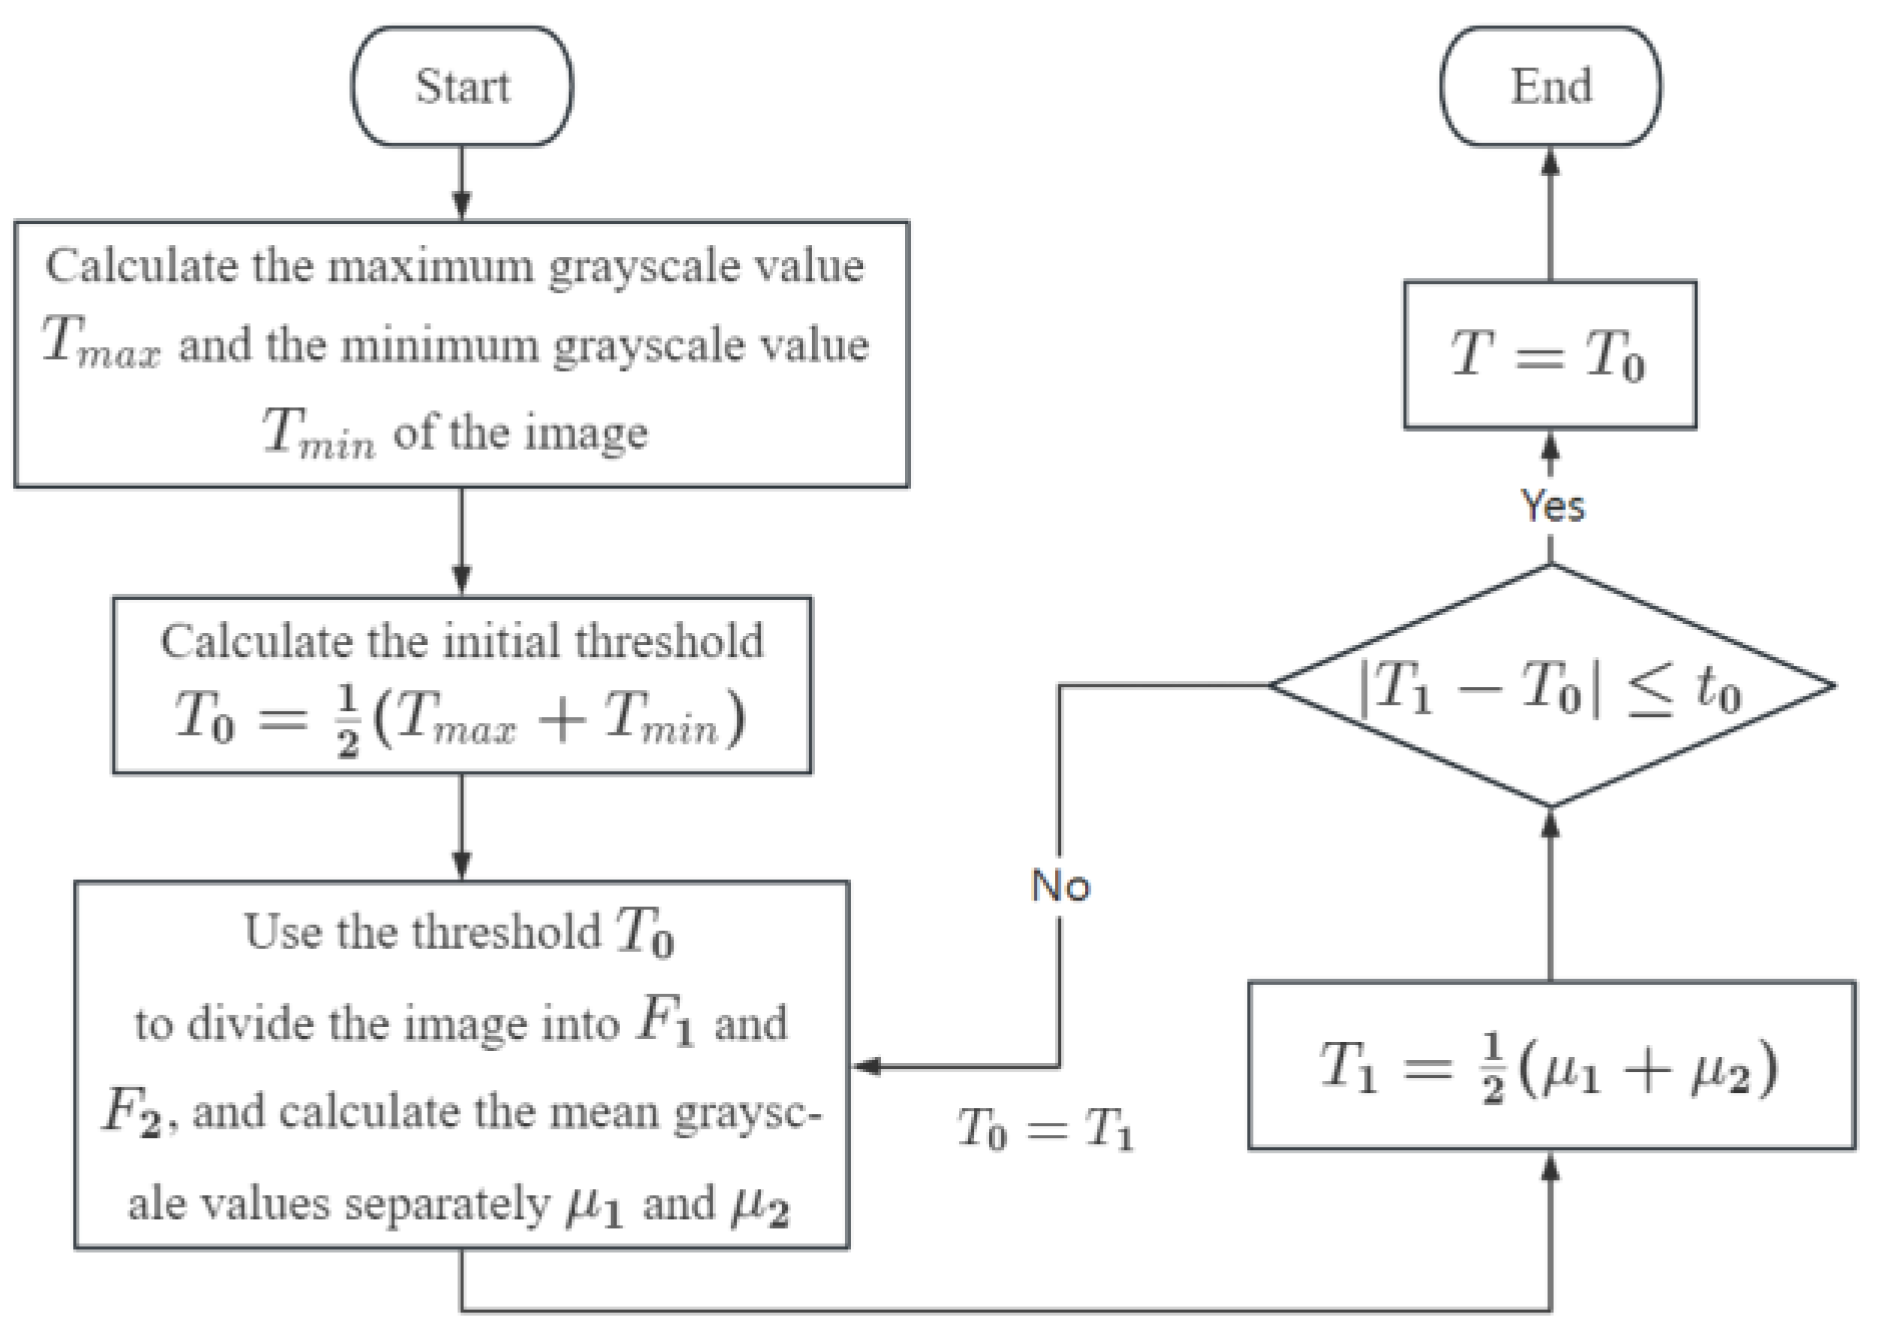
The iterative method is a method for iteratively calculating the grayscale threshold of images, suitable for crack images with bimodal histograms. It starts with an initial threshold T0, set as the average of the image’s maximum and minimum grayscale values, and an allowable error t0. ① The image is then segmented into background (F1) and crack (F2) regions using T0. ② The mean grayscales for F1 ( μ 1 ) and F2 ( μ 2 ) can be calculated, and a new threshold T1 can be calculated as the average of μ 1 and μ 2 . ③ If the absolute difference between T1 and T0 is less than t0, the process stops and T0 is set as the final threshold for image segmentation. Otherwise, T1 is assigned to T0, and the above steps are repeated until the absolute difference between T1 and T0 is less than t0. The workflow is shown in Figure 2.
The Otsu method aims to find a grayscale threshold T that maximizes the variance between cracks and background regions, thereby achieving optimal image segmentation [27]. The self-set threshold method is a subjective selection method based on experience. It involves manually selecting a suitable grayscale threshold T for image segmentation through understanding and judgment of the image.
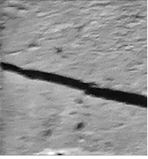
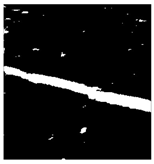
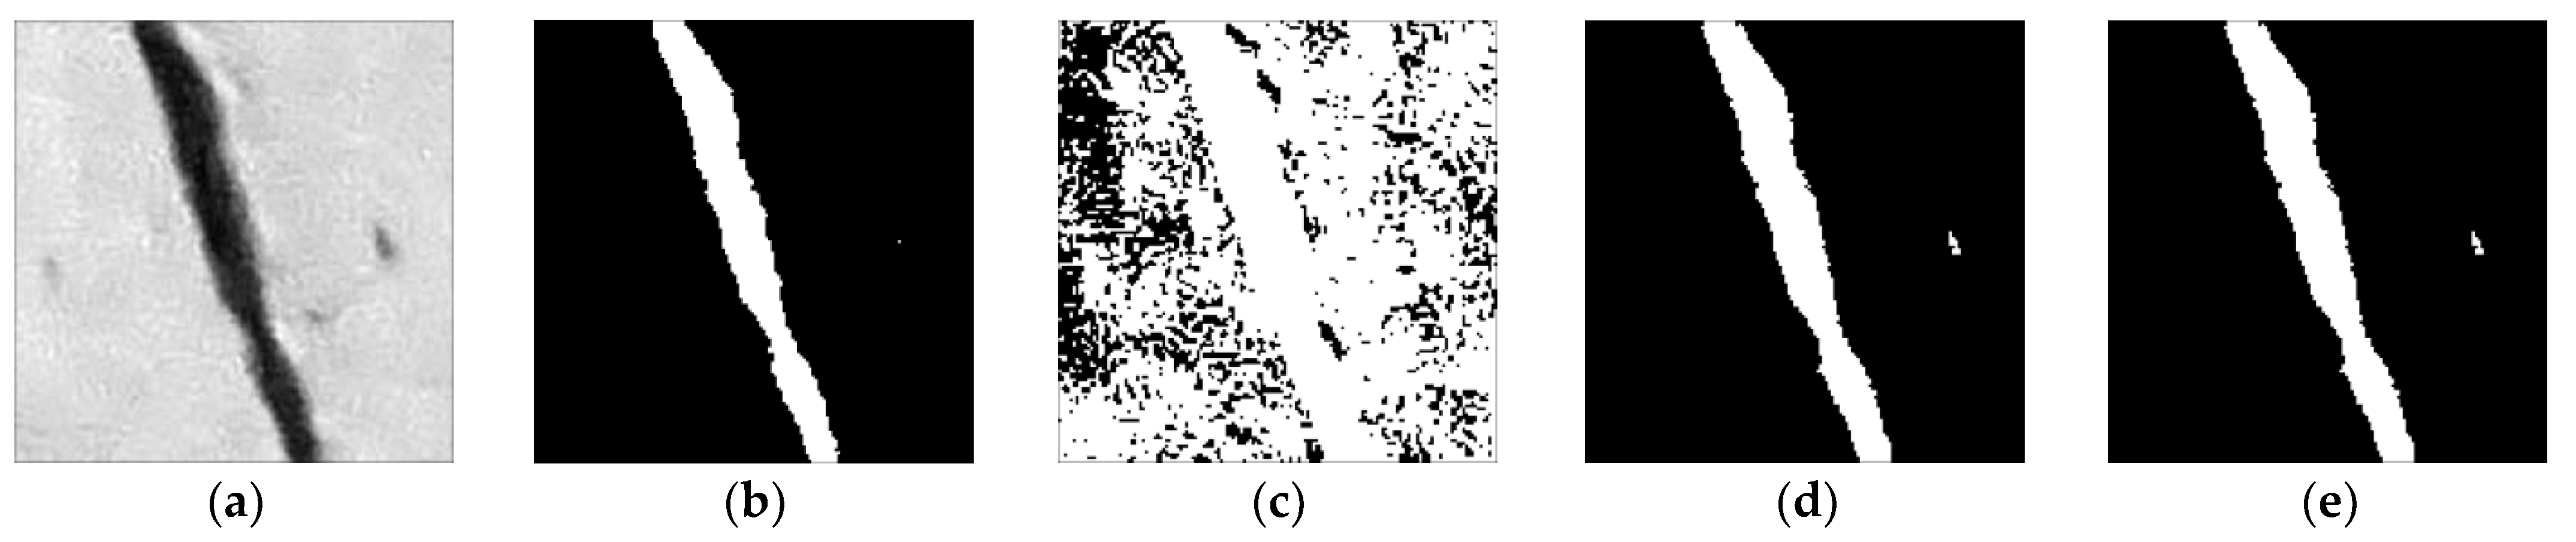
To compare the effectiveness of different methods, concrete crack images were segmented using the iterative method, the Otsu method, and the self-set threshold method for comparison, as shown in Figure 3. The self-set threshold method had grayscale thresholds T of 64 and 128, respectively. This method necessitates manually setting the grayscale threshold T for every crack image, which is inefficient. In contrast, the iterative method and the Otsu method do not require manual adjustment of the grayscale threshold T, making them more efficient and effective.
The threshold calculation results and time consumption of the iterative method and the Otsu method are shown in Table 1. The results indicate that the grayscale thresholds obtained by the iterative method and the Otsu method are very close, with a difference of only 0.09; However, in terms of computational efficiency, the iterative method is superior to the Otsu method (73 ms faster than the Otsu method for every 1000 executions). Therefore, this paper adopts the iterative method for calculating and determining the grayscale threshold.

2.1.2. Area Threshold Denoise

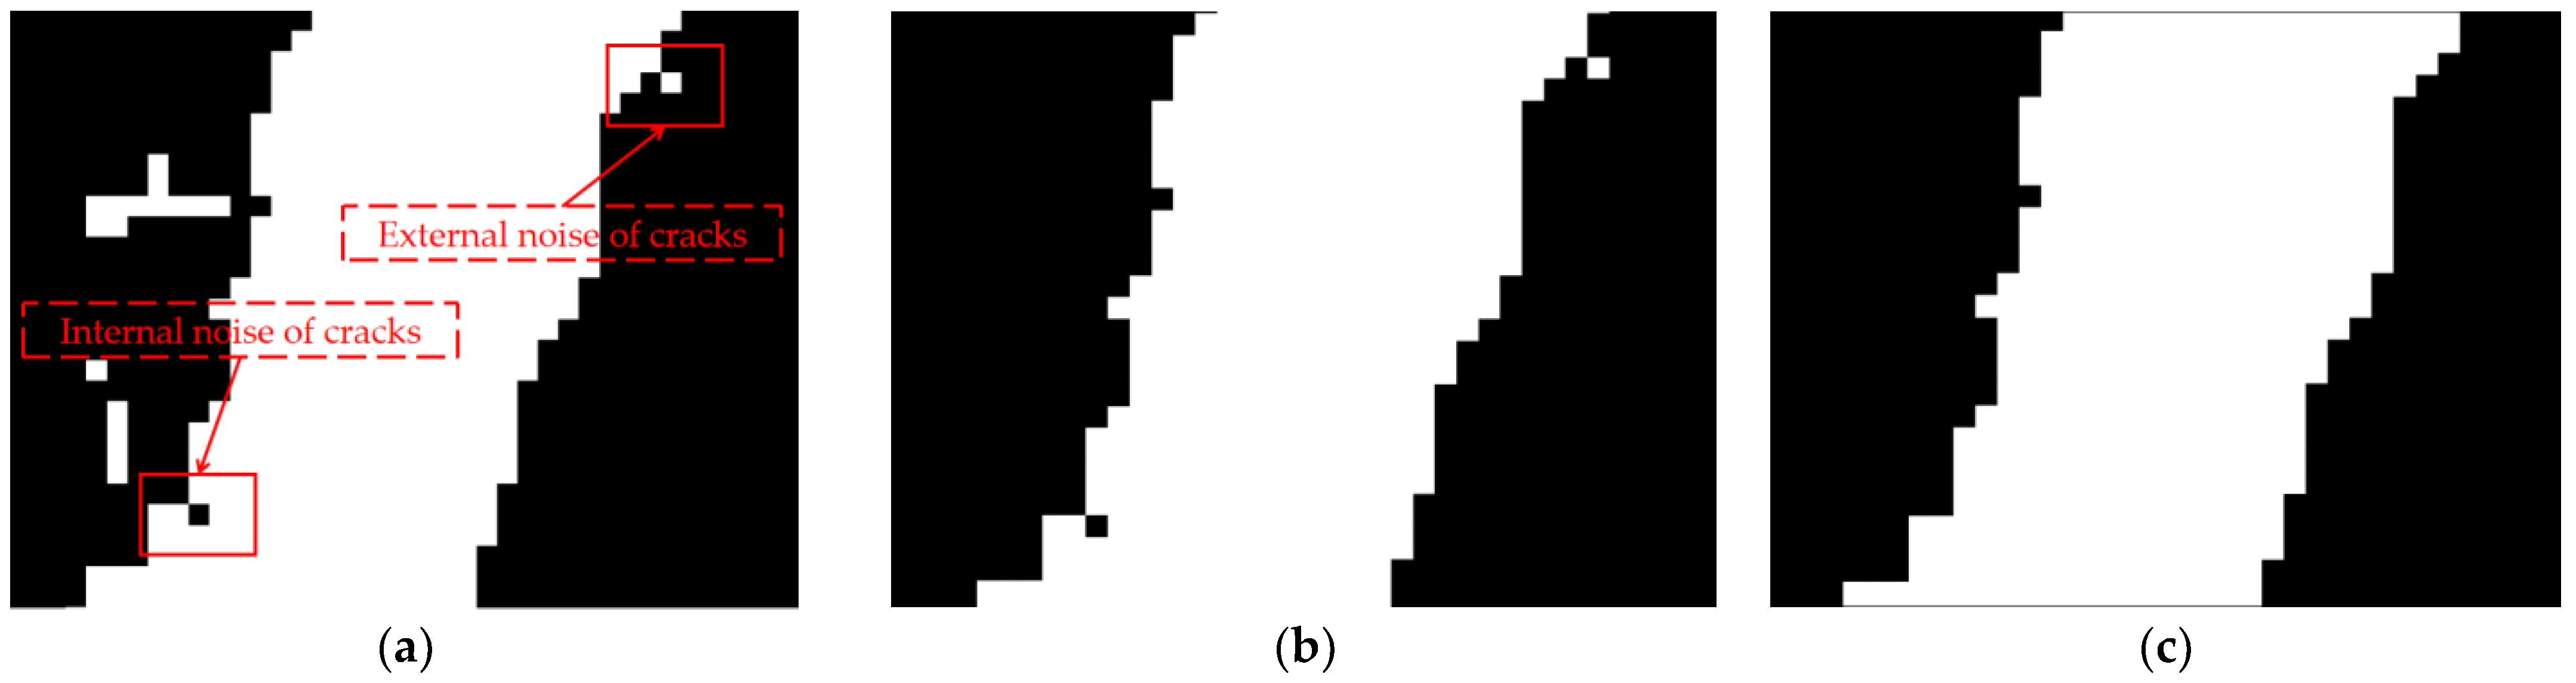
The binary image obtained by using a grayscale threshold for image segmentation contains noise caused by poor lighting, concrete surface stains, aggregates, etc. There are two types of crack image noise, one is low reflection coefficient noise in the concrete area, and the other is high reflection coefficient noise in the crack area, as shown in Figure 4. To improve the accuracy of crack identification, these noises need to be removed. If the set of connected pixels in an image is a connected domain G1, …, GN, then the area of the corresponding connected domain is A1, …, 
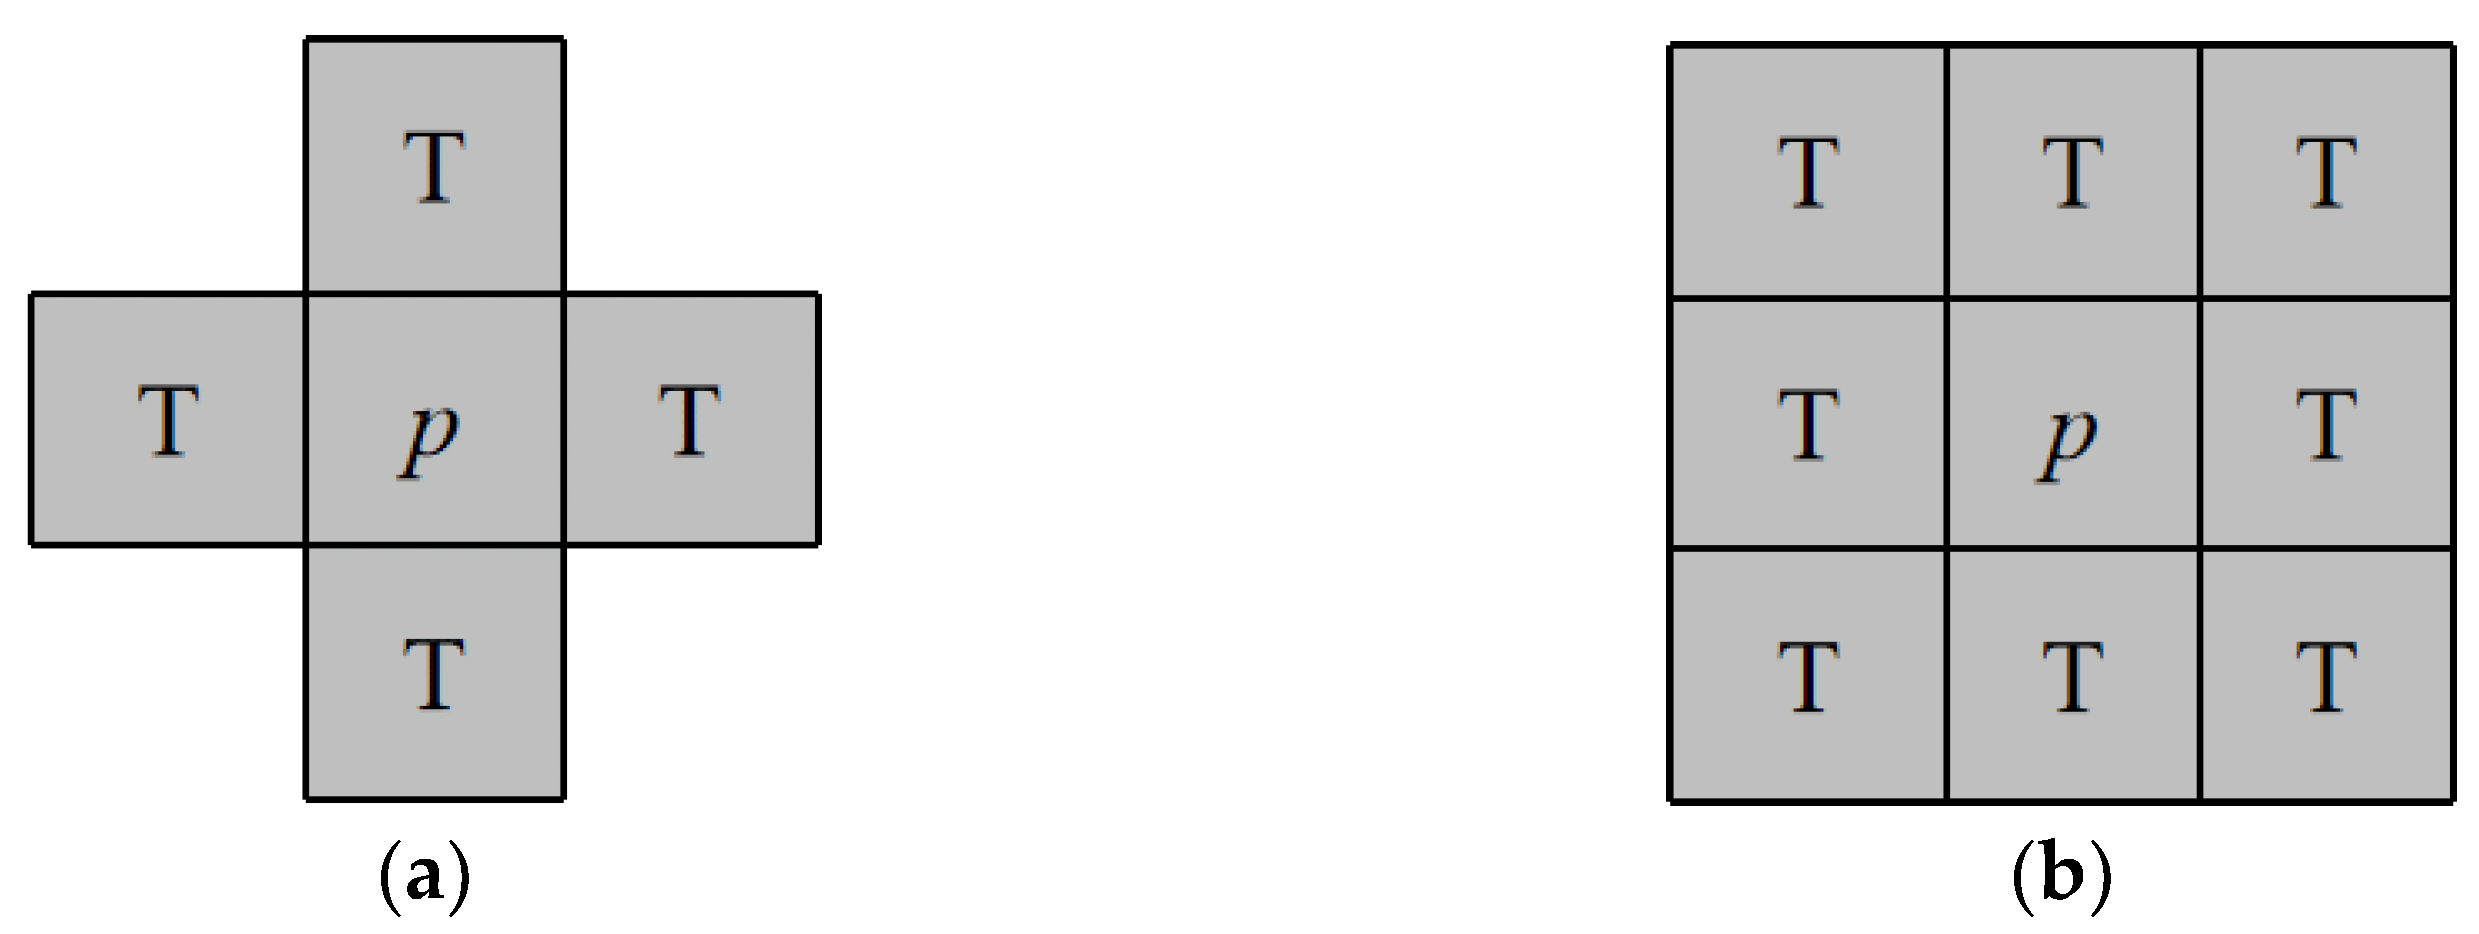
AN, measured in the number of pixels. There are mainly two connectivity validation algorithms: 4-neighbourhood algorithm and 8-neighbourhood algorithm. The 4-neighbourhood algorithm searches horizontally and vertically, as shown in Figure 5a, while the 8-neighbourhood algorithm searches horizontally, vertically and obliquely, as shown in Figure 5b. For crack exterior noise, as shown in Figure 4a, the 8-neighbourhood algorithm will consider the crack edge noise and the crack as the same set of pixels, so this type of noise cannot be removed using the 8-neighbourhood algorithm. In contrast, the 4-neighbourhood algorithm can distinguish between this type of noise and cracks, and can effectively remove it. σ A of the connected domain area is used as the area threshold Tarea [28]. Any connected domain with an area less than this threshold is considered noise, i.e.,
I ( x , y ) G i = { 0 , A i < T a r e a = σ A 1 , A i T a r e a = σ A
To eliminate internal noise in cracks, it is imperative to invert the binary image and subsequently eliminate the noise using Equation (2).
In the grayscale thresholding stage, the grayscale threshold should be set slightly higher so that the retained parts are slightly larger than the crack area, to prevent crack pixels from being filtered out. Furthermore, in the area size thresholding segmentation stage, the area threshold is determined by 4-neighborhood connectivity, effectively identifying and excluding regions that do not belong to the crack. This method ensures that the final segmented image predominantly contains actual crack features.
Though the above steps, we have established a multi-step, multi-threshold fusional infrastructure crack segmentation method, and pixel crack image map can be obtained.

2.2. Crack Parameter Extraction

After segmenting the crack images using the multi-threshold fusion algorithm, it is necessary to perform a quantitative calculation of the crack length, width, and other relevant parameters for structure status evaluation and integrity assessment. In this section a crack parameter calculation was proposed that involved three steps, first used 4-neighbourhood convolution method to detect the crack edges, then the crack center line were generated by crack edges. At last, the crack width could be calculated by crack edges and perpendicular line of the center line, and the crack length could be calculated by the smallest outer rectangle of the center line.

2.2.1. Crack Edge Extraction Based On4-Neighbourhood Convolution

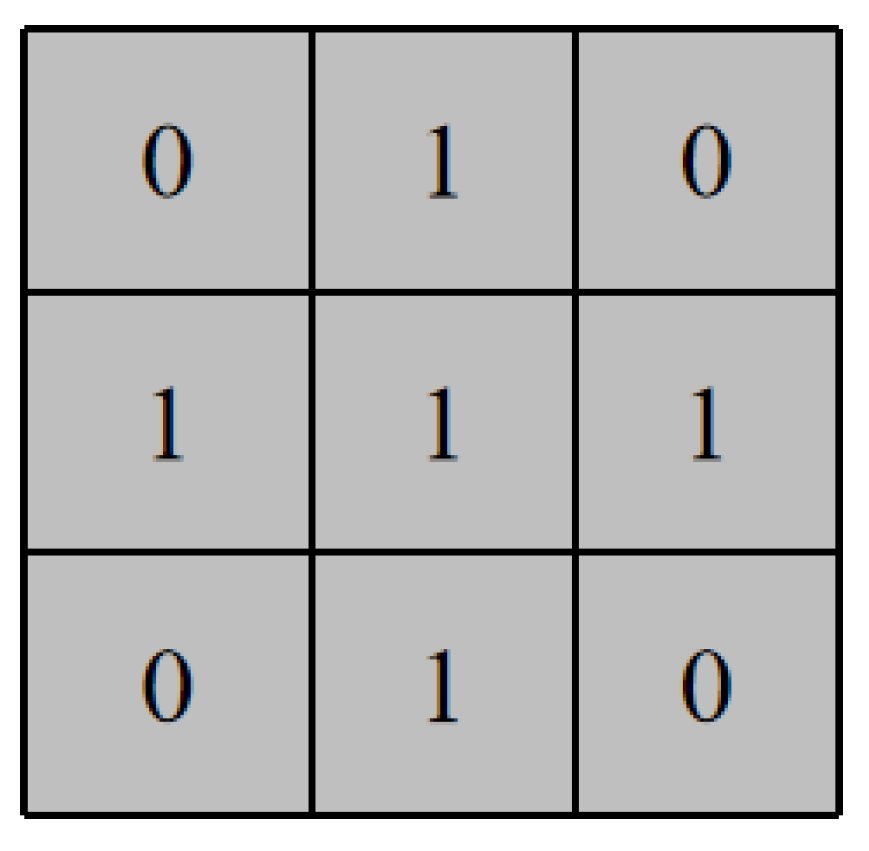
In the concrete crack binary image, the crack pixels are ones and concrete are all zeros, as a result, all internal crack pixels are all in four connectivity with crack pixels, but the boundary crack pixels do not satisfy this condition. So only pixels whose 4-neighbourhood convolution value is five are considered as internal crack pixels, or non-edge pixels, otherwise are classified as boundary crack pixels, also call crack edges. In view of this property, a new crack edge extraction was proposed based on 4-neighbourhood convolution. Figure 6 shows the convolutional kernel used, and Table 2 is the detailed illustration of the crack’s edges extraction steps.
The crack edge detection method proposed is different from the Canny edge detection algorithm [29] in the efficiency and the selection of threshold, where there is no need to set the threshold manually by iterative thresholding method and the standard deviation of all connected domain areas in proposed method, while two threshold value need manually selection. Moreover, the proposed method enhanced the computation efficiency of crack detection than the Canny method, as shown in Table 3.

2.2.2. Crack Center Line Extraction

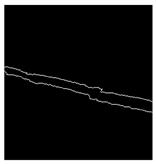
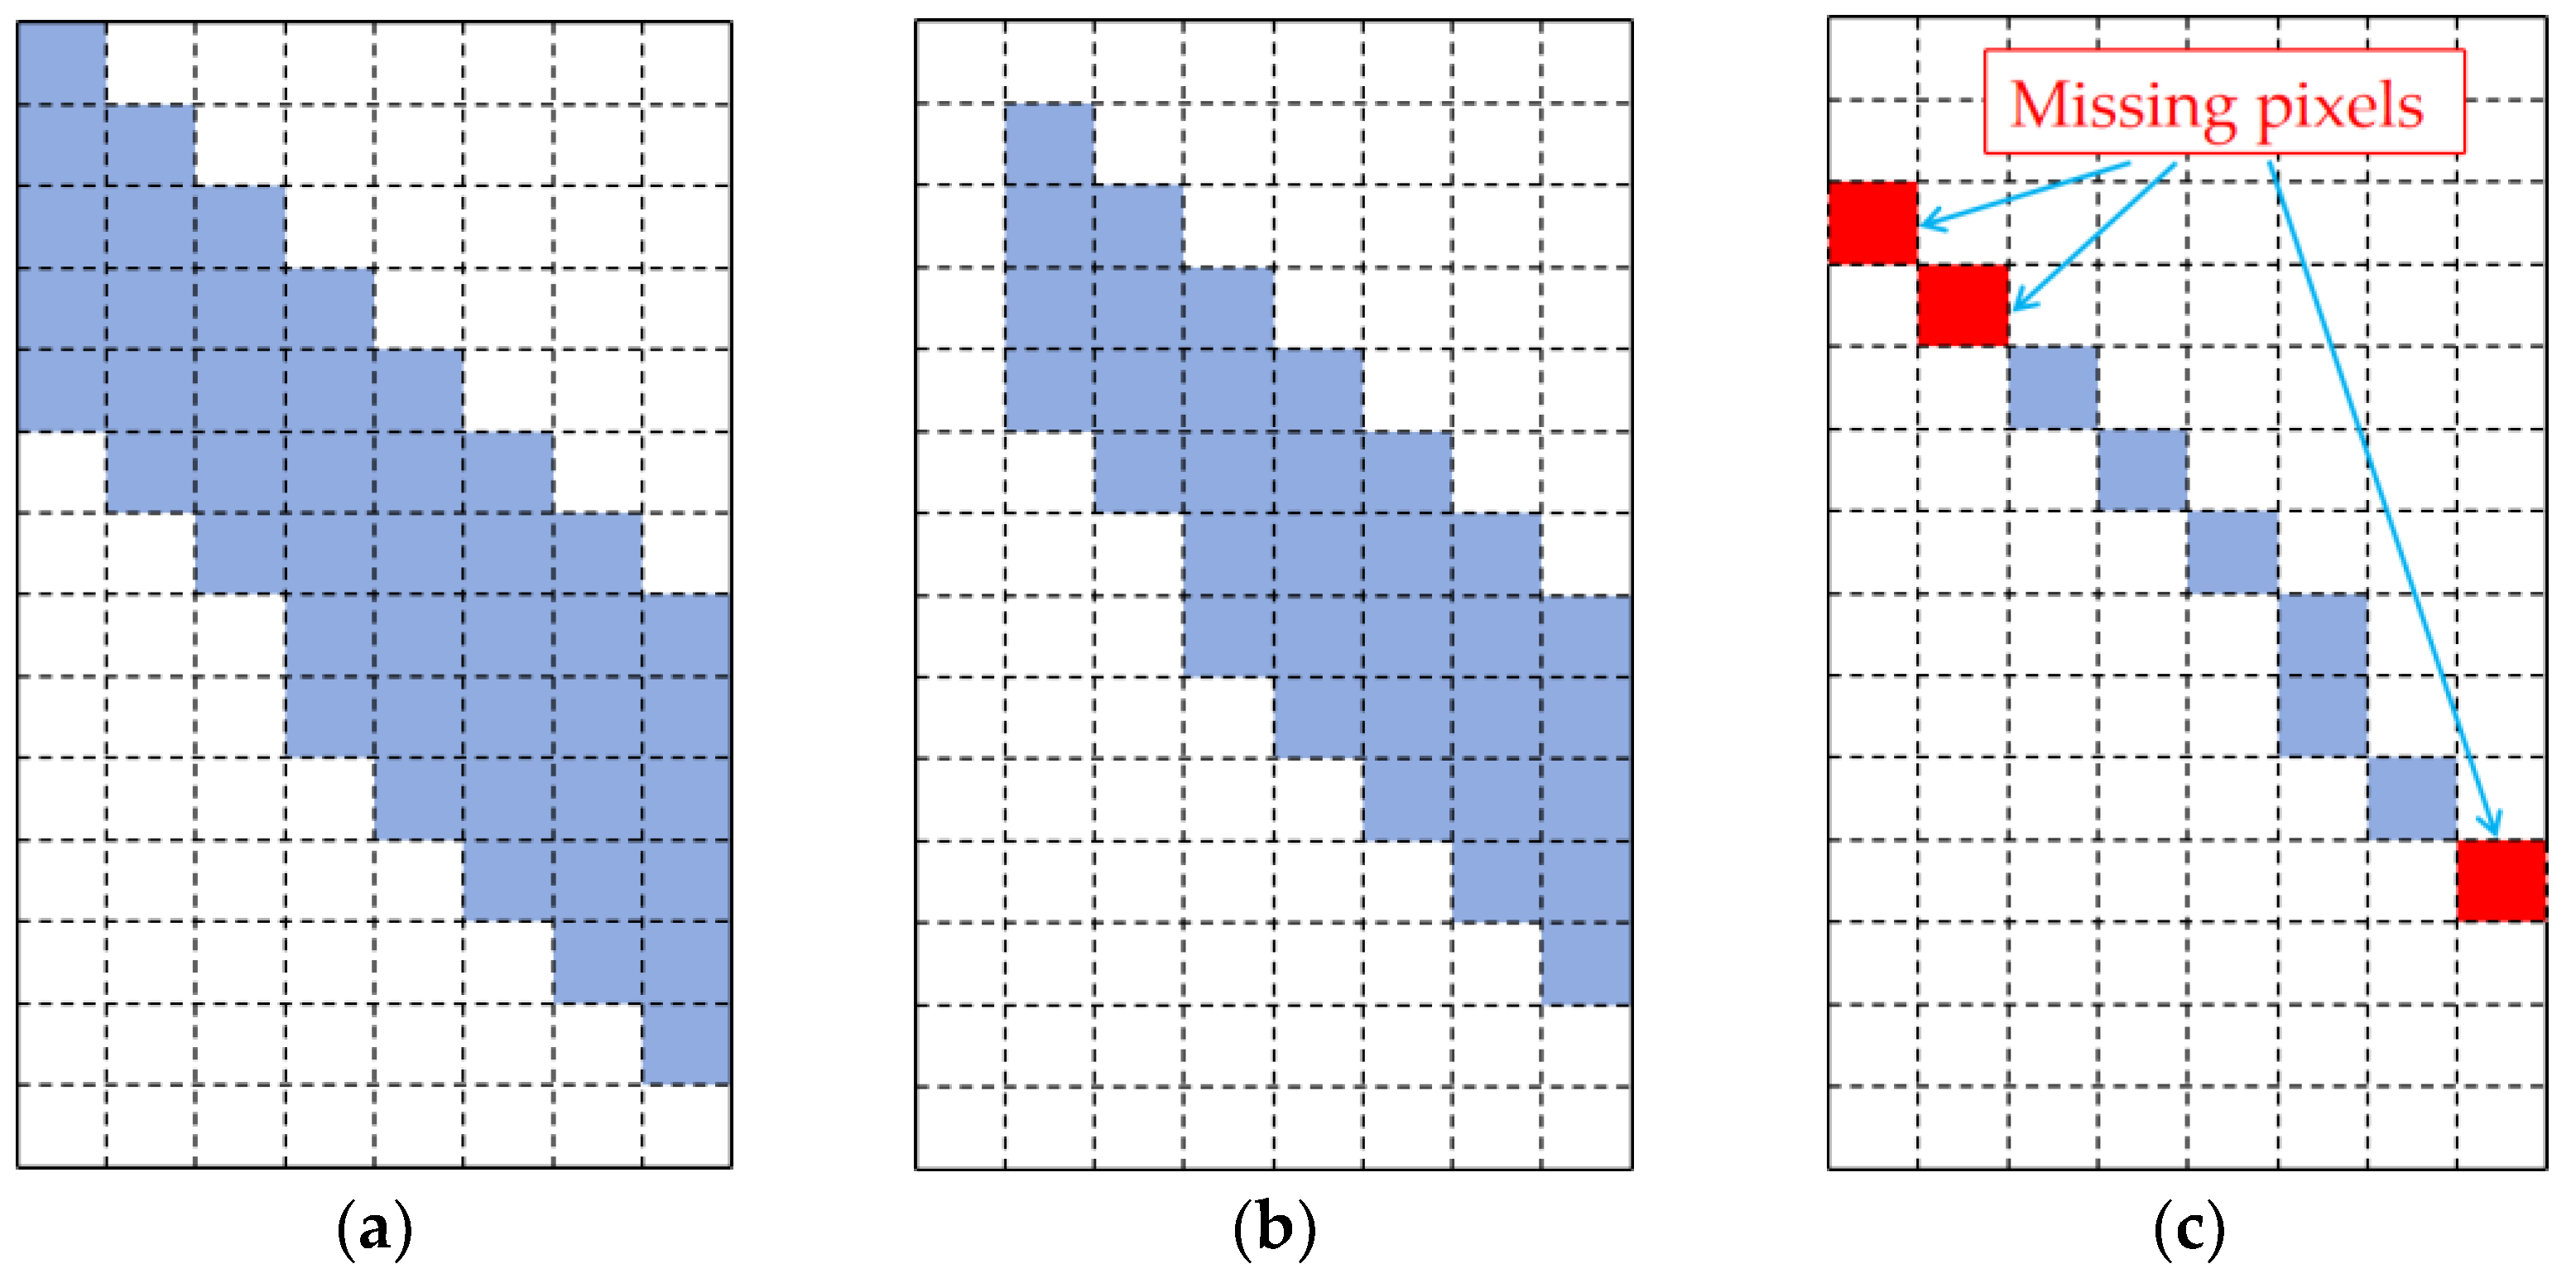
After extracting the crack edges, the skeleton line needs to be extracted to calculate crack length. Zhang proposed an iterative skeleton line extraction method to refine the crack to a 1-pixel thickness line through iterations of two local conditional judgments each iteration [30]; however, the algorithm led to the decreases in the crack length with an increased number of iterations, which made the measured crack length shorter than the actual crack length, as shown in Figure 7.
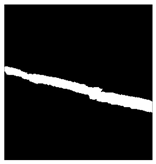
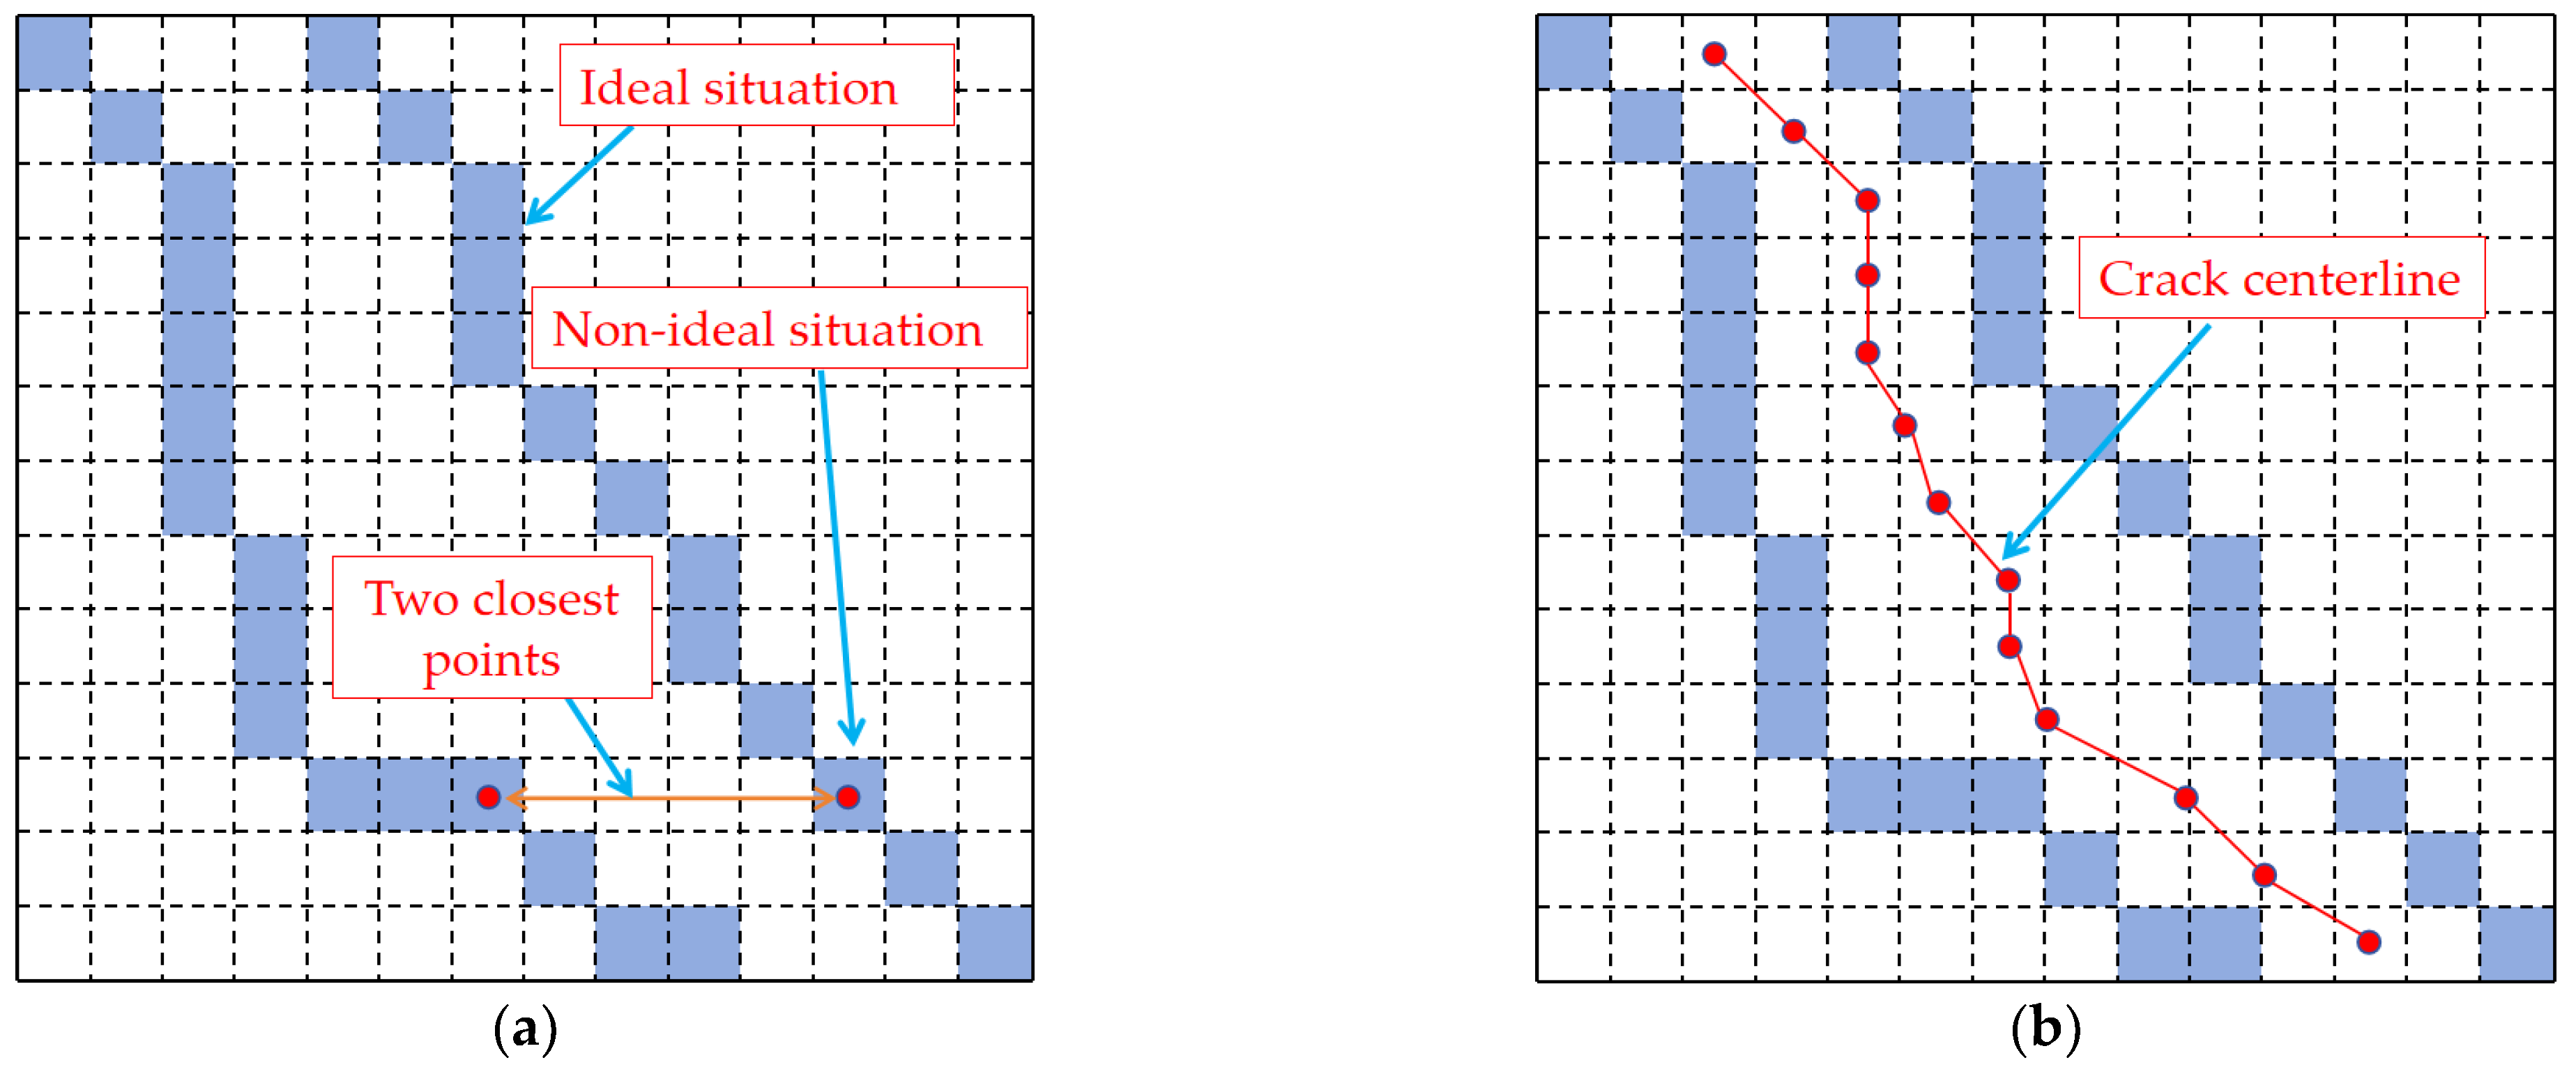
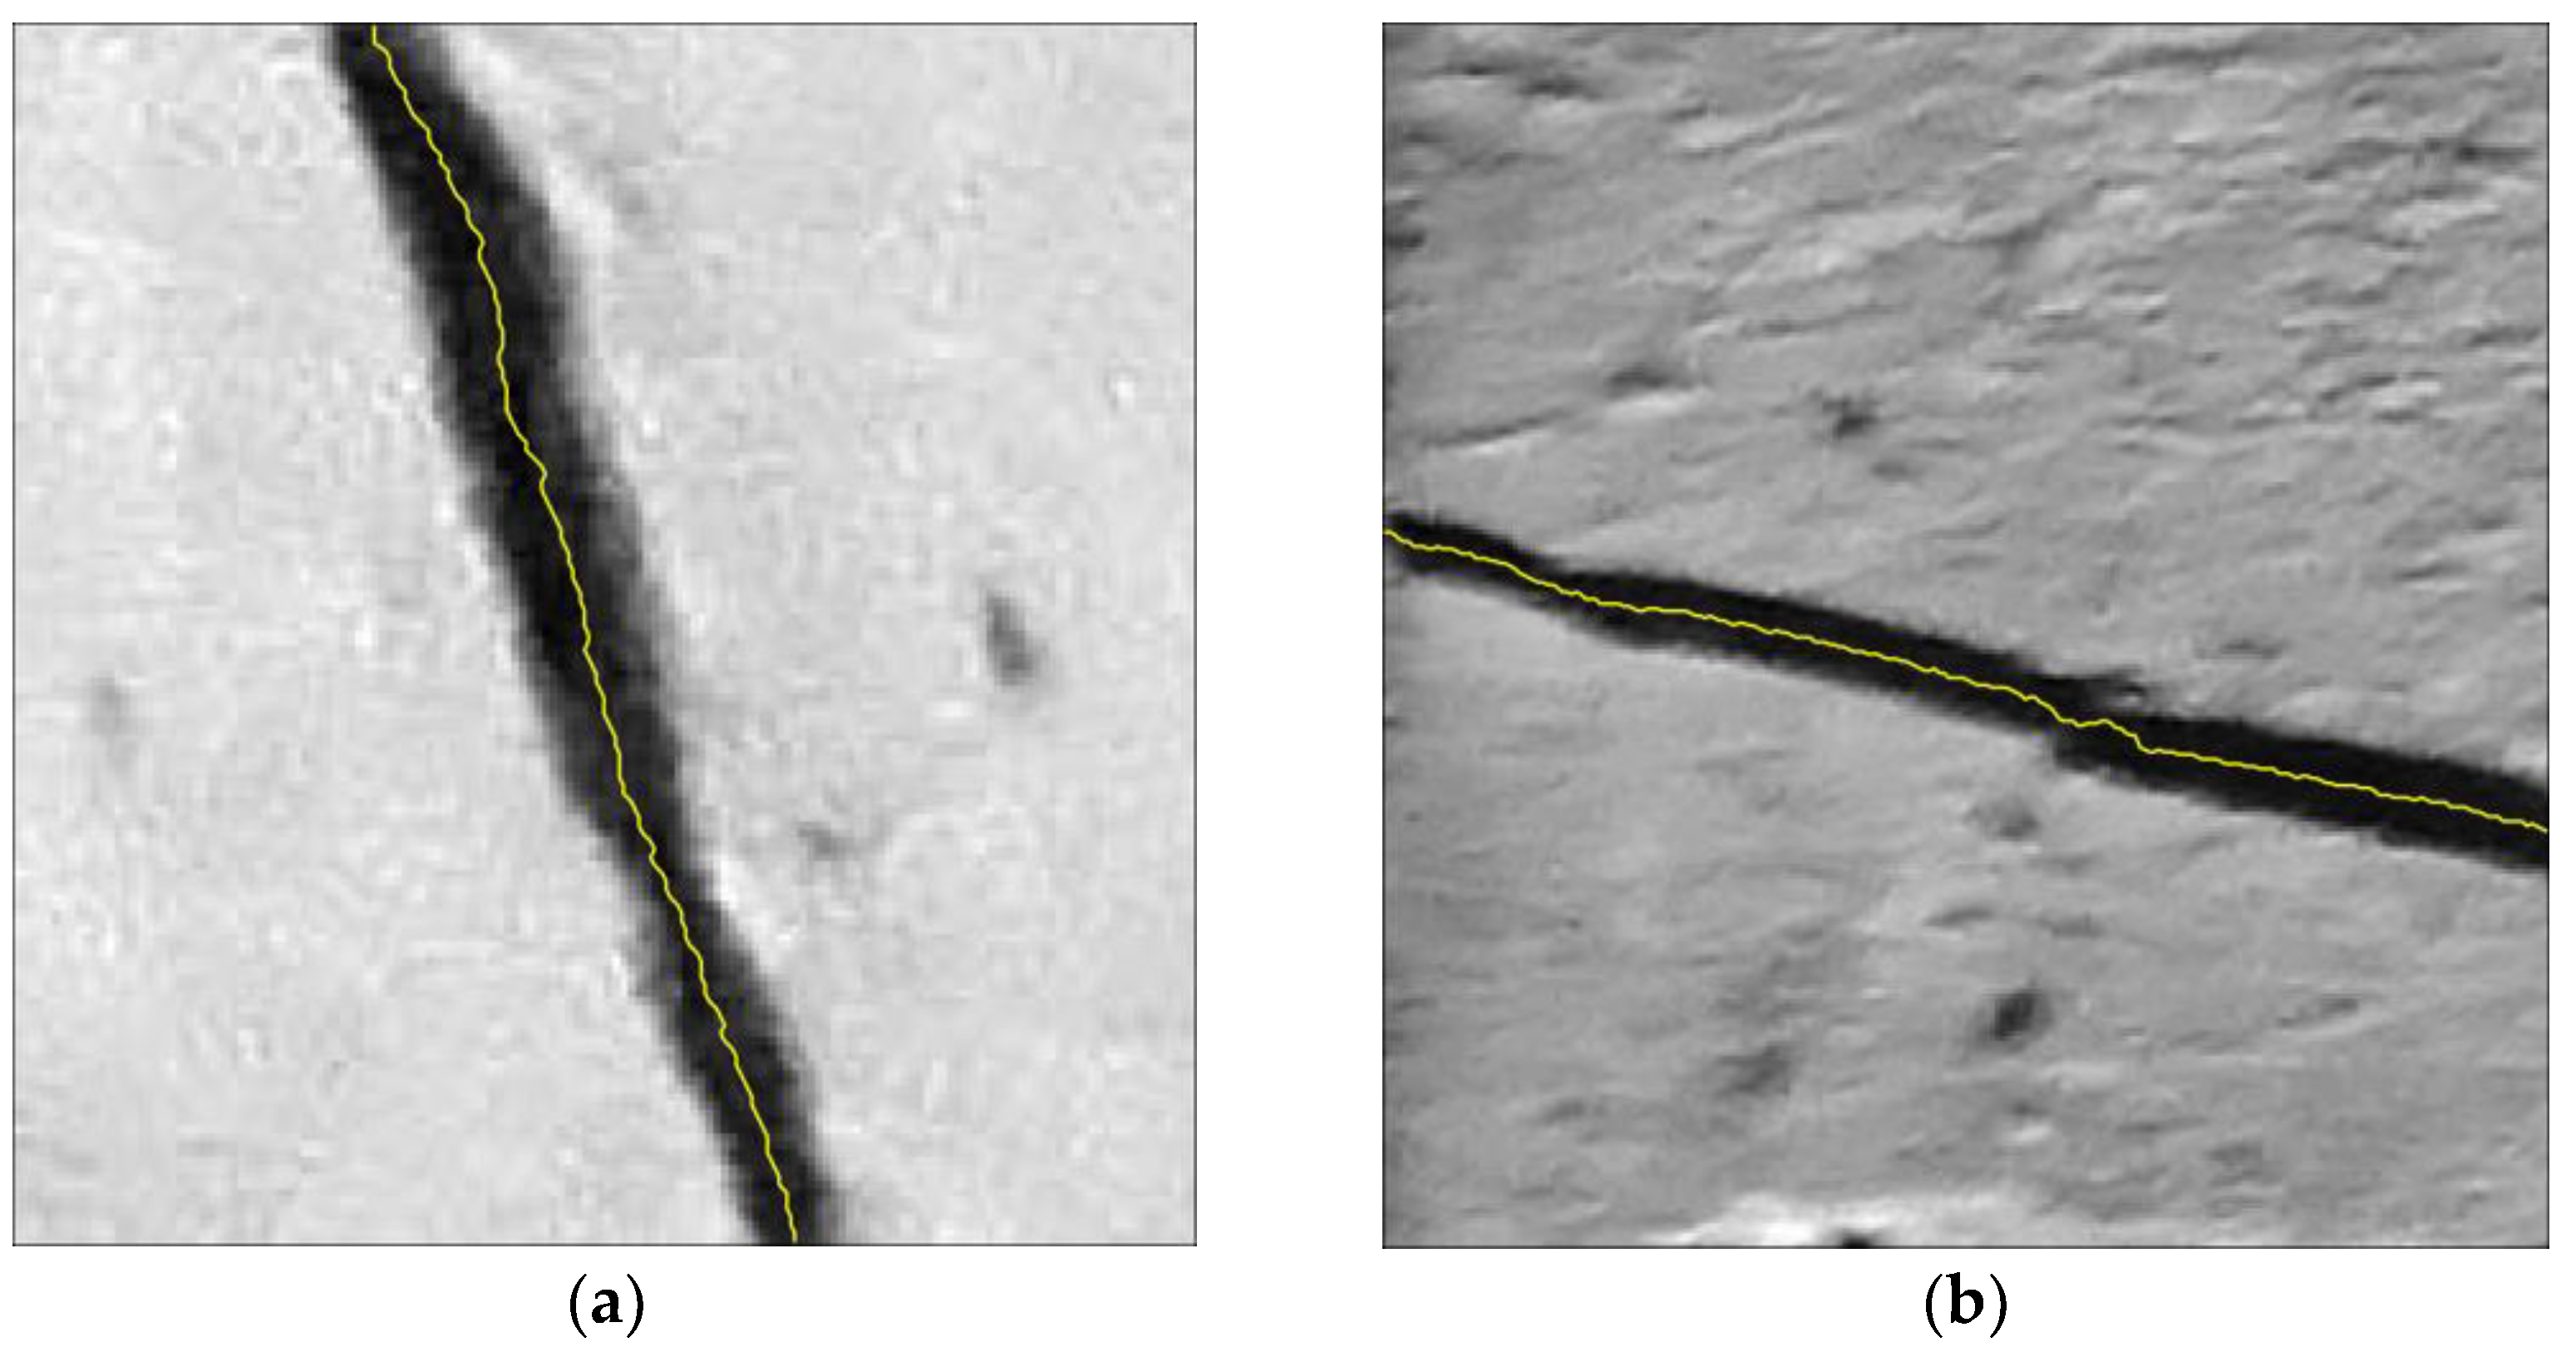
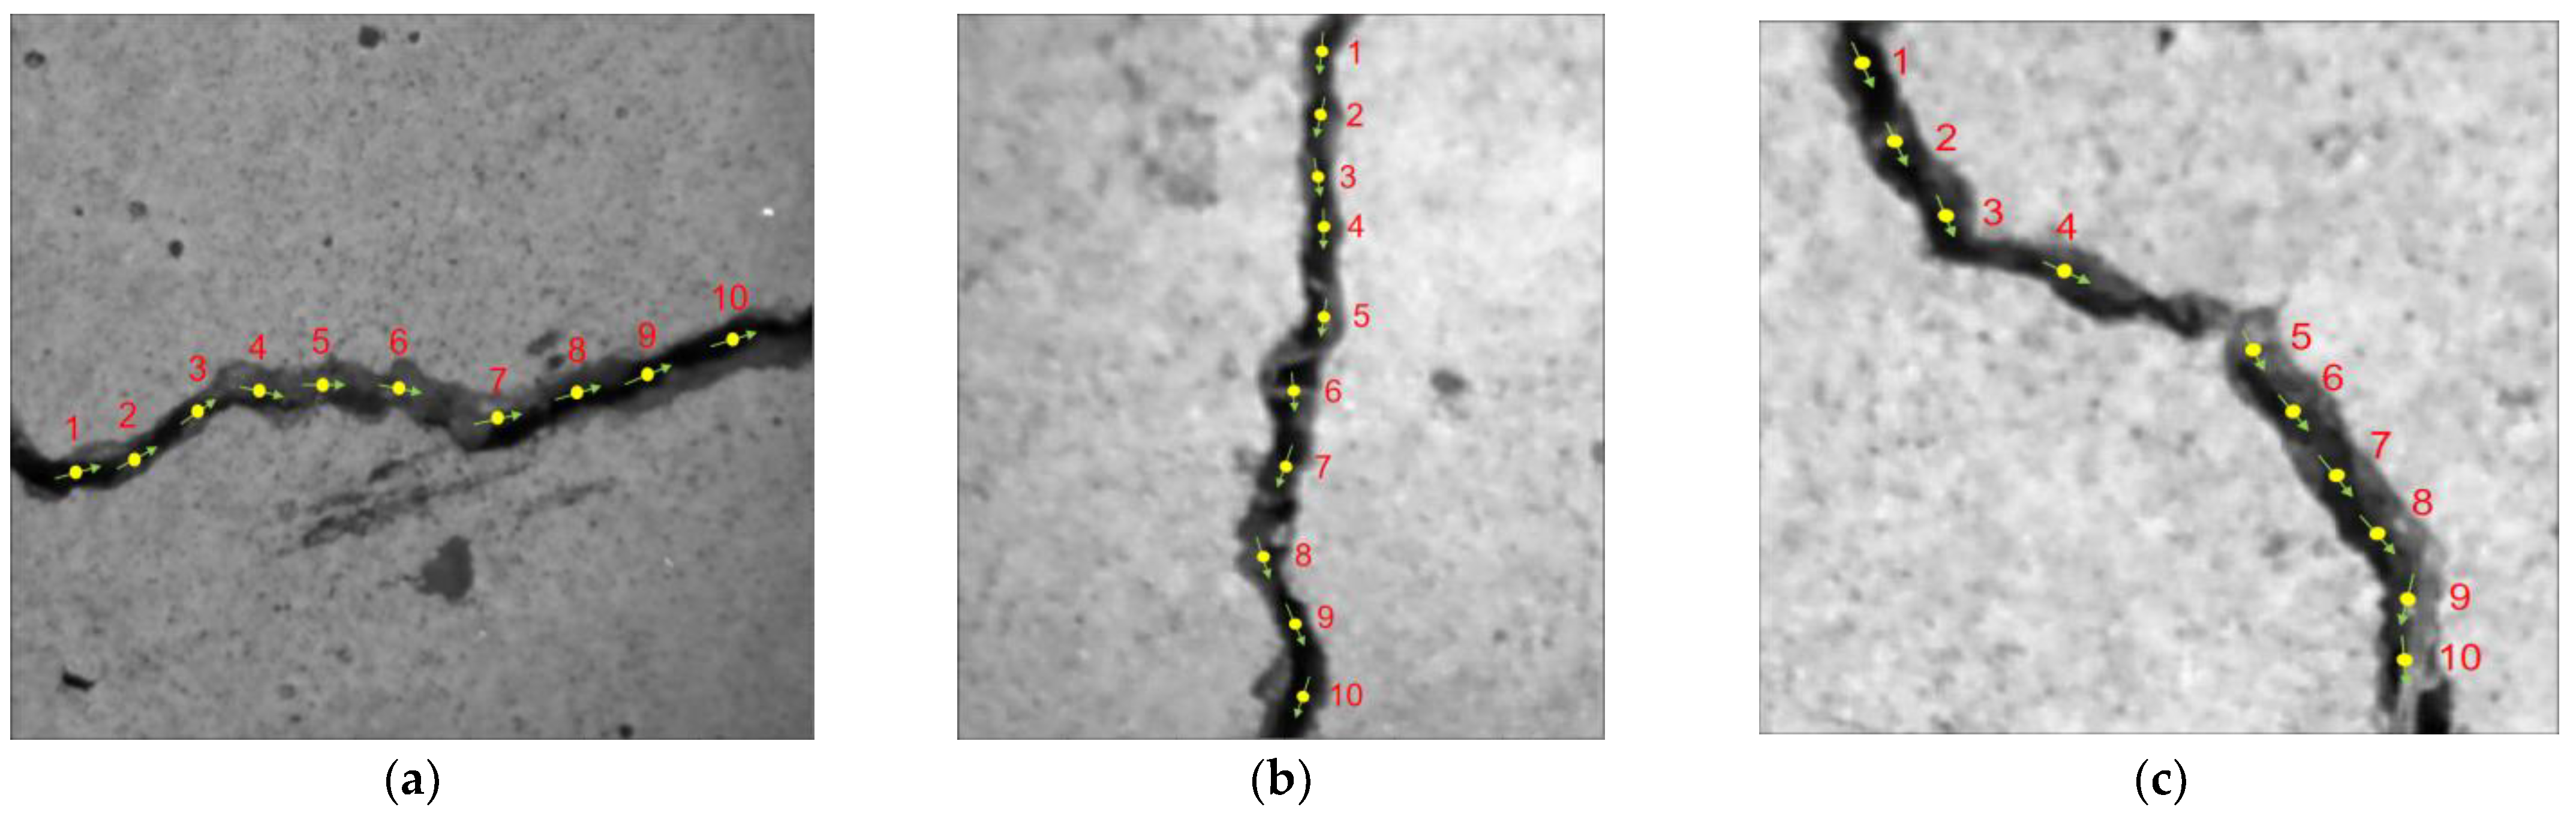
To avoid such errors in crack length and width measure, the center line instead of the skeleton line was proposed to extract straight cracks precision parameter, and straight cracks could be three types of cracks, vertical, horizontal and oblique cracks, based on the direction of crack extension and inclination [
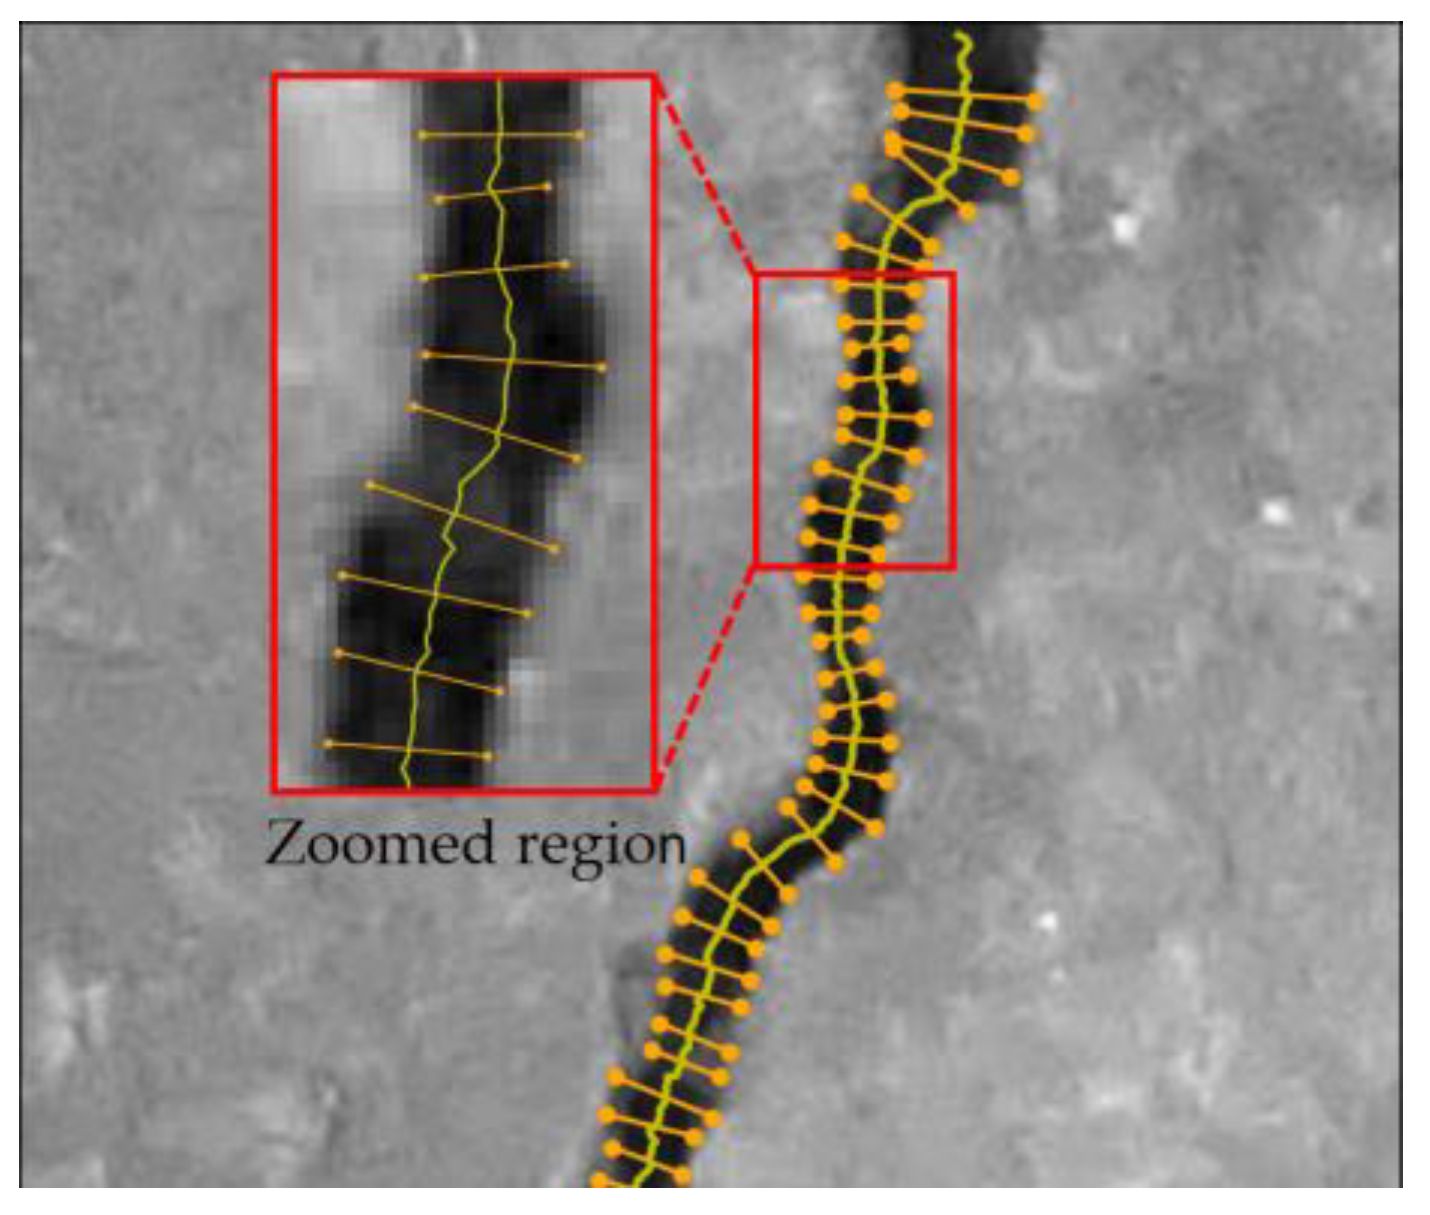
31]. For simplicity, take straight vertical cracks as an example, there are only two edge pixel points in each row of the image crack region in ideal conditions, as shown in Figure 8a, and the centroid of the crack in each row could be calculated using the corresponding two crack edge points extracted. In nonideal conditions, there are more than two edge pixel points in each row of the image crack region, also shown Figure 8a, the two nearest pixel points in each edge are selected to determine the centroid of the row. In this way, the center line of straight vertical crack could be detected by connecting all center points in each row, as shown in Figure 8b.
It should be noted that the proposed center line extraction model can only be applied to straight cracks, and curved, intersected cracks are not taken into consideration to avoid complex geometric properties and relations. For the crack extended along horizontal direction, its center line could also be extracted after a after a 90° rotation transformation, as shown in Figure 9.
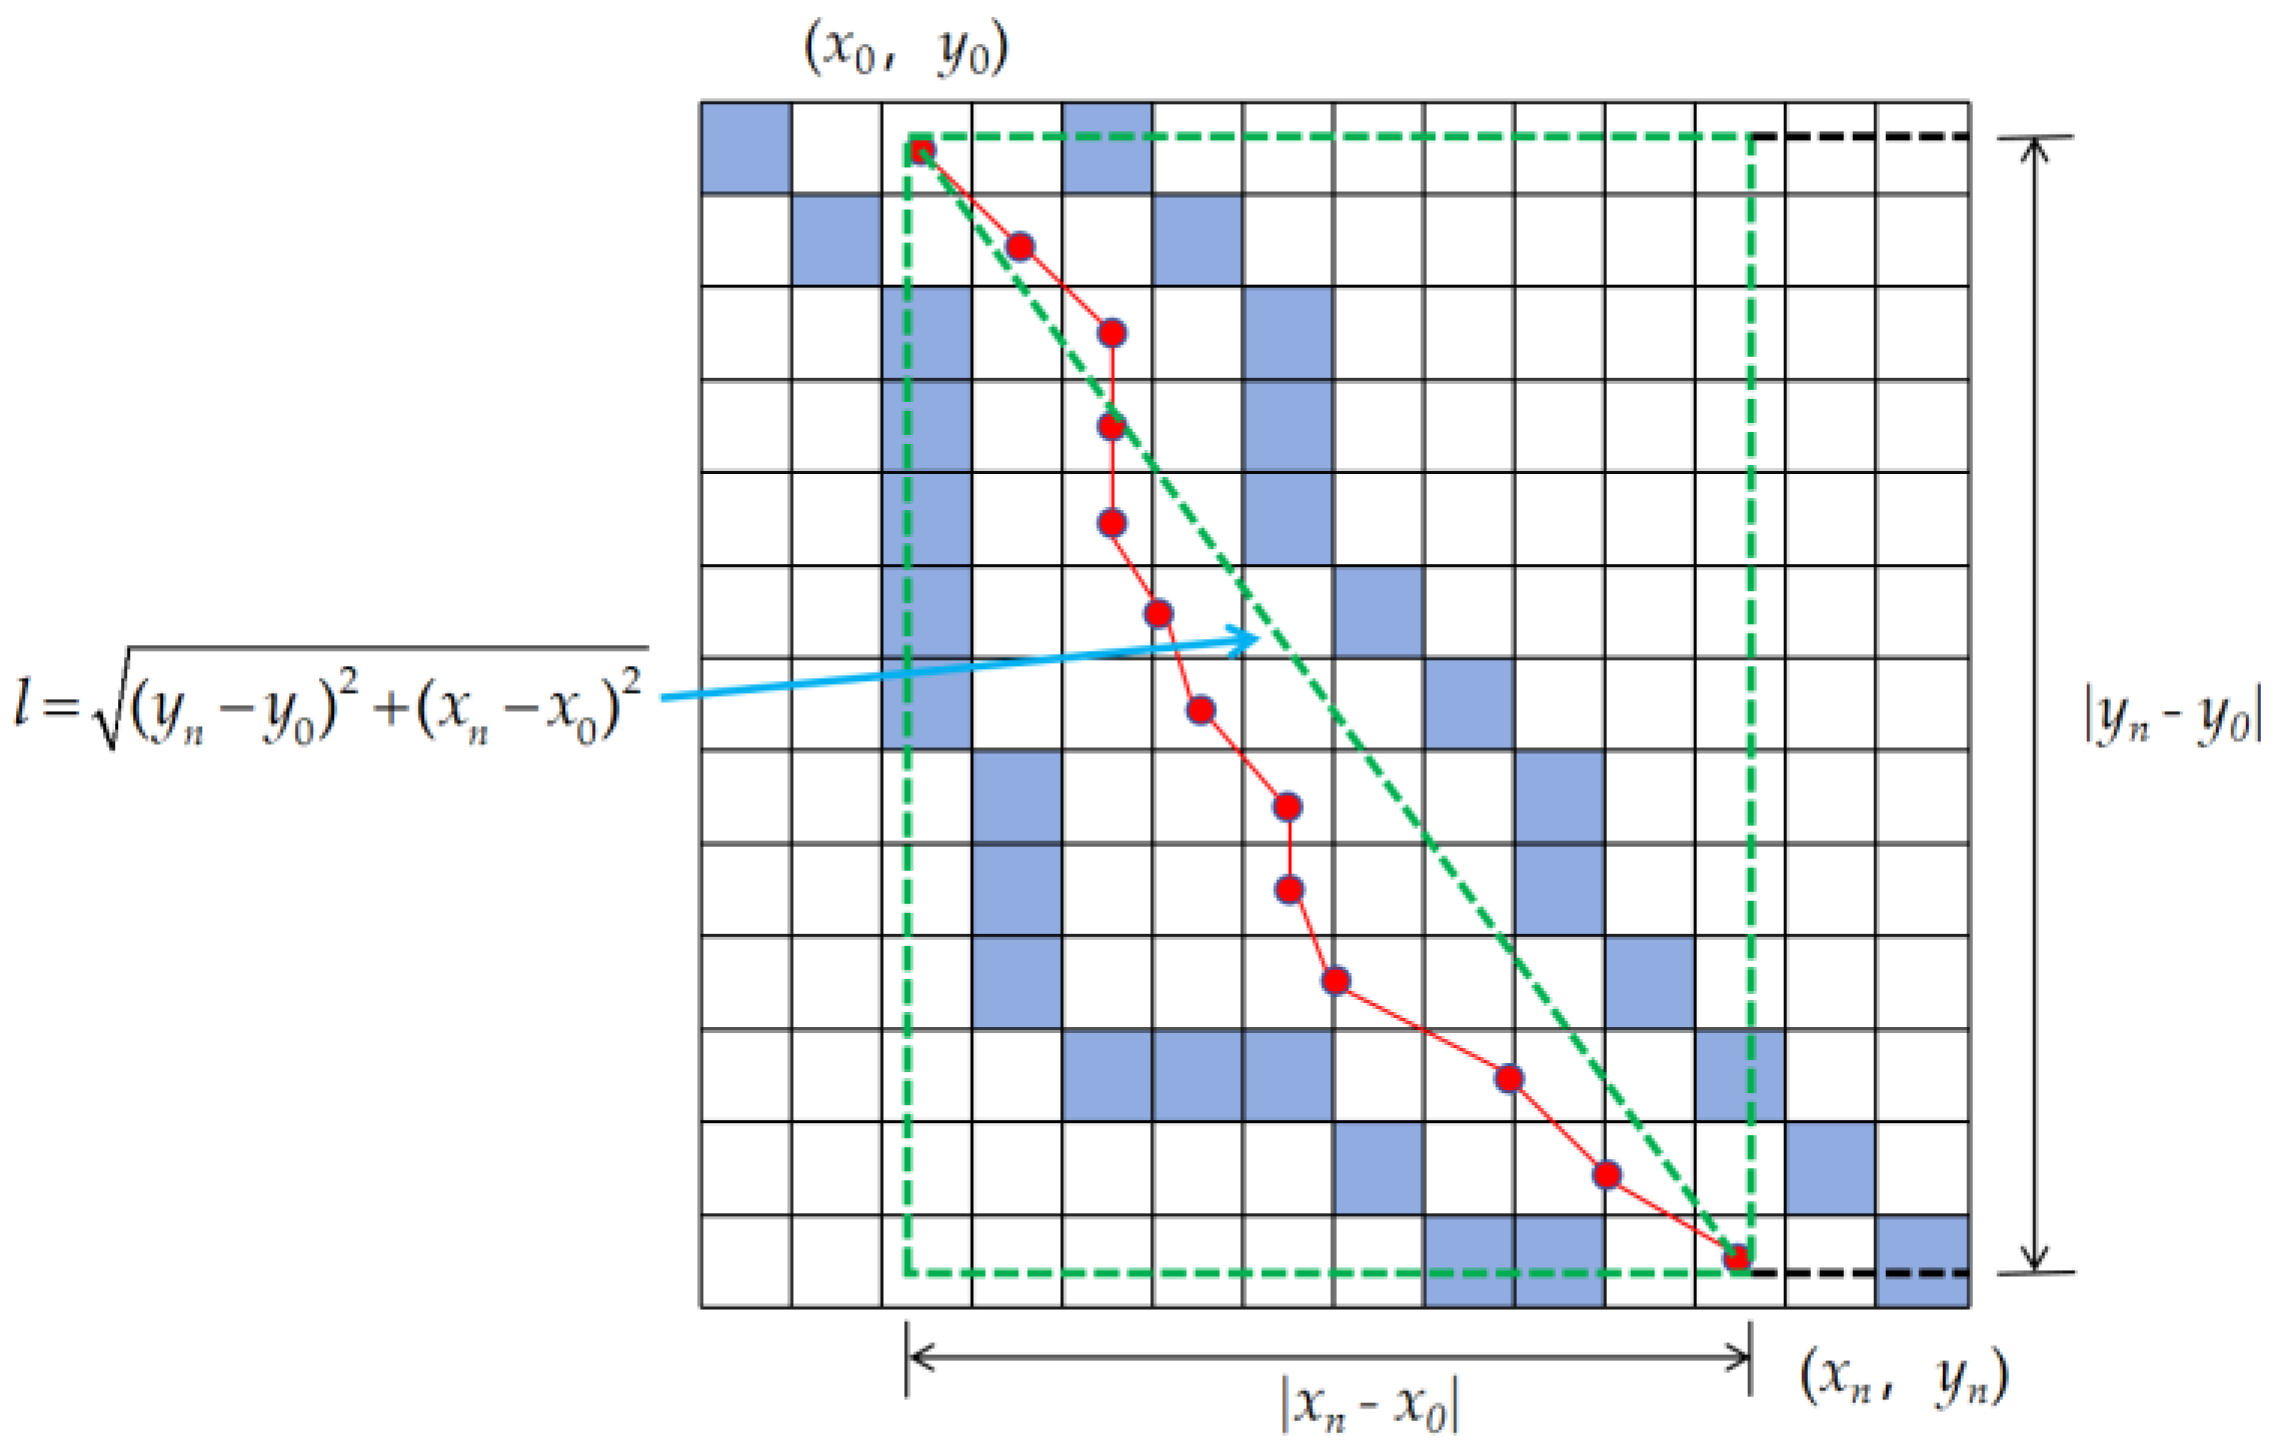
For straight cracks, the curvature is small and local curve length could be neglected, so the crack length could be approximately characterized by the diagonal length of the smallest outer rectangle of the crack center line. Assuming that the coordinates of the two endpoints of the crack center line are (x0, y0) and (xn, yn), the length and width of the smallest outer rectangle of the crack center line are|y0yn|, |x0xn|, respectively. Therefore, the length of the crack is l = ( y n y 0 ) 2 + ( x n x 0 ) 2 , and the schematic diagram of crack length calculation is shown in Figure 10.

3. Subpixel Crack Width Calculation

Accurate measurement of cracks is critical for assessing the structural integrity, and the application of traditional pixel-level crack detection methods is restricted due to its limited measurement precision, leading to potential inaccuracies threat in quantifying fine cracks through structure health monitoring. Otherwise, precision measurement with a high spatial resolution will increase the cost in image device, capture, transmission and storage. To address this problem, a subpixel algorithm based on the partial area effect is introduced to improve crack measurement precision over conventional pixel-level crack detection without significant cost in economy and time consumption.

3.1. Subpixel Edge Localization with the Partial Area Effect

Subpixel edge location algorithms can improve the measurement accuracy by subdividing a pixel into aa much finer measurement unit with the help of the local gray gradient matrix, and can satisfy the requirement of Technical Specification for Digital Image Inspection of Engineering Structures and highway bridge structural health monitoring. So subpixel edge location attract the wide attention of researchers, literature review indicate that current subpixel edge algorithms were based on interpolation [24], moment methods [25], and partial area effect methods [26]. Partial area effect methods can efficiently extract edge position, orientation and curvature, and work well even for crack images with noisy and blurred edges from complex environments. So, in this section, the partial area effect algorithm proposed by Trujillo in 2013 is introduced in crack edge location, and the key steps are briefly described as follows.
(1)
Suppose the edge is a straight line expressed as y = a + bx, and the slope is between 0 and 1. For any pixel point on the crack edge, a 3 × 5 local pixel neighborhood can be taken, as shown in Figure 11.
(2)
Assuming that the gray value of pixel is F ( x , y ) , SL, SM and SR are the sum of the gray values of the left, middle and right columns in the 3 × 5 pixels neighborhood, respectively, i.e.,
{ S L = n = j 2 j + 2 F i 1 , n S M = n = j 2 j + 2 F i , n S R = n = j 2 j + 2 F i + 1 , n
In concrete crack images, the gray value of concrete area and crack area are denoted as A and B, and can be estimated by pixels in the two corner regions of the 3 × 5 neighborhood, i.e.,
{ A = 1 3 ( F i , j + 2 + F i + 1 , j + 2 + F i + 1 , j + 1 ) B = 1 3 ( F i 1 , j 1 + F i 1 , j 2 + F i , j 2 )
And the edge straight line coefficient is:
{ a = 2 S M 5 ( A + B ) 2 ( A B ) b = S R S L 2 ( A B )
The subpixel location of (0, a) can be obtained by calculation of the coefficients a and b according to Equation (5). For a detailed description of the method, please refer to literature [26].
(3)
Repeat the above two steps to find the subpixel coordinates for each crack edge pixels.

3.2. Subpixel Width Calculation of Crack

For pixel-level crack edge detection, the crack width could be calculated along the skeleton line by the crack width calculation method of the skeleton line [32], but for subpixel crack computation, the accuracy of the skeleton line and pixel-level crack edge location is not enough and improvements are demanded on the basis of center line and subpixel edge location. Similarly, the subpixel crack width computation model of each pixel on the crack center line could be established, as shown in Figure 12; for any point P on the crack center line, a certain number of center line points forward and backward in row along the center line were taken out to fit a polynomial curve. The degree of the polynomial and the number of points on the crack center line determined as appropriate, by trial and error, 5 points above and under point P, were selected to fit a quadratic polynomial y = ax2 + bx + c by least square method, as shown in Figure 12.
In this way, the crack center line can be divided into segmented quadratic polynomials, and the perpendicular line can also be obtained on each point along the crack. For the point P, the normal slope of its corresponding quadratic polynomial can be calculated as:
k N p = 1 k p
The intersections of the normal line of quadratic polynomial on point P and two crack edge pixel points are Pl and Pr, the corresponding subpixel edge point are indicated as Fl (xl, yl) and Fr (xr, yr), and xl, yl, xr, and yr are the subpixel coordinates, respectively. The subpixel crack width can be calculated as follows.
W = ( x l x r ) 2 + ( y l y r ) 2
Repeating the above steps could yield pixel-by-pixel subpixel crack width calculation along the center line, as shown in Figure 13.

4. Concrete Crack Parameter Measurement and Verification

4.1. Overview of the Crack Identification Experiment on Concrete Specimens

To verify the accuracy of the proposed subpixel crack width method, a static loading experiment of 160 mm × 40 mm × 40 mm concrete specimens was carried out indoors, and the concrete specimens surface cracks were orthogonally photographed by a Nikon D810 camera (Nikon, Tokyo, Japan). At the same time, the crack parameters were measured by a 50~1600× magnification digital microscope to verify the measurement results from proposed crack length and width calculation methods. To eliminate the influence of unfavorable complex illumination, two LED lights were employed for auxiliary illumination, and the test site was arranged, as shown in Figure 14.
The maximum magnification of the high-precision digital microscope used in the test was 1600 times, and the parameters of the Nikon D810 camera and the digital microscope are shown in Table 4.

4.2. Experiment Result Calculation and Analysis

In the experiment, orthogonal photography was used for crack image acquisition and the camera was calibrated using the scale factor method. For a target of size D (mm), the pixel size in the image space is d (pixel) and the scale factor s is calculated as:
s = d / D
Horizontal crack, vertical crack and oblique crack images are selected, and the scale factors of horizontal, vertical and oblique cracks are 0.007 mm/pixel, 0.009 mm/pixel and 0.006 mm/pixel, respectively, as calculated from Equation (8). At the same time, the scale factors of a high-precision digital microscope are 0.00696 mm/pixel, 0.00822 mm/pixel and 0.00597 mm/pixel, respectively. And ten points on the center line are chosen on each crack, as shown in Figure 15.
Crack width values of ten points, as shown in Figure 15, in horizontal, vertical and oblique cracks are measured using a digital microscope and the subpixel calculation method proposed, as shown in Table 5, Table 6 and Table 7, respectively. Crack length values of cracks in different directions measured by a microscope and calculated by the proposed method are shown in Table 8.
Table 5, Table 6 and Table 7 indicate that the minimum relative errors of the pixel-level measurement of horizontal, vertical, and oblique cracks are 0.29%, 0.71%, and 0.47%, respectively, while the maximum relative errors reach 6.33%, 10.90%, and 8.39%. For subpixel measurements, the minimum relative error is zero, indicating a perfect match between measured and calculated values, and the maximum relative errors are 3.06%, 8.97%, and 5.16%, respectively. The average pixel measurement error of three images is 3.64%, whereas the subpixel measurement average error is 1.86%, with a reduction of 1.78% in measurement error. Results showed that the methodology presented in this paper performed better than pixel-level measurements and had high accuracy in different types of straight crack width measurements. Table 8 illustrates the different measurement results of crack lengths of horizontal, vertical and oblique cracks, compared with that using the smallest outer rectangle suggested in this paper, and the results are roughly consistent with the computed values of other methods. The absolute measurement error is less than 0.30 mm and the maximum relative error is 6.89%, which also affirmed the practicality and remarkable accuracy of the proposed methods.
To further validate the high accuracy of the subpixel algorithm, the binary map of the oblique crack edge is taken as an example; the subpixel coordinates, the pixel-level coordinates and the coordinate error are shown in Table 9; and only rows 50 to 60 are listed for simplicity. It can be seen that the measurement accuracy of subpixel coordinates can reach 0.01~0.09 pixels—approximately 0.05 pixels higher than that of [25].

5. Conclusions and Envisions

This paper proposes a high-precision concrete crack measurement method through a process of multi-threshold fusion, crack center line abstraction, and subpixel edge location computation. And the main conclusions are as follows:
(1)
This paper proposed a multi-step process and multi-threshold fusion and morphology operation combined pixelwise crack image segmentation and the parameter extraction algorithm. In the crack segmentation stage of the algorithm, a 4-neighbourhood convolution-based edge extraction is developed to detect the crack and experiment results show that the algorithm is very efficient. In the parameter extraction stage of the algorithm, the crack center line detection method is developed and the center line length is present as the crack length calculation method that can be applied both pixelwise and at the subpixel level.
(2)
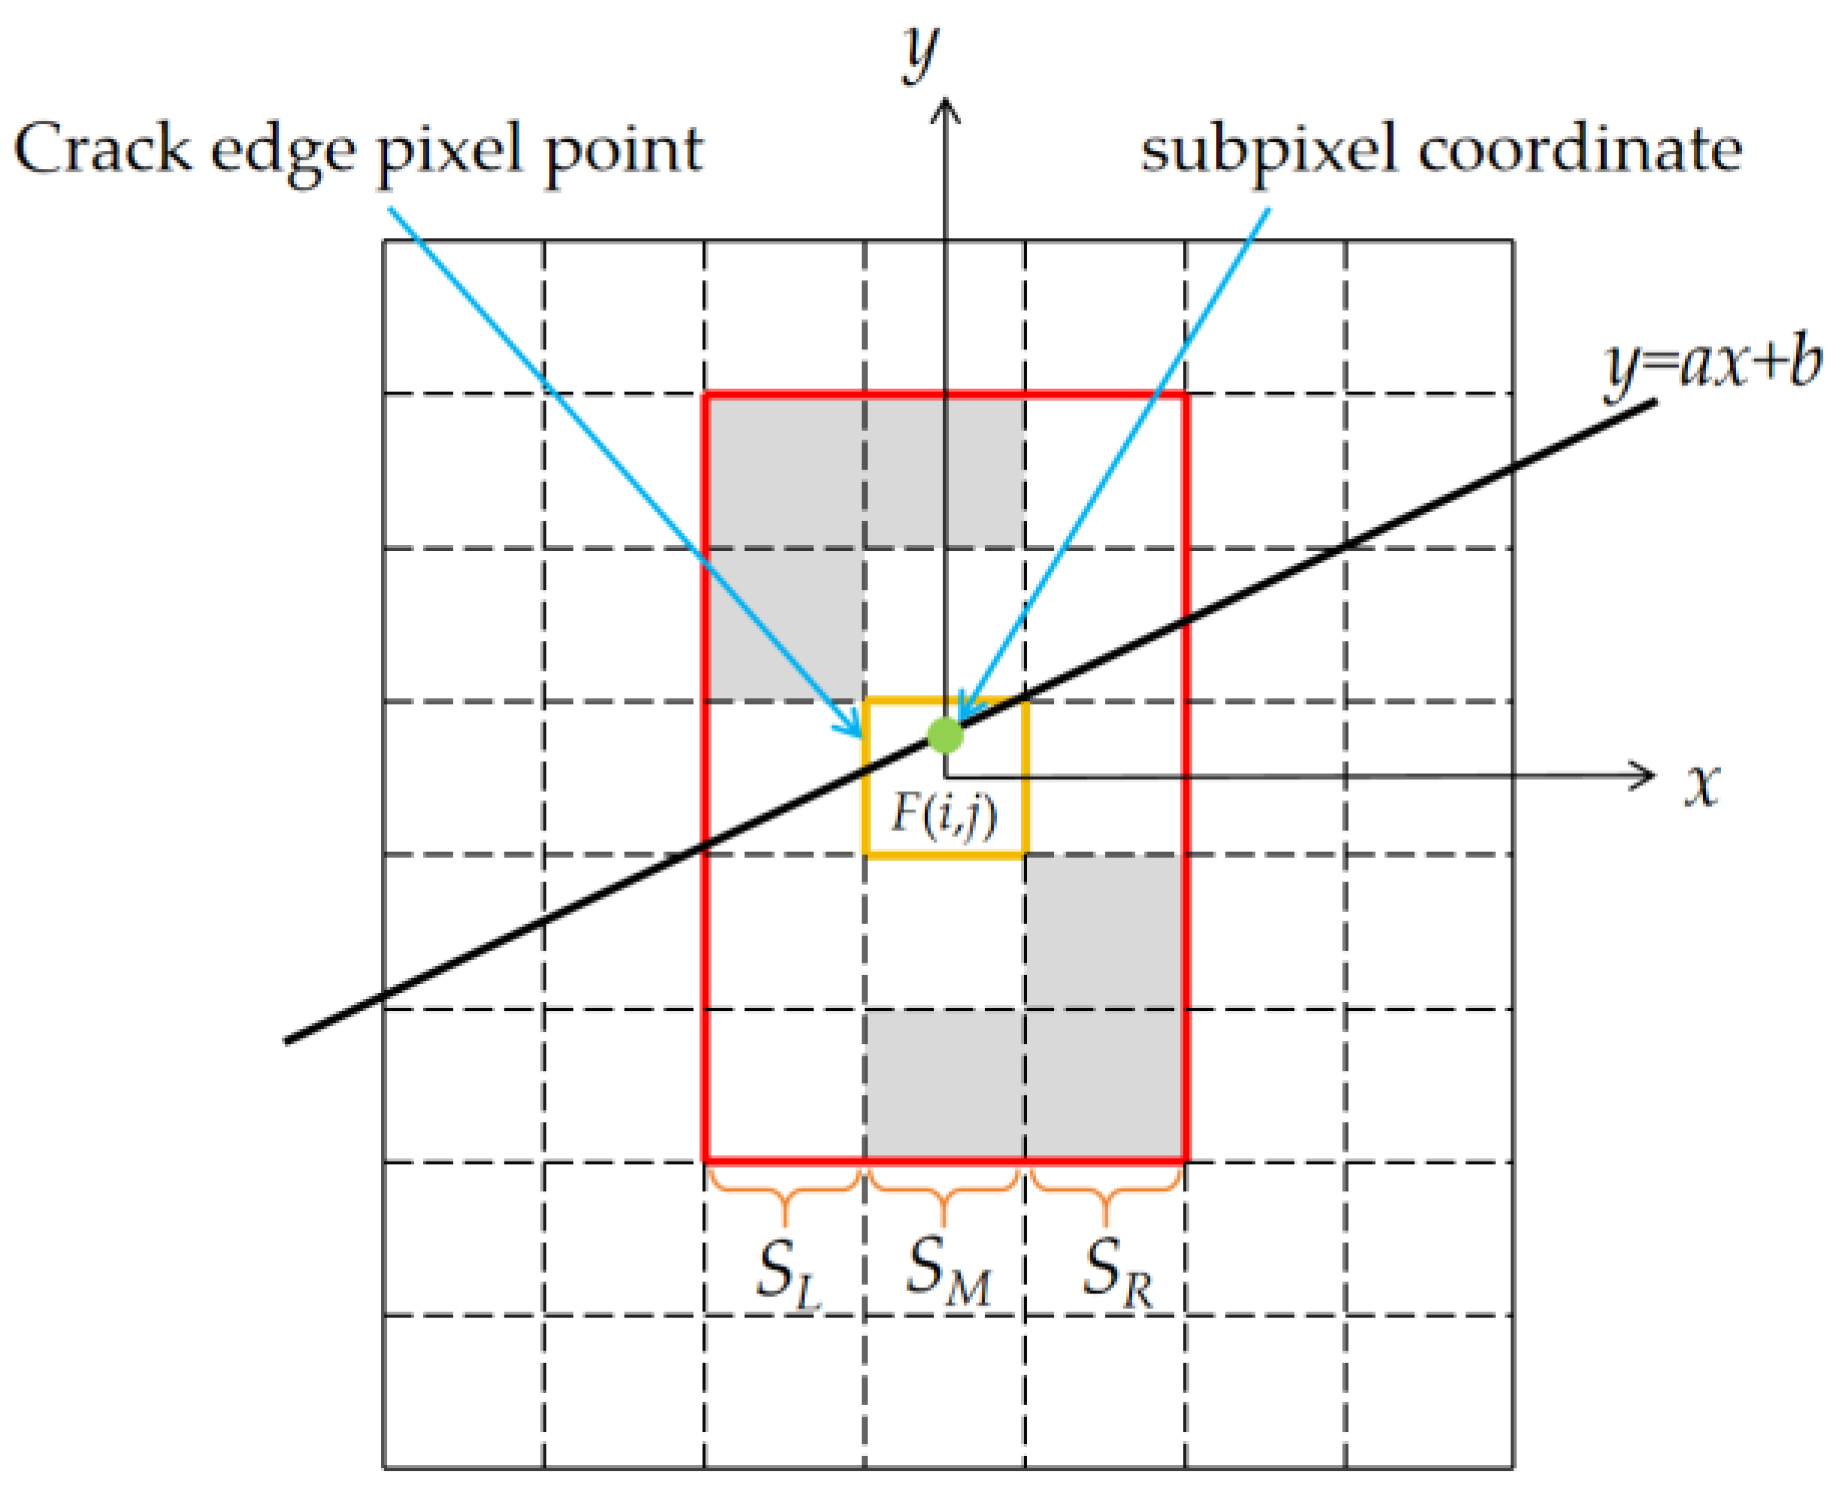
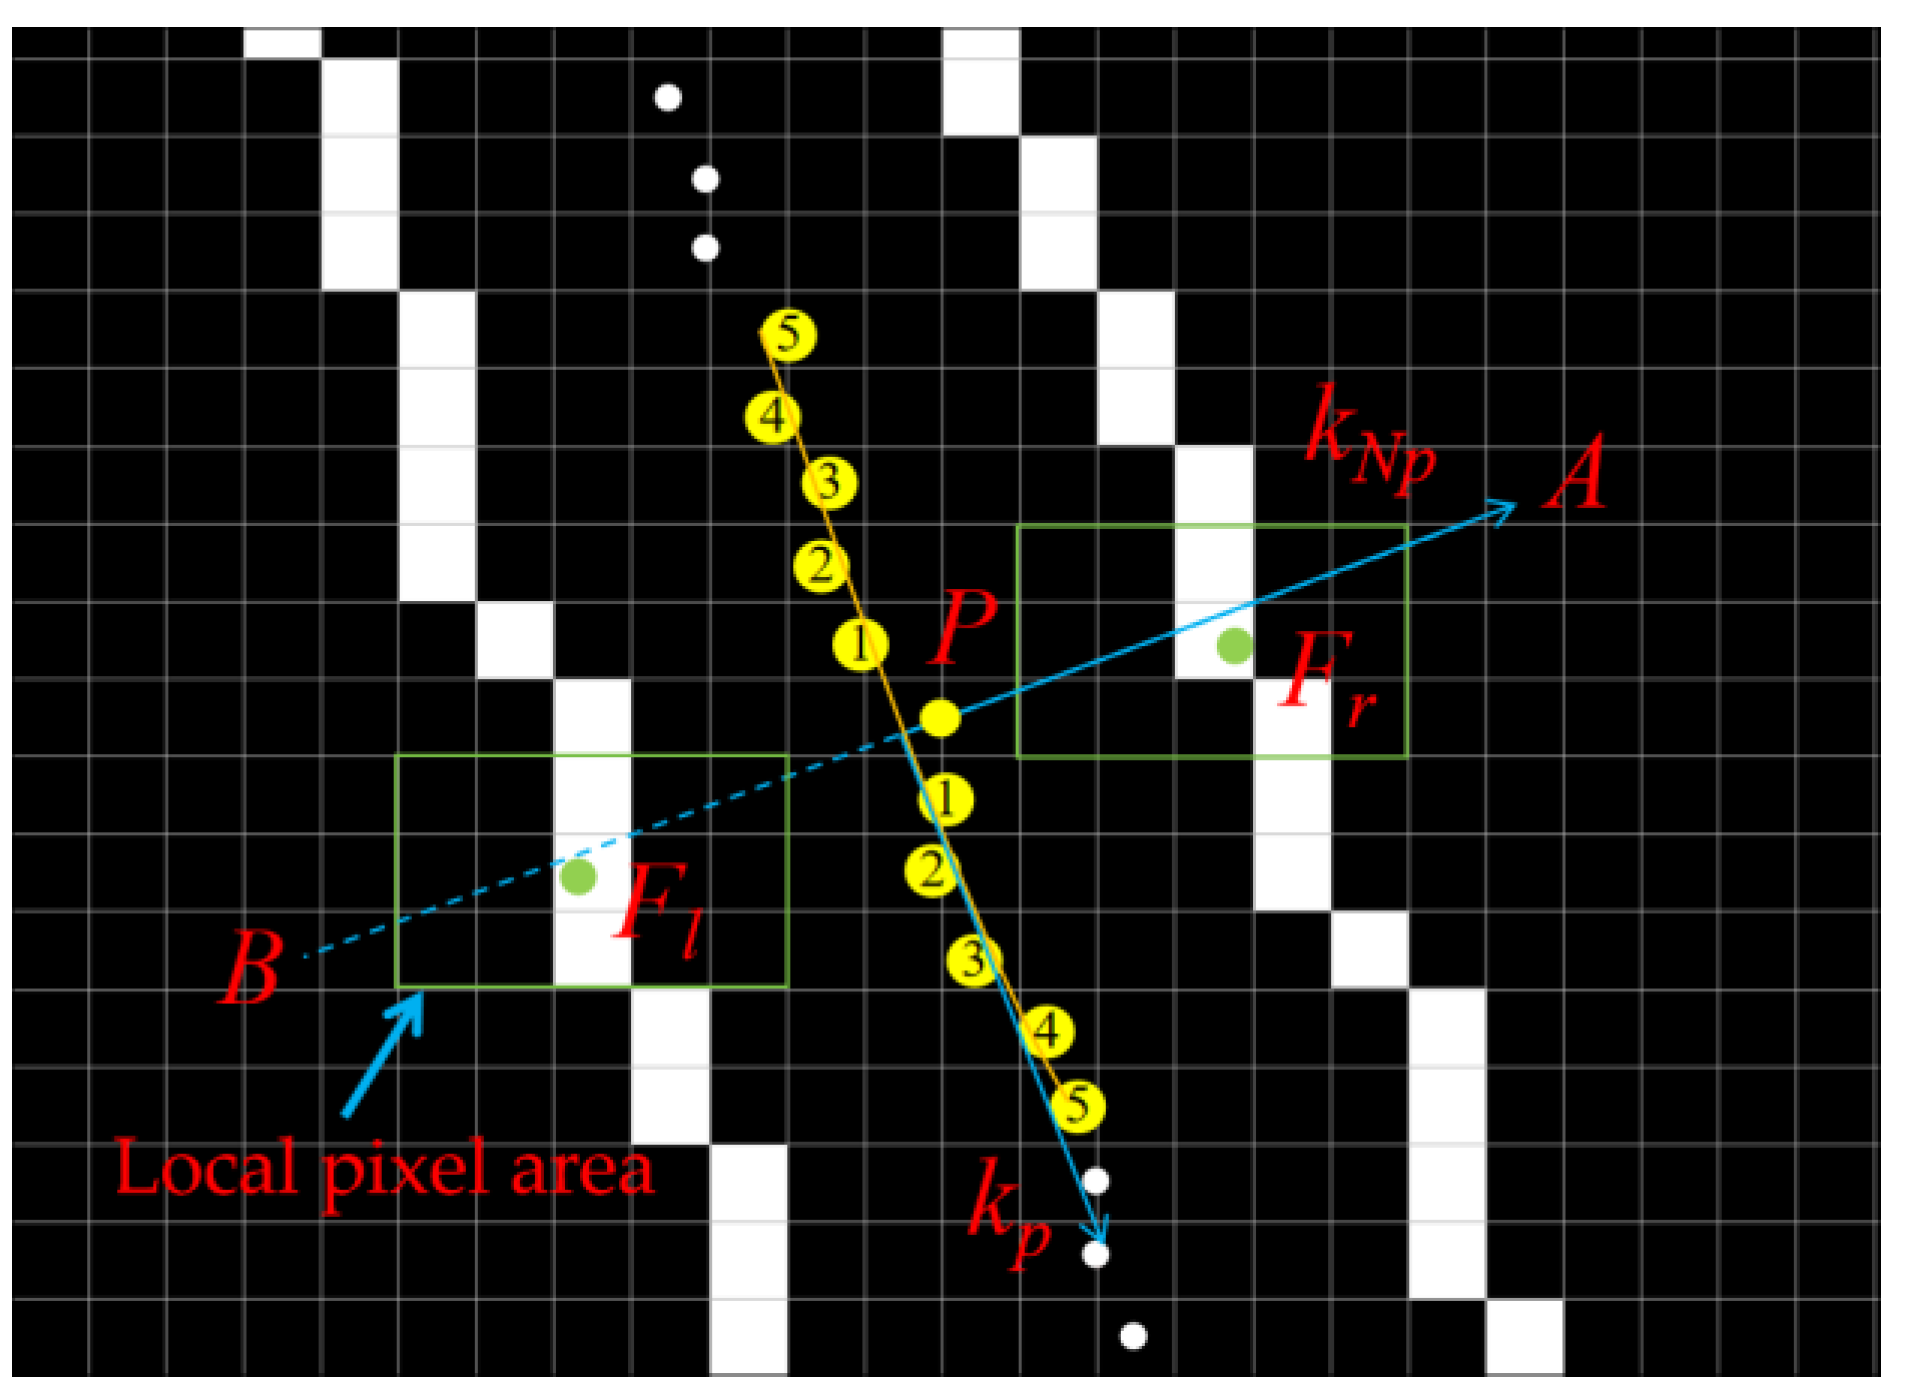
Based on the principle of the photoelectricity of image capturing, a subpixel algorithm based on the partial area effect is introduced to locate the subpixel edges of vertical, horizontal, and oblique cracks, and a novel subpixel crack width calculation method along the crack center line pixelwise is developed by extraction of middle points, the center line and its normal, and the intersection of center line normal and crack edges. With this method, the width of any point along the crack center line can be calculated.
(3)
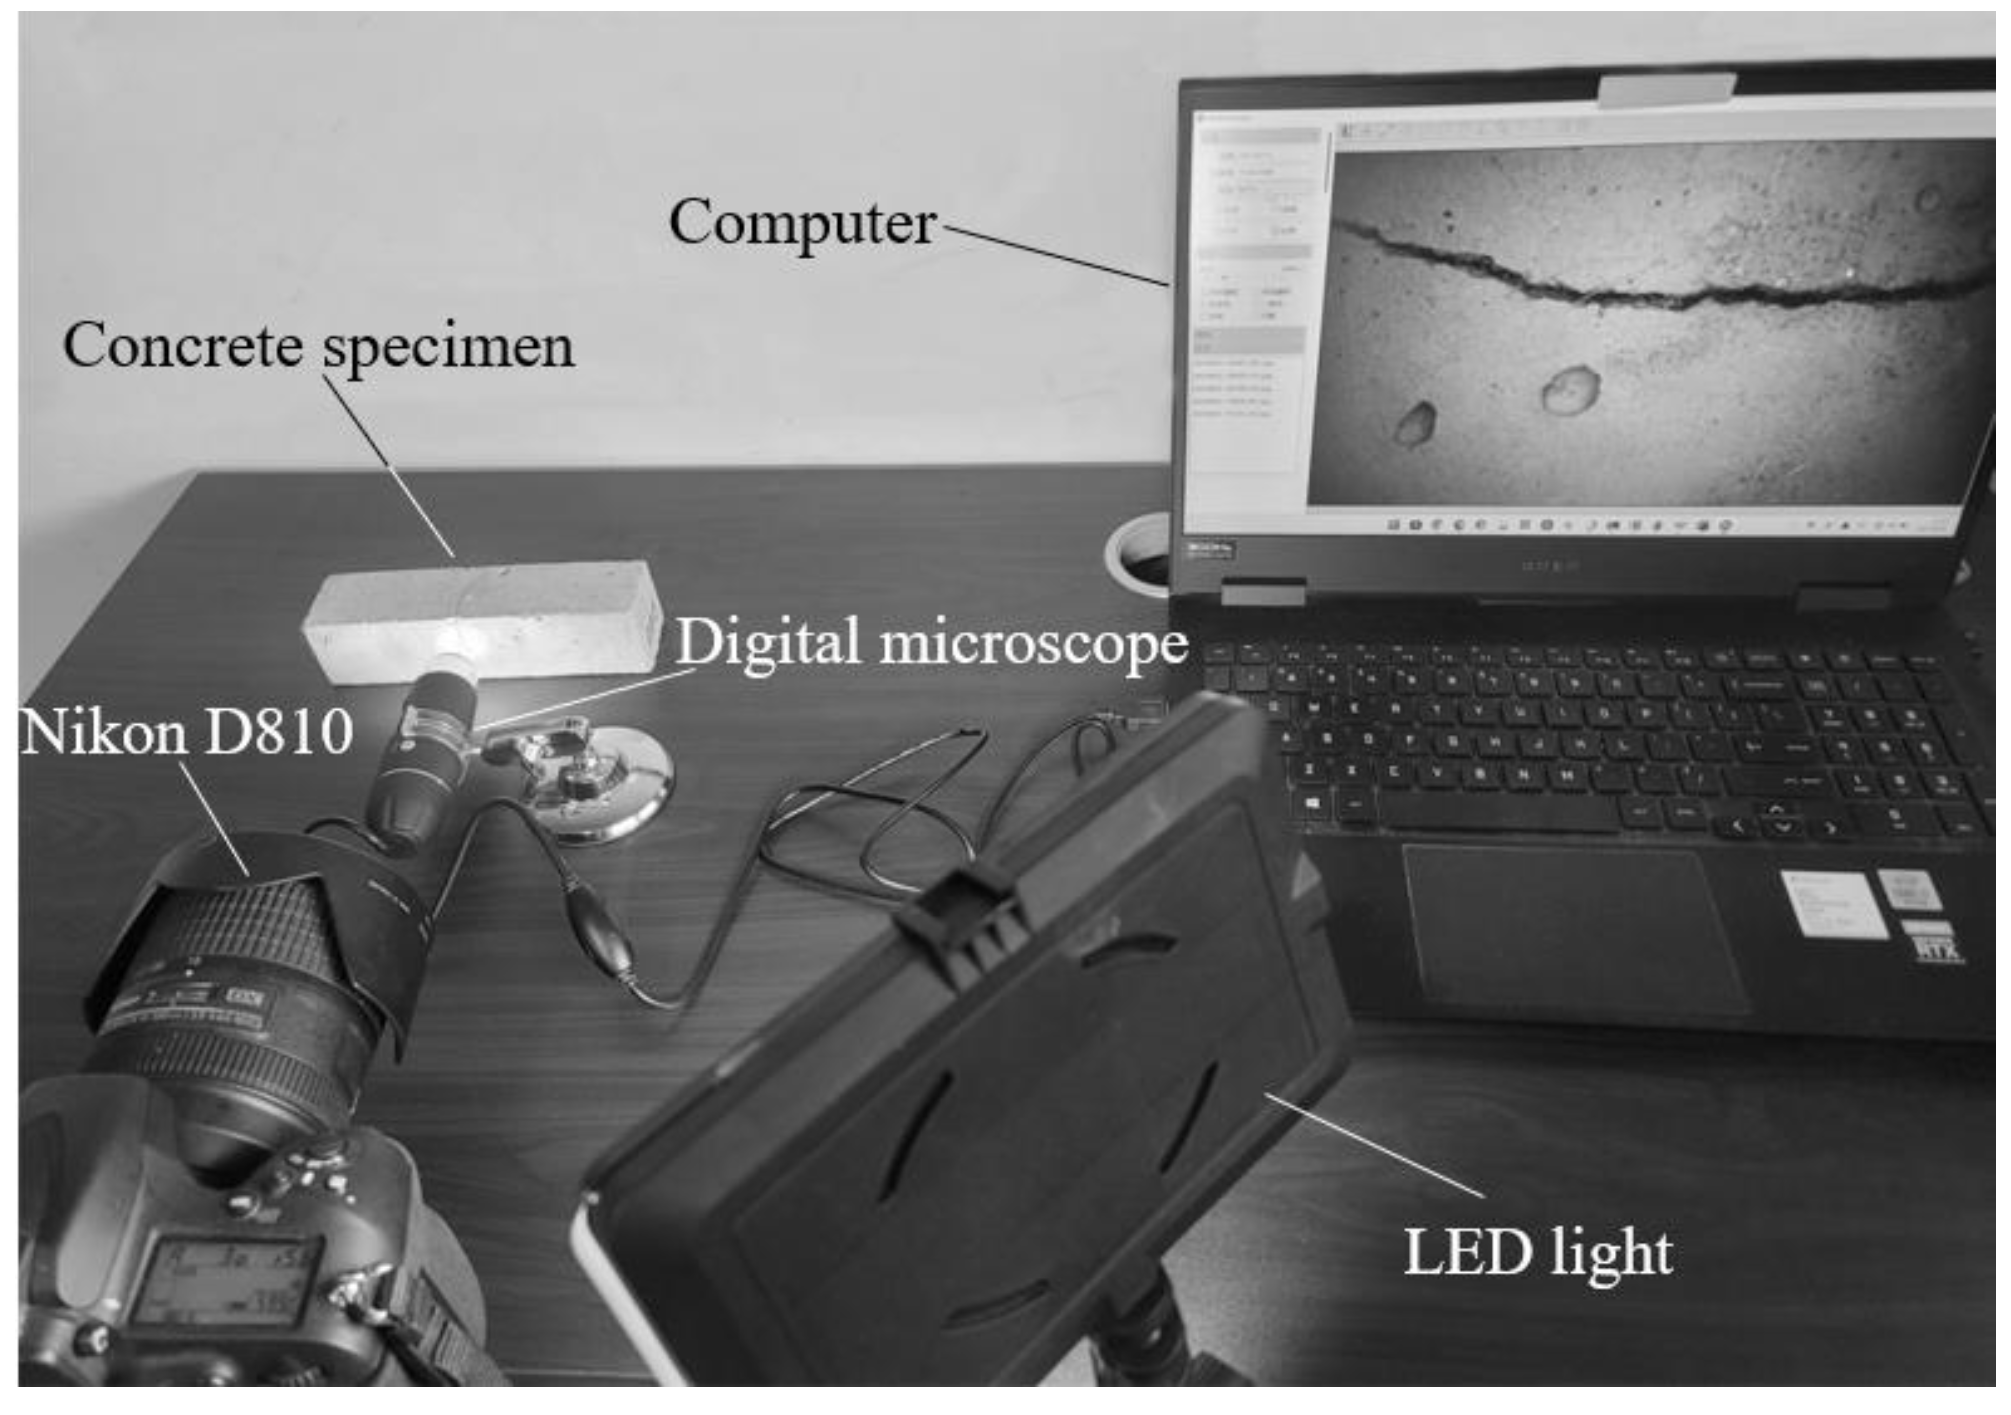
The proposed method is verified by an indoor concrete beam crack measurement experiment with a digital microscope, and results show that the maximum relative errors of the subpixel width of horizontal, vertical, and oblique straight cracks measured by the proposed method are 3.06%, 8.97% and 5.16%, respectively. The absolute error of the crack length is less than 0.30 mm, and the measurement accuracy can reach 0.01 pixels.
With the subpixel parameter calculation algorithm proposed, crack evolution monitoring in SHM can be easily achieved with precision, and it breaks through the limitation of traditional pixelwise crack segmentation. However, in complex environments like low light, severe surface dirt and stains, or great variation in crack width, it is difficult to select the proper dataset image size to make sure crack images with bimodal histograms can be obtained, which is prerequisite for iterative or Otsu threshold selection. Further research should focus on illumination setup, and the fusion of the global and local threshold methods to make sure more precise threshold values can be chosen. Moreover, curved and multi-branched cracks pose difficulties for the extraction of the center line geometrically. Since the localized region of the crack is characterized by a bimodal histogram, our future work will also focus on converting multi-branched cracks into single branches. Additionally, when dealing with single-branch curved cracks, segmenting them into multiple straight cracks will be necessary. These aspects will be the focus of the next phase of our research.

Author Contributions

Conceptualization, J.Z., H.L. and Y.L.; methodology, H.L., Y.L. and J.Z.; validation, R.L. and J.H.; formal analysis, R.L.; investigation, H.L. and Z.Z.; resources, J.Z. and Z.Z.; data curation, R.L. and J.H.; project administration, H.L.; Software, H.L.; writing—original draft preparation, Y.L.; writing—review and editing, J.Z.; supervision, J.Z. All authors have read and agreed to the published version of the manuscript.

Funding

This work was supported by the National Natural Science Foundation of China (Grant. No. 51778094), the Chongqing graduate joint training base construction project (Grant. No. JDLHPYJD2020019), the Graduate Tutor Team Construction Project of Chongqing (Grant. No. JDDSTD2022003), the Transportation Science and Technology Project of Sichuan Province (Grant No. 2020-ZL-B1) and the Scientific Research Innovation Project of Chongqing (Grant. No. CYS22398). We also acknowledge the State Key Laboratory of Mountain Bridge and Tunnel Engineering for providing experimental equipment.

Data Availability Statement

The data that support the findings of this study are available from the corresponding author, upon reasonable request.

Conflicts of Interest

Author Haijing Liu was employed by the company Merchant Chongqing Communication Research & Design Institute Co., Ltd. The remaining authors declare that the research was conducted in the absence of any commercial or financial relationships that could be construed as a potential conflict of interest.

References

  1. Chen, S.; Laefer, D.F.; Mangina, E.; Zolanvari, S.M.I.; Byrne, J. UAV bridge inspection through evaluated 3D reconstructions. J. Bridge Eng. 2019, 24, 05019001. [Google Scholar] [CrossRef]
  2. Payab, M.; Abbasina, R.; Khanzadi, M. A Brief Review and a New Graph-Based Image Analysis for Concrete Crack Quantification. Arch. Comput. Methods Eng. 2019, 26, 347–365. [Google Scholar] [CrossRef]
  3. Yang, G.J.; Qi, Y.H.; Shi, X.M. Review of bridge crack detection based on digital image technology. J. Jilin Univ. (Eng. Technol. Ed.) 2023, 1–20. [Google Scholar] [CrossRef]
  4. Chow, J.K.; Liu, K.F.; Tan, P.S.; Su, Z.; Wu, J.; Li, Z.; Wang, Y.H. Automated defect inspection of concrete structures. Autom. Constr. 2021, 132, 103959. [Google Scholar] [CrossRef]
  5. Ali, L.; Harous, S.; Zaki, N.; Khan, W.; Alnajjar, F.; Jassmi, H.A. Performance evaluation of different algorithms for crack detection in concrete structures. In Proceedings of the 2021 2nd International Conference on Computation, Automation and Knowledge Management, ICCAKM, Dubai, United Arab Emirates, 19–21 January 2021. [Google Scholar]
  6. Cha, Y.J.; Choi, W.; Suh, G.; Mahmoudkhani, S. Autonomous structural visual inspection using region-based deep learning for detecting multiple damage types. Comput. Aided Civ. Infrastruct. Eng. 2018, 33, 731–747. [Google Scholar] [CrossRef]
  7. Alipour, M.; Harris, D.K. Increasing the robustness of material-specific deep learning models for crack detection across different materials. Eng. Struct. 2020, 206, 110157. [Google Scholar] [CrossRef]
  8. Yang, X.; Li, H.; Yu, Y.; Luo, X.; Huang, T.; Yang, X. Automatic pixel-level crack detection and measurement using fully convolutional network. Comput. Aided Civ. Infrastruct. Eng. 2018, 33, 1090–1109. [Google Scholar] [CrossRef]
  9. Sales da Cunha, B.; das Chagas Moura, M.; Souto Maior, C.; Cláudia Negreiros, A.; Didier Lins, I. A comparison between computer vision- and deep learning-based models for automated concrete crack detection. Proc. Inst. Mech. Eng. Part O J. Risk Reliab. 2023, 237, 994–1010. [Google Scholar] [CrossRef]
  10. Dais, D.; Bal, İ.E.; Smyrou, E.; Sarhosis, V. Automatic crack classification and segmentation on masonry surfaces using convolutional neural networks and transfer learning. Autom. Constr. 2021, 125, 103606. [Google Scholar] [CrossRef]
  11. Zhang, Z.H.; Ji, K.; Dang, J.W. Crack identification method for bridge based on BCEM model. J. Jilin Univ. (Eng. Technol. Ed.) 2023, 53, 1418–1426. [Google Scholar]
  12. Wu, R.N.; Bai, Y.; Han, J.F. Detection and Identification Method of Road Surface Damage Based on Deep Learning. Comput. Simul. 2023, 40, 208–212. [Google Scholar]
  13. Li, W.W.; Li, X.Y.; Zhou, J.; Xie, Y.H.; Li, G. An Algorithm for Recognizing Bridge Cracks Based on Full Convolution Neural Network and Naive Bayesian Data Fusion. J. Highw. Transp. Res. Dev. 2023, 40, 44–52. [Google Scholar]
  14. Wang, Z.F.; Li, M.Y.; Li, B.X.; Li, Z.; Wang, L.Q. Bridge Crack Detection Based on Deep Learning and Crack Measurement Analysis Technology. J. Shenyang Jianzhu Univ. (Nat. Sci.) 2022, 38, 486–495. [Google Scholar]
  15. Ali, R.; Chuah, J.H.; Talip, M.S.A.; Mokhtar, N.; Shoaib, M.A. Structural crack detection using deep convolutional neural networks. Autom. Constr. 2022, 133, 103989. [Google Scholar] [CrossRef]
  16. Dorafshan, S.; Thomas, R.J.; Maguire, M. Comparison of deep convolutional neural networks and edge detectors for image-based crack detection in concrete. Constr. Build. Mater. 2018, 186, 1031–1045. [Google Scholar] [CrossRef]
  17. Tang, Q.L.; Tan, Y.; Peng, L.M.; Cao, H.R. On crack identification method for tunnel linings based on digital image technology. J. Railw. Sci. Eng. 2019, 16, 3041–3049. [Google Scholar]
  18. Sun, X.H.; Shi, C.H.; Liu, L.H.; Lei, M.F. Concrete Crack Image Recognition System Based on Improved Seed Filling Algorithm. J. South China Univ. Technol. (Nat. Sci. Ed.) 2022, 50, 27–136+146. [Google Scholar]
  19. Han, X.J.; Zhao, Z.C. Structural surface crack detection method based on computer vision technology. J. Build. Struct. 2018, 39, 418–427. [Google Scholar]
  20. Liu, X.; Zhu, L.; Wang, Y.; Yu, Z. A crack detection system of subway tunnel based on image processing. Meas. Control 2022, 55, 164–177. [Google Scholar] [CrossRef]
  21. Altabey, W.A.; Kouritem, S.A.; Abouheaf, M.I.; Nahas, N. Research in Image Processing for Pipeline Crack Detection Applications. In Proceedings of the 2022 International Conference on Electrical, Computer, Communications and Mechatronics Engineering (ICECCME), Male, Maldives, 16–18 November 2022; IEEE: Piscataway, NJ, USA, 2022. [Google Scholar]
  22. Pantoja-Rosero, B.G.; Santos, K.R.M.D.; Achanta, R.; Rezaie, A.; Beyer, K. Determining crack kinematics from imaged crack patterns. Constr. Build. Mater. 2022, 343, 128054. [Google Scholar] [CrossRef]
  23. China Association for Engineering Construction Standardization. Technical Specification for Digital Image Inspection of Engineering Structures, 1st ed.; China Architecture & Building Press: Beijing, China, 2022; pp. 12–15. [Google Scholar]
  24. Chen, J.; Shang, Y.C.; Tian, J.W. Fast polynomial fits sub-pixel edge detection algorithms. J. Appl. Opt. 2011, 32, 91–95. [Google Scholar]
  25. Luo, J.; Hou, Y.; Fu, L. An improved algorithm for subpixel edge detection using gray moment. J. Chongqing Univ. 2008, 31, 549–552+586. [Google Scholar]
  26. Trujillo-Pino, A.; Krissian, K.; Alemán-Flores, M.; Santana-Cedrés, D. Accurate subpixel edge location based on partial area effect. Image Vis. Comput. 2013, 31, 72–90. [Google Scholar] [CrossRef]
  27. Nobuyuki, O. A Threshold Selection Method from Gray-Level Histograms. IEEE Trans. Syst. Man Cybern. 1979, 9, 62–66. [Google Scholar]
  28. Dorafshan, S.; Thomas, R.J.; Maguire, M. Benchmarking Image Processing Algorithms for Unmanned Aerial System-Assisted Crack Detection in Concrete Structures. Infrastructures 2019, 4, 19. [Google Scholar] [CrossRef]
  29. Canny, J. A Computational Approach to Edge Detection. IEEE Trans. Pattern Anal. Mach. Intell. 1986, 6, 679–698. [Google Scholar] [CrossRef]
  30. Zhang, T.Y.; Suen, C.Y. A fast parallel algorithm for thinning digital patterns. Commun. ACM 1984, 27, 236–239. [Google Scholar] [CrossRef]
  31. Zhou, Y.; Liu, T. Computer Vision-Based Crack Detection and Measurement on Concrete Structure. J. Tongji Univ. (Nat. Sci.) 2019, 47, 1277–1285. [Google Scholar]
  32. Liu, Y.F.; Fan, J.S.; Nie, J.G.; Kong, S.Y.; Qi, Y. Review and prospect of digital-image-based crack detection of structure surface. J. Civ. Eng. 2021, 54, 79–98. [Google Scholar]
Figure 1. Crack measurement process.
Buildings 14 00151 g001
Figure 2. The iterative method process.
Buildings 14 00151 g002
Figure 3. Crack image segmentation effect. (a) Crack image. (b) The self-set threshold method (T = 64). (c) The self-set threshold method (T = 128). (d) The Otsu method. (e) The iterative method.
Buildings 14 00151 g003
Figure 4. Binary image noise. (a) Crack surface noise; (b) 8-neighborhood connectivity noise removal; (c) 4-neighborhood connectivity noise removal.
Buildings 14 00151 g004
Figure 5. Connectivity validation method: (a) 4-neighbourhood search; (b) 8-neighbourhood search.
Buildings 14 00151 g005
Figure 6. The 3 × 3 convolutional kernel.
Buildings 14 00151 g006
Figure 7. Crack skeleton line extraction model. (a) Crack binary diagram. (b) First iteration. (c) Skeleton line of cracks after n times iterations.
Buildings 14 00151 g007
Figure 8. Center line extraction model based on image row direction. (a) Crack image edge situation. (b) Crack center line.
Buildings 14 00151 g008
Figure 9. Crack center line extraction results. (a) Vertical crack center line extraction result. (b) Horizontal crack center line extraction result.
Buildings 14 00151 g009
Figure 10. Schematic diagram of crack length calculation.
Buildings 14 00151 g010
Figure 11. Computational model for subpixel edge location.
Buildings 14 00151 g011
Figure 12. Schematic diagram of subpixel width calculation based on the intersection of the normal line of the crack center line and crack edges.
Buildings 14 00151 g012
Figure 13. Crack width measurement and local magnification.
Buildings 14 00151 g013
Figure 14. Concrete test crack measurement.
Buildings 14 00151 g014
Figure 15. Ten points in crack images. (a) Horizontal crack. (b) Vertical crack. (c) Oblique crack.
Buildings 14 00151 g015
Table 1. Iterative and Otsu method threshold calculation results.
Segmentation MethodGrayscale ThresholdExecution 1000 times/ms
Iterative method77.91290
Otsu method78363
Table 2. Crack edge extraction process.
StepImage
1. Importing crack images.Buildings 14 00151 i001
2. Grayscale threshold segmentation.Buildings 14 00151 i002
3. Area threshold denoise.Buildings 14 00151 i003
4. Crack edges extraction by 4-neighborhood kernel convolution.Buildings 14 00151 i004
Table 3. Canny edge detection algorithm and 4-neighborhood convolution calculation results.
Edge Extraction MethodExecution 1000 times/ms
Canny edge detection algorithm170
4-neighborhood convolution227
Table 4. Basic parameters of experiment devices.
Device NameParameterSpecification
Nikon D810 cameraShutter1/8000~30 s
Resolution4800 × 3200
Focus Range18~300 mm
Available Image FormatJPG/PNG
Digital microscopeResolution1920 × 1080
Focus Range15~40 mm
Available Image FormatJPG/BMP
Microscopic Magnification50~1600 times
Table 5. Horizontal crack widths obtained by different methods.
Point Number12345678910
A: Measured values/mm0.2370.2370.2510.2780.3200.3410.3340.3830.3410.327
B: Pixel values/mm0.2220.2290.2440.2660.3180.3400.3400.3700.3470.347
C: Subpixel values/mm0.2320.2320.2490.2800.3220.3410.3380.3730.3420.337
|A–B|/A: Relative error/%6.33%3.38%2.79%4.32%0.63%0.29%1.80%3.39%1.76%6.12%
|A–C|/A: Relative error/%2.11%2.11%0.80%0.72%0.63%0.00%1.20%2.61%0.29%3.06%
Table 6. Vertical crack widths obtained by different methods.
Point Number12345678910
A: Measured values/mm0.1230.1560.1230.1560.1480.2060.1560.1890.1400.280
B: Pixel values/mm0.1220.1480.1220.1390.1390.2000.1650.1910.1390.286
C Subpixel values/mm0.1250.1520.1230.1420.1410.2070.1660.1920.1400.279
|A–B|/A: Relative error/%0.81%5.13%0.81%10.90%6.08%2.91%5.77%1.06%0.71%2.14%
|A–C|/A: Relative error/%1.63%2.56%0.00%8.97%4.73%0.49%6.41%1.59%0.00%0.36%
Table 7. Oblique crack widths obtained by different methods.
Point Number12345678910
A: Measured values/mm0.1490.1670.1430.2750.1730.2150.2310.2270.1550.157
B: Pixel values/mm0.1550.1620.1360.2850.1680.2140.2260.2140.1420.168
C: Subpixel values/mm0.1490.1630.1460.2780.1710.2150.2320.2300.1630.160
|A–B|/A: Relative error/%4.03%2.99%4.90%3.64%2.89%0.47%2.16%5.73%8.39%7.01%
|A–C|/A: Relative error/%0.00%2.40%2.10%1.09%1.16%0.00%0.43%1.32%5.16%1.91%
Table 8. Crack lengths of cracks in different directions.
Crack TypeHorizontal CrackVertical CrackOblique Crack
A: Measured values/mm4.0932.4571.851
B: Subpixel values/mm4.3752.5781.973
|A–B|: Absolute error/mm0.2820.1210.122
|A–B|/A: Relative error/%6.89%4.92%6.59%
Table 9. Pixel coordinates, subpixel coordinates and the coordinate error of oblique crack edges.
Pixel CoordinatesSubpixel CoordinatesCoordinate Error
(50.0, 66.0)(50.0, 66.169)0.169
(51.0, 67.0)(51.0, 67.016)0.016
(52.0, 67.0)(52.0, 67.156)0.156
(53.0, 67.0)(53.0, 67.178)0.178
(54.0, 68.0)(54.0, 68.045)0.045
(55.0, 68.0)(55.0, 68.194)0.194
(56.0, 68.0)(56.0, 68.079)0.079
(57.0, 69.0)(57.0, 69.195)0.195
(58.0, 70.0)(58.0, 69.967)0.033
(59.0, 70.0)(59.0, 70.231)0.231
(60.0, 71.0)(60.0, 71.053)0.053
Disclaimer/Publisher’s Note: The statements, opinions and data contained in all publications are solely those of the individual author(s) and contributor(s) and not of MDPI and/or the editor(s). MDPI and/or the editor(s) disclaim responsibility for any injury to people or property resulting from any ideas, methods, instructions or products referred to in the content.

