
Machine Learning-Based Cost-Effective Smart Home Data Analysis and Forecasting for Energy Saving †

Abstract
:1. Introduction
- Cost-effective system design: A cost-effective and high-performance smart IoT system is designed by removing and integrating redundant IoT sensors.
- AI-based energy prediction technology for energy efficiency: A data analysis and prediction technology that enables meaningful inference through correlation analysis of data acquired from different heterogeneous IoT sensors installed inside a smart home for energy efficiency.
2. Related Works
2.1. Machine Learning-Based Smart Home
2.2. Deep Learning-Based Smart Home
2.3. Merit of the Current Study
- Eliminating redundant sensors: Establishment of a cost-effective smart home IoT system by eliminating redundant sensors.
- Increased accuracy: Reduction in unnecessary sensors actually increases the accuracy of the AI model.
- Power demand response: Prediction of power demand through environmental information sensor data analysis in the home.
3. Methodology
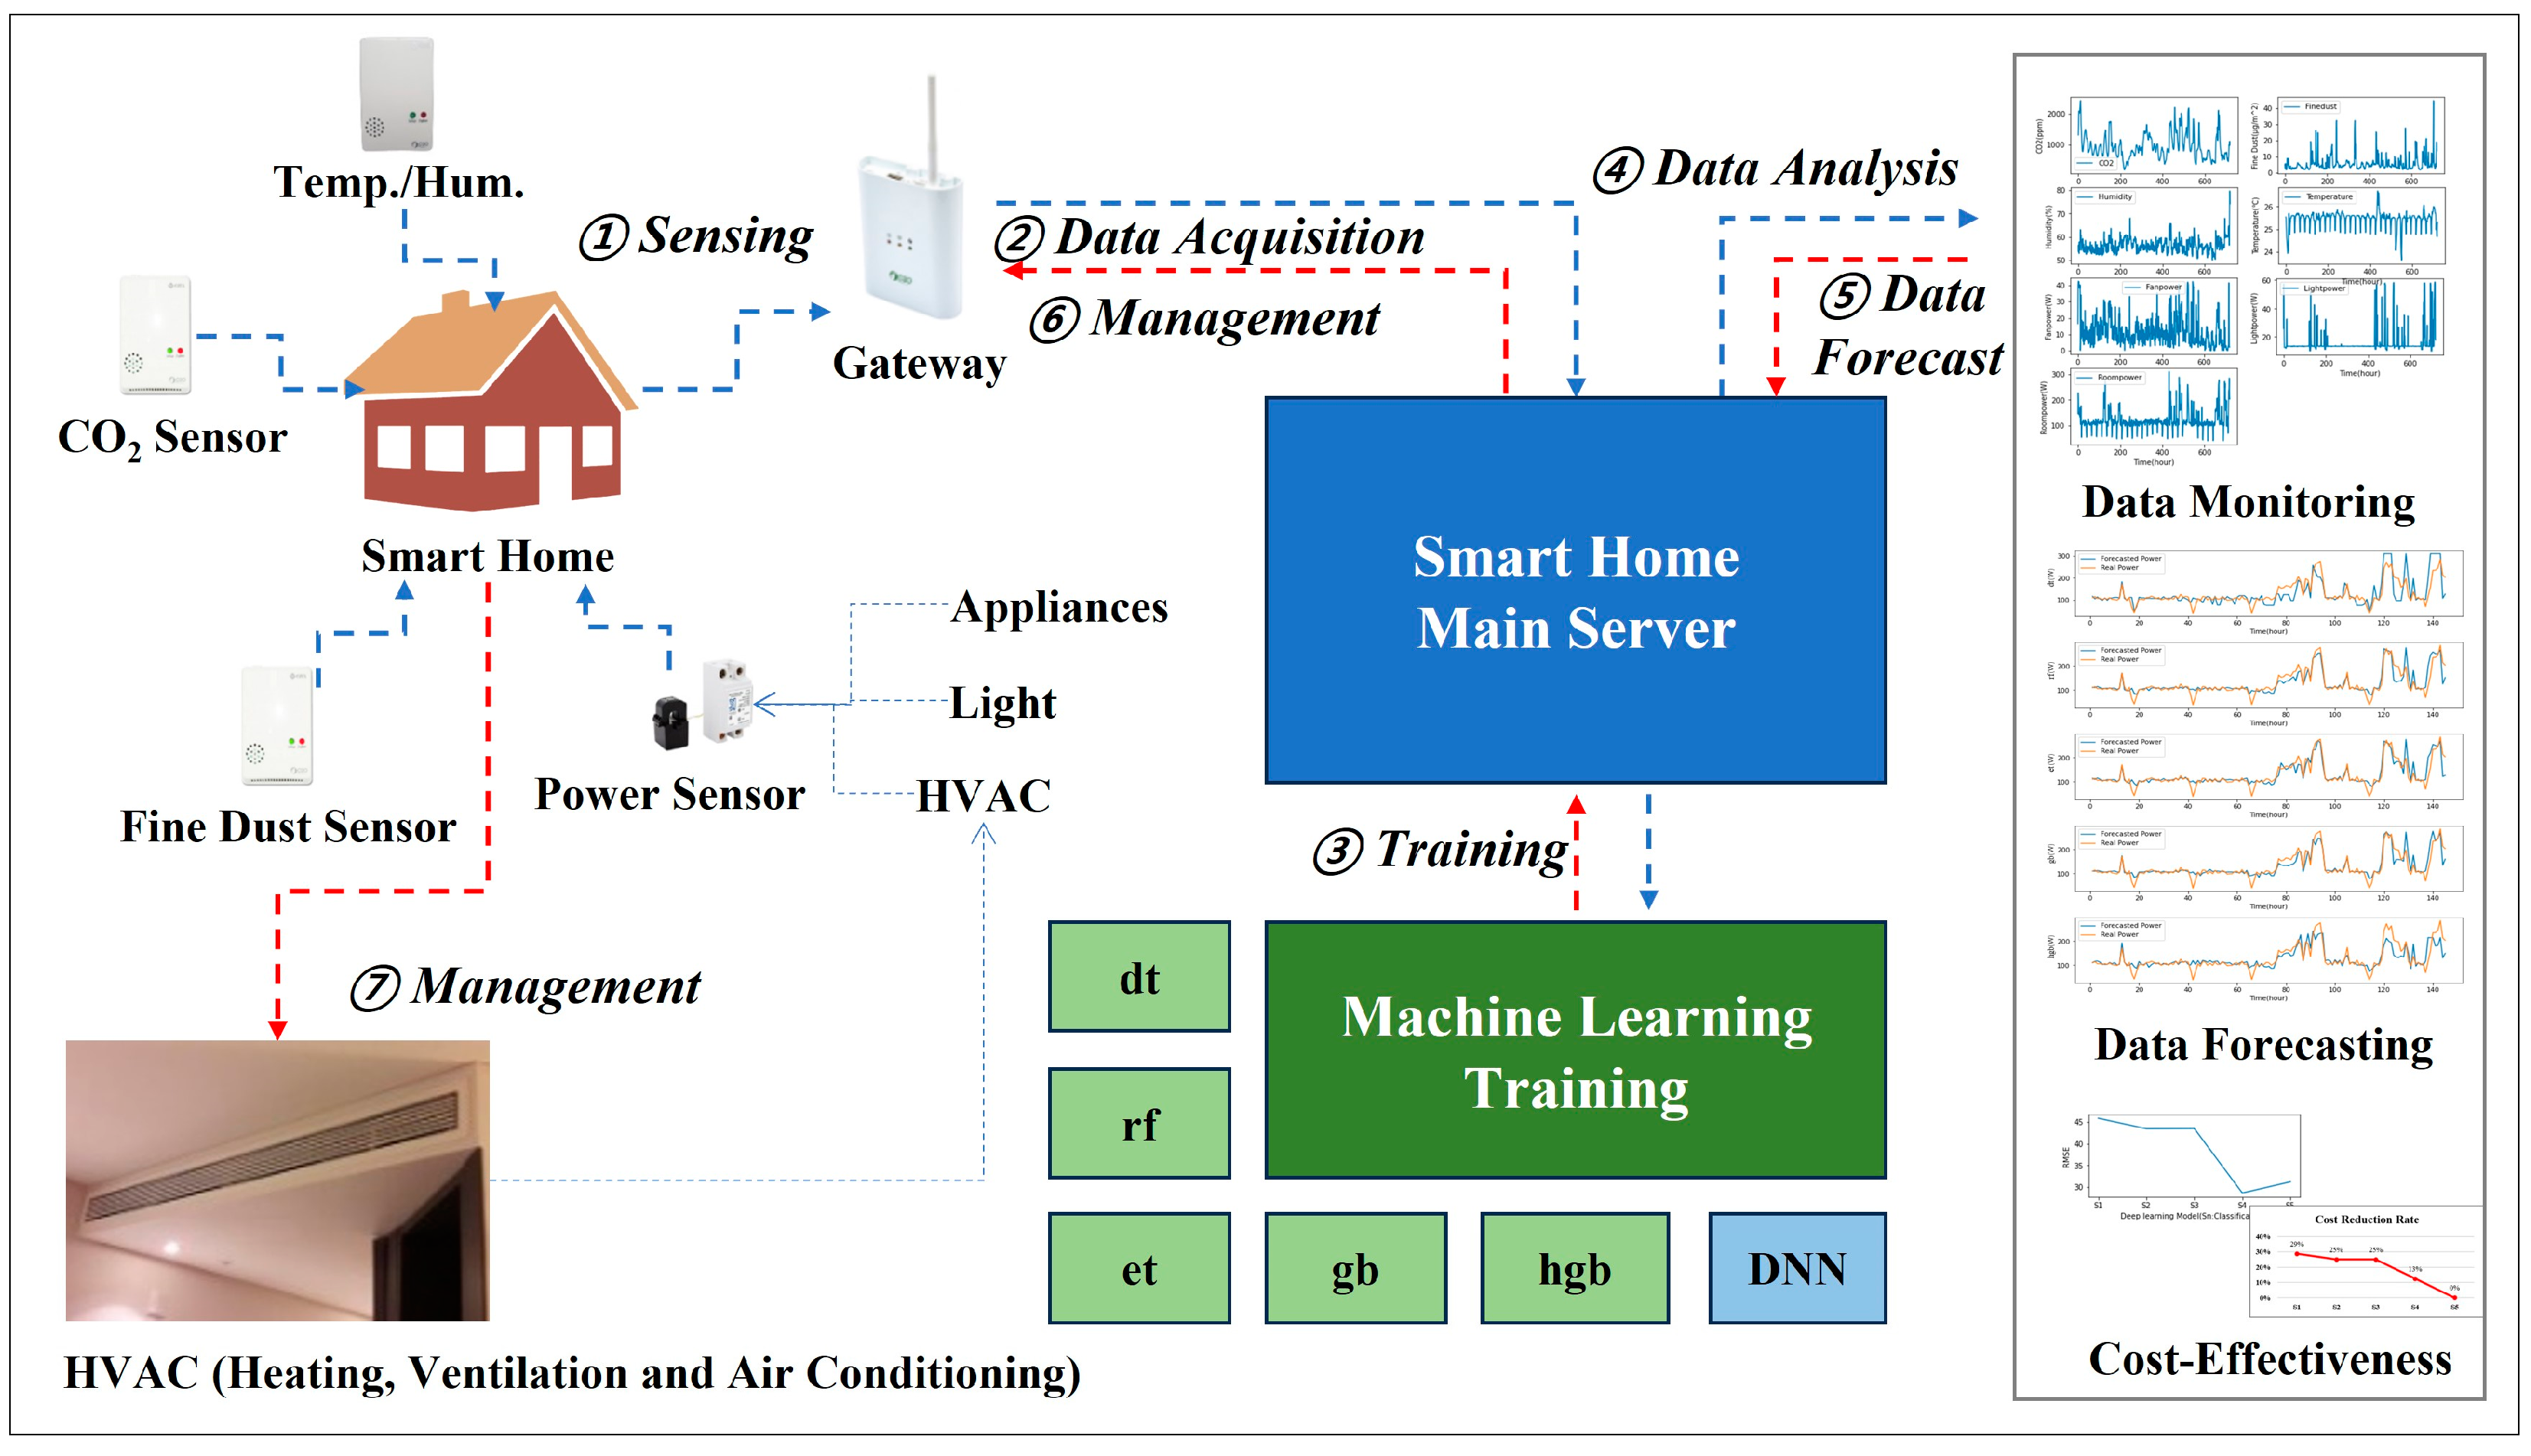
3.1. Methodology
- ①
- Sensing: Sensing environmental information inside the home from IoT sensors.
- ②
- Data acquisition: Collecting data from IoT sensors to Gateway.
- ③
- Training: Storing collected data in a database and performing machine learning training by importing the stored data. The algorithms used are Decision Tree Regressor (dt), Random Forest Regressor (rf), Extra Trees Regressor (et), Gradient-Boosting Regressor (gb), Hist Gradient-Boosting Regressor (hgb), and Deep Neural Network (DNN).
- ④
- Data analysis: Outputting the collected and trained data to the monitoring panel for users to visually check. Users can check the collected environmental information and also check the predicted data. At this time, the predicted data are HVAC power data.
- ⑤
- Data forecast: Predicting in advance how much power loss there will be in the future through predicted HVAC power. Through this, users can prevent their electricity bills from rising due to progressive power taxes.
- ⑥
- Management: Performing control for energy saving through predicted HVAC power data.
3.2. Background
3.2.1. Decision Tree
3.2.2. Random Forest
3.2.3. Extra Trees
3.2.4. Gradient Boosting
3.2.5. Hist Gradient Boosting
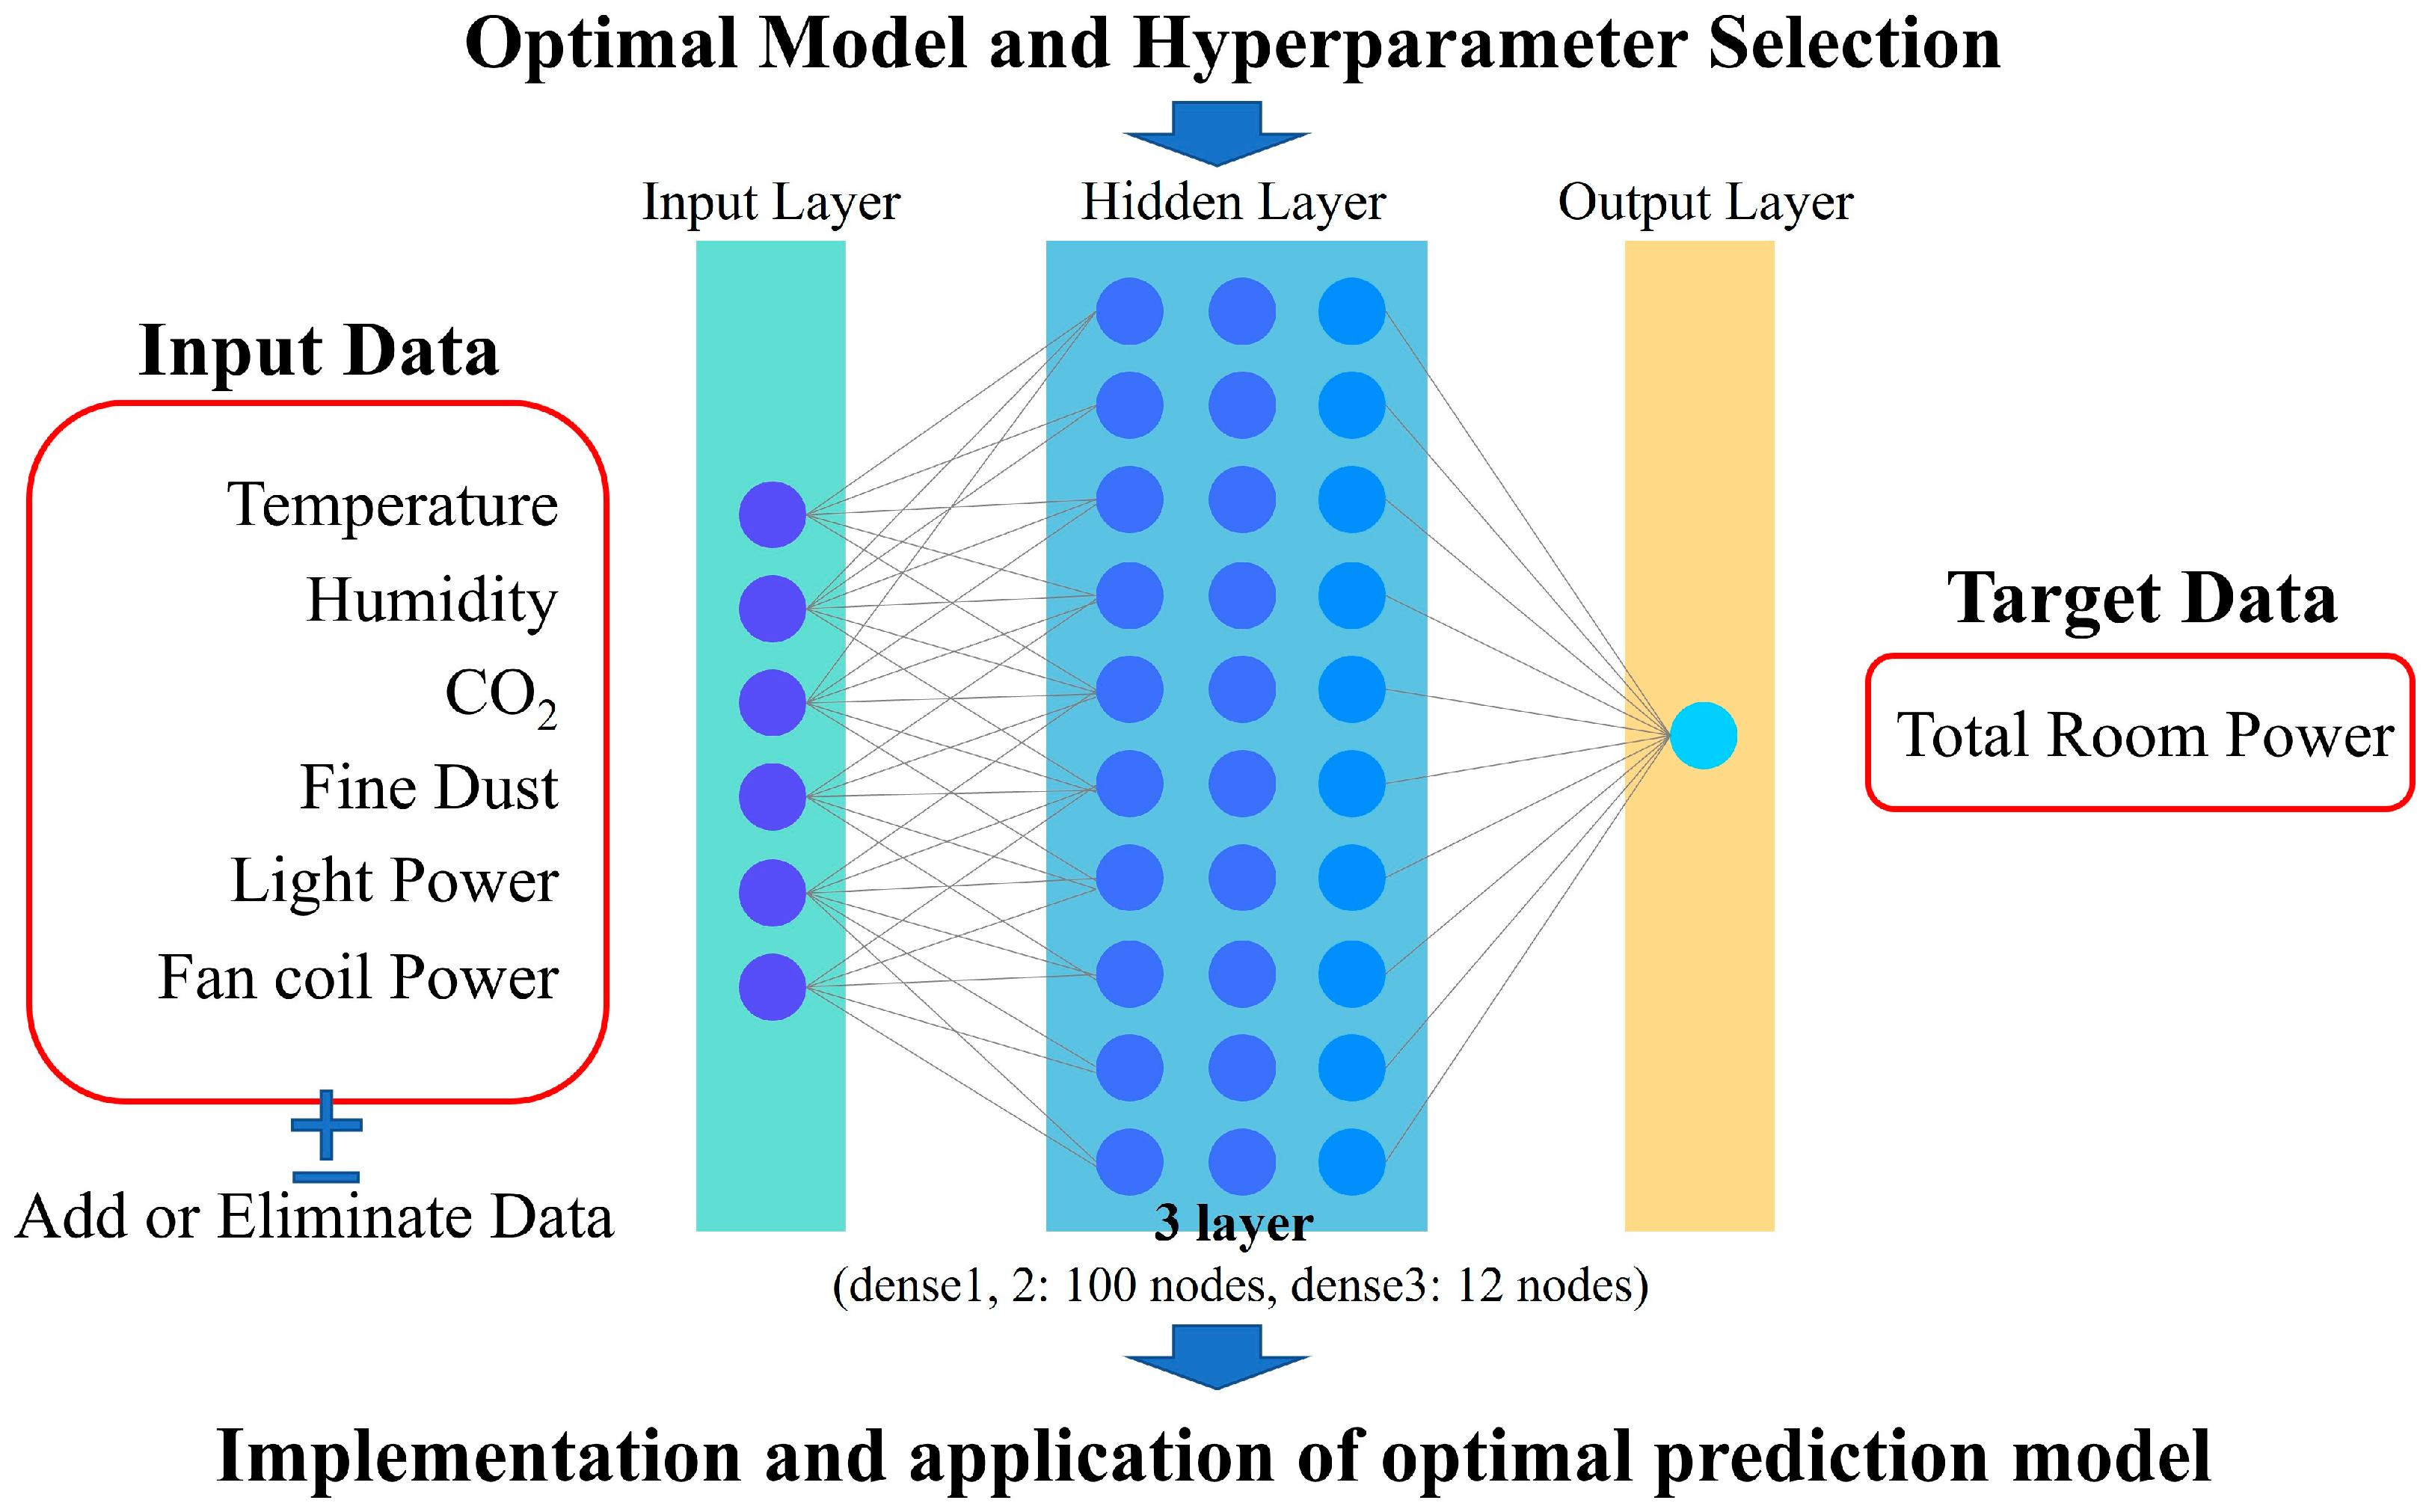
3.2.6. Deep Neural Network (DNN)
3.2.7. Recurrent Neural Network (RNN)
3.2.8. Convolutional Neural Network (CNN)
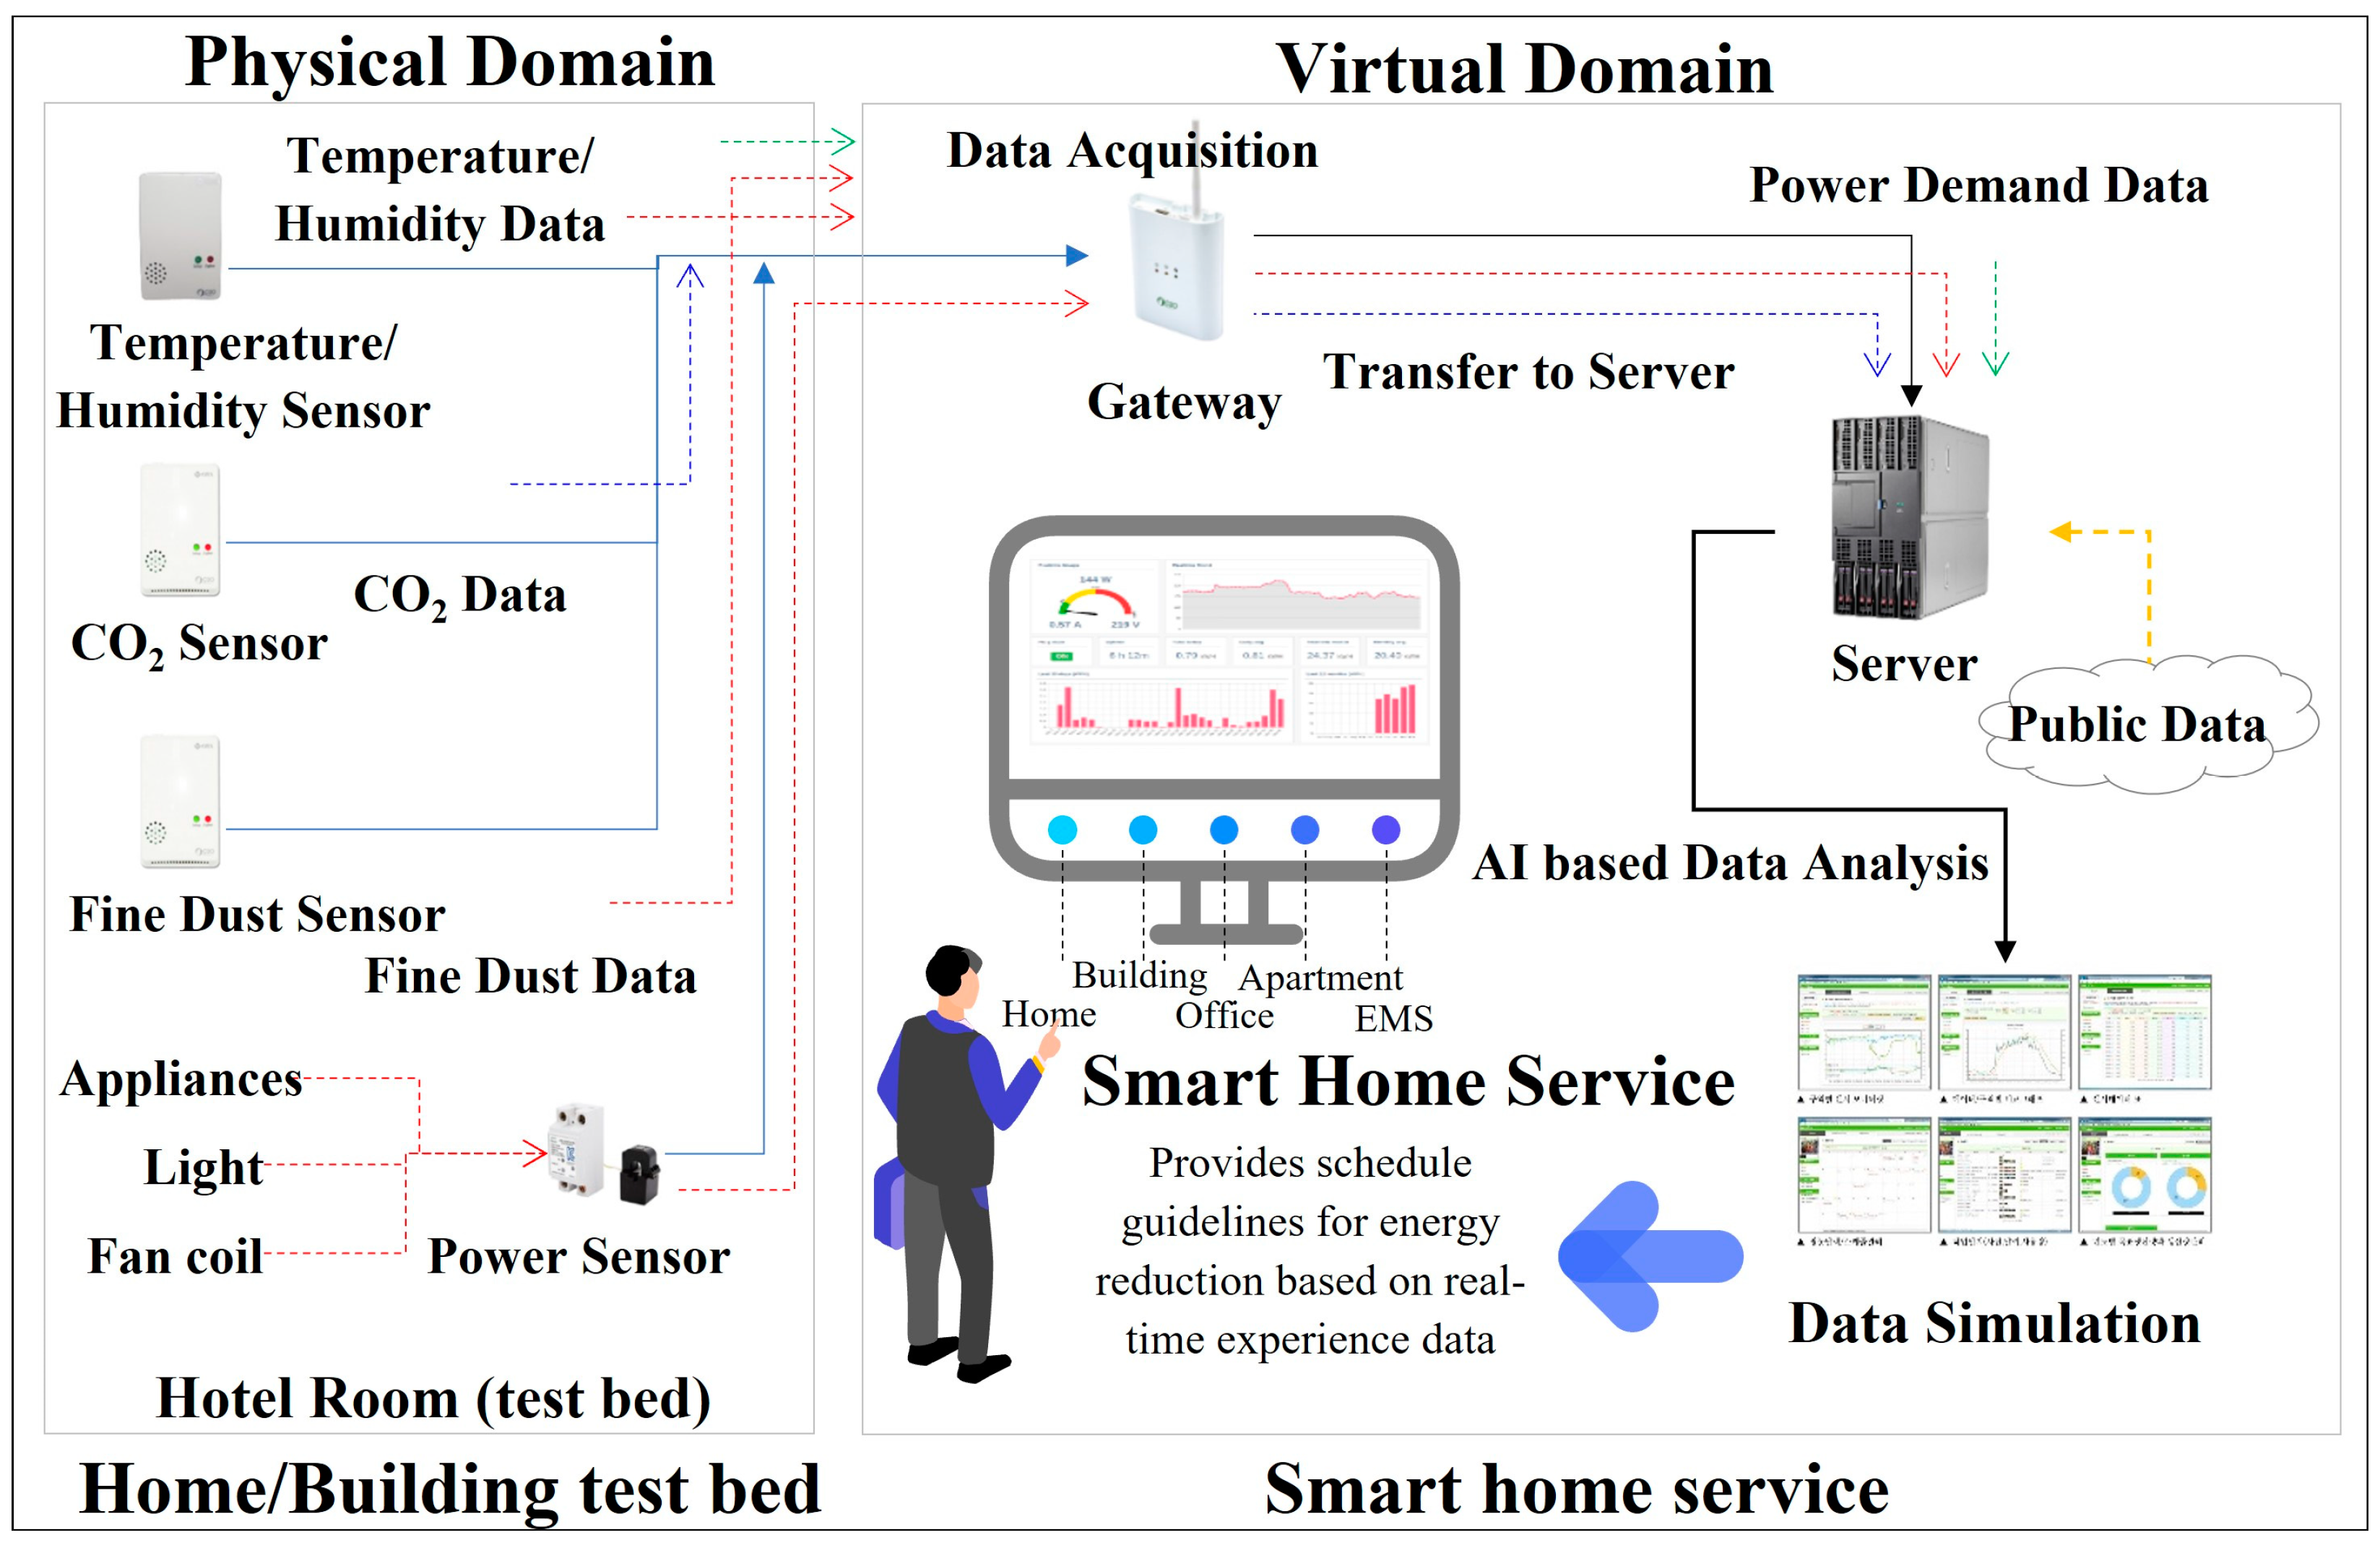
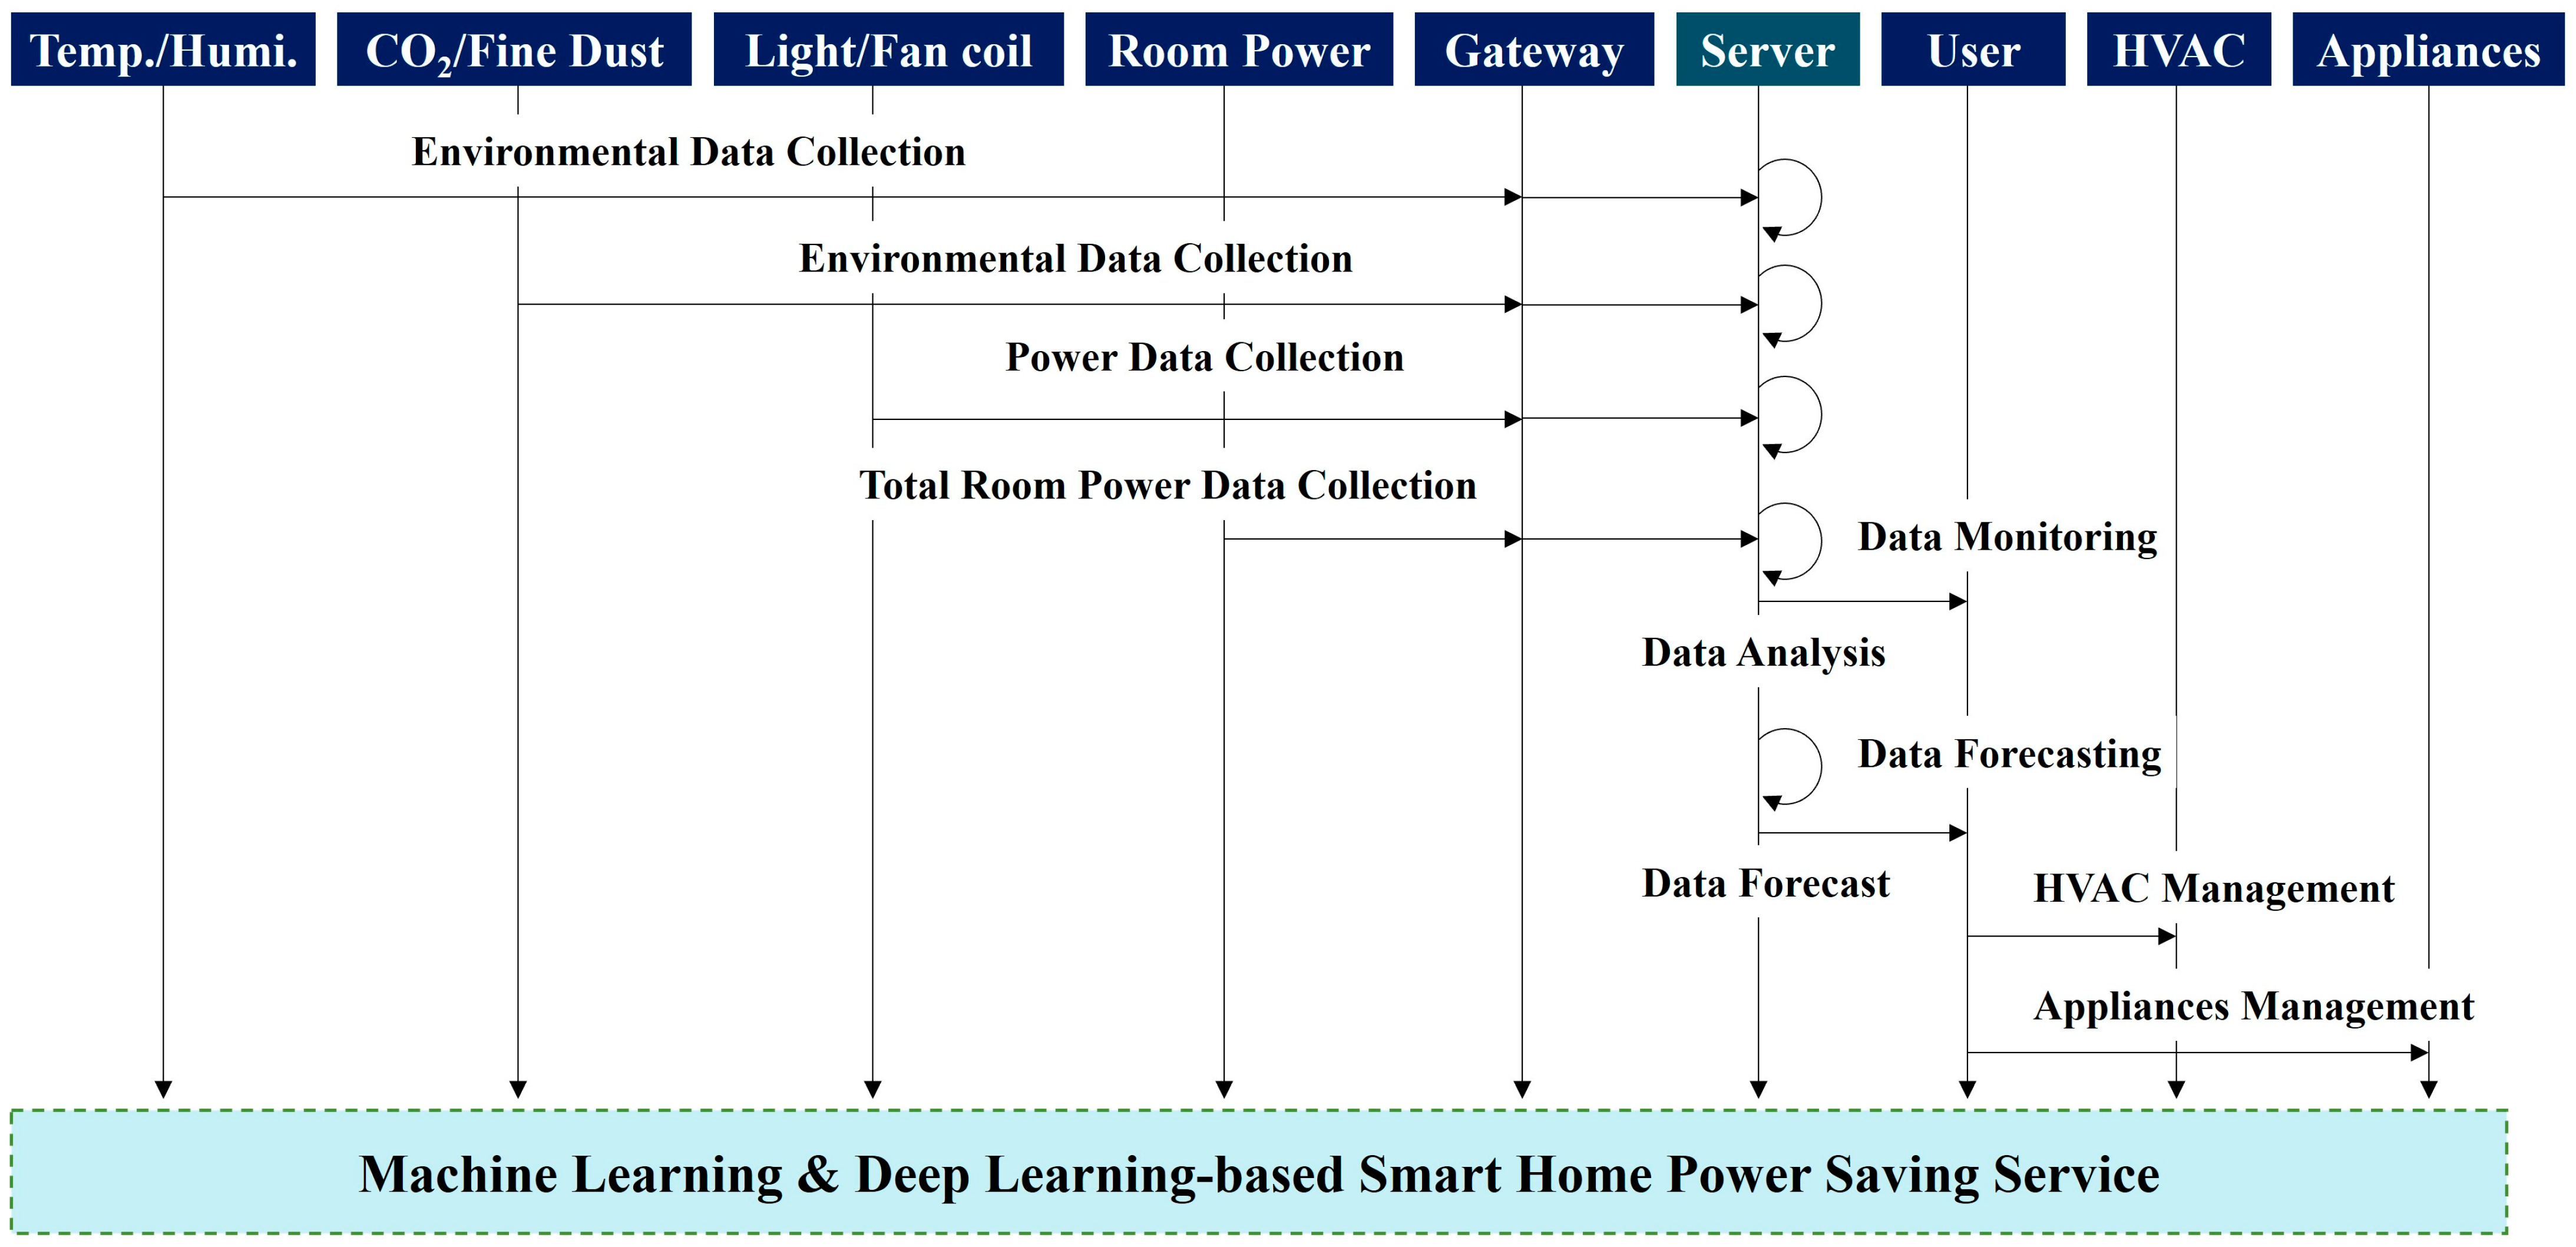
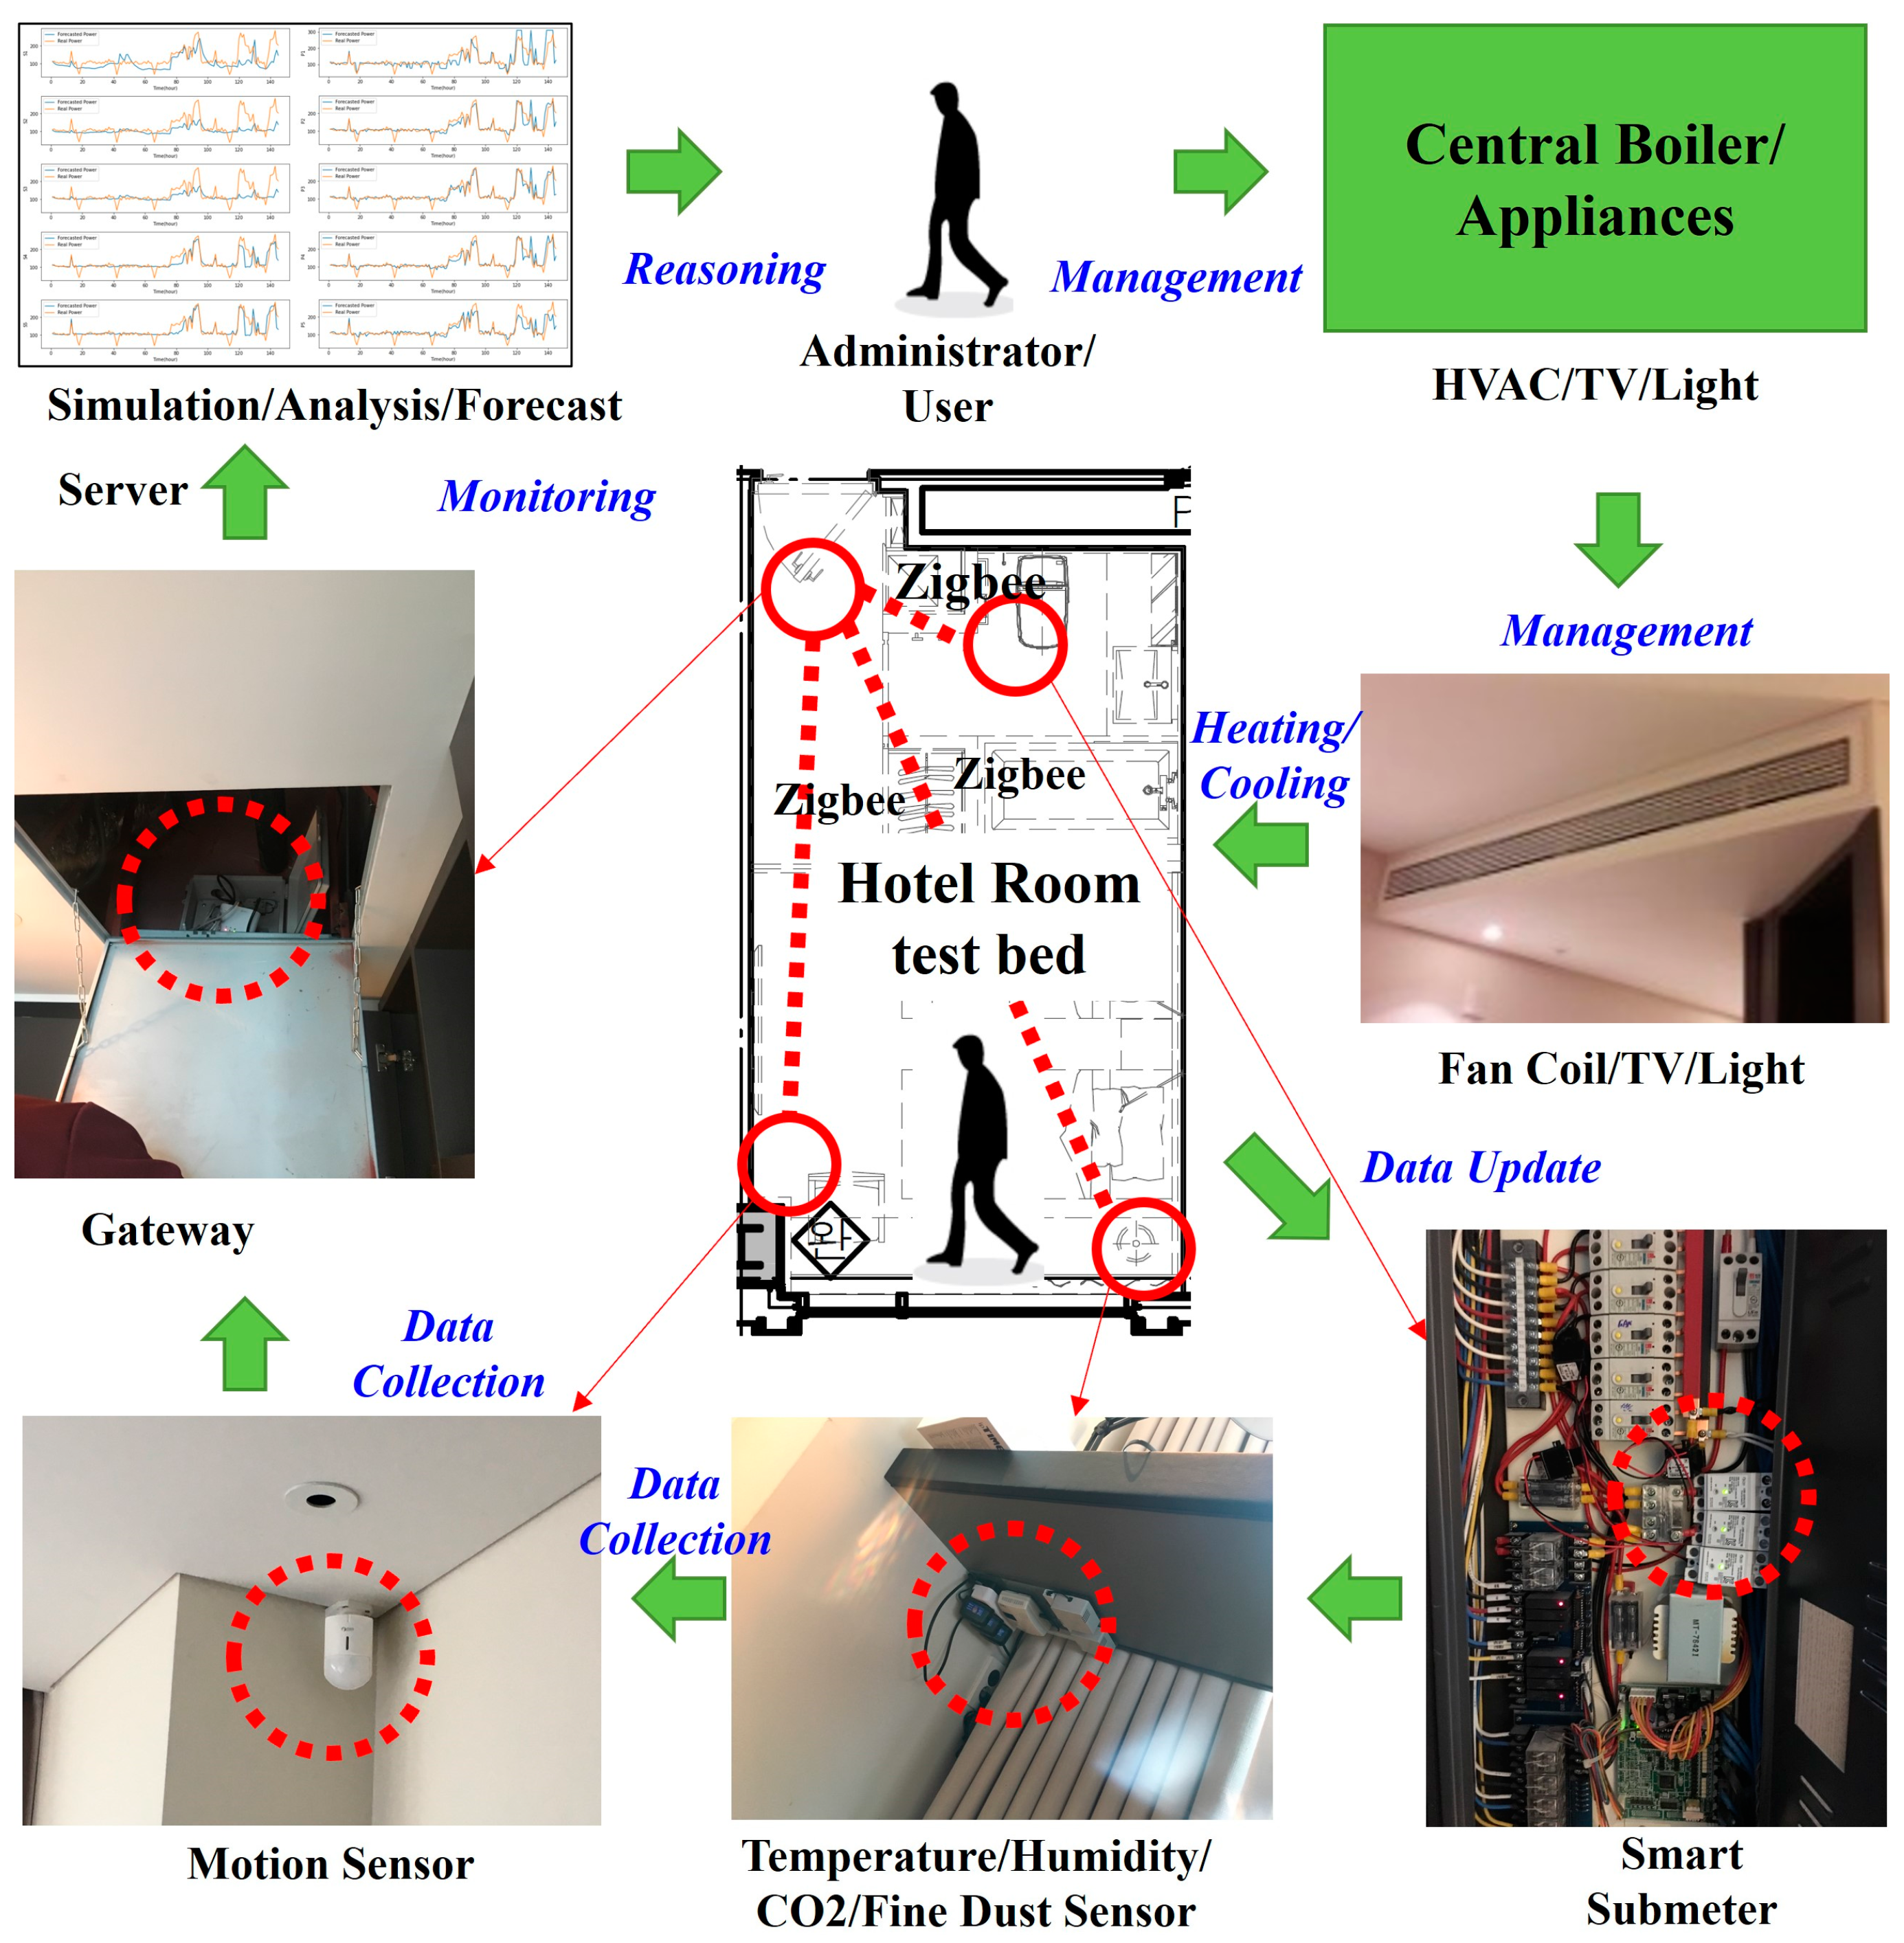
4. Service Overview
5. Implementation
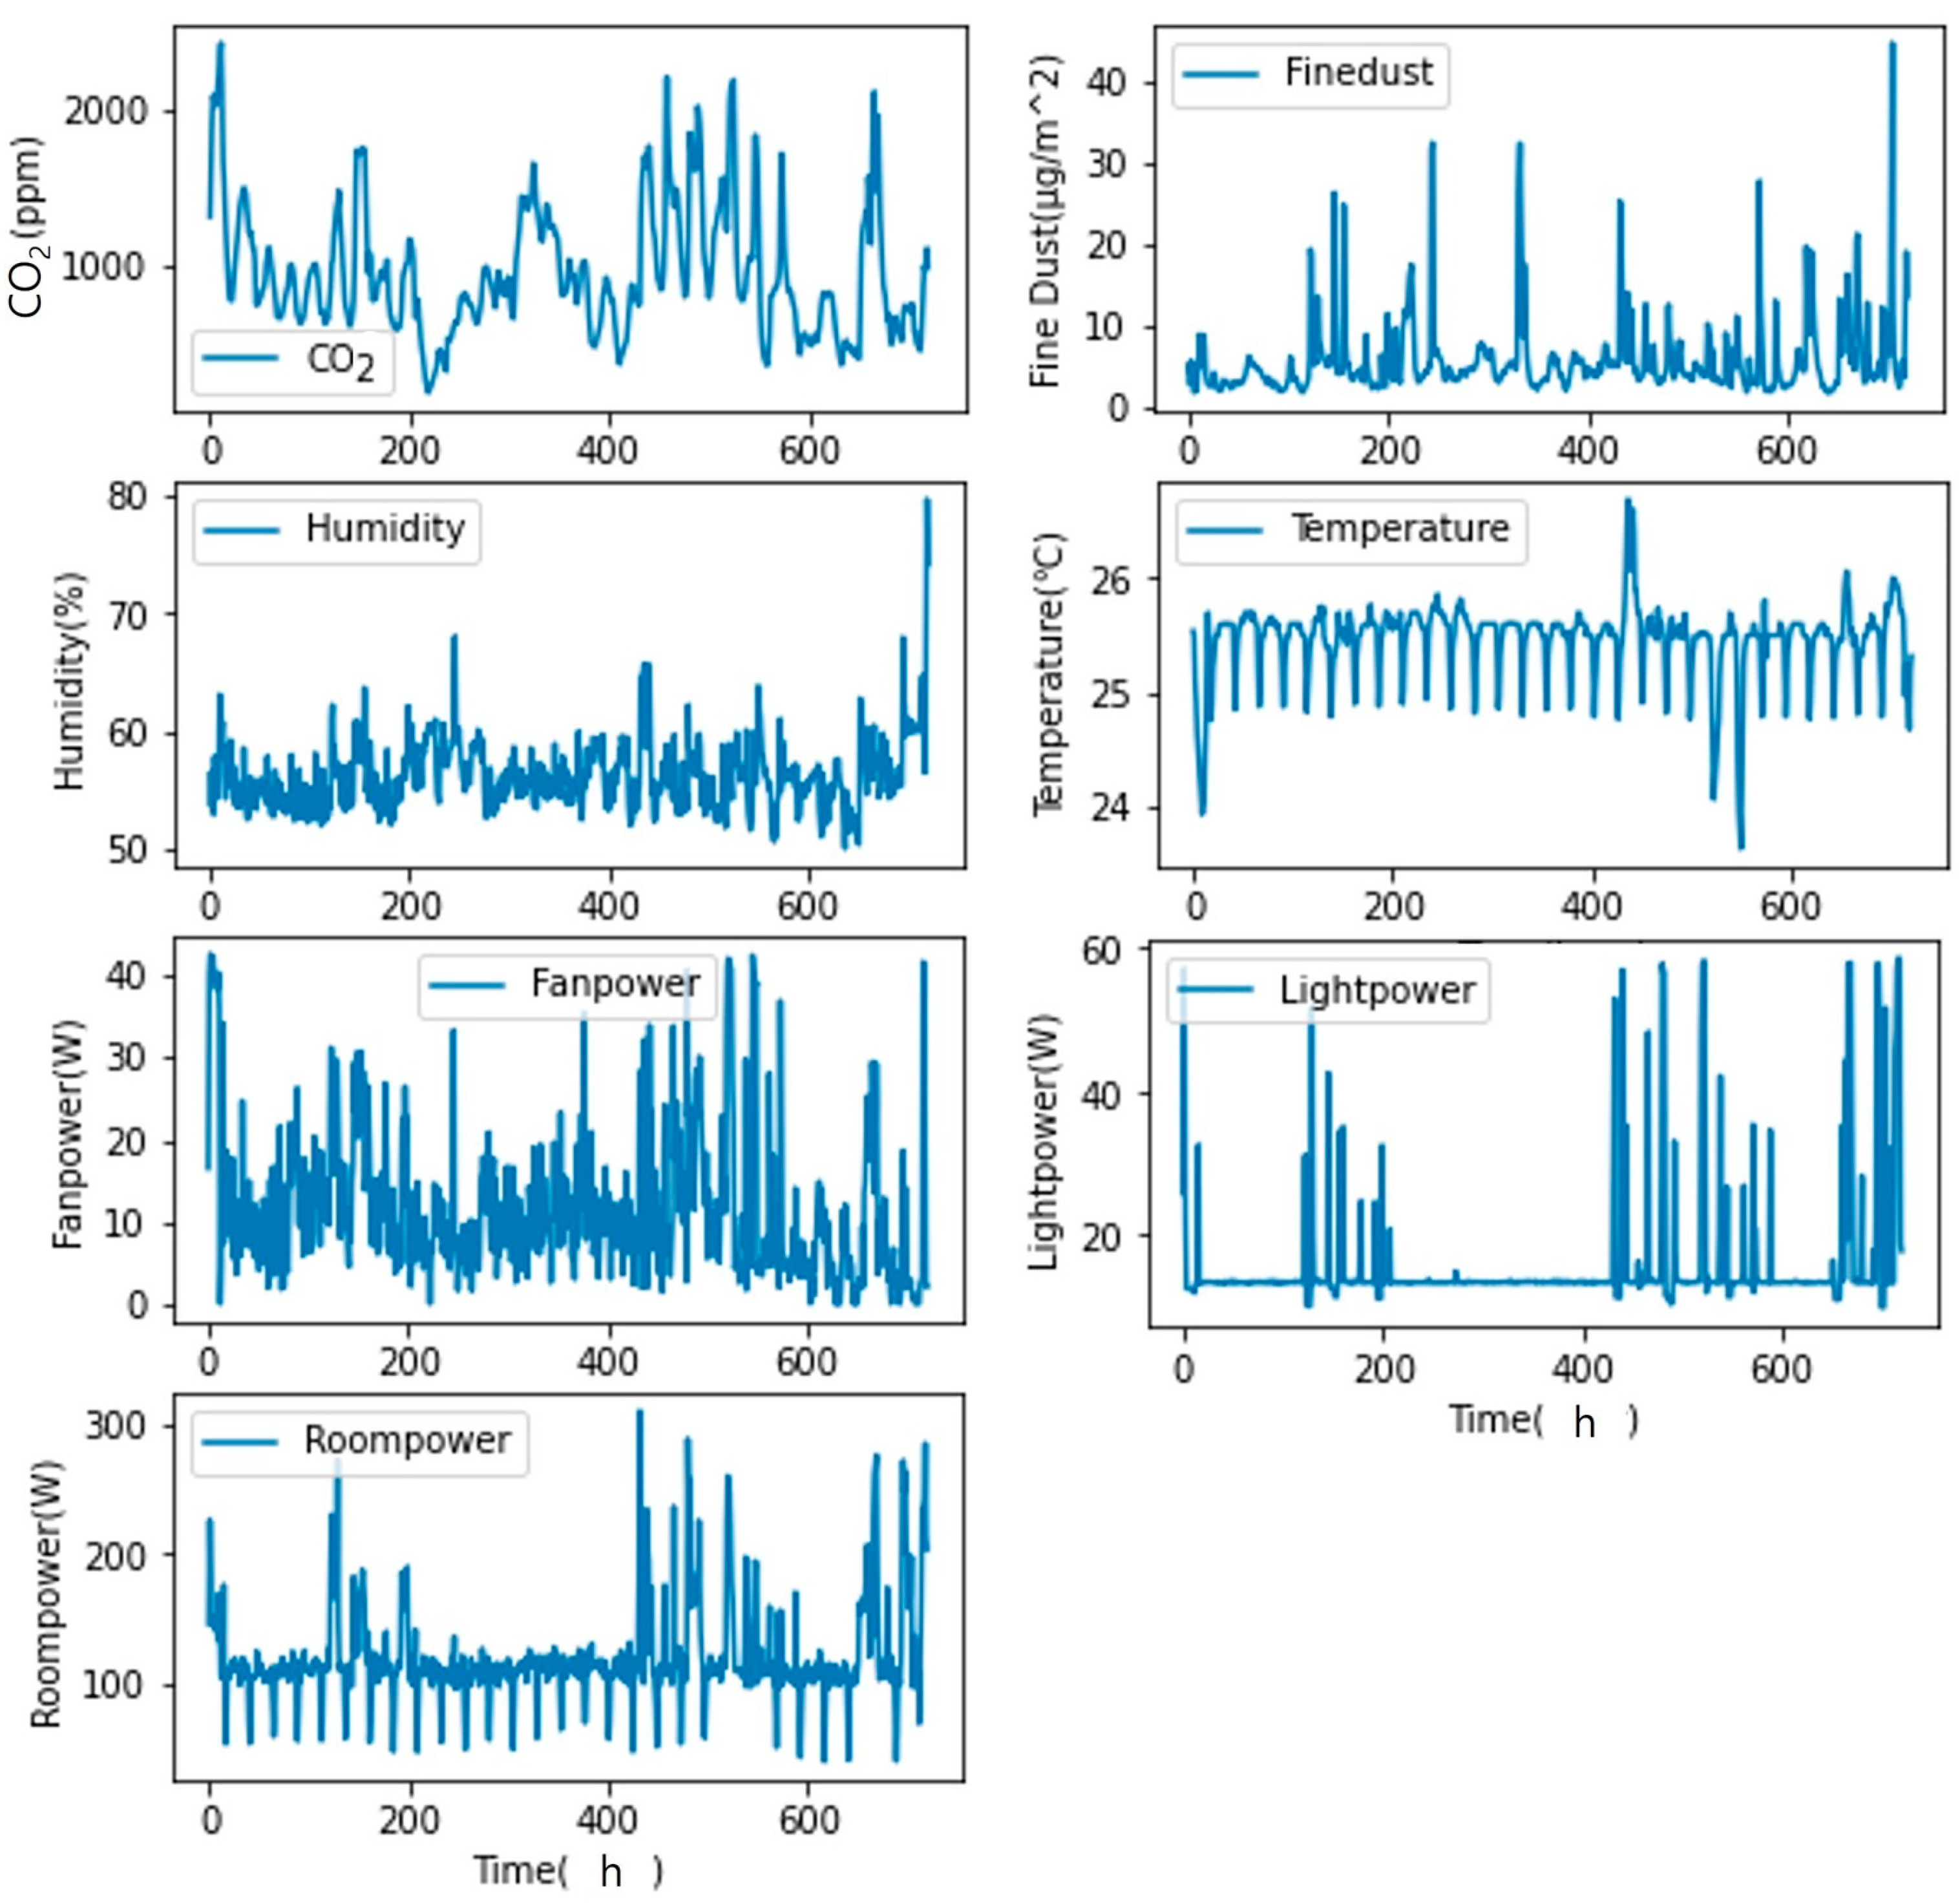
5.1. Data Acquisition
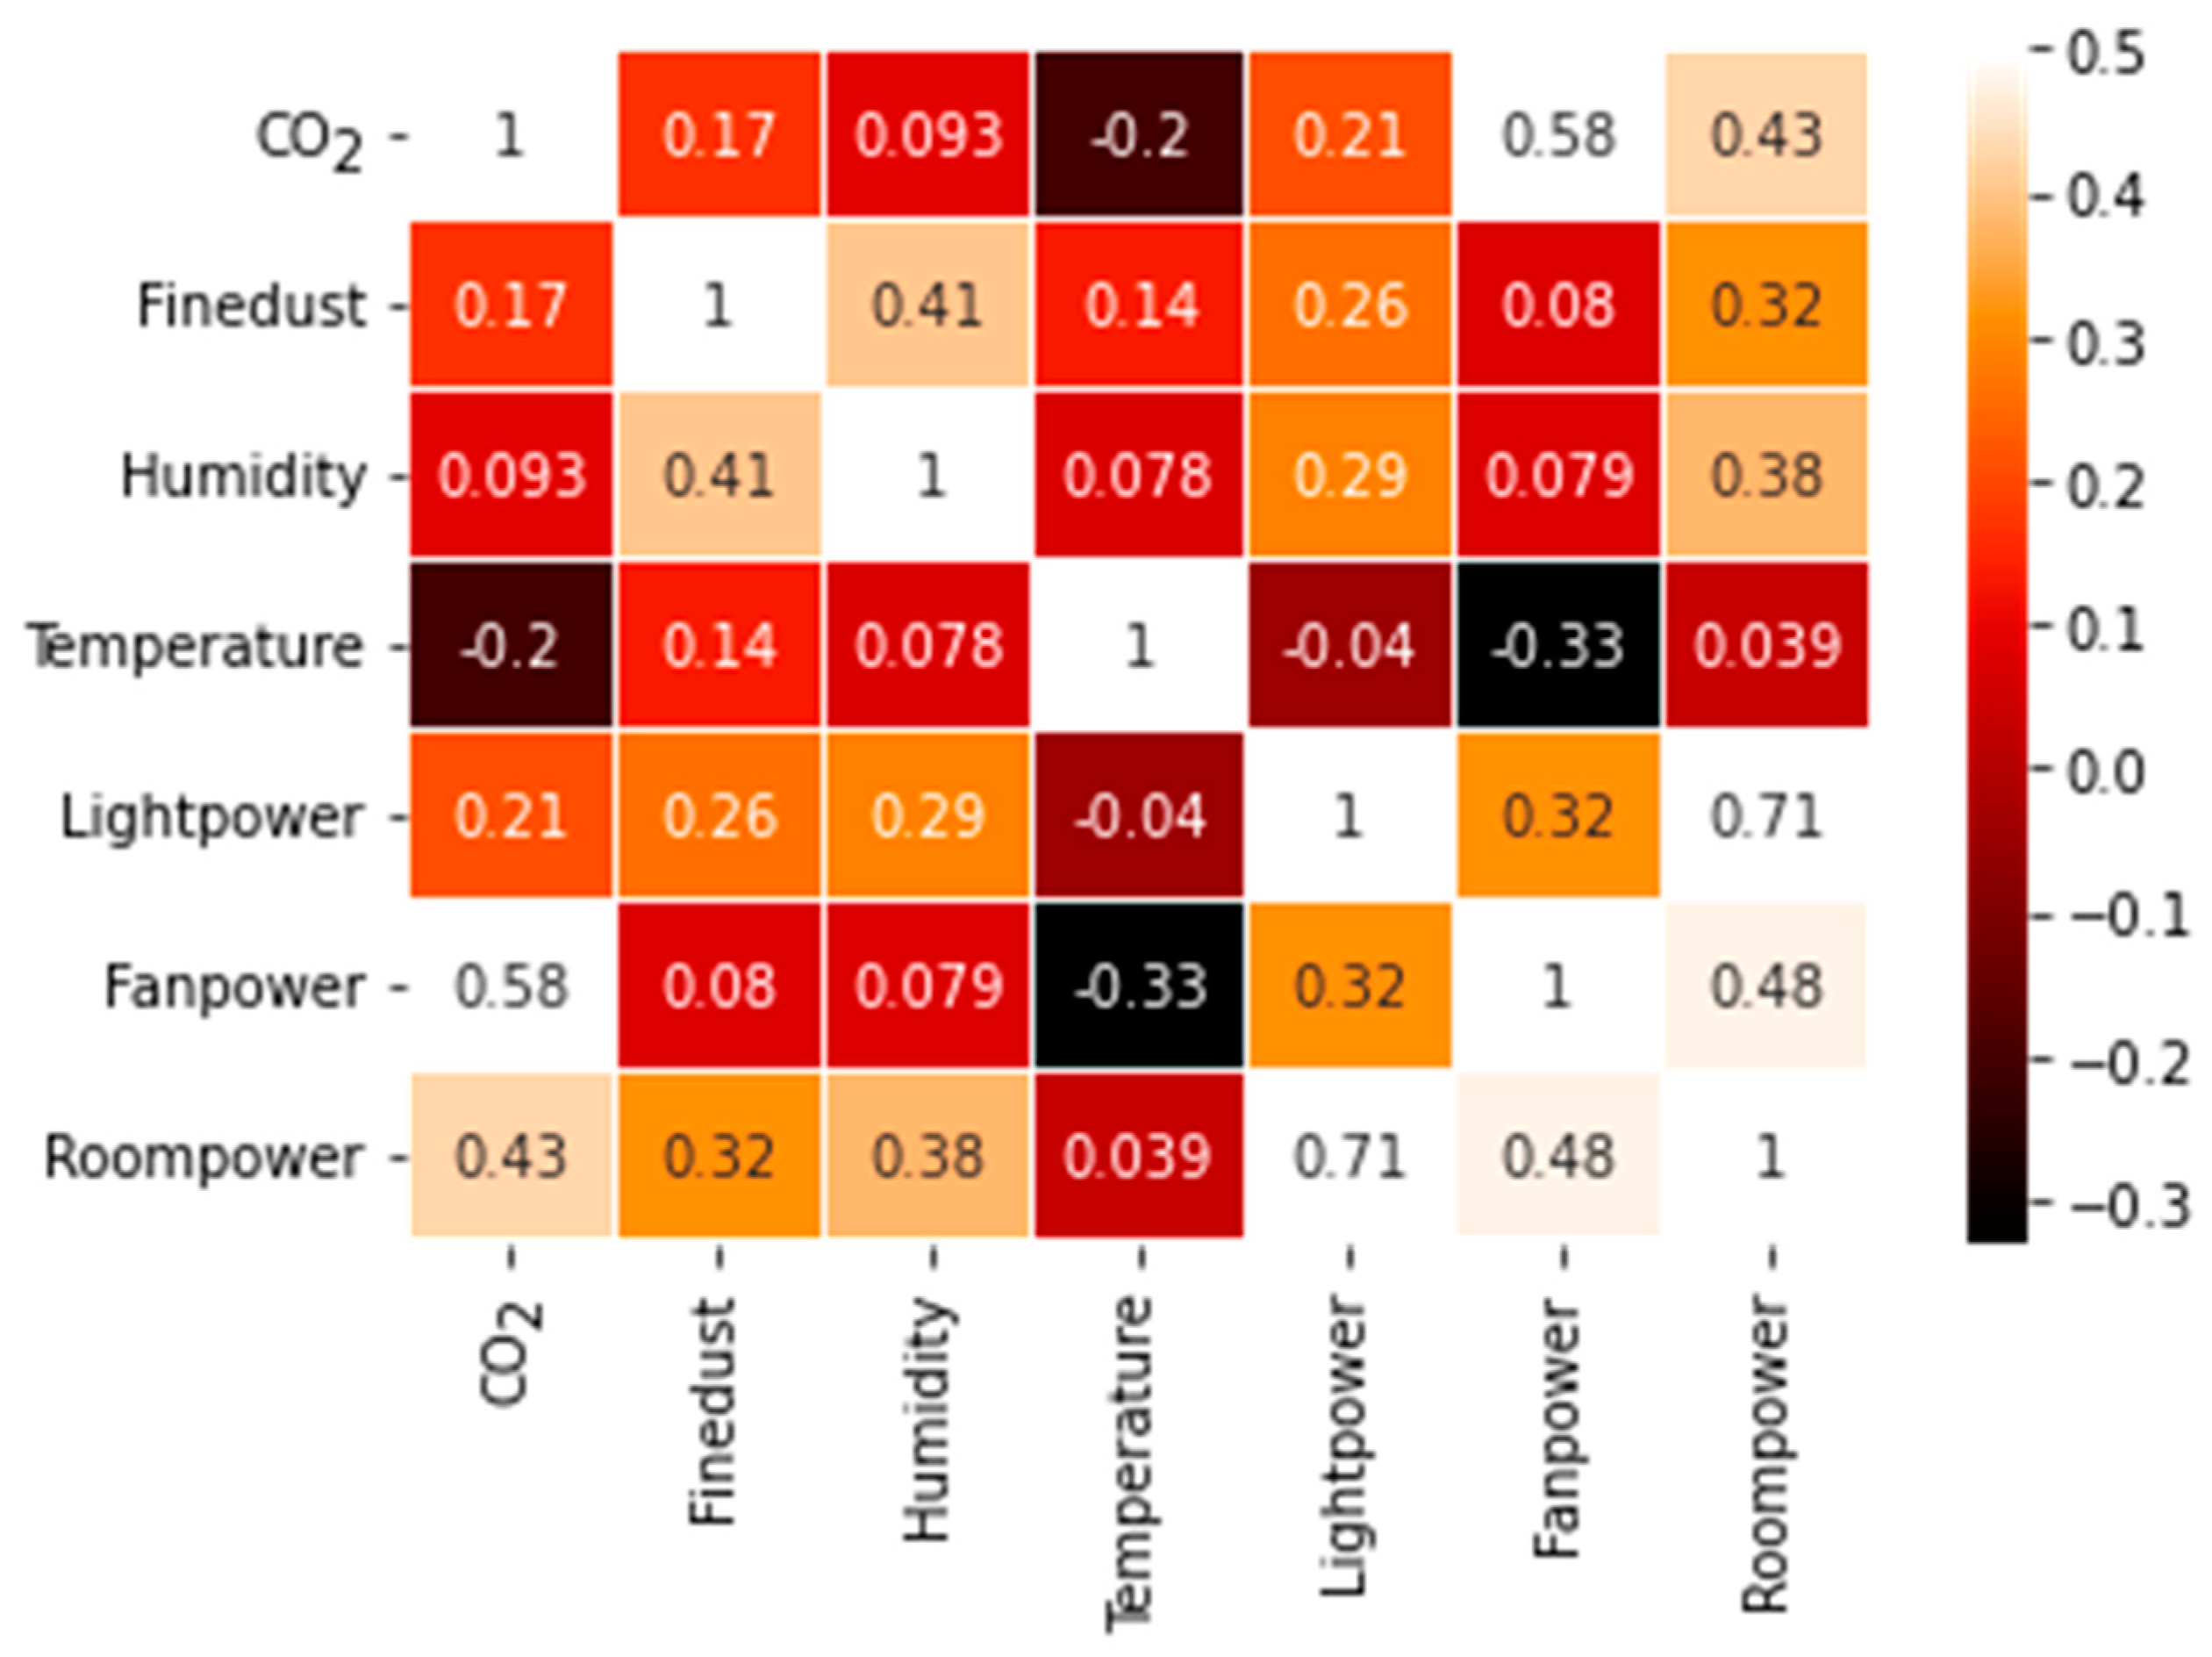
5.2. Data Relevance Analysis
5.3. Data Classification
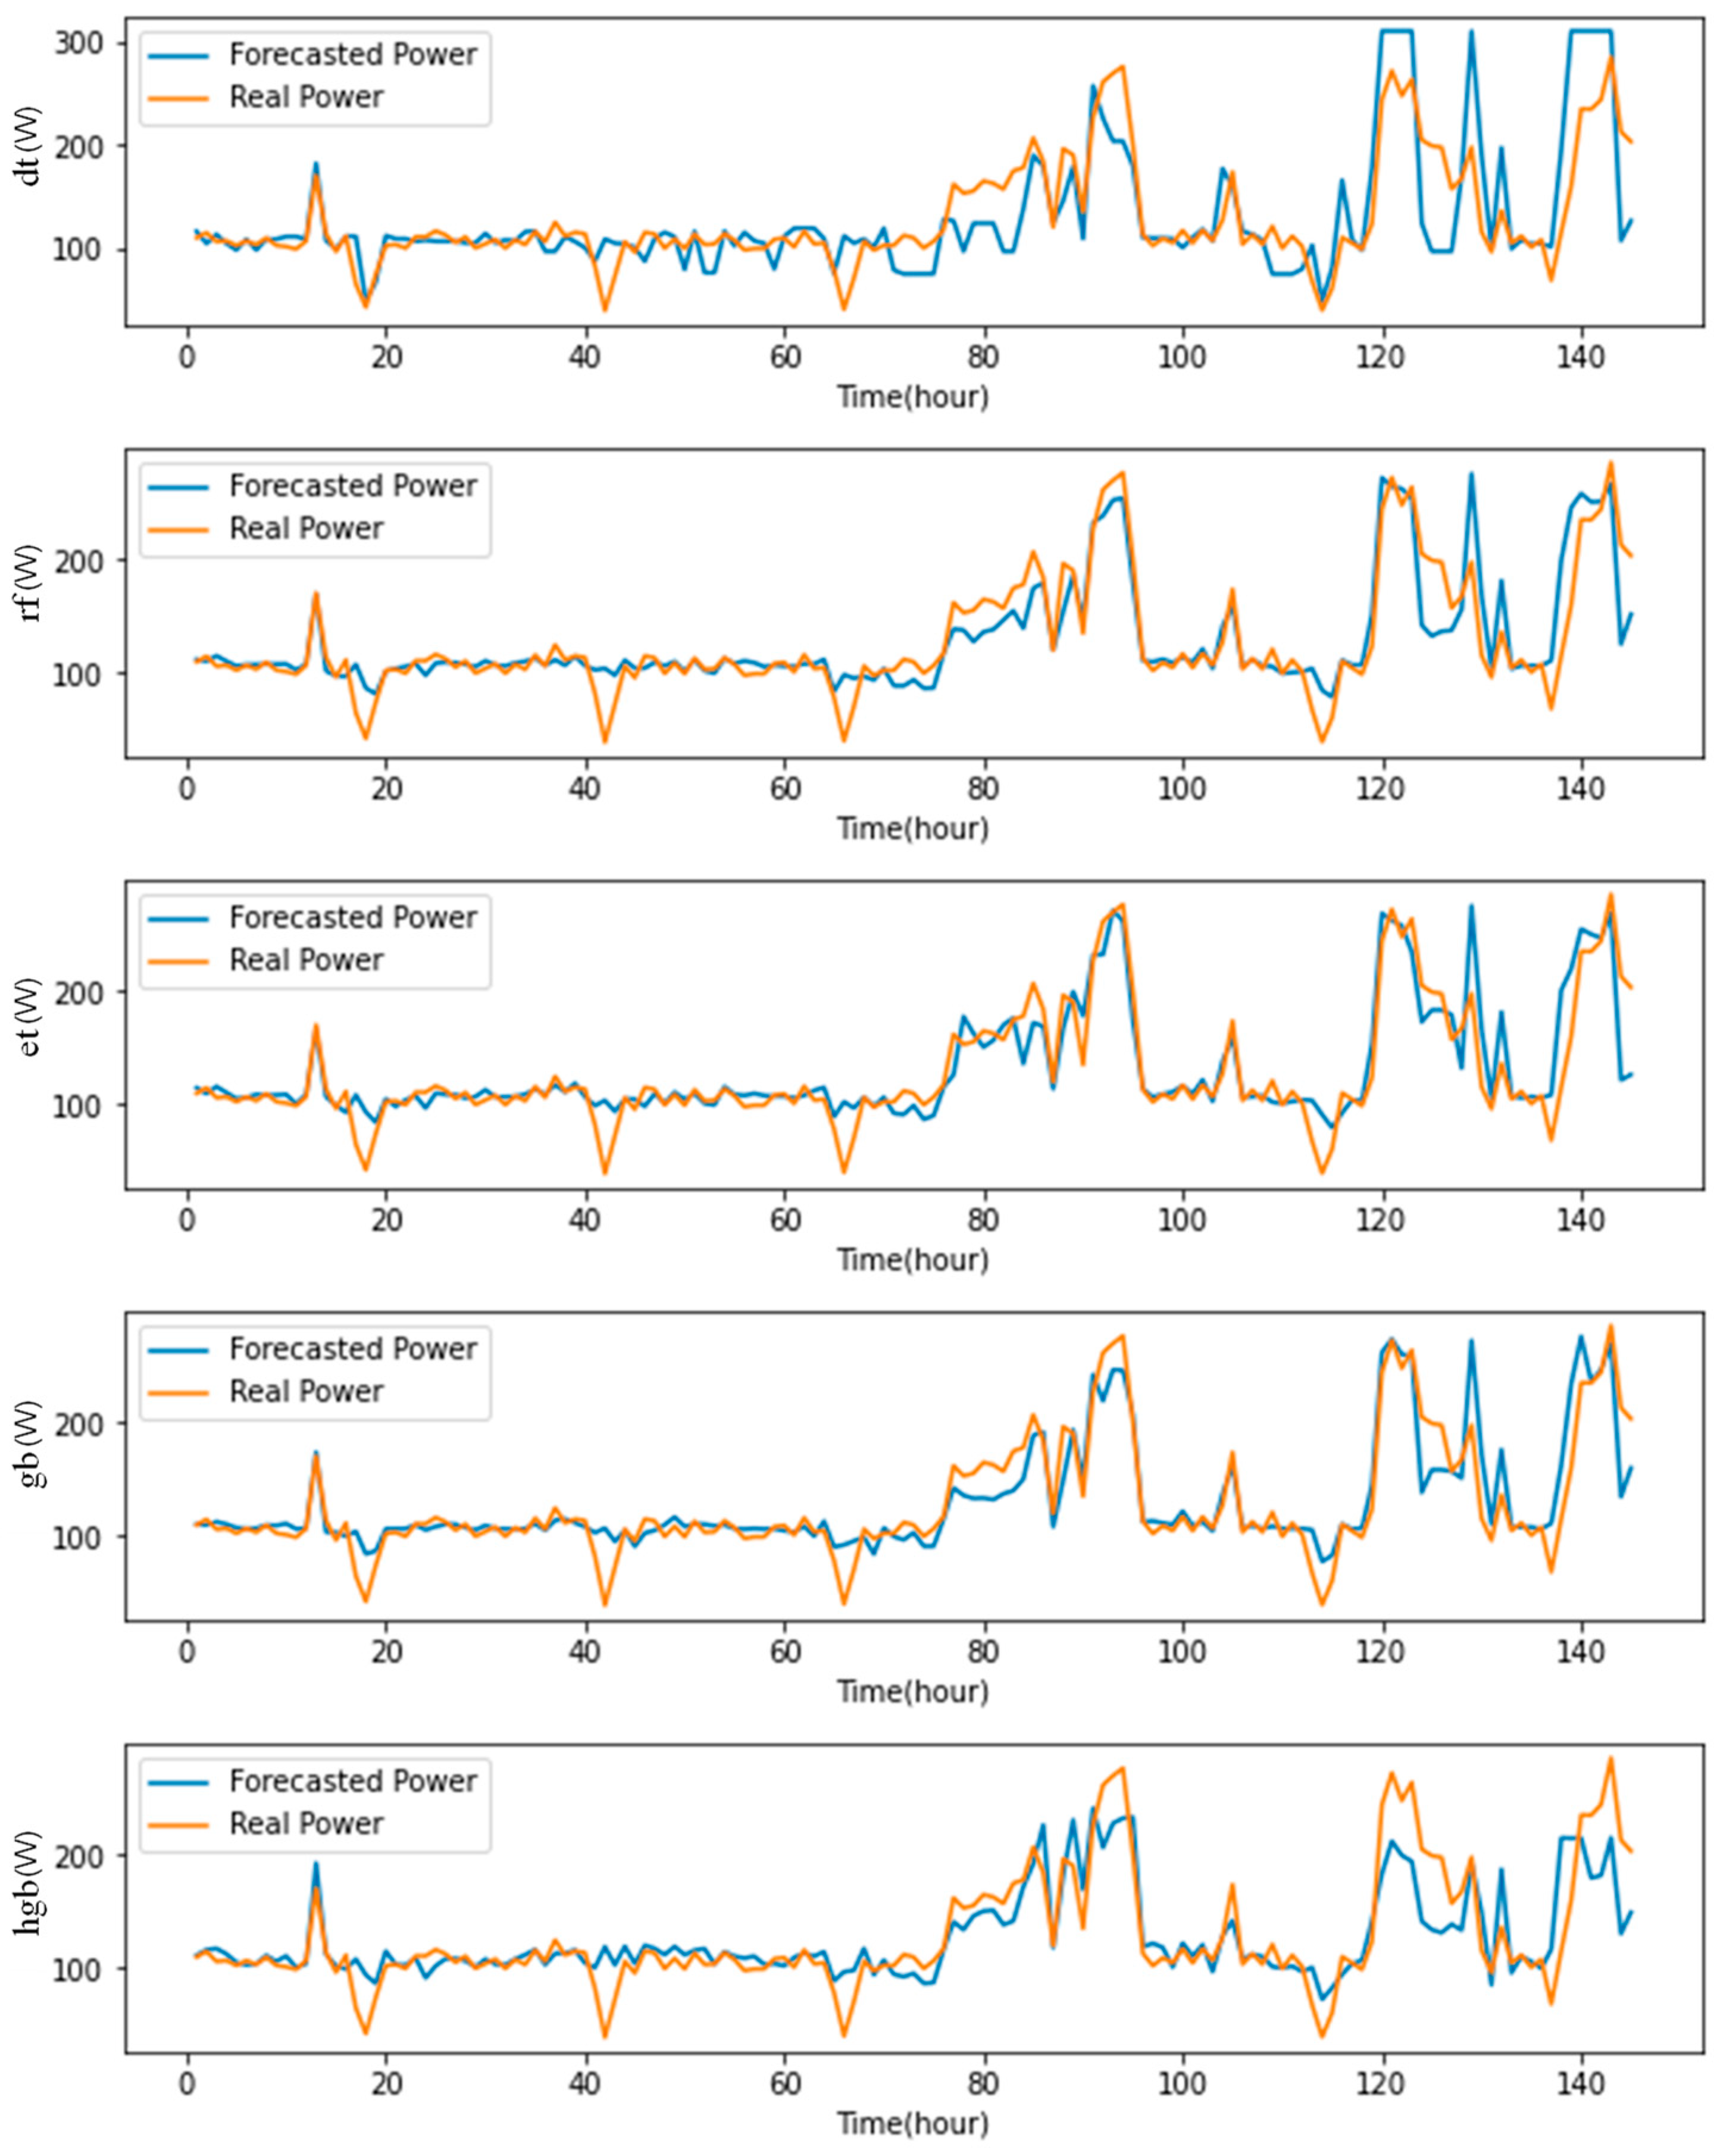
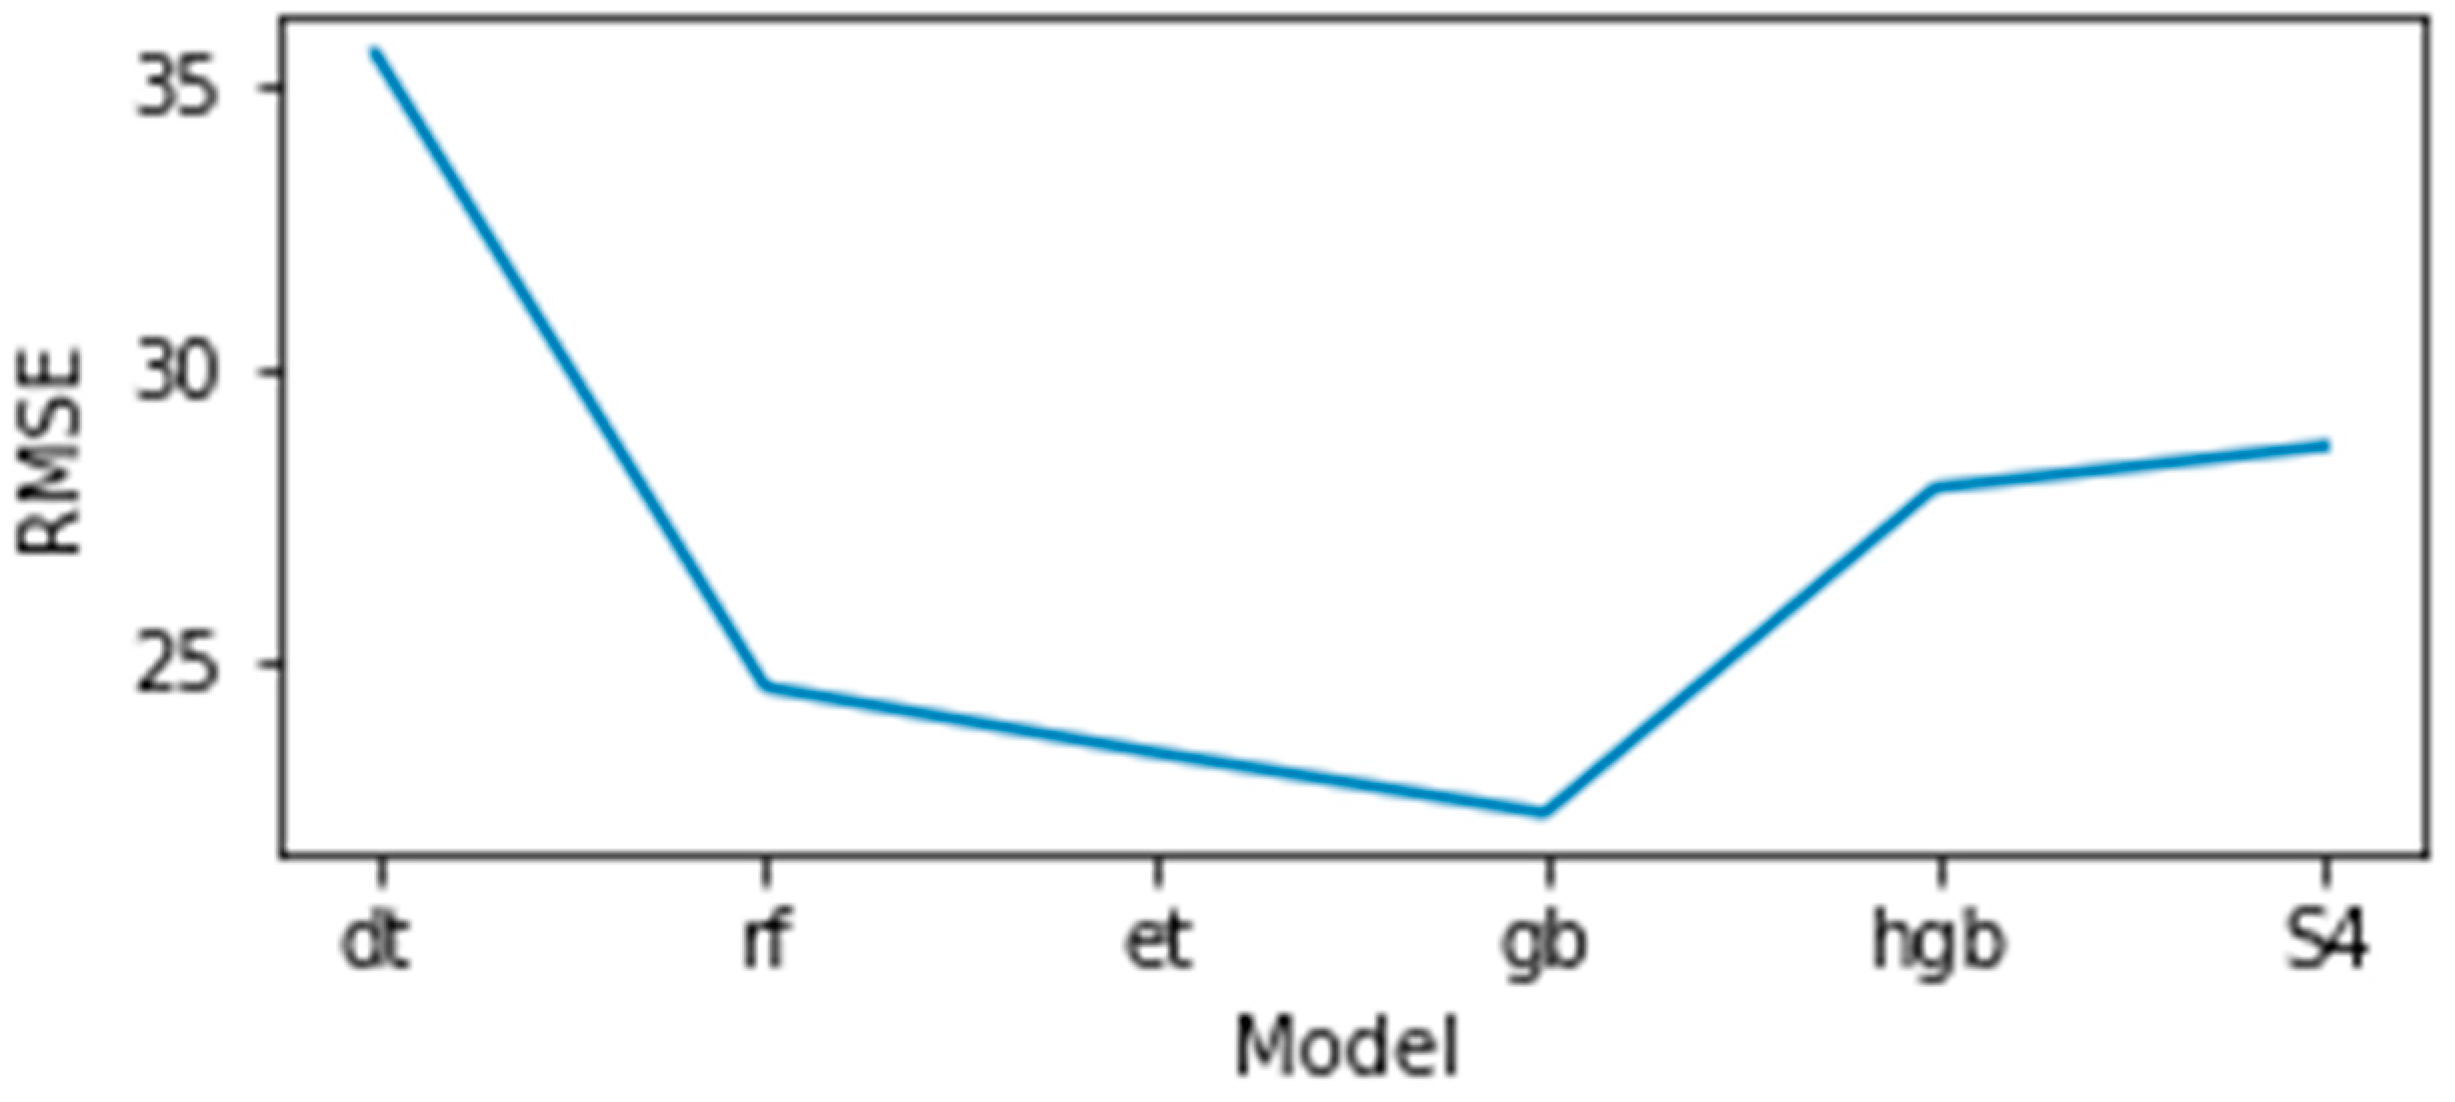
5.4. Model Development
- Decision Tree Regressor (dt)
- Random Forest Regressor (rf)
- Extra Trees Regressor (et)
- Gradient-Boosting Regressor (gb)
- Hist Gradient-Boosting Regressor (hgb)
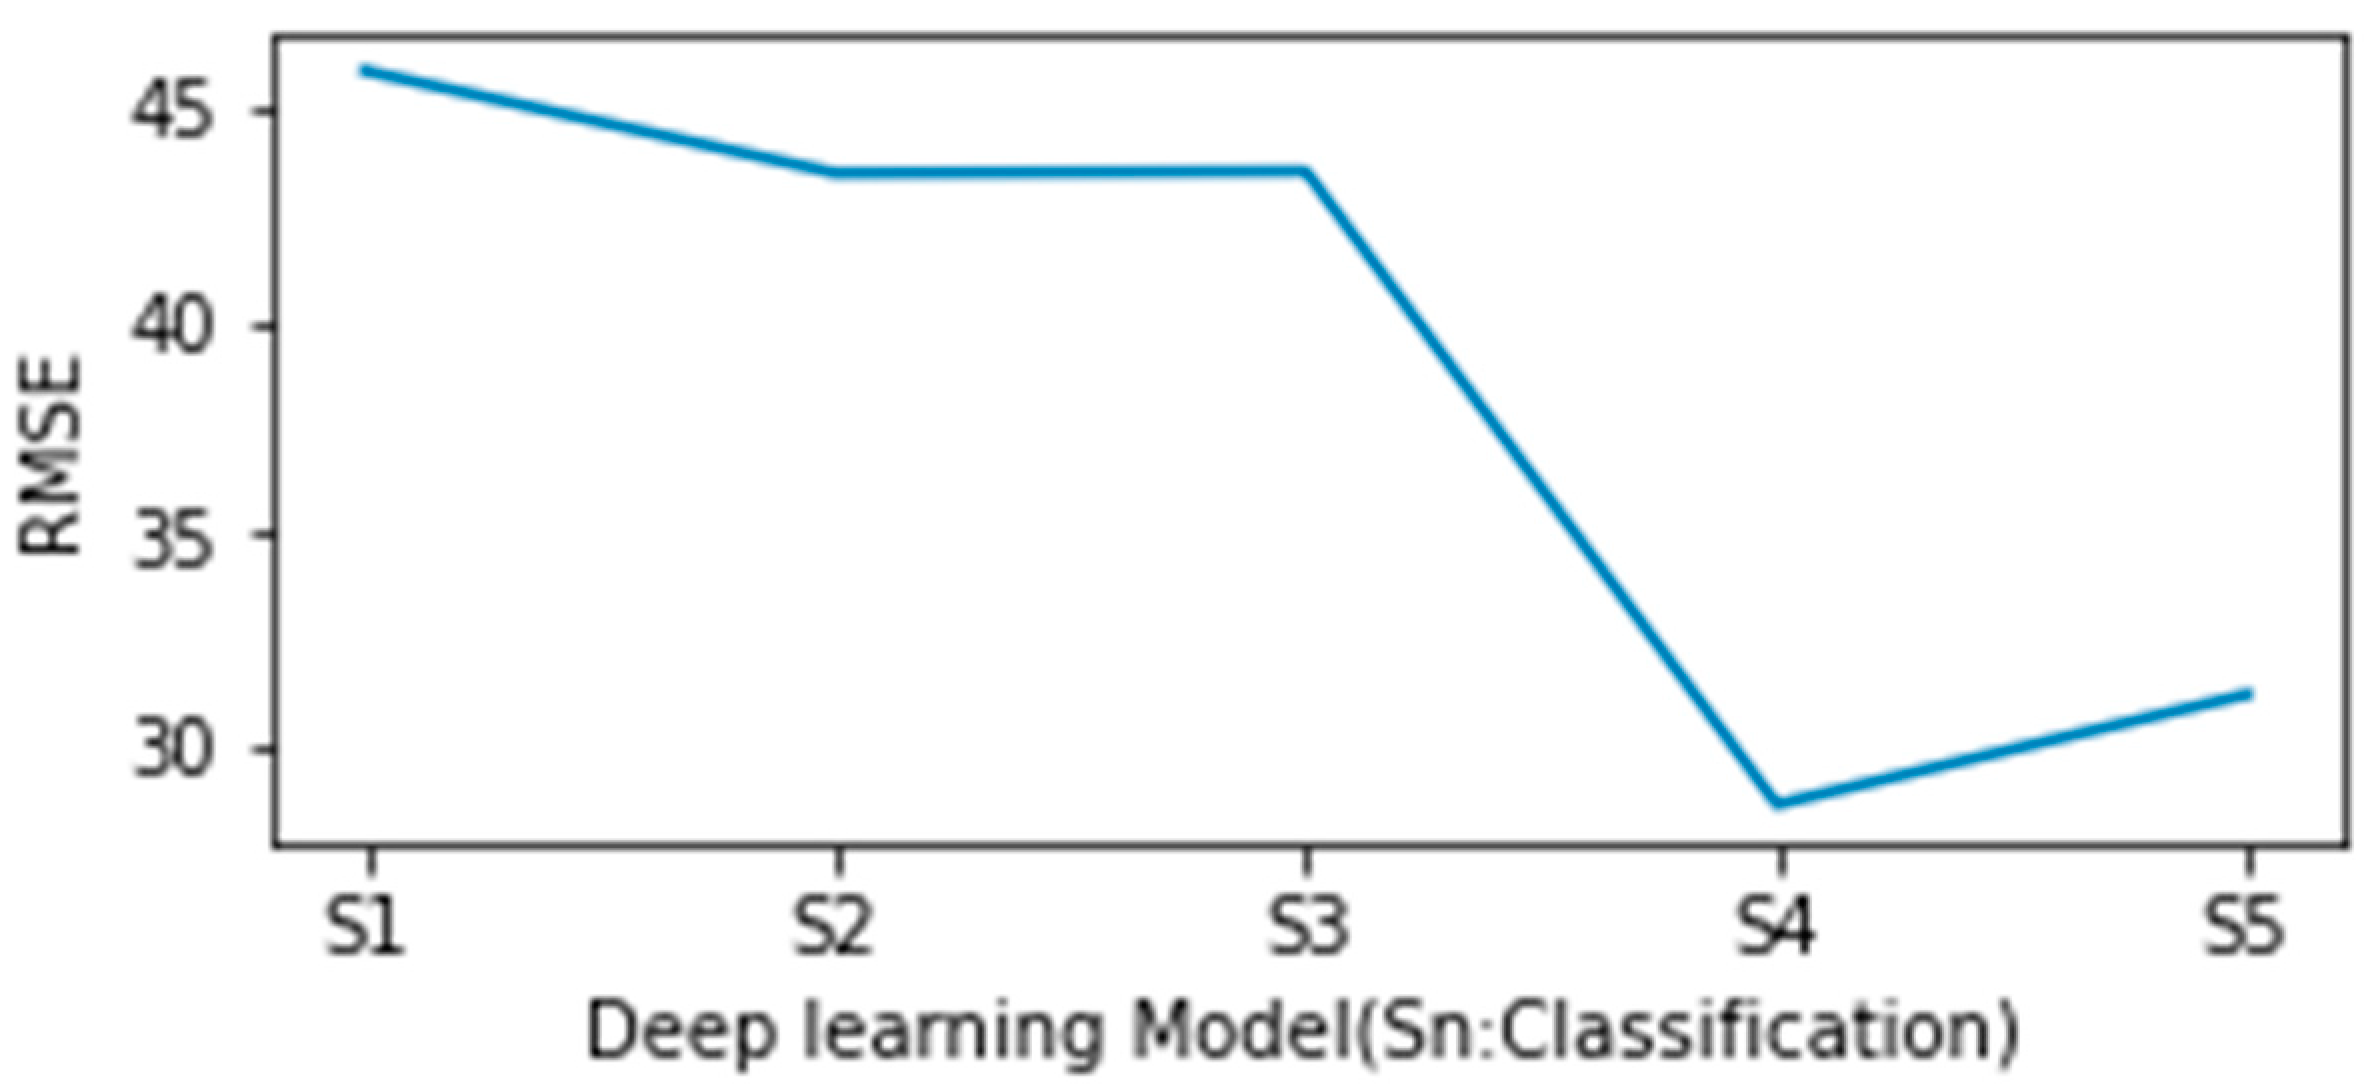
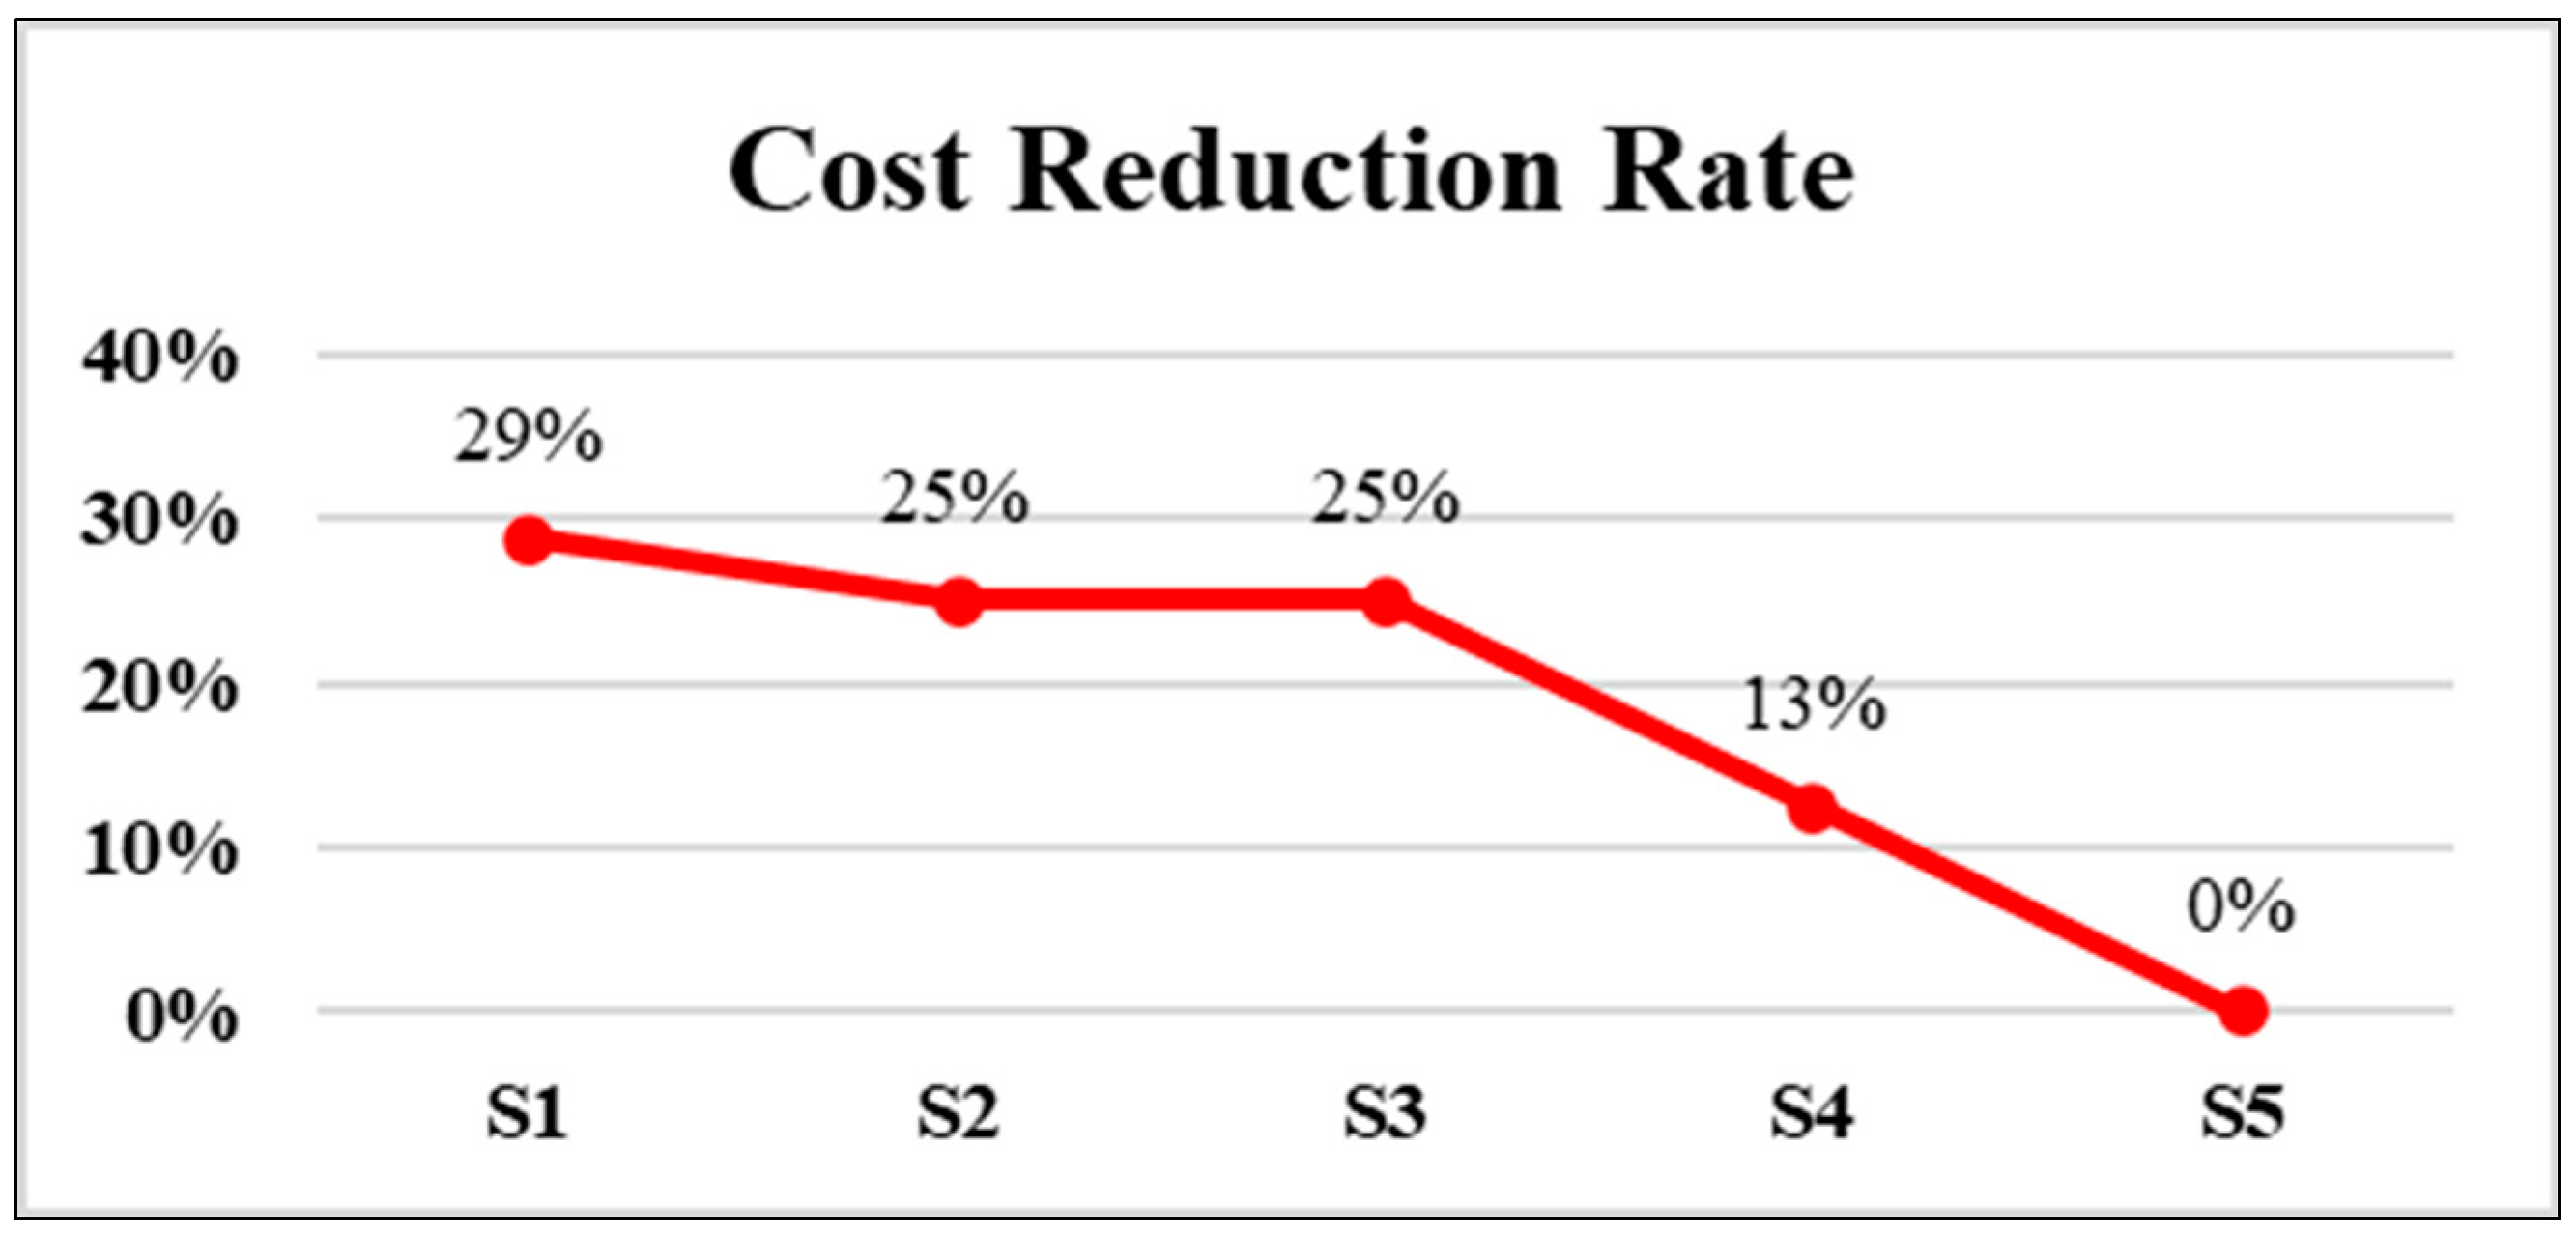
5.5. Scenarios
6. Conclusions
- Data-driven intelligent energy system: This proposed system provides an intelligent energy service based on data by installing inexpensive IoT devices in a smart home. It moves away from the existing schedule-based equipment control method and analyzes future energy usage based on AI-based predicted power energy data to compare with the present.
- High scalability of IoT system: This proposed system removes duplicate IoT devices installed in a smart home, resulting in a structure that can achieve greater efficiency in larger spaces than in smaller ones.
- High performance of model and cost-effective system construction: This system removes IoT sensors that have no correlation by collecting environmental data from IoT devices installed in a smart home and analyzing the correlation of the collected data. This can increase the performance of AI models and reduce the price of IoT systems.
Funding
Data Availability Statement
Conflicts of Interest
References
- Orfanos, V.A.; Kaminaris, S.D.; Papageorgas, P.; Piromalis, D.; Kandris, D. A Comprehensive Review of IoT Networking Technologies for Smart Home Automation Applications. J. Sens. Actuator Netw. 2023, 12, 30. [Google Scholar] [CrossRef]
- Mazhar, T.; Irfan, H.M.; Haq, I.; Ullah, I.; Ashraf, M.; Shloul, T.A.; Ghadi, Y.Y.; Imran; Elkamchouchi, D.H. Analysis of Challenges and Solutions of IoT in Smart Grids Using AI and Machine Learning Techniques: A Review. Electronics 2023, 12, 242. [Google Scholar] [CrossRef]
- Hussin, S.F.; Abdollah, M.F.; Ahmad, I.B. Acceptance of IoT Technology for Smart Homes: A Systematic Literature Review. In International Conference on Information Systems and Intelligent Applications; Springer: Cham, Switzerland, 2022; pp. 187–202. [Google Scholar]
- Park, S. Machine Learning-Based Smart Home Data Analysis and Forecasting Method. In Proceedings of the 2023 IEEE International Conference on Consumer Electronics (ICCE), Las Vegas, NV, USA, 6–8 January 2023; pp. 1–2. [Google Scholar]
- Kaur, B.; Dadkhah, S.; Shoeleh, F.; Neto, E.C.P.; Xiong, P.; Iqbal, S.; Lamontagne, P.; Ray, S.; Ghorbani, A.A. Internet of things (IoT) security dataset evolution: Challenges and future directions. Internet Things 2023, 22, 100780. [Google Scholar] [CrossRef]
- Almusaed, A.; Yitmen, I.; Almssad, A. Enhancing Smart Home Design with AI Models: A Case Study of Living Spaces Implementation Review. Energies 2023, 16, 2636. [Google Scholar] [CrossRef]
- Kang, J.; Kim, J.; Kim, M.; Sohn, M. Machine learning-based energy-saving framework for environmental states-adaptive wireless sensor network. IEEE Access 2020, 8, 69359–69367. [Google Scholar] [CrossRef]
- Machorro-Cano, I.; Alor-Hernández, G.; Paredes-Valverde, M.A.; Rodríguez-Mazahua, L.; Sánchez-Cervantes, J.L.; Olmedo-Aguirre, J.O. HEMS-IoT: A big data and machine learning-based smart home system for energy saving. Energies 2020, 13, 1097. [Google Scholar] [CrossRef]
- Wang, S.; Yang, S. Research on Smart Home Assistance Control Model Based on Machine Learning. In Proceedings of the 2020 Asia-Pacific Conference on Image Processing, Electronics and Computers (IPEC), Dalian, China, 14–16 April 2020; pp. 466–469. [Google Scholar]
- Filipe, L.; Peres, R.S.; Tavares, R.M. Voice-activated smart home controller using machine learning. IEEE Access 2021, 9, 66852–66863. [Google Scholar] [CrossRef]
- Jmila, H.; Blanc, G.; Shahid, M.R.; Lazrag, M. A survey of smart home iot device classification using machine learning-based network traffic analysis. IEEE Access 2022, 10, 97117–97141. [Google Scholar] [CrossRef]
- Huang, J.; Koroteev, D.D.; Rynkovskaya, M. Machine learning-based demand response in PV-based smart home considering energy management in digital twin. Sol. Energy 2023, 252, 8–19. [Google Scholar] [CrossRef]
- Kabir, M.H.; Hoque, M.R.; Seo, H.; Yang, S.-H. Machine learning based adaptive context-aware system for smart home environment. Int. J. Smart Home 2015, 9, 55–62. [Google Scholar] [CrossRef]
- Lee, S.; Choi, D.-H. Reinforcement learning-based energy management of smart home with rooftop solar photovoltaic system, energy storage system, and home appliances. Sensors 2019, 19, 3937. [Google Scholar] [CrossRef] [PubMed]
- Li, T.; Hong, Z.; Yu, L. Machine learning-based intrusion detection for iot devices in smart home. In Proceedings of the 2020 IEEE 16th International Conference on Control & Automation (ICCA), Sapporo, Japan, 9–11 October 2020; pp. 277–282. [Google Scholar]
- Kasaraneni, P.P.; Venkata Pavan Kumar, Y.; Moganti, G.L.K.; Kannan, R. Machine Learning-Based Ensemble Classifiers for Anomaly Handling in Smart Home Energy Consumption Data. Sensors 2022, 22, 9323. [Google Scholar] [CrossRef] [PubMed]
- Popa, D.; Pop, F.; Serbanescu, C.; Castiglione, A. Deep learning model for home automation and energy reduction in a smart home environment platform. Neural Comput. Appl. 2019, 31, 1317–1337. [Google Scholar] [CrossRef]
- Dey, N.; Fong, S.; Song, W.; Cho, K. Forecasting energy consumption from smart home sensor network by deep learning. In Proceedings of the Smart Trends in Information Technology and Computer Communications: Second International Conference, SmartCom 2017, Pune, India, 18–19 August 2017; Revised Selected Papers 2. pp. 255–265. [Google Scholar]
- Rahman, S.; Alam, M.G.R.; Rahman, M.M. Deep learning based ensemble method for household energy demand forecasting of smart home. In Proceedings of the 2019 22nd International Conference on Computer and Information Technology (ICCIT), Dhaka, Bangladesh, 18–20 December 2019; pp. 1–6. [Google Scholar]
- Uddin, M.Z.; Kim, M.R. A deep learning-based gait posture recognition from depth information for smart home applications. In Advances in Computer Science and Ubiquitous Computing: CSA-CUTE2016 8; Springer: Singapore; pp. 407–413.
- Sundaravadivel, P.; Kesavan, K.; Kesavan, L.; Mohanty, S.P.; Kougianos, E. Smart-log: A deep-learning based automated nutrition monitoring system in the iot. IEEE Trans. Consum. Electron. 2018, 64, 390–398. [Google Scholar] [CrossRef]
- Solatidehkordi, Z.; Ramesh, J.; Al-Ali, A.; Osman, A.; Shaaban, M. An IoT deep learning-based home appliances management and classification system. Energy Rep. 2023, 9, 503–509. [Google Scholar] [CrossRef]
- Xu, M.; Watanachaturaporn, P.; Varshney, P.K.; Arora, M.K. Decision tree regression for soft classification of remote sensing data. Remote Sens. Environ. 2005, 97, 322–336. [Google Scholar] [CrossRef]
- El Mrabet, Z.; Sugunaraj, N.; Ranganathan, P.; Abhyankar, S. Random forest regressor-based approach for detecting fault location and duration in power systems. Sensors 2022, 22, 458. [Google Scholar] [CrossRef] [PubMed]
- Breiman, L. Random forests. Mach. Learn. 2001, 45, 5–32. [Google Scholar] [CrossRef]
- John, V.; Liu, Z.; Guo, C.; Mita, S.; Kidono, K. Real-time lane estimation using deep features and extra trees regression. In Proceedings of the Image and Video Technology: 7th Pacific-Rim Symposium, PSIVT 2015, Auckland, New Zealand, 25–27 November 2015; Revised Selected Papers 7. pp. 721–733. [Google Scholar]
- Mukaka, M.M. A guide to appropriate use of correlation coefficient in medical research. Malawi Med. J. 2012, 24, 69–71. [Google Scholar] [PubMed]


| Author(s) | Publication Date | Application Field | Similarity | ||||||
|---|---|---|---|---|---|---|---|---|---|
| AI | IoT | Smart Home | Energy Management | Health Care | Security | Cost-Effective System Design | |||
| Machorro-Cano, et al. [8] | 2020 | √ | √ | √ | √ | 75% | |||
| Wang, et al. [9] | 2020 | √ | √ | √ | 50% | ||||
| Filipe, et al. [10] | 2021 | √ | √ | √ | 60% | ||||
| Jmila, et al. [11] | 2022 | √ | √ | √ | √ | 30% | |||
| Huang, et al. [12] | 2023 | √ | √ | √ | √ | 60% | |||
| Kabir, et al. [13] | 2015 | √ | √ | √ | √ | 55% | |||
| Lee, et al. [14] | 2019 | √ | √ | √ | √ | 60% | |||
| Li, et al. [15] | 2020 | √ | √ | √ | √ | 40% | |||
| Kasaraneni, et al. [16] | 2022 | √ | √ | √ | √ | √ | 40% | ||
| Popa, et al. [17] | 2019 | √ | √ | √ | √ | 65% | |||
| Dey, et al. [18] | 2017 | √ | √ | √ | √ | 70% | |||
| Rahman, et al. [19] | 2019 | √ | √ | √ | √ | 75% | |||
| Uddin, et al. [20] | 2017 | √ | √ | √ | √ | 50% | |||
| Sundaravadivel, et al. [21] | 2018 | √ | √ | √ | √ | 40% | |||
| Solatidehkordi, et al. [22] | 2023 | √ | √ | √ | √ | 65% | |||
| Proposed System | √ | √ | √ | √ | √ | - | |||
| Items | Characteristics | Uses | |
|---|---|---|---|
 | Temperature and humidity sensor |
| Collecting indoor temperature/humidity data |
 | Fine dust/ CO2 sensor |
| Collecting indoor CO2, fine dust data |
 | Smart motion sensor |
| Indoor user movement detection |
 | Smart submeter |
| Measure the room’s power utilization |
| Index | CO2 (ppm) | Fine Dust (µg/m2) | Humidity (%) | Temperature (°C) | Light Power (W) | Fan Power (W) | Room Power (W) |
|---|---|---|---|---|---|---|---|
| Count | 721 | 721 | 721 | 721 | 721 | 721 | 721 |
| Mean | 947.2059 | 5.836186 | 56.14233 | 25.46187 | 15.7639 | 11.62537 | 119.0838 |
| Std | 420.4869 | 4.574005 | 2.96905 | 0.331475 | 8.86753 | 8.814615 | 37.96945 |
| Min | 168.15 | 1.92 | 50.03 | 23.64 | 9.87 | 0.12 | 38.99 |
| 25% | 655.91 | 3.35 | 54.17 | 25.44 | 13.35 | 5.72 | 104.67 |
| 50% | 839.03 | 4.5 | 55.7 | 25.54 | 13.41 | 9.55 | 111.03 |
| 75% | 1186.46 | 6.26 | 57.62 | 25.6 | 13.49 | 14.95 | 119.76 |
| Max | 2441.44 | 44.88 | 79.69 | 26.69 | 58.75 | 42.62 | 311.35 |
| Range | Meaning |
|---|---|
| From −1.0 to −0.7 | Strong negative linear relationship |
| From −0.7 to −0.3 | Distinct negative linear relationship |
| From −0.3 to −0.1 | Weak negative linear relationship |
| From −0.1 to +0.1 | A linear relationship that can be almost neglected |
| From +0.1 to +0.3 | Weak positive linear relationship |
| From +0.3 to +0.7 | Clear positive linear relationship |
| From +0.7 to +1.0 | Strong positive linear relationship |
| Classifications | S1 | S2 | S3 | S4 | S5 |
|---|---|---|---|---|---|
| RMSE | 45.83 | 43.43 | 43.48 | 28.68 | 31.25 |
| Classifications | Sensor List |
|---|---|
| S1 | CO2, Fine Dust |
| S2 | S1 + Humidity |
| S3 | S2 + Temperature |
| S4 | S3 + Light Power |
| S5 | S4 + Fan Power |
| Classifications | Machine Learning Model |
|---|---|
| dt | Decision Tree Regressor |
| rf | Random Forest Regressor |
| et | Extra Trees Regressor |
| gb | Gradient-Boosting Regressor |
| hgb | Hist Gradient-Boosting Regressor |
| Classifications | dt | rf | et | gb | hgb | S4 |
|---|---|---|---|---|---|---|
| RMSE | 35.50 | 24.48 | 23.35 | 22.29 | 27.95 | 28.68 |
Disclaimer/Publisher’s Note: The statements, opinions and data contained in all publications are solely those of the individual author(s) and contributor(s) and not of MDPI and/or the editor(s). MDPI and/or the editor(s) disclaim responsibility for any injury to people or property resulting from any ideas, methods, instructions or products referred to in the content. |
© 2023 by the author. Licensee MDPI, Basel, Switzerland. This article is an open access article distributed under the terms and conditions of the Creative Commons Attribution (CC BY) license (https://creativecommons.org/licenses/by/4.0/).
Share and Cite
Park, S. Machine Learning-Based Cost-Effective Smart Home Data Analysis and Forecasting for Energy Saving. Buildings 2023, 13, 2397. https://doi.org/10.3390/buildings13092397
Park S. Machine Learning-Based Cost-Effective Smart Home Data Analysis and Forecasting for Energy Saving. Buildings. 2023; 13(9):2397. https://doi.org/10.3390/buildings13092397
Chicago/Turabian StylePark, Sanguk. 2023. "Machine Learning-Based Cost-Effective Smart Home Data Analysis and Forecasting for Energy Saving" Buildings 13, no. 9: 2397. https://doi.org/10.3390/buildings13092397
APA StylePark, S. (2023). Machine Learning-Based Cost-Effective Smart Home Data Analysis and Forecasting for Energy Saving. Buildings, 13(9), 2397. https://doi.org/10.3390/buildings13092397