Abstract
This study evaluates the vibration data of high-rise buildings during a typhoon by measuring the vibration data and using international serviceability standards. In order to do this, the horizontal vibration serviceability evaluation standards of each country were surveyed, but the standards that could be applied were limited to ISO10137 and ISO 6897. Despite the trend that the discomfort of residents increases as the number of high-rise buildings increases, the current standards are for high-frequency vibrations, such as machine vibrations or vertical floor vibrations, so there is an urgent need for research on new evaluation methods for low-frequency horizontal vibrations. As a result of analyzing the effects of typhoons on buildings, the study’s target building had low natural frequencies of less than 1 Hz, and the highest acceleration was observed to be amplified up to about 160 times due to the effects of Typhoon Danas and Chaba, but there was no change in the natural frequency. When this result was applied to the horizontal vibration serviceability evaluation, it was found that the likelihood of residents perceiving vibration was low during constant vibration, but during strong winds, the size of the top-floor horizontal vibration exceeded the average level of vibration perception proposed by ISO standards, so most residents of high-rise buildings would be likely to perceive the vibration as uncomfortable.
1. Introduction
The structure and form of high-rise buildings are determined by the lateral resistance system caused by wind loads rather than earthquake loads. Earthquakes happen abruptly and rarely, whereas wind constantly and continuously affects the entire building. Additionally, earthquake loads generally only act in one direction, but wind loads affect the building in all directions, so the design and analysis of high-rise structures usually focus on wind loads rather than earthquake loads.
Furthermore, wind-induced vibrations causing serviceability problems in high-rise structures are more likely to become a social issue than structural collapse caused by wind. Many construction companies already use computer modeling in compliance with architectural laws and standards at the planning stage to simulate earthquakes or wind loads and consider ways to regularly maintain structural elements during the structural planning stage.
In addition, by using active control systems to detect wind loads and sensors and actuators to reduce the vibrations of a structure, the problem of structural collapse from wind loads can be sufficiently prevented. However, the prevention of collapse does not guarantee a building’s serviceability.
Humans are very sensitive to swaying and vibration. Generally, high-rise buildings are thought to have inherent vibration frequencies of 0.8–3 Hz, as reported [1,2]. This can vary depending on factors such as the building height, mass, stiffness, etc., but it is a unique vibration tendency of a building that is unaffected by external forces such as wind or earthquakes. Values of vibration that change due to external forces are generally measured in acceleration, typically as g-forces, in which 1 g means the acceleration due to Earth’s gravity. When the wind speed is high, the acceleration level of high-rise buildings is typically in the range of 0.01–0.1 g, and when an earthquake occurs, it can reach 0.5 g or more. Therefore, people in high-rise architectural structures that are always exposed to wind in the upper part of the building are constantly exposed to low-frequency vibrations.
Exposure to low-frequency vibrations for a certain period of time can have various negative effects on the human body [3]. These effects can be grouped into physiological effects, such as dizziness, nausea, and headache, and psychological effects, such as anxiety, depression, and loss of concentration [4,5,6]. Due to these considerations, it is essential to implement a vibration monitoring system in high-rise buildings, which consistently measures the acceleration of vibrations and periodically notifies the occupants, as indicated by various sources.
The standards for building vibration monitoring in South Korea are based on article 6 of the earthquake disaster countermeasures law (measurement of earthquake acceleration of key facilities, etc.). Monitoring sensors are installed and operated in large civil engineering structures (such as dams, reservoirs, and bridges), high-rise buildings, domestic government buildings, power plants, substations, gas facilities, and other structures that are highly susceptible to earthquake damage. The seismic accelerometers used in these buildings require a high level of technical expertise and a high cost to operate due to the requirement for secure communication networks, GPS synchronization, and high dynamic range. Vibration monitoring not only requires structural health monitoring (SHM) to review the safety of major components of structures, but it also uses vibration measurement data to explain the dynamic characteristics of structures under various horizontal loads (wind loads, earthquake loads) or vertical loads. The recorded vibration data also make it possible to quickly identify the cause of the vibration through various signal analysis techniques in the case of accidents caused by vibration. High-rise buildings are equipped with systems that can measure sub-1 Hz low-frequency vibration, continuous non-vibration, and maximum acceleration during earthquakes and wind loads. In addition, software-based filters that can remove vibration components other than the natural vibrations of the building and system identification techniques for extracting modal parameters such as the building’s natural frequency, damping ratio, and mode shape are required.
City spaces are expected to become increasingly crowded in the future, and the need for vertical space will increase, as pointed out [7]. The trend of constructing high-rise buildings that have combined residential, commercial, and public spaces is also expected to continue. Therefore, the demand for studies that analyze the characteristics of high-rise buildings or evaluate their serviceability regarding vibrations will continue to increase.
This research undertakes the measurement of horizontal vibrations in a 63-story skyscraper situated in Busan during and immediately following typhoon conditions, utilizing a general-purpose data acquisition system. Crucially, the wind engineering characteristics of Busan—its coastal location, its hilly terrain, its temperate climate impacted by typhoon occurrences, and its urban environment with high concentrations of tall structures—all play significant roles in this investigation. By taking these factors into account, the study proceeds to evaluate the building’s serviceability in accordance with international standards, accomplished through an analysis of the variations in the natural frequency and amplitude of the vibrations.
2. Related Work
2.1. International Standards for the Evaluation of Vibration Serviceability of Buildings
Starting in 1931, the ASCE’s division committee began researching serviceability issues such as the discomfort felt by residents when buildings undergo vibrations due to human responsewind loads and other external forces. This research determined that for residents to comfortably reside in a structure, the deformation of the structure must be within a certain range. In 1962, Fischer proposed limiting the torsional displacement caused by wind loads to 1/500 of the building’s height. This limit was claimed to secure the serviceability from vibrations, providing satisfaction to residents.
In 1973, Chang proposed a curve that represents the discomfort felt by residents of high-rise buildings in the high-vibration frequency range of 1 Hz to 35 Hz, according to the human vibration response. Also, in 1972, Chen and Robertson presented the human response to vibrations between 0.067 Hz and 0.2 Hz [8,9]. However, it should be noted that previous research results should be taken into consideration with the recognition that simulated vibrations through experiments may differ from actual building vibrations.
To verify these results, in 1973, Hansen, Reed, and Vanmarche conducted a survey of workers in a 40-story steel-framed building and measured the acceleration values that caused discomfort [10]. Based on the above studies, serviceability criteria for predicting the dangers of whole-body vibration to human health were established that can be applied to various situations such as building vibrations, machinery vibrations, and train interior vibrations. However, when applying these criteria to buildings, they only apply to buildings with frequencies above 1 Hz and below 1 Hz.
BS6841:1987 and ISO2631-1:1997 are standards that can be applied to buildings with frequencies above 1 Hz. However, high-rise buildings typically have a frequency lower than 1 Hz, and it is appropriate to use standards that can be applied to frequencies below 1 Hz for serviceability evaluation [11,12,13]. However, as there are no domestic or foreign standards that apply to buildings with vibrations below 1 Hz yet, similar standards need to be comprehensively considered and applied as shown in Table 1.

Table 1.
Overview and characteristics of vibration evaluation criteria in different countries.
There are standards that can be applied as evaluation criteria for the horizontal vibration of buildings due to strong winds in various countries, such as the residency guideline for Japan’s building vibrations by AIJES-V 001-2004, the NBCC of Canada:1990, the AISC#11 [15], which is a combination of American and Canadian standards:2016, the Australian standard:1975 [16], and EURO CODE:2002. Many of these standards have also been established based on the research achievements of each country. Therefore, each international standard varies in setting the necessary permissible levels and evaluation methods for the serviceability evaluation of buildings.
The variations are largely categorized by the use of the maximum response acceleration and the use of the RMS value, and the reproduction period of wind speed ranges from 0.5 years to 10 years. Also, the average wind speed can vary from 10 min to 1 h. The reproduction period of wind speed can be different in each country, and it is good to use the value processed statistically by the country to reflect the wind strength that often occurs in that country.
The second evaluation method involves using the acceleration value as two different scales, the maximum acceleration and the RMS acceleration. This is because vibration acceleration patterns appear differently depending on the shape of the building, dynamic characteristics, and wind characteristics. Maximum acceleration refers to the maximum value of acceleration caused by wind during a set period of time for a fixed point of the building. RMS acceleration is the RMS (root mean square) value of acceleration measured during the same period of time.
Humans are better at detecting acceleration than deformation and velocity, but they have a tendency to forget small changes in acceleration. Therefore, the method of evaluation using maximum acceleration values may be advantageous in evaluating the discomfort induced by perceiving the starting point and intensity of vibrations. Evaluation using RMS acceleration is used because it places more importance on the duration of the stimulus, and it is more advantageous for studying human discomfort and the habitability of a building with regards to vibrations. Therefore, it is considered more reasonable to use RMS acceleration in the serviceability evaluation of buildings. However, in some countries, only the maximum acceleration is used, and it is speculated that this is because the maximum acceleration is used without any additional post-processing steps, making it easier for the general public to use according to the characteristics of the national standard. Therefore, this study has investigated several important criteria in detail to find an appropriate horizontal vibration serviceability evaluation criterion.
2.2. BS 6841:1987
BS 6841:1987 provides a standardized method for measuring and evaluating vibration and repetitive shocks [11]. The evaluation method considers frequency weighting functions, root mean square acceleration (RMS), vibration dose value (VDV), and discomfort symptoms in the low-frequency range of 0.1–0.5 Hz. BS 6841 defines frequency weighting functions for each of the 12 axes, thus providing specific distinctions for applying filters to each vibration axis. Compared to ISO 2631-1, BS 6841 is a highly preferred evaluation standard in the general industry. The reason for applying filters is to correct the perception of the strength of acceleration coming from the same vibration source, which varies in different directions, as shown in Figure 1. The weighting values related to the filter are shown in Table 2. The frequency weighting function graph drawn according to this table is shown in Figure 2.
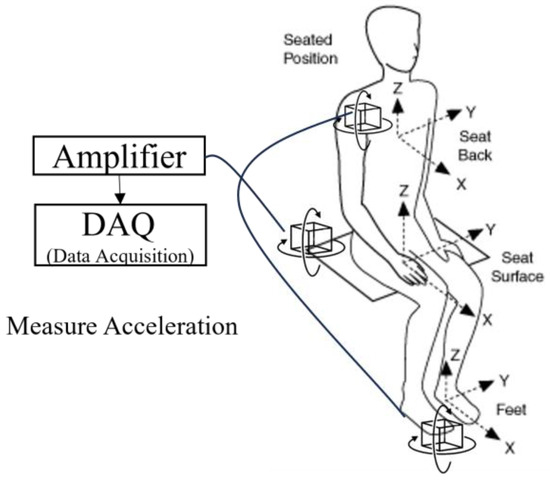
Figure 1.
Schematic configuration for the measurement of whole-body vibration.
Table 2.
Frequency weighting function and axis multiplying factor.
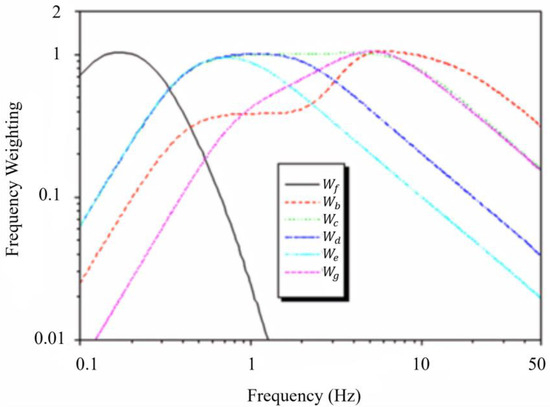
Figure 2.
British standard frequency weighting function.
2.3. ISO 2631-1:2003
ISO 2631-1:2003 defines a method for quantitatively evaluating the health, comfort, perception, and motion sickness phenomena of the human body when exposed to whole-body vibration [12]. The direction of the human body when exposed to vibration, such as a seated, standing, or lying down position, is evaluated using frequency-weighted acceleration response, which is calculated by applying different vibration weighting filters and evaluated by various evaluation indices, such as the RMS (root mean square), MTVV (maximum transient vibration value), or VDV (vibration dose value), depending on the form of the acceleration response.
ISO 2631-1 considers the frequency-weighted acceleration response based on the sensitivity of the human body. To account for this, the level of perceivable acceleration response changes depending on the direction in which it is transmitted to the human body. Therefore, the human vibration is evaluated using the human coordinate system presented in Figure 3, where the z-axis is in the direction of the spine.
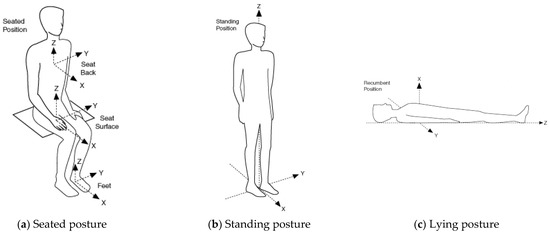
Figure 3.
Human coordinate system used in ISO 2631-1.
In ISO 2631-1, vibrational loads such as ,, and are presented for major activities and transmitted vibration directions. Table 3 represents various vibrational loads presented in ISO 2631-1. To obtain the weighted acceleration response from vibrational loads, a transfer function H(f) composed of combinations of a high-pass filter, a low-pass filter, an acceleration–velocity transition filter, and an upward step filter must be used, as shown in Table 4. The vibrational load weighted curves composed of this combination are shown in Figure 4. It can be confirmed in the figure that the evaluation frequency of , and is 4–8 Hz, 0.5–1.5 Hz, and 0.125–0.25 Hz, respectively.
Table 3.
The types of vibration weighting and human coordinates presented in ISO 2631-1.
Table 4.
Parameters used in each vibration weighting in ISO 2631-1.
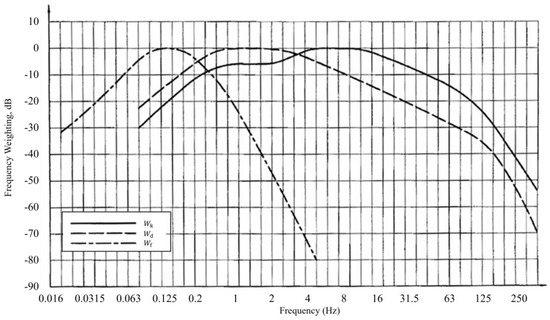
Figure 4.
Weighting curves used in ISO 2631-1 for vibration measurement.
By utilizing this vibration weighting curve, the measured acceleration data can be processed in three ways to evaluate the vibration serviceability. First, as a basic evaluation method, ISO 2631-1 defines the frequency-weighted RMS acceleration in Equation (1) as the evaluation indicator:
Here, is the frequency-weighted acceleration, and T is the response measurement time.
Next, we consider the maximum transient vibration value (MTVV). Although the frequency-weighted root mean square (RMS) acceleration is a significant indicator when evaluating human vibrations, an additional evaluation method incorporating peak vibrations is required for assessing short-term intermittent vibrations (transient vibrations) or shocks. ISO 2631-1 defines the crest factor, which is the ratio of the maximum instantaneous acceleration of the response to the frequency-weighted RMS acceleration. If this value exceeds nine, the maximum transient vibration value (MTVV) or the third evaluation method, the vibration dose value (VDV), is employed as the indicator to evaluate human vibrations. To assess intermittent vibrations or shocks, the running RMS acceleration at the instantaneous time , as defined in Equation (2), can be utilized:
Here, is the instant time, is the frequency-weighted acceleration, and τ is the integration time for RMS calculation. In other words, the maximum value of the RMS displacement over the total measurement time is referred to as the maximum transient vibration value (MTVV, Equation (3)). The MTVV has a higher value compared to the frequency-weighted RMS acceleration, so it can be used in cases in which a more conservative vibration evaluation is required. The MTVV is calculated using the following formula:
Here, is the frequency-weighted moving RMS acceleration estimated through Equation (2). Finally, in the evaluation of building vibration serviceability, in most cases, the goal is to reduce or eliminate discomfort, so a vibration serviceability evaluation based on a sense of stability index is required. Through the previously estimated frequency-weighted RMS acceleration, the maximum excessive vibration value, etc., the study examines whether the discomfort meets the conditions in Table 5.
Table 5.
Assessment of discomfort specified in ISO 2631-1.
2.4. ISO 10137:2007
ISO 10137:2007 regulates the method of quantitatively evaluating the serviceability of structures such as buildings or bridges for users exposed to vibrations [17]. Based on the evaluation indices and weighting of vibration numbers in ISO 2631-2:1989, the standard evaluates human vibrations through quantified results [18]. ISO 10137 determines the standard curves for human vibrations and presents these according to the purpose of the building, based on the RMS acceleration. Figure 5 is the evaluation curve of vibration serviceability presented in ISO 10137.
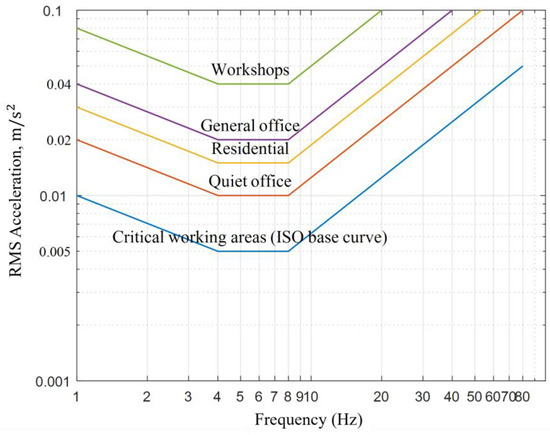
Figure 5.
Human perceptibility evaluation curves presented in ISO 10137.
The RMS acceleration size of the ISO standard curve is based on R = 1 (0.005 ) and divided into “quiet office (R = 2)”, “general office (R = 4)”, and “Workplace (R = 8)” according to the intended use of the building, with a weighting factor applied. Here, R is the response coefficient that represents the ratio of the minimum RMS vibration size of the ISO standard curve (base curve) of 0.005 and the measured RMS acceleration. In short, the level of floor vibrations can be expressed by using the response coefficient R, which is indicated by the multiple of the minimum acceleration size of 0.005 .
2.5. AISC (American Institute of Steel Construction) Design Guide 11:2002
The AISC Design Guide 11:2002 evaluates the vibration performance of buildings based on the basic curve of ISO 2631-2:1989, which is different from ISO 2631-1:1997 and ISO 10137:2007. It categorizes walking, rhythmic movement, and mechanical equipment as the main causes of vibration in buildings and evaluates the serviceability of vibrations through maximum value estimation equations and vibration frequency evaluation equations corresponding to each factor.
The maximum acceleration size according to the use of a room is divided into “office, residential” (R = 10), ”indoor walkway, shopping mall, dinner and dance” (R = 30), and “mobile behavior, outdoor walkway” (R = 100) by applying weights based on the ISO standard curve (R = 1, 0.05 g), as shown in Figure 6. The AISC is the only standard that presents an allowable vibration acceleration size for flooring that generates large vibrations for rhythmic activities, such as performance venues.
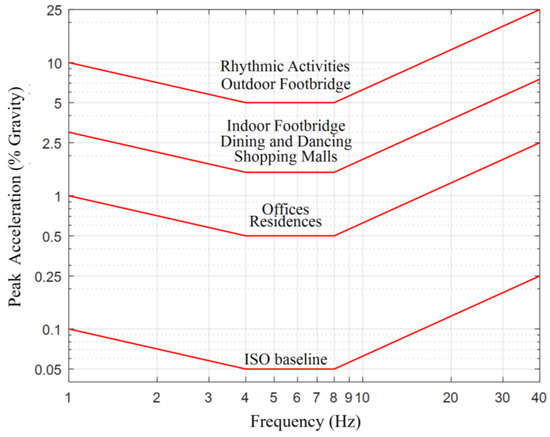
Figure 6.
The human response evaluation curve presented in AISC Design Guide 11.
The evaluation method presented by the AISC compares the allowable limit with the calculated maximum response of the structure to confirm its vibration performance. If the response is lower than the limit according to the standards presented in Figure 6, it is judged that it is difficult for a person to perceive vibration. The maximum acceleration size for walking is calculated in Equation (4), and the maximum response for rhythmic movement is calculated in Equation (5). To estimate the maximum value of floor vibration acceleration, the natural frequency of the floor and the mass per unit area must first be calculated. In addition, the dynamic coefficient is presented for each activity in Table 6, and it is possible to reflect the vibration phenomenon.
Table 6.
Dynamic coefficients for maximum response estimation.
Here, refers to the ratio of acceleration to gravitational force, R represents the reduction factor, β denotes the damping ratio, W represents the effective weight of the building, signifies the vibration frequency of pedestrian loads, and i represents the first harmonic frequency.
Here, refers to the ratio of the acceleration history and gravitational load, represents the dynamic coefficient, represents the effective mass of a person walking on a floor per unit area, represents the effective mass of the floor per unit area including walkers and residents, and refers to the frequency of vibration (=).
Typically, vibration problems in buildings occur when the frequencies of the building and the floor have a close match. Therefore, for more conservative design, it is necessary to ensure that the harmonic component of the frequency of the building matches the floor’s natural frequency , and the maximum acceleration response must take into account the response including the harmonic component, as shown in Equation (6):
The AISC Design Guide 11 suggests applying the minimum natural frequency of the floor plate according to Equation (7) to reduce the occurrence of resonant conditions, in addition to the comparison method of the maximum acceleration calculation and the limit:
Here, is a constant (military parade: 1.3, concert or sports event: 1.7, aerobics: 2.0), is the acceleration limit value (if a sensitive floor condition is required, less than 0.05). The AISC Design Guide 11 reports that structural fatigue problems can occur if the acceleration on the floor reaches 50% of the periodic gravitational acceleration. Therefore, the recommended maximum acceleration for rhythmic activity is 4% to 7% of gravitational acceleration.
2.6. ISO 6897:1984
ISO 6897:1984 was established due to the increase in building modifications caused by industrialization as well as the increase in the number of high-rise buildings, in order to verify the impact of low-frequency horizontal movements on residents [19]. It also acts as a guide for designing structures so as not to harm the health of people living in fixed structures that are frequently exposed to storms, such as marine structures. This standard is evaluated with the RMS value of acceleration for the 5-year expected wind speed of the 10 min average wind speed and suggests curves that can be applied to the evaluation of the four rarely occurring vibrations. Figure 7 shows the curve that can minimize the negative response of people to horizontal vibration in buildings and marine structures that are commonly used. Figure 8 shows the average value and lower threshold value of recognition for horizontal vibration.
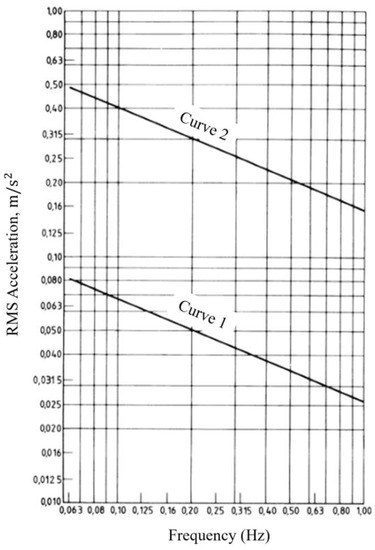
Figure 7.
Suggested satisfactory magnitudes of horizontal motion of buildings used for general purposes (curve 1) and of off-shore fixed structures (curve 2).
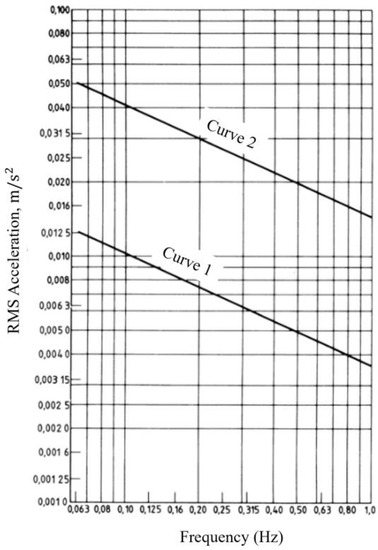
Figure 8.
Average (curve 2) and lower threshold (curve 1) of perception of horizontal motion by users of buildings.
2.7. Trend of Studies Related to the Serviceability Evaluation of High-Rise Buildings
Most of the previous literature that evaluates the horizontal vibrations of high-rise buildings can be divided into studies that identify the building’s system and studies that directly survey people’s reactions to the structure’s own performance. These studies have focused more on investigating the fundamental causes of vibration rather than presenting research based on livability or serviceability. Furthermore, it was difficult to find studies on the serviceability evaluation of low-rise buildings and mid-rise buildings.
The trends in papers related to the standards and serviceability of buildings are as follows. Howarth (2015) analyzed the differences between the ISO6897 and ISO13137 standards and studied which criteria are appropriate depending on the situation by evaluating the RMS acceleration and PEAK acceleration using these standards [20]. Kwok (2006) pointed to the need for further research on low natural frequencies that typically occur in high-rise buildings as well as information that clearly analyzes the physiological responses of people [21]. Michaels (2009) surveyed the discomfort felt by 578 residents of high-rise buildings and verified the frequency band that causes discomfort by precisely controlling the frequency with a shaker [22]. Tamura (2006) conducted vibration perception tests on a variety of buildings, from low-rise residential houses to high-rise buildings, and evaluated these using the Japanese Occupancy Evaluation Guidelines by AIJES-V 001:2004 [23,24]. Although similar studies have been conducted on the same building size and situation for the system identification of high-rise structures, it was difficult to find results analyzing serviceability.
Wang (2019) measured the acceleration response and roof wind characteristics of a high-rise building in Wenzhou simultaneously on the 10th, 18th, 25th, 32nd, and 41st floors during typhoons from 2014 to 2016. The building’s x- and y-direction natural frequencies were 0.39 and 0.41 Hz, respectively, and a study was performed to identify the system based on the amplitude and frequency characteristics [25]. Wu (2019) analyzed wind velocity data to verify the relationship between turbulence intensity and mean wind velocity in the 632 m Shanghai Tower, concluding that the response increases monotonically as wind speed increases [26]. In 2020, Zhang analyzed the modal parameters of four super-high-rise buildings in Shenzhen based on data from Typhoon Mangkhut and analyzed the change in structural dynamic characteristics with respect to amplitude and time [27]. These data were used to clarify that the change in damping ratio is related to wind speed and direction during strong winds. Su (2017) measured the actual effect of Typhoon Usagi on the Canton Tower, which is 604 m high, by analyzing wind loads and related loads on high-rise structures for use in structural design [28]. They compared the response due to temperature to the response due to the typhoon and found that the systematic response due to the typhoon was slightly less than the response due to temperature.
There is a significant shortage of studies on the serviceability of super-high-rise buildings. Because super-high-rise buildings have larger horizontal deformation than vertical deformation, it is important to design or investigate these buildings considering the serviceability of horizontal vibrations. However, the literature review revealed that there are only two serviceability evaluation criteria that can evaluate horizontal vibrations, including domestic and international studies. The remaining criteria mostly concern floor vibrations and vertical vibrations, and most of them pertain to high-frequency vibration. Therefore, this study evaluates the serviceability of super-high-rise buildings through the international standards ISO 10137 and ISO 6897 [17,19].
3. Identification of Target Building Information and Structural System
3.1. Building Information and Acceleration Measurement Method
The target building for measurement is a 63-story reinforced concrete structure located in Nam-gu, Busan, featuring a basement with four levels. The lateral resistance system comprises an internal core and external mega columns. The belt wall system, which resists horizontal forces, is supported by eight outrigger trusses located on the 28th and 29th floors as well as the 48th and 49th floors. The building stands at 289 m tall, and the seismic coefficient used in its structural design is 6.3, which represents an earthquake with a magnitude that occurs once every 1000 years. The building was completed in 2013. The area from the ground floor to the 3rd floor is used for sales facilities, and that from the 4th floor to the 62nd floor is designated for office purposes. The basement, which comprises the 1st to the 3rd floor, is used for parking and machinery rooms, and the top floor, the 63rd floor, is used as an observation deck. Accelerometers were installed in the central roof of the 63rd floor in the x- and y-directions, and the location of the accelerometer is shown in Figure 9. The accelerometer and the data collection device used for measurement are shown in Figure 10 and Table 7. The accelerometer is a high-sensitivity accelerometer capable of low-frequency vibration measurement, and the data collection device is a commercially available device with a ± 10 V measurement range and 16-bit resolution. The sensitivity of the accelerometer during acceleration measurement was set to 100 V/g.
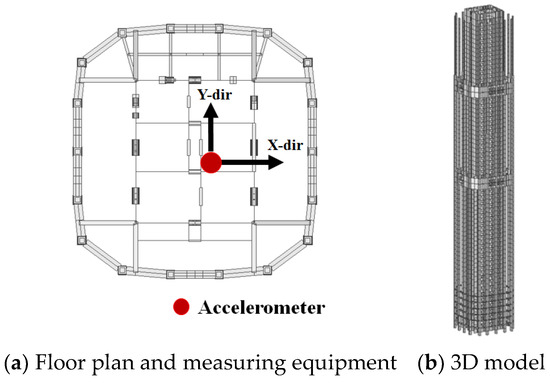
Figure 9.
Structural plan and accelerometer location.
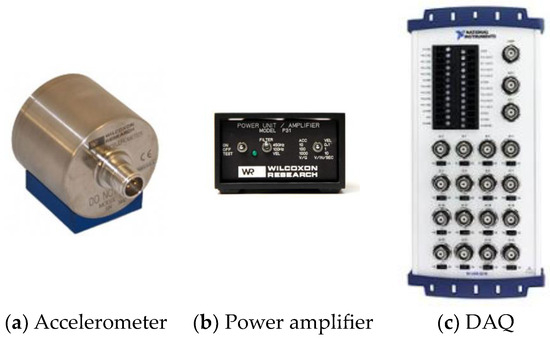
Figure 10.
Measurement equipment used for monitoring.
Table 7.
Measurement equipment specifications.
The data were measured with a 1000 Hz sampling rate and stored in 10 min intervals. Table 8 shows the data collection time and weather conditions, and Figure 11 shows the actual path of the typhoon. The ambient vibration conditions during the measurement were measured with an average wind speed of 0.1 m/s, in a warm and calm condition just after the passage of Typhoon Chaba in 2016. The vibration records of the typhoon’s passage were collected at the time when the maximum wind speed was recorded at its highest. In the case of Typhoon Danas in 2013, the typhoon’s passage and average wind speed were similar, but the maximum wind speed was higher, at 22 m/s, compared to 14 m/s for Typhoon Danas. Additionally, the wind speed and direction information during the monitoring period were obtained from a weather station located 6 km away from the target building and measured on a minute-by-minute basis.
Table 8.
Wind speed and direction information during acceleration data acquisition.
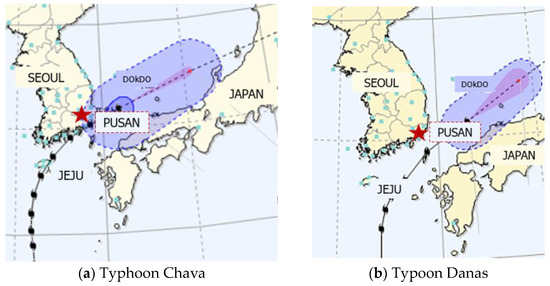
Figure 11.
Actual path and location of Typhoon Chaba and Typhoon Danas and the building measured.
3.2. Results of Vibration Acceleration Measurement
Figure 12, Figure 13 and Figure 14 show graphs of the x- and y-direction’s highest floor vibration acceleration waveform and PSD spectrum for three wind loads. The vibration acceleration time history represents the signal that passed through the low-pass filter with a center frequency of 10 Hz, and the PSD spectrum was analyzed using a Hanning window with a resolution of 1000 Hz. The size of the steady-state unvibrated acceleration waveform in Figure 12a is 1/10 the scale of the typhoon vibration acceleration waveform in Figure 13 and Figure 14, indicating that the steady-state unvibrated acceleration is very small. The effective acceleration in the x-direction over a 5000 s interval is 0.0016, and in the y-direction, it is 0.0022 , respectively. When the same analysis conditions are applied, the effective acceleration under the condition of Typhoon Chaba in Figure 13a is 0.0508 and 0.0707 , and the effective acceleration under the condition of Typhoon Danas in Figure 14a is 0.0311 and 0.0429 . In the initial 500 s of the Typhoon Chaba condition in Figure 13, the maximum wind speed was 22 m/s, and the maximum acceleration occurred in the y-direction, reaching 0.609 .
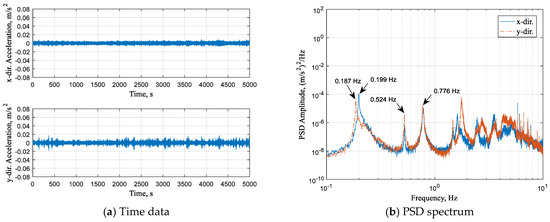
Figure 12.
Ambient vibration, 17:00–18:59 5 October 2016.
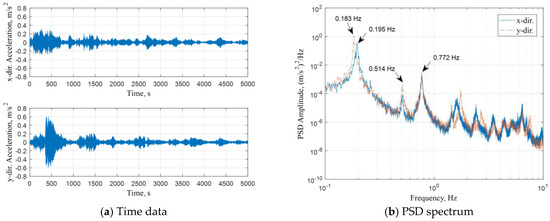
Figure 13.
Typhoon Chaba, 11:00-12:59 5 October 2016.
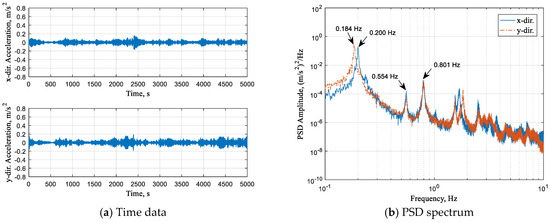
Figure 14.
Typhoon Danas, 21:00–22:59 8 October 2013.
In the PSD spectrum of Figure 12b, under steady-state conditions, the size of the acceleration spectrum in the frequency region above 3 Hz is similar to that of Figure 13b and Figure 14b under wind loads. However, in the frequency region below 2 Hz, the size of the PSD spectrum was about 1/10,000 smaller than that under typhoon conditions (when converted to acceleration units (), this is about 1/100). The lower the frequency band, the greater the increase in the size of the typhoon acceleration spectrum compared to the steady-state condition, and the increase in acceleration size at the first-mode natural frequency of 0.2 Hz was the largest. In other words, it can be seen that the horizontal vibration acceleration of a high-rise building caused by wind loads significantly increases in the lower frequency modes of less than 1 Hz.
Table 9 and Table 10 show the natural frequencies and spectral amplitudes for the first to the third modes in the x- and y-directions, respectively. Under high wind speed conditions of a typhoon, the natural frequencies of each vibration mode decreased compared to the constant state of non-vibration, with a decrease rate of 2 to 3%. However, it is important to note that these results may vary depending on the characteristics of the typhoon. Under the Typhoon Danas conditions in 2013, the natural frequencies of each mode appeared to be higher than the natural frequencies measured under the steady state of non-vibration in 2016. This is due to the fact that the target building was not completed in 2013 under Typhoon Danas conditions, which makes a relatively smaller floor mass compared to that of 2016.
Table 9.
Natural frequency and PSD amplitude of first three modes for x-direction.
Table 10.
Natural frequency and PSD amplitude of first three modes for y-direction.
3.3. Evaluation of Serviceability on Vibration Acceleration of Horizontal Vibration
The study’s target building was a 63-story high-rise building, and the first-mode natural frequency was approximately 0.2 Hz. People are typically sensitive to horizontal vibrations of 1–2 Hz, but 0.2 Hz can also cause dizziness or nausea if the vibration acceleration is high. According to ISO 2631-1, if the building’s horizontal vibration is high, occupants can express discomfort, so it is necessary to constantly monitor and analyze the horizontal vibration size through continuous vibration monitoring.
In this section, the horizontal vibration serviceability evaluation of the measured acceleration was performed under three wind loading conditions for two hours. The serviceability evaluation followed the guidelines of ISO 10137 [17] and ISO 6897 [19]. ISO 10137 proposes the maximum acceleration of the building for office and residential use based on a 1-year repetition cycle wind load, and the size of the maximum allowed acceleration varies depending on the first-mode natural frequency of the building. ISO 6897 proposes the allowable size of the horizontal vibration acceleration of the building with a frequency range of 0.063–1 Hz for the maximum wind load with a 5-year repetition cycle, in terms of effective acceleration. The proposed effective acceleration is presented in four lines, with two each for the human perception level and the building use purpose.
Figure 15 and Figure 16 are graphs that show the evaluation results of the building’s horizontal vibration acceleration calculated according to the ISO 10137 and ISO 6897 standards, respectively. The size of the horizontal vibration acceleration applied using the two standards is summarized in Table 11.
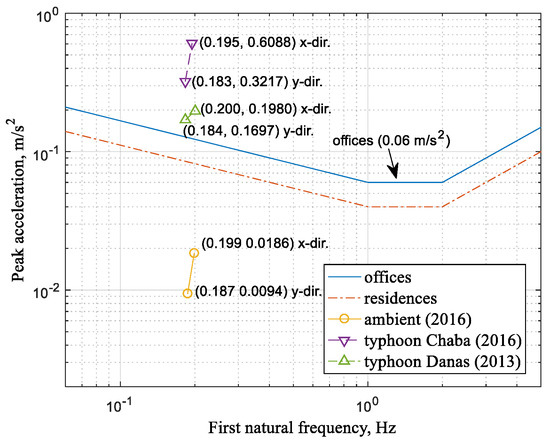
Figure 15.
Comparison of highest floor peak acceleration and evaluation curves as given by ISO 10137.
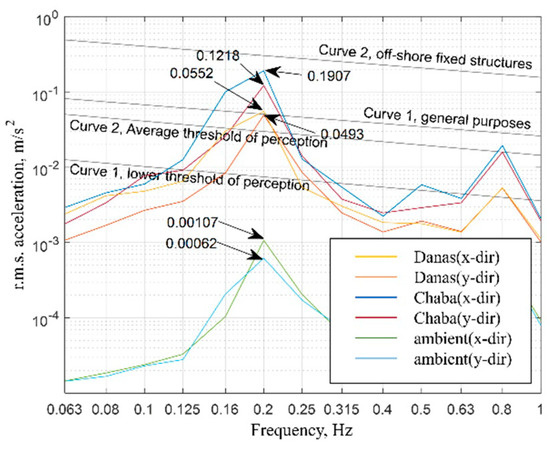
Figure 16.
Comparison of highest floor RMS acceleration and evaluation curves as given by ISO 6897.
Table 11.
Comparison of top-floor acceleration amplitude by wind load conditions, m/s2.
Figure 15 is a graph showing the maximum building acceleration under wind load conditions. Under steady-state conditions, it meets the standards for office and residential buildings, but under Typhoon Chaba and Typhoon Danas conditions, the maximum horizontal vibration acceleration in both the x- and y-directions exceeds the office level.
Figure 16 is a spectrum that shows the effective horizontal vibration acceleration at a one-third octave center frequency, based on the ISO 6897 standard. The frequency at which the maximum value of the average actual acceleration over 10 min measured for 2 h was located is close to the 0.2 Hz center frequency, which is close to the building’s first-mode natural frequency in all conditions. The actual horizontal vibration acceleration value at the upper floor of the building was below the lowest level that can be perceived by people under the condition of continuous non-vibration. However, under the two typhoon conditions, the actual horizontal vibration acceleration value exceeded the average threshold that adults can perceive on average and was evaluated as exceeding the size of the allowed acceleration (0.05 m/s2 at 0.2 Hz) for a general-purpose building (curve 1, general purpose).
During strong winds, the magnitude of horizontal vibration on the top floor was found to be at the level of the average vibration tolerance level proposed by ISO, so it is expected that most residents of high-rise buildings will experience horizontal vibrations. The average wind speed of the strong winds measured in this study was about 20 m/s, which is two-and-a-half times the average wind speed of 7–8 m/s in South Korea. Therefore, there is a low probability that residents will experience vibrations at the constant vibration level, but during strong winds, there are vibrations of a size that can cause discomfort, so guidance or safety management measures are required.
4. Summary and Conclusions
This study aimed to evaluate the level of discomfort experienced by residents of high-rise buildings in South Korea when excessive transverse deformation occurs due to the influence of typhoons. To do this, we measured the acceleration of the deformation. The conclusions of evaluating the domestic and international standards for vibration serviceability compared to ISO10137 and ISO6897 are as follows:
- The domestic and international vibration serviceability standards have been continuously studied over the course of 40 to 50 years, but most of the standards apply primarily to vertical vibrations of the floor or other restricted vibrations.
- Although there are not many high-rise buildings, people on the top floors can experience low-frequency vibrations due to wind or the building’s natural frequency. Therefore, it is advisable to evaluate the serviceability before designing a building. However, the standards that assist with this, ISO10137 and ISO6897, have limited applicability.
- The effective acceleration at the top floor of super-tall buildings has been analyzed to be 0.0005 to 0.2 m/s2. The research target building is a square-shaped super-tall building, with its y- and y-axis natural vibration frequencies close to 0.184 Hz and 0.200 Hz, respectively. The second- and third-mode vibration frequencies are also below 1 Hz, which identifies the building as greatly influenced by typical low-frequency vibrations.
- The acceleration change of a building due to typhoons was measured to be significantly higher (up to 0.6 m/s2) compared to normal conditions (0.005 m/s2)—a maximum of 120 times higher. No change was observed in the natural vibration frequency. The gust wind speed was higher than that of Typhoon Danas during the gust, and the results of the measurement also confirmed that the instantaneous acceleration increased during the gust, and the building was shaken more, revealing the relationship of the building to wind.
- The evaluation results showed that the horizontal vibration exceeded the allowable vibration standards proposed by ISO 10137 (2007) and ISO 6897 (1984), but it was not possible to confirm the actual relevance. This is because a survey of the residents’ discomfort was not carried out in this study. In the future, as high-rise buildings are constructed, research on building horizontal vibration and residents’ perception and discomfort is required. Such research should be validated through field vibration measurement data and resident surveys. This is because the results from laboratory-level vibration sensory experiments may differ from actual trends. To this end, continuous monitoring of building vibrations and resident responses is necessary for buildings that are potentially vulnerable to vibration problems. This requires the development of technology for building vibration and resident response monitoring.
Author Contributions
Data curation, W.C.; Writing—original draft, S.H.; Writing—review & editing, S.N. All authors have read and agreed to the published version of the manuscript.
Funding
This work was supported by the National Research Foundation of Korea (NRF) grant funded by the Korea government Ministry of Education (No. NRF-2018R1A6A1A07025819 and NRF-2020R1C1C1005406).
Data Availability Statement
The data that support the findings of this study are available upon reasonable request. For access to the data, please contact the corresponding author at mill@dankook.ac.kr.
Conflicts of Interest
The authors declare no conflict of interest.
References
- Brownjohn, J.M. Ambient vibration studies for system identification of tall buildings. Earthq. Eng. Struct. Dyn. 2003, 32, 71–95. [Google Scholar] [CrossRef]
- Torkamani, M.A.; Pramono, E. Dynamic response of tall building to wind excitation. J. Struct. Eng. 1985, 111, 805–825. [Google Scholar] [CrossRef]
- Park, S.J.; Subramaniyam, M. Evaluating methods of vibration exposure and ride comfort in car. J. Ergon. Soc. Korea 2013, 32, 381–387. [Google Scholar] [CrossRef][Green Version]
- Baliatsas, C.; van Kamp, I.; van Poll, R.; Yzermans, J. Health effects from low-frequency noise and infrasound in the general population: Is it time to listen? A systematic review of observational studies. Sci. Total Environ. 2016, 557, 163–169. [Google Scholar] [CrossRef] [PubMed]
- Hansen, C. Effects of Low-Frequency Noise and Vibration on People; Multi-Science Publishing Co., Ltd.: Brentwood, UK, 2007. [Google Scholar]
- Ozkaya, N.; Willems, B.; Goldsheyder, D.; Nordin, M. Whole-body vibration exposure experienced by subway train operators. J. Low Freq. Noise Vib. Act. Control 1994, 13, 13–18. [Google Scholar] [CrossRef]
- Heo, S.; Na, S.; Hur, M.W.; Lee, S. Evaluating the Vertical Extension Module of a Building with Installed Rotary Dampers at Joints. Buildings 2021, 11, 536. [Google Scholar] [CrossRef]
- Chang, F.K. Human response to motions in tall buildings. J. Struct. Div. 1973, 99, 1259–1272. [Google Scholar] [CrossRef]
- Chen, P.W.; Robertson, L.E. Human perception thresholds of horizontal motion. J. Struct. Div. 1972, 98, 1681–1695. [Google Scholar] [CrossRef]
- Hansen, R.J.; Reed, J.W.; Vanmarcke, E.H. Human response to wind-induced motion of buildings. J. Struct. Div. 1973, 99, 1589–1605. [Google Scholar] [CrossRef]
- BS 6841; Guide to Measurement and Evaluation of Human Exposure to Whole-Body Mechanical Vibration and Repeated Shock. British Standards Institution: Milton Keynes, UK, 1987.
- ISO 2631-1; Mechanical Vibration and Shock-Evaluation of Human Exposure to Whole-Body Vibration—Part 1: General Requirements. International Organization for Standardization: Geneva, Switzerland, 1997.
- European Convention for Constructional Steelwork. Technical Committee 12, Wind. Recommendations for Calculating the Effects of Wind on Constructions; ECCS: Brussels, Belgium, 1987. [Google Scholar]
- National Building Code of Canada. Part4 Structural Design 4; National Research Council of Canada: Ottawa, ON, Canada, 1990. [Google Scholar]
- Murray, T.M.; Allen, D.E.; Ungar, E.E.; Davis, D.B. Vibrations of Steel-Framed Structural Systems due to Human Activity; American Institute of Steel Construction: Chicago, IL, USA, 2016. [Google Scholar]
- Australian Standard Rules. Minimum Design Loads on Structures, Part 2—Wind Forces; Standards Australia Office: Sydney, Australia, 1975. [Google Scholar]
- ISO 10137; Bases for Design of Structures-Serviceability of Buildings against Vibration. International Organization for Standardization: Geneva, Switzerland, 1992.
- ISO 2631-2; Evaluation of Human Exposure to Whole-Body Vibration—Part 2: Continuous and Shock-Induced Vibrations in Buildings (1 to 80 Hz). International Organization for Standardization: Geneva, Switzerland, 1989.
- ISO 6897; Guidelines for the Evaluation of the Response of Occupants of Fixed Structures, Especially Buildings and OFF-Shore Structures, to Low-Frequency Horizontal Motion (0.063 to 1 Hz). International Organization for Standardization: Geneva, Switzerland, 1984.
- Howarth, H. Human exposure to wind-induced motion in tall buildings: And assessment of guidance in ISO 6897 and ISO 10137. In Proceedings of the 50th United Kingdom Conference on Human Responses to Vibration, Southampton, UK, 9–10 September 2015. [Google Scholar]
- Kwok, K.C.; Burton, M.D.; Hitchcock, P.A. Human perception of wind-induced tall building motions. In Proceedings of the UK Conference on Wind Engineering, Glasgow, UK, 4–6 September 2006; pp. 11–18. [Google Scholar]
- Michaels, M.N.; Kwok, K.C.; Hitchcock, P.A. Human body response to low frequency narrow-band random building motions. In Proceedings of the Seventh Asia-Pacific Conference on Wind Engineering, Taipei, Taiwan, 8–12 November 2009. [Google Scholar]
- AIJES-V 001; Standard for the Evaluation of Habitability to Building Vibration. Architectural Institute of Japan: Tokyo, Japan, 2004.
- Tamura, Y.; Kawana, S.; Nakamura, O.; Kanda, J.; Nakata, S. Evaluation perception of wind-induced vibration in buildings. Proc. Inst. Civ. Eng.-Struct. Build. 2006, 159, 283–293. [Google Scholar] [CrossRef]
- Wang, C.; Li, Z.; Hu, L.; Zhao, Z.; Luo, Q.; Hu, J.; Zhang, X. Field research on the wind-induced response of a super high-rise building under typhoon. Appl. Sci. 2019, 9, 2180. [Google Scholar] [CrossRef]
- Wu, J.; Xu, H.; Zhang, Q. Dynamic performance evaluation of Shanghai Tower under winds based on full-scale data. Struct. Des. Tall Spec. Build. 2019, 28, e1611. [Google Scholar] [CrossRef]
- Zhang, L.; Hu, X.; Xie, Z.; Shi, B.; Zhang, L.; Wang, R. Field measurement study on time-varying characteristics of modal parameters of super high-rise buildings during super typhoon. J. Wind Eng. Ind. Aerodyn. 2020, 200, 104139. [Google Scholar] [CrossRef]
- Su, J.Z.; Xia, Y.; Zhu, L.D.; Zhu, H.P.; Ni, Y.Q. Typhoon-and temperature-induced quasi-static responses of a supertall structure. Eng. Struct. 2017, 143, 91–100. [Google Scholar] [CrossRef]
Disclaimer/Publisher’s Note: The statements, opinions and data contained in all publications are solely those of the individual author(s) and contributor(s) and not of MDPI and/or the editor(s). MDPI and/or the editor(s) disclaim responsibility for any injury to people or property resulting from any ideas, methods, instructions or products referred to in the content. |
© 2023 by the authors. Licensee MDPI, Basel, Switzerland. This article is an open access article distributed under the terms and conditions of the Creative Commons Attribution (CC BY) license (https://creativecommons.org/licenses/by/4.0/).