Abstract
The energy-supply crisis, aggravated by the war in Ukraine, has prompted EU governments to approve urgent energy-saving measures. The new Spanish energy-saving standard aims to reduce energy consumption by changing the regulatory limits for indoor hygrothermal conditions in buildings. This regulation has provoked a great social debate about its real effectiveness and its impact on user comfort. This work explores the hygrothermal performance of an office building in southeastern Spain. The objective of this research is to determine qualitatively and quantitatively how the new energy-saving standard in Spain influences energy efficiency and indoor thermal comfort, by considering the characteristics of the dry Mediterranean climate (BShs) within a warm semi-arid climate (BSh). The scientific novelty of the study is to demonstrate that the new Spanish standard not only reduces energy costs but also makes the indoor comfort of buildings much worse; for this reason, an improvement in the standard is also proposed. The study methodology consists of a comparative study between the thermal performance, thermal comfort, and energy demand of the building, considering both the new and previous standards’ requirements. It also includes the evaluation of a proposal to improve the current standard. The results showed that the new energy-saving standard reduced energy consumption by 21.78% in comparison to former standards, but the new comfort ranges were not acceptable for 60% of the users. The proposed improvement does achieve acceptable comfort for most users (75%) and an additional reduction in energy demand of 48.76% compared to current standard. We conclude that the thermal comfort requirements of the current energy standard should be modified to better adapt the design criteria to the dry Mediterranean climate.
1. Introduction
The energy-supply crisis of recent years, intensified by the war in Ukraine, has prompted governments in the European Union to approve urgent energy-saving measures [1]. Considering this, the Spanish government approved, in mid-2022, a new law to reduce energy consumption by changing the regulatory limits for indoor hygrothermal conditions in public buildings, such as offices and shops [2].
The new Spanish standard stipulates that the dry-bulb temperature of indoor air in buildings must be a minimum of 27 °C in summer and a maximum of 19 °C in winter. These temperatures are more extreme than those in previous standards. The aim of the new standard is to consider that air-conditioning systems should remain on for fewer hours during the year to save energy. However, this increase in the indoor air temperature in summer and decrease in winter negatively influences the thermal comfort of the users. For this reason, this standard has caused a great deal of social debate about its impact on the thermal comfort of building users and its real effectiveness in saving energy in buildings. Other EU member countries have also promoted reducing the indoor dry-bulb temperature in winter to 19 °C, such as Germany [3,4]. Since 1975, French standards have also set an indoor dry-bulb temperature of 19 °C in winter and 26 °C in summer [5,6], but these specifications are only recommended mean temperatures, and they should be adapted to the needs and characteristics of the building’s occupants. However, the climatic characteristics of Central and North European countries are very different from the BShs climate, and these do not have the influence of high solar radiation and its effect on indoor comfort in summer.
The differences between the new Spanish standard and previous standards are important. First, the current standard requires a cooler indoor air temperature in winter and warmer indoor air temperature in summer than those in previous standards. The former Royal Decree 1027/2007 [7] established an operating temperature between 21 °C and 23 °C in winter and between 23 °C and 25 °C in summer. The former Royal Decree 1826/2009 [8], also abolished, established a dry-bulb indoor air temperature of 21 °C in winter and 26 °C in summer in offices. Additionally, the new standard determines the dry-bulb air temperature instead of the operating temperature. This is important because the dry-bulb temperature does not consider the mean radiant temperature, which has a strong influence on both the operating temperature and comfort [9,10,11,12,13,14]. In fact, for indoor air velocities in buildings (less than 0.2 m/s) the operating temperature can be considered as the average of the dry-bulb air temperature and the mean radiant temperature [15]. This influence is especially strong in hot climates with high solar radiation on many days of the year, such as the BShs climate within a warm semi-arid climate. In this climate, solar gains have a major influence on the energy performance of buildings and lead to a significant increase in the cooling-energy needs. In addition, areas close to façades and windows have a higher mean radiant temperature, especially in buildings with considerable glazing, such as office constructions. However, the standard sets the same dry-bulb air temperature for the whole building. As a result, some areas of the building have higher operating temperatures than others and, consequently, comfort is very different from one area to another. This aspect is very important because the lack of thermal comfort in office buildings affects occupational health and work performance and is even related to psychological and mental health problems as has been well demonstrated in many studies [16,17,18,19,20].
The characteristics of the BShs climate, such as the high annual solar radiation and low thermal oscillation between the coldest and hottest days of the year [21,22], are decisive for the energy performance of buildings. However, there are a lack of independent studies analysing the influence of the new energy-saving standard on the energy efficiency and comfort in buildings in the BShs climate. This is important because it is a climate for which the geographical area is clearly expanding owing to climate change, as several studies have shown [23,24,25].
Previous studies have demonstrated the effect of high solar radiation on the thermal performance of buildings with considerable glazing in the BShs climate [26,27]. High solar radiation increases the radiant temperature of interior façade surfaces, greenhouse effect inside buildings, and operating temperature. This situation has a strong effect on indoor comfort and cooling-energy costs in summer.
The influence of solar thermal radiation on energy consumption and the beneficial effect of solar control are widely reported in the literature [28,29,30]. The impact of solar radiation on the thermal comfort of the users has also been extensively demonstrated [10]. Fanger’s method for the assessment of thermal comfort considers a combination of parameters to determine thermal comfort: air dry-bulb temperature, thermal radiation, air humidity content, relative air velocity, personal activity, and clothing level [31,32,33,34]. Other studies have also investigated the influence of other factors, such as metabolic rate, gender, age, and mood, on thermal comfort [35,36,37,38,39,40,41,42,43,44]. In Fanger’s equation, the thermal radiation factor is referred to as the mean radiant temperature (MRT). However, its effect on thermal comfort is usually not considered, as in Spanish standards. Consequently, for conventional air-conditioning systems, the dry-bulb temperature of the indoor air is the main parameter that is normally controlled. All other parameters are supposed to be within the limits specified in the design phase. However, the dry-bulb air temperature cannot accurately or completely reflect the perceived thermal comfort [45].
Therefore, in sunny and dry climates, the influence of the surrounding buildings or trees on the solar radiation affecting the building is also very important, as demonstrated by Arboit and Betman [46]. However, proper control of solar radiation has also given rise to specific solutions to optimise building energy efficiency and daylighting as a function of solar radiation [47], highly technological developments by means of electrochromic and thermochromic glasses for improving energy efficiency and comfort [48], and the use of automatic solar control methods and shading systems by means of smart glazing [49,50,51,52]. These types of solutions allow solar radiation control by means of movable sun protection systems adaptable year-round [53], preferably on the outside of the glazing because they offer better thermal comfort compared to internal solar-shading devices [54]. Other studies demonstrate the advantages of analysing direct and diffuse solar radiation separately to improve the solar control of buildings while keeping lighting and indoor temperature at the comfort level [55].
In conclusion, the strong solar radiation in the BShs climate [56] needs different energy-saving solutions than those in continental and central European climates [57,58]. However, the particularities of this climate are not considered enough by current Spanish standards.
The objective of this study is to determine both qualitatively and quantitatively how the new Spanish energy-saving standard influences energy efficiency and indoor thermal comfort, by considering the conditions of the dry Mediterranean climate (BShs) within a warm semi-arid climate (BSh). For this purpose, how to reduce winter dry-bulb air temperatures to 19 °C and increase summer dry-bulb air temperatures to 27 °C to influence the thermal performance of buildings should be analysed and compared with previous standards.
This study is about sustainability in buildings, but it focuses on energy savings in air -conditioning systems and how the application of the new RDL 14/2022 standard [2] affects thermal comfort. This standard only concerns the energy savings of HVAC systems by modifying the indoor air temperature of the building and applies to new and existing buildings. This standard does not address other important aspects of sustainability in buildings, such as life-cycle analysis and the use of recycled or green materials [59,60], because they are related to the construction and renovation of buildings.
The experimental design of this research consisted of a comparative study with on-site measurements of thermal performance, thermal comfort, and energy needs using the current and previous standards. For this, the operating and dry-bulb air temperatures established by each standard were considered. This includes on-site measurements of the building’s indoor temperatures and surveys of the thermal comfort of the building’s users. The overall temperatures, thermal comfort of the entire office, and the thermal comfort of each office zone were studied in detail. The study also includes the evaluation of the comfort and energy efficiency of a proposed improvement in the current standard using computer simulations. The proposed modification is to improve solar radiation control in summer to reduce the mean radiant temperature and operating temperature in the hottest months.
On-site measurements were complemented by computer simulations. Questionnaires were complemented using the Fanger analytical method to study thermal comfort. This method establishes the predicted mean vote (PMV) and predicted percentage of dissatisfied users (PPD). PMV values considered in this method are: −3 (cold), −2 (fresh), −1 (slightly cool), 0 (neutral), +1 (slightly warm), +2 (warm), and +3 (very hot). Values between −1 and +1 are considered as appropriate in the adaptive method defined by the ASRAHE 55 standard [61]. For the PPD, values of less than 10% unsatisfactory were assumed to be suitable.
The novelty of the study is to analyse and question the current energy-saving standard in Spain, showing that it reduces energy costs but makes the indoor comfort of buildings much worse. The research proposes a specific alternative for the BShs climate that improves the energy savings of buildings without reducing the comfort of the users below acceptable limits. This will lead to a greater social acceptance of the energy-saving standards, favouring their effective compliance by users. The contributions and conclusions of this study can be applied to many other office buildings in this climate.
2. Materials and Methods
The case study building is in the city of Alicante (Spain). This area has a dry Mediterranean climate (BShs) within a warm semi-arid climate (BSh) according to the Köppen–Geiger climate classification (Figure 1). It is a temperate climate owing to the Mediterranean Sea breeze that acts as a natural thermal regulator. It is characterised by hot, dry summers and mild winters. The average summer temperature is around 27 °C, and the average winter temperature is around 18 °C. However, one of the most important characteristics of this climate is the strong solar radiation throughout the year, exceeding 3000 h of annual sunshine. The climate database of the weather station of El Altet (Alicante) was used for the energy calculations.

Figure 1.
(a) Location in BShs climate zone (red) according to the Köppen–Geiger Climate Classification for the Iberian Peninsula, Balearic Islands, and Canary Islands of the State Meteorological Agency of the Spanish Ministry for Ecological Transition; (b) location map.
The case study is for an office building dedicated to the Alicante Architects’ Council headquarters. It is located in the urban centre of the city in an area where there are many administrative and commercial buildings. It was a former housing building built at the end of the 19th century and was refurbished for office use in 2000. The original façade walls were maintained, but the structure, exterior carpentry, and entire interior of the building were replaced. It is a five-storey building. The main façade is oriented to the southwest, which is very sunny, and there is a square in front of the building. The other façades are oriented to the east and west to narrow streets with little sunlight (Figure 2a). The studied offices are located on the first floor of the building. The plan geometry is almost rectangular (36 m long and 19 m wide) (Figure 2b).

Figure 2.
Case study building: (a) external image of the building; (b) perspective of the office floor plan.
This building was selected because it has characteristics similar to those of many office buildings located in central European cities, and these features allow the results to be extrapolated to many other case studies. It has a high proportion of glazing, with a window-to-wall ratio of 37.5%, allowing plenty of natural light inside the building. The characteristics of the façades are typical of the vernacular architecture in the area, but the interior has been adapted to the current needs of administrative buildings. The floor plan of the building is quite diaphanous, with several office spaces in the main area and a secondary area for stairs, elevators, and facilities.
The methodology had three phases. First, a study of the constructive conditions of the building enclosures was conducted. Second, a systematised comparative study of thermal performance, thermal comfort, and energy demand was carried out, considering the operating and dry-bulb air temperatures of the new and previous standards. This study included on-site temperature measurements, surveys of building users, and recordings of electricity consumption. Third, a proposal to improve the current standard was evaluated using computer simulations. This methodology made it possible to compare the thermal performance of the building under the previous and current standards, analyse its effects on thermal comfort and energy efficiency, and study possible improvements to the current standard.
Phase 1. Two types of on-site measurements were taken to study the hygrothermal and constructive features of the building: thermographic photographs to identify areas of the building’s thermal envelope with different insulation characteristics and thermal bridges (Figure 3a) and the thermal transmittance of the façades using a thermal transmittance flowmeter (Figure 3b).

Figure 3.
On-site measurements of the studied building enclosures: (a) thermographic photograph; (b) thermal transmittance measurement.
The thermal transmittance flowmeter estimates the temperature of the indoor surface of the wall from the ratio between the outside and indoor building temperatures. To obtain accurate measurements according to the meter manufacturer’s instructions, the thermal transmittance measurements were carried out in winter and with a thermal difference of more than 15 °C between the outside temperature and inside temperature of the building. In addition, thermal transmittance measurements were carried out with constant and stable indoor and outdoor temperatures for several hours. The results obtained coincide with the calculations made using computer simulations considering the thickness and materials of the envelopes.
Phase 2. On-site measurements of daily and annual evolutions of indoor temperatures were carried out to study the thermal performance. The dry-bulb air temperature was measured using a hot-wire sensor (Figure 4a). The mean radiant temperature was also determined using a black globe probe (Figure 4b) and by measuring the temperature of indoor surfaces with a thermographic camera and thermocouples. Relative humidity, indoor air velocity, and outdoor air temperature were also measured using a humidity/temperature sensor with wireless handle.
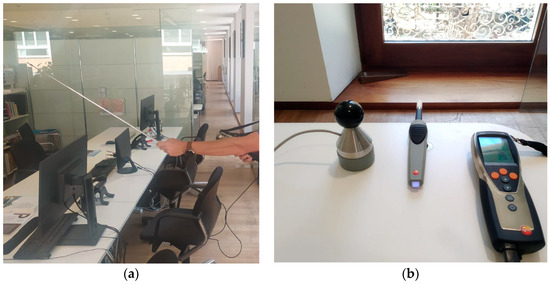
Figure 4.
On-site measurements: (a) hot-wire probe measurements; (b) black globe temperature measurements, and wireless probe measurements.
Questionnaire surveys were also conducted to study thermal comfort and test the users’ perception and their thermal adaptation inside the office. The surveys were carried out among the 20 office employees, who are regular users of the building throughout the whole year.
Records of the current electricity consumption specific to the days analysed were taken to study the energy needs. The HVAC system in the studied offices is a multi-zone system with one outdoor heat pump unit and four indoor supply air units, and the only energy source is electricity.
All the surveys and on-site measurements were carried out following the same procedure. Measurements and surveys had to be conducted simultaneously at least half an hour after all the employees were at their workstations to be acclimatised to the environmental conditions. Measuring instruments were switched on 5 min before taking the measurements to acclimatise to the ambient conditions. The air-conditioning units should have been switched on at the set temperature at least one hour before the measurements, and surveys were taken so that temperatures began to stabilise throughout the office.
The requirements of each standard were applied on different days to study the thermal performance of the building using both the current Spanish thermal comfort standard and previous standards. To this end, the operating temperatures and relative humidities established by Royal Decree 1027/2007 and the air temperatures and relative humidities established by Royal Decree 1826/2009 and Royal Decree Law 14/2022 were used. To apply Royal Decree 1027/2007, average operating temperatures of the indoor environment of 25 °C in summer and 21 °C in winter were considered. To obtain these operating temperatures, the air temperature was adjusted by considering the average radiant temperature obtained in the centre of the room. To analyse the thermal behaviour according to Royal Decree 1826/2009, air temperatures of 26 °C in summer and 21 °C in winter were used. In accordance with Royal Decree Law 14/2022, air temperatures of 27 °C in summer and 19 °C in winter were used.
In each case, daily evolutions of the dry-bulb air temperature, mean radiant temperature, and operating temperature were analysed, and their distributions in the office space were studied. On-site measurements were taken on consecutive days with equal weather conditions and with differences of less than 1 °C in the mean outdoor temperature and mean outdoor radiant temperature to compare the influence of each standard on comfort and energy consumption in the building. In this way, the outdoor temperature and radiation conditions were very similar, and the only variable that was modified was the indoor temperature according to each applied standard. On each day, the indoor temperatures set by one of the standards were applied. Consequently, these requirements made it necessary to carry out measurements on specific days. For this reason, it was not possible to use an automatic data collection system. On-site measurements were taken every fortnight over a period of twelve months to cover all the climatic conditions during the year.
A Testo 868 camera (Testo SE & Co. KGaA, Titisee, Germany) was used to take thermographic photographs. The measurement of thermal transmittance, humidity, dry-bulb temperature, and average radiant temperature were carried out using a Testo 435-2 multifunctional instrument (Testo SE & Co. KGaA, Titisee, Germany) calibrated at standard settings (Table 1).

Table 1.
Summary of measurement instrument features.
Phase 3. To study the proposed improvement in the current normative, computer simulations were used. Before calculating the new proposal, the energy simulation tool’s calculations were adjusted and validated. For this purpose, the current measurements were then checked with computer calculations. The survey results were also compared with the results obtained from the computer calculation of the estimated average vote (PMV) and the percentage of dissatisfied users (PPD) using the Fanger analytical method for estimating indoor comfort. In addition, the annual energy demand was calculated using computer simulations by comparing the obtained results with current measurements.
DesignBuilder software (version v.7.0.1.006, DesignBuilder Software Limited, Stroud, UK) was used for computer calculations. This software allows the simulation of the energy efficiency and thermal comfort in buildings using the EnergyPlus calculation engine [62]. This software also provides for computational fluid dynamics (CFD) calculations to simulate the mean radiant temperature distribution, operating temperature, and estimated thermal comfort in different zones inside the building. For the computer simulations, the thermal transmittances of the façade and air infiltrations of the window frames measured on-site were considered. Air infiltrations are quite high, as in many historic buildings in Spain [63]. This is due to the large proportion of wall openings in the façade and the characteristics of the timber joinery used in renovations for aesthetic and heritage-protection reasons.
The computer model considered the geometrical and constructive features of the building and climatic area. In accordance with current standards, the calculation method considered the gains and losses due to the thermal transmittance of the enclosures, the transmission of solar radiation considering the solar factor of the glazing, and the air permeability and absorptivity of the frames [64]. The outdoor temperature and relative humidity were also considered for virtual simulations of the hygrothermal performance (Table 2).
Table 2.
Summary of thermal properties of the building façades according to on-site measurements.
The operating temperatures and dry-bulb air temperatures established by each standard were considered to calculate the influence of each standard on the thermal performance of the building. Temperatures were progressively modified to calculate the impact of each modification on the energy efficiency and thermal performance of the building (Table 3).
Table 3.
Summary of hygrothermal characteristics of previous and current standards.
Calculations considered occupation, usage calendars and schedules, set-point temperatures, air-conditioning equipment performance, ventilation air renewals required by regulations, and indoor lighting loads (Table 4).
Table 4.
Parameters of computer calculations.
After verifying the validity of the computer simulations, the proposed new solution and its influence on the thermal performance, thermal comfort, and energy efficiency of the building were calculated. The proposed modification includes the use of passive solar control systems with movable shading elements activated in summer. The parameters considered were as follows (Table 5).
Table 5.
Parameters of computer calculations.
3. Results
This section shows the influences of the three analysed regulations on the indoor temperatures, thermal comfort, and energy demand of the case-study offices. The results of the proposed modification are also shown.
3.1. Indoor Temperatures
3.1.1. Overall Indoor Temperatures
The results obtained from on-site measurements of the hygrothermal performance show significant differences between the dry-bulb air temperature, mean radiant temperature, and mean operating temperature over the year. These differences are also significant over the course of the workday within a single day. These differences greatly vary depending on the regulations and time of year (Figure 5).
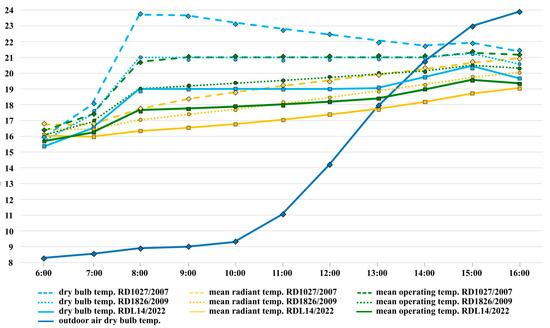
Figure 5.
On-site measurements of overall indoor temperatures during the work day in the extreme winter week (3–7 January) by applying the three analysed standards: mean dry-bulb air temperature, mean radiant temperature, and mean operating temperature [2,7,8].
In the coldest weeks of winter, the mean radiant temperature and operating temperature are significantly lower than the dry-bulb air temperature.
If the current RDL 14/2022 standard [2] is applied, the dry-bulb air temperature is maintained at 19 °C, but the mean operating temperature is below 18 °C for many hours. This is 3 °C lower than that with the RD 1027/2007 standard [7] and 1.5 °C lower than that with the RD 1826/2009 standard [8] (Table 6).
Table 6.
Summary of on-site measurements of overall indoor temperatures during the work day in the extreme winter week (3–7 January) by applying the three standards.
In the hottest weeks of summer, the mean radiant temperature and operating temperature are much higher than the dry-bulb air temperature (Figure 6).
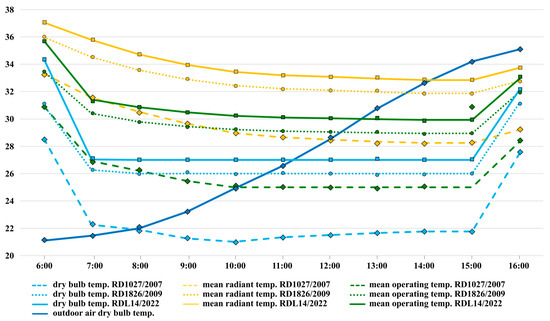
Figure 6.
On-site measurements of overall indoor temperatures during the work day in the extreme summer week (25–29 July) by applying the three analysed standards: mean dry-bulb air temperature, mean radiant temperature, and mean operating temperature [2,7,8].
If the current RDL 14/2022 standard [2] is applied, the dry-bulb air temperature is maintained at 27 °C, but the mean operating temperature is above 30 °C every morning. This is more than 5 °C higher than that with the RD 1027/2007 standard [7] and more than 1 °C higher than that with the RD 1826/2009 standard [8] (Table 7).
Table 7.
Summary of on-site measurements of overall indoor temperatures during the workday in the extreme summer week (25–29 July) by applying the three standards.
3.1.2. Indoor Temperature Distribution
On-site measurements at different locations in the office show very significant differences in mean radiant temperatures and operating temperatures in different areas. These differences greatly vary depending on the applied regulations and time of year.
In the coldest weeks of winter, the temperature of the interior glazed surfaces drops below 14 °C in early morning hours. This causes that the mean radiant temperature in the areas near windows to be much lower than that in interior areas of the office. The results show differences of up to 3 °C.
If the current RDL 14/2022 standard [2] is applied, the mean radiant temperature drops to 16 °C near the façade, while in the centre of the office, the average radiant temperature is close to 19 °C. This is between 1 and 2 °C lower than that with the RD 1027/2007 standard [7]. Consequently, the operating temperature with the RDL 14/2022 standard [2] drops to 17.5 °C near the façade. This is 1.5 °C lower than that with the RD 1027/2007 standard [7] (Figure 7).
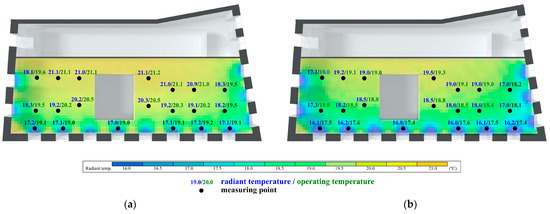
Figure 7.
Distribution of the mean radiant temperature and operating temperature depending on the location during the workday in the extreme winter week (3–7 January): (a) by applying the RD 1027/2007 standard [7]; (b) by applying the RDL 14/2022 standard [2].
In the hottest weeks of summer, the temperatures of the interior glazed surfaces drop more than 45 °C. This causes the mean radiant temperature to be much higher than that in interior areas of the office. The results show differences of up to 6.5 °C.
If the current RDL 14/2022 standard [2] is applied, the mean radiant temperature reaches 36 °C near the façade, while in the centre of the office, the average radiant temperature is close to 29.5 °C. This is between 2 and 3.5 °C higher than that with the RD 1027/2007 standard [7]. Consequently, the operating temperature with the RDL 14/2022 standard [2] reaches 31.5 °C near the façade. This is 3.5 °C higher than that with the RD 1027/2007 standard [7] (Figure 8).

Figure 8.
Distribution of the mean radiant temperature and operating temperature depending on the location during the workday in the extreme summer week (25–29 July): (a) by applying the RD 1027/2007 standard [7]; (b) by applying the RDL 14/2022 standard [2].
3.2. Thermal Comfort
3.2.1. Overall Thermal Comfort
Survey results from users show that the mean thermal sensation inside the building is much worse under the current standard than under previous standards. As shown in the graph (Figure 9a), if the temperatures established by the RD 1027/2007standard [7] are applied to mean thermal sensation values above −1 (slightly cool) in winter and below +1 (slightly warm) in summer, the mean thermal sensation inside the building is perceived as approximately neutral year-round. If the temperatures established by the RD 1826/2009 standard are applied to values reaching −1 in winter and exceeding +1 in summer and if the temperatures established by the RDL 14/2022 standard [2] are applied to mean thermal sensation values below −1 in winter and much higher than +1 in summer, with the RDL 14/2022 standard [2], the mean thermal sensation is perceived as slightly cool most of the time in winter. In summer, the mean thermal sensation is perceived as warm.
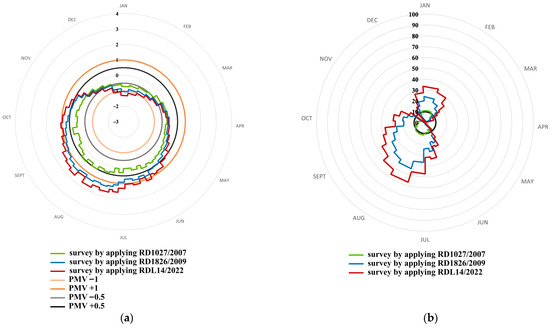
Figure 9.
Results of thermal comfort surveys by applying the three analysed standards: (a) occupants’ thermal sensation: −3 (cold), −2 (fresh), −1 (slightly cool), 0 (neutral), +1 (slightly warm), +2 (warm), +3 (very hot); (b) percentage of dissatisfied users [2,7,8].
According to these data, the results show that the temperatures established by the RD 1027/2007 standard [7] do not exceed 10% of dissatisfied users throughout the year (Figure 9b). However, if the RD 1826/2009 standard [8] is applied, the percentage of dissatisfied people reaches 45% in summer and 25% in winter. Additionally, if the RDL 14/2022 standard [2] is applied, the percentage of dissatisfied people reaches almost 60% in summer and 35% in winter.
3.2.2. Indoor Comfort Distribution
The results of the comfort surveys show very important differences in the occupants’ thermal comfort sensation depending on their location in the office. These differences greatly vary depending on the applied standard and time of year.
With the RD 1027/2007 standard [7], the mean thermal sensation in winter is perceived as neutral by 75% of the employees and slightly cool by 25% in areas close to the façade. However, with the RDL 14/2022 standard [2], the mean thermal sensation near the façades is perceived as neutral by only 25% of employees, slightly cool by 50%, fresh by 12.5%, and cold by 12.5%. Therefore, temperatures are not comfortable for 62.5% of the users (Figure 10).
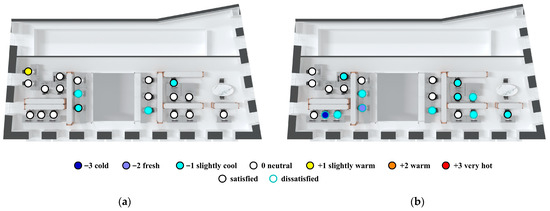
Figure 10.
Distribution of the results of thermal comfort surveys depending on the location during the workday in the extreme winter week (3–7 January): (a) by applying the RD 1027/2007 standard [7]; (b) by applying the RDL 14/2022 standard [2].
With the RD1027/2007 standard [7], the mean thermal sensation in summer is perceived as neutral by 65% of the employees and slightly warm by 35% in areas close to the façade. However, with the RDL 14/2022 standard [2], the mean thermal sensation near the façades is perceived as slightly warm by 37.5% of the employees, warm by 50%, and very hot by 12.5%. Therefore, temperatures are not comfortable for 90% of the users (Figure 11).
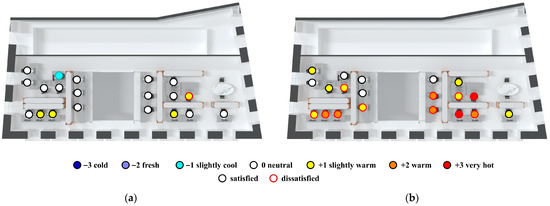
Figure 11.
Distribution of the results of thermal comfort surveys depending on the location during the workday in the extreme summer week (25–29 July): (a) by applying the RD 1027/2007 standard [7]; (b) by applying the RDL 14/2022 standard [2].
3.3. Energy Efficiency
The registers of the building’s energy consumption show very important differences in the energy demand depending on the temperatures according to the applied standards. In summer, daily cooling-energy needs are reduced by an average of 30% with the application of the RD 1826/2009 standard [8] compared to the previous regulations and by more than 50% with the application of the RDL 14/2022 standard [2]. In winter, daily heating-energy needs are reduced by around 30% with the application of the RD 1826/2009 standard [8] and by more than 45% with the application of the RDL 14/2022 standard [2]. The on-site measurements were complemented by computer simulations to calculate the annual energy needs for cooling and heating. The obtained results confirm this significant decrease in energy needs with the implementation of the latest energy-saving standards.
If the former RD 1027/2007 standard [7] is applied, the heating-energy needs in winter reach 16.32 KWh/m2 year, and the cooling-energy needs in summer reach 47.20 KWh/m2 year. Therefore, the overall annual energy needs (Cooling + Heating) reach 63.58 KWh/m2 year. If the RD 1826/2009 standard [8] is applied, the heating-energy needs in winter decrease by up to 12.49 KWh/m2 year, and the cooling-energy needs in summer decrease by up to 35.81 KWh/m2 year. Therefore, the overall annual energy needs (Cooling + Heating) decrease by up to 48.30 KWh/m2 year. If the current RDL 14/2022 standard [2] is applied, the heating-energy needs in winter decrease by up to 6.28 KWh/m2 year, and the cooling-energy needs in summer decrease by up to 31.50 KWh/m2 year. Therefore, the overall annual energy needs (Cooling + Heating) decrease by up to 37.78 KWh/m2 year (Figure 12).
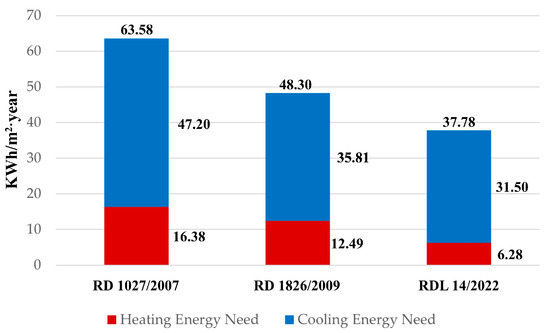
Figure 12.
Cooling- and heating-energy needs depending on the temperatures used according to the applied standards [2,7,8].
These results from the simulation calculations confirm reductions in annual energy needs of 24.03% with the application of the RD 1826/2009 standard [8] and 40.58% with the application of the RDL 14/2022 standard [2]. The annual cooling-energy needs are reduced by 24.13% with the application of the RD 1826/2009 standard [8] and 33.26% with the application of the RDL 14/2022 standard [2]. The annual heating-energy needs are reduced by 23.75% with the application of the RD 1826/2009 standard [8] and 61.66% with the application of the RDL 14/2022 standard [2].
The reductions in energy needs obtained by computer simulations are similar to the reduction in the current-energy consumption registers of the building. Comparative analysis of actual measurements and computer results allows the validation of the computer simulations because the deviations are small. The software provides more complete annual data because the current energy-consumption records correspond to specific days.
3.4. Proposal to Improve Solar Radiation Control
3.4.1. Indoor Temperatures
Computer software was used to calculate improvements in comfort and energy efficiency that would result from controlling the solar radiation. To this end, on-site measurements of indoor temperatures were checked with computer results to adjust and validate the computer calculations. The on-site measurements show that the mean operating temperature is between 20.2 °C in winter and 26.7 °C in summer if the former RD 1027/2007 regulation is applied. If the RD 1826/2009 standard [8] is applied, the mean operative temperature is between 18.4 °C in winter and 28.9 °C in summer. Additionally, if the current RDL 14/2022 regulation is applied, the mean operating temperature drops to 16.6 °C in winter and rises to 30 °C in summer. Clearly, the annual thermal oscillation increases with the current standard because it allows for more extreme setpoint temperatures (Figure 13).
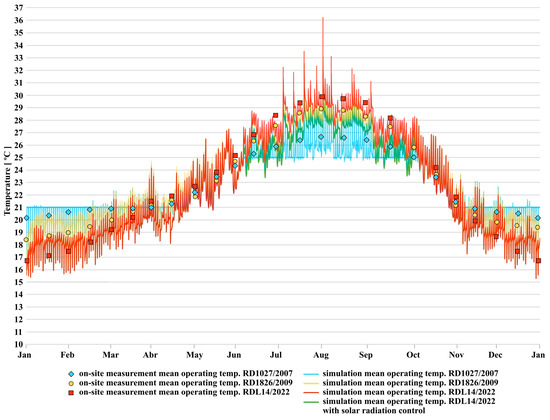
Figure 13.
Indoor temperatures considering the three studied standards and by increasing the solar control of the glazing with movable solar shading in summer: on-site measurements and simulation results [2,7,8].
The computer simulations show more annual and daily thermal fluctuations because the results show all the hourly temperatures throughout the day. However, the on-site measurements and computer calculations show a very similar daily and monthly temperature development. The variance between the actual and calculated temperatures in the same time zone is less than 8%.
Based on these results, the effect of increasing the solar control of the glazing with movable solar shading in summer on the indoor operating temperature was calculated. The obtained results show a reduction of up to 2 °C in the indoor operating temperature in summer. This allows the indoor operating temperature to remain below 28 °C almost all the time in summer.
The results obtained from CFD computer simulations show much lower mean radiant temperatures and operating temperatures in summer than those without solar radiation control. The differences between the temperatures in different areas of the office are also smaller. Therefore, the temperature remains much more stable and uniform all around the office. In the hottest week of summer, the average radiant temperature is between 30 °C near the façade and 27 °C in interior areas of the office. Therefore, the operating temperature near the façade does not exceed 28.5 °C and is approximately 27 °C in the centre of the room. These results show differences of only 1.5 °C between the different zones (Figure 14).

Figure 14.
Distribution of the mean radiant temperature and operating temperature depending on the zone during the workday in the extreme summer week (25–29 July) by applying the RDL 14/2022 standard [2] with movable solar shading.
3.4.2. Comfort
The comparison of on-site measurements and computer simulations gives quite similar results to allow the validation of the computer calculations. The predicted mean vote (PMV) and predicted percentage dissatisfied (PPD) simulations obtained according to the Fanger method show a greater range of results than the current measurements. This is because the simulations cover all the daily working hours, while the current measurements are the mean daily thermal sensations of the occupants (Figure 15).
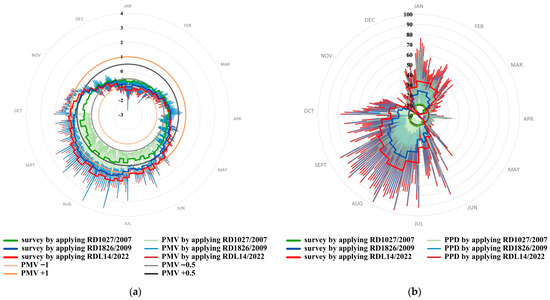
Figure 15.
Thermal comfort analysis considering the three studied standards: (a) comparison between user surveys on thermal comfort and predicted mean vote (PMV) calculated using the Fanger analytical method: −3 (cold), −2 (fresh), −1 (slightly cool), 0 (neutral), +1 (slightly warm), +2 (warm), and +3 (very hot); (b) comparison between the percentage of dissatisfied users according to the surveys and predicted percentage of dissatisfied users (PPD) calculated using the Fanger analytical method [2,7,8].
If temperatures established by the RD 1027/2007 standard [7] are applied, analytical calculations show that the mean thermal sensation inside the building is perceived as approximately neutral year-round. However, with the RDL 14/2022 standard [2], the mean thermal sensation is perceived as slightly cool most of the time in winter. In summer, the mean thermal sensation is perceived from slightly warm to warm.
If temperatures established by the RD 1027/2007 standard [7] are applied, analytical calculations of comfort estimation according to the Fanger method show PMV values between −1 and +1 year-round. With the RD 1826/2009 standard [8], PMV values are below −1 from January to February and above +1 from mid-June to mid-October. With the RDL 14/2022 standard [2], PMV values are below −1 from December to March and above +1 from early June to November. In line with these data, PPD results obtained using RD 1027/2007 temperatures show mean values below 20% year-round. PPD results obtained with the RD 1826/2009 standard [8] show values above 30% from January to February and from June to October. Finally, PPD results obtained with the RDL 14/2022 standard [2] show mean values of 35% from December to March and mean values of 65%, with same values close to 90% from June to October.
Based on these results, the effect of improved solar control of glazing in summer on thermal comfort was calculated. If the RDL 14/2022 standard [2] is applied by adding solar control to the glazing, the comfort is significantly improved. The analytical calculations show PMV values slightly above +1 (slightly warm) from the beginning of July to September. The results are below +1 for the rest of the year (Figure 16a). As shown in the graph, the values in winter do not change, but in summer, the values improve substantially with solar control. Therefore, the PPD calculations with solar control show mean values of 25% all summer (Figure 16b). This means a much lower dissatisfaction rate than that under the current standard.
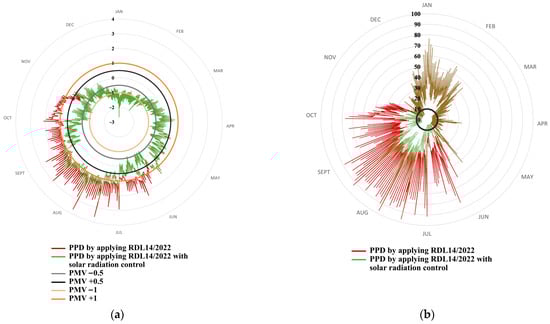
Figure 16.
Thermal comfort analysis by applying the current RDL 14/2022 standard [2] without movable solar shading and with movable solar shading: (a) predicted mean vote (PMV) calculated using the Fanger analytical method: −3 (cold), −2 (fresh), −1 (slightly cool), 0 (neutral), +1 (slightly warm), +2 (warm), and +3 (very hot); (b) predicted percentage of dissatisfied users (PPD) calculated using the Fanger analytical method [2].
The results obtained from CFD computer simulations show that thermal comfort remains much more homogeneous between different areas of the office. PMV values are around +1 and PPD values are below 25% in most of the office (Figure 17).
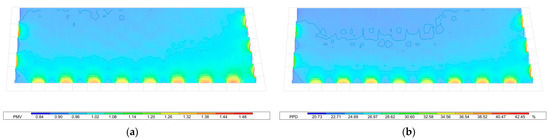
Figure 17.
Distribution of thermal comfort depending on the location during the workday in the extreme summer week (25–29 July) by applying the RDL 14/2022 standard [2] with movable solar shading: (a) predicted mean vote (PMV) calculated using the Fanger analytical method; (b) predicted percentage of dissatisfied users (PPD) calculated using the Fanger analytical method.
3.4.3. Energy Efficiency
The results obtained from the simulation calculations show a very important decrease in the annual energy needs if RDL 14/2022 temperatures are applied with solar control of the glazing in summer. The heating-energy needs in winter remain at 6.28 KWh/m2 year, and the cooling-energy needs in summer decrease by up to 13.07 KWh/m2 year. These results show a reduction of 72.30% in the cooling-energy needs in summer with respect to the RD 1027/2007 standard [7] and 58.51% with respect to the RDL 14/2022 standard [2] without solar control. Therefore, the overall annual energy needs (Cooling + Heating) decrease by up to 19.36 KWh/m2 year (Figure 18). This represents a reduction of 69.55% compared to the RD 1027/2007 standard [7] and 48.76% compared to the RDL 14/2022 standard [2] without solar control.
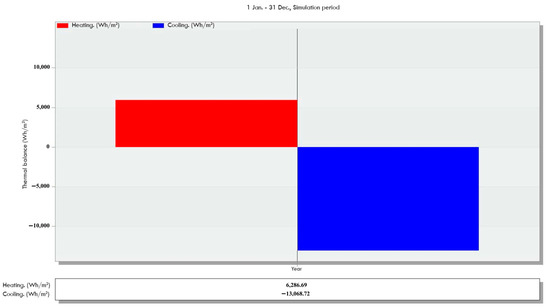
Figure 18.
Cooling- and heating-energy needs by applying the current RDL 14/2022 standard [2] with solar control of the glazing in summer.
4. Discussion
4.1. Indoor Temperature
4.1.1. Overall Indoor Temperature
The results obtained from the on-site measurements of the indoor temperatures show that the dry-bulb air temperature, mean radiant temperature, and mean operating temperature greatly vary from each other over the year and during working hours. These variations are different depending on the standard used to choose the setpoint temperatures. If the former RD 1027/2007 regulation is applied, the operating temperature reaches the value set by the standard. However, the RD 1826/2009 and RDL 14/2022 standards [2] set neither the operating temperature nor the dry-bulb air temperature. Consequently, the current regulation does not consider the effect of thermal radiation from the interior surfaces of the building. This effect is especially important in winter for cold climates or in summer for hot climates with high solar radiation, such as the BShs climate, especially for large, glazed surfaces, such as those of office buildings. The temperatures of interior surfaces influence the mean radiant temperature inside the building, and this situation also influences the operating temperature and thermal comfort. The analysis of the obtained results shows that, in winter, the dry-bulb temperature of indoor air increases rapidly when the heating system is activated. However, the mean radiant temperature and operating temperature increase more slowly. This is because façades and windows remain much cooler. In summer, the dry-bulb air temperature decreases rapidly by cooling. However, the mean radiant temperature and operating temperature decrease more slowly. This is because façades and windows are heated by solar radiation. Consequently, the operating temperature varies throughout the day and is especially influenced by the variation in the mean radiant temperature.
From the analysis of on-site measurements, the mean radiant temperature has a strong influence on the operating temperature in buildings with a large façade and considerable glazing, such as the case-study building. This influence is the highest in the first few hours of occupancy of the building because the temperatures of the interior surfaces of façades maintain the temperature that the building had in the previous hours when it was unoccupied and not air-conditioned. Consequently, the operating temperature is lower than the dry-bulb air temperature in winter and higher in summer. From this analysis, the regulations that set the dry-bulb air temperature instead of the operating temperature, such as the RD 1826/2009 and RDL 14/2022 standards [2], do not allow the control of the influence of the mean radiant temperature on the operating temperature. Furthermore, the current RDL 14/2022 standard [2] determines a much lower air temperature in winter (19 °C) and much higher air temperature in summer (27 °C) than the previous standards. Therefore, with the current standard, the mean operating temperature is quite low (18 °C) during most of the morning hours in winter and too high (30 °C) during the whole workday in summer.
4.1.2. Indoor Temperature Distribution
If we analyse the temperature distribution from on-site measurements at different locations in the office, the differences between the dry-bulb air temperature, mean radiant temperature, and mean operating temperature are even greater in different areas. Consequently, operating temperatures are even more extreme in winter and summer. The differences are greater between central areas of the office and areas close to façades. This is because temperatures of interior surfaces of façades influence the mean radiant temperature depending on proximity to the façade. The influence is greater especially near the windows because glazing and frames have a higher thermal transmittance than enclosing walls. The analysis of the obtained results shows that, in winter, the indoor air temperature increases quickly when the heating system is activated, but the façades and windows remain much colder. Therefore, the mean radiant temperature is lower near façades. In summer, although the room maintains a cool air temperature owing to cooling, façades and windows are heated by solar radiation. Therefore, the mean radiant temperature is much higher near façades. Consequently, near façades, the mean operating temperature is also much lower in winter and much higher in summer than in the centre of the office. In winter, employees located near windows feel up to 3 °C or 4 °C lower operating temperatures than employees located in the centre of the room. In summer, because the building under study is in a BSH climate, the difference is even greater, reaching more than 6 or 8 °C of operating temperature compared to the operating temperature that the rest of their colleagues experience. This means that the distribution of the operating temperature is not very homogeneous between different areas of the office and reaches very extreme values in certain points of the office.
Consistent with this data, the application of the dry-bulb temperatures established by the latest RDL14/2022 regulation leads to operating temperatures that are too low in winter and too high in summer in areas close to façades.
4.2. Comfort
4.2.1. Overall Comfort
The results of the comfort surveys show that the temperatures set by the former RD 1027/2007 standard [7] are comfortable for most employees year-round. However, the temperatures set by the RD 1826/2009 standard [8] are not comfortable for almost half the employees in summer and for 25% in winter. The results are even worse if the temperatures set by the RDL 14/2022 standard [2] are applied, being uncomfortable for most employees in summer and for 35% in winter.
The progressive deterioration in thermal comfort with the latest regulations is consistent with the results of on-site measurements of indoor temperatures obtained with each regulation. The comparative analysis between on-site temperature measurements and surveys confirms that the application of energy-saving regulations with more extreme setpoint temperatures significantly reduces the thermal comfort of the users. In the case of the current RDL 14/2022 regulation, temperatures are not comfortable for most employees. This means that, in the absence of control methods, employees apply setpoint temperatures outside ranges established by the current regulation.
4.2.2. Indoor Comfort Distribution
The inhomogeneity of the operating temperature distribution shown by the on-site measurement results implies a much greater discomfort in proximity of façades. This contributes to the fact that the loss of comfort observed under the latest regulations is even more severe in these areas. With the RDL 14/2022 standard [2], discomfort near façades is almost double the average of discomfort of the office employees, reaching 90% in summer and 62.5% in winter.
The results of the surveys are consistent with the temperature distribution obtained from on-site measurements. The comparative analysis of the measurements and surveys confirms that the application of energy-saving standards that only set dry-bulb temperatures does not allow enough control of the operating temperature distribution and thermal comfort. These standards, such as RD 1826/2009 and RDL 14/2022, do not consider the significant differences in the radiant temperature and operating temperature depending on the area of the office. Consequently, their influence on thermal comfort is also not taken into account. This means that the use of more extreme setpoint temperatures, such as those established by the current RD 14/2022 regulation, leads to unacceptable levels of thermal discomfort in some areas of the office, causing discomfort in some employees and work and health problems.
4.3. Energy Efficiency
The records of the energy consumption of the building and results obtained from the simulation calculations show a significant decrease in energy needs with the application of the latest energy-saving regulations.
The reduction in energy needs with the RD 1826/2009 standard [8] compared to the previous regulation is explained by the fact that this standard increases the setpoint temperature from 25 °C to 26 °C in summer. It is also influenced because this standard fixes the dry-bulb air temperature instead of the operating temperature. This has an impact on energy consumption because lower setpoint temperatures than those in previous standards are applied in winter and higher setpoint temperatures are applied in summer. The application of the current RDL14/2022 standard [2] produces an even greater reduction in energy demand. This is because it fixes the dry-bulb temperature instead of the operating temperature and reduces the setpoint temperature to 19 °C in winter and increases it to 27 °C in summer. By setting more extreme setpoint temperatures, the indoor temperature of the building complies with the standard for more hours without activating air-conditioning systems. This reduction is especially significant in temperate climates, such as the BShs climate. The smaller thermal oscillation in this climate between the minimum outside temperature in winter and maximum outside temperature in summer makes it possible to reach the indoor temperatures of the new standard without using air-conditioning equipment on many days during the year.
The analysis of the results leads to the conclusion that the application of regulations that set more extreme dry-bulb air temperatures significantly reduces the energy demand of the building.
4.4. Proposal to Improve Solar Radiation Control
From the obtained results, two main negative aspects for comfort can be deduced in the current standards: the application of more extreme setpoint temperatures in winter and summer and the lack of homogeneity in the distribution of operating temperatures. From the analysis of on-site temperature measurements, the inhomogeneity of the operating temperature distribution is mainly due to the influence of the mean radiant temperature. From the analysis of the surveys, the worst comfort results are achieved in summer, when outdoor temperatures and solar radiation are the highest.
Considering these data, and with the aim of modifying the current standard as little as possible, it was proposed to analyse how the use of passive solar control systems for solar radiation in summer would affect thermal comfort and energy efficiency. The obtained results show a significant reduction in operating temperatures and an improvement in comfort. This is explained by the fact that the improved solar control reduces solar gains through the glazing. This significantly reduces the mean radiant temperatures in different areas of the room, especially near the glazing. The differences between the mean radiant temperatures in different areas of the office are also reduced, resulting in a more homogeneous operating temperature.
In conclusion, the use of sun shading elements in summer would allow the implementation of the RDL 14/2022 standard [2] while maintaining adequate thermal comfort all summer and reducing percentage of unsatisfied people. In relation to energy efficiency, the application of the RDL 14/2022 standard [2] with mobile sun shading elements only in summer allows the maintenance of the same heating-energy needs in winter and further reducing the cooling-energy needs in summer.
In climates with high solar radiation, such as the BShs climate, the standards should promote greater control of the distribution of the mean indoor radiant temperature in summer to guarantee a more homogeneous operating temperature inside the building. To this end, it is necessary for the standards to be more detailed, considering the solar radiation received by the façades owing to their orientation and surroundings and the proportion of glazing. It is also necessary to promote solar control solutions to reduce the mean radiant temperature in summer. In this way, the operating temperature would be lower and more homogeneous throughout the interior areas of the office, preserving the thermal comfort for all the occupants.
RDL 14/2022 [2] is a standard for all commercial and office buildings, both new and existing buildings. For this reason, it is important to evaluate how it affects comfort and the importance of emphasising that in BShs climates it causes unacceptable discomfort, especially in summer. Applying this regulation, if the building analysed were to be refurbished by improving the thermal insulation, comfort would improve in winter but would worsen even more in summer owing to an increase in the greenhouse effect. Improving the energy efficiency of the HVAC system would reduce energy consumption but would not improve comfort because the indoor temperatures would be the same to comply with the standard. Only if the standard is modified considering the important effect of solar radiation in this climate zone would comfort be improved as recommended in this paper.
The research had several limitations. The comparative study of three different regulations meant that different setpoint temperatures had to be applied using different days with similar outdoor temperatures and solar radiation. This meant that the measurement days had to be selected to have very similar weather conditions. This prevented the use of automated measurement systems. On the other hand, there was a high level of refusal by some workers to apply the temperatures imposed by the current standard. This circumstance conditioned and limited the number of testing days during the year.
This research did not consider other aspects that influence temperature distribution, such as localised heat gains caused by computer equipment. Nor is it within the scope of this work to detect and analyse specific problems in the distribution and diffusion of air through existing air-conditioning ducts.
Finally, it is important to mention that the improvement proposal focused on passive systems, such as solar control, to reduce the mean radiant temperature and homogenise the operating temperature. Further work will consider other types of active system solutions, such as sectorised dry-bulb air temperature control by specific zones to help homogenising the operating temperature.
5. Conclusions
(1) This work demonstrates that the current RDL 14/2022 standard [2] has an important real effectiveness in the energy savings of the building. The application of the new standard leads to a 61.66% reduction in heating-energy needs and a 33.26% reduction in cooling-energy needs compared to the RD 1027/2007 standard [7]. It also means a reduction of 49.72% in heating-energy needs and 12.04% reduction in cooling-energy needs compared to the RD 1826/2009 standard [8]. This represents a 40.58% reduction in annual energy consumption compared to the RD 1027/2007 standard [7] and a 21.78% reduction compared to the RD 1826/2009 standard [8].
(2) The current energy-saving standard has a very negative impact on the comfort of building users, increasing the percentage of dissatisfied people up to 60%. The operating temperatures are too low in winter and too high in summer, especially near façades and many users are comfortable depending on the area of the office. The study shows that the mean radiant temperature has a strong influence on the operative temperature in buildings with considerable glazing in the BShs climate zone, and the current RDL 14/2022 standard does not sufficiently consider the important influence of the mean radiant temperature. Consequently, this standard does not sufficiently control the operating temperature distribution and thermal comfort.
(3) This article proposes to modify the current RDL 14/2022 standard [2] to consider the importance of the distribution of the mean indoor radiant temperature and operating temperature in office spaces. To this end, it is recommended that the standard promotes the use of passive solar control systems in climates with high solar radiation, such as the BShs climate. The modification of the standard proposed in this work achieves an acceptable comfort for most users (75%) throughout the whole summer and reduces the energy demand by 48.76% compared to the current regulations and 69.55% compared to the former standard. Through data analysis, it is concluded that improving the solar control of glazing in summer reduces the mean radiant temperature and the operating temperature and provides more homogeneous temperatures throughout the office. This improves the thermal comfort of the users and reduces cooling needs by reducing heat gains from solar radiation.
(4) This work demonstrates the influence of the high solar radiation in the BShs climate on the thermal performance of the building and the need for more precise and specific standards for this climate. This work opens the possibility of applying alternative solutions to the standards, which consider the effects of solar radiation. Using the contributions of this study, new research is currently being conducted in the Alicante Provincial Council Music Auditorium, the largest public building in the region with high air-conditioning costs and comfort problems. The findings of this work will be the subject of a future paper.
Author Contributions
Conceptualisation, C.P.-C. and Á.B.G.-A.; methodology, C.P.-C., S.S.-C. and Á.B.G.-A.; software, C.P.-C. and S.S.-C.; validation, C.P.-C., Á.B.G.-A. and A.G.-G.; formal analysis, C.P.-C. and S.S.-C.; investigation, C.P.-C., S.S.-C., Á.B.G.-A. and A.G.-G.; resources, C.P.-C. and S.S.-C.; data curation, C.P.-C. and S.S.-C.; writing—original draft preparation, C.P.-C., S.S.-C. and Á.B.G.-A.; writing—review and editing, C.P.-C., S.S.-C. and Á.B.G.-A.; visualisation, C.P.-C. and S.S.-C.; supervision, C.P.-C., Á.B.G.-A. and A.G.-G.; project administration, C.P.-C. and Á.B.G.-A.; funding acquisition, C.P.-C. All authors have read and agreed to the published version of the manuscript.
Funding
This research received an external grant from the Colegio Territorial de Arquitectos de Alicante (CTAA).
Data Availability Statement
The data presented in this study are available on request from the corresponding author.
Conflicts of Interest
The authors declare no conflict of interest.
References
- European Union. Council Regulation (EU) 2022/1369, of 5 August 2022, on Coordinated Measures for Gas Demand Reduction; Official Journal of the European Union: Brussels, Belgium, 2022. [Google Scholar]
- Agencia Estatal Boletín Oficial del Estado. Royal Decree Law 14/2022, of 1 August, Measures Economic Sustainability in the Scope of the Transport, in the Field of Scholarships and Helps the Study, as Well as Saving Measures, Energetic Efficiency and Reduction of Natural Gas Energetic Dependence (In Spanish: Real Decreto Ley 14/2022, de 1 de Agosto, de Medidas de Sostenibilidad Económica en el ámbito del Transporte, en Materia de Becas y Ayudas al Estudio, así Como de Medidas de Ahorro, Eficiencia Energética y Reducción de la Dependencia Energética del Gas Natural); Agencia Estatal Boletín Oficial del Estado: Madrid, Spain, 2022; Available online: https://www.boe.es/eli/es/rdl/2022/08/01/14/con (accessed on 15 July 2023).
- Bundesgesetzblatt. Building Energy Act–GEG (In German: Gebäudeenergiegesetz–GEG); Bundesgesetzblatt: Berlin, Germany, 2023. [Google Scholar]
- Bundestag. Draft Act Amending the Energy Security Act 1975 and Other Energy Industry Regulations (In German: Entwurf Eines Gesetzes zur Änderung des Energiesicherungsgesetzes 1975 und Anderer Energiewirtschaftlicher Vorschriften); Deutscher Bundestag: Berlin, Germany, 2022. [Google Scholar]
- Journal Officiel de la République Française. Decree No. 74-1025 of 3 December 1974 on Limiting the Heating Temperature of Rooms (In French: Décret n° 74-1025 du 3 Décembre 1974 Relatif à la Limitation de la Température de Chauffage de Locaux); Journal Officiel de la République Française: Paris, France, 1975. [Google Scholar]
- Journal Officiel de la République Française. Decree No. 2015-1823 of 30 December 2015 on the Codification of the Regulatory Part of the Energy Code (In French: Décret n° 2015-1823 du 30 Décembre 2015 Relatif à la Codification de la Partie Réglementaire du Code de l'énergie); Journal Officiel de la République Française: Paris, France, 2015. [Google Scholar]
- Agencia Estatal Boletín Oficial del Estado. Royal Decree 1027/2007, of 20 July, Approving the Regulation on Thermal Installations in Buildings (In Spanish: Real Decreto 1027/2007, de 20 de Julio, por el que se Aprueba el Reglamento de Instalaciones Térmicas en los Edificios); Agencia Estatal Boletín Oficial del Estado: Madrid, Spain, 2007; Available online: https://www.boe.es/eli/es/rd/2007/07/20/1027/con (accessed on 15 July 2023).
- Agencia Estatal Boletín Oficial del Estado. Royal Decree 1826/2009 Amending the Regulation on Thermal Installations in Buildings, Approved by Royal Decree 1027/2007 of 20 July 2007 (In Spanish: Real Decreto 1826/2009 por el que se Modifica el Reglamento de Instalaciones Térmicas en los Edificios, Aprobado por Real Decreto 1027/2007, de 20 de Julio); Agencia Estatal Boletín Oficial del Estado: Madrid, Spain, 2009; Available online: https://www.boe.es/eli/es/rd/2009/11/27/1826 (accessed on 15 July 2023).
- Atmaca, I.; Kaynakli, O.; Yigit, A. Effects of radiant temperature on thermal comfort. Build. Environ. 2007, 42, 3210–3220. [Google Scholar] [CrossRef]
- Song, B.; Bai, L.; Yang, L. Analysis of the long-term effects of solar radiation on the indoor thermal comfort in office buildings. Energy 2022, 247, 123499. [Google Scholar] [CrossRef]
- Hodder, S.; Parsons, K. The effects of solar radiation on thermal comfort. Int. J. Biometeorol. 2007, 51, 233–250. [Google Scholar] [CrossRef] [PubMed]
- Gan, G. Analysis of mean radiant temperature and thermal comfort. Build. Serv. Eng. Res. Technol. 2001, 22, 95–101. [Google Scholar] [CrossRef]
- Hodder, S.; Parsons, K. The effects of solar radiation and black body reradiation on thermal comfort. Ergonomics 2008, 51, 476–491. [Google Scholar] [CrossRef]
- Foster, J.; Smallcombe, J.W.; Hodder, S.; Jay, O.; Flouris, A.D.; Nybo, L. Quantifying the impacto of heat on human physical work capacity; part III: The impact of solar radiation varies with air temperature, humidity, and clothing coverage. Int. J. Biometeorol. 2022, 66, 175–188. [Google Scholar] [CrossRef]
- UNE-EN ISO 7730:2006; Ergonomics of the Thermal Environment-Analytical Determination and Interpretation of Thermal Comfort Using Calculation of the PMV and PPD Indices and Local Thermal Comfort Criteria (ISO 7730:2005). AENOR, Agencia Española de Normalización y Certifiación: Madrid, Spain, 2006.
- Ramsey, J.; Burford, C.; Beshir, M.; Jensen, R. Effects of workplace thermal conditions on safe work behavior. J. Saf. Res. 1983, 14, 105–114. [Google Scholar] [CrossRef]
- Axelson, O. Influence of Heat Exposure on Productivity. Work. Environ. Health 1974, 11, 94–99. [Google Scholar]
- Kjellstrom, T.; Holmer, I.; Lemke, B. Workplace heat stress, health and productivity-an increasing challenge for low and middle-income countries during climate change. Glob. Health Action 2009, 2, 2047. [Google Scholar] [CrossRef]
- Chang, T.; Kajackaite, A. Battle for the thermostat: Gender and the effect of temperature on cognitive performance. PLoS ONE 2019, 14, 0216362. [Google Scholar] [CrossRef]
- Mullins, J.T.; White, C. Temperature and mental health: Evidence from the spectrum of mental health outcomes. J. Health Econ. 2019, 68, 102240. [Google Scholar] [CrossRef] [PubMed]
- Olcina, J.; Serrano-Notivolit, R.; Miró, J.; Meseguer-Ruiz, O. Tropical nights in the Spanish Mediterranean coast: Recent evolution (1950–2014). Clim. Res. 2019, 78, 225–236. [Google Scholar] [CrossRef]
- Miró, J.; Olcina, J. Cambio climático y confort térmico. Efectos en el turismo de la Comunidad Valenciana. Rev. Investig. Turísticas 2020, 20, 1–30. [Google Scholar]
- Beck, H.; Zimmermann, N.; McVicar, T.; Vergopolan, N.; Berg, A.; Wood, E.F. Present and future Köppen-Geiger climate classification maps at 1-km resolution. Sci. Data 2018, 5, 180214. [Google Scholar] [CrossRef] [PubMed]
- Kriticos, D.; Webber, B.; Leriche, A.; Ota, N.; Macadam, I.; Bathols, J.; Scott, J. CliMond: Global hihg-resolution historical and future scenario climate surfaces for bioclimatic modelling. Methods Ecol. Evol. 2012, 3, 53–64. [Google Scholar] [CrossRef]
- Ministerio para la Transición Ecológica y el Reto Demográfica. Climate Projections for the 21st Century (In Spanish: Proyecciones Climáticas para el Siglo XXI); Ministerio para la Transición Ecológica y el Reto Demográfica, Agencia Estatal de Meteorología: Madrid, Spain, 2023. [Google Scholar]
- Pérez-Carramiñana, C.; González-Avilés, Á.B.; Galiano-Garrigós, A.; Lozoya-Peral, A. Optimization of Architectural Thermal Envelope Parameters in Modern Single-Family House Typologies in Southeastern Spain to Improve Energy Efficiency in a Dry Mediterranean Climate. Sustainability 2022, 14, 3910. [Google Scholar] [CrossRef]
- Pérez-Carramiñana, C.; Maciá-Mateu, A.; Sirvent-García, G.; Lledó-Llorca, I. Study of Natural Ventilation and Solar Control Strategies to Improve Energy Efficiency and Environmental Quality in Glazed Heated Swimming Pools in a Dry Mediterranean Climate. Sustainability 2022, 14, 8243. [Google Scholar] [CrossRef]
- Zhang, H.; Duan, D.; Yang, X.; Zheng, W. Application of CPMV for improving the indoor thermal environment under global solar radiation. Indoor Built Environ. 2023, 32, 797–814. [Google Scholar] [CrossRef]
- Bienvenido-Huertas, D.; Sánchez-García, D.; Tejedor, B.; Rubio-Bellido, C. An innovative approach to assess the limitations of characterizing solar gains in buildings: A Spanish case study. Energy Build. 2023, 293, 113206. [Google Scholar] [CrossRef]
- Chan, Y.H.; Zhang, Y.; Tennakoon, T.; Fu, S.C.; Chan, K.C.; Tso, C.Y.; Yu, K.M.; Wan, M.P.; Huang, B.L.; Yao, S.; et al. Potential passive cooling methods based on radiation controls in buildings. Energy Convers. Manag. 2022, 272, 116342. [Google Scholar] [CrossRef]
- Fanger, P.O. Thermal Confort; Mc Graw Hill: New York, NY, USA, 1972. [Google Scholar]
- Castejón, E. NTP 74: Thermal Comfort-Fanger's Method of Assessment (In Spanish: NTP 74: Confort térmico-Método de Fanger para su Evaluación); Ministerio de Trabajo y Asuntos Sociales: Madrid, Spain, 1983. [Google Scholar]
- Halawa, E.; Van Hoof, J.; Soebarto, V. The impacts of the thermal radiation field on thermal comfort, energy consumption and control—A critical overview. Renew. Sustain. Energy Rev. 2014, 37, 907–918. [Google Scholar] [CrossRef]
- Kazkaz, M.; Pavelek, M. Operative temperature and globe temperature. Eng. Mech. 2013, 20, 319–325. [Google Scholar]
- Luo, M.; Wang, Z.; Kec, K.; Caod, B.; Zhaib, Y.; Zhoue, X. Human metabolic rate and thermal comfort in buildings: The problem and Challenge. Build. Environ. 2018, 131, 44–52. [Google Scholar] [CrossRef]
- Yang, C.; Yin, T.; Fu, M. Study on the allowable fluctuation ranges of human metabolic rate and thermal environment parameters under the condition of thermal comfort. Build. Environ. 2016, 103, 155–164. [Google Scholar] [CrossRef]
- Havenith, G.; Holmér, I.; Parsons, K. Personal factors in thermal comfort assessment: Clothing, properties and metabolic heat production. Energy Build. 2002, 34, 581–591. [Google Scholar] [CrossRef]
- Beshir, M.; Ramsey, J. Comparison between male and female subjective estimates of thermal effects and sensations. Appl. Ergon. 1981, 12, 29–33. [Google Scholar] [CrossRef] [PubMed]
- Parsons, K. The effects of gender, acclimation state, the opportunity to adjust clothing and physical disability on requirements for thermal comfort. Energy Build. 2002, 34, 593–599. [Google Scholar] [CrossRef]
- Kalmár, F. An indoor environment evaluation by gender and age using an advanced personalized ventilation system. Build. Serv. Eng. Res. Technol. 2017, 38, 505–521. [Google Scholar] [CrossRef]
- Baquero, M.T.; Higueras, E. Thermal comfort of older adults: A systematic review of the literature (In Spanish: Confort térmico de adultos mayores: Una revisión sistemática de la literatura científica). Rev. Española De Geriatría Y Gerontol. 2019, 54, 280–295. [Google Scholar] [CrossRef]
- Baquero, M.T.; Forcada, N. Thermal comfort of older people during summer in the continental Mediterranean climate. J. Build. Eng. 2022, 54, 104680. [Google Scholar] [CrossRef]
- Ege Çeter, A.; Furkan Ozbey, M.; Turhan, C. Gender inequity in thermal sensation based on emotional intensity for participants in a warm mediterranean climate zone. Int. J. Therm. Sci. 2023, 185, 108089. [Google Scholar] [CrossRef]
- Furkan Ozbey, M.; Ege Çeter, A.; Orfioglu, S.; Alkan, N.; Turhan, C. Sensitivity analysis of the effect of current mood states on the thermal sensation in educational buildings. Indoor Air. 2022, 32, e13073. [Google Scholar]
- Wu, J.; Li, X.; Lin, Y.; Yan, Y.; Tu, J. A PMV-based HVAC control strategy for office rooms subjected to solar radiation. Build. Environ. 2020, 177, 106863. [Google Scholar] [CrossRef]
- Arboit, M.E.; Betman, E.S. Solar radiation in forested urban environments with dry climate. Case: Metropolitan Area of Mendoza, Argentina (In Spanish: Radiación solar en entornos urbanos forestados con clima seco. Caso: Área Metropolitana de Mendoza, Argentina). Urban 2014, 16, 76–94. [Google Scholar]
- Kim, J.T.; Todorovic, M.S. Tuning control of buildings glazing’s transmittance dependence on the solar radiation wavelength to optimize daylighting and building’s energy efficiency. Energy Build. 2013, 63, 108–118. [Google Scholar] [CrossRef]
- Granqvist, C.G. Electrochromics and Thermochromics: Towards a New Paradigm for Energy Efficient Buildings. Mater. Today: Proc. 2016, 3, S2–S11. [Google Scholar] [CrossRef]
- Piscitelli, M.S.; Brandi, S.; Gennaro, G.; Capozzoli, A.; Favoino, F.; Serra, V. Advanced control strategies for the modulation of solar radiation in buildings: MPC-enhanced rule-based control. Build. Simul. Conf. Proc. 2019, 2, 869–876. [Google Scholar]
- Deng, Y.; Yang, Y.; Xiao, Y.; Xie, H.; Lan, R.; Zhang, L.; Yang, H. Ultrafast Switchable Passive Radiative Cooling Smart Windows with Synergistic Optical Modulation. Adv. Funct. Mater. 2023, 2301319. [Google Scholar] [CrossRef]
- Yarbrough, D.W.; Anderson, R.W. Use of Radiation Control Coatings to Reduce Building Air-Conditioning Loads. Energy Sources 2007, 15, 59–66. [Google Scholar] [CrossRef]
- Castilla, M.; Álvarez, J.D.; Berenguel, M.; Pérez, M.; Rodríguez, F.; Guzmán, J.L. Building Comfort Control Techniques (In Spanish: Técnicas de Control del Confort en Edificios). Rev. Iberoam. De Automática E Inf. Ind. 2010, 7, 5–24. [Google Scholar] [CrossRef]
- Tzempelikos, A.; Shen, H. Comparative control strategies for roller shades with respect to daylighting and energy performance. Build. Environ. 2013, 67, 179–192. [Google Scholar] [CrossRef]
- Atzeria, A.; Cappellettib, F.; Gasparella, A. Internal versus external shading devices performance in office buildings. Energy Procedia 2014, 45, 463–472. [Google Scholar] [CrossRef]
- Tripanagnostopoulos, Y.; Siabekou, C.; Tonui, J.K. The Fresnel lens concept for solar control of buildings. Sol. Energy 2007, 81, 661–675. [Google Scholar] [CrossRef]
- Albatayneh, A.; Alterman, D.; Page, A.; Moghtaderi, B. The significance of building design for the climate. Environ. Clim. Technol. 2018, 22, 165–178. [Google Scholar] [CrossRef]
- Pesic, N.; Roset, J.; Muros, A. Natural ventilation potential of the Mediterranean coastal region of Catalonia. Energy Build. 2018, 169, 236–244. [Google Scholar] [CrossRef]
- Ozarisoy, B.; Altan, H. Systematic literature review of bioclimatic design elements: Theories, methodologies and cases in the South-eastern Mediterranean climate. Energy Build. 2021, 250, 111281. [Google Scholar] [CrossRef]
- Wang, C.; Wu, H.; Li, C. Hysteresis and damping properties of steel and polypropylene fiber reinforced recycled aggregate concrete under uniaxial low-cycle loadings. Constr. Build. Mater. 2022, 319, 126191. [Google Scholar] [CrossRef]
- Wang, C.; Xiao, J.; Liu, W.; Ma, Z. Unloading and reloading stress-strain relationship of recycled aggregate concrete reinforced with steel/polypropylene fibers under uniaxial low-cycle loadings. Cem. Concr. Compos. 2022, 131, 104597. [Google Scholar] [CrossRef]
- ASHRAE Standard-55; Thermal Environment Conditions for Human Occupancy. American Society of Heating, Refrigerating and Air-Conditioning Engineers: Peachtree Corners, GA, USA, 2020.
- DesignBuilder; v.7.0.1.006. DesignBuilder Software Ltd.: Stroud, UK, 2021. Available online: https://www.designbuilder.co.uk (accessed on 24 November 2021).
- Rodríguez-Jiménez, C.; Carretero-Ayuso, M.; Claro-Ponce, J. Influence of infiltrationsin the energy retrofit of the envelope. A case study from the actions plans in the public housing stock of Andalucia. Inf. De La Construcción 2018, 70, e271. [Google Scholar] [CrossRef]
- Agencia Estatal Boletín Oficial del Estado. Royal Decree 732/2019, of 20 December, Amending the Technical Building Code, Approved by Royal Decree 314/2006, of 17 March (In Spanish: Real Decreto 732/2019, de 20 de Diciembre, por el Que se Modifica el Código Técnico de la Edificación, Aprobado por el Real Decreto 314/2006, de 17 de Marzo); Agencia Estatal Boletín Oficial del Estado: Madrid, Spain, 2019. [Google Scholar]
- Ministerio de Transportes; Villar Burke, R.; Sorribes Gil, M.; Jiménez González, D.; Sobaler Rodríguez, J. DB-HE Application Guide 2019 (In Spanish: Guía de Aplicación DB-HE 2019); Ministerio de Transportes, Movilidad y Agenda Urbana; Sorribes Gil, M., Jiménez González, D., Eds.; Gobierno de España: Madrid, Spain, 2019. [Google Scholar]
- Agencia Estatal Boletín Oficial del Estado. Order FOM/588/2017, of 15 June, Amending Basic Document DB-HE 975 "Energy Saving" and Basic Document DB-HS "Health" of the Technical Building Code, Approved by Royal Decree 976 314/2006, of 17 March, 2017 (In Spanish: Orden FOM/588/2017, de 15 de Junio, por la Que se Modifican el Documento Básico DB-HE 975 “Ahorro de Energía” y El Documento Básico DB-HS “Salubridad”, del Código Técnico de la Edificación, Aprobado por Real Decreto 976 314/2006, de 17 de Marzo, 2017); Agencia Estatal Boletín Oficial del Estado: Madrid, Spain, 2017. [Google Scholar]
- Agencia Estatal Boletín Oficial del Estado. Royal Decree 486/1997, of 14 April 1997, Establishing the Minimum Safety and Health Provisions in the Workplace (In Spanish: Real Decreto 486/1997, de 14 de Abril, por el que se Establecen las Disposiciones Mínimas de Seguridad y Salud en los Lugares de Trabajo); Agencia Estatal Boletín Oficial del Estado: Madrid, Spain, 1997. [Google Scholar]
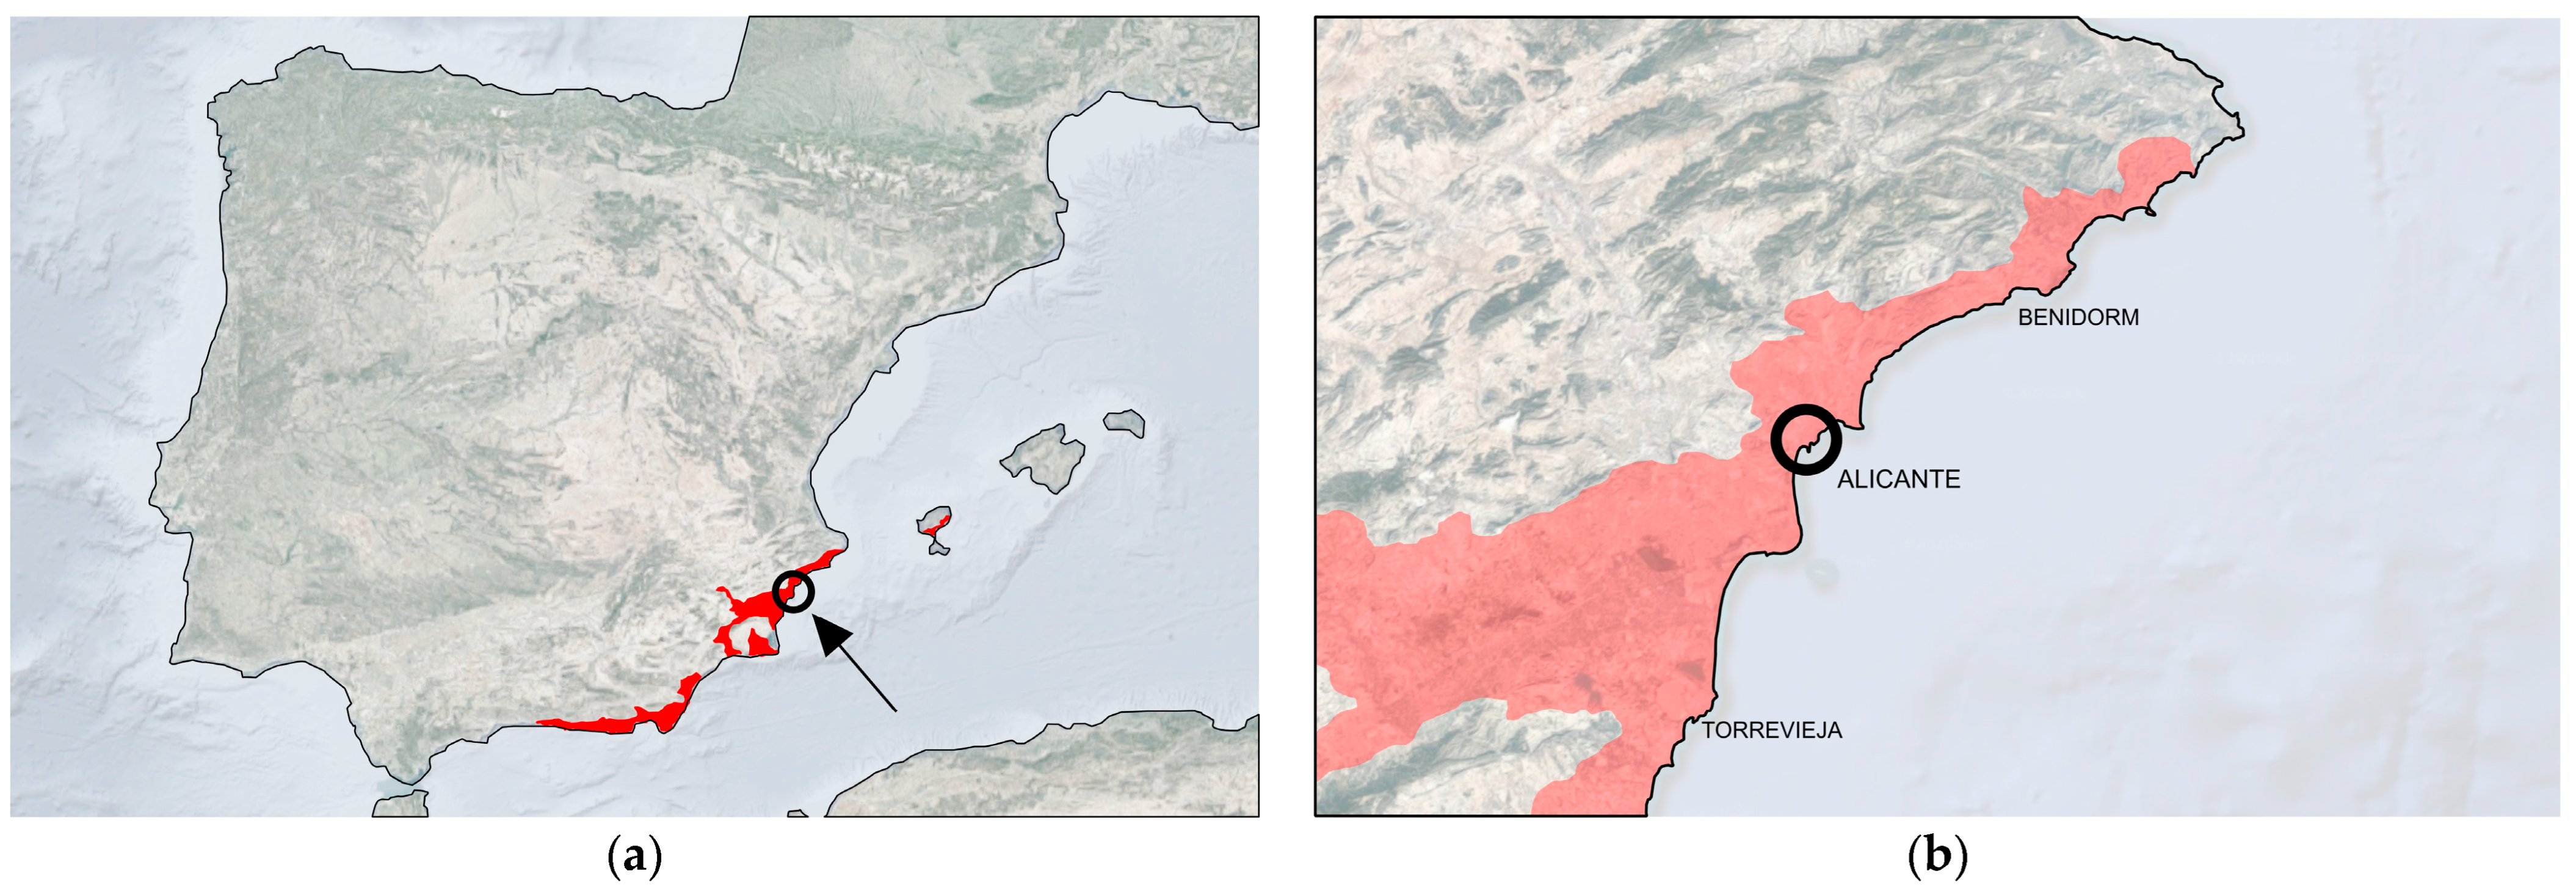
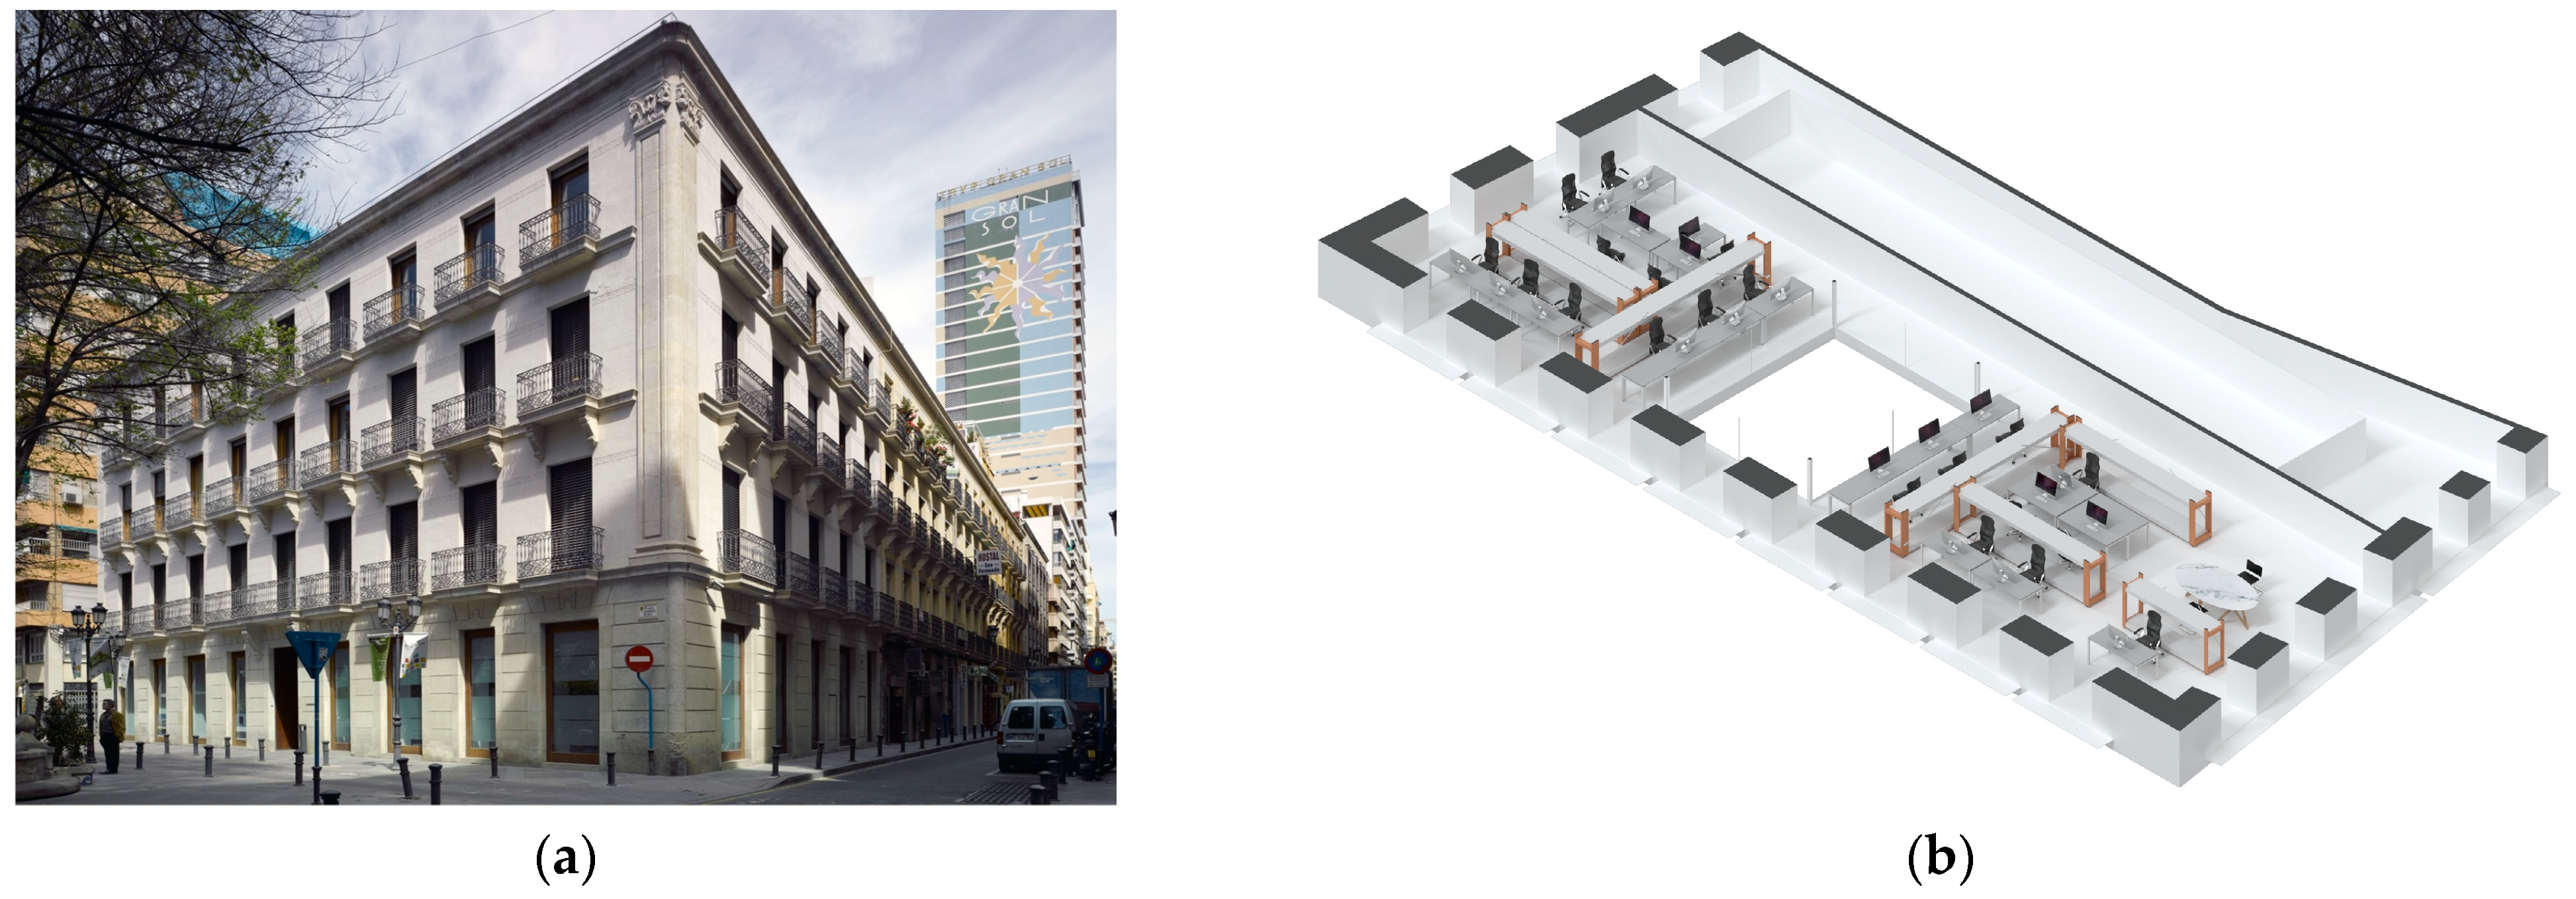
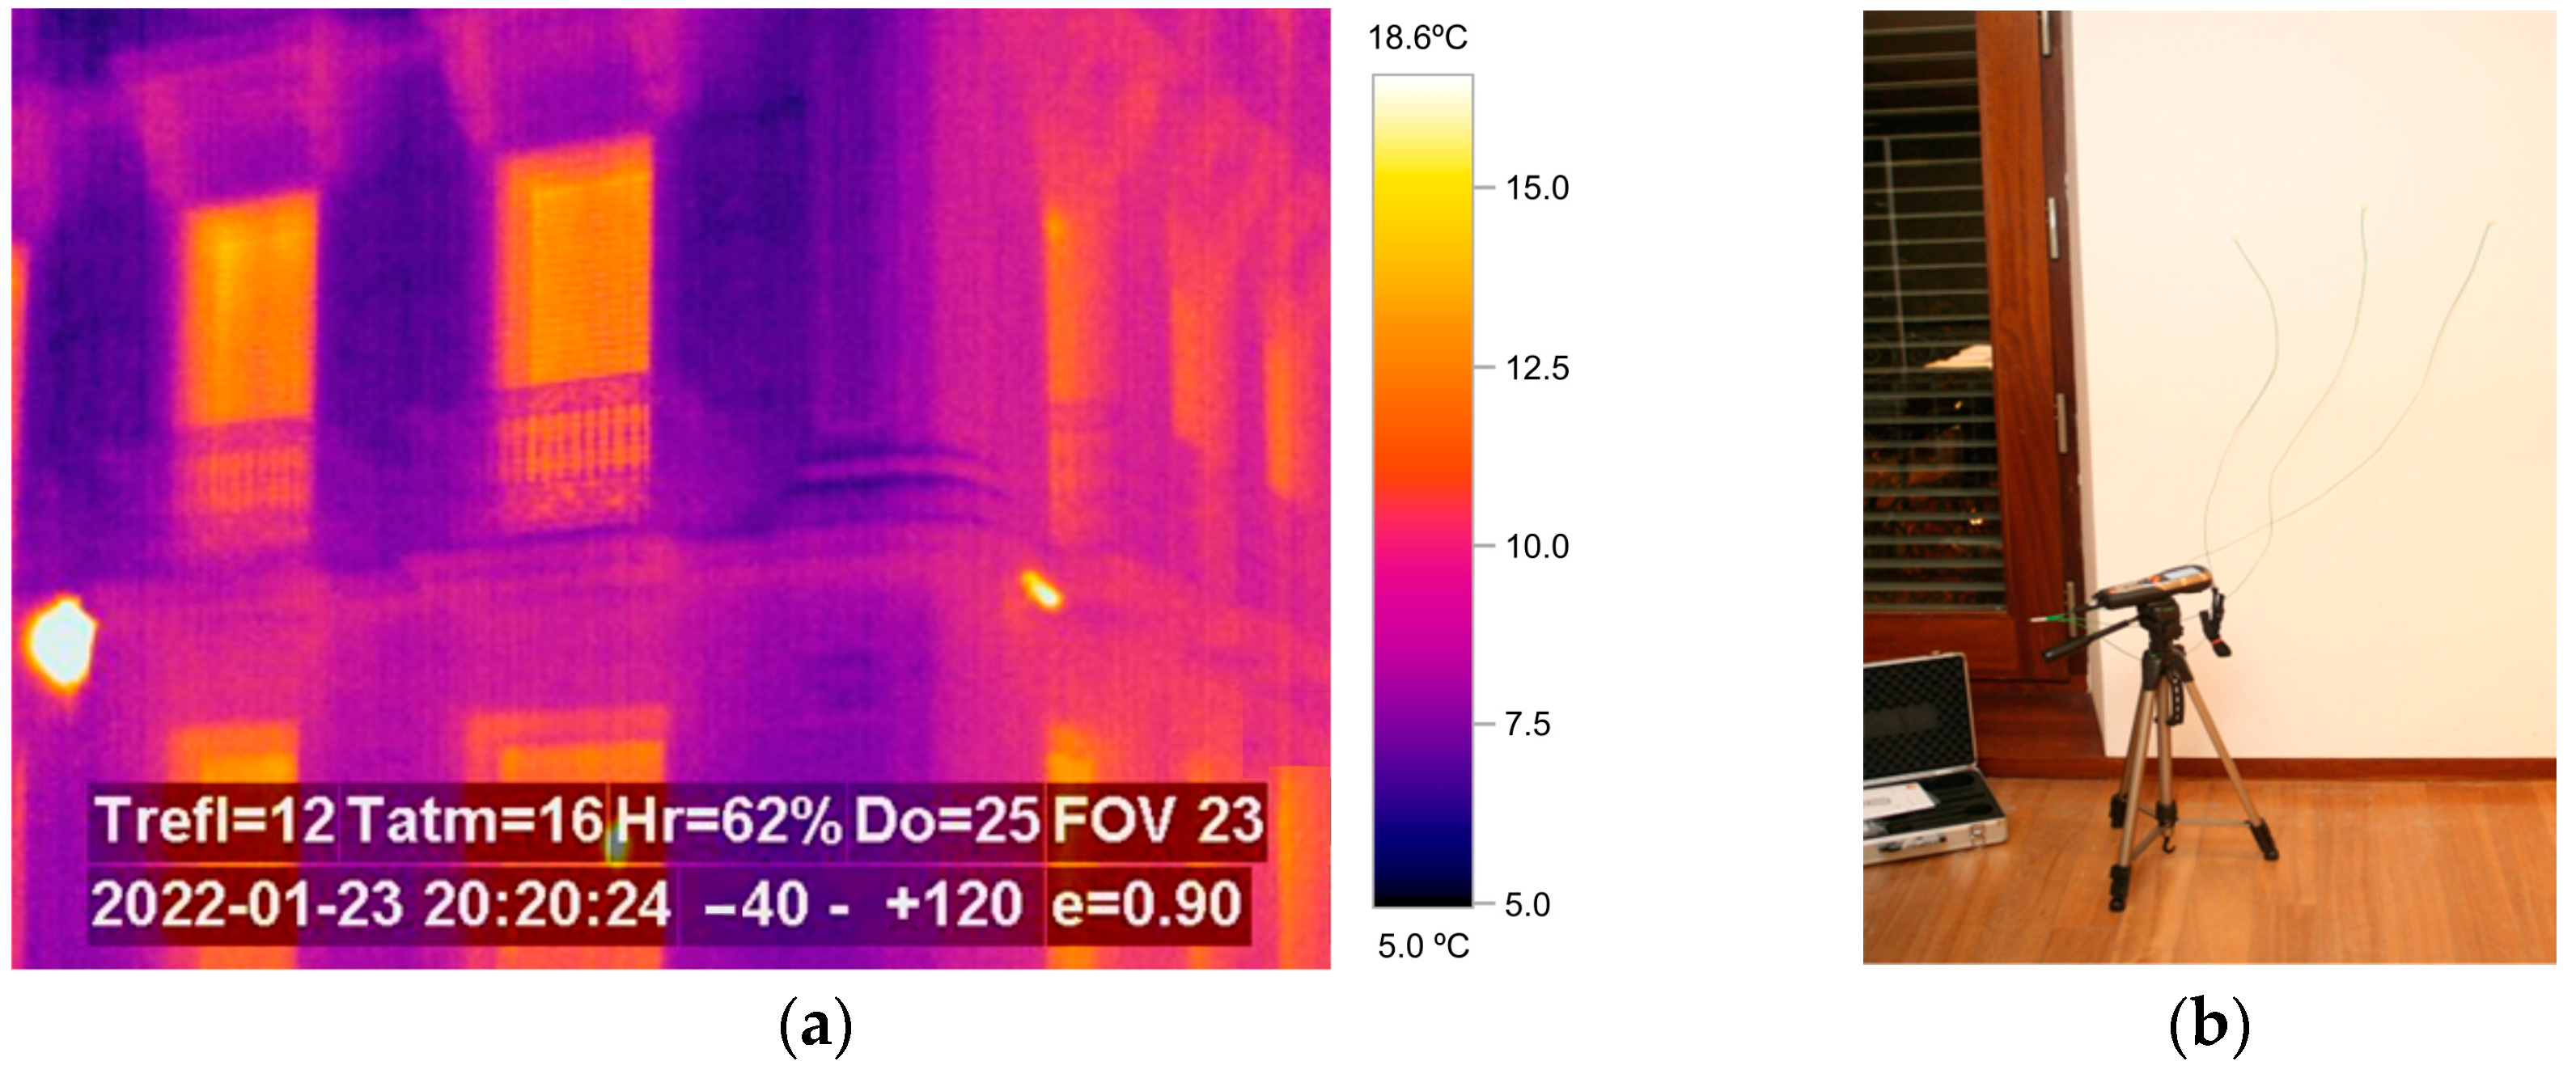

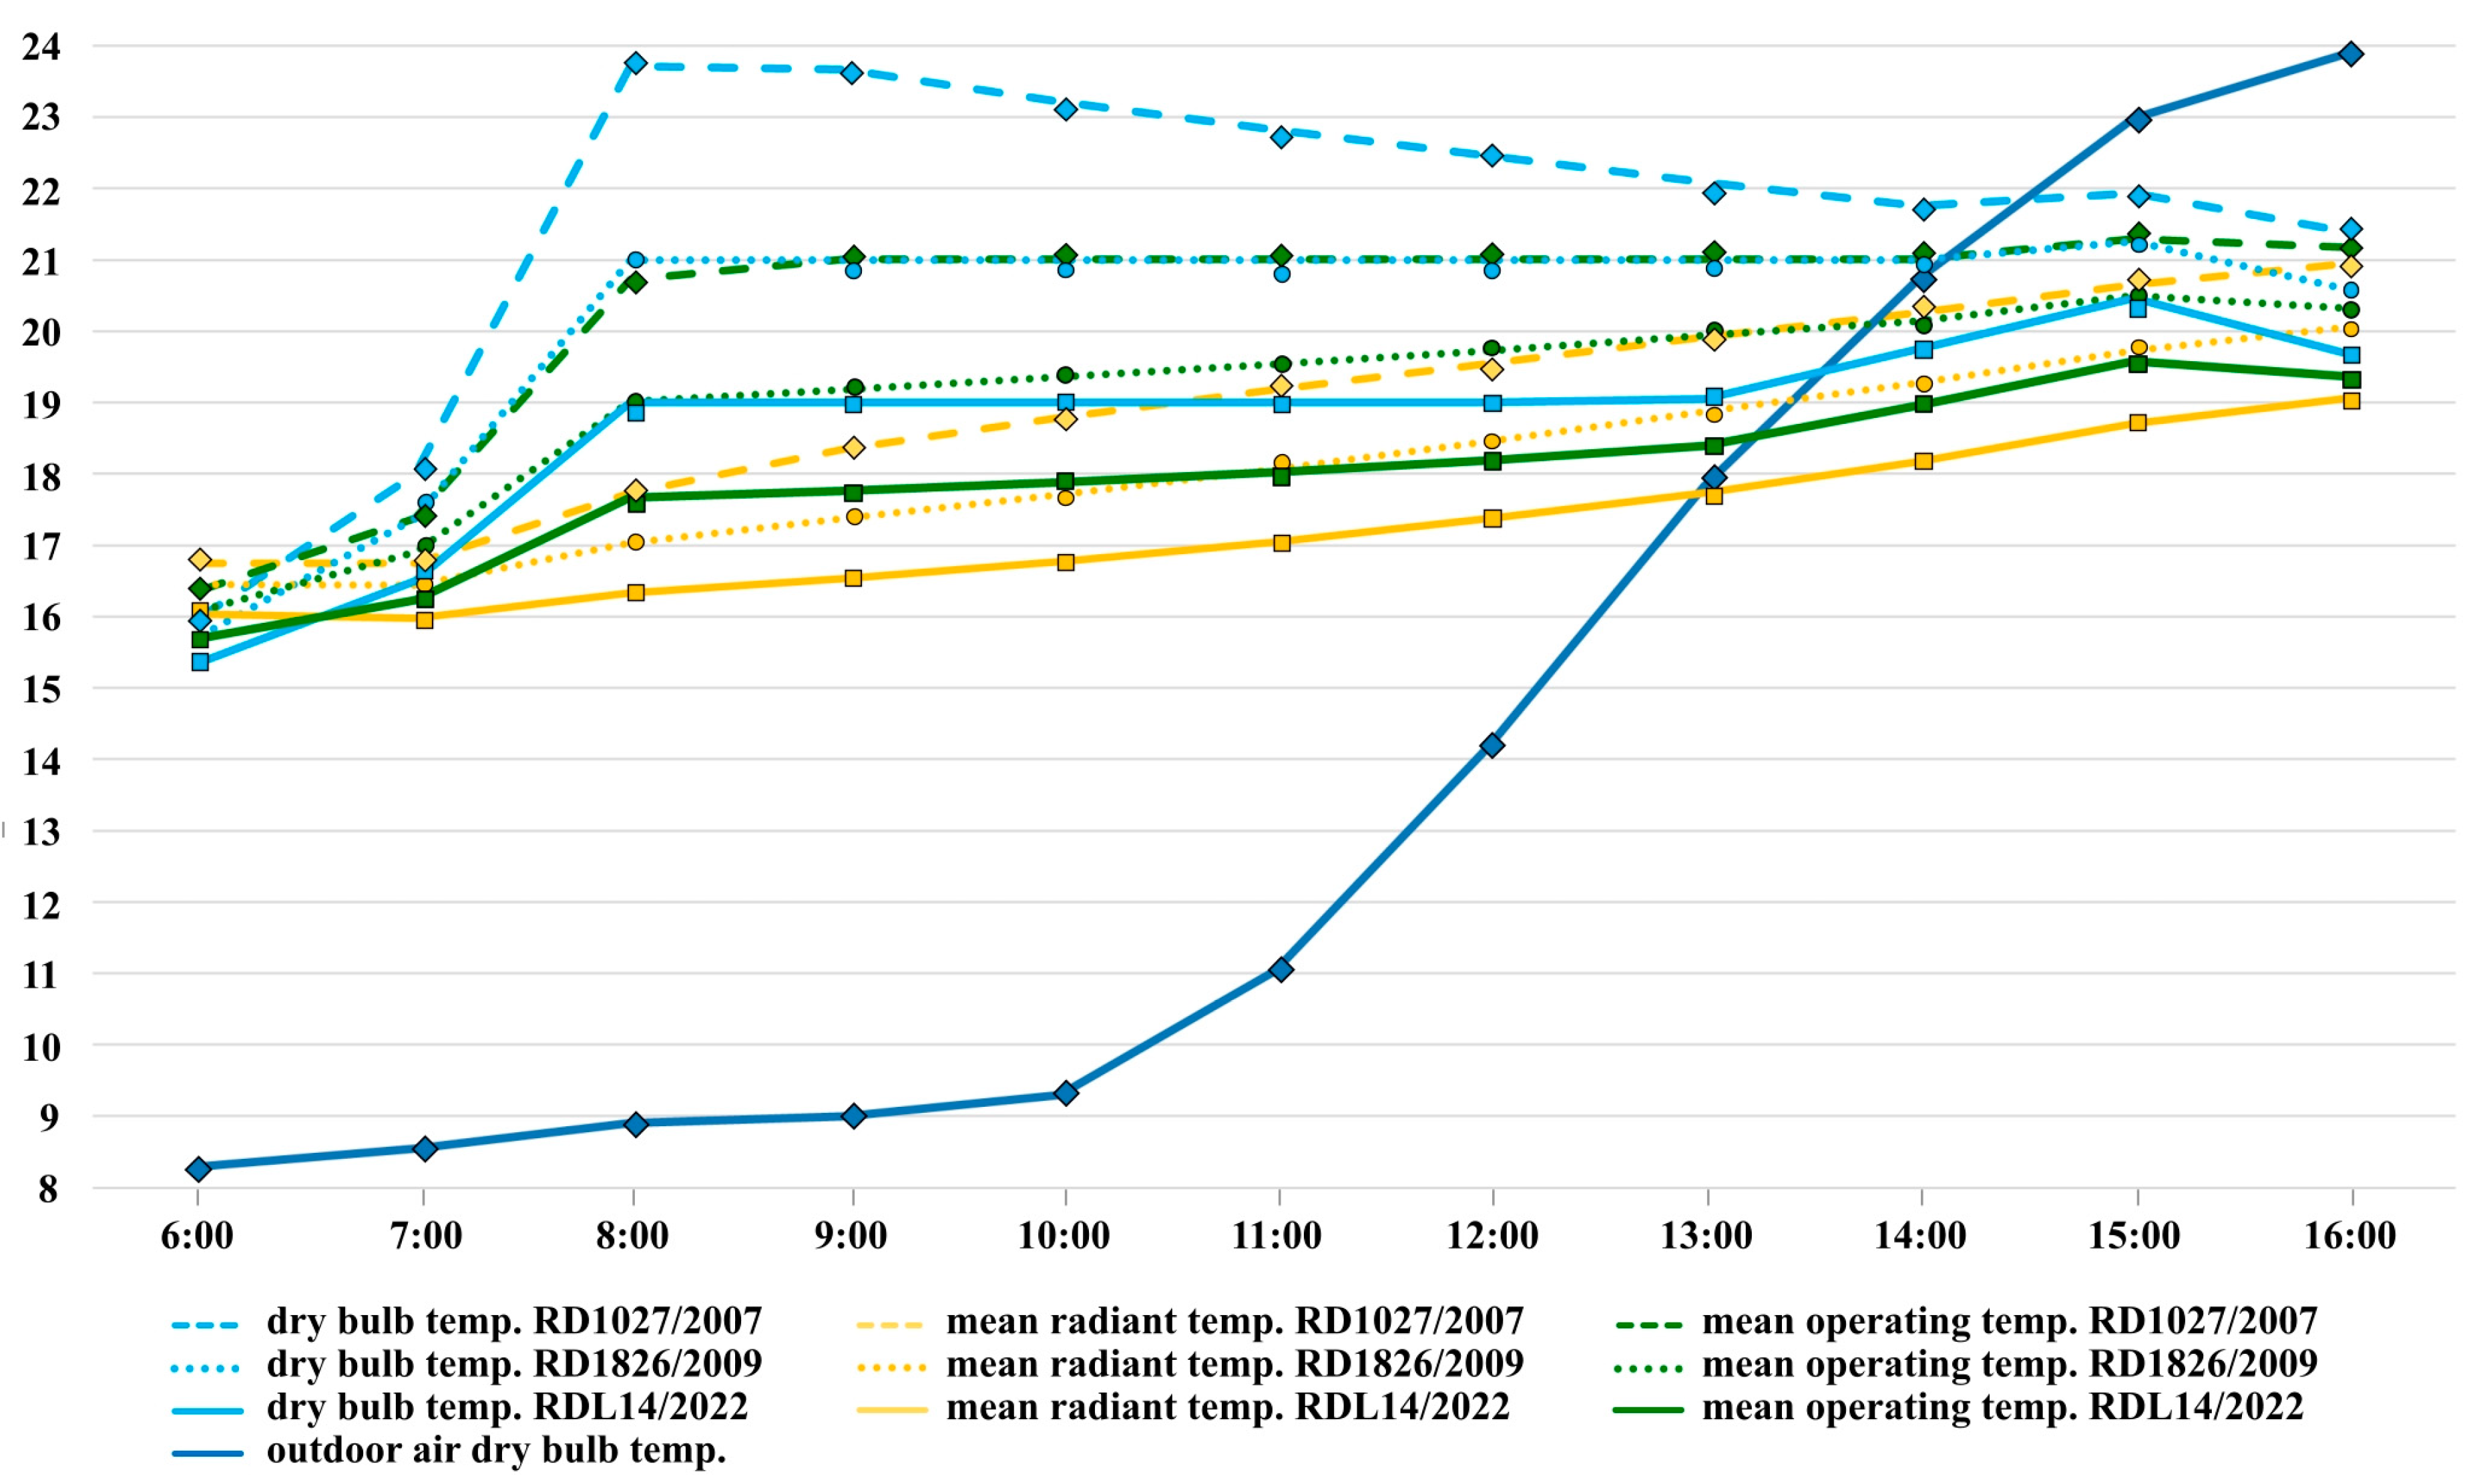
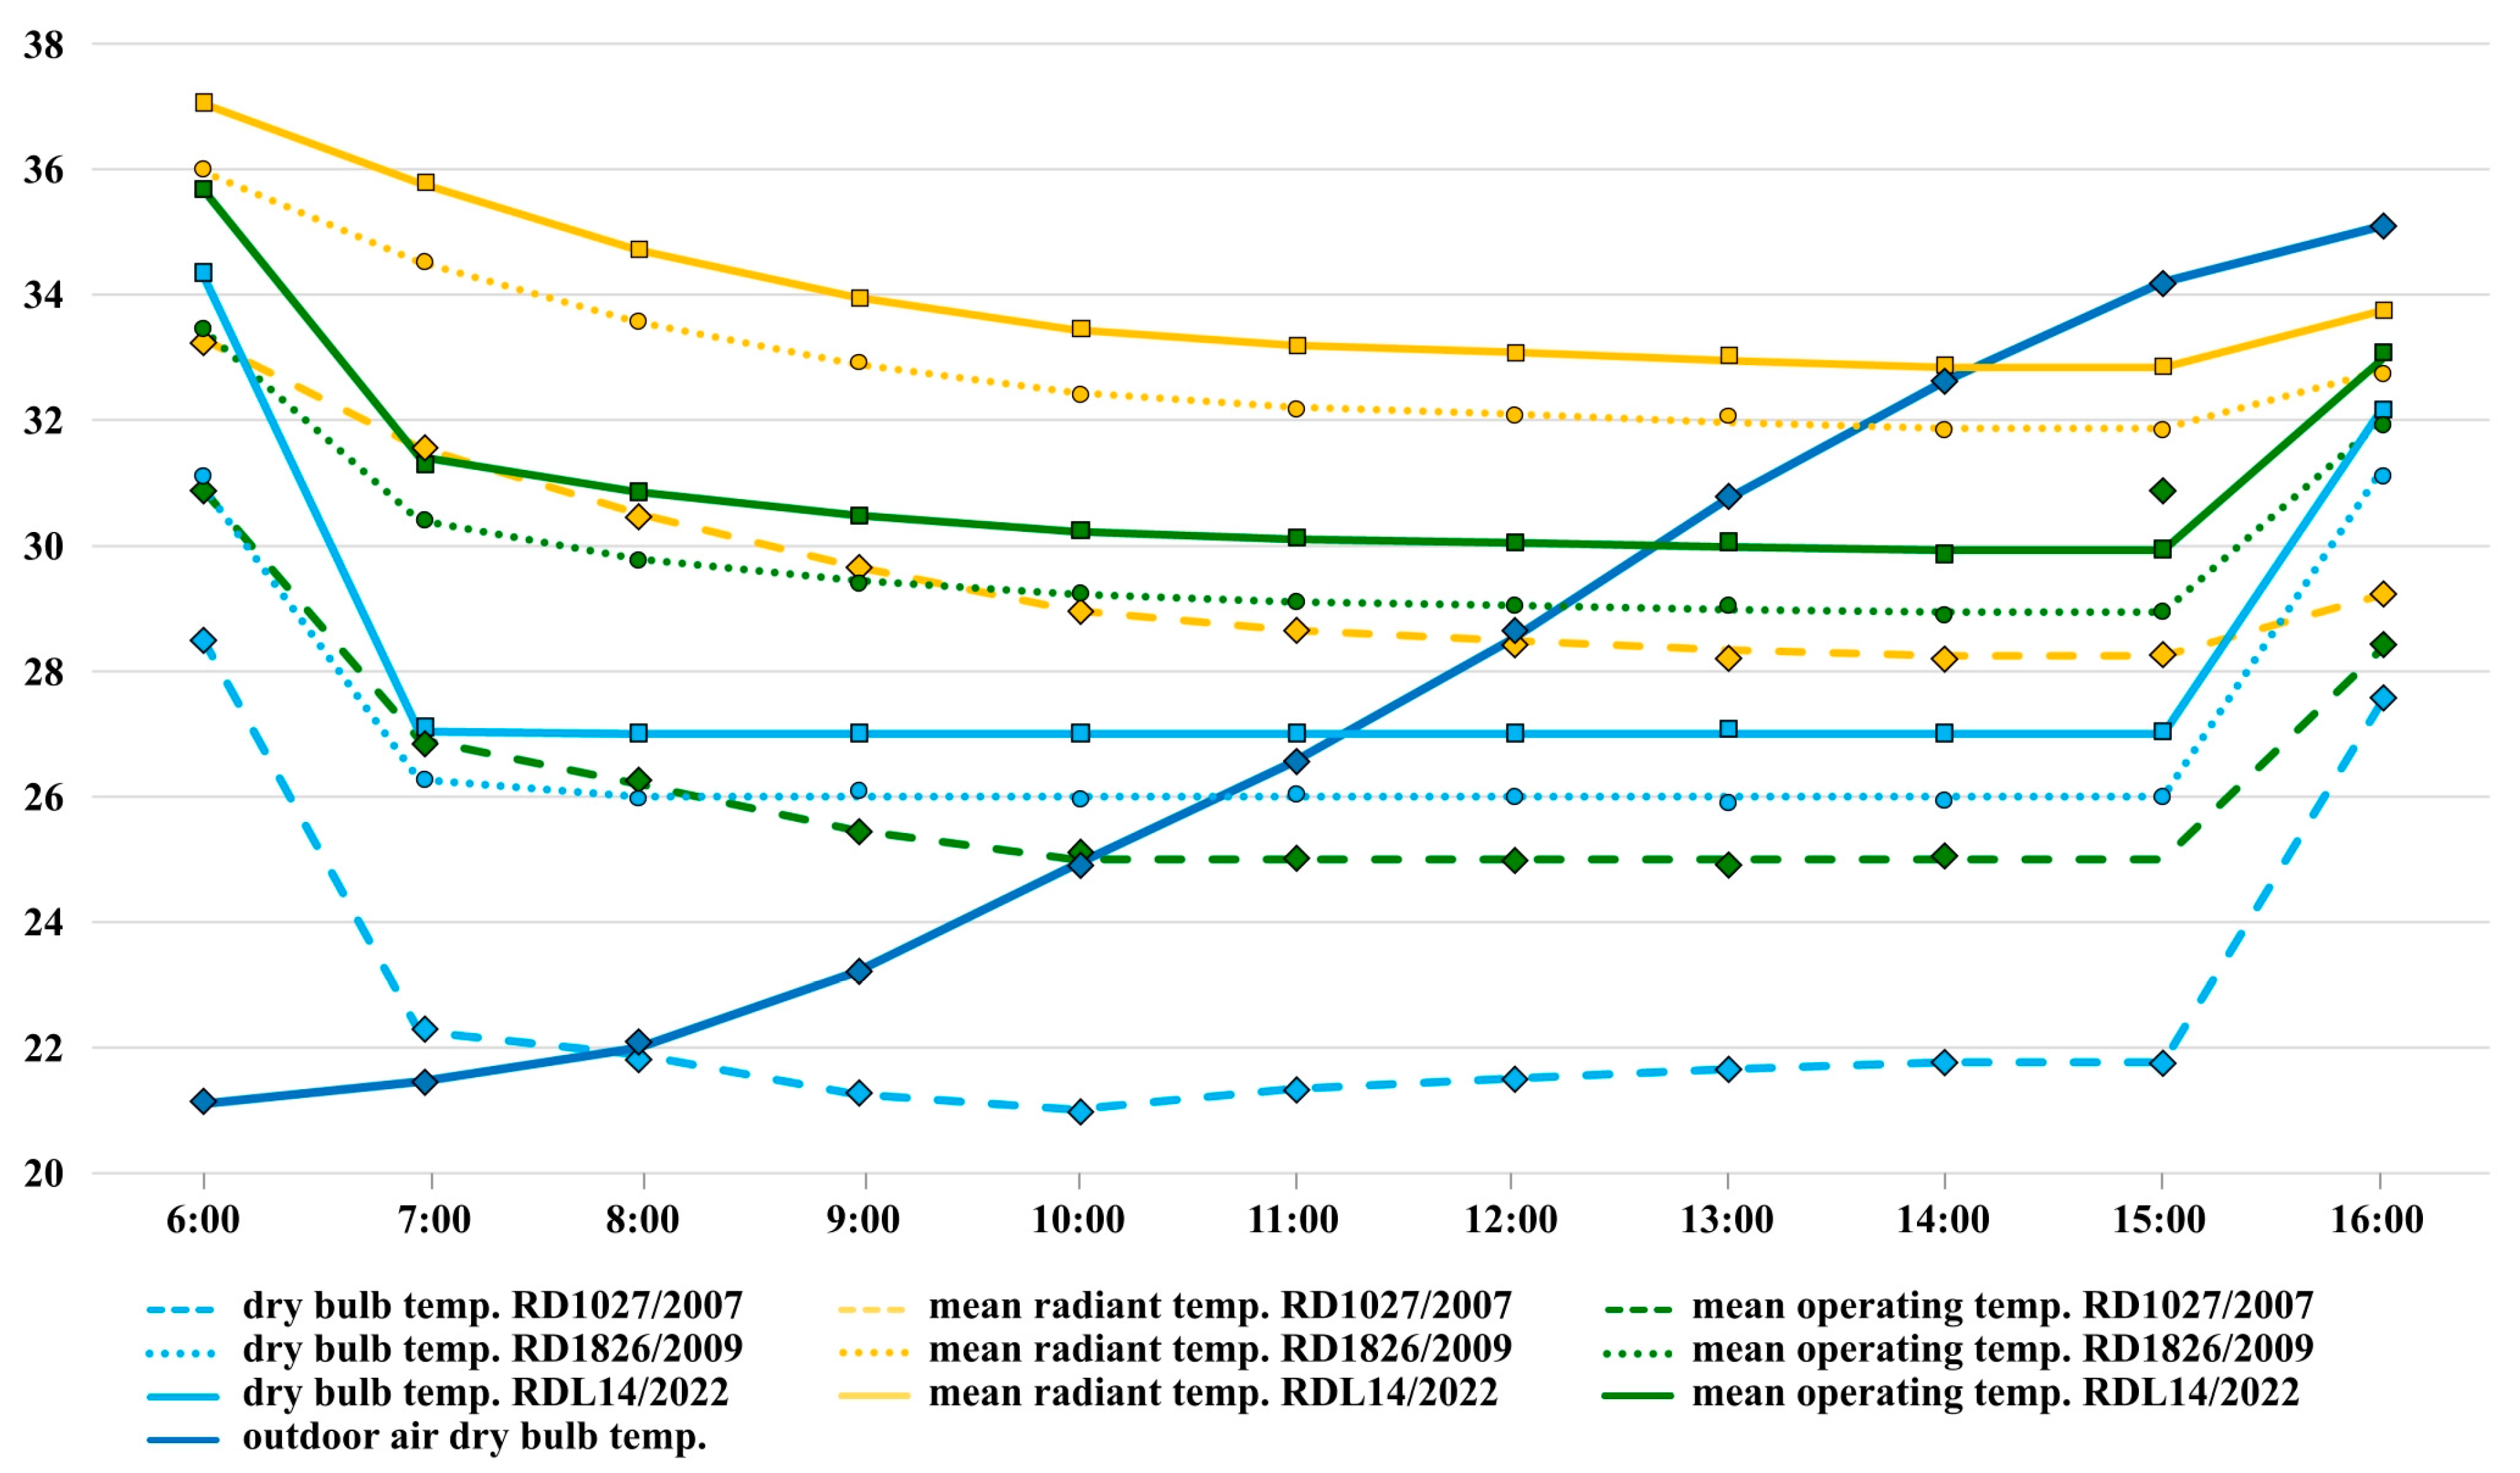
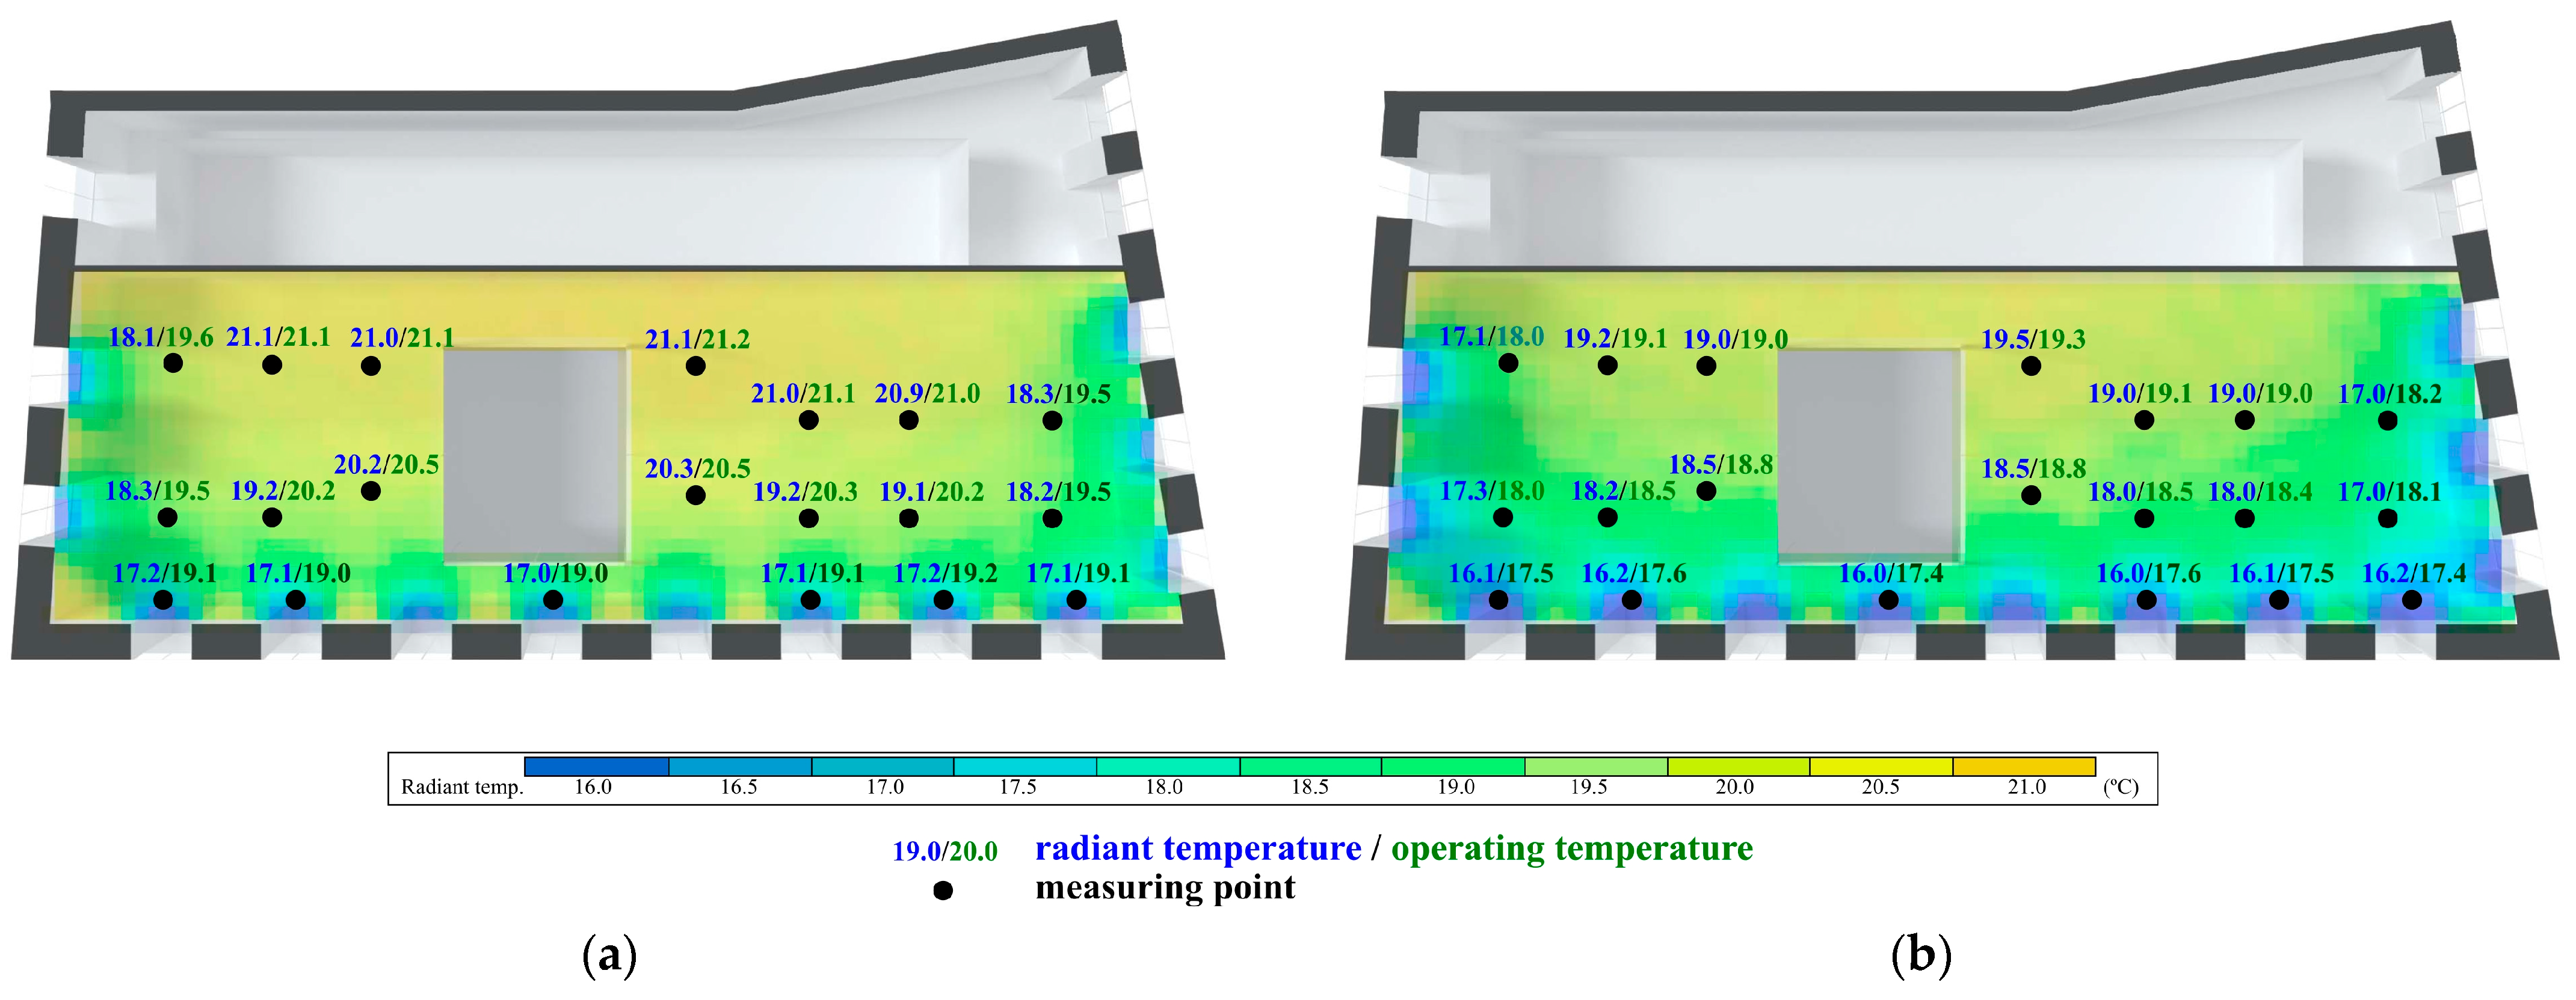
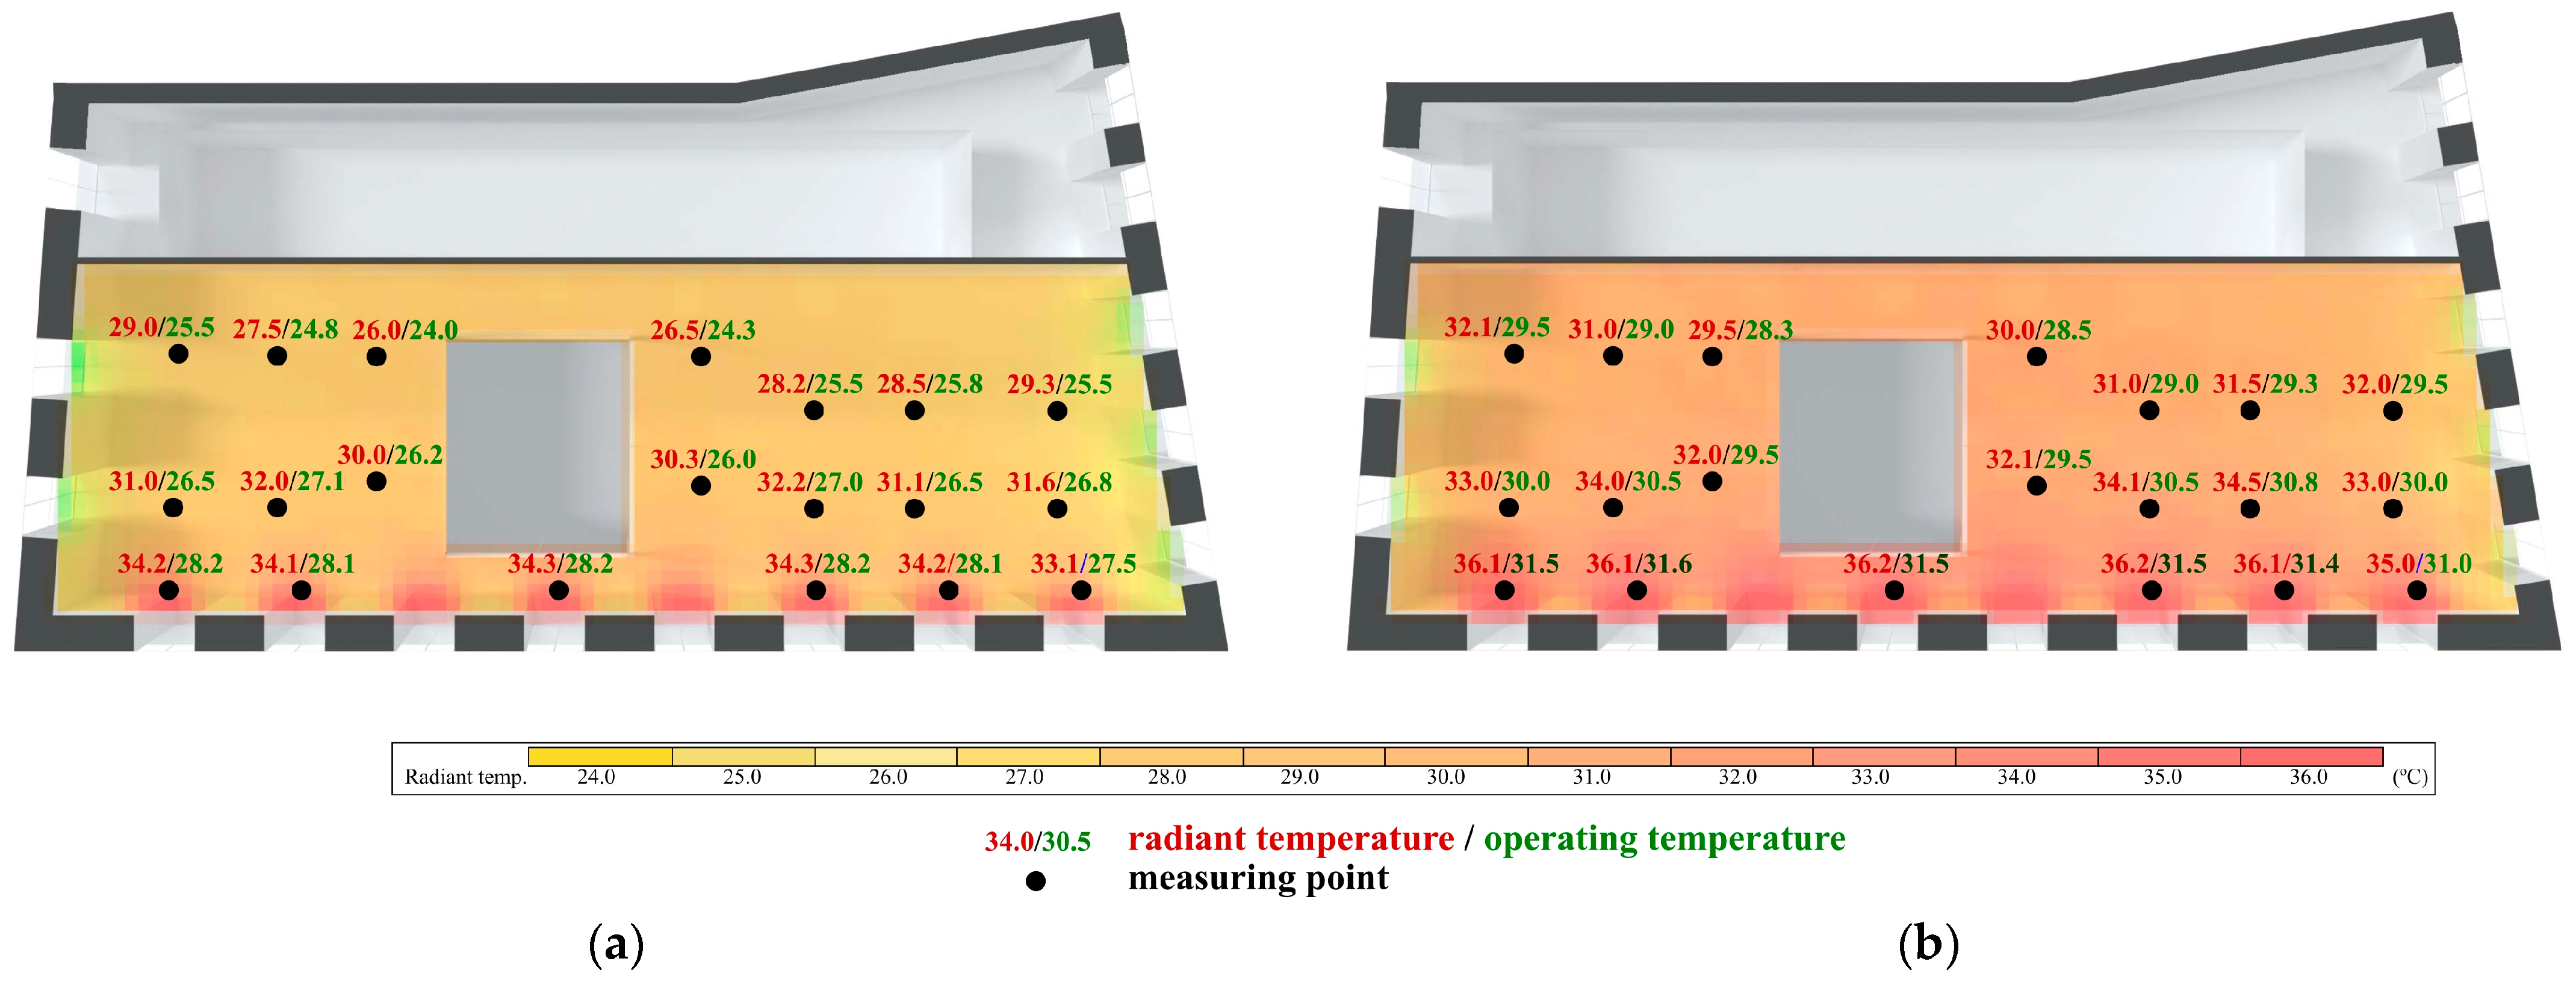
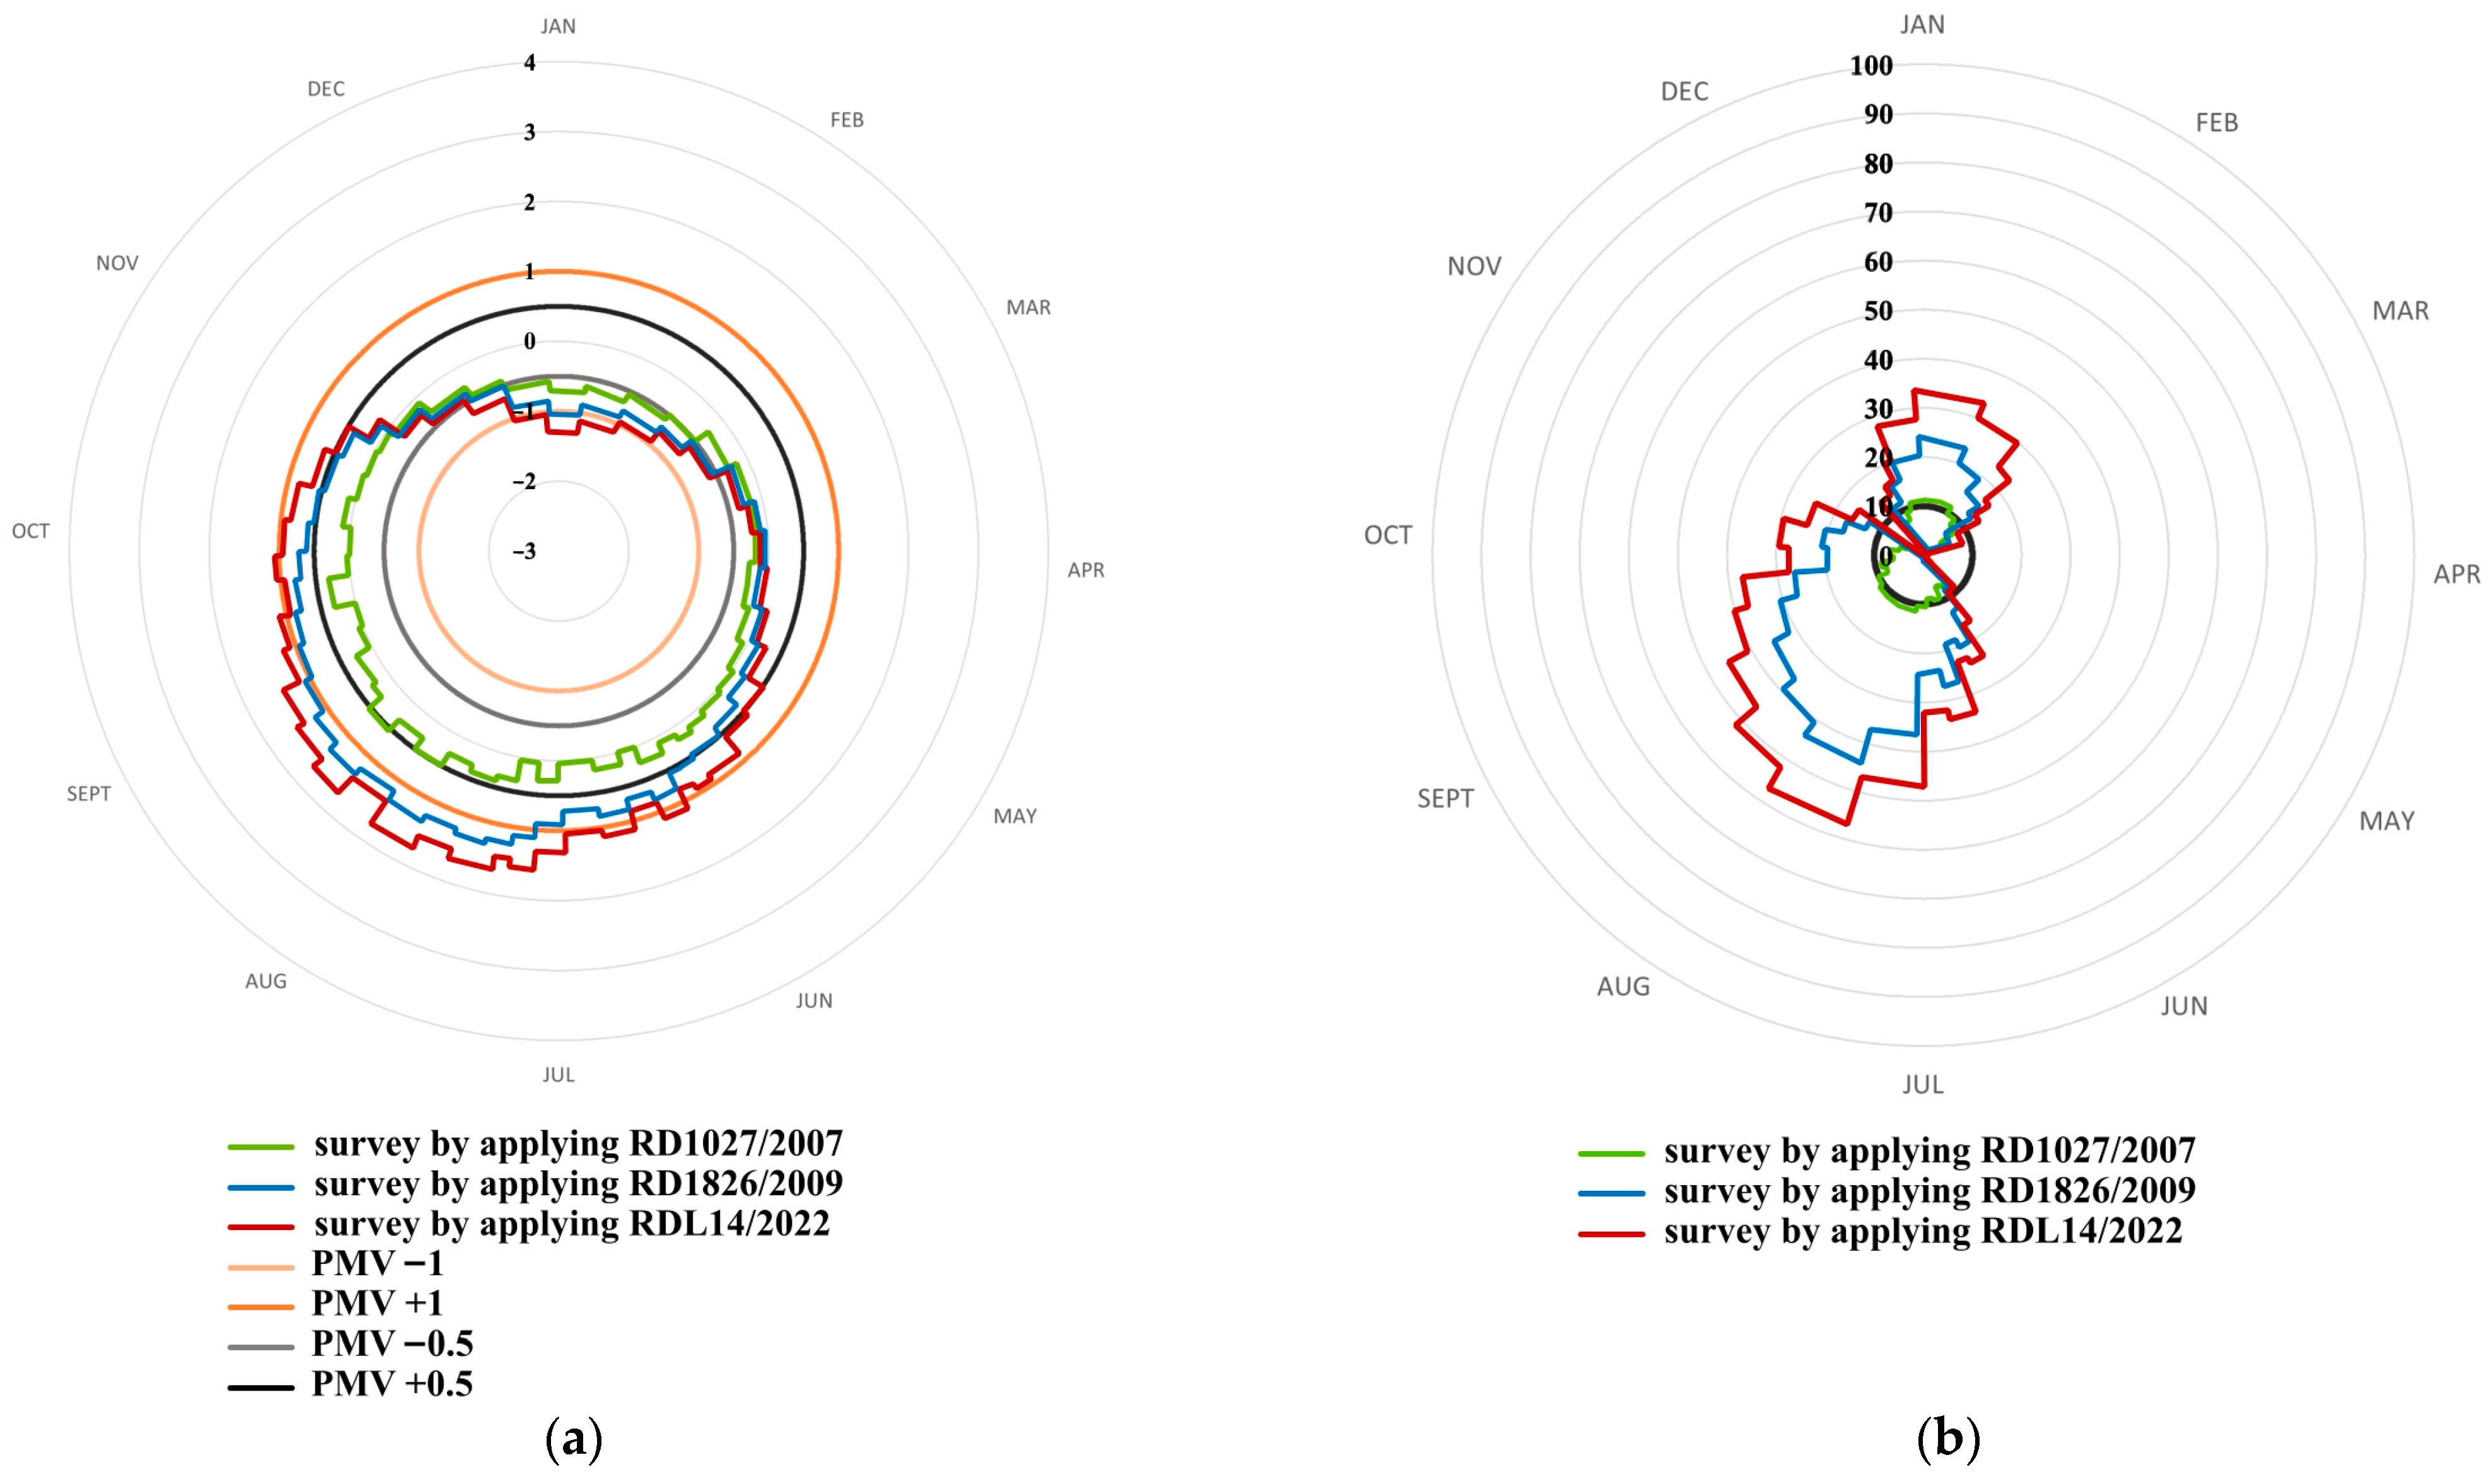
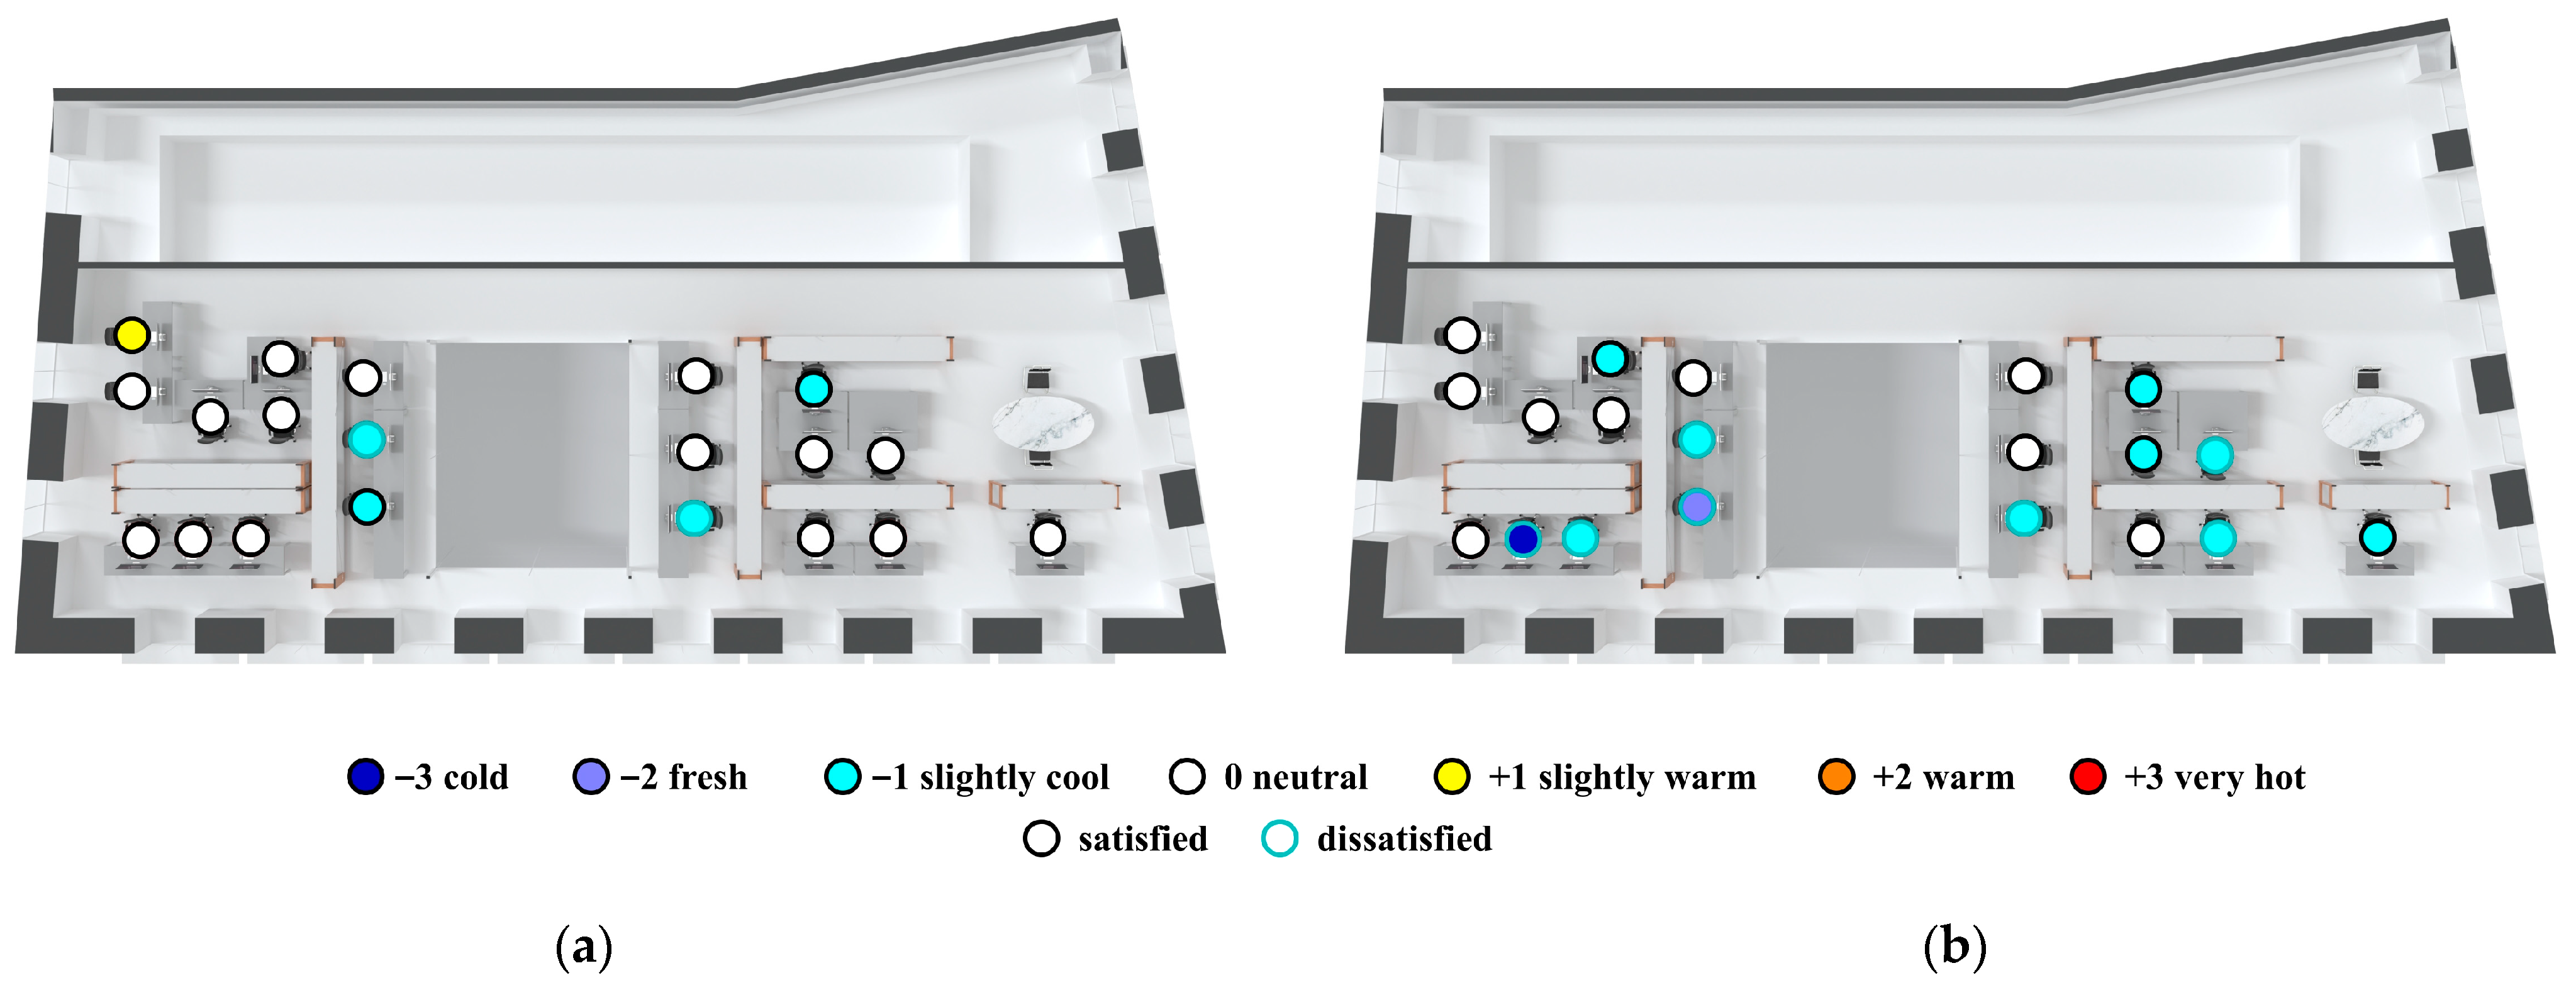
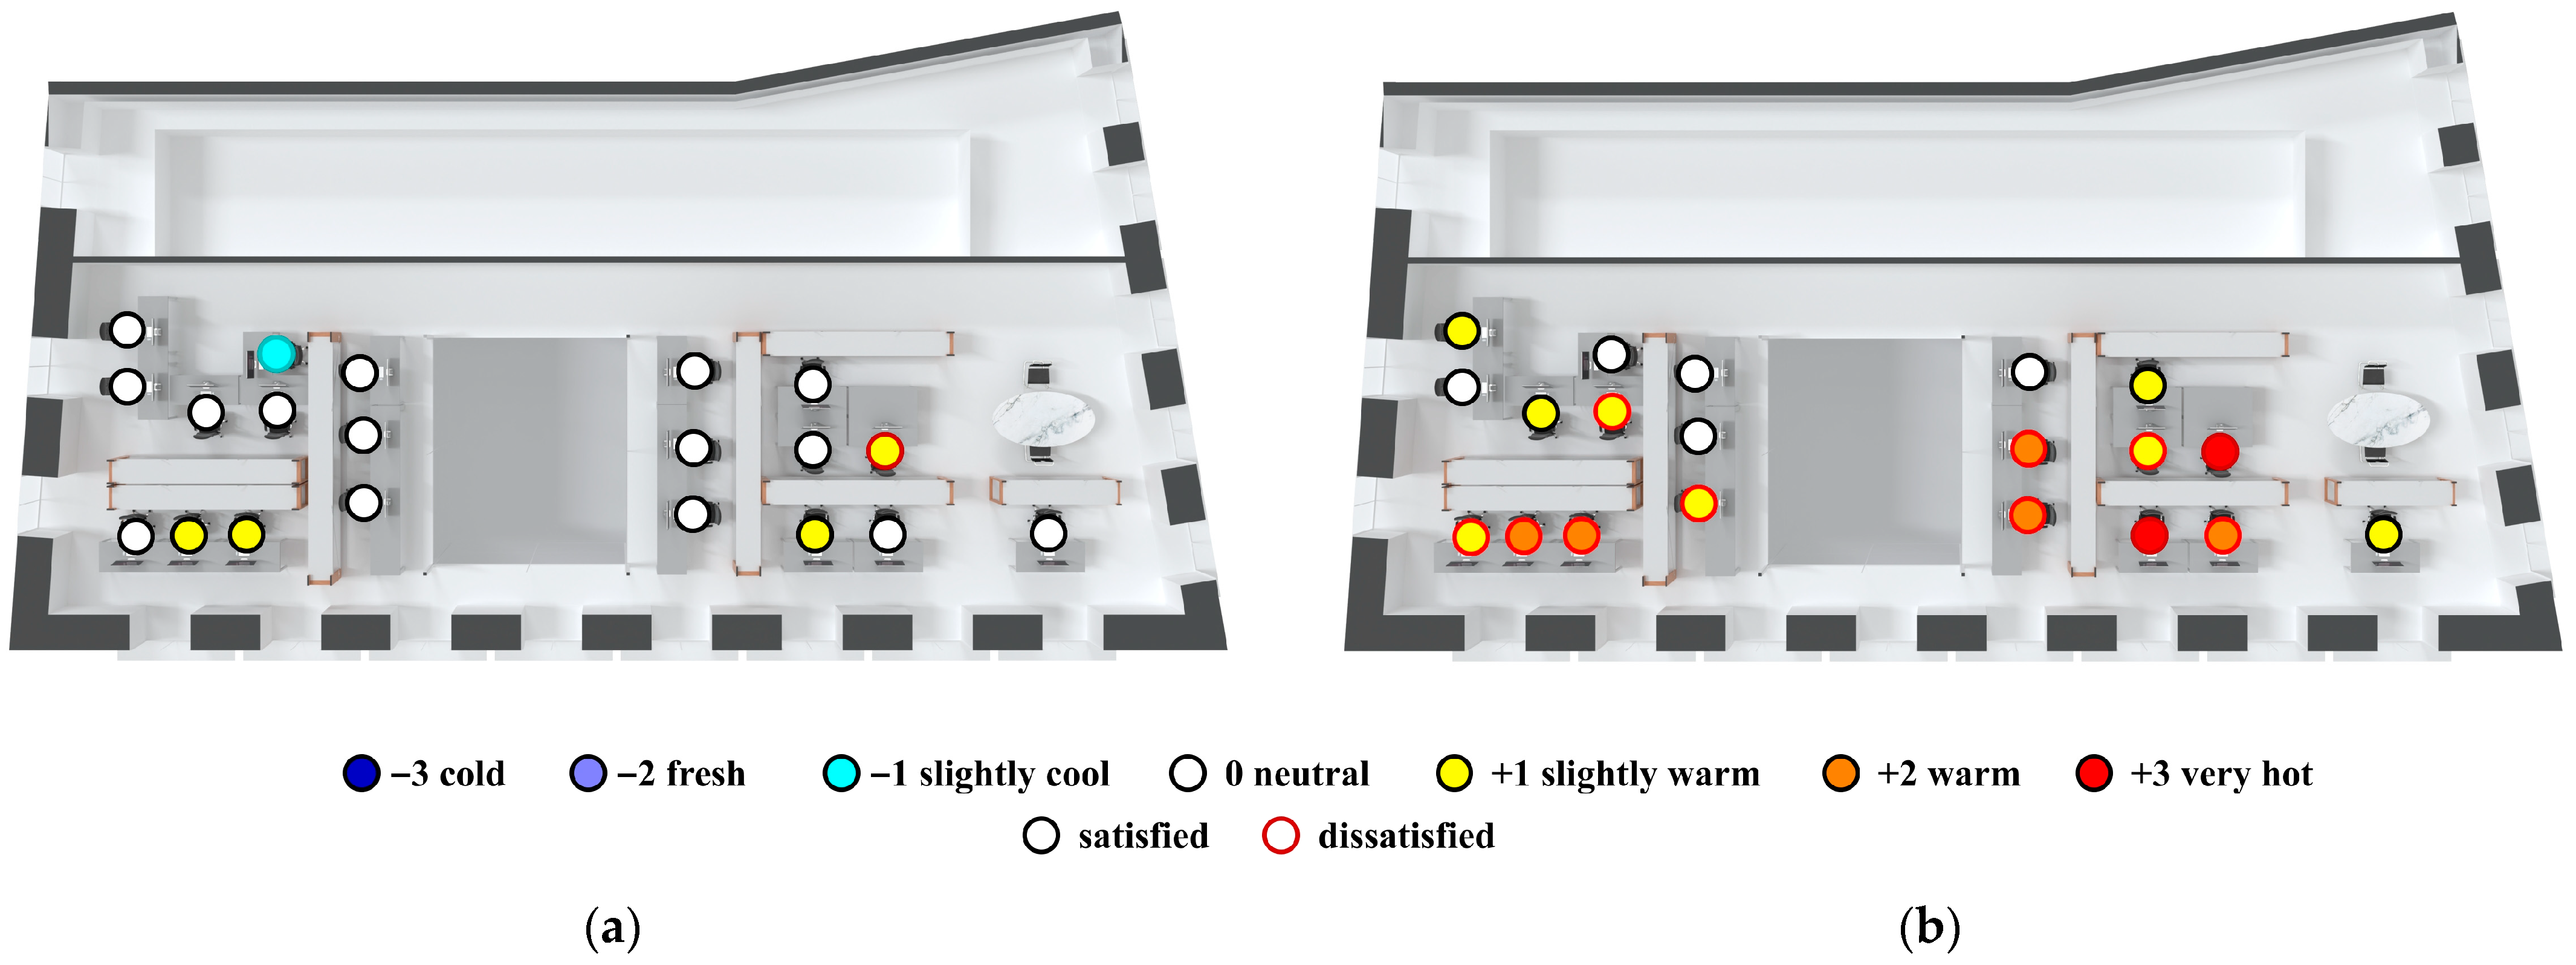
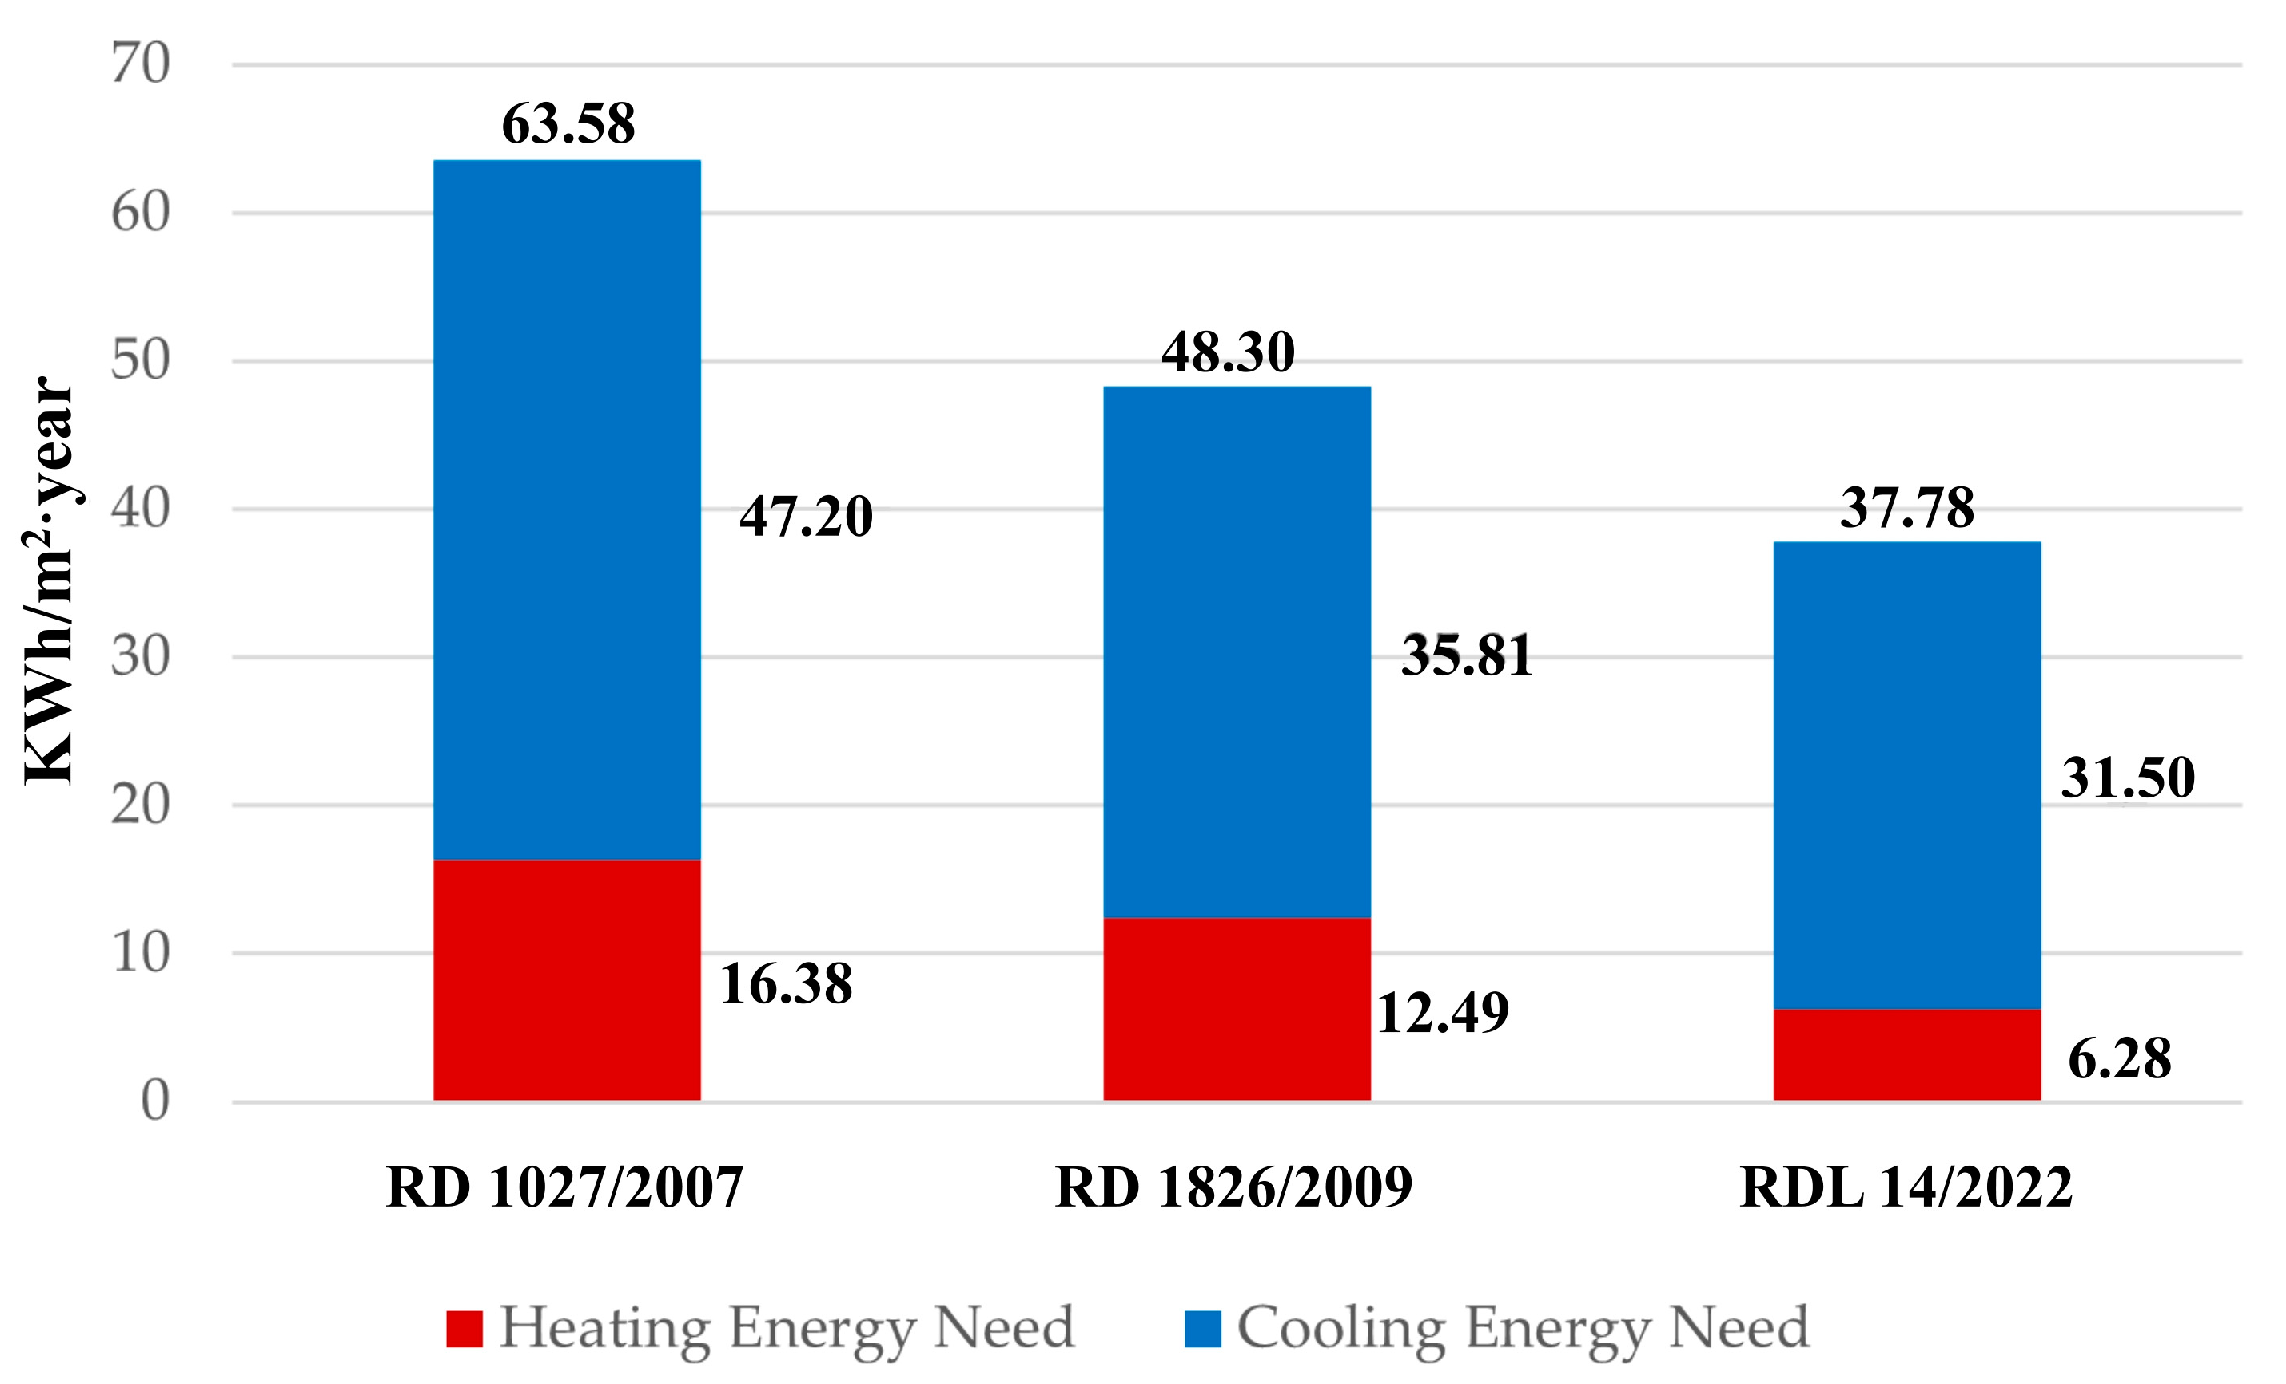

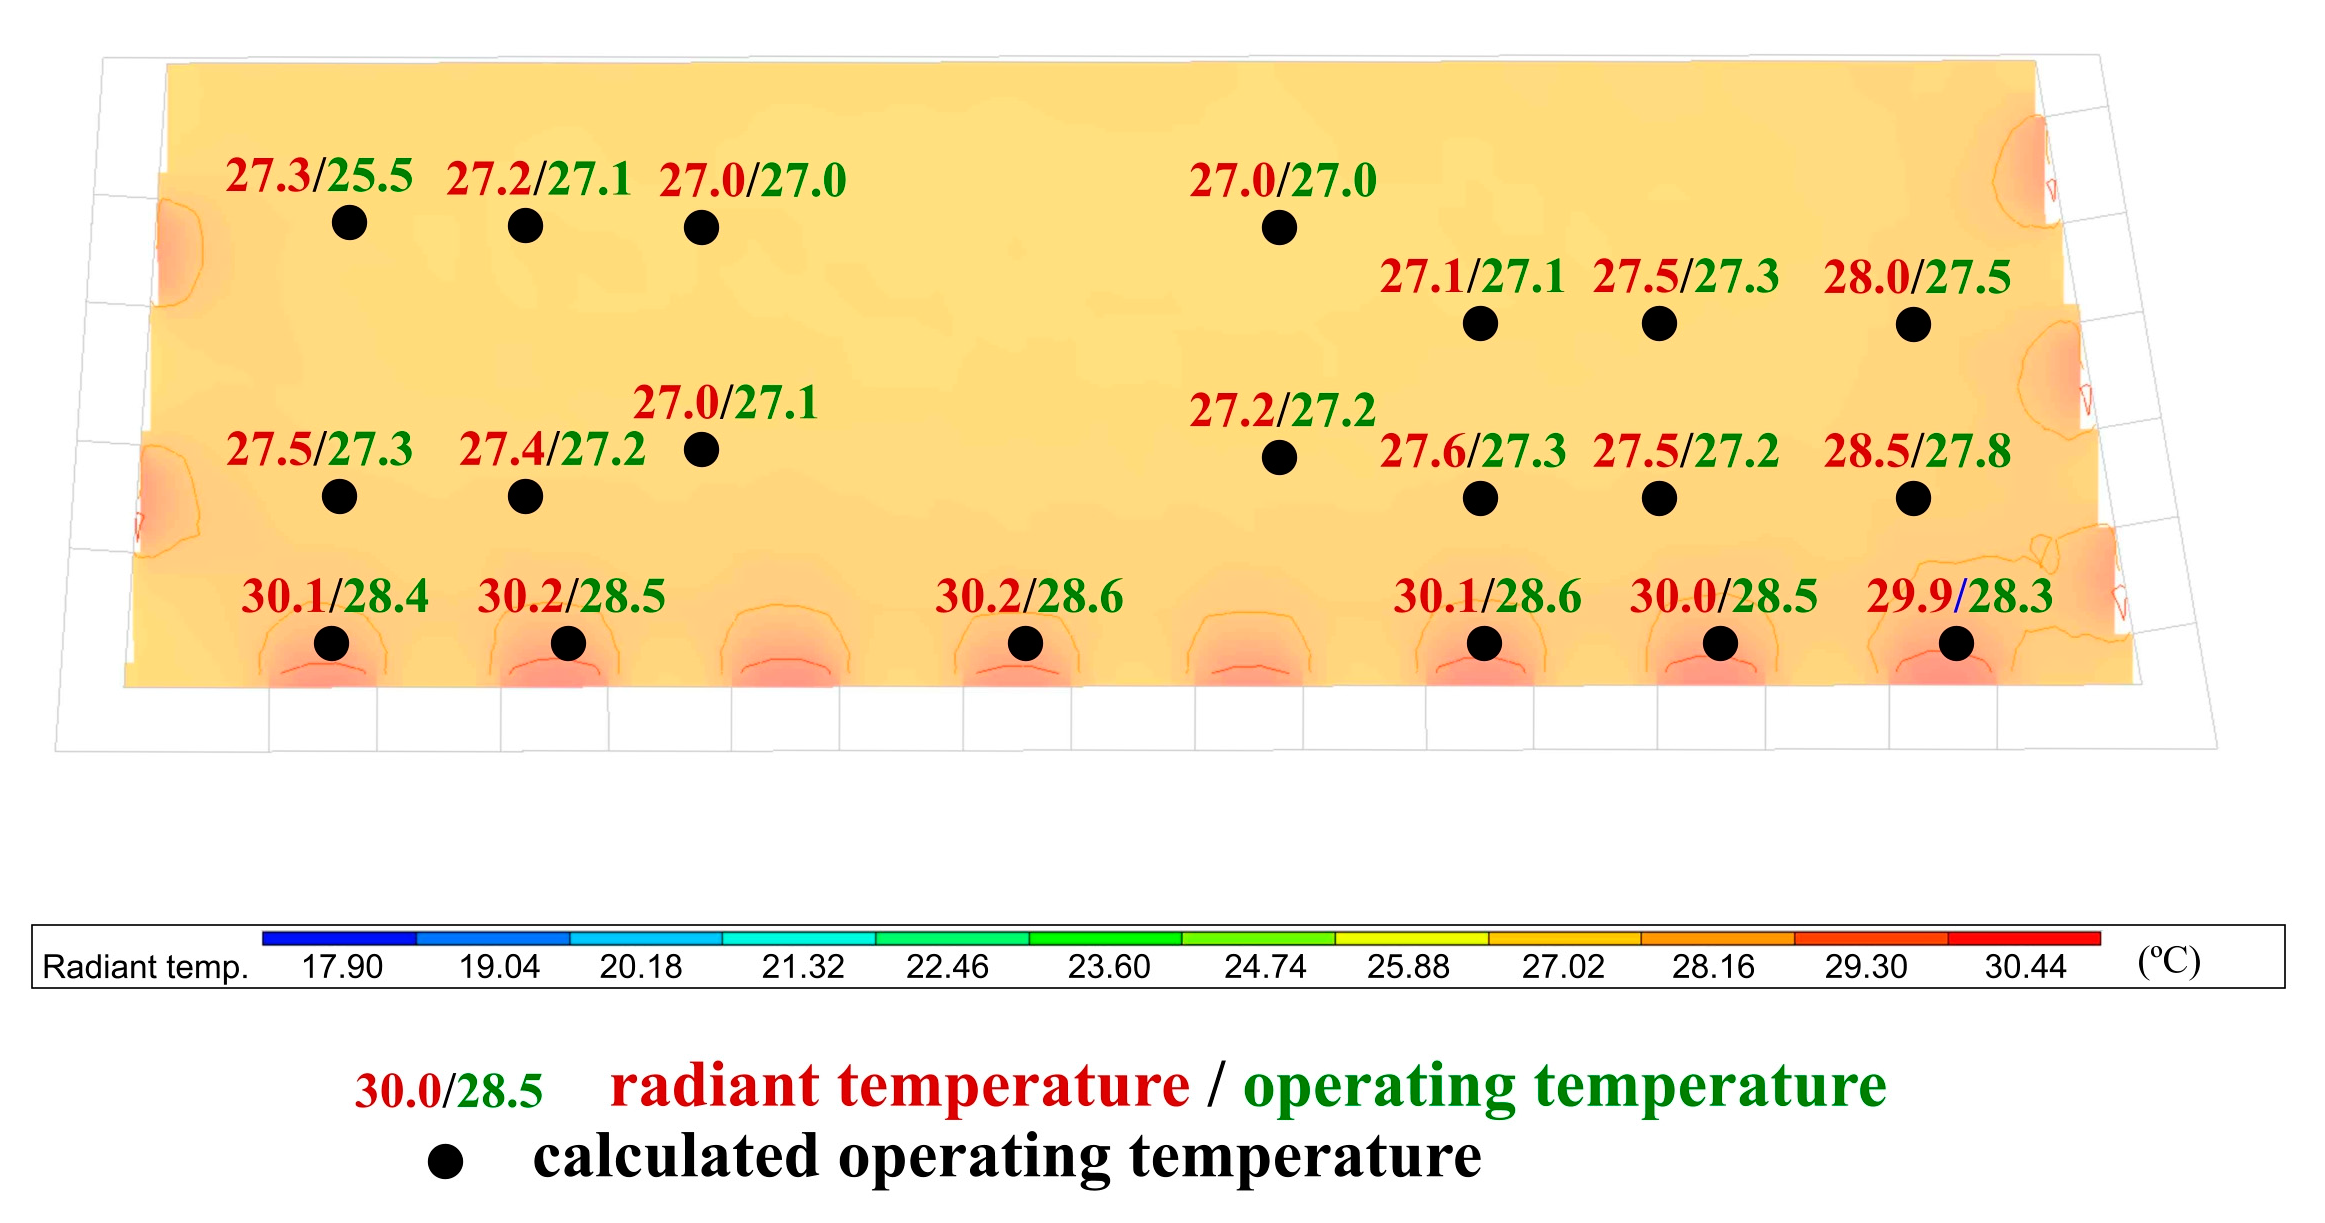
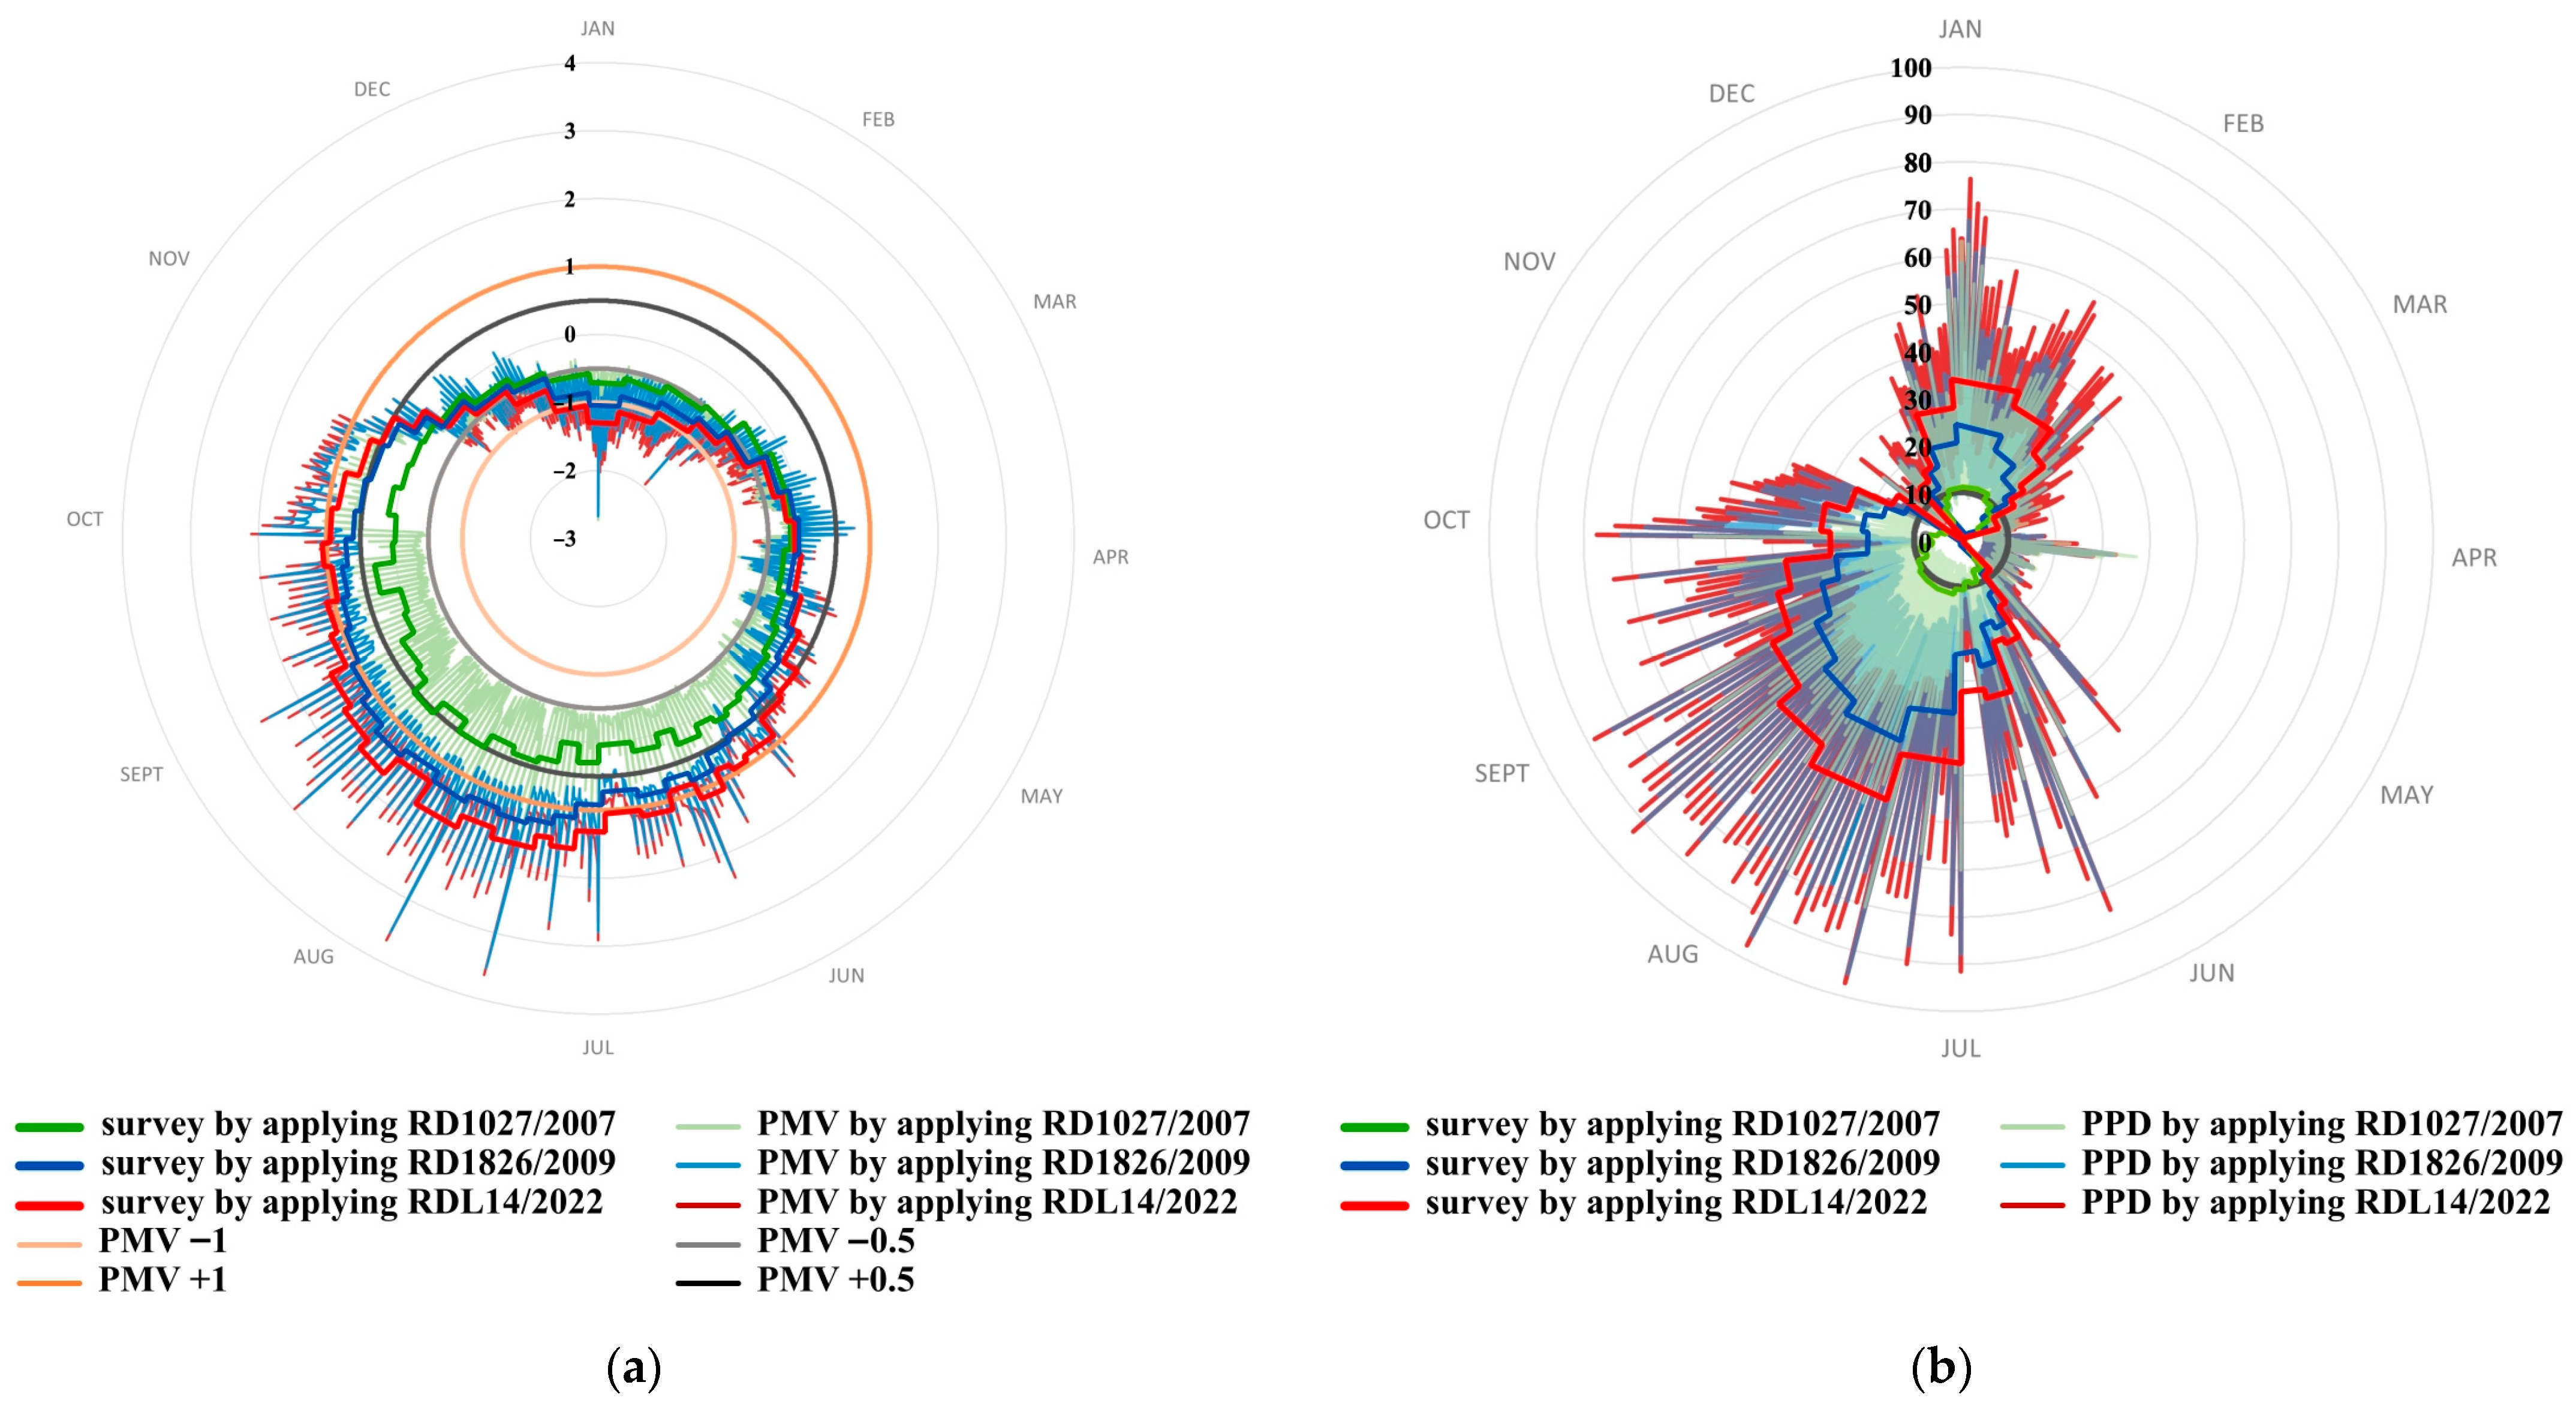
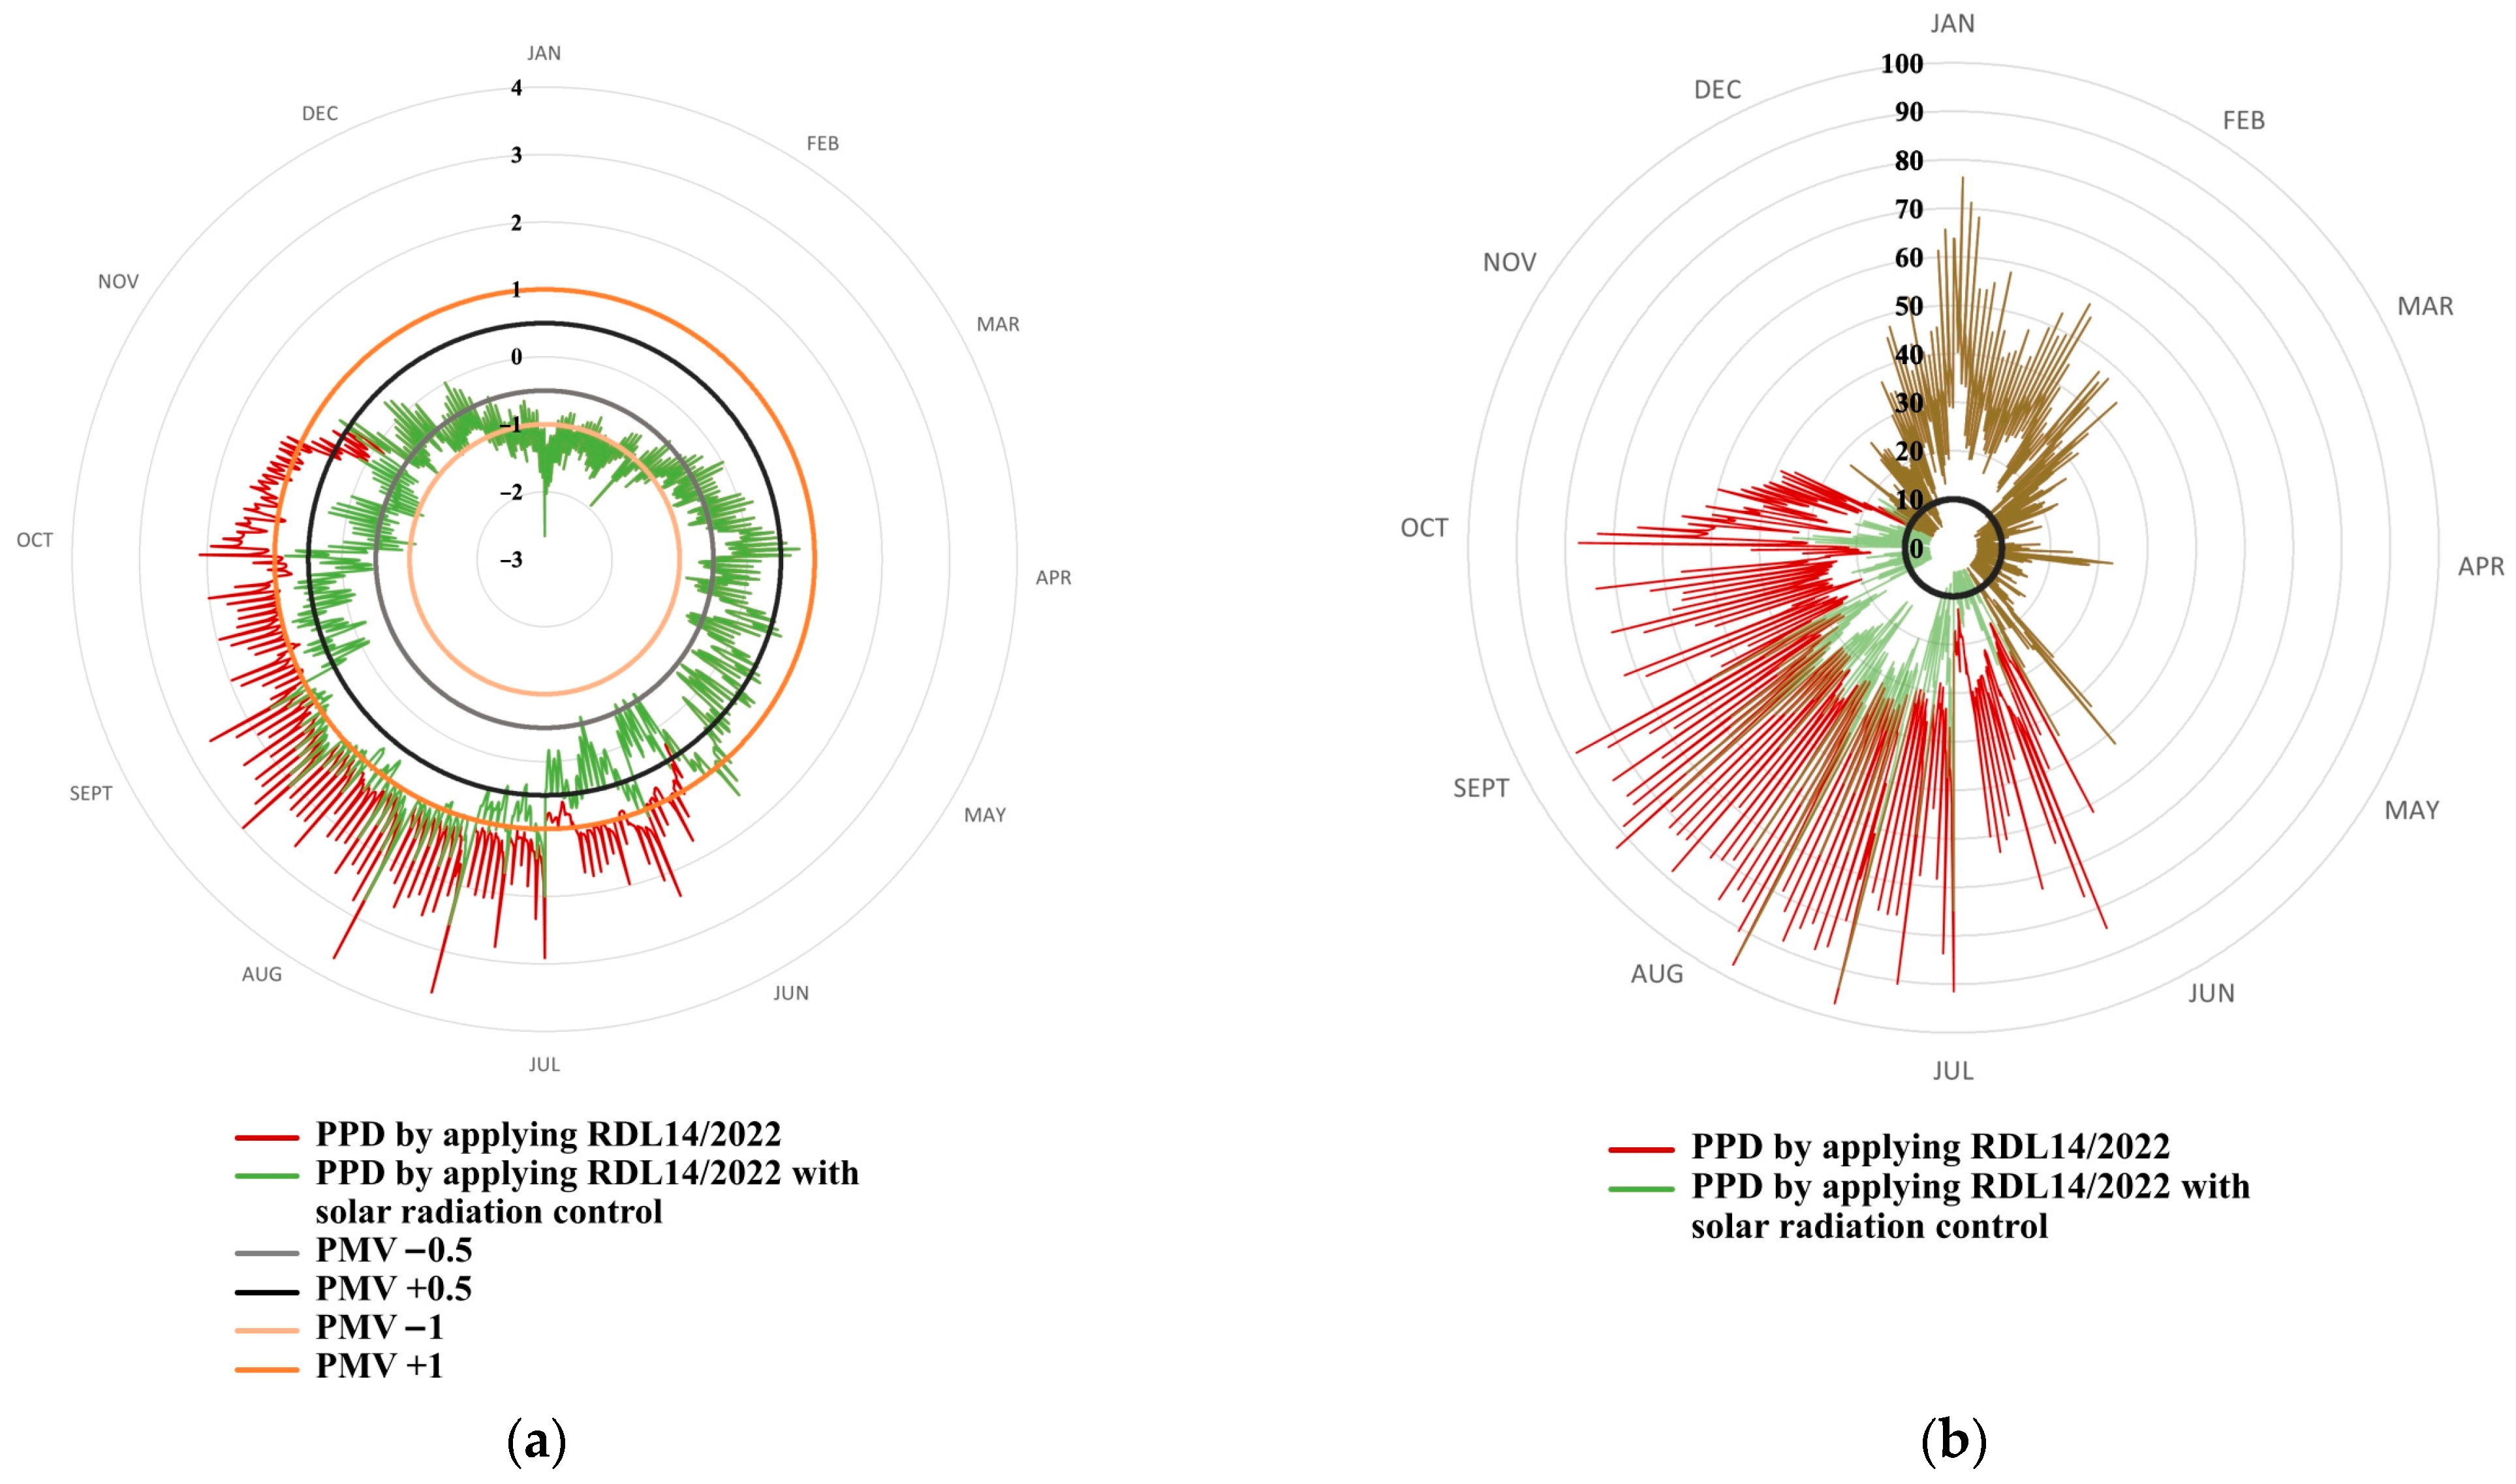
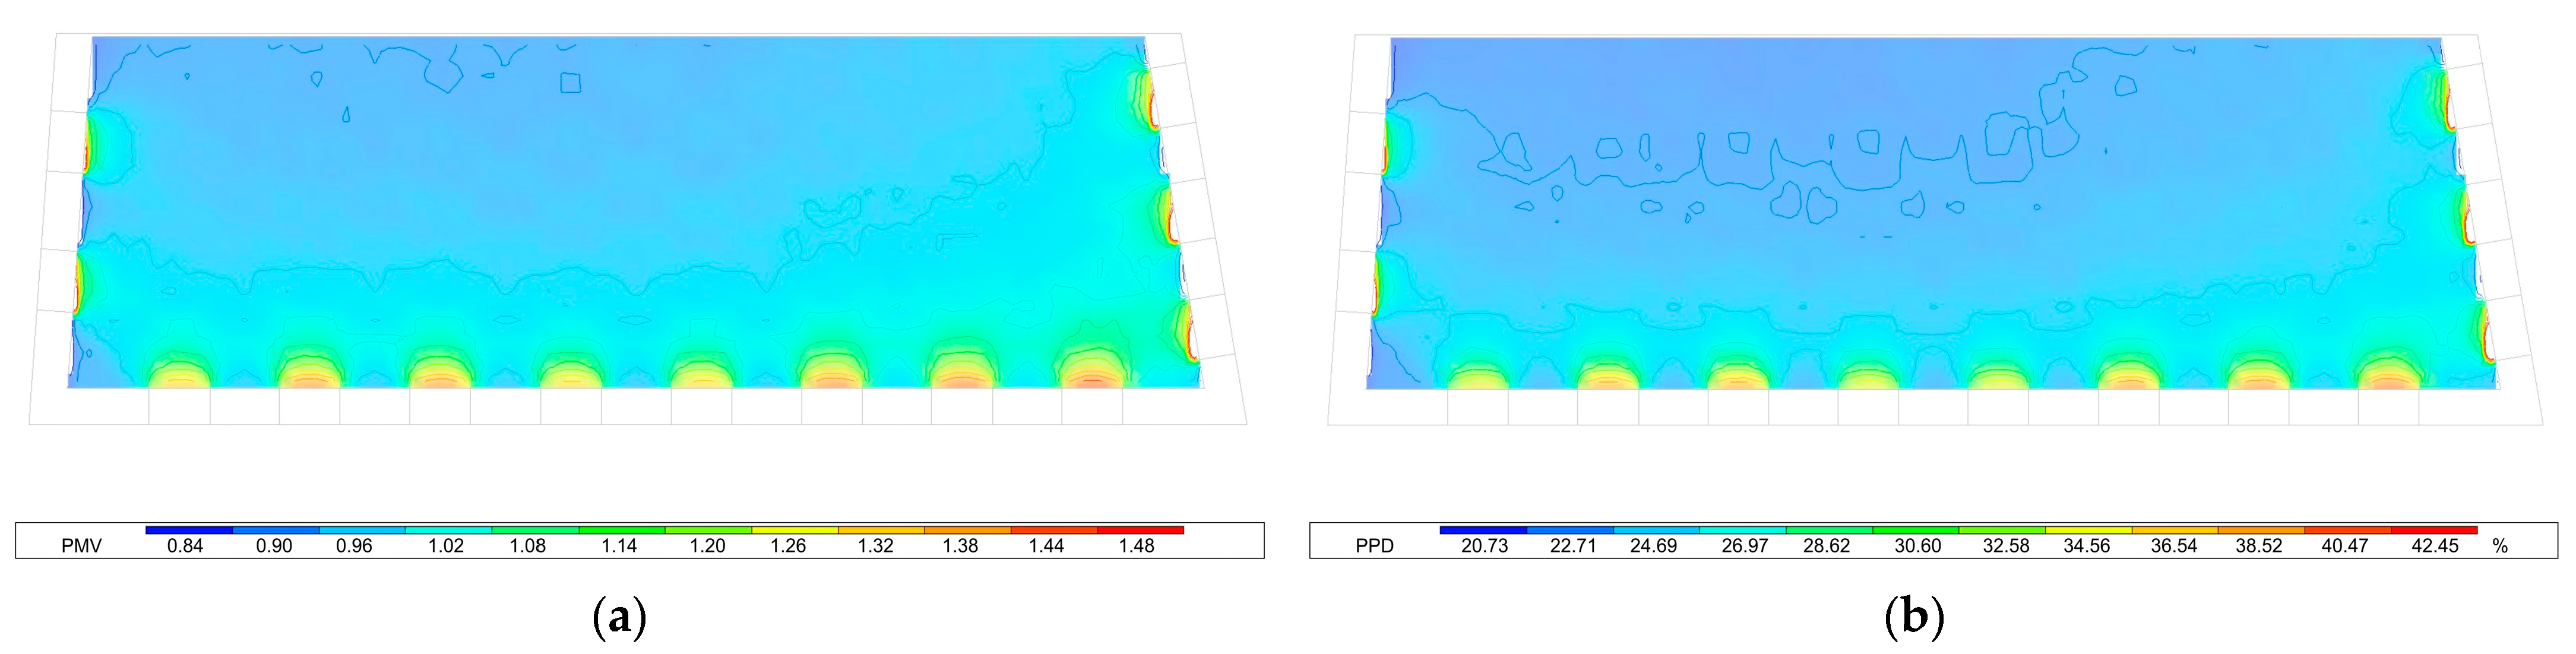
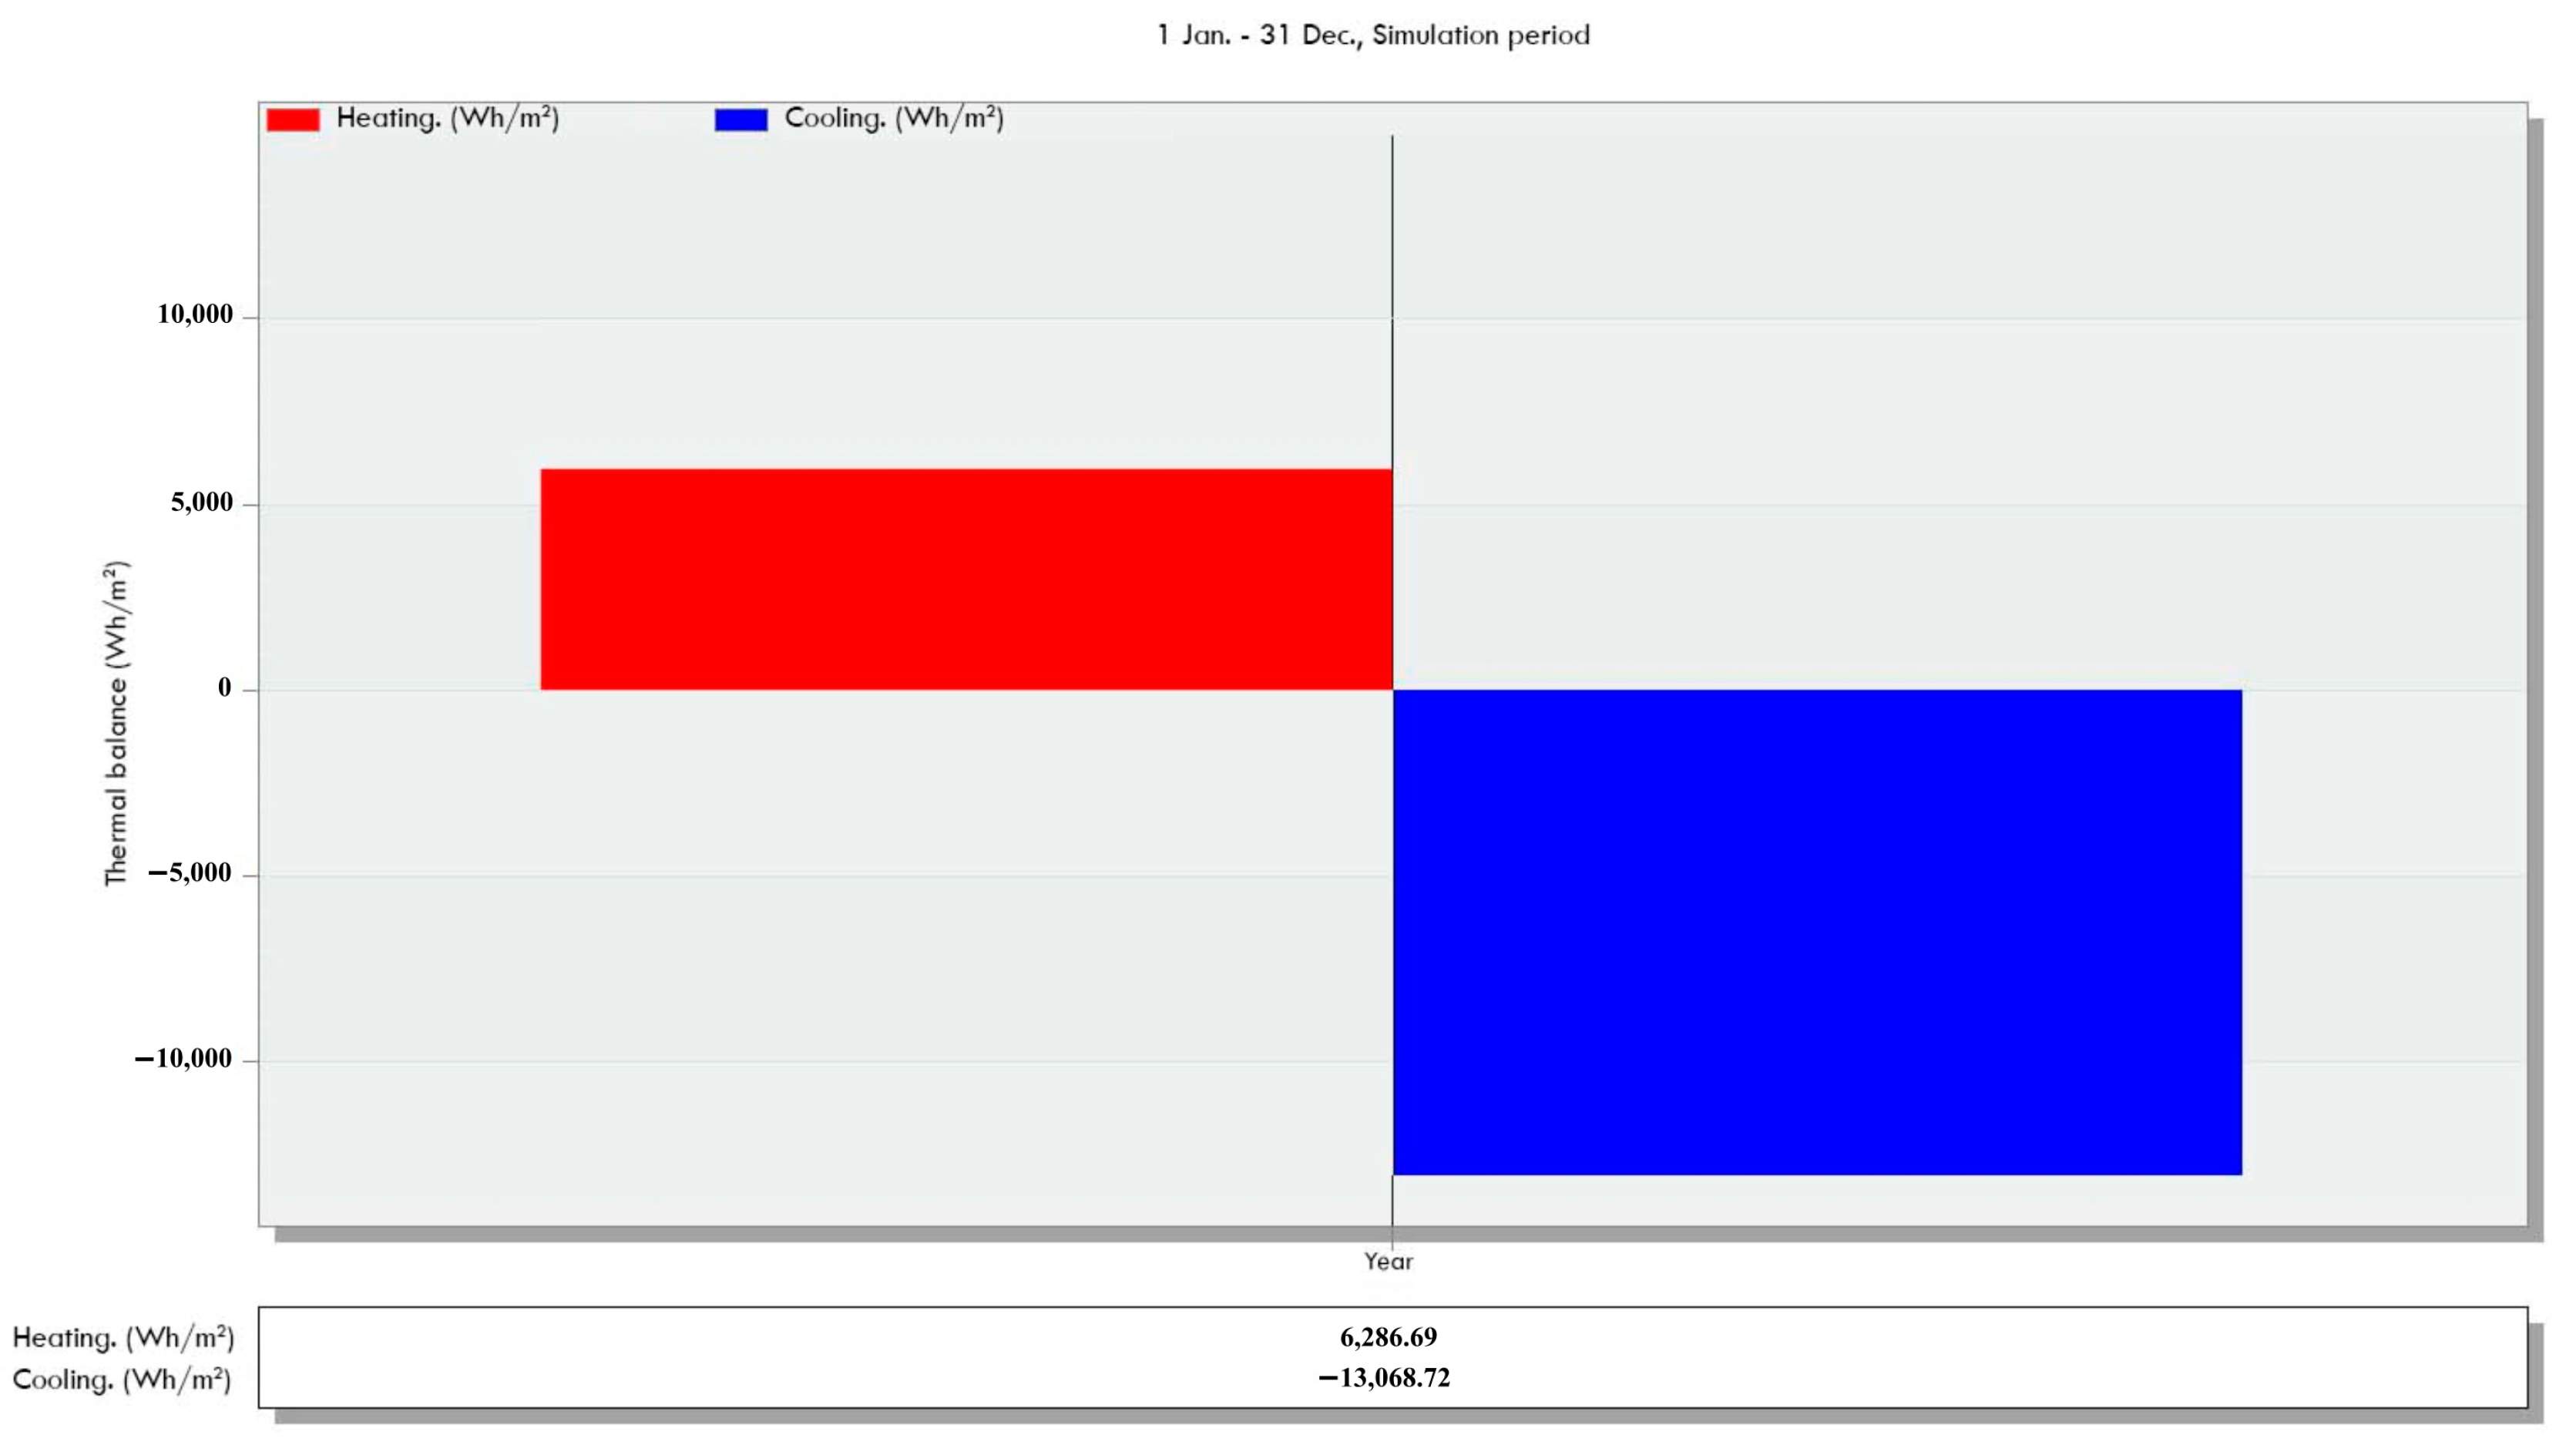
Disclaimer/Publisher’s Note: The statements, opinions and data contained in all publications are solely those of the individual author(s) and contributor(s) and not of MDPI and/or the editor(s). MDPI and/or the editor(s) disclaim responsibility for any injury to people or property resulting from any ideas, methods, instructions or products referred to in the content. |
© 2023 by the authors. Licensee MDPI, Basel, Switzerland. This article is an open access article distributed under the terms and conditions of the Creative Commons Attribution (CC BY) license (https://creativecommons.org/licenses/by/4.0/).