Abstract
Slow population growth has limited the construction of new schools, leading to the renovation of existing buildings to achieve energy efficiency goals. While improvements are made to thermal insulation, heating and ventilation systems often remain outdated, presenting challenges in maintaining indoor air quality (IAQ) in schools, where children spend a significant amount of time in densely populated classrooms, and whose health is more affected by IAQ than that of adults. Therefore, this study assessed the possibilities to achieve IAQ requirements in schools ventilated by opening the windows by monitoring the carbon dioxide (CO2) concentration, temperature, and relative humidity (RH) fluctuation. The results of the study have shown that it is not feasible to achieve the defined IAQ parameters in classrooms through window opening alone. The measured CO2 concentration during lessons in many cases exceeded the limit value of 1000 ppm and did not decrease to ambient levels when the windows were opened during the break. Additionally, the internal air temperature dropped below the normative when lessons started, and RH was significantly below the recommended minimum value on all days. It was also found that the use of thermal energy decreases evenly because of inefficient air change leaving no direct economic leverage for the installation of efficient ventilation systems.
1. Introduction
In many European countries, due to the lack of population growth, not a lot of new schools are built, and school buildings built 30 or more years ago are mostly adapted to today’s needs. In Eastern Europe, these are low-energy-efficiency buildings with powerful central heating systems and a natural ventilation system, where air enters classrooms through leaky windows or inefficient air vents and is removed through ventilation ducts installed in internal partitions [1,2]. According to Šadauskienė et al. [3], the thermal resistance of existing school building roofs and walls in Lithuania was about 1 m2·K/W, the annual heat loss was up to 180 kWh/m2 per year, and the air tightness of the building n50 ranged from three to seven times per hour. It is obvious that it is impossible to ensure modern energy efficiency and air quality requirements in such school buildings, so school buildings are being renovated. Since these are public buildings, renovation decisions are usually motivated by compliance with the energy efficiency requirements of buildings specified in building regulations. Investments to improve energy efficiency are easily justified by the saved thermal energy during the corresponding payback period [4]. It is much more difficult to justify investments in an efficient ventilation system, especially for ensuring indoor air quality (IAQ), because there are no clear and approved economic assessment methodologies, so after renovation, the natural ventilation system is often left. Even worse, old leaky windows with frost vents are being replaced with new energy-efficient and airtight windows, restricting airflow to the premises. In order to maintain at least the minimum IAQ requirements, all that remains is to open the windows when the classrooms are empty. However, there is no detailed analysis of how window opening affects IAQ.
Nowadays, people spend more than 80% of their time indoors [5,6]. Moreover, children spend almost 12% of this indoor time in classrooms; the occupancy density of many classrooms is about four times higher than that of office buildings [7], so poorly ventilated school buildings are a key source of the potential for health problems from indoor air pollutants [8]. In terms of IAQ, multiple pollutants: particulate matter concentrations, volatile organic compounds, microorganisms, excessive concentrations of carbon dioxide (CO2), etc., which can cause health problems, are often measured in schools [9]. The effect of variations in indoor air temperature, relative air humidity, and air movement speed is less often discussed, as it is more associated with well-being than with illness.
To improve IAQ, ventilation systems are used to ensure the necessary air exchange in the premises. According to Sadrizadeh et al. [8], the CO2 concentration is an indicator of the sufficiency of the rate of outside air supply per person; the higher the CO2 concentration, the poorer the ventilation and the higher concentrations of other pollutants.
Excessive exposure to CO2 might cause headaches, fatigue, and lower performance at work. According to different standards, the concentration of CO2 in the premises should not exceed 2500 parts per million (ppm), and the recommended upper limit is 1000 ppm [10,11,12]. Indoor CO2 concentrations above 1000 ppm are generally considered indicative of unacceptable ventilation rates. However, concentrations of CO2 below 1000 ppm do not always guarantee that the ventilation rate is adequate for the removal of air pollutants from other indoor sources [13]. There is enough evidence to state that CO2 has a direct health effect on humans, but only at concentrations much higher than those found in normal indoor applications [7,14]. As stated by Talarosha et al. [15] children are more susceptible to air pollutants and require more oxygen for their growth. Indoor CO2 concentrations greater than 1000 ppm will affect student health, concentration levels, and academic performance.
According to Petersen et al. [16], low ventilation rates are especially critical for children as they inhale more air in relation to their body weight compared to adults because their tissues and organs are actively growing. This study showed that the performance of the students improved significantly in four of four performance tests when the outdoor air supply rate increased from an average of 1.7 to 6.6 L/s per person. Another study showed that a higher ventilation rate (up to 10 L/s per person) could improve school performance by 14.5% [17].
Sundell et al. [18], based on Klauss et al., provide the following historical chronology of ventilation requirements: in 1836, Tregold made one of the earliest estimates of ventilation requirements. He estimated a minimum required ventilation rate of about 2 L/s per person; later, Billings (1893) calculated a ventilation requirement of about 15 L/s per person, and this value was valid until 1931 when the New York State Commission found that 5–7.5 L/s per person was adequate in schoolrooms. Since 2001, the ventilation rate used is typically 7.5 L/s per person in densely occupied spaces. According to the hygiene standards of the Republic of Lithuania, HN 21:2017 ‘School carrying out general education programs. General requirements for health safety’, the average concentration of CO2 in classrooms and teaching rooms, measured between the beginning and end of the lessons, must not exceed 2745 mg/m3 (1500 ppm), and the maximum acceptable concentration of CO2 in the air of these rooms is 9000 mg/m3 (5000 ppm) [19].
The main aim of ventilation is to create an IAQ that is more suitable for people and processes than that occurring in an unventilated building, thereby diluting and removing the pollutants produced by inhabitants, their activities, and the indoor surroundings [20]. However, the operation of any ventilation system to reduce the concentration of CO2 indoors is inseparable from the change in the temperature and relative humidity (RH) of the indoor air. Temperature and RH are important physical factors that affect the sense of well-being [21]. Studies showed that reducing temperature by 1 °C could improve school performance by 3.5% [17]. Air temperature also affects thermal comfort, which can negatively affect student health and educational performance [9]. Ma et al. [22] noticed that children worldwide have different thermal comfort temperatures in different seasons and different climatic conditions. They provide several examples of other research: in England, the comfort temperature for children (11–16 years of age) is 16.5 °C in winter and 19.1 °C in summer; in South Korea, the comfort temperature for children (4–6 years of age) is 22.1 °C; in Australia, the comfort temperature is 24.5 °C in winter and 22.5 °C in summer for students in primary and secondary school. The HN 21:2017 hygiene norms of the Republic of Lithuania recommend that the air temperature in classrooms, teaching rooms, and the assembly hall should be at least 18 °C and not higher than 22 °C in the cold season, and not higher than 26 °C in the warm season [19].
One of the functions of ventilation is to remove moisture from the building, which is emitted by the occupants, generated through their activities (cooking, showering, cleaning, etc.) and produced through chronic leaks from piping, roofs, or through the walls of basements [21]. Controlling RH is important for the comfort of children and for the prevention of moisture accumulation, which can lead to mould growth [21]. Low levels of humidity are unacceptable due to the decrease in mucous available to the eyes and nose, leading to the drying of these organs and thus irritation [23]. On the other hand, high levels of RH may support the growth of pathogenic or allergenic microorganisms (e.g., mould on the inner side of the elements of the building envelope) [5]. However, when moisture emissions are low, ventilation greatly reduces the relative humidity. The hygiene norms HN 21:2017 of the Republic of Lithuania recommend that RH in school premises be maintained at a level of 35–60% in the cold season and 35–65% in the warm season [19].
The ventilation of the premises is always related to the loss of heat in the building. When evaluating the energy efficiency of buildings, heating the amount of air necessary for ventilation is considered a mandatory part of the energy consumption of buildings. However, the energy efficiency of buildings is reduced by the energy consumption to heat the air with excessive infiltration, so the aim is to avoid this by increasing the level of air tightness of buildings and installing adjustable mechanical ventilation systems. Natural ventilation systems are considered to be poorly regulated, so the energy consumption for ventilation is considered higher. It is even more difficult to estimate the energy consumption related to ventilation, when ventilation takes place by opening the windows, and even such a methodology does not exist, although the assessment of the increase in energy consumption due to opening the windows would add economic motivation to install mechanical ventilation systems in schools. Even worse, old room heating systems that have not been renovated and do not have automatic regulation mean that the air temperature in heated schools is often higher than the norm, also increasing the total heating costs of the building [24].
According to a World Health Organization (WHO) report, most schools (86%) in Europe use natural ventilation, only 7% use assisted ventilation, and only 7% of schools use mechanical ventilation [21]. The problems related to ventilation also exist in many Lithuanian school buildings constructed in the Soviet period [1]. According to data from the Lithuanian Statistics Department, in 2022, there were 957 general education schools in Lithuania with 330,262 students [25]. A significant number of Lithuanian schools are renovated; however, only a few of them have a mechanical ventilation system. According to Zemitis et al. [26], the lack of modern ventilation systems in schools means that most students are taking classes in buildings with the only possible air exchange through open windows. Kapalo et al. [2] stated that even a short 10-min class ventilation has a significant impact on classroom air quality, which means that even brief ventilation has a positive impact on classroom IAQ. However, there is no detailed analysis performed on how window opening affects indoor air quality parameters: CO2 concentration, indoor air temperature, and relative air humidity, nor is there any energetic or economic assessment method for this type of ventilation. The WHO survey suggested that technical and operational requirements must be established to ensure adequate ventilation: minimum number and surface area of vents in natural ventilation systems; minimum number of windows/window surface area; functioning heating systems and temperature controls; specifications of mechanical systems; protocol for opening windows during classes and breaks; CO2-based demand-controlled mechanical systems; and increase in teacher awareness [21]. Therefore, this research aimed to analyse the impact of opening windows as part of the natural ventilation of school rooms on the parameters of the internal microclimate (CO2 concentration, temperature, and RH) in renovated naturally ventilated schools in Lithuania. Three schools of different sizes and years of construction were selected for the study. Monitoring of the CO2 concentration, air temperature and RH was carried out in classrooms of various sizes and occupancy. During the study, the outside air temperature, cloudiness, classroom occupancy, and duration of opening the windows were recorded. The air change rate was measured in all classrooms using the blower door method before starting the measurements. The results of the study are presented as a dependence of CO2 concentrations in classrooms on window opening patterns, considering the classroom occupancy, measured standardised air exchange rate, and outside climate parameters. In addition, the impact of window opening on the heat consumption of the building was also analysed.
2. Materials and Methods
2.1. Investigated Schools and Classrooms
Three schools (School A, School B and School C) located in Alytus, Lithuania, were selected for the study. All schools were built between 1960 and 1980 and have undergone renovations. The renovation works included the replacement of windows and external doors, thermal insulation of the facades and roofs, and modernization of the heating system. Ventilation during renovation has not been improved in either of these schools and is still only natural with openable windows. All schools are in the city centre, close to busy streets. The classrooms selected for the study had similar volumes and window areas in all schools and were located on the eastern or southern facade. The floor area of these classrooms varied from 49.2 to 54.25 m2. According to the hygiene norms HN 21:2017, each student must be provided with at least 1.7 m2 of learning space per classroom [19]. The occupancy density in selected classrooms varied from 2.05 to 3.51 m2 per person, thus meeting the requirements of HN 21:2017. Data for schools are presented in Table 1.

Table 1.
Data on schools and surveyed premises.
The premises were in continuous classroom use at the time of the survey. Heating in the classrooms is provided with water-filled radiators with thermostatic valves. The three study classrooms have typical school furniture and the floor is covered with linoleum. The density of people who occupy the selected rooms during the research is given in Table 2.

Table 2.
Density of persons in the classroom, person/m2.
During the study, teachers were allowed to ventilate the classroom as normal: when students leave the classroom, all windows are opened at an angle of about 90° and kept until the end of the break. There are no people in the classroom during the break. At the end of the break, the windows are closed, and only then do the students enter the classroom.
2.2. Measurement Equipment Used in Research
The indoor air quality meter used for the study was a Combo IAQ Meter 77,597 portable indoor air quality (IAQ) meter (Figure 1), compliant with EN 50270:2015, which measures:
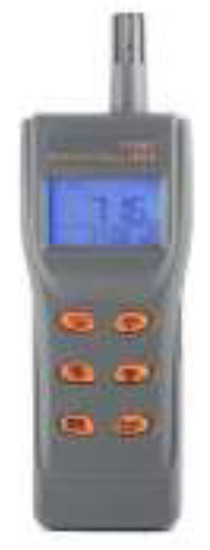
Figure 1.
Combo IAQ Meter 77597.
- Air temperature from −20 °C to 60 °C (air temperature resolution 0.1 °C; air temperature accuracy ±0.6 °C).
- Relative humidity (RH) from 0 to 99.9% (RH resolution 0.1% RH; RH accuracy ±3% RH (at 25 °C, 10~90% RH), others ±5% RH).
- Carbon dioxide (CO2) concentration from 0 to 9999 ppm (CO2 resolution 1 ppm; CO2 accuracy ±30 ppm ± 5% of reading (0~5000 ppm), other ranges are not specified).
Levels of CO2, internal temperature and RH were monitored at 5-min intervals throughout the occupied day, in locations close to the occupied zone at seated head height, at 1.1 m height in the centre of the classroom (Figure 2). The meter was placed on a table that was unoccupied throughout the measurement.
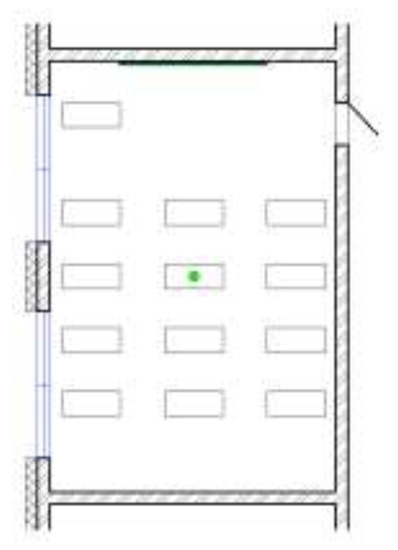
Figure 2.
Location of the meter in the standard classroom layout (green dot).
The air exchange rate per hour n50 of each classroom was measured with the standardised fan pressurization method, using the Retrotec Blower Door System (Figure 3) with the following technical specifications: measurement accuracy ±3.0%, measurement uncertainty 8.3%. Tests were carried out once before the monitoring of IAQ with sealed ventilation exhaust ducts under negative indoor pressure conditions.
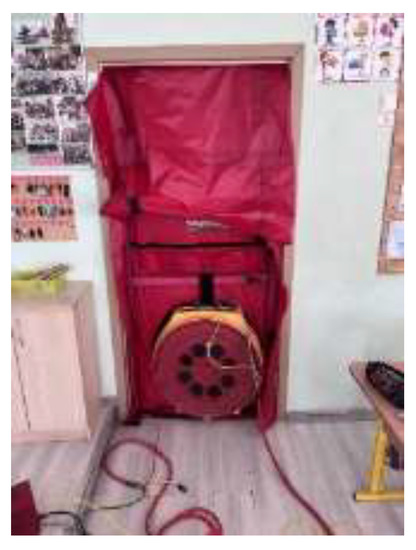
Figure 3.
Blower door test.
2.3. Monitoring Sequence of Window Opening, CO2 Concentration, Indoor Air Temperature, and RH
The periods of approximately −10–+10 °C external air temperatures were chosen for the study. It is the longest period in the school year and, thus, the opportunities for opening windows to ensure indoor microclimate parameters in classrooms are the most relevant and cannot be ignored. Hot summer is less relevant for general education schools, because they are not used during the school holidays, and on warm spring days, when the outside air temperature is similar to the inside, the windows can be kept open during classes as well. During the summer, overheating problems arise, not ventilation-related, which are solved by other means. In the cold winter period, when the outside air temperature is below −10 °C, and without testing, it is clear that the temperature conditions will not be suitable.
Firstly, prior to the three-day IAQ monitoring, a blower door test was carried out once to determine air exchange in every classroom at a pressure difference of 50 Pa. Monitoring was carried out for three consecutive days during the heating season in one representative classroom in each school. Measurements were made during all teaching hours, including breaks. The school day varied depending on the classroom schedule from 8:00 to 13:45. The survey recorded the start and end time of each lesson, the number of pupils in the lesson, and the opening and closing times of the windows. Measurement dates, window opening times, and climatic conditions during the measurement period are presented in Table 3.

Table 3.
Climatic data determined during the measurement period.
Wind speeds were similar on all monitoring days, ranging from 1 to 5 m/s.
2.4. Assessment of Air Exchange and Heat Consumption for Class Ventilation
The volume of air changing through the open windows during one break Vair,exc.op. is calculated using the equation:
where: Vroom—volume of the room, m3.
N—the proportion of indoor air that has changed.
The volume of air that changes in the room through leaks in one lesson Vair,exc.leak is calculated using the equation:
where 0.5—a coefficient to account for the fact that air infiltration into the building does not occur throughout the envelope area.
n50—the value of the air change in the building as determined by tests (h−1).
zc—duration of the lesson, min.
60—number of seconds per minute.
0.75—aerodynamic coefficient of the building.
ρair—air density (kg/m3); ρ = 1.21 kg/m3.
0.9—a coefficient that takes into account the reduction in wind speed due to the presence of various barriers in the vicinity of buildings.
vwind,m—wind speed (m/s).
50—the pressure at which the building’s airtightness is measured (Pa).
2/3—the value of the grade indicator determined by blower door tests.
The amount of air required for ventilation during a lesson, Vair,exc.req., is calculated using equation:
where: Vreq—fresh air flow required by hygiene standards, L/s.
zc—duration of the lesson, min.
60—number of seconds per minute.
NS—number of students in the class during the lesson.
1000—number of litres per cubic metre.
The amount of air to be additionally heated in case of required ventilation achieved is calculated using the equation:
The amount of thermal energy used to heat the changed air, Qh, is calculated using the equation:
where ρair—density of air at a temperature of 0 °C, kg/m3.
cair—specific heat capacity of the air, kJ/(kg·K).
(ti − te)—internal and external air temperatures, °C.
3600—conversion to kWh.
3. Results
3.1. Monitoring Results for School A
The monitoring of School A was carried out in the presence of freezing outside temperatures and high cloud cover. The air change rate per hour (n50) in this classroom was measured at 1.55 1/h. On the first day of monitoring (8 March 2022), the outside air temperature was −3–0 °C. The carbon dioxide (CO2) concentration, indoor air temperature, and occupant density during lessons on 8 March 2022 in School A are shown in Figure 4.
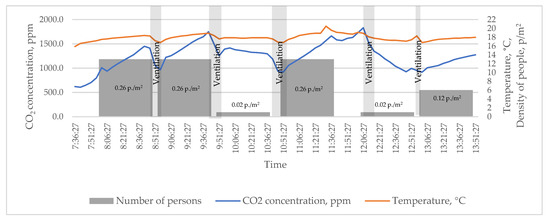
Figure 4.
CO2 concentrations, air temperature, and density of people during class on 8 March 2022 in School A.
As can be seen in the CO2 concentration graph in Figure 4, the room was well-ventilated at the beginning of the class (CO2 concentration around 600 parts per million (ppm)). Classroom occupancy was average for all lessons, with 0.26 people/m2. The CO2 concentration started to increase before the lesson started, as the students gathered in the classroom earlier. During the first 45 min of the first lesson, the CO2 concentration in the classroom increased from 800 ppm to 1450 ppm (+650 ppm). Opening the windows for 15 min reduced the CO2 concentration from 1450 ppm to approximately 970 ppm (−480 ppm), which did not cover the accumulation of CO2 during the lesson. During the second lesson, the CO2 concentration increased from 970 ppm to 1646 ppm (+676 ppm), which is very similar to the increase during the first lesson. During the break, the window was open only for 10 min, so the CO2 concentration decreased from 1646 ppm to 1250 ppm (−396 ppm), roughly proportional to the decrease in the first break. During the third lesson, there was only one person in the classroom (approximately 50 m2 of classroom space) and the CO2 concentration decreased by only about 100 ppm. This shows that the change in indoor air without opening the window is quite low. During the third 15-min break, the CO2 concentration dropped from 1189 ppm to 920 ppm (−269 ppm), which is similar to the drop during the first break. During the fourth lesson, when the same number of students reassembled, the CO2 concentration increased by approximately the same amount as during the first lesson (+742 ppm). During the sixth lesson, when the class was about twice as small as during the first lessons, the CO2 concentration increased from 916 ppm to 1254 ppm (+338 ppm) in 45 min, that is, approximately 2 times less.
The temperature curve is smooth, with temperatures below the norm at the beginning of the lessons but close to 18 °C during the other lessons. During ventilation, the indoor temperature dropped by about 1.5 °C when the windows were open, but quickly rose to the norm when the windows were closed.
The relative humidity (RH) also decreased by about 5% but remained close to the norm of 35%.
On the second monitoring day (9 March 2022), the outside air temperature was close to the first day’s temperature, with lower cloud cover. Classroom occupancy was slightly lower than on the first day, with 0.22 person/m2. This time, the classroom was ventilated before the first lesson; the first lesson started at a CO2 concentration of 574 ppm and reached a concentration of 1228 ppm (+654 ppm) at the end of the lesson (Figure 5). During the first break, the windows were only opened for 10 min, but the decrease in CO2 concentration was −395 ppm, like the window opening of 15 min on the first monitoring day. During the third lesson, there were two people in the classroom and the classroom was not ventilated before and during the lesson, which shows that without opening the windows there is insufficient air change in the room and the CO2 concentration is not reduced.
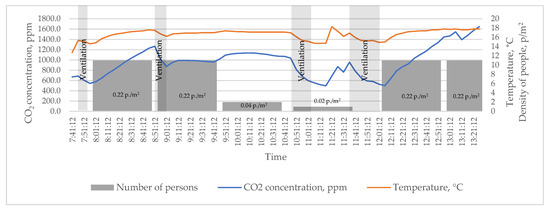
Figure 5.
CO2 concentrations, temperature, and density of people during class on 9 March 2022 in School A.
The increase in CO2 concentration during lessons five and six shows that during the first break without ventilating the classroom, the CO2 concentration reaches a high value of 1650 ppm.
The indoor air temperature curve for the day shows that the temperature was kept lower during the night, with a drop of about 1.5 °C when the windows are open and stabilised between lessons five and six without ventilation. The RH of the indoor air is lower than on the first day, between 30% and 35%, which is due to the lower number of people in the room, especially during the third and fourth lessons.
On the third day of monitoring (10 March 2022), the outside air temperature was −9 to −3 °C with high cloud cover. Classroom occupancy was higher than before, with 0.28 person/m2 during the first, third and fourth lessons. The classroom was ventilated before the first lesson and the lesson started at a concentration of 602 ppm, which increased to 1370 ppm (+768 ppm) at the end of the lesson. This shows that increasing the occupancy of the classroom quickly leads to an increase in CO2 concentration (Figure 6). From the monitoring data for this day, opening a window at a lower outside air temperature leads to a greater air change and, consequently, to a greater reduction in the CO2 concentration in the room air. During the 15 min window opening between the third and fourth lessons, the CO2 concentration in the room decreased from 1354 ppm to 680 ppm (−674 ppm). The trends in CO2 regulation when opening the windows at school A were similar on all three days of monitoring.
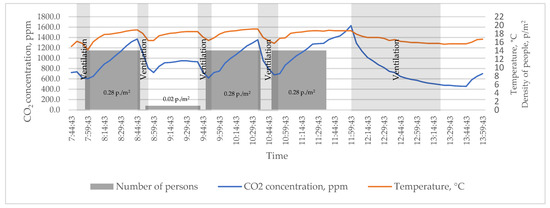
Figure 6.
CO2 concentrations, temperature, and density of people during class on 10 March 2022 in School A.
The room air temperature decreased more during the opening of the windows than during the first lessons, by around 2 °C. This is a significant drop, but the speed with which the room air temperature recovers when the windows are closed suggests that air changes during ventilation do not have time to cool the room surfaces.
Indoor RH is much lower than on previous days, with 11% RH measured at one point. This is below the regulatory limit. Cold air entering the room intensively absorbs moisture, so ventilation at lower outside air temperatures removes moisture from the room more quickly.
3.2. Monitoring Results for School B
The monitoring of School B took place at positive outside temperatures on sunny days. The air change rate per hour (n50) in this classroom was measured at 2.26 1/h. On the first day of monitoring (22 March 2022), the outside air temperature varied between 6 and 11 °C, resulting in a high temperature of +25 °C in the classroom at the beginning of lessons (Figure 7).
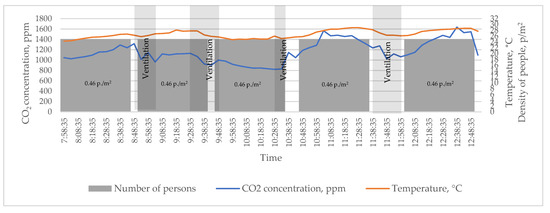
Figure 7.
CO2 concentrations, temperature, and density of people during class on 22 March 2022 in School B.
The situation was similar on the other monitoring days: on the second day (23 March 2022), the outside air temperature varied between 4 and 14 °C, with a high inside air temperature of +23 °C in the morning and a steady rise during the day, and on the third monitoring day (24 March 2022), the outside air temperature varied between 2 and 5 °C, but the classroom temperature was +22 °C in the morning and rose to almost +28 °C during the day (Figure 8). During all lessons, the density of people in the room was 0.46 people per m2.
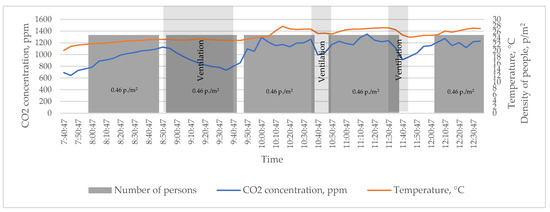
Figure 8.
CO2 concentrations, temperature, and density of people during class on 24 March 2022 in School B.
The CO2 concentration in this school varied very unevenly during the school day, with frequent increases and decreases during the school day, regardless of ventilation. Passive sunscreens should be installed on windows as the room becomes too hot and ventilation by opening the windows does not reduce the indoor air temperature.
3.3. Monitoring Results for School C
The monitoring of School C was carried out in the presence of positive outside temperatures and high cloud cover. The air change rate per hour in this classroom was measured at 2.50 1/h. On the first day of monitoring (25 March 2022), the outside air temperature was 6–8 °C. The concentration of CO2, the temperature of the indoor air and the density of the residents during the lessons on 04.25 at School C are shown in Figure 9.
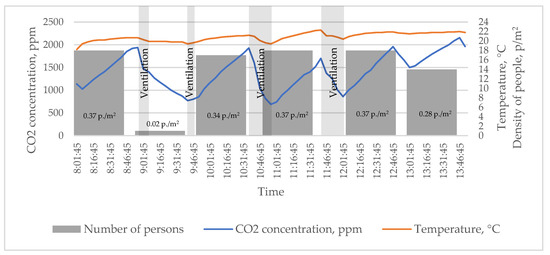
Figure 9.
CO2 concentrations, temperature, and density of people during class on 25 April 2022 in School C.
As can be seen in the CO2 concentration graph in Figure 9, the CO2 concentration at the beginning of the class was 1026 ppm. Classroom occupancy was average for all lessons, with 0.30 person/m2. The CO2 concentration started to increase before the lesson started, as the students gathered in the classroom earlier. During the first 45 min of the first lesson, the CO2 concentration in the classroom increased from 1026 ppm to 1940 ppm (+914 ppm). Opening the windows for 10 min reduced the CO2 concentration from 1940 ppm to approximately 1400 ppm (−540 ppm), which did not cover the accumulation of CO2 during the lesson. During the second lesson, the classroom was empty, so the concentration of CO2 decreased from 1400 ppm to 872 ppm (−528 ppm). During the second break, the window was open for 5 min, decreasing the CO2 concentration from 872 ppm to 773 ppm (−99 ppm), recognizing that it was empty before. During the third lesson, the density of the classroom rose to 0.34 person/m2, thus increasing the CO2 concentration from 855 ppm to 1927 ppm (+1072 ppm). During the third 20-min break, the CO2 concentration dropped from 1927 ppm to 740 ppm (−1187 ppm), which is like the drop during the two-times shorter first break. During the fourth lesson, when the density of people in the classroom was a bit higher (0.37 person/m2), the CO2 concentration increased by approximately the same amount as during the first lesson (+1011 ppm). The fourth 20-min break decreased the CO2 concentration from 1701 ppm to 861 ppm (−840 ppm), as before. The fifth lesson was attended by the same number of pupils as before, the CO2 concentration increased from 861 ppm to 1959 ppm (+1098 ppm) in 45 min, i.e., the same as before. Between the fifth and sixth lessons, no window opening occurred, so on this 15-min break, the CO2 concentration decreased from 1959 ppm to 1499 ppm (−460 ppm), i.e., around twice less compared to opening of the window.
The temperature curve is smooth, with temperatures close to 18 °C at the beginning of the lessons, and not higher than given in the norms during the other lessons. During ventilation, the indoor temperature dropped by about 1.5 °C when the windows were open, but quickly rose to the norm when the windows were closed.
The RH also decreased by about 8% but remained within the limits of the norms.
On the second monitoring day (26 April 2022), the outside air temperature was close to the first day’s temperature, with lower cloud cover. Classroom occupancy was slightly higher than on the first day, with 0.36 person/m2. This time, the first lesson started at a CO2 concentration of 941 ppm and reached a concentration of 1961 ppm (+1020 ppm) at the end of the lesson (Figure 10). During the first break, the windows were only opened for 10 min, but the decrease in CO2 concentration was −694 ppm, like the 10 min window opening on the first monitoring day. The classroom was ventilated by opening windows after every lesson. The ventilation period was usually 15 min, so we can see the same tendencies in Figure 10, as described in the first lesson, and the results of the second day are similar to the results of the first day.
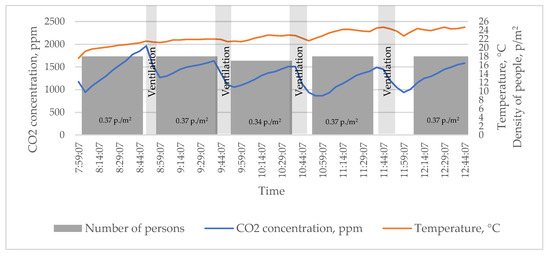
Figure 10.
CO2 concentrations, temperature, and density of people during class on 26 April 2022, in School C.
The indoor air temperature curve for the day shows that the temperature was kept lower during the night, with a drop of about 1.5 °C when the windows are open and constantly increasing during the day. The RH of the indoor air is like the first day, between 35% and 50%.
On the third day of monitoring (27 April 2022), the outside air temperature was 6–7 °C, and the weather was sunny. Classroom occupancy was the same as the day before. The room air temperature dropped more during the opening of the windows than during the first two days, by around 3–3.5 °C. This is a significant drop, but the speed with which the room air temperature recovers when the windows are closed suggests that the air changes during ventilation do not have time to cool the room surfaces. The lowest indoor humidity was recorded on the third day. After the third ventilation, indoor humidity dropped significantly, from 24 to 16%. This is below the regulatory limit.
The trends in CO2 regulation when opening the windows in School C were similar on all three days of monitoring. The longer the window is open for ventilation, the bigger the drop in CO2 concentration. The results of the monitoring of School C showed that the airtightness of the classroom is the highest of all the schools studied, with the highest increases in CO2 concentrations for similar occupancy levels. This is confirmed by the clear dependence of the decrease in CO2 concentration on the time of window opening.
4. Discussion
4.1. Dependence of the Drop in CO2 Concentration When the Windows Are Open on the Duration of Window Opening at Different Outside Temperatures
Table 4 shows the data for all ventilations: duration of ventilation, change in carbon dioxide (CO2) concentration, change in indoor temperature during ventilation, outside air temperature during ventilation, and occupant density before and after ventilation.

Table 4.
Ventilation summary data.
As can be seen in Table 4, the CO2 concentration is highly dependent on the timing of window opening, the duration of which was usually between 10 and 20 min. It has been observed that such a short period of time leads to a reduction in CO2 concentrations between 15% and, in some cases, 65%. The presence of people during ventilation does not affect the slower decrease in CO2 concentration. Opening the windows for ventilation results in changes in temperature in the room. Because the studies were carried out during the cold season, the negative temperature outside also influenced faster cooling of the indoor air, with a 10 to 20 min ventilation that generally cools the room by 1 to 3 degrees, resulting in an indoor temperature that did not meet hygiene standards, and also changed the relative humidity (RH) value to a lower value as the air entered the room.
Opening the windows for ventilation makes it very difficult to keep the air quality parameters constant, as it is only when the window is closed that the CO2 concentration starts to rise again and usually reaches undesirable levels in the middle of the lesson. As the study did not specify when to open the windows, it can be seen that the window was not always opened between lessons. Normally, CO2 concentrations in a well-ventilated classroom start to rise from a minimum and reach the maximum recommended value (1000 ppm) in the middle of the lesson. In an unventilated classroom, the CO2 concentration drops very little during breaks and always remains above 1000 ppm.
As can be seen in the graphs above (Figure 4, Figure 5, Figure 6, Figure 7, Figure 8, Figure 9 and Figure 10), Schools A and C show a clear decrease in CO2 concentrations in proportion to the time the windows are open, depending on the magnitude of the initial concentration. Opening the window (depending on the duration of the opening) returned the CO2 concentration to its initial state, that is, before each lesson, the CO2 concentration dropped to a level similar to at the beginning of the previous lesson. This did not happen in School B because the internal temperature was always quite high.
4.2. Variation in Indoor Air Temperature with Window Opening Time and Outside Air Temperature
The variation in indoor air temperature with window opening time and outside air temperature at the time of window opening is analysed below. Based on the data in Table 4, each window opening period can be divided into different temperature ranges.
We first analyse the cases where the outside temperature ranged from −6 °C to −9 °C. At these temperatures, there were two ventilation cycles of 15 min and one of 10 min. In all cases, the indoor temperature dropped by about 2 degrees.
The next case to be analysed was the outdoor temperature of 0 to −5 °C. At these temperatures, there was one ventilation cycle of 5 min, two ventilation cycles of 10 min, five ventilation cycles of 15 min, and two ventilation cycles of 20 min or more. The 5-min ventilation cycle took place at an outdoor temperature of 0 °C and resulted in a 1.5-degree decrease in room temperature (from 18.3 °C to 16.8 °C). The two 10-min ventilation sessions took place when the outside temperature was −3 °C and the room temperature dropped by 1.3 degrees. During 15-min ventilation, the indoor temperature decreased by approximately 1 degree, except for one case where the indoor temperature decreased by 3.4 degrees during ventilation and the outside air temperature was −5 °C at the time of ventilation. Ventilation cycles of more than 20 min cooled the room temperature by 2 degrees.
Another case to be analysed was an outdoor temperature of 1 to 5 °C. At these outdoor temperatures, two ventilation cycles of 10 min and one of 15 min were carried out. One 10-min ventilation after the first lesson reduced the indoor temperature by half a degree and the other after the third lesson the following day reduced the indoor temperature by 1.3 degrees. Both stints of ventilation reduced the CO2 concentration by the same amount from the initial value, but the room temperatures recorded before the start of the ventilation were 25.2 °C in the first case and 26.9 °C in the second case. During 15-min ventilation, the room temperature was reduced by 3 °C, while the room temperature before ventilation was 27.3 °C.
The last case analysed was the case where the outside air temperature was between 6 and 10 °C. At these outside temperatures, one ventilation of 5 min was carried out, during which the room temperature dropped by 0.4 degrees. The 10 min ventilation sessions resulted in a drop in room temperature of about 0.5 to 0.8 degrees. A 15-min ventilation in one school raised the room temperature by 0.5 degrees; in another school, it reduced the room temperature by half a degree. In both cases, the outside air temperature was similar, as was the classroom occupancy. An exceptional case was a 15-min ventilation that reduced the room temperature by more than 3.6 degrees (the room temperature before the ventilation started was 24 °C, the outside air temperature during ventilation was 6 °C). There were four 20-min ventilation cycles, two of which were like the 15-min ventilation cycles: in one school, the room temperature rose, and in the other school, it fell. However, despite these occurrences, the room temperature dropped by about 2 degrees during these ventilations. The last three cases are ventilation cycles of 25 min, during which the room temperature dropped by about 2 to 2.5 degrees.
4.3. Variation in RH with Window Opening Time and Outside Air Temperature
Table 5 shows the data for all ventilation events: duration of ventilation, change in RH, outside air temperature at the time of ventilation.

Table 5.
RH summary data.
In School A, the outdoor temperature on the third day was lower than on the other days, which affected the RH. With each opening of the window for ventilation, the cold air entering the room dehumidified the indoor air, resulting in a drop in RH on this day, with a particularly significant drop in RH during lesson 5 of 1.7 times. When the outside temperature is below −5 °C (Table 5), it is more difficult to control the RH, which drops below the norm when the window is opened and, with each ventilation session, the cold air entering the room makes the air even drier, which can cause dry eyes and other similar ailments in pupils. Without opening a window to ventilate the room, RH increases, but so does the room temperature and CO2 concentration.
In School B, the RH was significantly below the recommended minimum value (35%) on all days. RH is influenced by indoor temperature, which was significantly higher than hygiene standards on all days in this school, which also led to air drying. In School B, unlike School A, it is not possible to control the temperature and RH by opening windows for ventilation, although the CO2 concentration can be adjusted in this way. It is easier to control the microclimatic parameters when the outside temperature is below 5 °C, which was recorded on the last day of monitoring. At an outdoor temperature of around 10 °C, it is more difficult to control the RH, and the school has a constant tendency to exceed the comfort temperature, resulting in a feeling of dryness in the rooms, as shown by the RH measurements. At outdoor temperatures between 0 and 10 °C, classroom ventilation decreases CO2 concentration, RH, and temperature. If the classroom is not ventilated at these outdoor temperatures, an increase in CO2 and RH is recorded, but the room temperature remains almost unchanged.
At School C, the RH was within the normal range for the first two days of the study, but on the third day, the RH steadily decreased because the classroom temperature on that day was the highest of the three days of the study and it was rising all day, while the RH fell at the same time. In School C, a similar situation to School B is observed: at outdoor temperatures between 0 and 10 °C, the ventilation of the classroom decreases the CO2 concentration, RH, and temperature. When the classroom is empty, the RH decreases, whereas when the classroom is later filled with pupils, the RH increases. The same trend is observed for outdoor temperatures between 10 and 15 °C.
4.4. Assessment of Air Exchange and Heat Consumption for Class Ventilation
To assess the intensity of air change in the classes and associated heat losses, three monitoring cases were selected for analysis (Table 6).

Table 6.
Results for air change, ventilation demand, and associated energy consumption.
The analysis of the CO2 monitoring carried out in School A on 10 March 2022 (Figure 6) shows that the classroom was well-ventilated before the lesson, but during the lesson, the CO2 concentration curve was increasing intensively, clearly indicating insufficient ventilation. When the window was opened during the first break, the CO2 concentration approached the baseline level, indicating that almost all the air in the room had changed. The change in CO2 concentration during the third lesson and the break afterward also indicates that the air in the room changes when the windows are open during the break.
Analysis of the monitoring of CO2 concentrations in School B on 24 March 2022 (Figure 8) shows that opening the windows during breaks after the third lesson results in a drop of only about 50% in CO2 concentrations compared to the increase during the lesson and after the fourth lesson in a decrease of about 70%. In this case, not all of the air has changed, so it is assumed that on average 60% of the indoor air volume changes during the break when the windows are opened.
Analysis of CO2 concentration monitoring (Figure 9) carried out in School C on 25 April 2022 shows that a longer window opening period ensures that CO2 concentrations that have increased during the lesson return to their initial level, but that even in a less airtight room with a higher outside air temperature, the increase in concentration during the lesson is sudden. These experimental results confirm that indoor ventilation conditions deteriorate as the temperature of the outside air increases.
The results of the calculation of air change, ventilation demand, and associated energy consumption using Equations (1)–(5) in the Methodology section are shown in Table 6. The analysis of air change and associated heating energy usage has shown that even moderate-sized leakages in rooms have several times lower air change compared to the ventilation demand of the classes, so the required air change cannot be achieved without supply and extract air devices in the classes. The intensity of the air change when windows are open decreases as the outside air temperature increases, so in warmer periods, the duration of the breaks is insufficient to fully ventilate the rooms. The results of the analysis also show that natural ventilation of school classrooms by opening windows even reduces the real energy consumption of heating compared to properly ventilated school premises, as indoor air change does not meet the hygiene standards.
The dependencies and trends identified during this research are relevant for general education schools, where the number of children in classes is large, there are many lessons in a row and breaks are short, when the unoccupied room duration is not enough to ventilate them and stabilise their air temperature. In other schools, the conditions of use of the premises will be different, less intensive, so their ventilation by opening the windows may give better air quality results. Air temperature fluctuations after opening the windows can be smaller in schools with heating systems with automated regulation.
5. Conclusions
It was noticed that a periodic window opening during each break significantly reduces the carbon dioxide (CO2) concentration in the classroom but may not be sufficient to reach the continuous comfort limit in an airtight room, especially during warmer periods. Monitoring of classrooms with different airtightness has shown that the control of CO2 concentration and indoor air temperature will be more effective when the indoor airtightness can be controlled, e.g., by installing a window micro-ventilation function. When rooms are less airtight, lower peak values of air parameters are obtained because the room is partially ventilated through the leaks all the time. However, this is only relevant at lower outside temperatures. When it reaches +10 °C, air filtration through leaks is greatly reduced, and its influence on indoor air parameters becomes insignificant.
The air in the entire room can only change during a 15-min break at low outside temperatures. At positive temperatures, opening the windows for 15 min is not sufficient to remove the CO2 concentration accumulated during the lesson. The higher air leakage from classrooms helps flatten the CO2 concentration curves only at lower temperatures. When the outside temperature is higher, only forced ventilation can produce adequate indoor air quality (IAQ). A drop in indoor air temperature when the window is open is only acceptable at positive temperatures. When the outside air temperature is negative, the indoor temperature before the start of the lesson may be 1–2 °C below the normative temperature and does not meet the hygiene requirements. The opening of windows dries out the indoor air, especially at low outside temperatures. The study found that indoor air becomes drier in leaky classrooms with more constant air changes. The results also showed that opening a window during a break only significantly changes some of the indoor air, as the CO2 concentration and air temperature immediately begin to increase when the window is closed. The use of a fan to move air during the break would increase the intensity of the air change in the room.
It is not possible to directly apply economic weights to the installation of an efficient ventilation system in schools under renovation, as poorly ventilated classrooms consume less heating energy than classrooms that meet the ventilation requirements, and the requirements for classroom ventilation systems and IAQ in schools should therefore be formalised in the building regulations.
Author Contributions
Conceptualization, T.M., R.B., S.A. and I.B.; Methodology, T.M., R.B. and S.A.; Validation, T.M. and R.B.; Formal Analysis, T.M. and R.B.; Investigation, S.A., V.P. and I.B.; Data Curation, T.M., S.A. and V.P.; Writing—Original Draft Preparation, T.M.; Writing—Review and Editing, R.B. All authors have read and agreed to the published version of the manuscript.
Funding
This research received no external funding.
Data Availability Statement
Not applicable.
Conflicts of Interest
The authors declare no conflict of interest.
References
- Pikutis, R.; Šeduikytė, L. Estimation of the effectiveness of renovation work in Lithuanian schools. J. Civ. Eng. Manag. 2006, 12, 163–168. [Google Scholar] [CrossRef]
- Kapalo, P.; Klymenko, H.; Zhelykh, V.; Adamski, M. Investigation of indoor air quality in the selected Ukraine classroom–Case study. Proceedings of CEE 2019, Lviv, Ukraine, 11–13 September 2019; Blikharskyy, Z., Koszelnik, P., Mesaros, P., Eds.; Springer: Cham, Switzerland, 2020; Volume 47. [Google Scholar] [CrossRef]
- Šadauskienė, J.; Šeduikytė, L.; Paukštys, V.; Banionis, K.; Gailius, A. The role of air tightness in assessment of building energy performance: Case study of Lithuania. Energy Sustain. Dev. 2016, 32, 31–39. [Google Scholar] [CrossRef]
- Jensen, P.A.; Thuvander, L.; Femenias, P.; Visscher, H. Sustainable building renovation–strategies and processes. Constr. Manag. Econ. 2022, 40, 157–160. [Google Scholar] [CrossRef]
- Kapalo, P.; Domniţa, F.; Bacoţiu, C.; Spodyniuk, N. The impact of carbon dioxide concentration on the human health–case study. J. Appl. Eng. Sci. 2018, 8, 61–66. [Google Scholar] [CrossRef]
- Moya, T.A.; van den Dobbelsteen, A.; Ottelé, M.; Bluyssen, P.M. A review of green systems within the indoor environment. Indoor Built Environ. 2019, 28, 298–309. [Google Scholar] [CrossRef]
- Luther, M.B.; Horan, P.; Tokede, O. Investigating CO2 concentration and occupancy in school classrooms at different stages in their life cycle. Arch. Sci. Rev. 2018, 61, 83–95. [Google Scholar] [CrossRef]
- Sadrizadeh, S.; Yao, R.; Yuan, F.; Awbi, H.; Bahnfleth, W.; Bi, Y.; Cao, G.; Croitoru, C.; de Dear, R.; Haghighat, F.; et al. Indoor air quality and health in schools: A critical review for developing the roadmap for the future school environment. J. Build. Eng. 2022, 57, 104908. [Google Scholar] [CrossRef]
- Kapalo, P.; Mečiarová, Ľ.; Vilčeková, S.; Burdová, E.K.; Domniţa, F.; Bacotiu, C.; Péterfi, K.A. Investigation of CO2 production depending on physical activity of students. Int. J. Environ. Health Res. 2019, 29, 31–44. [Google Scholar] [CrossRef] [PubMed]
- Zhang, D.; Ortiz, M.A.; Bluyssen, P.M. A review on indoor environmental quality in sports facilities: Indoor air quality and ventilation during a pandemic. Indoor Built Environ. 2022, 32, 1–21. [Google Scholar] [CrossRef]
- Krawczyk, D.A.; Zielinko, P.; Rodero, A. Measurements of carbon dioxide concentration and temperature in dormitory rooms in Poland and Spain—A case study. IOP Conf. Ser. Earth Environ. Sci. 2019, 214, 012056. [Google Scholar] [CrossRef]
- Song, G.; Ai, Z.; Liu, Z.; Zhang, G. A systematic literature review on smart and personalized ventilation using CO2 concentration monitoring and control. Energy Rep. 2022, 8, 7523–7536. [Google Scholar] [CrossRef]
- Daisey, J.M.; Angell, W.J.; Apte, M.G. Indoor air quality, ventilation, and health symptoms in schools: An analysis of existing information. Indoor Air 2003, 13, 53–64. [Google Scholar] [CrossRef]
- Satish, U.; Mendell, M.J.; Shekhar, K.; Hotchi, T.; Sullivan, D.; Streufert, S.; Fisk, W.J. Is CO2 an indoor pollutant? Direct effects of low-to-moderate CO2 concentrations on human decision-making performance. Environ. Health Perspect. 2012, 120, 1671–1677. [Google Scholar] [CrossRef] [PubMed]
- Talarosha, B.; Satwiko, P.; Aulia, D.N. Air temperature and CO2 concentration in naturally ventilated classrooms in hot and humid tropical climate. IOP Conf. Ser. Earth Environ. Sci. 2020, 402, 012008. [Google Scholar] [CrossRef]
- Petersen, S.; Jensen, K.L.; Pedersen, A.L.S.; Rasmussen, H.S. The effect of increased classroom ventilation rate indicated by reduced CO2 concentration on the performance of schoolwork by children. Indoor Air 2016, 26, 366–379. [Google Scholar] [CrossRef] [PubMed]
- Shendell, D.G.; Prill, R.; Fisk, W.J.; Apte, M.G.; Blake, D.; Faulkner, D. Associations between classroom CO2 concentrations and student attendance in Washington and Idaho. Indoor Air 2004, 14, 333–334. [Google Scholar] [CrossRef]
- Sundell, J.; Levin, H.; Nazaroff, W.W.; Cain, W.S.; Fisk, W.J.; Grismund, D.T.; Gyntelberg, F.; Li, Y.; Persily, A.K.; Pickering, A.C.; et al. Ventilation rates and health: Multidisciplinary review of the scientific literature. Indoor Air 2011, 21, 191–204. [Google Scholar] [CrossRef]
- HN 21:2017; Mokykla, Vykdanti Bendrojo Ugdymo Programas. Bendrieji Sveikatos Saugos Reikalavimai: Vilnius, Lithuania, 2017.
- Sundell, J. On the history of indoor air quality and health. Indoor Air 2004, 14, 51–58. [Google Scholar] [CrossRef]
- World Health Organization. School Environment: Policies and Current Status; Report; WHO Regional Office for Europe: Copenhagen, Denmark, 2015. [Google Scholar]
- Ma, F.; Zhan, C.; Xu, X.; Li, G. Winter thermal comfort and perceived air quality: A case study of primary schools in severe cold regions in China. Energies 2020, 13, 5958. [Google Scholar] [CrossRef]
- Abdel-Salam, M.M.M. Investigation of indoor air quality at urban schools in Qatar. Indoor Built Environ. 2019, 28, 278–288. [Google Scholar] [CrossRef]
- Ramos, N.M.M.; Almeida, R.M.S.F.; Curado, A.; Pereira, P.F.; Manuel, S.; Maia, J. Airtightness and ventilation in a mild climate country rehabilitated social housing buildings—What users want and what they get. Build. Environ. 2015, 92, 97–110. [Google Scholar] [CrossRef]
- Statistics Lithuania, Official Statistics Portal. General Schools. 2021–2022. Available online: https://osp.stat.gov.lt/statistiniu-rodikliu-analize?hash=96f65e9b-794b-4f3b-845d-c7576edf57cf#/ (accessed on 4 July 2022).
- Zemitis, J.; Bogdanovics, R.; Bogdanovica, S. The study of CO2 concentration in a classroom during the COVID-19 safety measures. E3S Web Conf. 2021, 246, 01004. [Google Scholar] [CrossRef]
Disclaimer/Publisher’s Note: The statements, opinions and data contained in all publications are solely those of the individual author(s) and contributor(s) and not of MDPI and/or the editor(s). MDPI and/or the editor(s) disclaim responsibility for any injury to people or property resulting from any ideas, methods, instructions or products referred to in the content. |
© 2023 by the authors. Licensee MDPI, Basel, Switzerland. This article is an open access article distributed under the terms and conditions of the Creative Commons Attribution (CC BY) license (https://creativecommons.org/licenses/by/4.0/).