1. Introduction
Fire safety is a widely discussed topic in the scientific community, primarily due to the critical nature of fire spread in confined spaces. This event not only leads to economic losses in terms of structural damage but also poses significant hazards to people’s safety. Extensive research in fire protection aims to outline solutions that can extinguish fire hazards in the shortest possible time while ensuring the protection of compartments [
1].
However, one aspect of fire safety that receives relatively little attention is the implementation of fire safety measures for heritage protection in museums. Museums often lack fire suppression systems and house numerous flammable materials. To enhance the protection of museums and their collections, it is imperative to implement targeted actions that effectively reduce the risk of fire and mitigate its potential consequences [
2,
3].
A museum is a treasure trove of history and art, filled with invaluable artifacts and delicate exhibits. However, within its walls, there also lies the potential for fire hazards that could jeopardize these precious collections. Electrical malfunctions, such as faulty wiring or overheating equipment, pose a significant risk. Carelessness with open flames, such as candles or smoking materials, can easily ignite a fire. Moreover, flammable materials, such as solvents or chemicals used for preservation, demand strict handling procedures to prevent accidents. Adequate fire detection and suppression systems, along with regular maintenance and staff training, are crucial in mitigating the potential ignition sources within a museum and ensuring the safety of its irreplaceable treasures. In the event of a fire, the process of removing soot from artifacts and recovering the building is a lengthy one, typically taking several months or more [
4].
Museums are often housed in historical buildings, and integrating appropriate fire protection measures into these ancient structures requires a certain degree of compromise when combining safety devices and evacuation strategies [
5].
Safety systems must be designed to ensure the preservation of paintings and statues in historic buildings and museums, safeguarding them from potential fire damage and the adverse effects of fire extinguishing agents. The desired outcome is an integrated safety concept that incorporates both structural and technological measures to achieve the objectives described below. Furthermore, the aim is to strike a balance between user safety, prevention of damage, and the requirements of heritage protection [
6]. For example, it is imperative to maintain the original appearance of historical buildings while implementing a fire extinguishing system [
7]. Water mist is considered one of the most suitable extinguishing systems for art museum buildings [
8], due to its ability to minimize water damage while effectively extinguishing fires [
9].
This choice is primarily driven by its environmental friendliness, minimal water consumption, and the ability to customize its performance based on specific requirements [
9]. According to the definition [
10], water mist systems typically have a flow-weighted cumulative volumetric distribution of water droplets that is predominantly below 1000 µm, ensuring effective fire suppression. Extensive research has been conducted to determine the impact of nozzle design and spray dynamics behavior in water-based fire suppression systems. Yinshui et al. [
11] determined that the fire suppression effectiveness in a confined space can be enhanced by adjusting the flow rate and spray angle of nozzles, thereby reducing water consumption. Their findings indicated that optimizing these parameters allows a certain mass of water to effectively cover the desired area. Similarly, in another study [
12] it was observed that early suppression by water mist led to controlled fire growth, but significant cooling of the flame and the liquid pool was required, and a longer application time was necessary for effective suppression. Liu et al. [
13] conducted experiments on the use of water mist in a long ventilated tunnel and found that the cooling effect of droplets, coupled with the imposed velocity, played a crucial role in reducing the maximum temperature in the upper smoke region. When observing the activation of water mist [
14], significant radiation scattering near the flame zone was observed, indicating the presence of mist droplets. These droplets reduced the heat feedback to the fuel surface, resulting in a reduced combustion rate. Due to the complex nature of water mist behavior, which is challenging to describe using limited equations and parameters, experimental studies are essential. Field testing is necessary to accurately capture the real behavior of water mist systems in response to a fire event [
15]. Previous evaluations of the combined use of water mist and fire suppression mechanisms primarily focused on the general characteristics of the fire plume, such as its geometry, temperature, gas flow speed, and smoke quantity [
16,
17,
18] and found that larger droplets are more effective in penetrating a smoke layer.
The investigation of the role of these phenomena in the fire extinguishment process is studied and illustrated in this study. The aim was to investigate the fire suppression by a water mist system in the museum and art gallery Borghese, in Rome. The heritage paintings’ protection and simultaneously the safety of workers in the compartment were the issues for the present study. A water mist system was developed and installed in a way that recreates the same conditions of a museum and art gallery’s compartment room, in which the onsite fire test was developed, in collaboration with the research laboratory of the company Tema Sistemi SpA. The study demonstrates the effectiveness of the system for the safeguarding of people and the works of art present within the structure.
After obtaining the data from the pre-tests conducted in the laboratory, we proceeded to size the test room to replicate the conditions in a simulated environment. We utilized computational fluid dynamics software, specifically Fire Dynamics Simulator (FDS), to perform simulations that accurately reproduced the representative test room of an art gallery [
19].
The literature review about the effectiveness of water mist and onsite tests [
20] allows us to highlight, for example, in the case of road tunnels, the effectiveness of being able to define, through a fire test in a simulated environment, the design of the specific fire suppression system. This process enabled us to determine the thermal power of the fire outbreak and the ambient temperature reached during the tests, ensuring compatibility with the data obtained in the pre-test phase. The temperature range derived from the pre-tests, which involved acquiring point data through sensor measurements, facilitated the calibration of the simulation model. Validating the simulated results ensures the reproducibility of the conditions and outcomes in a simulated environment. With the obtained results, the application of water mist can be expanded to various purposes and conditions.
The paper is structured as follows: the first part presents a description of the fire modeling of water mist in the simulated environment. This is followed by a description of the onsite fire test and the results obtained from the fire suppression using the water mist system. Subsequently, the Discussion section compares the two sets of results, emphasizing any critical aspects. Finally, the Conclusions summarize the key findings of the study and outline potential areas for future improvement.
2. Materials and Method
2.1. Research Design
The aim of the research is to demonstrate, through simulation models and thermal release curves defined by thermofluid dynamics simulations, the validity of these models compared to the results obtained from real-scale tests. Therefore, the objective of the study is not only to prove the effectiveness of the fire suppression system but also to establish a modeling and operational standard in terms of effectiveness for firefighting systems, which can be performed in a simulated environment, eliminating the need for real-scale tests. The possibility of modeling the fire curve and its characteristic parameters has been extensively studied in the literature. The study conducted by Pope et al. [
21] allowed for a comparison between parametric curves derived from the Eurocode and simulated curves using Fire Dynamics Simulator (FDS) through a real-scale test in a compartment. As a result, the study demonstrated both the effectiveness and limitations of the methodology employed, providing valuable insights for enhancing the performance quality of FDS software. In addition, for particularly complex scenarios, a design approach should be adopted to address the issue of personal safety within a comprehensive framework [
22]. In
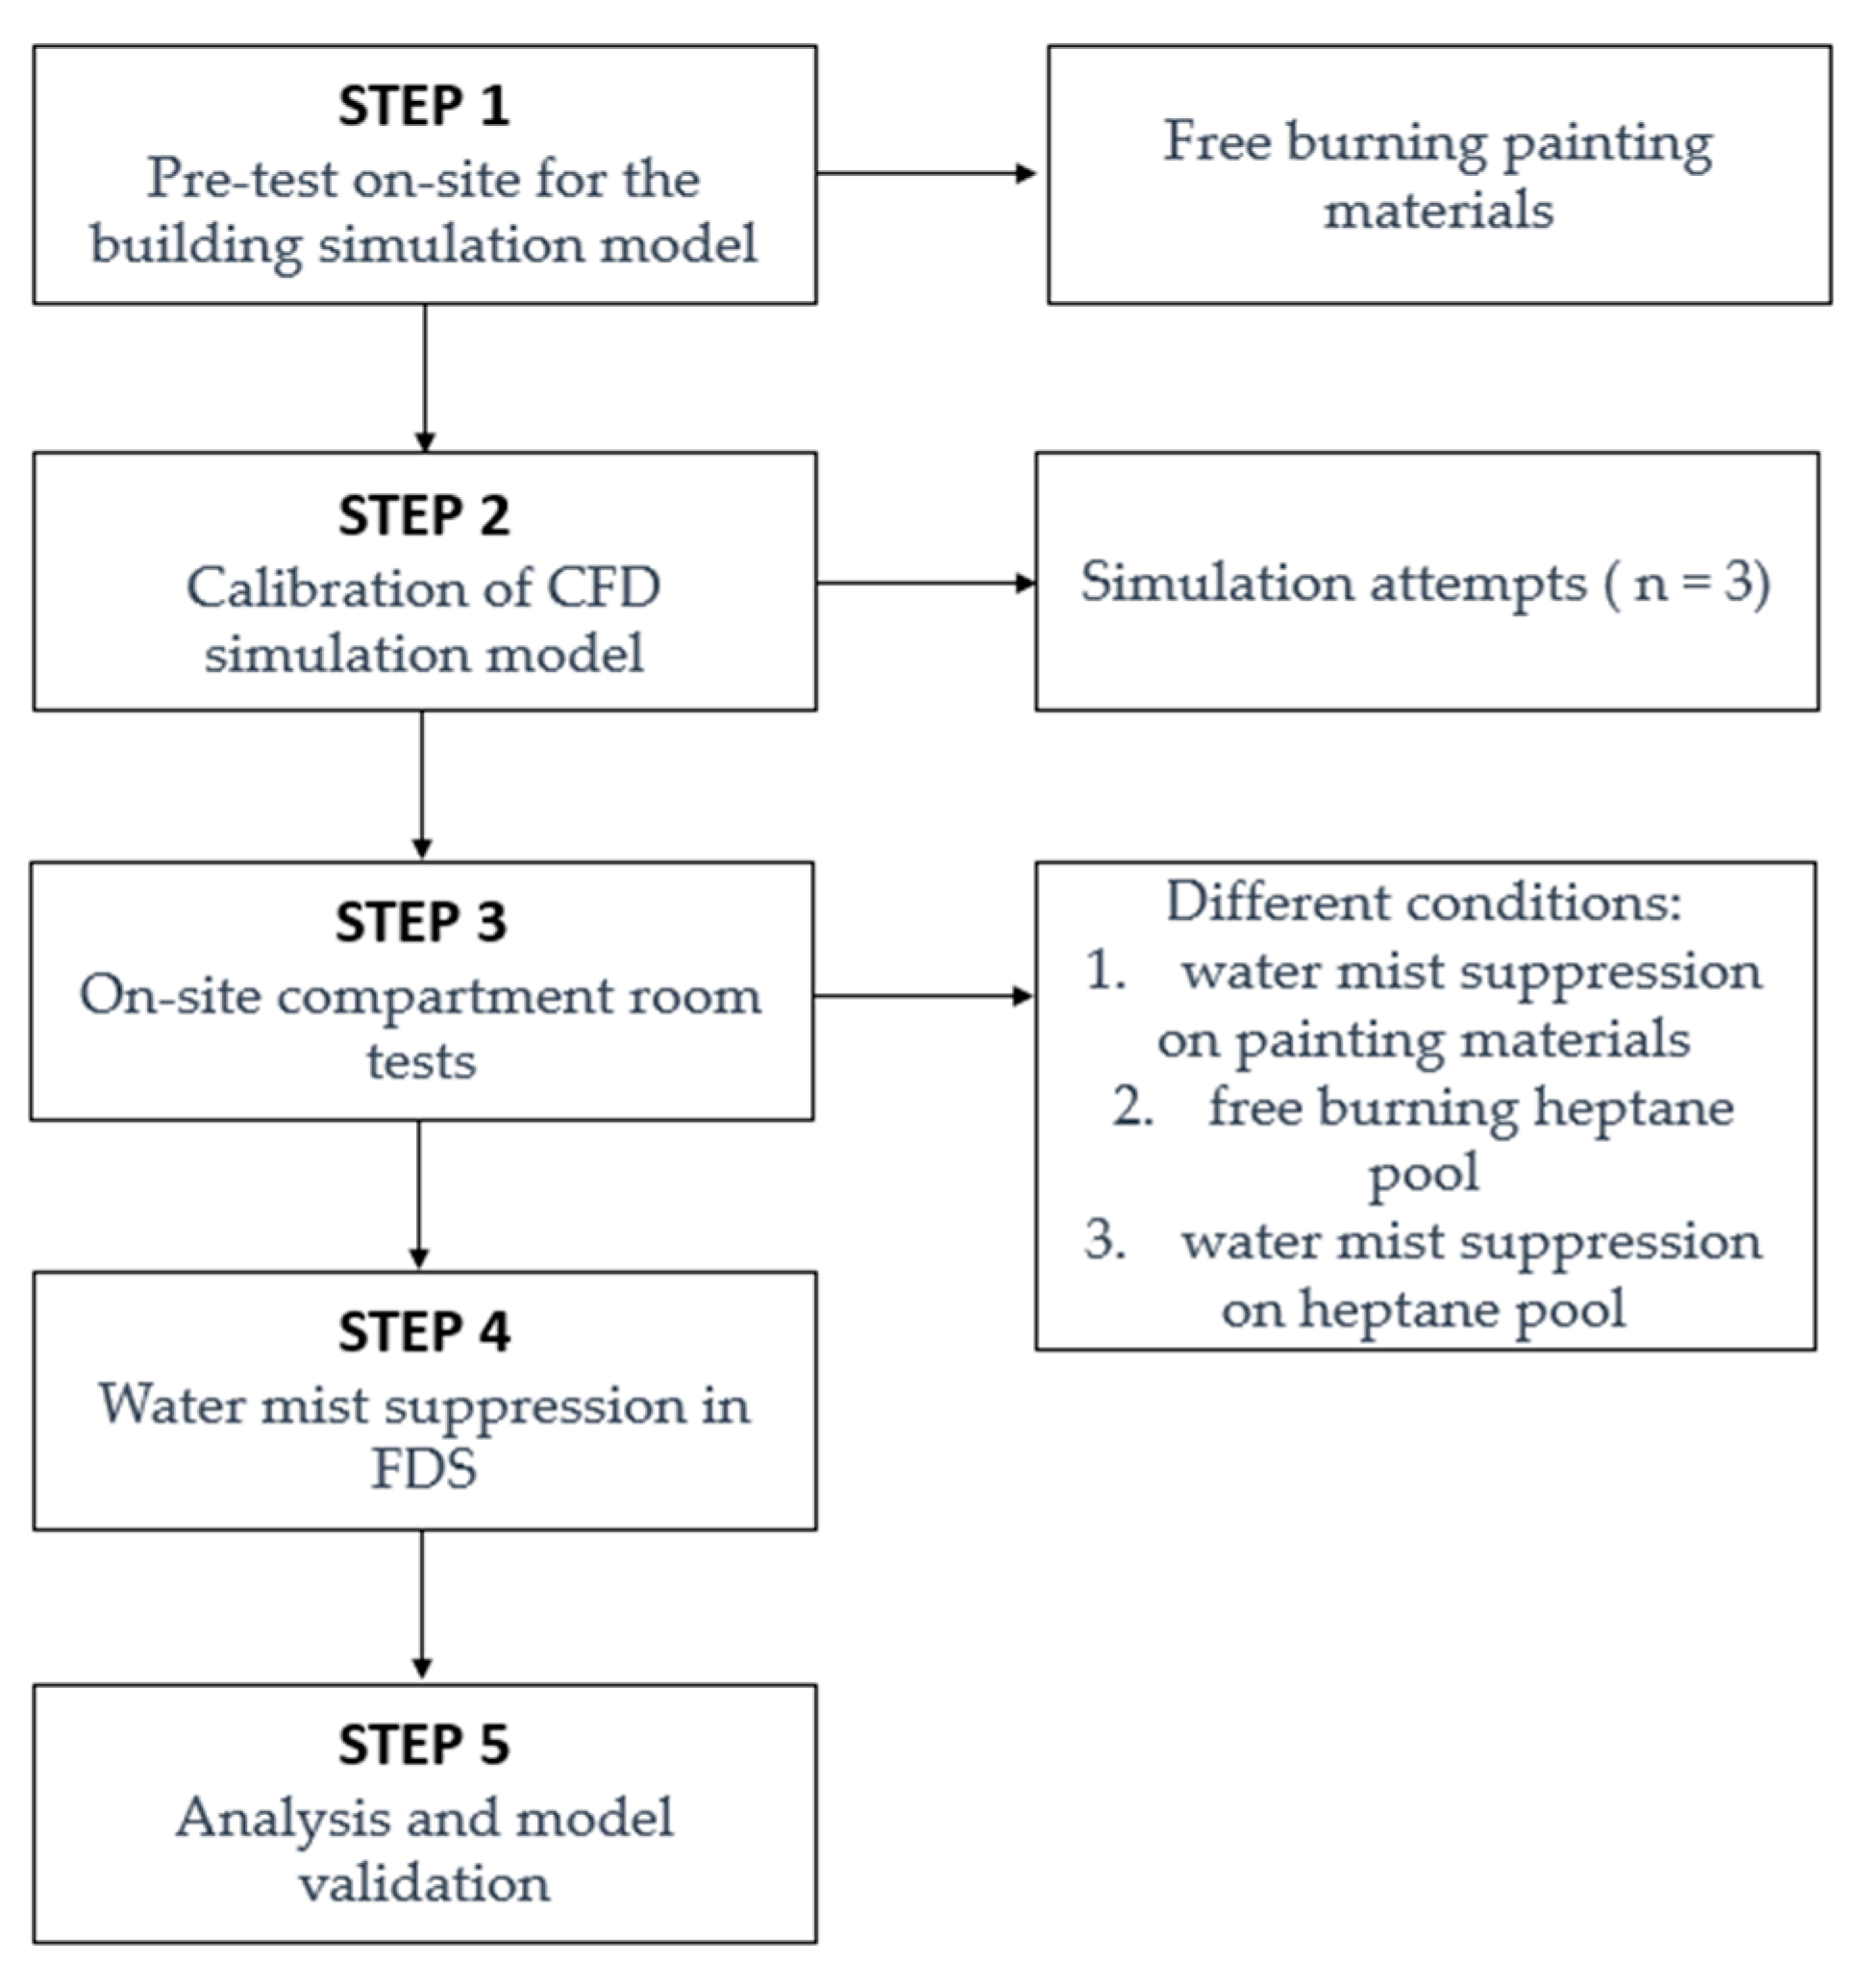
Figure 1, the procedure used in the study has been presented in the form of a flow chart, divided into steps. The first step in the procedure is conducting a pre-test onsite for the building simulation model. Following this, the Fire Dynamics Simulator model needs to be calibrated to ensure a proper fit and validation. The subsequent step involves conducting onsite compartment tests. After these tests, the simulations are repeated to align with the results obtained from the full-scale tests.
2.2. Literature on Fire Modeling of Water Mist Using FDS Software
Fire Dynamics Simulator v. 6.7.6 (FDS) was utilized for simulating the fire development and water mist system in this case study [
23,
24]. FDS is based on a computational fluid dynamics model. In the simulations, droplets emitted from mist nozzles and sprinklers were treated as Lagrangian particles, and a set of defined transport equations were employed to describe the interaction between the droplets and the surrounding ambient conditions [
25]. In realistic conditions, the behavior of water droplets, such as induced surface regression and spatially isothermal droplet conduction, can be neglected [
26]. When the water droplets encounter a fire source, they not only cool the burning surface and surrounding air, but also impact the chemical reaction rate of the fuel [
27,
28]. Additionally, a new model based on the Arrhenius equation has been implemented in FDS, which establishes a connection between the burning rate and the fuel surface temperature [
29]. The choice of combustion model must agree with the temperature field expected [
30,
31], and it is evident that incorporating water mist into the simulation poses additional challenges due to the interaction between the mist and fire [
32]. Considering these factors, the sizing and development of the fire were designed. First, the burning rate depends on the heat transferred from the pool’s edge and flame to the fuel, involving convection, conduction, and radiation [
33]. The study focused on a heptane pool, which has properties and characteristics comparable to propane [
34,
35], which is commonly used as fuel oil for pool fire [
12,
36,
37]. Characterization of open pool fires is crucial. Characterizing pool fires involves understanding the emissivity, emissive power, and spatial and temporal temperature distribution of the pool fire [
38,
39]. Experimental observations indicate that the burning time of the pools increases as the fuel depth increases, while the rate of mass loss in the steady state remains constant for different initial depths [
40]. In addition, while water mist systems are effective in suppressing multiple pool fires, their effectiveness is largely affected by operational parameters such as S/D ratio, which is the distance between pools to the diameter of the pool [
41]. Furthermore, the average height of the flame is dependent on the pool diameter and the distance between two fuel pools [
42,
43,
44].
An empirical approach to quantify the effectiveness of fire suppression by water involves describing the reduction of the pyrolysis rate using an exponential function for the mass loss rate [
24]. In terms of the sprinkler system dimensions, the following equation has been utilized:
In the given context, Q (L/min) represents the total volume flow, p (bar) denotes the pressure during system operation, and k is the K-factor (dimensionless), which is an original design parameter of the system.
2.3. Selection of Painting Materials and Onsite Preliminary Test
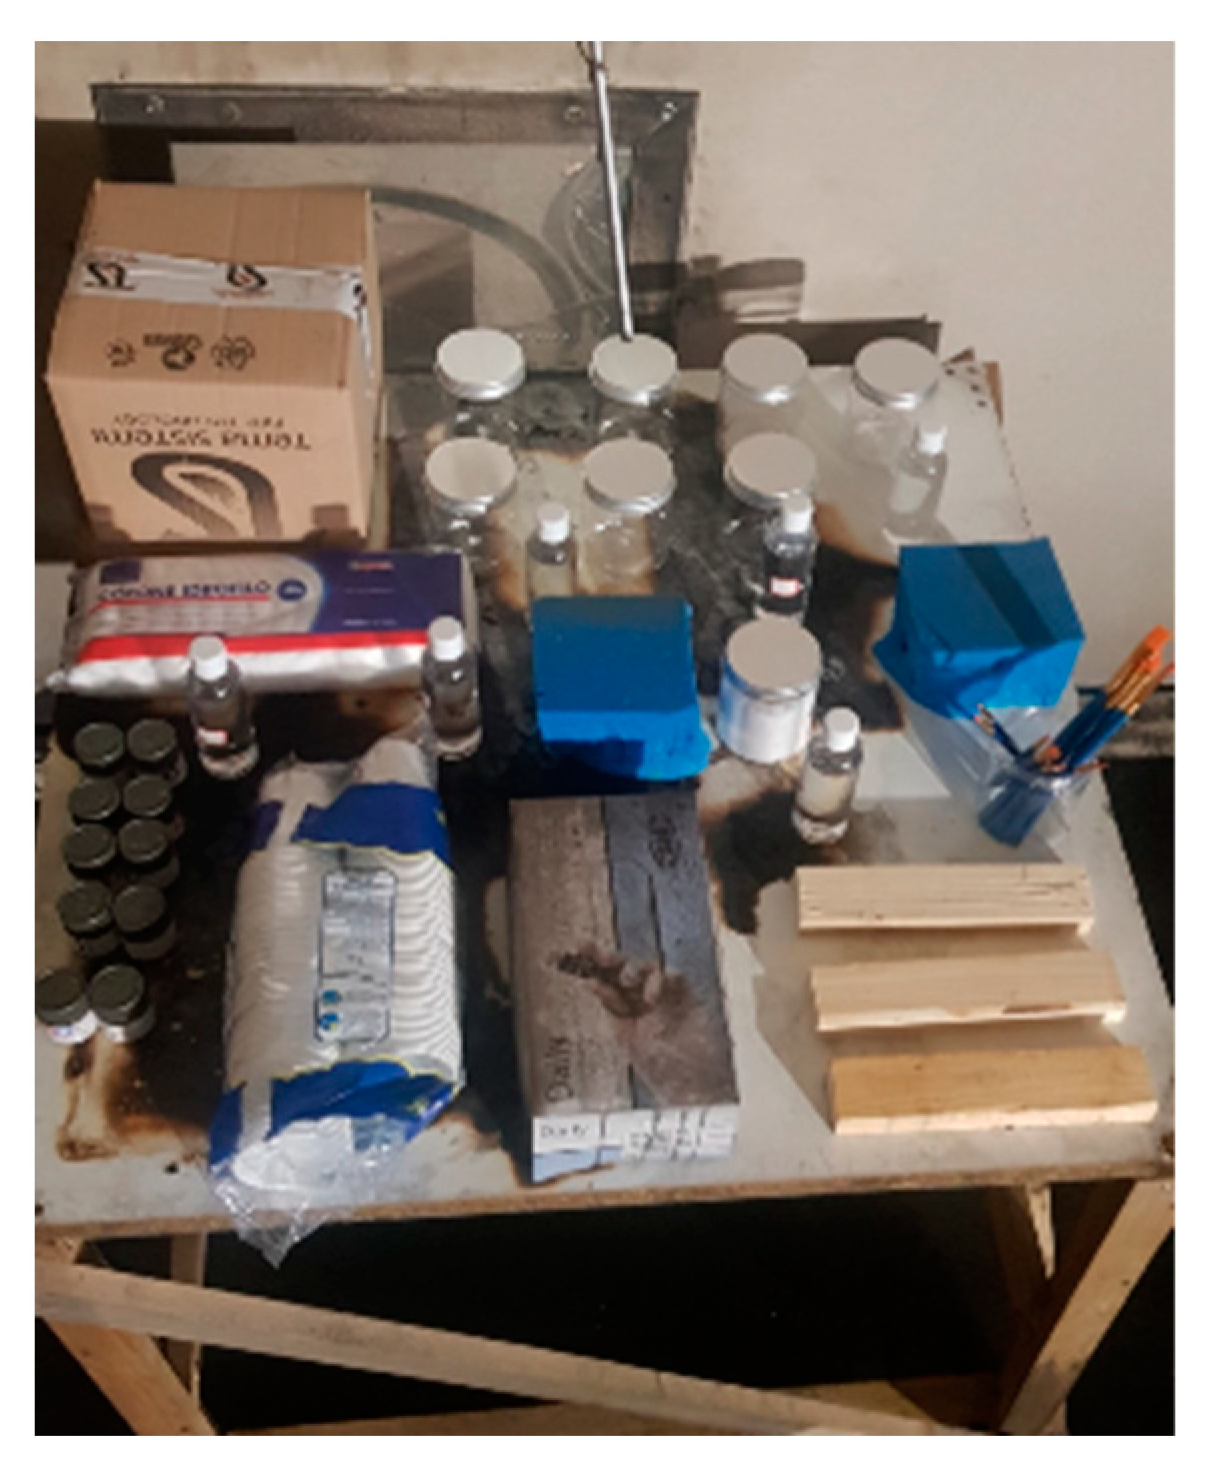
The first step of the conducted experimentation involved reproducing in a test room the ignition of materials that characterize a workspace in a museum or art gallery. The chosen materials can be divided into solid materials and liquid materials. Among the solid materials, wooden tables, strips, paintbrushes, and paint cans were selected. Among the liquid materials, bottles containing liquids typically used for the restoration of assets and artworks were chosen, such as paints and ethyl alcohol.
In
Figure 2, the solid and liquid materials used have been depicted through a photograph, positioned on the test table.
Variables and Measurements
When conducting an in situ fire test, variables and measurements play a crucial role in assessing and understanding the fire behavior. These factors are essential for accurate analysis and evaluation of fire safety measures. Variables such as fuel load, ventilation conditions, and geometry of the space can significantly influence fire growth, flame spread, and smoke production. By carefully controlling and measuring these variables, researchers can obtain reliable data on fire behavior, which can be used to develop and validate fire safety strategies and regulations. Accurate measurements of temperature, heat release rate, gas concentrations, and smoke production help quantify the severity of the fire and its potential impact on occupants and structures. This information is invaluable in designing effective fire protection systems, developing evacuation plans, and improving overall fire safety standards. The precise control of variables and accurate measurements in in situ fire tests are paramount for advancing our understanding of fire dynamics and enhancing fire safety practices.
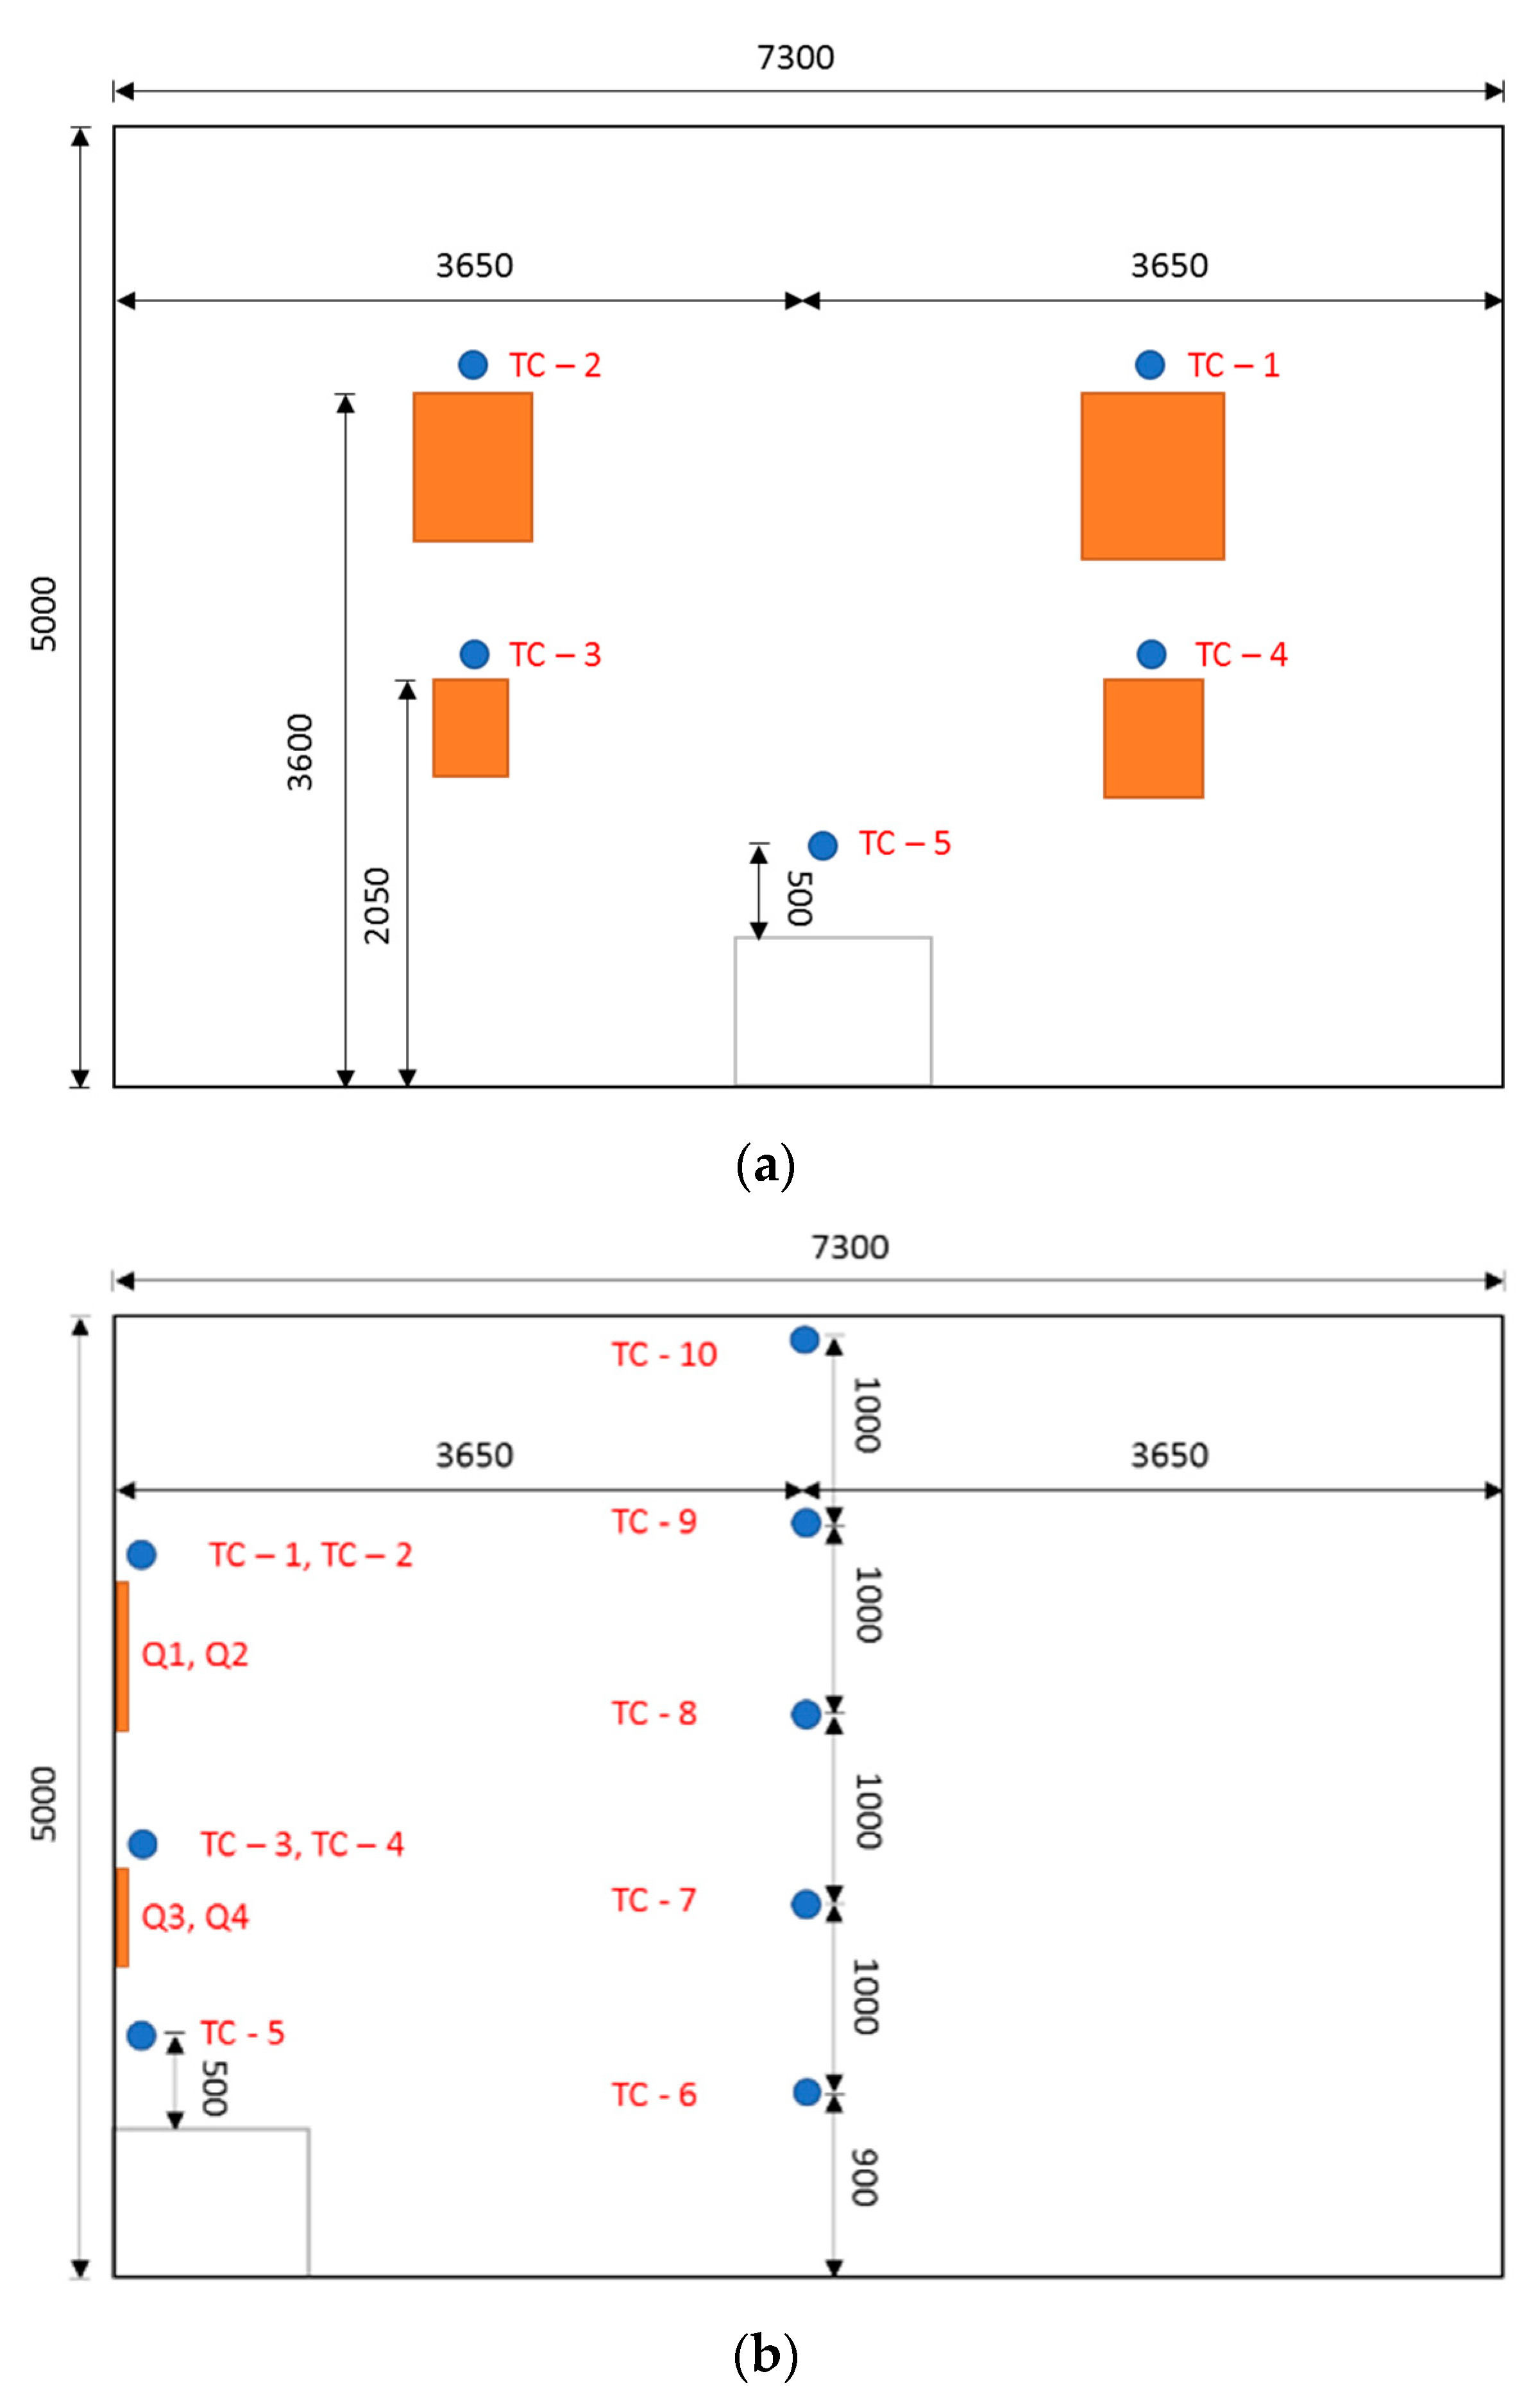
The positioning of thermocouples to record the temperature distribution at key points in the room has been reproduced in
Figure 3a,b. The placement of thermocouples is crucial because it serves not only for the preliminary step just described with the free burning of materials but remains unchanged and is used as is in the subsequent steps of the experimentation. Specifically, in
Figure 3a, the positions of wall thermocouples (TC-1, TC-2, TC-3, TC-4) and the thermocouple placed on the table (TC-5) are shown. In
Figure 3b, thermocouples placed at the center of the room (TC-6, TC-7, TC-8, TC-9, TC-10), each one meter apart from the others, until reaching the ceiling, are represented. The positioning is strategic for recording the temperature gradient that affects all key points in the room.
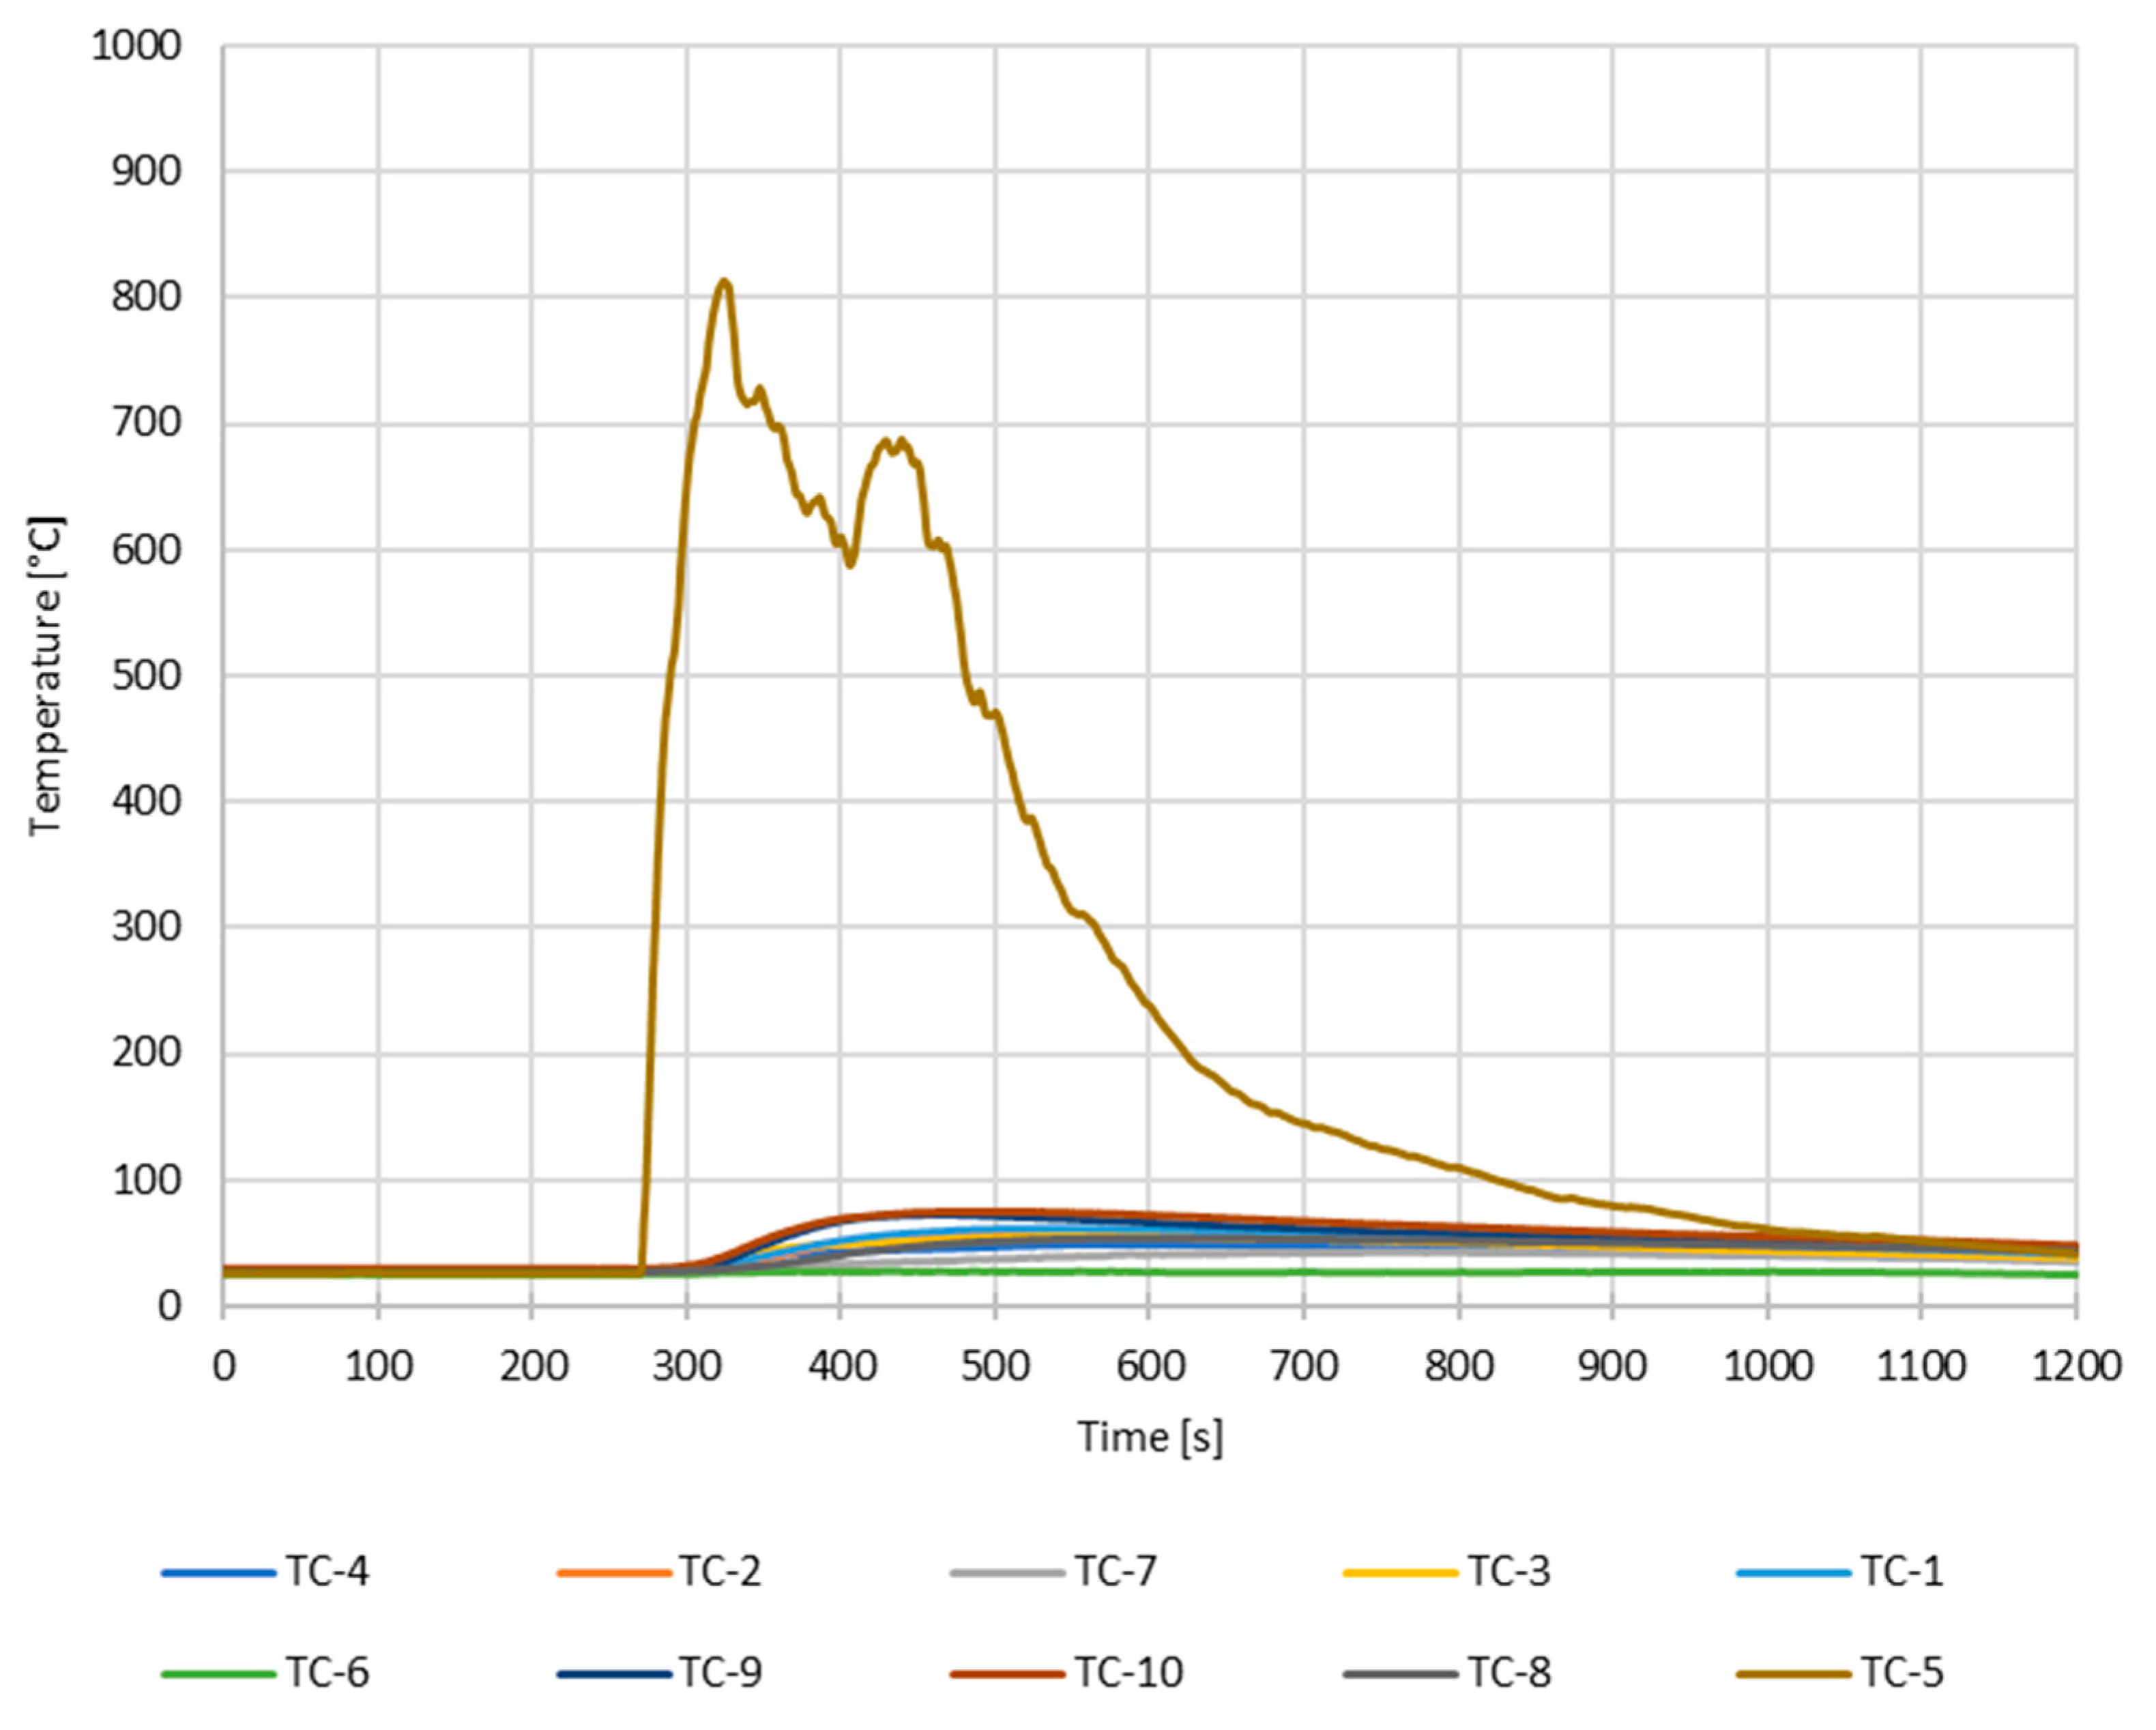
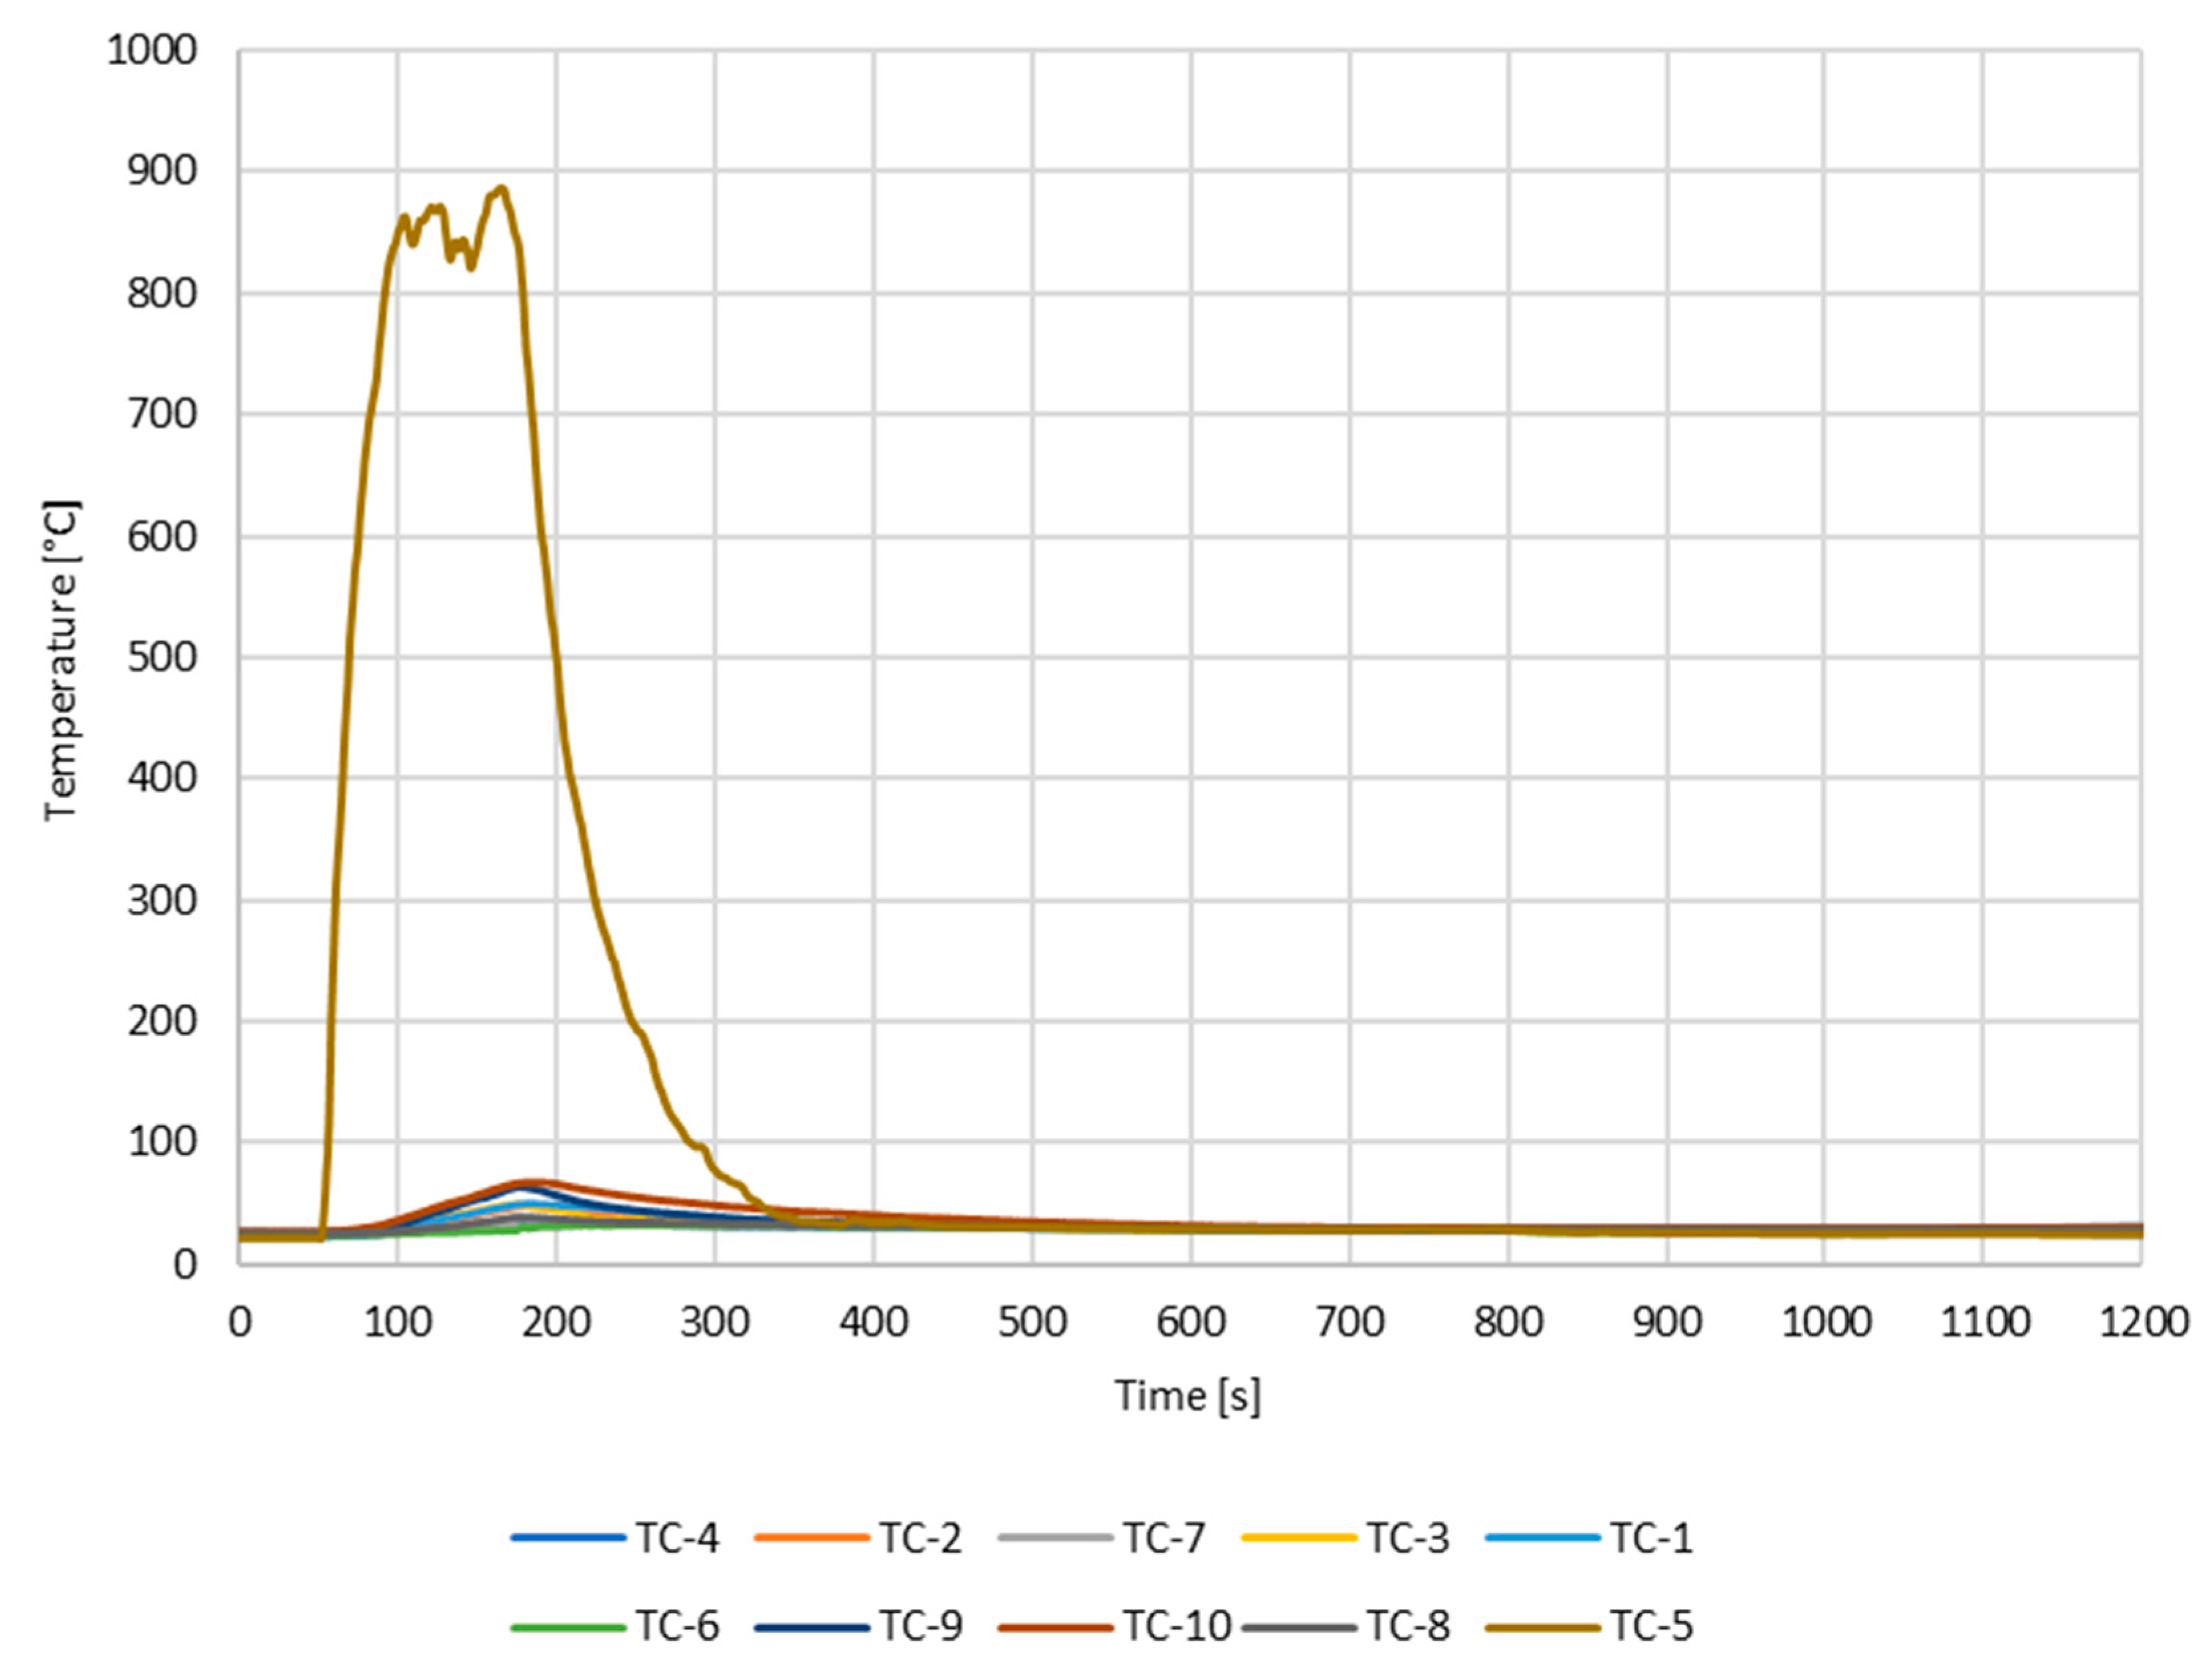
In the following, a graphical distribution of temperature time is offered. As shown in the graph, the maximum temperature reached is around 800 °C registered by TC-5, near the burning area in the room. The maximum ceiling temperature registered by TC-10 is around 75 °C. It is possible to notice that the provided representation is governed by the temperature trends around the burning point, which has the highest values. Therefore, it is for this reason that, in the graph shown in
Figure 4, it is more difficult to appreciate the variations of the thermocouples positioned at the depicted points.
2.4. Calibration of CFD Simulation Model
After the preliminary fire tests, the first step of the experiment consisted in calibration of CFD simulation model. As already mentioned in the research design phase, the dual objective pursued in this work is not only to demonstrate the effectiveness of the fire suppression system but also to establish a modeling and operational standard in terms of effectiveness for firefighting systems, which can be achieved in a simulated environment, eliminating the need for full-scale tests. With that said, the modeling and calibration phase of the simulated test is crucial in terms of replicating the environment and system characteristics for the sake of reproducibility.
Three preliminary simulations were conducted, allowing us to calibrate the model and construct the fire test leading up to the suppression test.
Table 1 presents the main parameters used in the geometry modeling and grid definition phase in FDS. The compartment geometry dimensions are reported in
Table 1. To ensure accurate results, a small grid resolution was selected, as the grid size directly affects the simulation outcomes. For precision, a uniform grid mesh size of 10 cm was applied throughout the compartment, as shown in
Table 1 below. The compartment’s geometry is depicted in
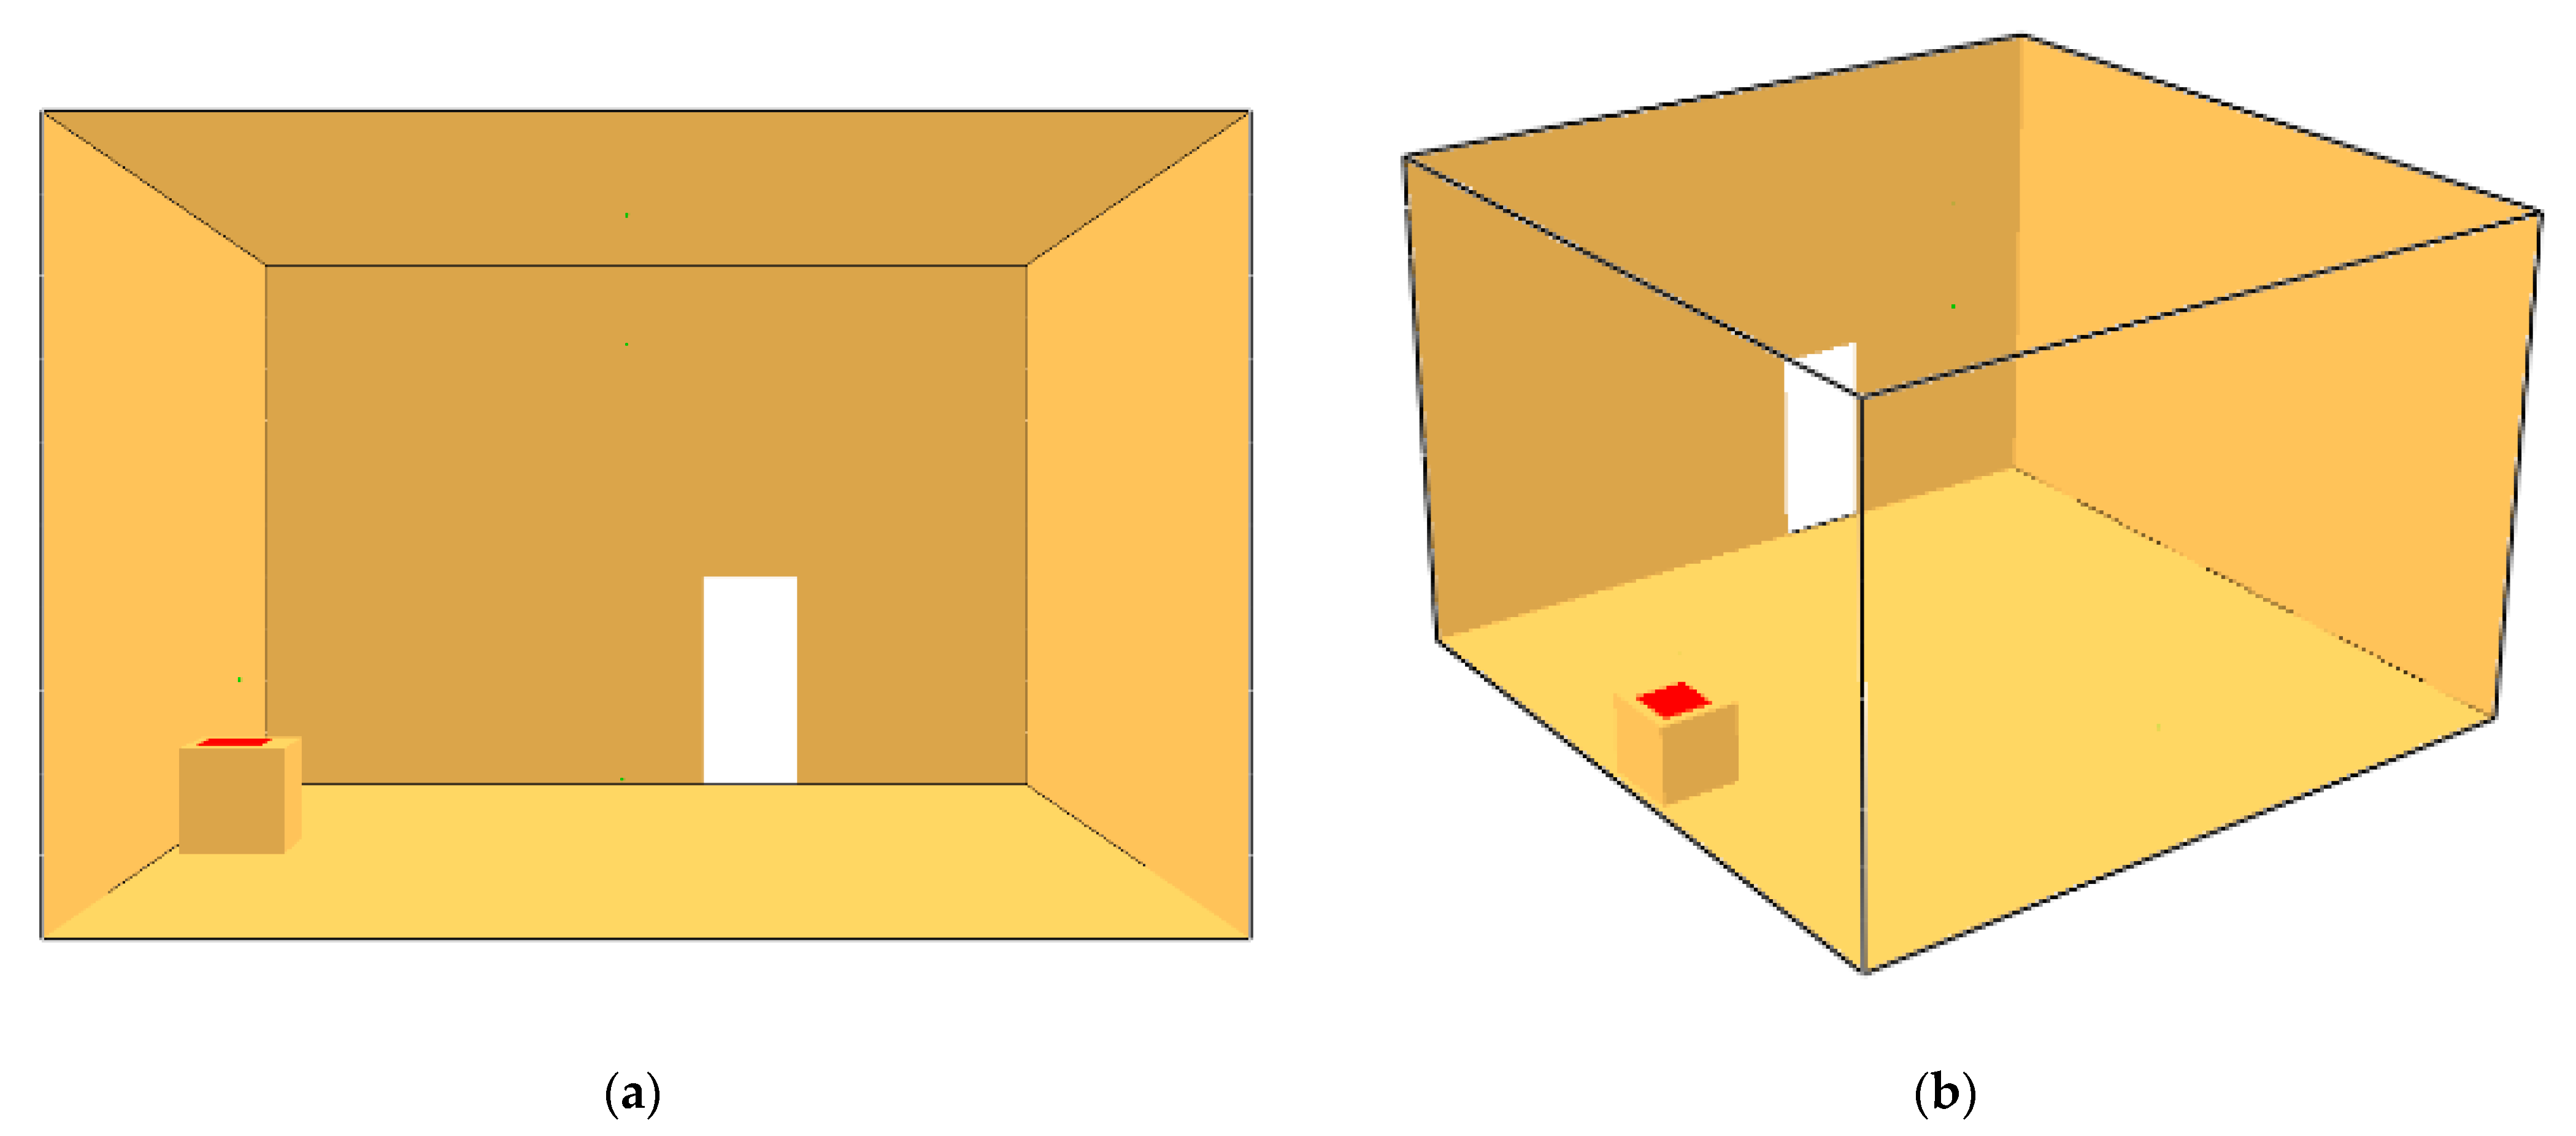
Figure 5, with the burner positioned on a table adjacent to a wall within the room. On top of the table, the vent with the fire source is represented by a burner with a specified heat release rate per unit area (HRRPUA) measured in kW/m
2.
Table 2 provides a detailed sizing of the fire source for each of the test simulations conducted to calibrate the computational fluid model that could more realistically represent the fire simulated at full scale with the test materials.
In
Figure 5, geometries of the compartment and burning area (shown in red) are represented. As we can see, the simulated geometry environment represents faithfully the real compartment room.
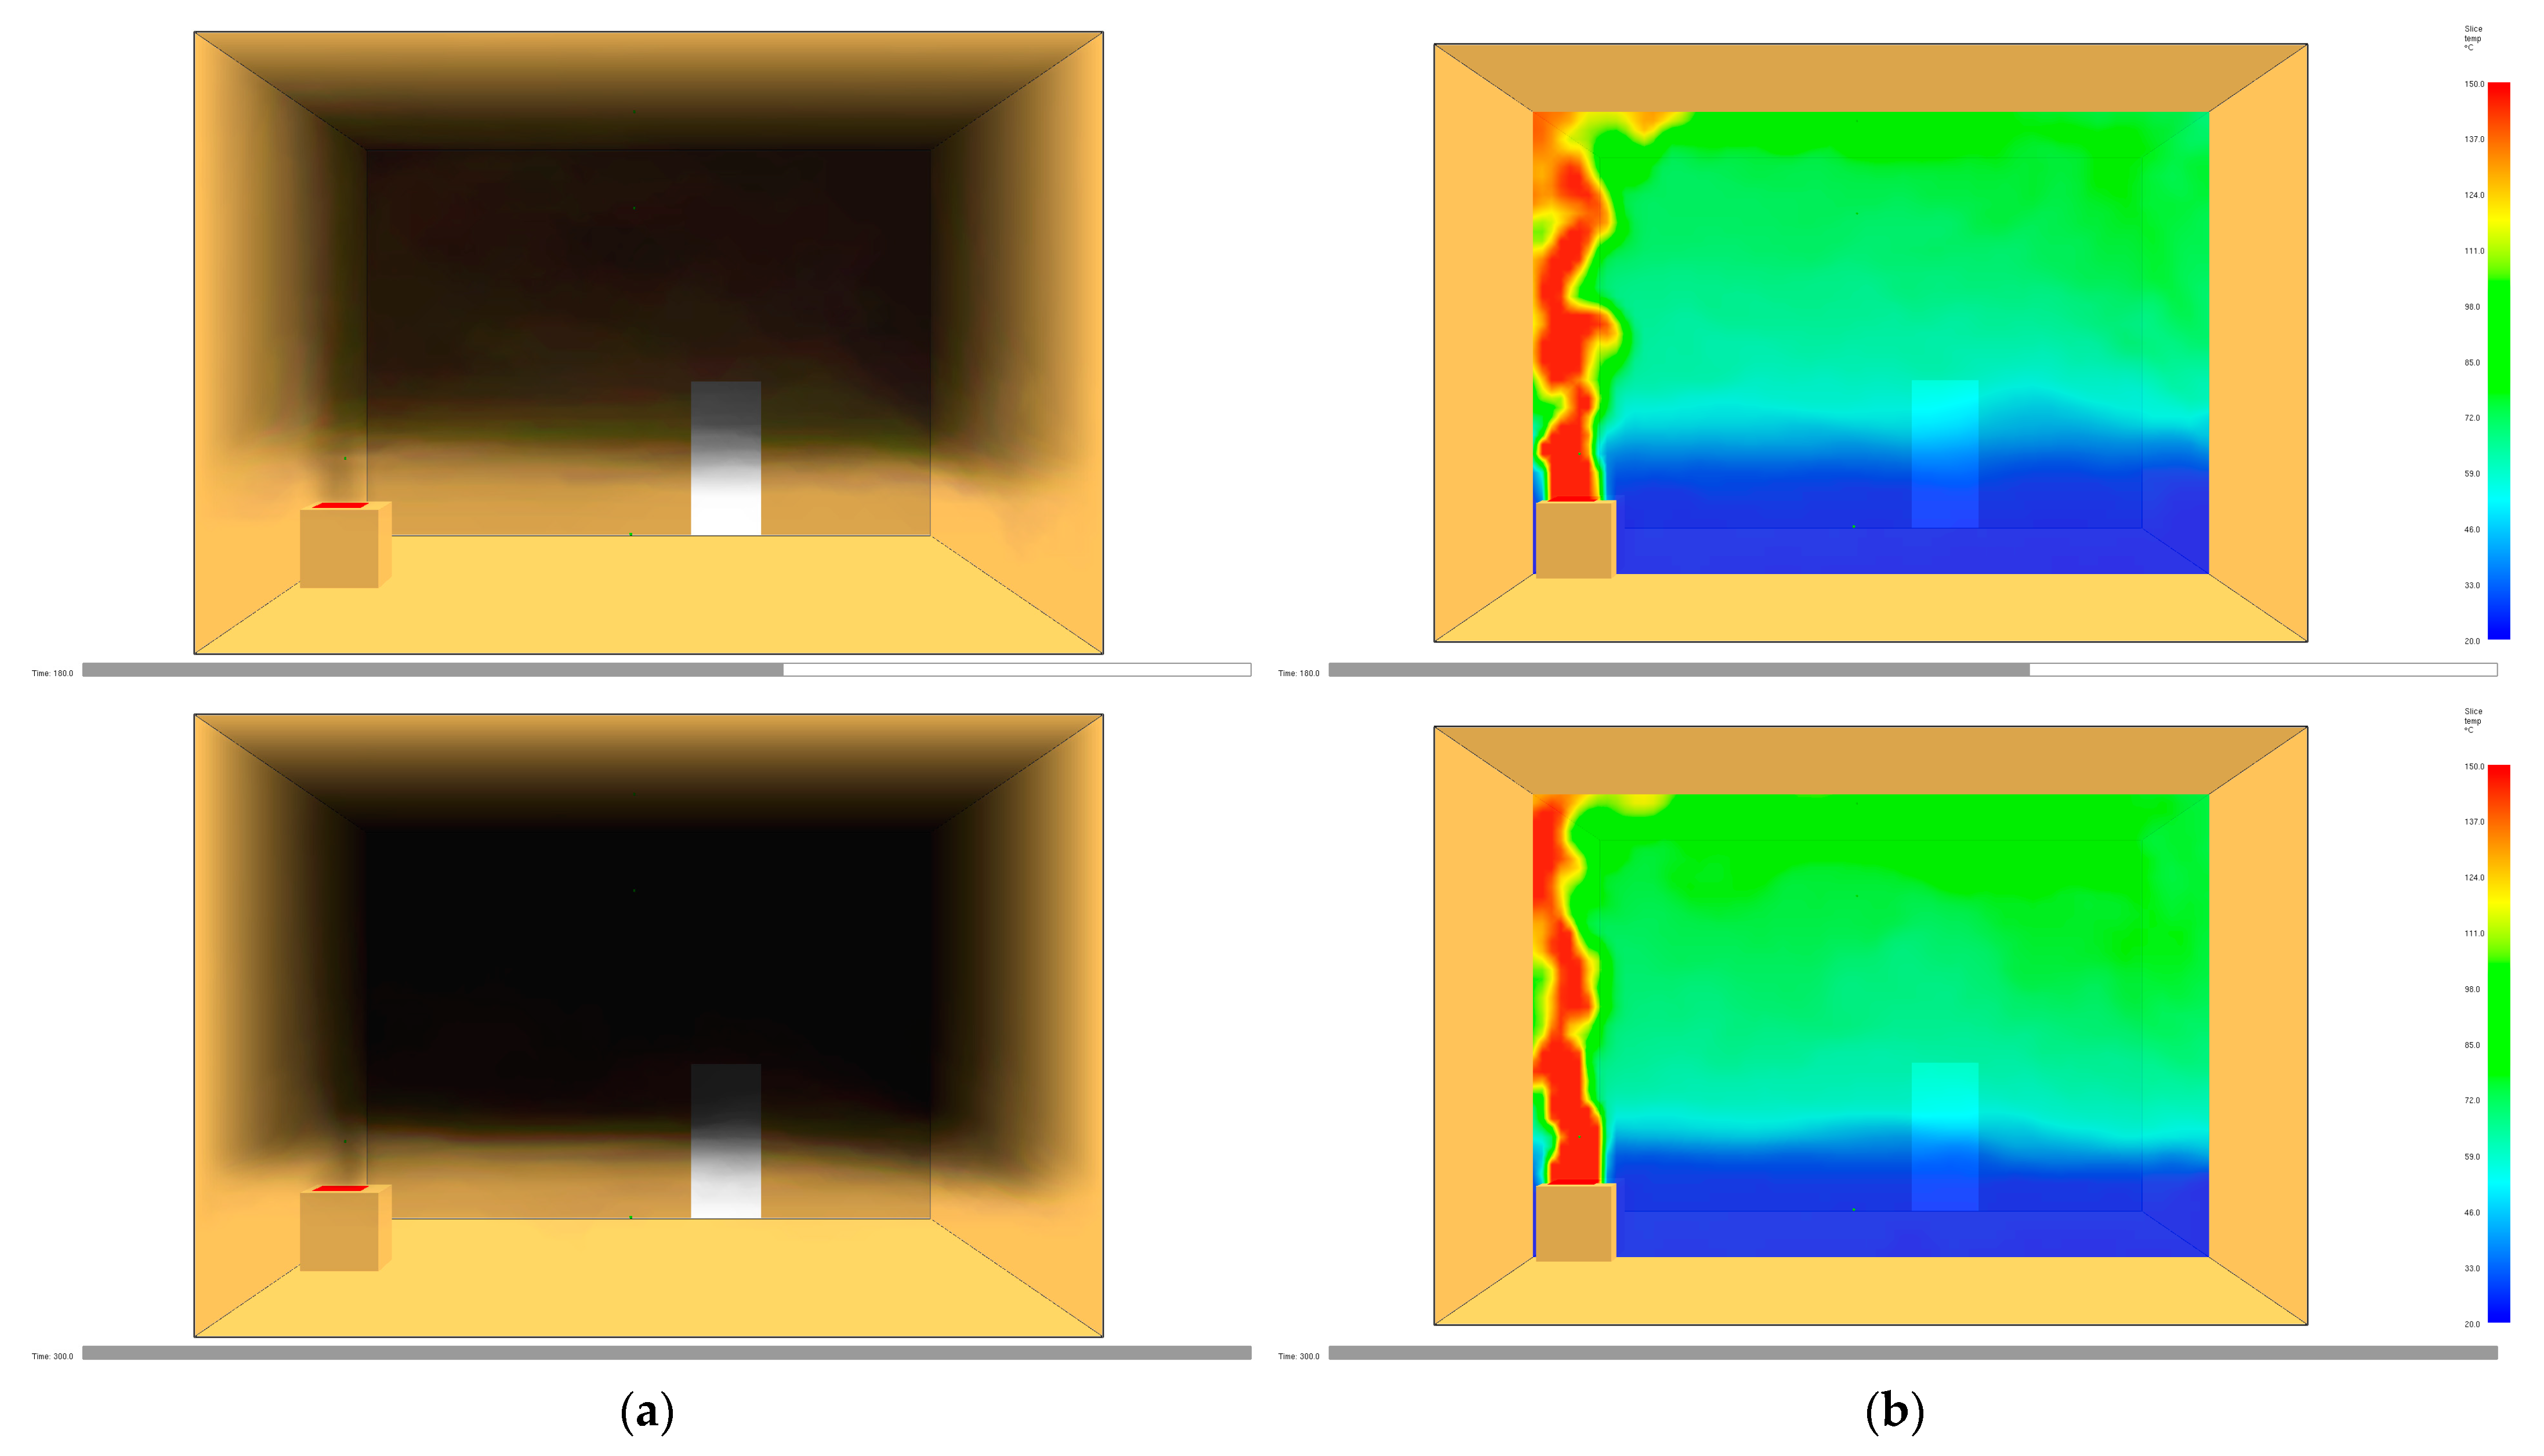
Starting with simulation N.1, the burning area was 0.25 m
2 and the HRRPUA was kW/m
2. The result maximum value of HRR is reached at around 125 kW. In
Figure 6a,b below, we offer a depiction of the evolution of smoke and temperature. The maximum temperature reached in the simulation is around 96 °C.
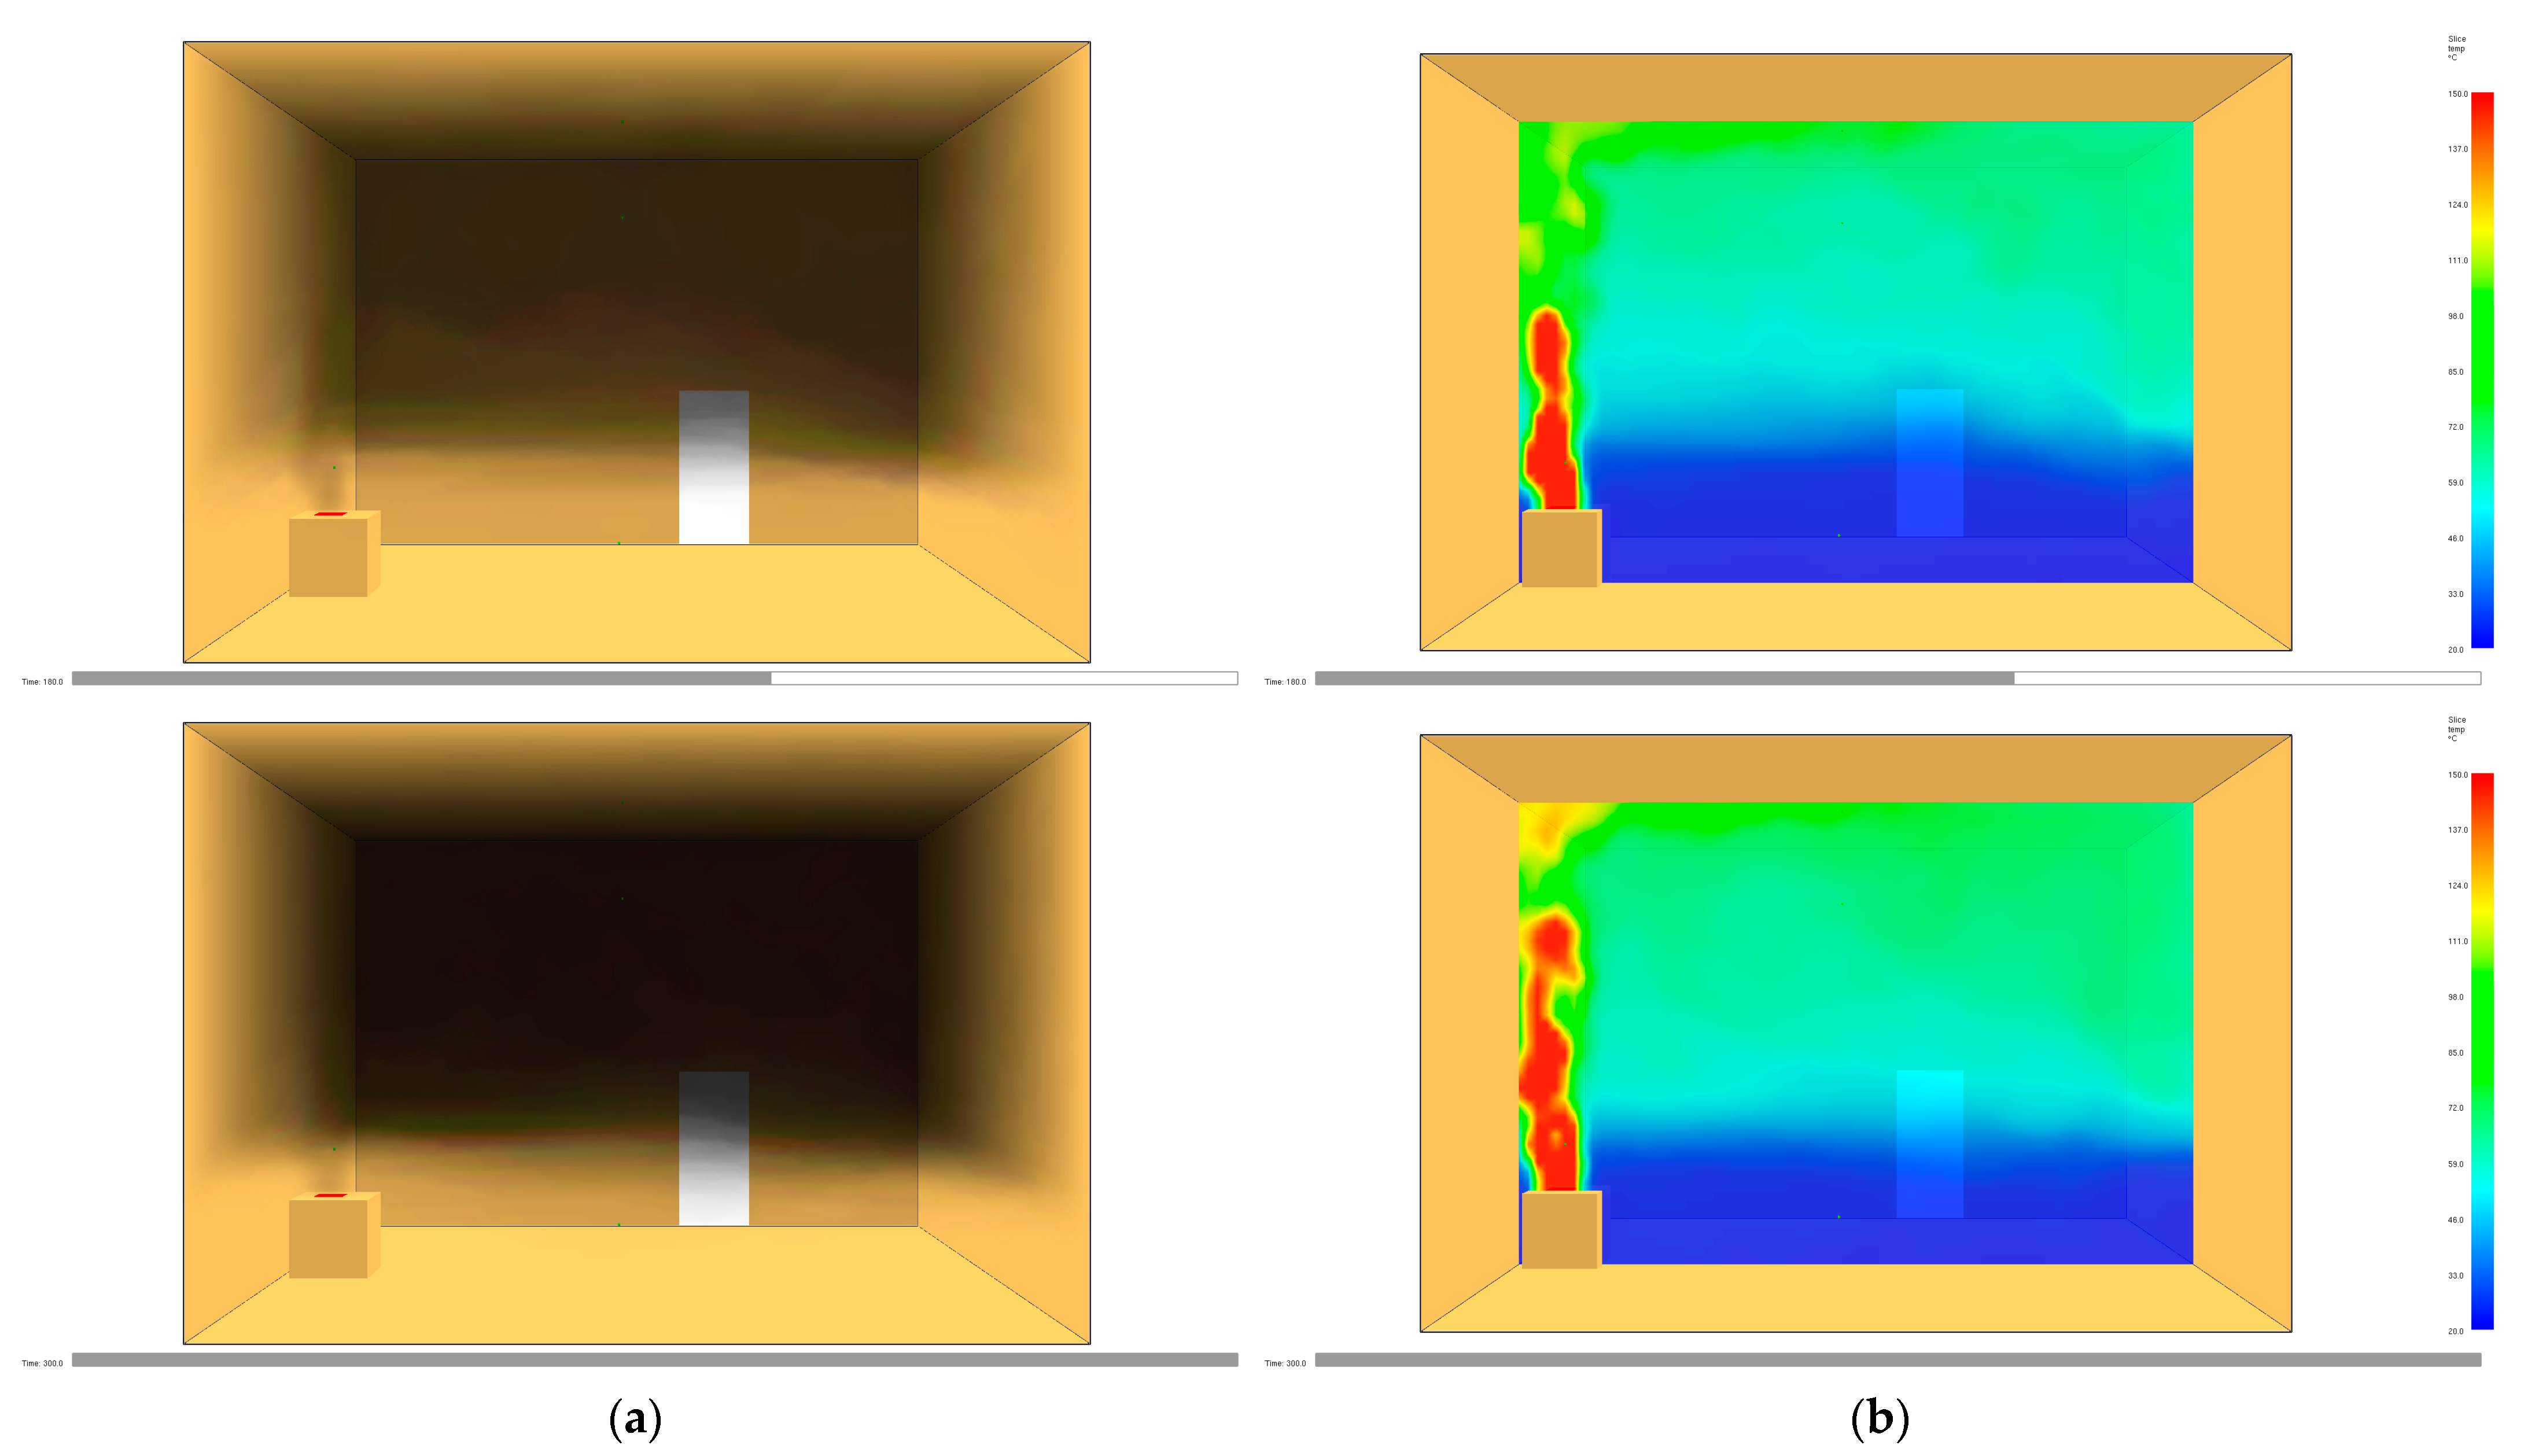
Following the results obtained in the first simulation, a second simulation was conducted with the burning area set to 0.25 m
2 and the heat release rate per unit area (HRRPUA) set to 800 kW/m
2. The maximum value of HRR reached during the simulation was approximately 200 kW.
Figure 7a,b below presents the progression of smoke and temperature. The highest temperature recorded in the simulation was around 96 °C.
The last of the three simulations, represented in
Figure 8a,b, carried out to calibrate the geometric and fluidodynamic model, as well as provide useful indications for the implementation of in-situ tests, was conducted using a burning area of 0.09 m
2 and with the heat release rate per unit area (HRRPUA) set to 1233 kW/m
2. The maximum value of HRR reached during the simulation was approximately 111 kW. The highest temperature recorded in the simulation was around 91 °C.
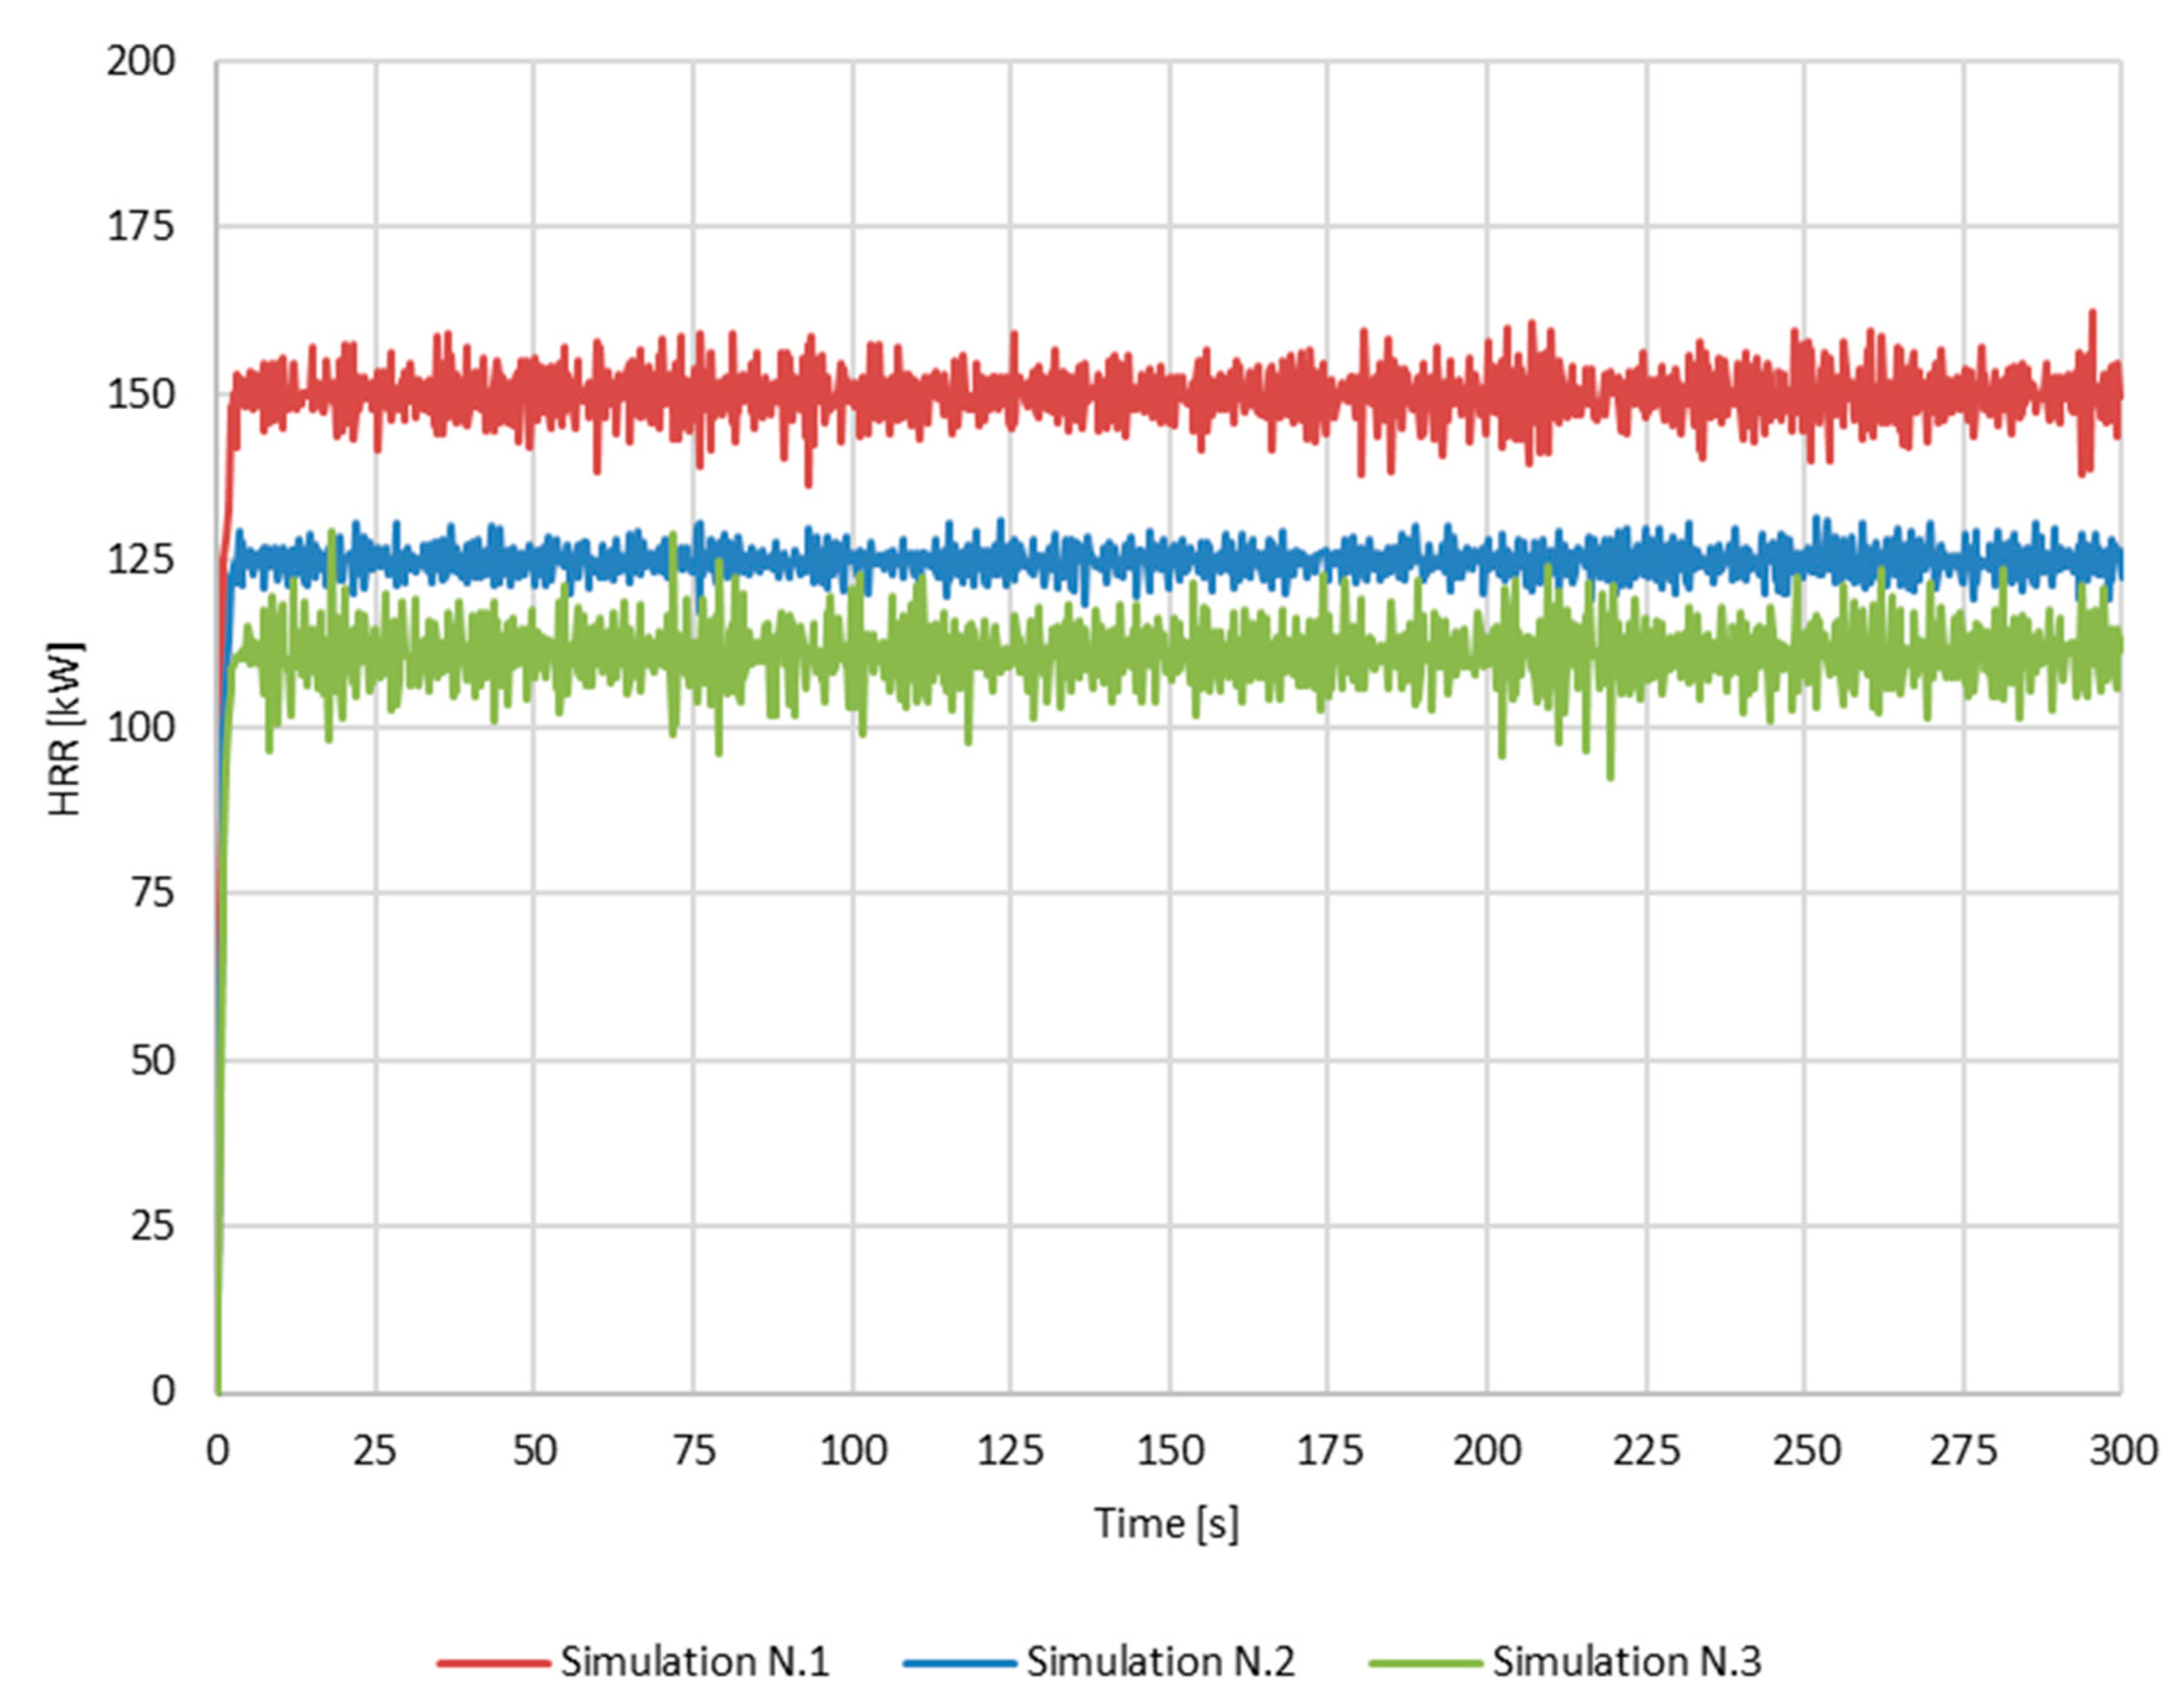
The interesting part of the calibration process is undoubtedly identifying a thermal power that can best represent the real conditions compared to the simulated ones. Moreover, the maximum temperature recorded by the sensors in the simulated environment should coincide with the real temperature. In
Figure 9, the comparison of the three HRR values is displayed. The process carried out consisted of calibration to achieve a projected heat release rate (HRR) equal to the behavior observed in real-scale tests. Therefore, the burning areas and the progressive heat release rate per unit area (HRRPUA) value were modified in the three simulations until the correct behavior was identified in simulation N.3.
2.5. Onsite Compartment Room Tests
Considering the results obtained in the second step of the experimental procedure, tests were carried out in the compartment using the high-pressure water mist extinguishing system designed to ensure environmental sustainability and the preservation of the works in a cultural heritage structure. The same test procedure was repeated to evaluate the effectiveness of the water mist system [
45], according to the water droplet size [
46]. Using the same materials and room arrangement, a second fire test was conducted, and the temperature range was recorded using thermocouples (
Figure 10).
In our case study, the spray angle is approximately 80°, and the activation temperature is around 75 °C. The impact of the atomizer exit area ratio on the breakup morphology of water–air jets is a critical parameter [
47].
All these parameters are summarized in the following
Table 3. We have set the droplet diameter at 60 μm, and the system releases 5000 particles per second. Small droplets are highly effective in fire suppression due to their ability to easily connect to the flame zone and evaporate more rapidly and efficiently.
Heptane Pool Fire Test
After obtaining the results from the fire tests conducted on materials found in the museum, the findings of this study can be generalized to a heptane pool, which is commonly studied in the literature [
48]. When determining the fire design for a specific scenario, it is often based on either the knowledge of the quantity and type of combustible materials present in the fire compartment or on reproducing the same heat release rate (HRR) versus time using equivalent performance fuels [
29,
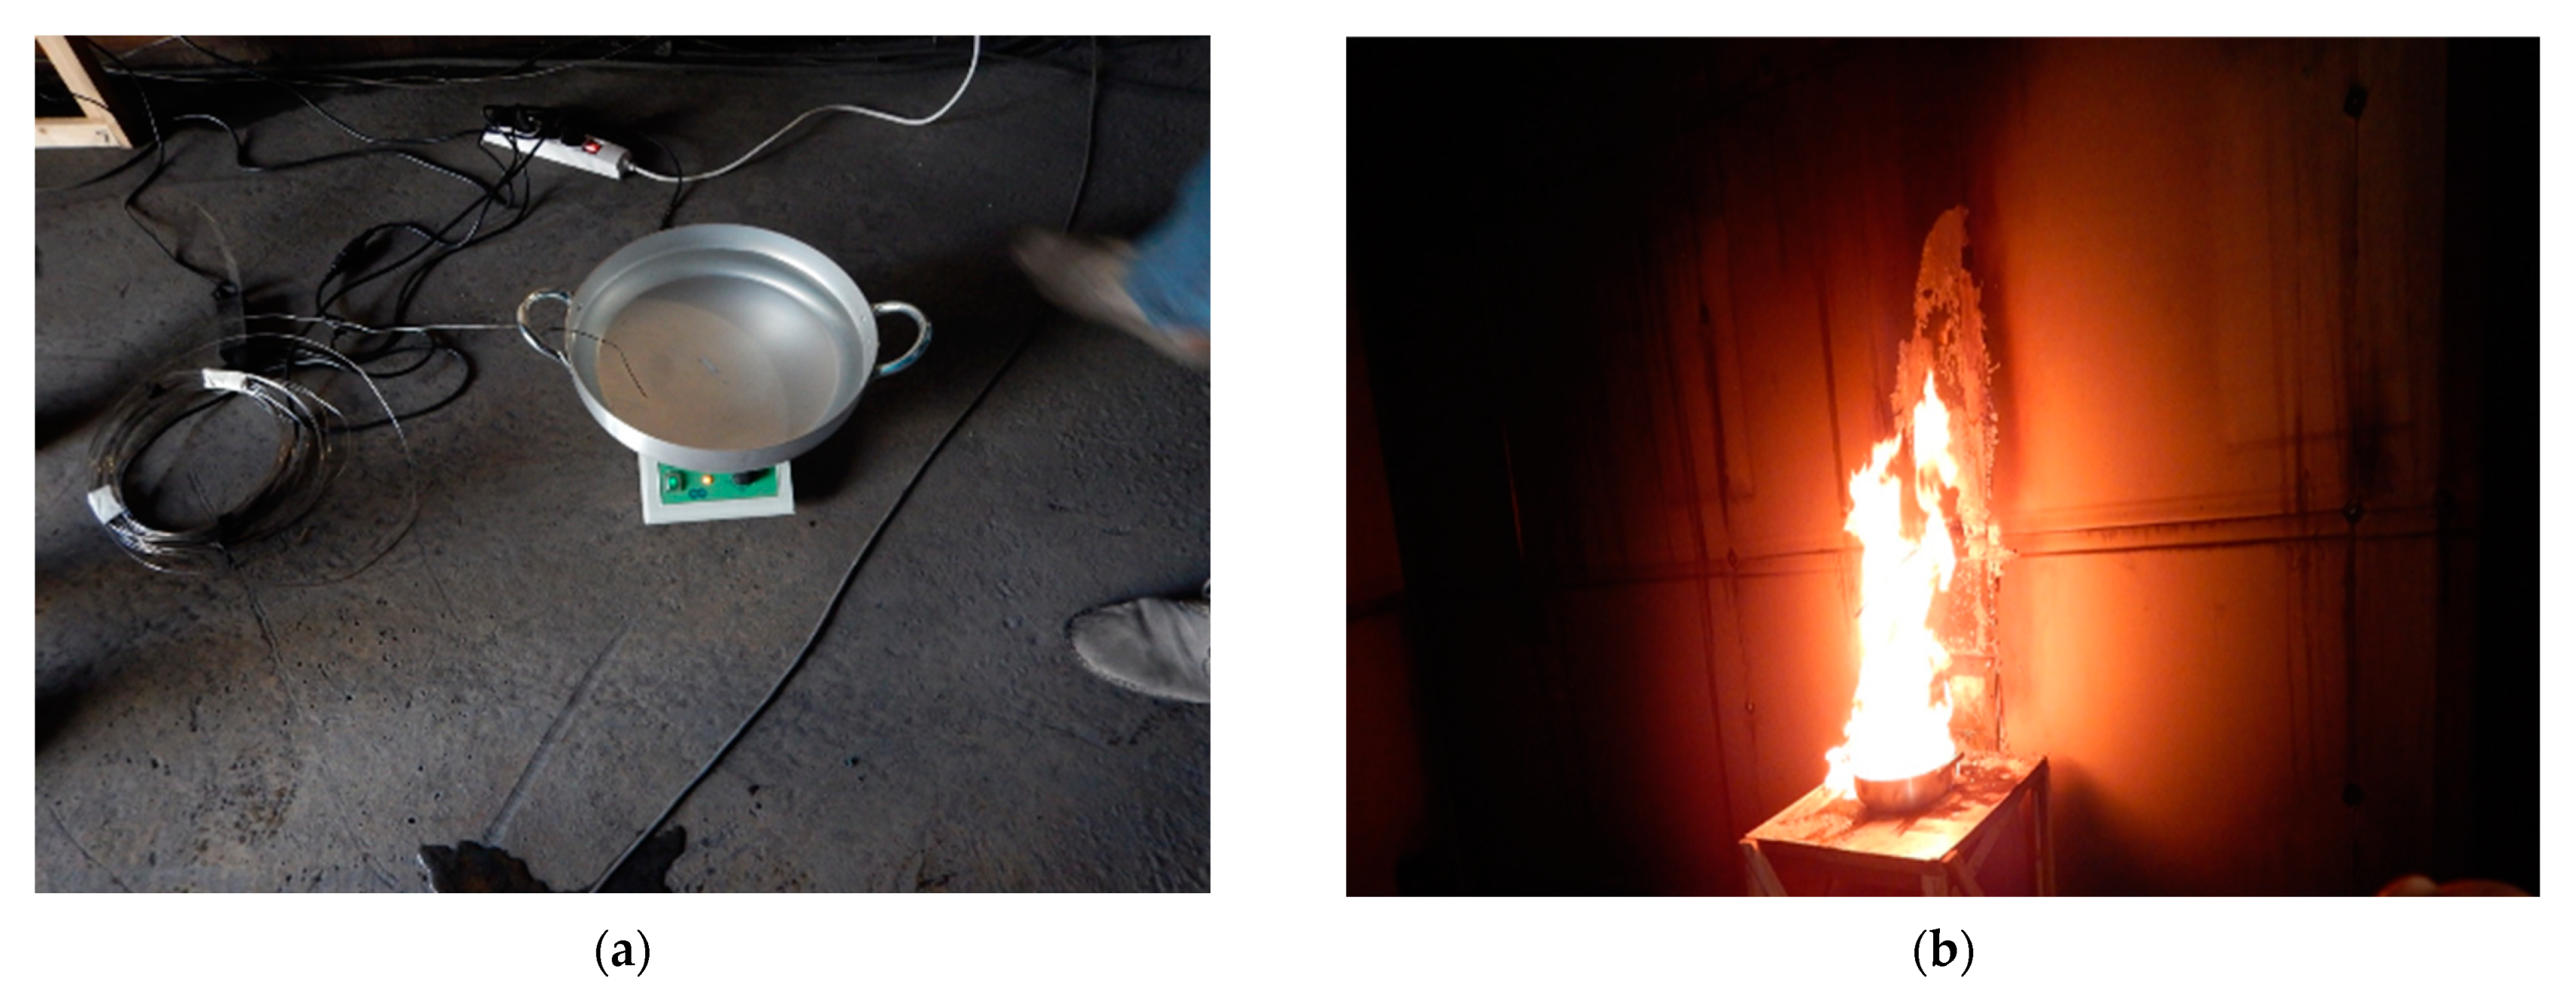
49]. These tests are valuable for comparing the achieved results with simulations performed using FDS. The heptane pool tests, both the free burn and water mist scenarios, were conducted using an aluminum pool with a diameter of 36 cm, a thickness of 3 mm, and a height of 8 cm. In the setup, a volume of 2.7 L of water was placed at the bottom, while a volume of 5 L of heptane was placed on top, as depicted in
Figure 11a,b.
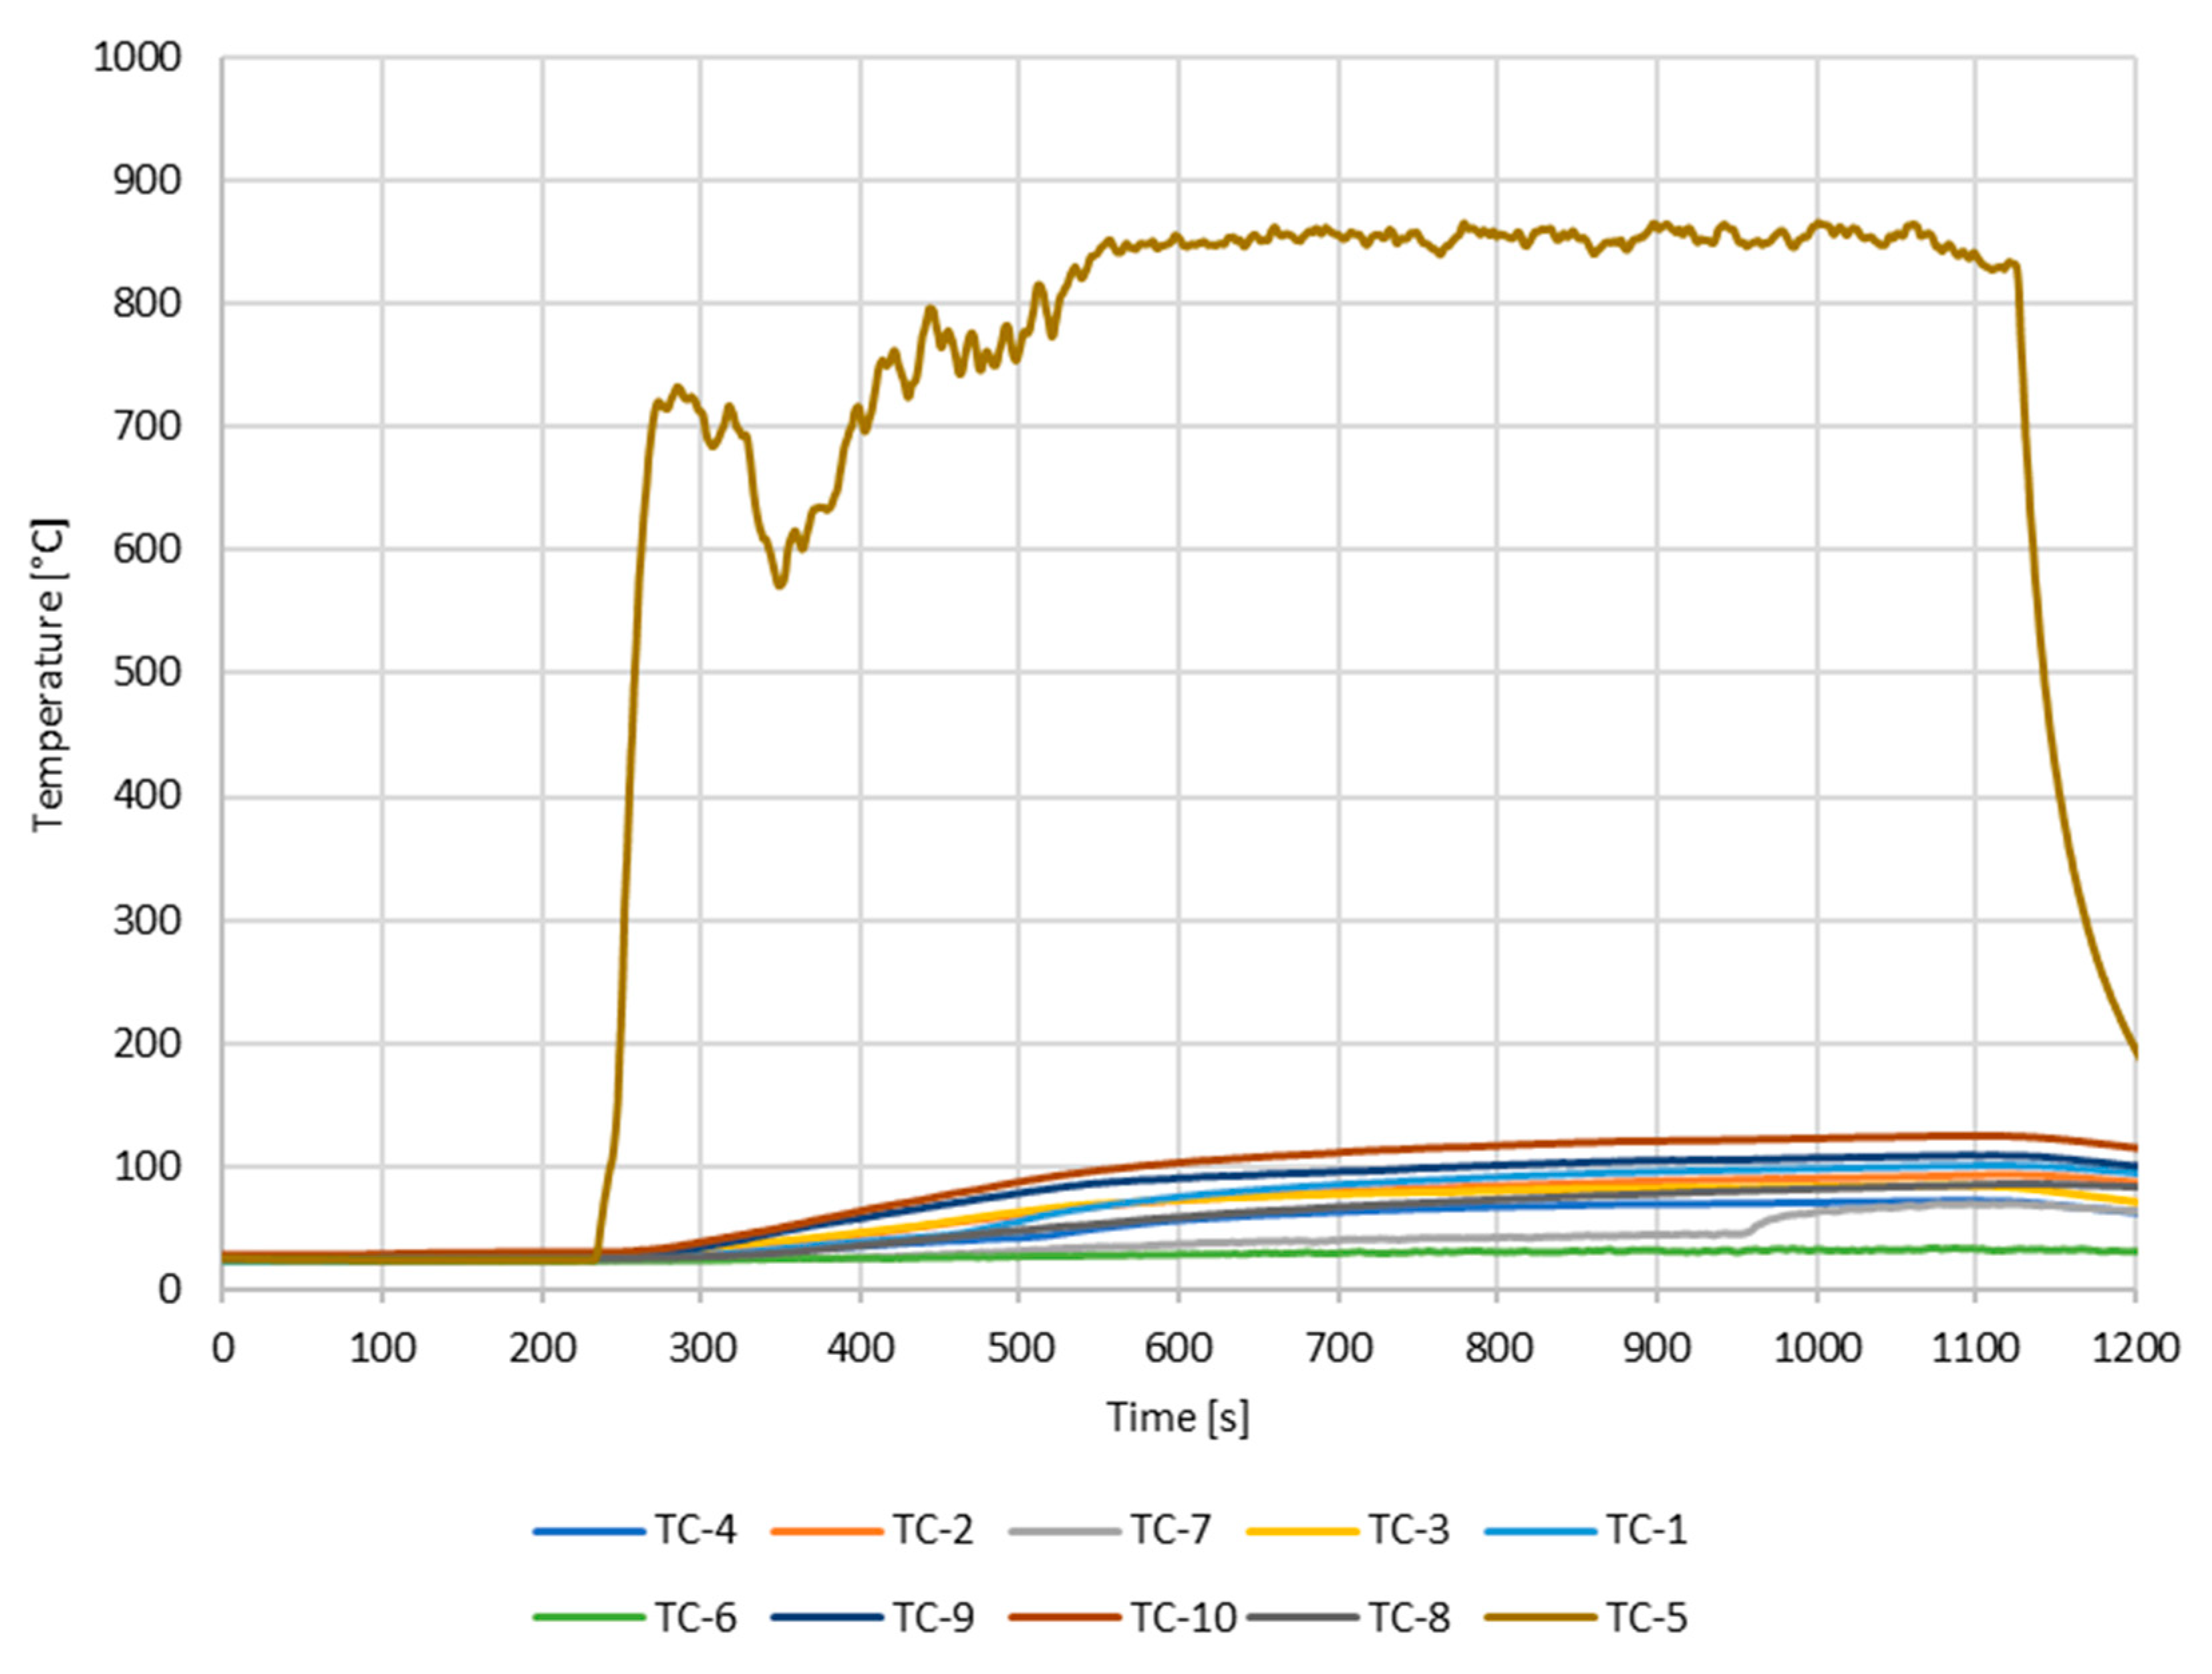
Similarly, the trends of the ceiling temperature are depicted in
Figure 12. The first setup was carried out in free burning conditions, according the procedure described in
Figure 1.
When the water mist was introduced into the compartment after the specified activation time (as indicated by the activation temperature parameter in
Table 3), it was observed that the fire decreased in power rapidly, as shown in the temperature–time evolution pictures of the fire in
Figure 13. Based on the data presented in
Figure 13, it is evident that the water mist has a significant effect on the fire, which becomes apparent after 300 s.
2.6. Water Mist Suppression in FDS
The fourth step of the experimentation involved recreating the extinguishing system in the simulated environment, using the model that had already been calibrated in step two and validated in real-scale tests in step three.
In our case study, the spray angle is approximately 80°, and the activation temperature is around 75 °C. The impact of the atomizer exit area ratio on the breakup morphology of water–air jets is a critical parameter [
46].
We have set the droplet diameter at 60 μm, and the system releases 5000 particles per second. Small droplets are highly effective in fire suppression due to their ability to easily connect to the flame zone and evaporate more rapidly and efficiently.
The performance of the water mist system can be directly assessed through the analysis of the temperature field. The design of the instrument used for monitoring fire development in the compartment was determined to achieve more accurate and reliable measurements [
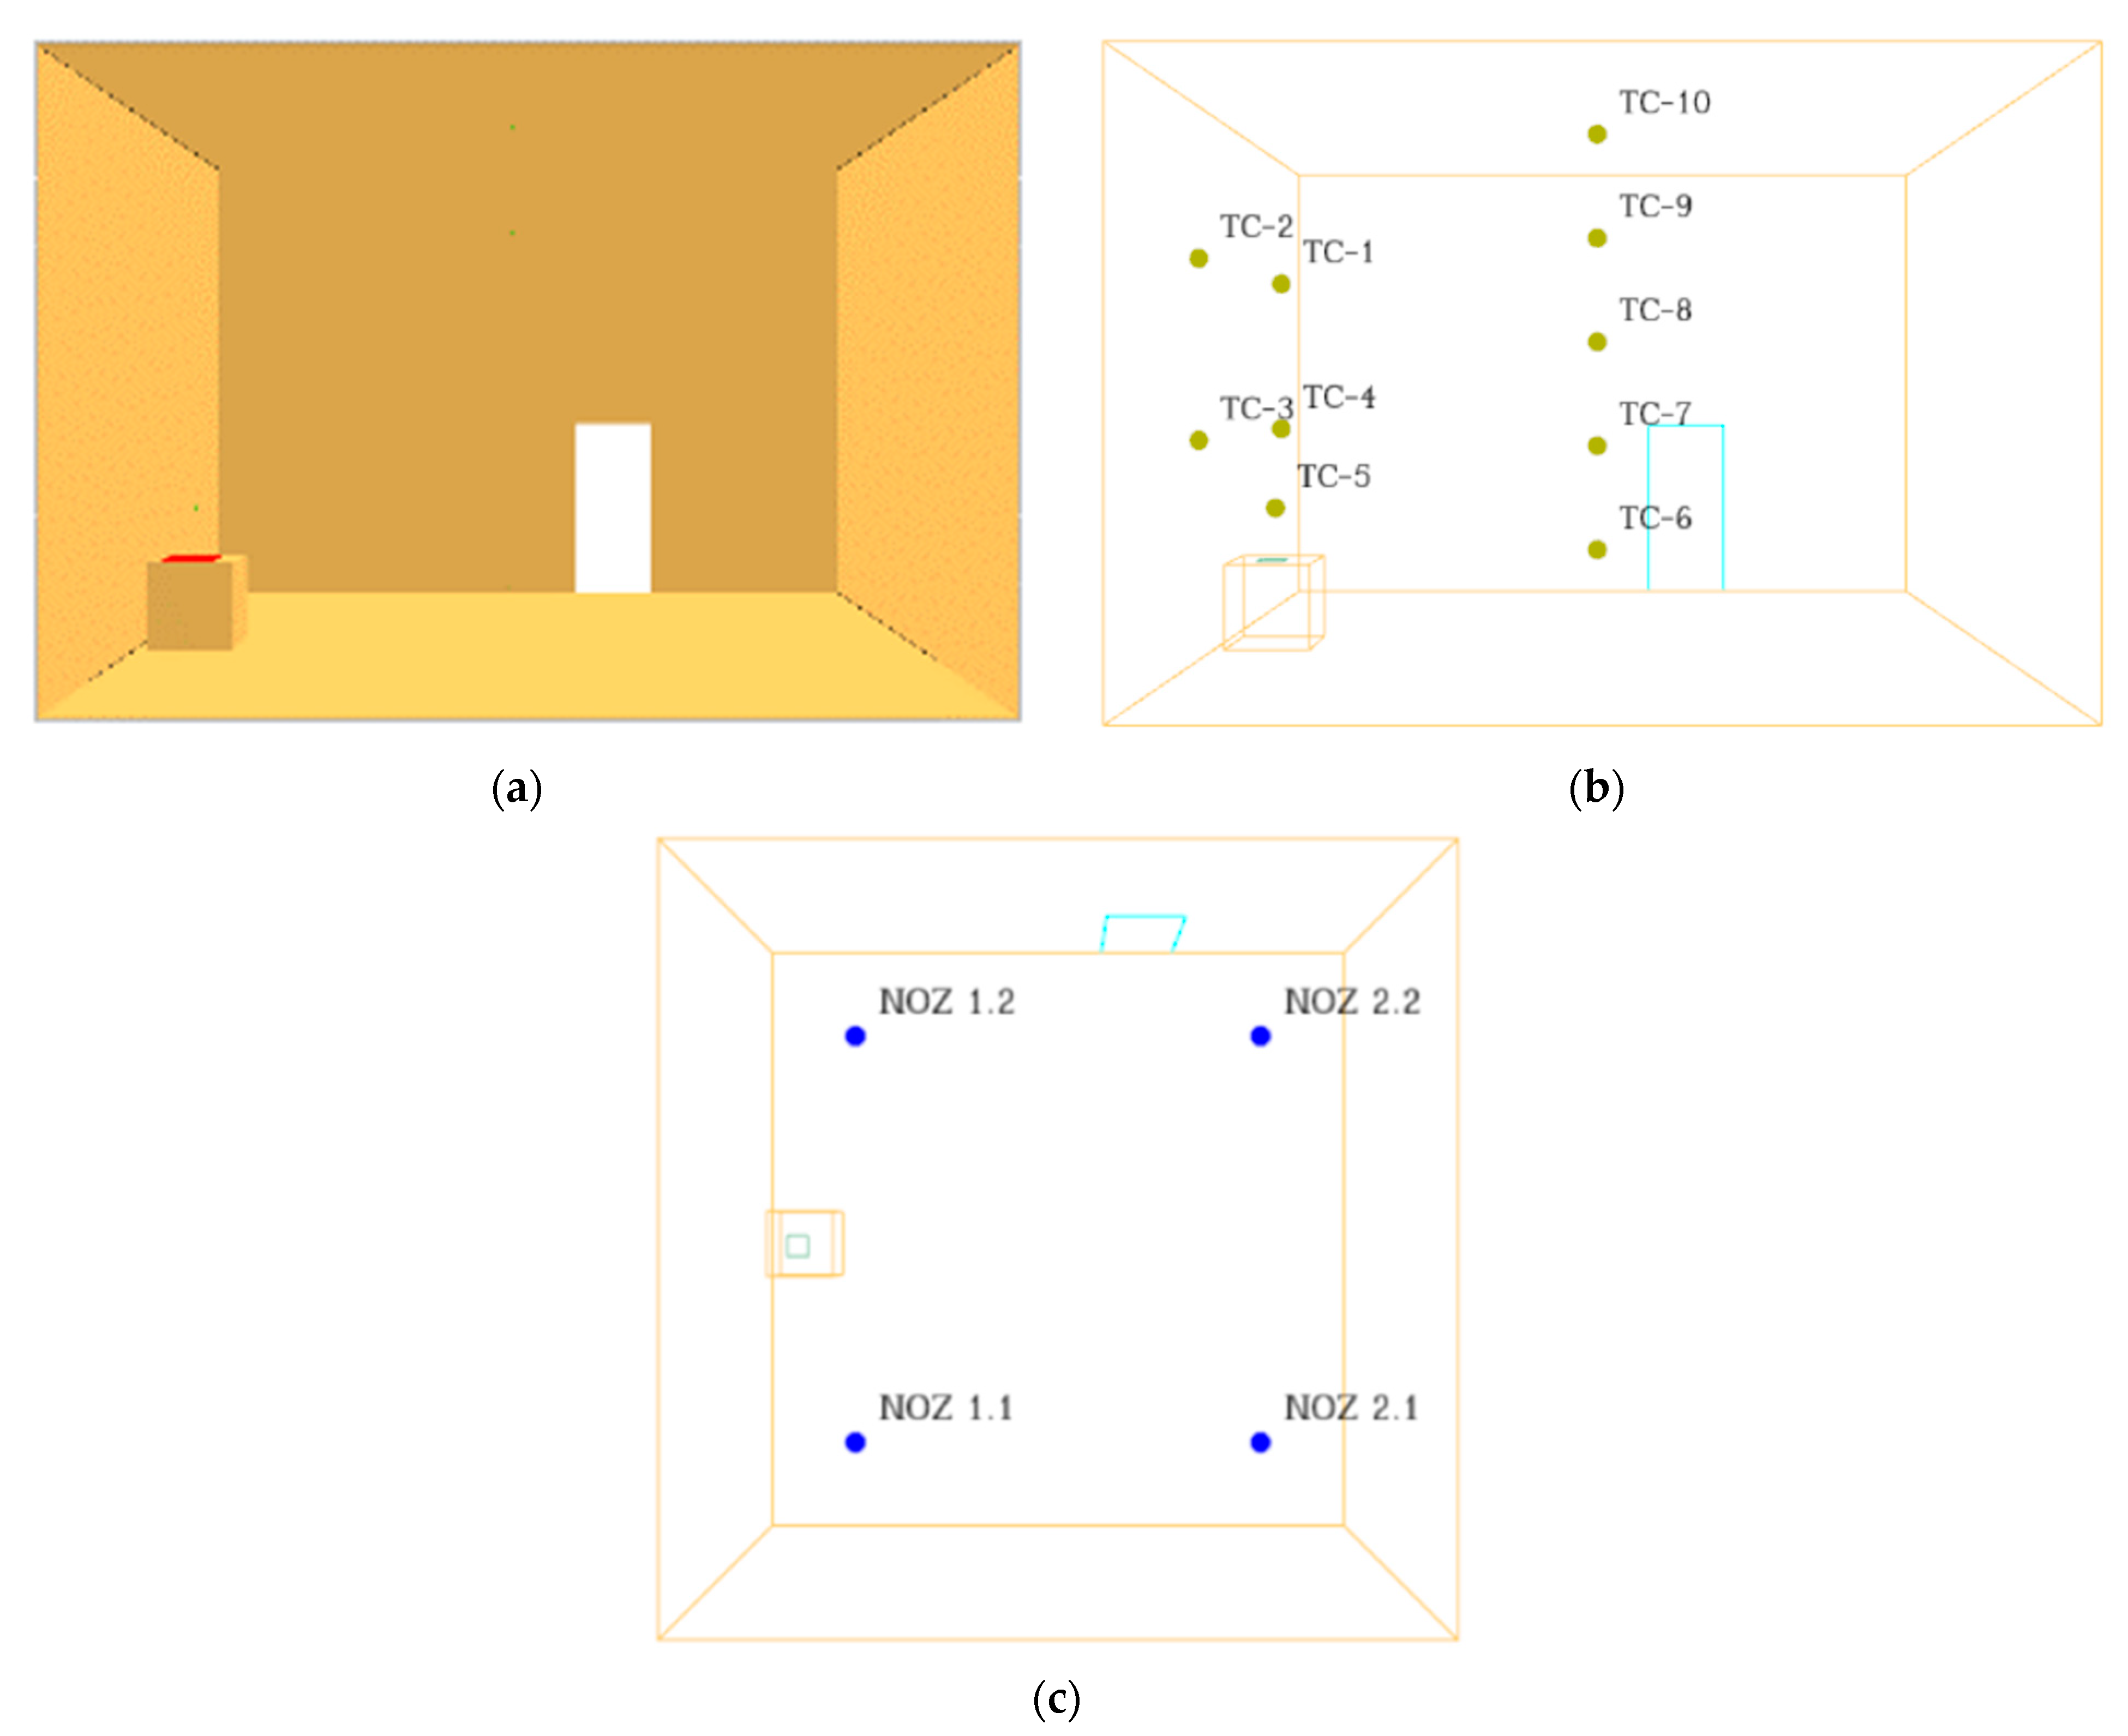
50]. The ambient temperature was set at 20 °C. The positions of the thermocouples are indicated in
Figure 14b and
Table 4. The thermocouple placement was strategically chosen to capture various temperature fields. Firstly, thermocouples were positioned to monitor the rise in temperature from the burner and estimate the maximum fire temperature (TC-5). Secondly, thermocouples were placed near the wall (TC-1, TC-2, TC-3, TC-4) to assess the temperature field related to the protection of the paintings. Lastly, thermocouples were placed at the center of the room (TC-6, TC-7, TC-8, TC-9, TC-10) to record the temperature increase within the room, enabling calibration of the water mist system activation and monitoring the temperature for people’s safety.
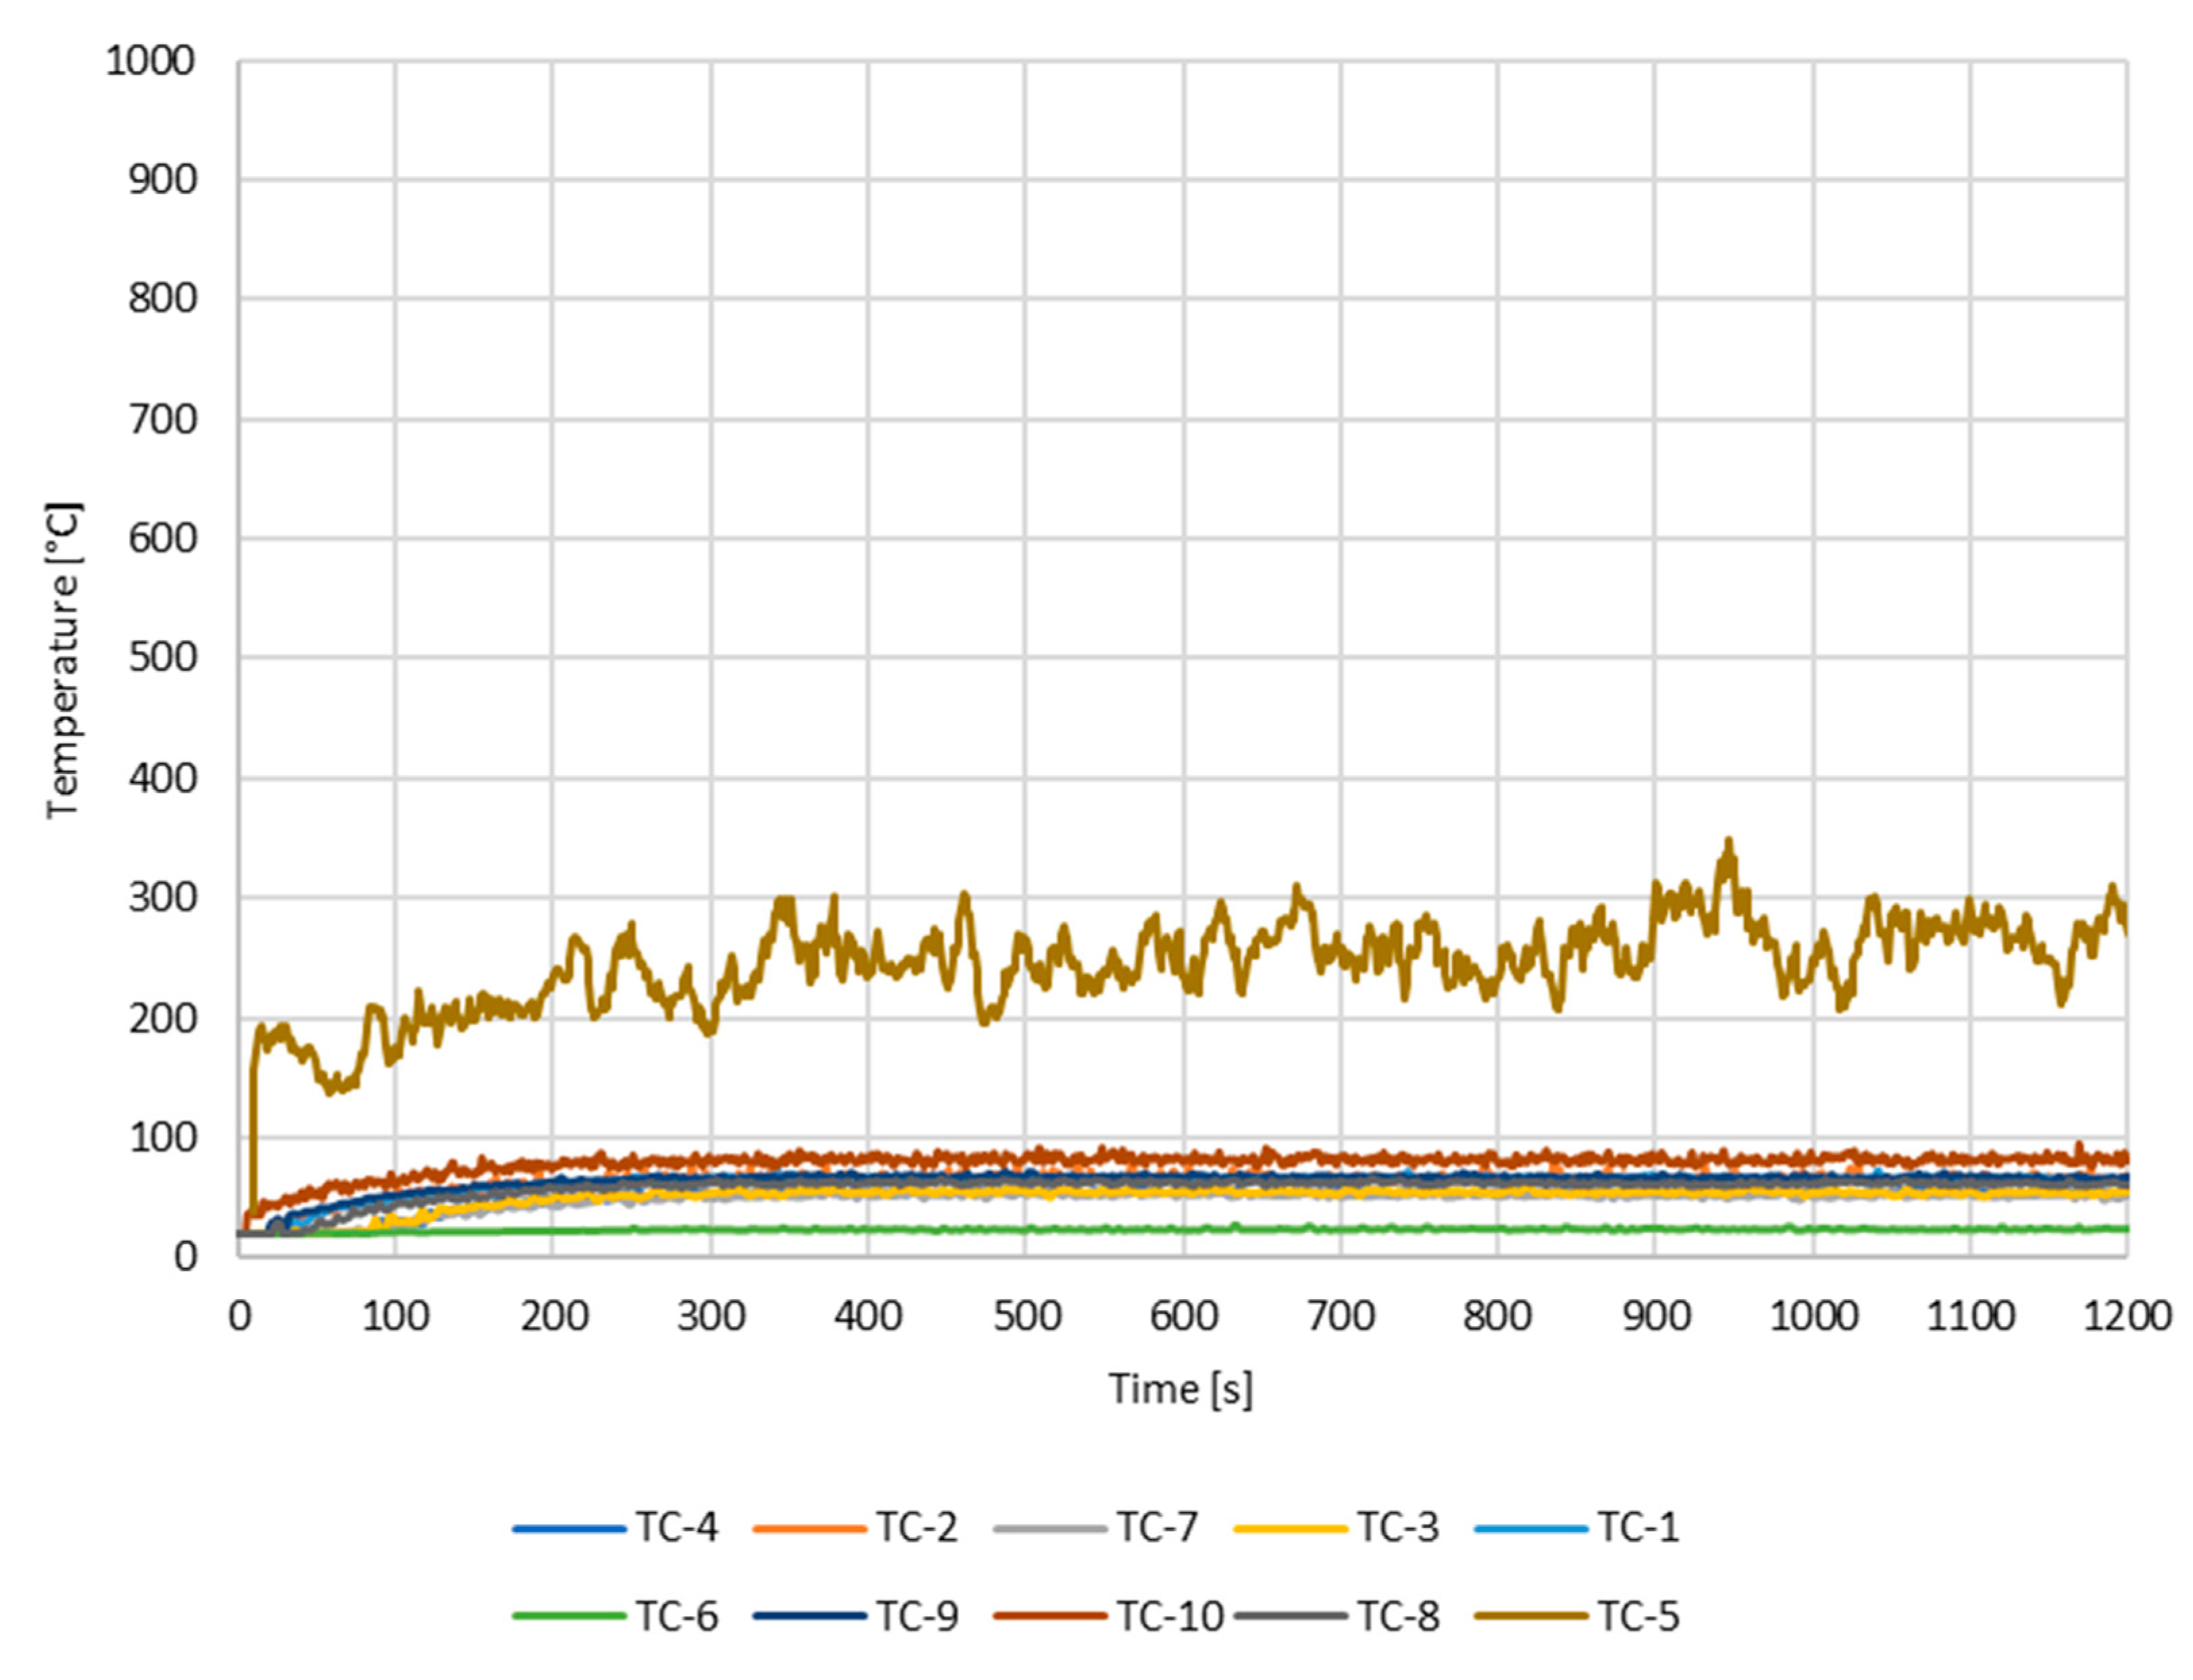
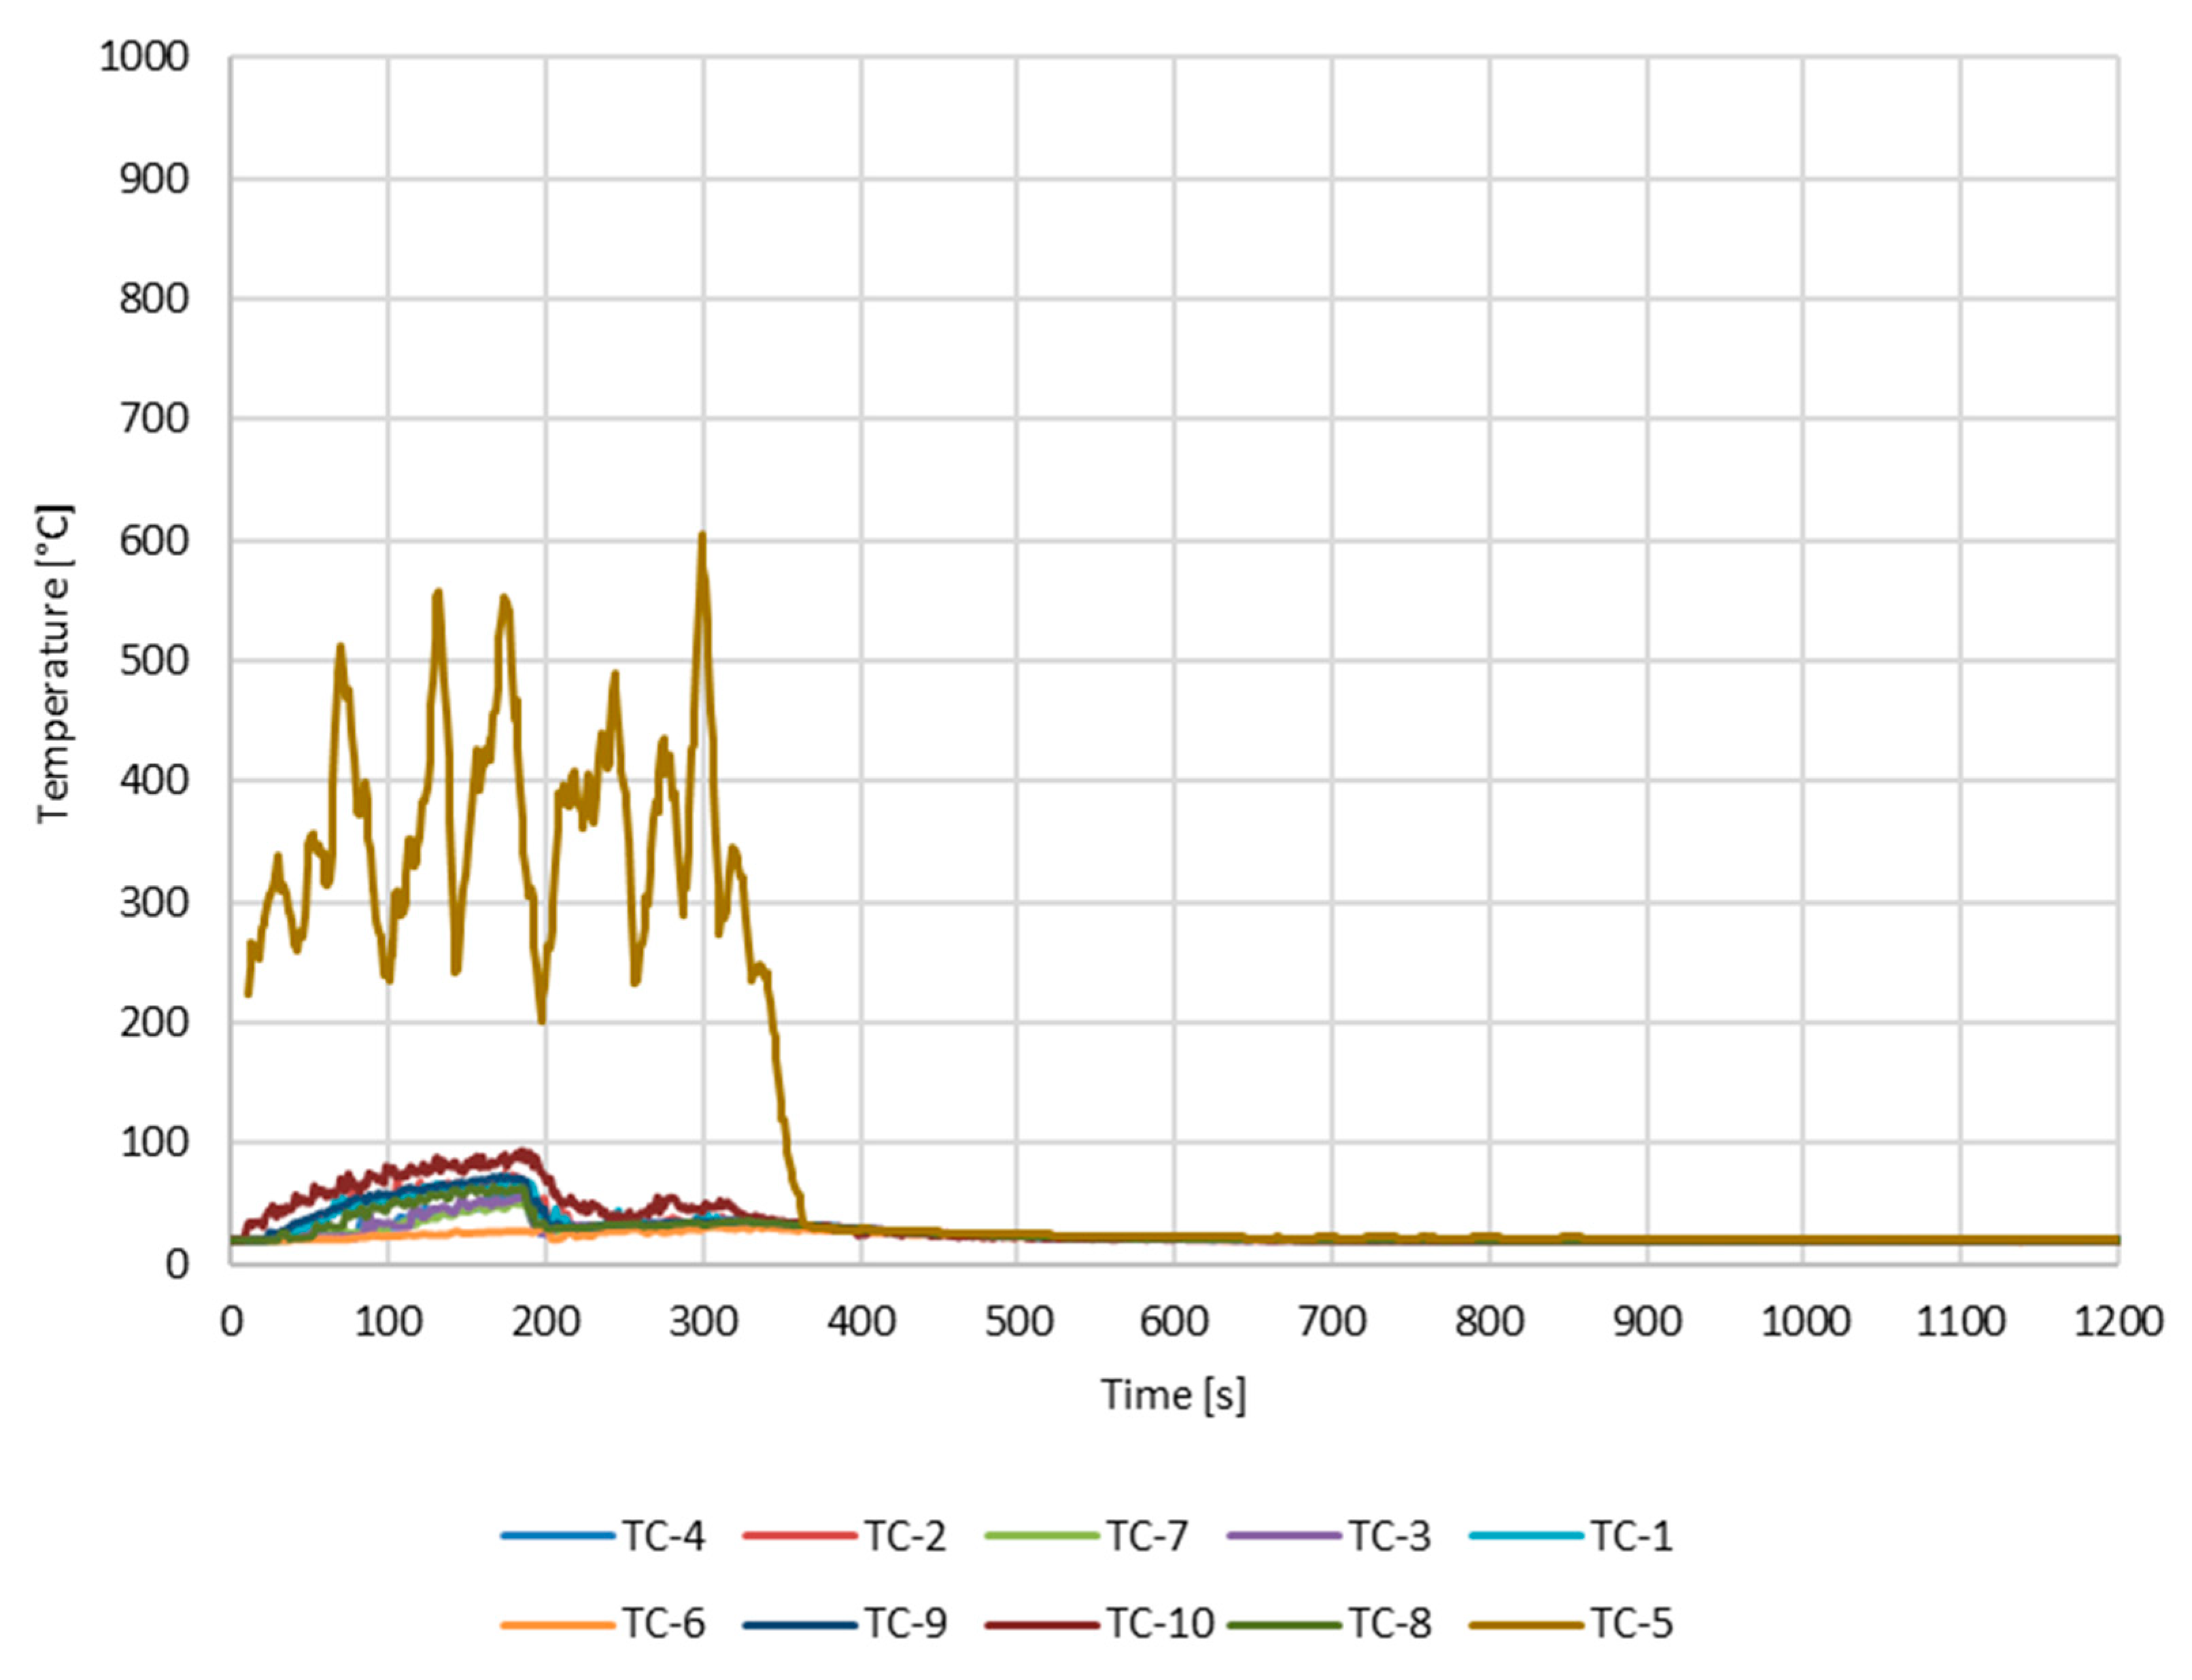
Numerical simulations were performed to analyze the temperature trends during the free burn of the heptane pool (
Figure 15) and the burning with suppression by the water mist system (
Figure 16).
Temperatures recorded by thermocouple TC-5 assume fluctuating values, increasing and decreasing continuously, due to its reduced distance from the burning point. For this reason, we used a smoothing function to better represent the distribution.
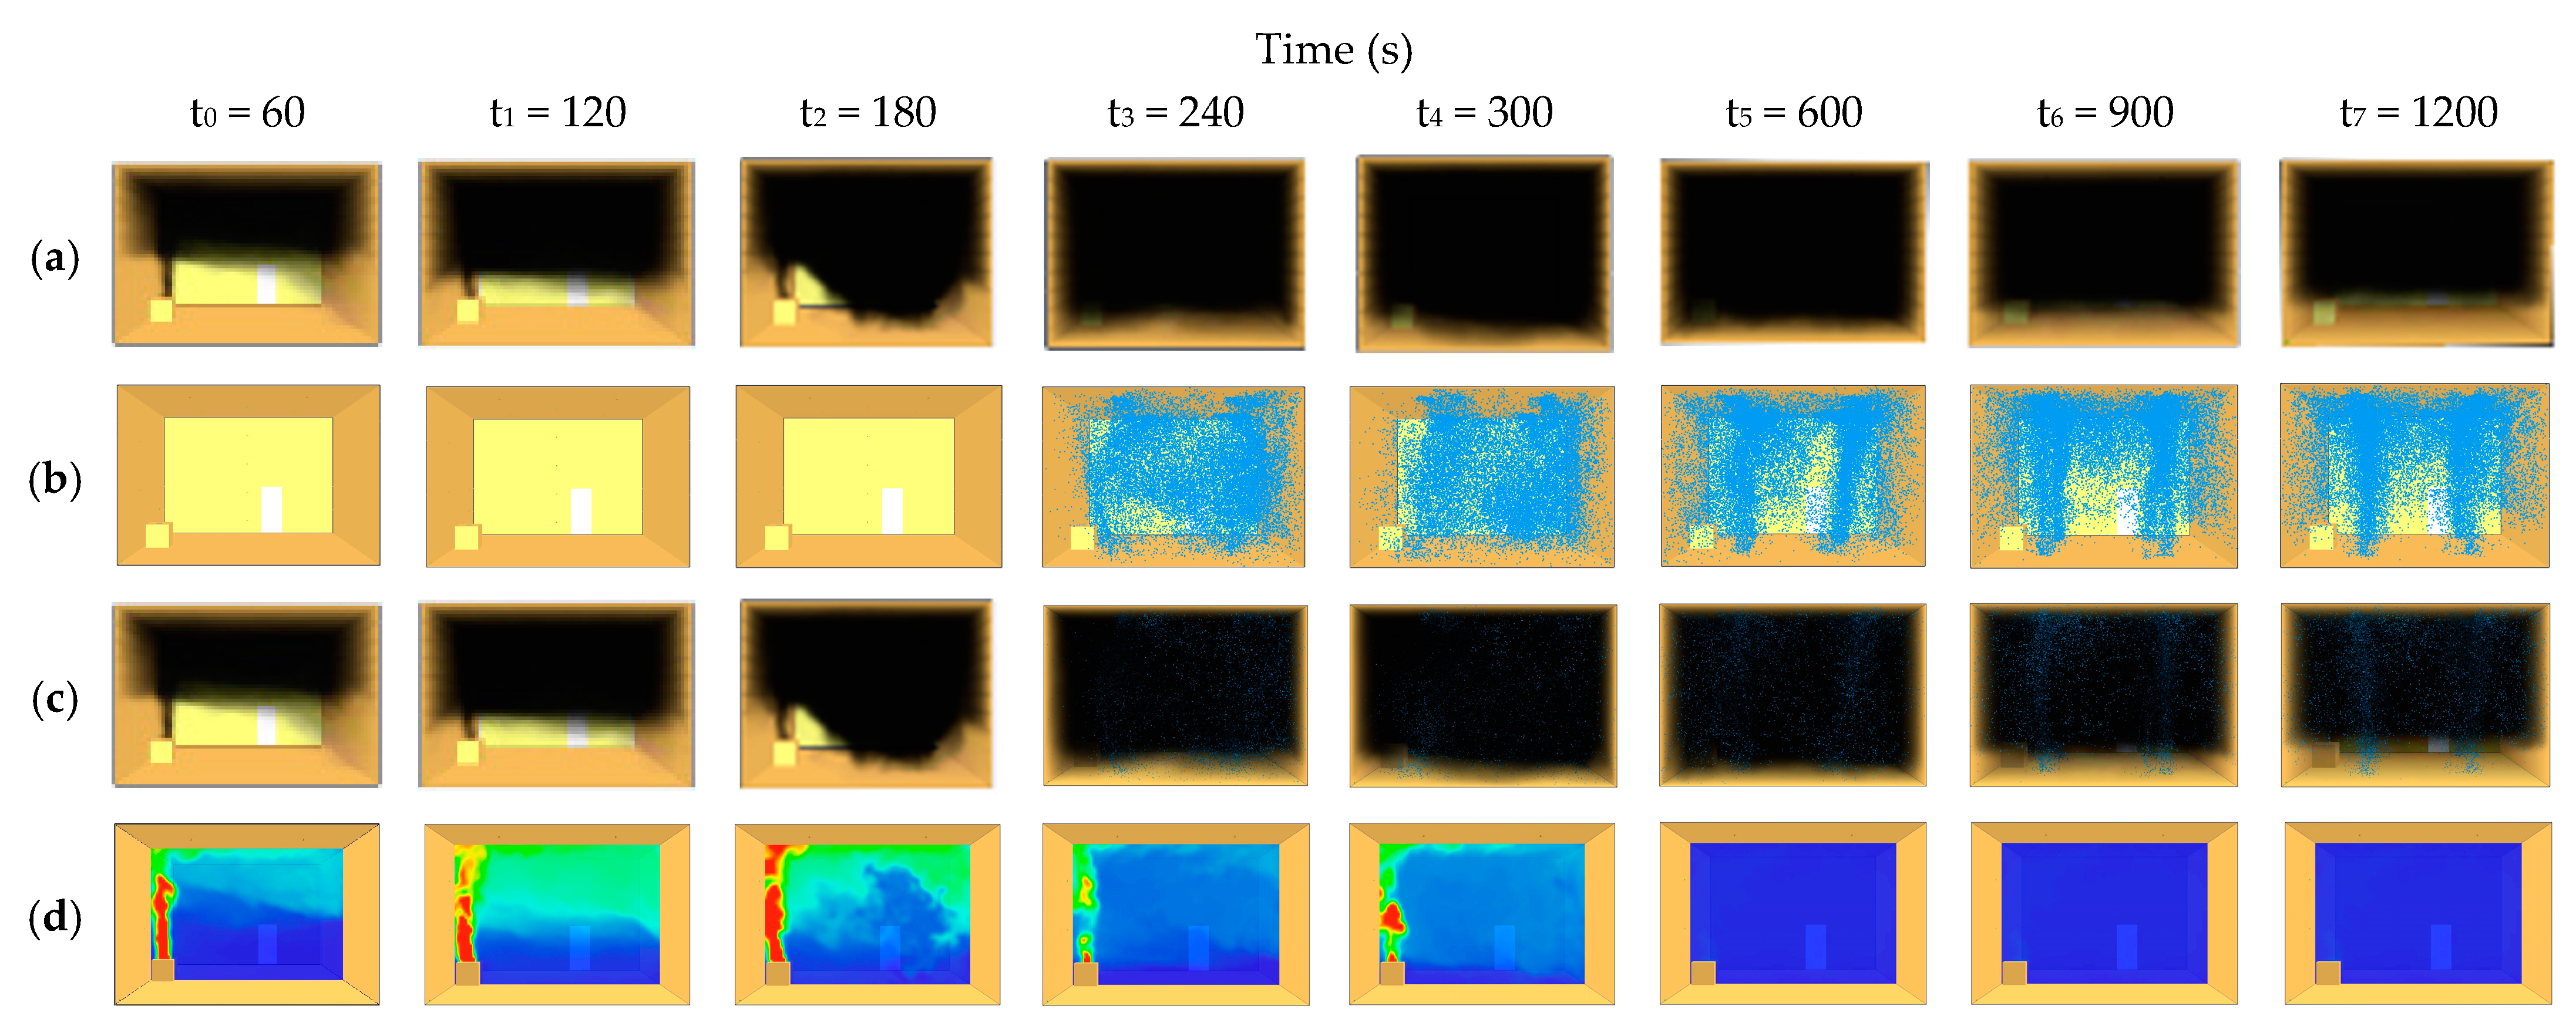
The analysis of temperature distribution and velocity field was crucial to understand the interaction between water droplets and smoke during fire suppression. The simulation outputs, illustrating the dispersion of water mist and the smoke layer during fire suppression, are depicted in
Figure 17.
3. Results
In this section, we delve into the comprehensive analysis and discussion of the results obtained from our experimental test. The main objective of this study was to investigate the effects of the extinguishing system and examine the reproducibility of simulation conditions to replicate real test conditions. This investigation aimed to define the domain of existence of input conditions and determine the underlying mechanisms that contribute to the observed outcomes. By conducting a rigorous experimental design and employing advanced data analysis techniques, we were able to obtain valuable insights into the relationship between real tests and FDS simulation, shedding light on important factors influencing their relationship.
To provide a clear structure for this discussion, we will begin by summarizing the key findings derived from the experimental data. Overall, this section serves as a critical examination and synthesis of the experimental results, allowing us to draw meaningful conclusions and advance our understanding.
Analysis of Experimental Data: Effectiveness of Water Mist Extinguishing Systems
We will scrutinize the data to identify patterns and trends, seeking to discern relationships between temperature trends and how they manifest under various experimental conditions. By doing so, we can enhance our understanding of the complex dynamics governing this phenomenon.
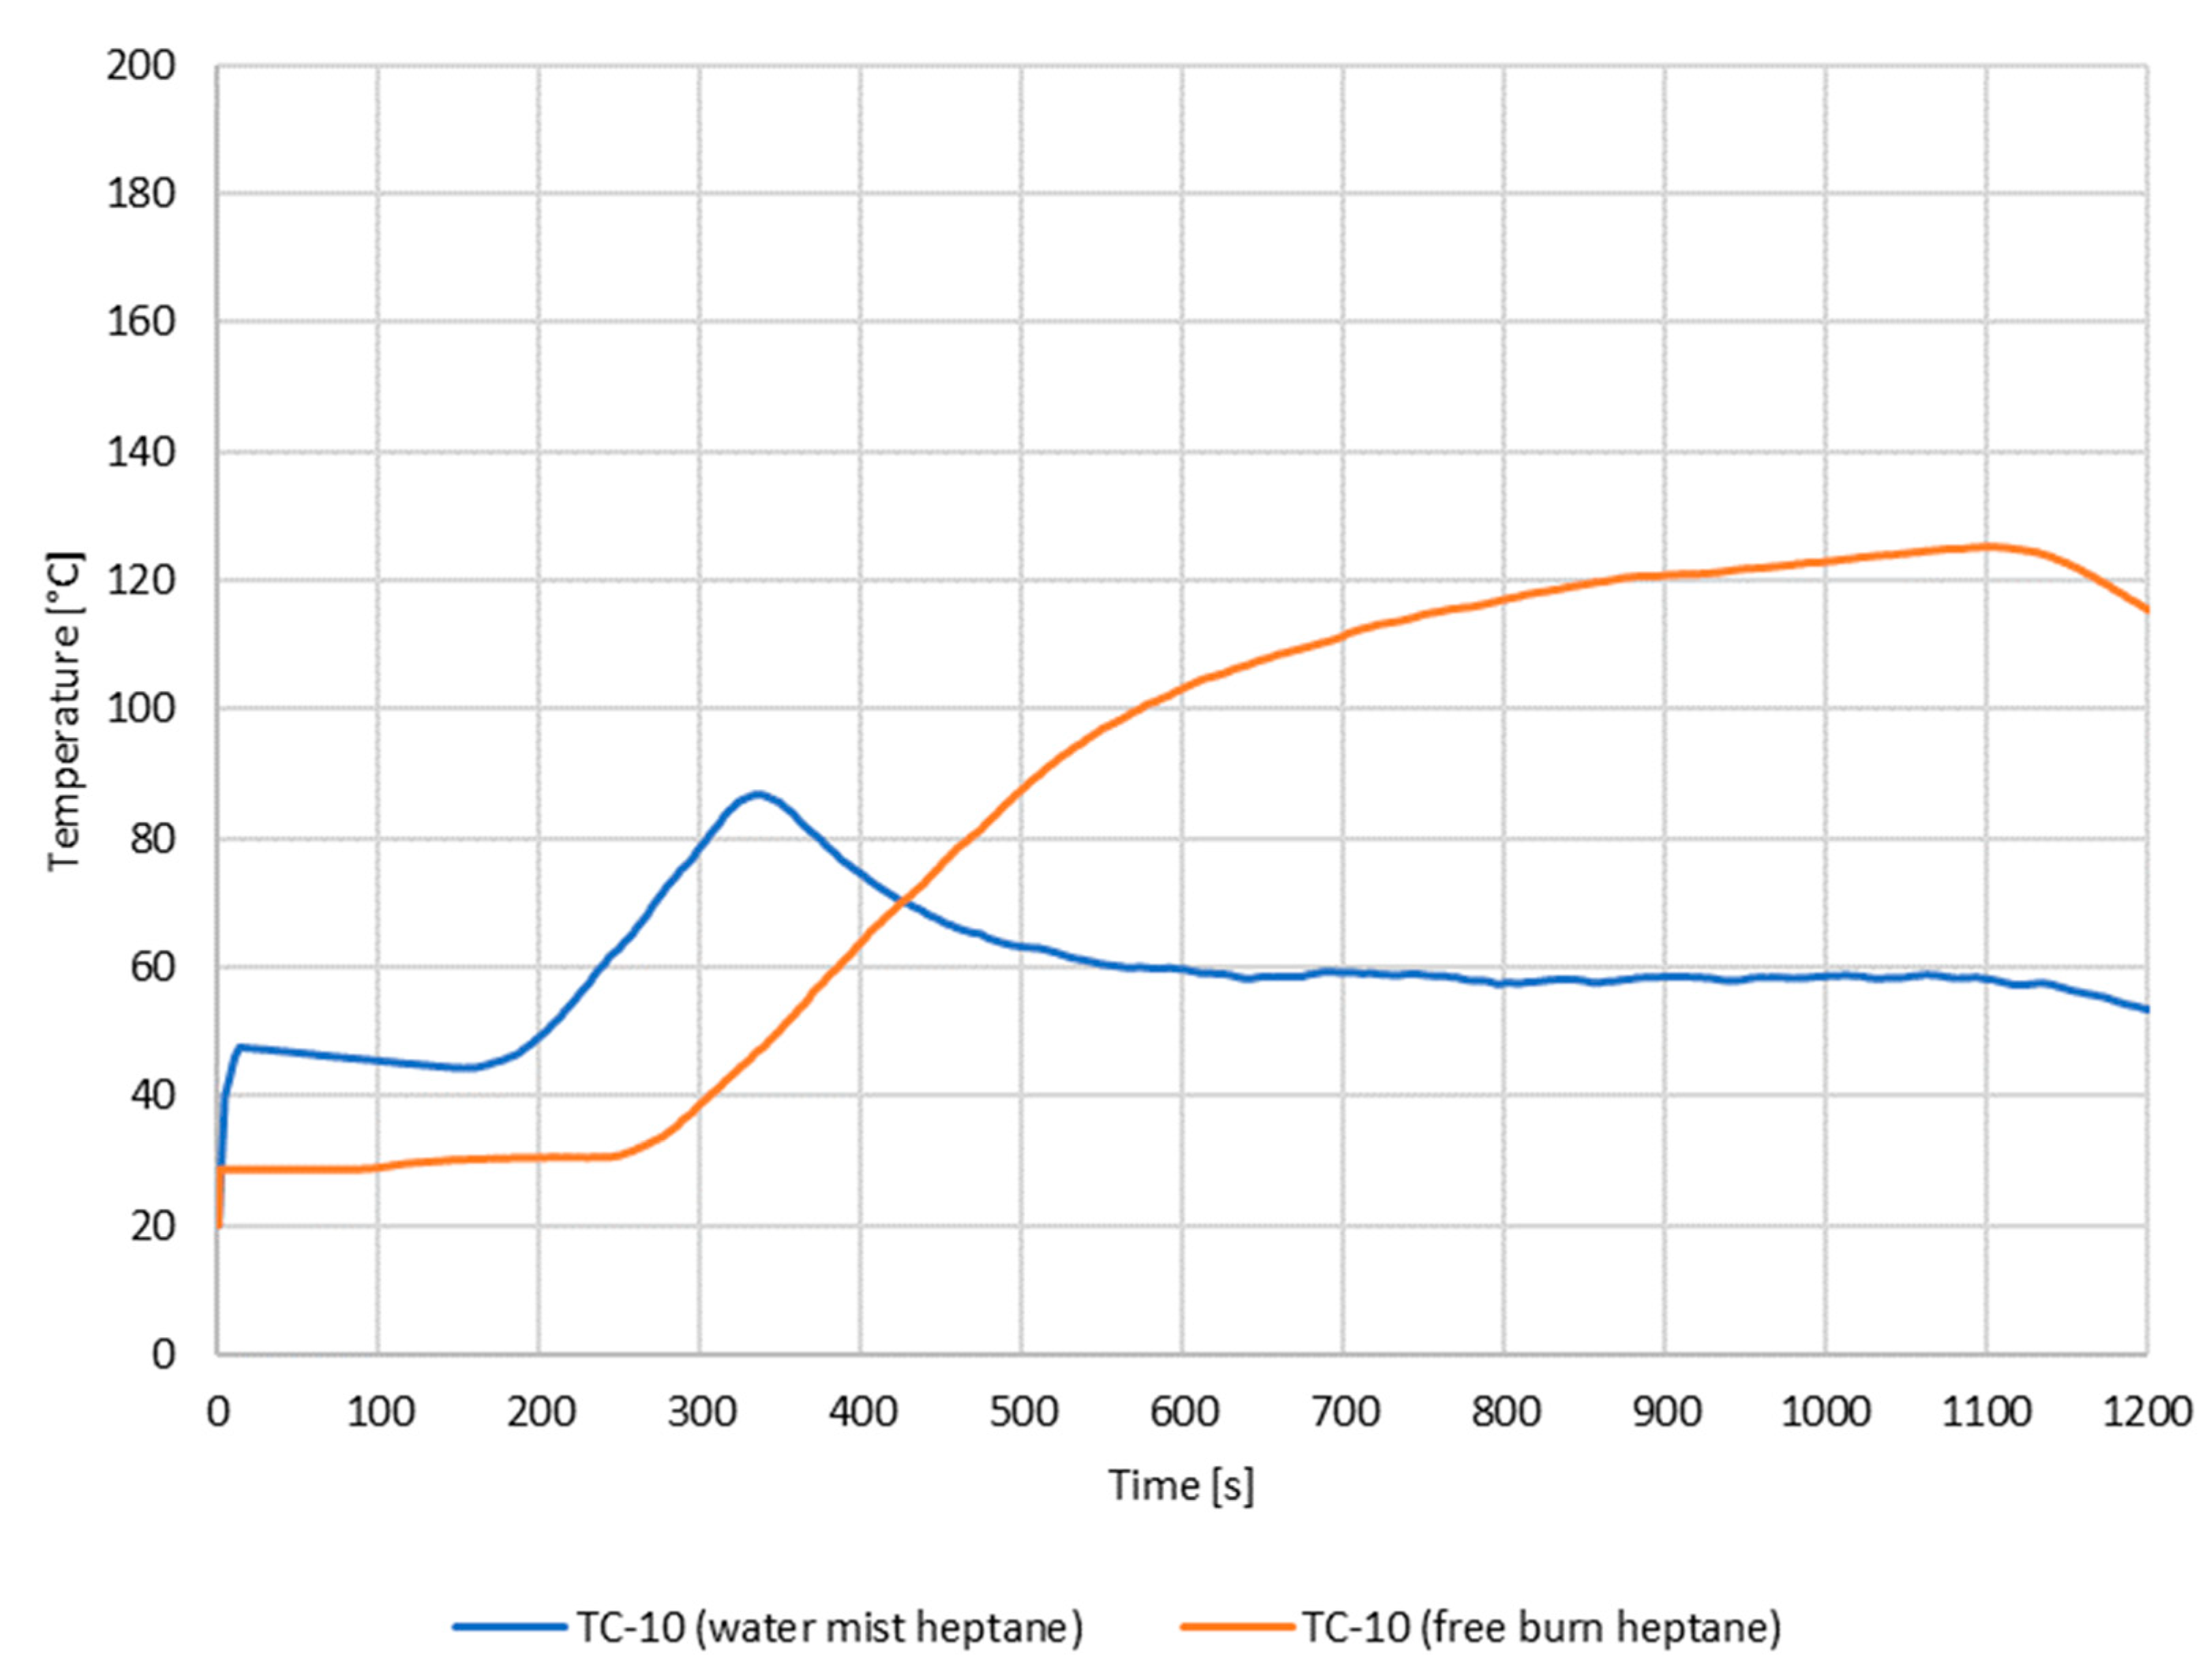
The comparison between the temperatures reached in the first and second material tests is presented in
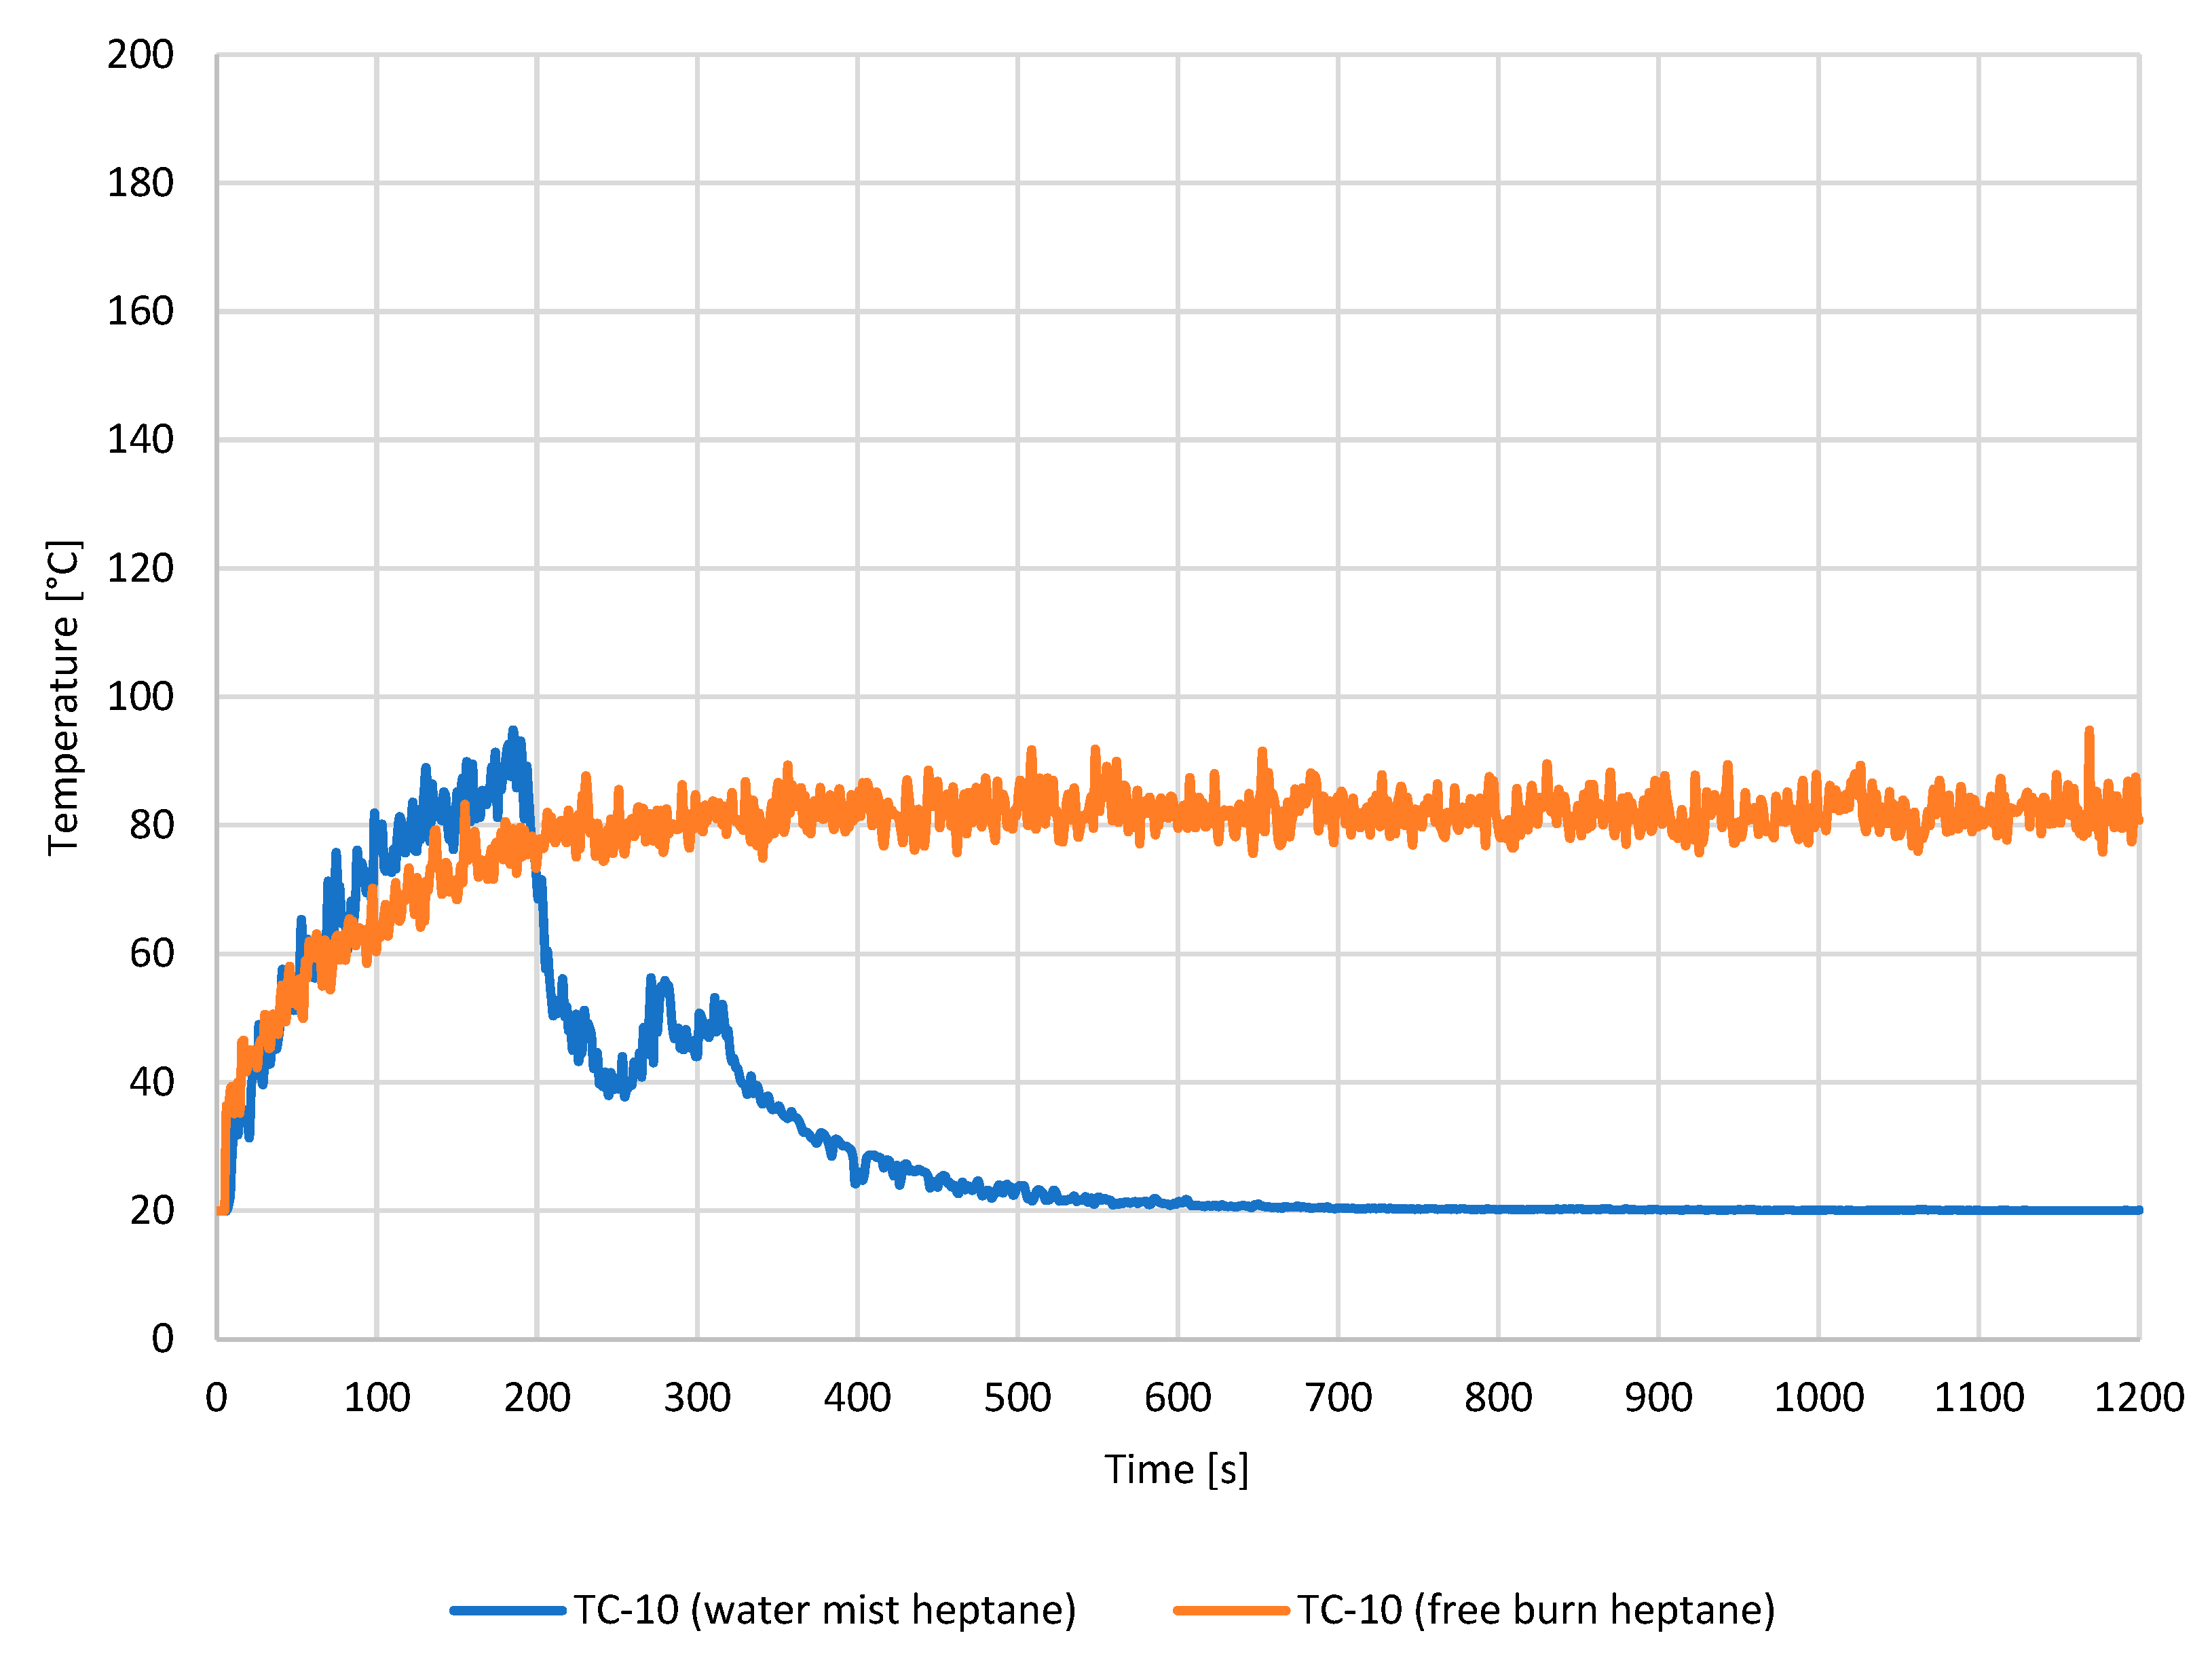
Figure 18 below. The trend of the ceiling temperature registered by TC-10 is shown, and this comparison illustrates how the fire suppression by the extinguishing system can impact the fire behavior and the progression of the fire event. The temperature values in the free burn curve are higher compared to the scenario where the water mist system is active. It is evident that effective suppression is achieved after 400 s.
The comparison between the temperatures reached in the first and second tests is presented in
Figure 19. The trend of the ceiling temperature registered by TC-10 is shown, and this comparison illustrates how the fire suppression by the extinguishing system can impact the fire behavior and the progression of the fire event. The temperature values in the free burn curve are higher compared to the scenario where the water mist system is active. It is evident that effective suppression is achieved after 400 s.
The temperatures recorded by TC-5 exhibit clear differences. In the first case (
Figure 6), the temperatures consistently remain high throughout the entire simulation. However, in
Figure 19, the temperatures recorded by TC-5 decrease rapidly after 400 s, indicating the suppressive effect of the water mist system on the fire. Similarly, a comparison between the ceiling temperatures in the free burn conditions and the suppression conditions in FDS simulation is presented in
Figure 20. In the free burn conditions, temperatures reach approximately 80 °C and remain steady throughout the simulation. In contrast, in the simulation with water mist activation, the temperature initially reaches 90 °C within the first 200 s and subsequently decreases until the end of the simulation.
4. Discussion
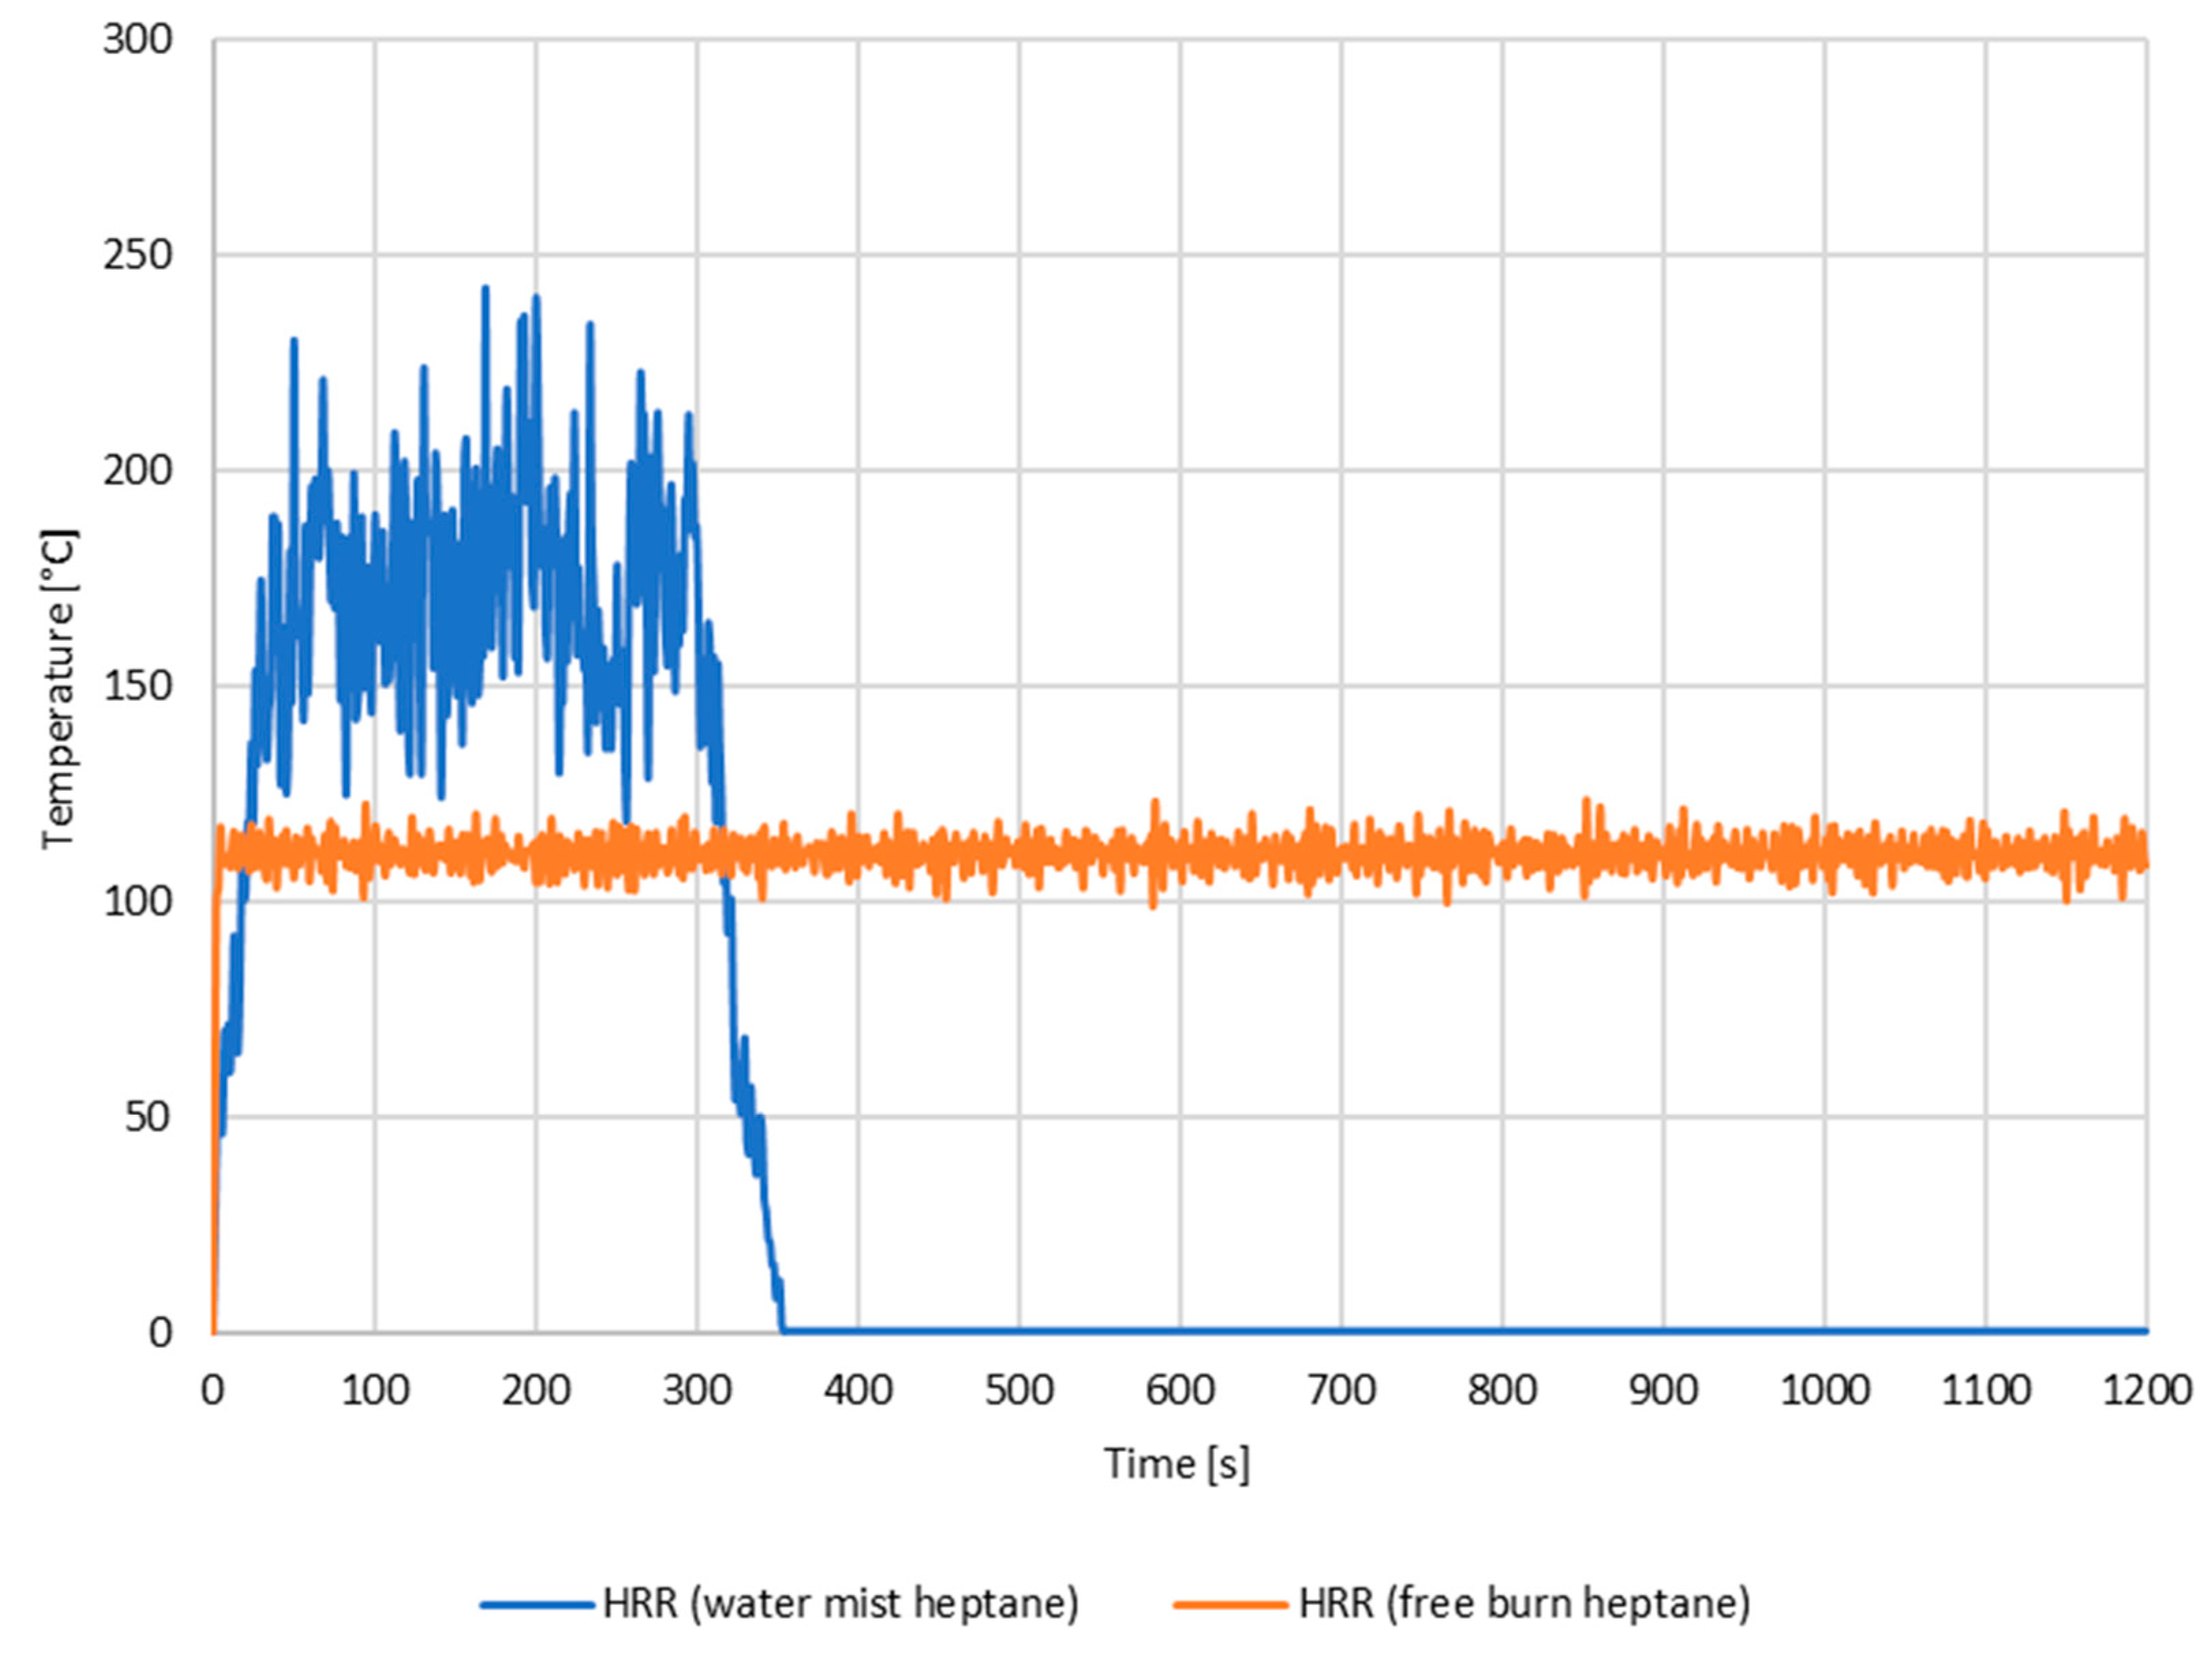
The experimental results of heat release rate (HRR) in the free burn scenario and the temperature in the compartment fire with a water mist system have provided valuable insights and raised several points for discussion. The application of water mist for fire suppression resulted in a significant reduction in HRR over a six-minute period, effectively extinguishing the fire (
Figure 21). The use of water mist systems in historical buildings is of great importance in safeguarding these invaluable structures and preserving their rich cultural heritage. Historical buildings often feature intricate architectural details, ancient artifacts, and irreplaceable artworks, making them susceptible to significant damage from fires. However, traditional firefighting methods such as sprinkler systems or foam extinguishers may cause irreversible harm to these delicate structures. In contrast, water mist systems offer a tailored solution that combines effective fire suppression with minimal water damage. The generation of fine water droplets by the system efficiently cools down the fire while minimizing the amount of water used, thereby reducing the risk of structural damage [
51]. The thermal component of the flame is considered the most critical aspect to be investigated in fire modeling [
52]. After the experimental analysis, it is important to highlight the validation part of the FDS model. The accuracy of the model’s domain (mesh size 0.1) provides the accuracy of the temperature data obtained through simulations. Validation of computational fire models is crucial for accepting the results of any model, as it ensures the accurate representation of physical phenomena. For this reason, we included a comparison of temperature trends in real-scale tests and FDS simulations in the Results section.
In order to validate the results of the simulation model used, it is possible to consider future methods of non-linear regression [
53] that can predict the behavior of the water mist system in a confined environment.
Moreover, the non-toxic nature of the mist ensures the protection of historical artifacts, paintings, and delicate materials, preventing further loss. By implementing water mist systems, historical buildings can embrace advanced fire protection technology, ensuring the longevity and preservation of these cultural treasures for generations to come.
The study highlights certain limitations and open points that can be explored further. These include the constraints associated with using simulations to verify real-scale conditions and the need to conduct a thorough investigation into the range of input conditions. This encompasses factors such as boundary conditions, fire load, and other relevant variables that play a role in the analysis. Future research could be directed towards generalizing the methodology used to different fields of application, aiming to enhance the design of fire protection systems.
