Abstract
Urbanization in China has reached a mature stage, and research on spatial quality has become an important topic in urban research. This paper employs a machine learning method using a large set of street view image data to explore the spatial quality for historical districts, specifically in terms of vitality, safety, and landscape. The Fangcheng district is taken as the research object to evaluate the spatial quality of historical blocks. The results suggest that the following: (1) The spatial quality of the Fangcheng district presents a pyramidal structure. (2) High-quality streets are mainly distributed in the core areas of historical protection and commercial areas, medium-quality streets are mainly distributed in residential areas around the core areas of the historical district, and low-quality streets are mostly streets with poor accessibility. Based on the findings, we proposed several spatial quality improvement recommendations for the Fangcheng district in Shenyang.
1. Introduction
With the rapid rate of urbanization in China, the diverse functions of streets in cities have been weakened, the original social space of streets has been shrinking, residents’ activities have shifted from outdoor to indoor, and vehicle traffic has gradually replaced pedestrian traffic, resulting in a series of problems such as traffic congestion, street inactivation, and environmental degradation [1]. Through this rapid urban development, many historical districts lose their original functionalities, such as the embodiment of culture, leading to commercialization and, therefore, the homogenization of historical blocks. As a result, an increasing number of historical blocks are becoming deserted, the number of pedestrians whose purpose is to visit historical blocks is reduced, and the spatial attraction of historical blocks is greatly reduced [2].
At present, urbanization in China has reached a mature stage, and the focus of urban planning has shifted from the policy revision of the incremental mode to the refined design of the stock mode. In other words, the goal of urban planning has shifted from the speed of development to improve the quality of space [3]. As the embodiment of the historical process and the unique features of a city, historical blocks hold great significance for urban development. Furthermore, the quality of streets reflect the cultural features of the historical district [4]. With the concept of the smart city and prevalence of big data applications (such as street view images, point of interest (POI), and DMSP/OLS nighttime light images data), it is of paramount importance to establish an evaluation system for the spatial quality of the historical districts. Furthermore, scientific and comprehensive evaluations of the spatial quality of historical blocks can provide support to improve urban images and the renewal of historical districts.
Research on street spatial quality evaluation in China and elsewhere can be divided into three aspects: qualitative research, quantitative research, and research under the background of big data. In terms of qualitative research, scholars in China and elsewhere have summarized and categorized the elements of street spatial quality from different disciplinary perspectives and roughly divided them into two dimensions: material space and subjective perception. This aspect of research has laid a solid theoretical foundation for follow-up research on street spatial quality [5,6,7,8]. However, an evaluation system for street spatial quality constructed only from the theoretical level is greatly influenced by subjectivity, especially in regard to evaluating subjective feelings. This issue limits the scientific validity and persuasiveness of the street spatial quality evaluation system. Subsequently, research on street spatial quality evaluation has gradually shifted from qualitative research to quantitative research. Based on qualitative research, quantitative research constructs a relatively scientific street spatial quality evaluation system through field investigations, questionnaires and field interviews, expert scoring methods, and the analytic hierarchy process [9,10,11]. However, the data accuracy of the traditional methods in the quantitative analysis is relatively low and the data collection process is difficult, resulting in the confinement of the research scope [12,13] and further limits to the universality of the street spatial quality evaluation system [14].
In addition, the application of big data can also shed some light on existing urban issues, such as the inaccurate depiction of utilization of urban space [15]. Scholars have established various scoring matrixes including and not limited to manual scoring [16], hue, saturation, and value (HSV) [17], semantic segmentation [18], and machine learning [14]. They have evaluated the spatial quality of streets in various contexts, touching on a wide range of domains including urban health [19], urban activities [20,21,22], urban change [23,24], built environment quality [25], urban mobility [26,27], urban perception [28,29,30,31,32,33], sidewalks [34,35], signalized intersections [36], and so on.
There have been many studies on the evaluation of urban street spatial quality, but there are few studies on the evaluation of street spatial quality in historical blocks. Additionally, most of them are based on research on urban public space quality. Although previous studies have introduced street view image data, they are limited by the large amount of data and difficult processing techniques. Thus, most of them select only a small number of street view image data for manual scoring. Few studies have analyzed a large amount of street view image data, meaning that research has not fully utilized the advantages of big data and that the scientificity and universality of the quality evaluation system for historical blocks are limited. The machine learning approach provides the capability to classify massive amounts of street view images rapidly, incorporating multi-dimensional characteristics, which are lacking comparing to the traditional methods [37]. Street space is complex and needs a more comprehensive and unified evaluation system. The combination of street view image data and machine learning methods has made it possible to achieve large-scale, high-precision, and multidimensional street spatial quality evaluations of historical blocks [38].
The Fangcheng district is one of the oldest historical district in China. It was constructed originally in Qing Dynasty, and it witnessed the rise and fall of the urban development to this day. The Shenyang Fangcheng Renovation project with the theme of “a City in the City of Shenyang” was launched on 29 July 2022. Therefore, we take a look at the Fangcheng district in the city of Shenyang, Liaoning. It is surrounded by four streets: Dongshuncheng Street, Nanshuncheng Road, Xishuncheng Street and, Beishuncheng Road. Both the east-west and north-south direction lengths are 1.3 km, and the overall area covers approximately 1.7 km2. This paper takes the Fangcheng district as the research object and selects street view image data and POI data to establish a historical block street spatial quality evaluation database. Machine learning is used to semantically segment street view image data, and a spatial quality evaluation system for historical blocks is constructed based on three aspects: vitality, safety, and landscape. On this basis, the street spatial quality of the Fangcheng district is evaluated, and corresponding quality improvement recommendations are proposed for the three different levels of high-, medium-, and low-quality streets in the Fangcheng district.
2. Methodology
2.1. Data Sources
- (1)
- Road Network Data
First, the road network data were crawled through the OSM (OpenStreetMap) using Python. Then, the crawled road network was rectified and calibrated by combining field research and street view images. Finally, all roads were processed into single lines by converting multilane roads into single-lane roads, and thus created the vector data for the Fangcheng district (Figure 1).
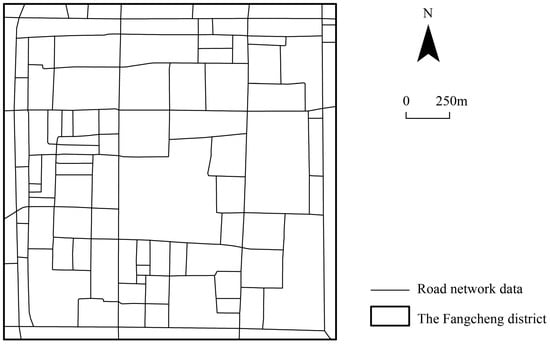
Figure 1.
Vector diagram of the road network data.
- (2)
- POI data
The POI data for various categories within the scope of the Fangcheng district were obtained through Python software and the Gaode Map application programming interface (API). The dataset contains 2765 entries, which are divided into 13 types of businesses, including shopping, catering, medical treatment, commerce, science and education, transportation, sports, companies and enterprises, public facilities, life services, financial services and insurance, accommodation services, and government agencies. The 13 types of POI were reclassified into three categories (Table 1): B (commercial service facilities), R (residential facilities), and S (road and transportation facilities).

Table 1.
List of POI data reclassification.
- (3)
- Street view image data
The street view image data of the Fangcheng district were obtained from the Baidu Street View Map API through Python; the sampling distance of this study is set as 30 m. The field of vision (FOV) parameter (the horizontal direction range of street view image shooting) in the crawling program was set to 90 degrees, which means that each sampling point is crawled from four directions: front, back, left, and right (as shown in Figure 2). Thus, the total image set is 9562 street view images after the classification process.
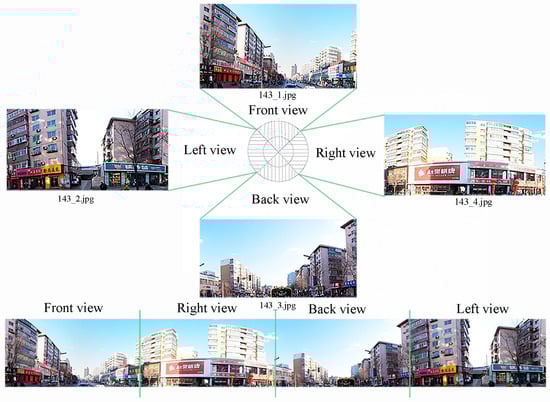
Figure 2.
The street view image data.
After crawling the street view image data, semantic segmentation was performed on the acquired street view image data [39]. Through the algorithm, the street images have been classified into 18 types, including sidewalks, roads, cars, buses, trucks, electric vehicles, streetlamps, traffic lights, monitors, indicators, people, walls, architecture, skyscrapers, trees, grass, plants, and the sky (as shown in Figure 3). In addition, we use python to calculate the pixel proportion of each type of element for the street view image dataset, and then perform the semantic segmentation process for all images.
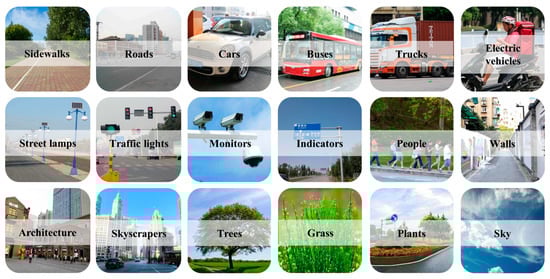
Figure 3.
Intelligently recognized elements of street view images.
2.2. Methods
2.2.1. Selection of Measurement Indexes of the Spatial Quality of Historical Blocks
Urban vitality, urban safety, and urban landscape are important indicators of city quality [40,41]. Researchers believed that spatial vitality could be defined through diverse human activities and interactions [42]. Therefore, spatial vitality was measured using the convenience index, diversity index, and crowd concentration index. In the computer vision community, traditional street visual quality indicators (such as enclosure, greenery, openness, and visual pavement) are commonly evaluated using physical components extracted from street view image data [43,44], with the view index of vegetation, building, sky, and road as the most representative indicators among them [45]. Therefore, we calculated the walking index, vehicle interference index, interface transparency index, interface enclosure index, green visibility index, and sky visibility index from the extracted physical components. Then, they are cataloged into safety and landscape.
By summarizing the measurement index of urban street spatial quality at different scales and combining the availability of relevant data, this paper used street view image data and POI data to catalog them into nine indexes based on three aspects: vitality, safety, and landscape (Table 2).
Table 2.
List of quality evaluation indexes of historical blocks.
2.2.2. Evaluation System for the Spatial Quality of Historical Blocks
In order to deal with the various magnitude of each measurement index in this historical district, the data is standardized through the dimensionless pure value conversion to calculate the weight of the measurement index.
Further, to minimize the substantial influences on spatial evaluation of the above measurement indexes, we invited five college professors and five students with relevant backgrounds to make pairwise comparisons for manual scorings to evaluate the spatial quality of the Fangcheng district. Finally, the weight of each measurement index of the spatial quality evaluation of historical blocks was determined by using the analytic hierarchy process (AHP). The final weight of each index was obtained through the consistency test, and then we established the spatial quality evaluation system for the Fangcheng district. The weight and type of each measurement indicator are shown in Table 3.
Table 3.
Street spatial quality evaluation system for historical blocks.
3. Results
3.1. Overall Quantification of Street Spatial Quality
3.1.1. The Overall Numerical Distribution Presents an Obvious Pyramidal Structure
The overall quality score of the Fangcheng district is obtained through normalizing and assigning weights to each quality measurement index. The statistical results suggest that the total quality score is in the range of [0.247, 0.631], with an average of 0.471. The overall numerical distribution presents an evident pyramidal structure (Figure 4). As shown in Figure 4, most of the streets are medium quality, while the number of high-quality and low-quality streets are small. Among them, 81.86% of the streets are distributed in the range of [0.400, 0.550] and fluctuate around the average of the total score of street spatial quality. The proportion of streets with street spatial quality values less than 0.400 is 9.22%, and the proportion of streets with street spatial quality values greater than 0.550 is 8.92%. With the increase in the distance between the street spatial quality score and the average value, the street sample size gradually decreases.
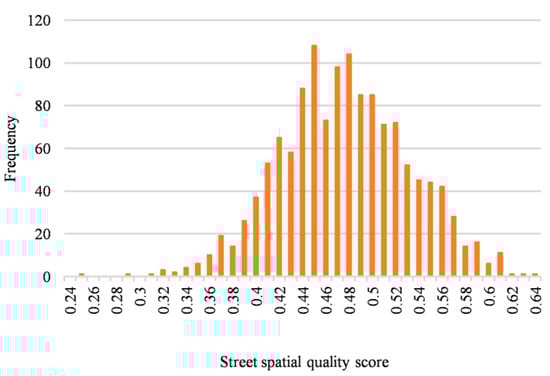
Figure 4.
Numerical statistics of the street spatial quality evaluation of the Fangcheng district.
3.1.2. Medium-Quality Streets Occupy a Dominant Position
The overall quantitative analysis of the evaluation of the spatial quality of the Fangcheng district shows an obvious pyramidal structure. However, the specific and accurate numerical segmentation points cannot be obtained, and the evaluation of the spatial quality of the Fangcheng district cannot be accurately classified. In this paper, by drawing the scatter plot of the spatial quality evaluation of the Fangcheng district, it is found that there are five key points in the overall value distribution (Figure 5): one key point of the highest value ①, one key point of the lowest value ②, one key point of the average value ③, and two key points that are abrupt inflection points in the slope (④ and ⑤). It is obvious that the spatial quality of the Fangcheng district can be divided into three quality intervals through the two abrupt inflection points in the slope. The first interval is composed of key points ① to ④, constituting high-quality streets. The score of street spatial quality is distributed in the range of [0.570, 0.631], accounting for only 5.8%. The second interval is composed of key points ④ to ⑤, constituting medium-quality streets. The score of street spatial quality is distributed in the range of [0.370, 0.570], accounting for 92.12%. The third interval is composed of key points ⑤ to ②, constituting low-quality streets. The score of street spatial quality is distributed in the range of [0.247, 0.370], accounting for only 2.08%. Overall, medium-quality streets dominate the street space of Shenyang Fangcheng.
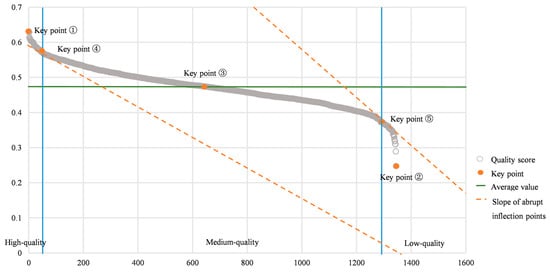
Figure 5.
Classification of the street spatial quality of the Fangcheng district.
In 1986, when the State Council announced the second batch of national famous historical and cultural cities, the concept of protecting historical blocks was formally proposed given that a large number of historical blocks had disappeared and the historical features were seriously damaged. Included in the second batch of national famous historical and cultural cities announced by the State Council, the Fangcheng district is dominated by medium-quality streets. It can be seen that some achievements have been made in the protection of historical and cultural blocks in China. However, there are still some low-quality streets in the Fangcheng district, indicating that in the long process of transformation and renovation, there are still some spatial landscapes and traditional environments that have been damaged. Additionally, medium-quality streets, which occupy a large proportion, still have great room for improvement. These spaces will be the key to improving the spatial quality of the Fangcheng district in the future.
3.2. Spatial Quality of Streets in Fangcheng District
We use the isoline construction tools in ArcGIS (10.8) to depict and analyze the street spatial qualities. Figure 6 illustrates the three spatial quality of streets. The darker the color, the higher the street spatial quality.
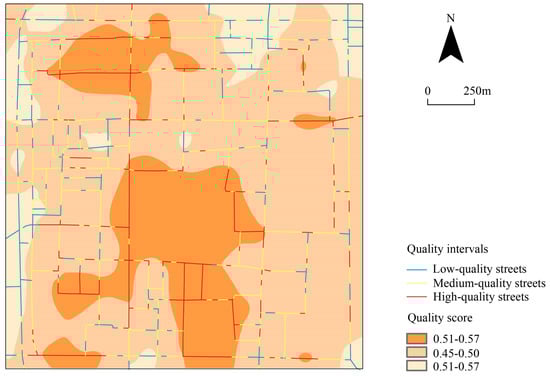
Figure 6.
Spatial distribution of the street spatial quality evaluation of the Fangcheng district.
From the spatial distribution of high-quality streets, high-quality streets in the Fangcheng district are mainly distributed in the center of the historical preservation district and key commercial areas. Within the Fangcheng district, the Shenyang Imperial Palace and Marshal Zhang’s Mansion belong to the National Historical Preservation Program. For the center of the historical preservation district, the government has a relatively large investment and perfect management system. Thus, the street quality in this core area is evidently higher than that in other areas. The main commercial area is Shenyang Zhong Street, formerly known as Siping Street, which is a commercial area with a long history and has been one of the economic center in Shenyang. It has a history of more than 300 years dating back to the Ming Dynasties. Similar to the other ancient capital cities in China, the Fangcheng district was also built according to the planning concept of “the imperial court in front, the market behind, the ancestral shrine on the left and the community on the right”. The northern part of the Fangcheng district was originally Siping Street formed by some historical establishment. With the expansion of Siping Street and the change of some old tile-roofed shops into two- or three-story buildings, a commercial concentration area has gradually formed, and the “Siping Night Market” has become one of the eight scenic spots in Shenyang. After years of development, Zhong Street has become one of the most prosperous street in the city of Shenyang, and even in the Northeast part of the country. The surrounding amenities are abundant, and the street environment is relatively pleasing. In this case, the density of high-quality streets is higher and concentrated in the shape of strips in Zhong Street.
As shown in Figure 6, we discovered that the medium-quality streets mostly concentrated in the residential areas surrounding the center of historical preservation areas. The Fangcheng district is located in the central area of the city, and its favorable geographical location and well-developed supporting facilities attract a large number of people to live in the Fangcheng district. The high population and building density has brought enormous pressure to the street spatial quality in the Fangcheng district. Meanwhile, during the old district renovation campaign in the 1980s, a large number of traditional residential buildings in Fangcheng district were gradually demolished under the pretext of shantytown renovation and replaced by identical multistorey residential buildings. As a result, this led to the residential communities with varying heights and spatial forms that fail to meet the requirements for historical architecture preservation. Moreover, the street facades also lack harmony and coherence. Due to these factors, many medium-quality streets have emerged in the residential neighborhoods surrounding the historic and cultural conservation zone in the center of the Fangcheng district.
Comparatively, the spatial distribution of low-quality streets in the Fangcheng district is quite dispersed. According to onsite investigations, most low-quality streets turn out to be streets with poor (transport) accessibility, located around some open parking lots in Fangcheng district. The street layout of Fangcheng district was formed during the Kyoto Castle period spanning over 300 years of history. Many urban side streets are narrow (as compared to other main road today), and underground space development is inadequate, making it difficult to adapt to the traffic pattern dominated by motor vehicles in modern society.
3.3. Section Line Analysis of Street Spatial Quality
Section line analysis is employed in this section to explore the relationship between changes in the details of spatial street quality and the corresponding street spaces in the Fangcheng district. The locations traversed by the section line can reflect certain areas where such details undergo changes. Therefore, section line analysis is adopted to examine the changes in the specifics of street space quality in the Fangcheng district. Based on the spatial distribution characteristics of street spatial quality in the Fangcheng district, we used the 3D analysis module in ArcGIS to exam the spatial quality distribution in the Fangcheng district. Zhengyang Street, Chaoyang Street, and the central line were selected as section lines in the north-south direction, while Zhong Street, Shenyang Road, and the central line were selected as the section lines in the east-west direction. The location diagram of the section lines is shown in Figure 7. By referring to the street spatial quality contour map of the Fangcheng district, the quality evaluation values of the sections were extracted from ArcGIS based on the section line positions depicted in Figure 7. Ultimately, six profile curves of quality evaluation data were obtained, as shown in Figure 8.
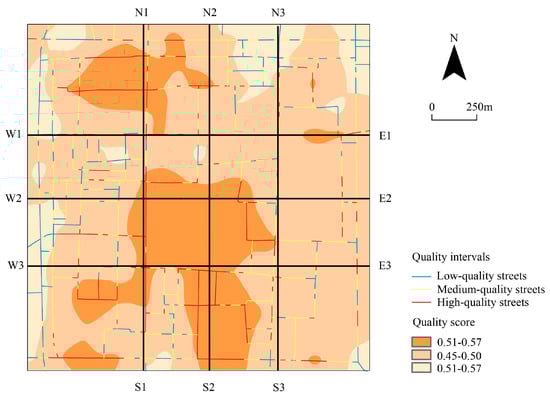
Figure 7.
Section line location diagram.
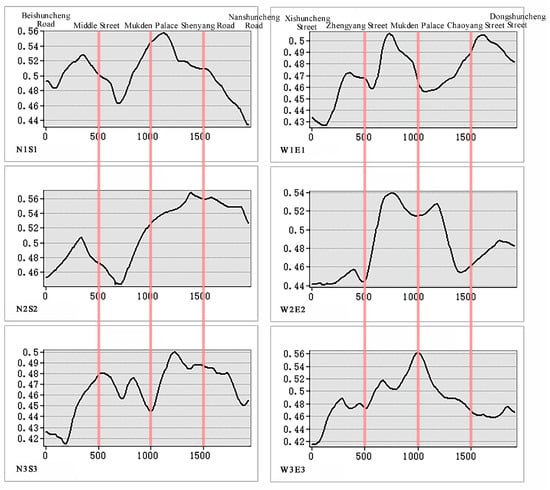
Figure 8.
Section diagram of street spatial quality in the NS and WE directions of the main streets.
As shown in Figure 8, the area intersected by which the six streets spatial quality section lines pass exhibit numerous fluctuations. Judging from the north–south street space quality profiles, the three positions generally manifest the same value distribution. The street spatial quality from Beishuncheng Road to Zhong Street displays an upward trend, peaking at Zhong Street. The street spatial quality from Zhong Street to the Shenyang Imperial Palace presents a downward trend and then rises again, and peaks at the Shenyang Imperial Palace, surpassing that of Zhong Street. From the Shenyang Imperial Palace to Nanshuncheng Road, the street spatial quality continues to decline. Overall, the Shenyang Imperial Palace has a greater radiation effect on the street spatial quality in the north-south direction, and the section lines of the three positions are all affected by the radiation effect of the Shenyang Imperial Palace.
Judging from the east–west street space quality profiles, the latter two positions generally exhibit the same value distribution. The street space quality from Xishuncheng Street to the Shenyang Imperial Palace keeps increasing, peaking at the Shenyang Imperial Palace, whereas that from the Shenyang Imperial Palace to Dongshuncheng Street continues decreasing. However, the section line at the first position displays a “trough” at the Shenyang Imperial Palace, signifying that the Shenyang Imperial Palace exerts little impact on the street space quality of this cross section.
In summary, based on a comparative analysis of the horizontal and vertical section line analysis, it can be concluded that the Shenyang Imperial Palace has a greater stimulating effect on the street spatial quality in the north–south direction in the Fangcheng district.
4. Discussion
In order to improve the spatial quality of historical districts, it is necessary to propose accurate improvement policy suggestions for streets of different spatial quality: (1) For high-quality streets, we should further enhance spatial vitality on the basis of existing well-functioning spatial carriers of the streets and optimize the layout of supporting facilities to optimize high-quality streets. (2) For medium-quality streets, we should solve the problems existing in the street space one by one through supervision and guidance to achieve a leap from medium-quality streets to high-quality streets. (3) For low-quality streets, we should take more effective control, standardization, and other measures to comprehensively improve the current situation of low-quality streets.
4.1. Policies Suggestions for High-Quality Street Improvement
First, revitalization of the historical district, especially the cultural symbols and characteristics, are critically important. The over-development of modern commerce has had a strong impact on traditional commerce. The disappearance of traditional “street craftsmanship” such as washing and dyeing, darning, and various kinds of maintenance in the heart of the historical district have lead to the loss of traditional cultural traits in the heart of residents. We believe decision makers should consider restoring those so that it would help recoup cultural foundation within the city and further pursue economic benefits in the high-quality streets.
Secondly, we should tap into cultural resources to create a vibrant Fangcheng district. The Fangcheng district has witness socioeconomic changes since the Qing Dynasty; from the stories of Nurhaci occupying Shenyang, Huang Taiji establishing Shengjing in Shenyang, the Qing government’s construction of Shengjing, to the Republic of China’s transformation of Shengjing they are all related to the Fangcheng district. In this case, the cultural resources of the Fangcheng district, historical sites, Manchu culture, and traditional folk arts of Northeast China can all be used as vessels for inheriting its culture. Therefore, by increasing facilities such as small theaters and museums, new norms of development would incorporate both industrial and cultural development, enrich the function of the space, and improve its quality.
4.2. Policies Suggestions for Medium-Quality Street Improvement
First, the buildings on both sides of medium-quality streets should be gradually improved. Some of the previous renovation attempts have inappropriately addressed the existing issues in the Fangcheng district; specifically, some multi-storey buildings and a few high-rise buildings have been built, causing inconsistency in the spatial form (especially in terms of the skyline of the buildings). For future renovations, rebuilds, and expanded buildings, reasonable control measures should be exercised. Decision makers should create guidelines and standards for building revitalization in the historical district. For instance, policies should ensure that the height, exterior decoration, and color of buildings surrounding the historical and cultural protection area are consistent and harmonious within the district.
Second, the population of the Fangcheng district should be appropriately reduced. For a long time, the high population and building density in the Fangcheng district has had a negative impact on the overall quality of street spatial construction. In order to foster the street quality, it is necessary to gradually reduce the population in the Fangcheng district, and one of the possible approach could be to provide some economic control. For example, maintain the high real estate prices and increase the cost of living inside the Fangcheng district. With the reduced population, the floor–area ratio will also decrease. We should try to increase the vegetation coverage in the extra area by planting more trees, flower stands, and shrubs to increase the green visibility of the streets. In terms of the existing buildings, the rebuilt land of multi-storey residential buildings can be restored to the traditional courtyard form of the Fangcheng district, such as “Liu Xiejiang’s Courtyard” and “Huangjia Dayuan”. This will not only improve the quality of street space in the Fangcheng district but also inherit the original texture of the blocks.
4.3. Policies Suggestions for Low-Quality Street Improvement
First, temporary buildings and illegal buildings on both sides of low-quality streets should be demolished. The basic road network of the Fangcheng district was formed during the prosperous period of Shengjing City and, thus, some of the roads are narrow in width by today’s standards. In addition, the maintenance and management of those roads were insufficient. Therefore, the roads and buildings should be the priority in order to improve the street quality in the Fangcheng district. Additionally, the internal branch road system should be organized on the basis of maintaining the original urban space texture to strengthen the traffic capacity of the streets in the Fangcheng district.
Second, we could collaborate with various interest groups and policy-makers to reroute the traffic within the Fangcheng district. As the commercial center of the city, Zhong Street has attracted incalculable numbers of vehicles, resulting in the escalation of congestion. In this case, we should take east-west Shuncheng Street and south-north Shuncheng Road as links to coordinate the urban traffic system and reduce the flow of automobiles entering the Fangcheng district by means of channeling traffic, restricting one-way traffic, limiting traffic at specific times of a day, and implementing sections to ensure the smooth passage of internal vehicles. At the same time, based on urban subways, underground space can be used more efficiently in order to accommodate the flow of people.
5. Conclusions
This paper examines street spatial quality by constructing a street-scale evaluation system for historical districts based on overall quantification and spatial distribution using street view images. Specifically, we focus on the vitality, safety, and landscape. The overall street spatial quality of the Fangcheng district presents a pyramidal structure in its numerical distribution; most streets are medium-quality. In terms of the spatial distribution, high-quality streets are mainly distributed in the core area of historical protection, medium-quality streets are mainly distributed in residential areas close to the historical district and its cultural protection areas, and low-quality streets are associated with poor traffic accessibility. Based on these findings, this paper proposes corresponding spatial quality improvement recommendations for high-, medium- and low-quality streets.
There are several directions for further research. Firstly, there are some limitations with the Baidu Image datasets; they are not up to time, which would potentially affect the results. In future studies, Microsoft images, Weibo data, or Xiaohong Shu image datasets can reflect the streets more accurately. Second, in terms of the research methods, this study used machine learning to identify the semantic elements of street view image data and finally identified only 18 elements. However, the characteristics and identity of urban space refer to not only the physical conditions of the settings but also the social, cultural, artistic, historical, and ecological qualities of space [46]. In follow-up research, relevant street view image element identification can be achieved through continuous dataset training, and the specific disorder of urban street space can be further studied. Third, although the presented method has been able to measure the quality of streets scientifically and effectively, there are still some deviations in the measurement results of streets. For example, the hutongs with high-quality in the traditional sense may be low-quality when measured using the presented method. In follow-up research, a more scientific and perfect street space quality evaluation system can be built by combining street view image data and traditional data.
Author Contributions
Writing—original draft, Y.W.; Writing—review & editing, C.X. All authors have read and agreed to the published version of the manuscript.
Funding
This research was funded by the National Natural Science Foundation of China (Grant No. 41871162).
Data Availability Statement
Not applicable.
Conflicts of Interest
The authors declare no conflict of interest.
References
- Liu, H.; Liu, J.; Li, M.; Gou, P.; Cheng, Y. Assessing the Evolution of PM2.5 and Related Health Impacts Resulting from Air Quality Policies in China. Environ. Impact Assess. Rev. 2022, 93, 106727. [Google Scholar] [CrossRef]
- Throsby, D. Investment in Urban Heritage Conservation in Developing Countries: Concepts, Methods and Data. City Cult. Soc. 2016, 7, 81–86. [Google Scholar] [CrossRef]
- Chen, C.; Li, H.; Luo, W.; Xie, J.; Yao, J.; Wu, L.; Xia, Y. Predicting the Effect of Street Environment on Residents’ Mood States in Large Urban Areas Using Machine Learning and Street View Images. Sci. Total Environ. 2022, 816, 151605. [Google Scholar] [CrossRef]
- Li, M.; Liu, J.; Lin, Y.; Xiao, L.; Zhou, J. Revitalizing Historic Districts: Identifying Built Environment Predictors for Street Vibrancy Based on Urban Sensor Data. Cities 2021, 117, 103305. [Google Scholar] [CrossRef]
- Nyunt, M.S.Z.; Shuvo, F.K.; Eng, J.Y.; Yap, K.B.; Scherer, S.; Hee, L.M.; Chan, S.P.; Ng, T.P. Objective and Subjective Measures of Neighborhood Environment (NE): Relationships with Transportation Physical Activity among Older Persons. Int. J. Behav. Nutr. Phys. Act. 2015, 12, 108. [Google Scholar] [CrossRef]
- Lee, C.; Moudon, A.V. Correlates of Walking for Transportation or Recreation Purposes. J. Phys. Act. Health 2006, 3, S77–S98. [Google Scholar] [CrossRef]
- Lin, L.; Moudon, A.V. Objective versus Subjective Measures of the Built Environment, Which Are Most Effective in Capturing Associations with Walking? Health Place. 2010, 16, 339–348. [Google Scholar] [CrossRef]
- Naik, N.; Philipoom, J.; Raskar, R.; Hidalgo, C. Streetscore—Predicting the Perceived Safety of One Million Streetscapes. In Proceedings of the 2014 IEEE Conference on Computer Vision and Pattern Recognition Workshops, Columbus, OH, USA, 23–28 June 2014; pp. 793–799. [Google Scholar]
- Nasar, J.L. The Evaluative Image of the City. J. Am. Plan. Assoc. 1990, 56, 41–53. [Google Scholar] [CrossRef]
- Humpel, N.; Owen, N.; Iverson, D.; Leslie, E.; Bauman, A. Perceived Environment Attributes, Residential Location, and Walking for Particular Purposes. Am. J. Prev. Med. 2004, 26, 119–125. [Google Scholar] [CrossRef]
- Montello, D.R.; Goodchild, M.F.; Gottsegen, J.; Fohl, P. Where’s Downtown? Behavioral Methods for Determining Referents of Vague Spatial Queries. Spat. Cogn. Comput. 2003, 3, 185–204. [Google Scholar] [CrossRef]
- Griew, P.; Hillsdon, M.; Foster, C.; Coombes, E.; Jones, A.; Wilkinson, P. Developing and Testing a Street Audit Tool Using Google Street View to Measure Environmental Supportiveness for Physical Activity. Int. J. Behav. Nutr. Phys. Act. 2013, 10, 103. [Google Scholar] [CrossRef]
- Seiferling, I.; Naik, N.; Ratti, C.; Proulx, R. Green Streets—Quantifying and Mapping Urban Trees with Street-Level Imagery and Computer Vision. Landsc. Urban. Plan. 2017, 165, 93–101. [Google Scholar] [CrossRef]
- Zhang, F.; Zhou, B.; Liu, L.; Liu, Y.; Ratti, C.; Lin, H.; Fung, H. Measuring Human Perceptions of a Large-Scale Urban Region Using Machine Learning. Landsc. Urban. Plan. 2018, 180, 148–160. [Google Scholar] [CrossRef]
- Ye, Y.; Richards, D.; Lu, Y.; Song, X.; Zhuang, Y.; Zeng, W.; Zhong, T. Measuring Daily Accessed Street Greenery: A Human-Scale Approach for Informing Better Urban Planning Practices. Landsc. Urban. Plan. 2019, 191, 103434. [Google Scholar] [CrossRef]
- Ewing, R.; Handy, S.; Brownson, R.C.; Clemente, O.; Winston, E. Identifying and Measuring Urban Design Qualities Related to Walkability. J. Phys. Act. Health 2006, 3, S223–S240. [Google Scholar] [CrossRef]
- Li, X.; Zhang, C.; Li, W.; Ricard, R.; Meng, Q.; Zhang, W. Assessing Street-Level Urban Greenery Using Google Street View and a Modified Green View Index. Urban. For. Urban. Green. 2015, 14, 675–685. [Google Scholar] [CrossRef]
- Atif, N.; Bhuyan, M.; Ahamed, S. A Review on Semantic Segmentation from a Modern Perspective. In Proceedings of the 2019 International Conference on Electrical, Electronics and Computer Engineering (UPCON), Aligarh, India, 8–10 November 2019; pp. 1–6. [Google Scholar]
- Kang, Y.; Zhang, F.; Gao, S.; Lin, H.; Liu, Y. A Review of Urban Physical Environment Sensing Using Street View Imagery in Public Health Studies. Ann. GIS 2020, 26, 261–275. [Google Scholar] [CrossRef]
- Zhang, F.; Zu, J.; Hu, M.; Zhu, D.; Kang, Y.; Gao, S.; Zhang, Y.; Huang, Z. Uncovering Inconspicuous Places Using Social Media Check-Ins and Street View Images. Comput. Environ. Urban. Syst. 2020, 81, 101478. [Google Scholar] [CrossRef]
- Yao, Y.; Zhang, J.; Qian, C.; Wang, Y.; Ren, S.; Yuan, Z.; Guan, Q. Delineating Urban Job-Housing Patterns at a Parcel Scale with Street View Imagery. Int. J. Geogr. Inf. Sci. 2021, 35, 1927–1950. [Google Scholar] [CrossRef]
- Hawes, J.K.; Gounaridis, D.; Newell, J.P. Does Urban Agriculture Lead to Gentrification? Landsc. Urban. Plan. 2022, 225, 104447. [Google Scholar] [CrossRef]
- Naik, N.; Kominers, S.D.; Raskar, R.; Glaeser, E.L.; Hidalgo, C.A. Computer Vision Uncovers Predictors of Physical Urban Change. Proc. Natl. Acad. Sci. USA 2017, 114, 7571–7576. [Google Scholar] [CrossRef]
- Byun, G.; Kim, Y. A Street-View-Based Method to Detect Urban Growth and Decline: A Case Study of Midtown in Detroit, Michigan, USA. PLoS ONE 2022, 17, e0263775. [Google Scholar] [CrossRef]
- LI, S.; Ma, S.; Tong, D.; Jia, Z.; Li, P.; Long, Y. Associations between the Quality of Street Space and the Attributes of the Built Environment Using Large Volumes of Street View Pictures. Environ. Plan. B Urban. Anal. City Sci. 2022, 49, 1197–1211. [Google Scholar] [CrossRef]
- Zhang, F.; Wu, L.; Zhu, D.; Liu, Y. Social Sensing from Street-Level Imagery: A Case Study in Learning Spatio-Temporal Urban Mobility Patterns. ISPRS J. Photogramm. Remote Sens. 2019, 153, 48–58. [Google Scholar] [CrossRef]
- Li, M.; Sheng, H.; Irvin, J.; Chung, H.; Ying, A.; Sun, T.; Ng, A.Y.; Rodriguez, D.A. Marked Crosswalks in US Transit-Oriented Station Areas, 2007–2020: A Computer Vision Approach Using Street View Imagery. Environ. Plan. B Urban. Anal. City Sci. 2023, 50, 350–369. [Google Scholar] [CrossRef]
- Dubey, A.; Naik, N.; Parikh, D.; Raskar, R.; Hidalgo, C.A. Deep Learning the City: Quantifying Urban Perception at a Global Scale. In Proceedings of the Computer Vision—ECCV 2016, Amsterdam, The Netherlands, 11–14 October 2016; Leibe, B., Matas, J., Sebe, N., Welling, M., Eds.; Springer International Publishing: Cham, the Switzerland, 2016; pp. 196–212. [Google Scholar]
- Kruse, J.; Kang, Y.; Liu, Y.-N.; Zhang, F.; Gao, S. Places for Play: Understanding Human Perception of Playability in Cities Using Street View Images and Deep Learning. Comput. Environ. Urban. Syst. 2021, 90, 101693. [Google Scholar] [CrossRef]
- Guan, F.; Fang, Z.; Wang, L.; Zhang, X.; Zhong, H.; Huang, H. Modelling People’s Perceived Scene Complexity of Real-World Environments Using Street-View Panoramas and Open Geodata. ISPRS J. Photogramm. Remote. Sens. 2022, 186, 315–331. [Google Scholar] [CrossRef]
- Inoue, T.; Manabe, R.; Murayama, A.; Koizumi, H. Landscape Value in Urban Neighborhoods: A Pilot Analysis Using Street-Level Images. Landsc. Urban. Plan. 2022, 221, 104357. [Google Scholar] [CrossRef]
- Qiu, W.; Zhang, Z.; Liu, X.; Li, W.; Li, X.; Xu, X.; Huang, X. Subjective or Objective Measures of Street Environment, Which Are More Effective in Explaining Housing Prices? Landsc. Urban. Plan. 2022, 221, 104358. [Google Scholar] [CrossRef]
- Wei, J.; Yue, W.; Li, M.; Gao, J. Mapping Human Perception of Urban Landscape from Street-View Images: A Deep-Learning Approach. Int. J. Appl. Earth Obs. Geoinf. 2022, 112, 102886. [Google Scholar] [CrossRef]
- Kang, B.; Lee, S.; Zou, S. Developing Sidewalk Inventory Data Using Street View Images. Sensors 2021, 21, 3300. [Google Scholar] [CrossRef]
- Ning, H.; Ye, X.; Chen, Z.; Liu, T.; Cao, T. Sidewalk Extraction Using Aerial and Street View Images. Environ. Plan. B Urban. Anal. City Sci. 2022, 49, 7–22. [Google Scholar] [CrossRef]
- Li, W.; Long, Y.; Kwan, M.-P.; Liu, N.; Li, Y.; Zhang, Y. Measuring Individuals’ Mobility-Based Exposure to Neighborhood Physical Disorder with Wearable Cameras. Appl. Geogr. 2022, 145, 102728. [Google Scholar] [CrossRef]
- Liu, Y.; Chen, M.; Wang, M.; Huang, J.; Thomas, F.; Rahimi, K.; Mamouei, M. An Interpretable Machine Learning Framework for Measuring Urban Perceptions from Panoramic Street View Images. iScience 2023, 26, 106132. [Google Scholar] [CrossRef]
- Wang, J.; Biljecki, F. Unsupervised Machine Learning in Urban Studies: A Systematic Review of Applications. Cities 2022, 129, 103925. [Google Scholar] [CrossRef]
- Yao, Y.; Liang, Z.; Yuan, Z.; Liu, P.; Bie, Y.; Zhang, J.; Wang, R.; Wang, J.; Guan, Q. A Human-Machine Adversarial Scoring Framework for Urban Perception Assessment Using Street-View Images. Int. J. Geogr. Inf. Sci. 2019, 33, 2363–2384. [Google Scholar] [CrossRef]
- Lopes, M.N.; Camanho, A.S. Public Green Space Use and Consequences on Urban Vitality: An Assessment of European Cities. Soc. Indic. Res. 2013, 113, 751–767. [Google Scholar] [CrossRef]
- Meng, Y.; Xing, H. Exploring the Relationship between Landscape Characteristics and Urban Vibrancy: A Case Study Using Morphology and Review Data. Cities 2019, 95, 102389. [Google Scholar] [CrossRef]
- Wu, C.; Ye, Y.; Gao, F.; Ye, X. Using Street View Images to Examine the Association between Human Perceptions of Locale and Urban Vitality in Shenzhen, China. Sustain. Cities Soc. 2023, 88, 104291. [Google Scholar] [CrossRef]
- Tang, J.; Long, Y. Measuring Visual Quality of Street Space and Its Temporal Variation: Methodology and Its Application in the Hutong Area in Beijing. Landsc. Urban. Plan. 2019, 191, 103436. [Google Scholar] [CrossRef]
- Zhou, H.; He, S.; Cai, Y.; Wang, M.; Su, S. Social Inequalities in Neighborhood Visual Walkability: Using Street View Imagery and Deep Learning Technologies to Facilitate Healthy City Planning. Sustain. Cities Soc. 2019, 50, 101605. [Google Scholar] [CrossRef]
- Gong, F.-Y.; Zeng, Z.-C.; Zhang, F.; Li, X.; Ng, E.; Norford, L.K. Mapping Sky, Tree, and Building View Factors of Street Canyons in a High-Density Urban Environment. Build. Environ. 2018, 134, 155–167. [Google Scholar] [CrossRef]
- Li, H.; Cui, G.; Zhou, X. Quality, characteristics, and identity protection of urban space in the internet era. Landsc. Archit. Front. 2020, 8, 110. [Google Scholar] [CrossRef]


Disclaimer/Publisher’s Note: The statements, opinions and data contained in all publications are solely those of the individual author(s) and contributor(s) and not of MDPI and/or the editor(s). MDPI and/or the editor(s) disclaim responsibility for any injury to people or property resulting from any ideas, methods, instructions or products referred to in the content. |
© 2023 by the authors. Licensee MDPI, Basel, Switzerland. This article is an open access article distributed under the terms and conditions of the Creative Commons Attribution (CC BY) license (https://creativecommons.org/licenses/by/4.0/).