Abstract
This study explored the overall visual elements of arcade buildings and streetscapes from the perspective of tourists and then evaluated their influence on the identity and emotion of places. The scope of the research was to take the arcade building in the port area of Shantou Small Park in Guangdong, China, and apply the eye-tracking experiment method and semantic difference method. This entailed collecting the eye-tracking data of 16 people, implementing 334 questionnaires for evaluation, verifying the correlation between the visual elements and place identity emotions, and then screening out the visual elements that affect place identity through correlation analysis and multiple linear regression analysis. The results show that plaque text morphological richness (p = 0.045 < 0.05, and the regression coefficient B = 0.146), the color brightness of plaque text (p = 0.031 < 0.01, and the regression coefficient B = 0.171), window morphological richness (p = 0.038 < 0.05, and the regression coefficient B = 0.106), window color brilliance (p = 0.047 < 0.01, and regression coefficient B = 0.094), and plant color brilliance (p = 0.029 < 0.05, and the regression coefficient B = 0.154) are five visual element evaluation factors that have a significant correlation with the identity and emotion of places. Although the fineness of architectural decoration is negatively correlated with place identity, it is not obviously significant. The research results provide reference for the visual control design of arcade buildings.
1. Introduction
The perception of the visual environment, with aesthetic experience as the core, is the core issue of research in the fields of urban architecture, streetscape protection and planning, and urban landscapes [1]. Individuals visit buildings and streets with a certain character, and their visual environments provide emotional meaning through an emotional connection between people and place, while also being a source of satisfaction and pleasure for tourists [2]. In the urban spatial environment, people perceive the landscape of urban streets through the visual environment and understand the social value of the existence of historical streets [3]. In addition, people’s perception of the environment and their imagination and understanding of geographic space also construct their concept of spatial sense of place [4]. Arcade architecture and street landscapes have typical regional characteristics. For instance, Western architectural styles and forms introduced into China have been adapted to the Chinese culture and physical environment, while also retaining traces of historical memory [5]. This can inform an environmental model for studying the historical streetscapes of Lingnan. In order to understand how the visual environment of architecture and street style affect visitors’ place identity emotions, it is particularly important to construct the relationship between the visual elements of architecture and street style and identity emotions, and the results can be used as the basis for architectural style protection and visual control.
1.1. Visual Perception
Since the 1980s, with the rapid development of visual evaluation research, the object of visual perception evaluation has shifted from natural ecology to the coexistence of natural ecology and the human landscape. In recent years, eye-tracking technology has provided a new perspective for the quantification of the visual perception of streets and built environments for tourist places [6]. By observing eye behavior and visual responses, cognitive processes in the brain can be inferred [7], and their perceptual results can be transformed into visualized eye-movement heat distribution and eye-movement behavior data. Among them, in the study of street environment, through eye-tracking experiments, it is found that the morphological elements of the street interface affect the livability of the street environment [8], validating that the distinctive visual elements in the field of architectural heritage attract more visual attention [9]. However, in terms of specific visual environment creation practices, most planning guidelines and policies in China for traditional architectural heritage, such as arcade streetscapes, only provide general recommendations and lack research and policy focus on the specific visual perception of buildings and streetscapes [10]. The ambiguity of the visual perception control of buildings and streetscapes leads to the destruction of the coordination and integrity of urban styles [11]. Preserving architectural heritage and street features is essential to maintaining, developing, and improving the quality of the built environment [12].
1.2. Visual Environment and Place Identity Theory
The theory of place identity originated from “Topophilia”, expressing the special emotional connection between people and the environment [13]. In the 1980s, the concept of place identity was introduced into environmental psychology. It refers to the process of socialization by which individuals or groups interact with places: the “socialized self of the objective world” [14]. In terms of theoretical dimensions, place identity has been confirmed to be positively correlated with familiarity, belonging, environmental preference, meaning, cultural atmosphere, and childhood memory, and it has been empirically demonstrated through psychometrics [15]. Physical environment elements form the specific context and environment of tourists’ place identity, but most of the research related to place identity theory is carried out around human geography, environmental psychology, and other disciplines, and the research on physical environment elements is limited. In the fields of urban residential areas and green landscapes, previous studies have found that the spatial scale [16], the amount of natural vegetation [17], and other physical environment elements have a direct relationship with identity emotions; however, this has not been verified within the field architectural and street visual environment. In summary, exploring the influence of physical visual elements on identity emotion within the theoretical dimension of place identity is the value and significance of this study at the theoretical level.
This study aims to construct the connection between the visual elements and identity emotions of arcade building facades and street styles in tourists’ field of view. Because people perceive their surrounding environment and identify their physical environment by visually processing most of the sensory data, one can understand people’s internal psychological responses by observing the visual behavior characteristics of their eyeballs [18]. As a tool to record the eye movements of participants viewing sample pictures, eye-tracking technology analyzes the differences in visual behavior of different visual elements by screening the key visual elements of the sample pictures [19]. The SD method was used to collect the subjective evaluations of the visual elements of arcade buildings and streetscapes, and the relationship between the visual elements and place identity emotions was constructed. Based on a review of the relevant literature and the research purposes, the following hypotheses and research framework are proposed (Figure 1).
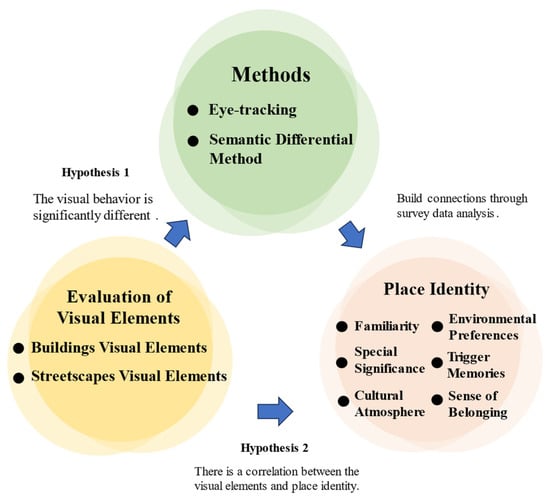
Figure 1.
Conceptual framework of the correlation between arcade architecture, street visual elements, and place identity.
Hypothesis 1.
The visual behaviors of tourists viewing different categories of arcade buildings and visual elements of streetscapes are significantly different.
Hypothesis 2.
There is a significant correlation between the visual elements of arcade architecture and street style and the sense of place identity.
2. Materials and Methods
2.1. Study Area
This study was conducted in the Shantou Small Park opening area of Shantou City, Guangdong Province, China. The arcade and street in the port area of Shantou Small Park are typical representatives of arcade buildings and streets in Lingnan overseas Chinese townships. Built in 1926, the Shantou Small Park port area ushered in a golden age and high commercial prosperity, and it still retains many historical buildings and an open-port street pattern. In July 2016, the Shantou Urban and Rural Planning Bureau identified an area in the Shantou Small Park area that was rich in cultural relics from the port-opening period. The historical buildings are concentrated in subsections that can fully and truly reflect the historical and cultural style of the port-opening period of the Shantou Small Park port-opening area (Figure 2).
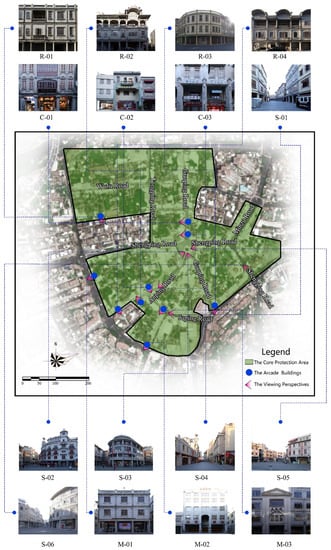
Figure 2.
Distribution of core area and sample buildings in Shantou Small Park.
As can be seen from the above picture, the streets in the port area of Shantou Small Park are fan-shaped radial road network structures, and the core area covers a total area of 72.43 hectares. The arcade buildings in the port area of Shantou Small Park have unique characteristics, and they are divided into residential buildings, commercial buildings, and landmark buildings according to their functions. The architectural styles are mainly eclecticism, the decorative style, and the modernist style. These architectural styles are highlighted in the façade structure and decoration of the arcade. The composition form of the façades of arcade buildings is generally divided into three vertical sections: upper, middle, and lower, with the lower section dominated by doors, columns, and other elements, the middle section dominated by walls, windows, pilasters, waistlines, and other elements, and the upper section dominated by mountain flowers, roofs, and other elements. These complex and diverse decorative and structural elements combine the classical Western column vocabulary with the local residential tradition, forming an eclecticism with regional characteristics conducive to forming the rich visual effects of arcades.
2.2. Eye-Tracking Experiments
2.2.1. Photograph Selection
Under the same imaging technology and weather conditions, 700 images of the façades and streetscapes of arcade buildings in the port area of Shantou Small Park were taken with a camera and a 16 mm lens as the shooting equipment. In total, 5 experts were invited to divide the arcade according to the function and completeness of the street, and a total of 16 image samples of arcade buildings and streetscapes were selected and numbered, including 4 residential arcade buildings, 3 monumental arcade buildings, 3 commercial arcade buildings, and 6 arcade streetscapes. However, due to the limited width of the streets, the image range of C-01 and C-03 could only include the middle and lower façade elements of arcade buildings within the normal field of view of people. The image samples are 4500 × 3600 dpi pixels and have a length-to-width ratio of 4:5.
2.2.2. Participants
During the study, 16 individuals who had been to the arcade buildings in the port area of Shantou Small Park were invited to participate in eye-tracking experiments, and all participants saw the image samples for the first time, with uncorrected or corrected vision of 1.0 or higher and no color weakness or color blindness. The participants were between 20 and 40 years old, their majors were related to architecture (n = 9) and nonarchitecture (n = 6), and they had professional backgrounds in industrial design, physics, chemistry, computer science, and so on.
2.2.3. Procedure
Considering the interference effect of light on the eye-tracking experiment, the experiment was conducted in the laboratory of the School of Innovation and Design of the City University of Macau, with curtains to block the outdoor light source. The internal lighting of the laboratory ensured the light environment control of the experimental environment. Tobii Pro Spectrum, made by a Swiss company, was used to record the eye-tracking data, and the images were displayed on a 23.8-inch (2560 × 1600 dpi, 600 Hz) computer screen. When the participants were familiar with the experimental environment and had agreed to the experiment, they were guided to sit 60–65 cm away from the screen for the experiment.
First, the experimenter explained the purpose, procedure, and requirements of the experiment to the subject, and after the participant understood the experiment, the experimenter calibrated the eye tracker and automatically played 16 image samples. Each image sample’s playback time lasted 15 s, and there was a 2 s blank interval between the pictures to relieve eye fatigue and concentration.
After the eye-tracking experiment, a retrospective interview was conducted, and the content of the interview was related to the details of the visual elements of the images, including the participant’s feelings and sensitivity to the image features. Each experiment lasted about 16 min, the introduction and preparation before each experiment was about 4 min, the eye-tracking-experiment process was about 8 min, and the retrospective interview time was about 4 min (Figure 3).
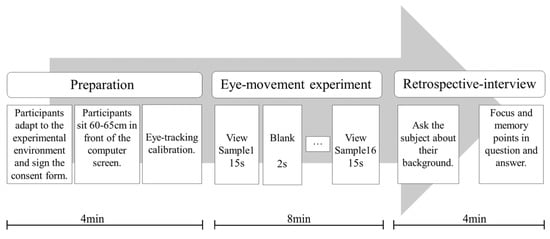
Figure 3.
Experimental procedure.
2.2.4. Data Analysis
The eye-tracking data were processed by Tobii Pro Lab (v1.194), the required indicators were extracted, and the eye-tracking data and questionnaire results were imported into SPSS21.0 for statistical analysis and screened by sampling rate (>80%) and calibration accuracy and precision (<0.65). A total of 2 participants whose data did not meet the requirements were excluded; thus, we included valid eye-tracking data from 14 people.
To explore the visual behavior characteristics of the participants’ areas of interest in the images, we analyzed the results of the eye-tracking indicator data. We selected 6 indicators from the AOIs to study the visual preferences of the participants, including the total fixation duration (TFD), fixation count (FC), the time before first fixation (TFF), first fixation duration (FFD), average fixation duration (AFD), and visit count (VC). These six indicators could accurately reflect the visual behavior characteristics of the participants [20]. Table 1 shows the specific content of each indicator.

Table 1.
Meanings of eye-movement metrics.
2.2.5. Defining the AOI
The applied region of interest was used to explore the relationship between eye-movement behavior and the visual world and to determine the AOIs in the sample according to the main fixed elements of the picture to analyze the spatial visual elements of the image samples used in this study. We divided the image information into two categories: the individual building class and the streetscape class. The image elements of a single building are mainly the visual elements of the building façade, including roofs, walls, windows, doors, columns, plaques, and text, and the streetscape image elements include not only architectural elements but also paving, pedestrians, vehicles, facilities, plants, and other visual elements of the street environment. These areas are divided into each other as shown in Figure 4.
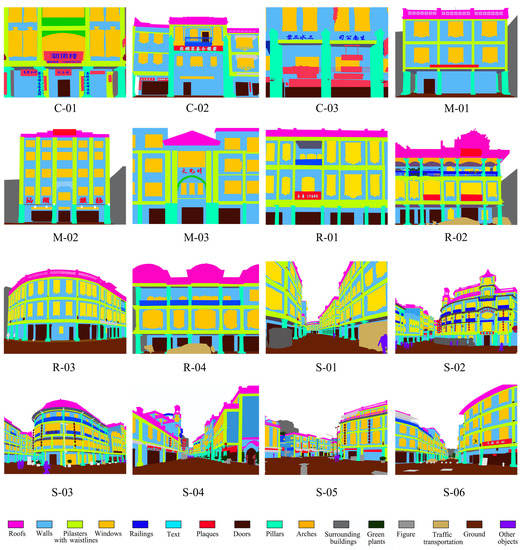
Figure 4.
AOIs of elements.
2.3. Semantic Differential Method
2.3.1. Questionnaire Design
After the eye-tracking experiment and retrospective interview study phase, 16 real-world photos were used, the same as those of the eye-tracking experiment, using the semantic difference method (SD). The visual elements of the images were described and quantified, and the degree of identity was psychologically measured by incorporating the dimension of place identity. The questionnaire was based on tourists in the port area of Shantou Small Park as the subjects, and the visual elements were preliminarily screened according to the distribution of eye-movement heat. Six experts in architecture-related specialties were invited to select five evaluation indicators, such as the morphological complexity, proportional coordination, and scale suitability of the visual elements of buildings and streets, as well as corresponding clear and easy-to-understand adjectives (Table 2). The Likert 5-level scale method was used to divide the adjective ranks, corresponding to 1, 2, 3, 4, and 5.
Table 2.
SD evaluation indicators and adjective pairs.
2.3.2. Participants
A total of 350 questionnaires were randomly distributed in the port-opening area of Shantou Small Park, and a total of 350 questionnaires were distributed in combination with online questionnaires. The questionnaire collection duration was from 15 March 2023 to 15 April 2023, with a total of 334 valid questionnaires and an effective rate of 97.4%.
3. Results
3.1. Eye-Tracking Heat Distribution Results and Analysis
After the eye-tracking experiment and retrospective interview, we analyzed the eye-movement data collected through Tobii Pro Lab (v1.194), generated an eye-movement heat map of the image, and sorted out the visual elements corresponding to the visual hot spots that appeared in the image (Table 3).
Table 3.
Characteristics of eye-movement heat distribution for arcade buildings and streetscapes.
Taking the heat distribution of Figure C-01 as an example, the windows, door columns, plaques, and textual visual elements in the figure draw high attention, their colors are dark red and orange-red, and the “●” mark is used. The pilasters draw attention to the waistlines, but they are not obvious, their color is light-green in light spots, and the “◎” mark is used. The walls do not receive high attention, have no thermal distribution or light-green light spots, and are marked with “○”. The roofs and arch elements are not reflected in the figure, and the “╳” mark is used. The interpretation of other heat-map identification situations is the same, and this method can quickly filter the visual elements of the heat distribution.
It can be seen from the figure that at the level of the building façade, the subjects paid more attention to visual elements such as plaques and text, windows, and decoration around windows, and their colors were dark red and orange-red. The visual elements of the wall are not highly concerning, and they show no thermal distribution or light-green light spots. In the eye-movement heat map of the street scene, due to the visual perspective, the subject’s focus was on the distant visual vanishing point; thus, the visual vanishing point was dark red. At the level of visual elements, the visual elements of buildings, such as text, signboards, window-cover decorations, roofs, and other nearby elements, as well as the visual elements of the environment, such as pedestrians and cars in the near area, are dark red and dark green; however, there is no thermal distribution or light-green light spots for visual elements such as paving and facilities.
By comparing the eye-movement heat distribution, we speculated that the difference in the eye-movement heat distribution is affected by the visual perspective, on the one hand, and by the complexity and vividness of the decorative form of the visual elements, on the other hand, which is also an important aspect that reflects the influence of Western architecture on arcade architecture. This view was also confirmed in retrospective interviews. Through the interview Q&A session, the participants also mentioned that what impressed them were the decorative elements of the visual elements of the building façades and the text information, which is consistent with the results of the heat map. However, some participants proposed that the images of the building façades could not convey the sense of atmosphere in the scene, and that the streetscapes were more like the scene that the tourists actually saw in reality.
Through the collation of the visual elements corresponding to the eye-movement heat map and hot spots, the visual elements were preliminarily screened, and the ones that drew significant attention more than three times were selected (Table 4), which provided support for the screening and setting of the visual elements of the questionnaire.
Table 4.
Selected visual material elements.
3.2. Visual Behavior Characteristics of Elements
We randomly selected one image of eye-tracking indicators with different categories of arcade buildings and street features as the data source, and we used the total fixation duration (TFD), fixation count (FC), time before the first fixation (TFF), first fixation duration (FFD), and eye-tracking metric data collection and collation for the average fixed duration (AFD) and visit count (VC) (Table 5).
Table 5.
Visual element eye-tracking indicator data.
It can be seen that when tourists view arcade building facades and streetscape scenes, they spend the least time and the most time in fixation count (FC) visual behavior, and the time before the first fixation visual behavior takes the least time. The average fixation duration (AFD) standard deviation and variance values are the smallest, indicating that the data differ from each other and the fluctuation range is small. The standard deviation and variance values of the time before the first fixation (TFF) are small, indicating that the eye-movement difference and data-fluctuation amplitude are large. At the level of visual elements, the participants spent the most time on visual behavior related to windows and plaques, indicating that they were interested in these two visual elements.
In order to better understand the differences among the eye-tracking indicators of different visual elements, a one-way ANOVA of the eye-tracking indicators of architectural visual elements was carried out (Table 6). However, because there were people and vehicles among the environmental visual elements and they only appeared in the streetscape images, an ANOVA could not be performed for environmental elements; thus, this study mainly analyzed the variance in the eye-tracking indicators of the architectural visual elements.
Table 6.
ANOVA for eye-tracking indicators of different visual elements.
The results show that, based on the p-value > 0.05 of the average fixed duration (AFD) eye-tracking index data, there was no significant difference in the data. The time to first fixation duration (FFD) showed significance at the 0.05 level, with the total fixation duration (TFD), fixation count (FC), time before first fixation (TFF), and visit count (VC) showing significance at the 0.01 level.
Among the different visual element eye-tracking indicators, the window element had the strongest prominence. In particular, there is a clear difference between the visual elements of doors and columns. The windows had the longest total fixation duration (TFD), indicating that they were more likely to attract the attention of the participants. For the AFD and FC eye-tracking indicators, the values of windows and plaque text were higher, which also indicated that the participants had the greatest difficulty in extracting information from the windows and plaque text, and the greatest cognitive load. The overall trend of the FFD, TFF, and VC eye-tracking indicators was basically consistent with the TFD trend. In summary, through the analysis of eye-tracking indicators, the visual behaviors of tourists viewing arcade buildings and street features were measured in terms of the first fixation duration (FFD), total fixation duration (TFD), fixation count (FC), time before the first fixation (TFF), and visit count (VC), and they are significantly different for all five factors; thus, we verified that Hypothesis 1 holds.
3.3. Questionnaire Data Results and Analysis
3.3.1. Questionnaire Validity Test
A total of 334 pieces of questionnaire data were imported into SPSS21.0 software for reliability and validity testing. The results show that the reliability test A value is >0.7, indicating that the overall questionnaire reliability is good. KMO = 0.897 > 0.8 with the p-value (sig.) = 0.000 < 0.05, which was highly significant, and the questionnaire passed the KMO check sum and Bartlett’s spherical test (Table 7).
Table 7.
Questionnaire validity reliability test results.
3.3.2. Correlation Analysis
In order to verify that Hypothesis 2 is true, the subjective evaluation of the visual elements of arcade buildings and street features and the emotional dimension of place identity were analyzed by double-variable Pearson correlation. The correlation results are as follows (Table 8).
Table 8.
Correlation analysis.
From the results in the table, the following can be obtained:
(1) A total of 12 visual evaluation factors’ correlations with the intrinsic dimension of place identity showed significance at the level of 0.05; a total of 19 visual evaluation factors’ correlations with the intrinsic dimension of place identity showed significance at the level of 0.01.
(2) From the perspective of the visual element category, the evaluation factor of plaque text on the façades of arcade buildings had the strongest correlation with place identity, and the evaluation factor of plaque text showed that a significant correlation of the value of the trigger-recall correlation coefficient with the theoretical dimension of place identity was the highest (0.188). The evaluation factor of green plants in the visual elements of the street landscape had the highest correlation with the dimension of place identity and identity attitude, and the correlation coefficient value of environmental preference between the evaluation factor of plant color brightness and the dimension of place identity theory was the highest (0.185).
(3) From the perspective of the evaluation factor categories, the significance evaluation factor of decorative refinement and the correlation coefficient of place identity emotion are negative; thus, decorative refinement has a negative-correlation relationship with the place identity emotion, and the other significance evaluation factors have a positive correlation coefficient with the place identity emotion. Thus, the evaluation of form richness, color brightness, scale suitability, and proportional coordination have a positive-correlation relationship with the place identity emotion.
(4) The absolute value of the correlation coefficient between the evaluation factors showing a significant correlation and the identification emotion was <0.3, indicating that these 31 influencing factors were weakly correlated with the identification effective relationship.
3.3.3. Linear Regression Results and Analysis
In order to verify the common visual elements and their significances that affect the identity emotion in different types of arcade buildings and streetscapes, multiple linear regression analysis was used to set the dependent variable as the identity attitude (that is, the “identification emotion for arcade buildings and streetscapes”). The independent variable is the evaluation factor of each visual element, and the model summary, ANOVA results (Table 9), and coefficient table results (Table 10) were obtained through analysis.
Table 9.
Multiple linear regression model results.
Table 10.
Multiple linear regression model data table.
From the results of the overall regression model data in the above table, the following was found:
(1) F = 1.678, and p = 0.038 < 0.05, representing the significance of the model at the level of 0.05. The model passed the F test, the whole was linearly related to the dependent variable, and the model was established.
(2) The adjusted R2 takes into account the number of arguments used to predict the target variable and can determine whether adding a new variable to the model will increase the fit of the model. The adjusted R2 value was 0.175, which represented that 35 influencing factors could explain 17.5% of the reasons for the change in identification emotion (that is, 17.5% of attachment emotion was caused by these 35 influencing factors), and the model fit was average.
(3) Durbin–Watson (D–W value) = 1.939, which is close to 2, indicating that no autocorrelation was generated, which is consistent with data independence.
According to the significance and correlation coefficients of the independent and dependent variables, the following was obtained:
(1) According to the morphological richness of the plaque text as an independent variable (p = 0.045 < 0.05, and regression coefficient B = 0.146), color brightness of the plaque text (p = 0.031 < 0.01, and regression coefficient B = 0.171), window morphological richness (p = 0.038 < 0.05, and regression coefficient B = 0.106), window color brightness (p = 0.047 < 0.01, and regression coefficient B = 0.094), and plant color brightness (p = 0.029 < 0.05, and regression coefficient B = 0.154), there was a positive correlation between the evaluation factors of these five visual elements and the identification emotion, and the significance value was weakly correlated.
(2) Based on the levels of the evaluation factors, the evaluation factors of the five visual elements that had significant impacts were concentrated in the two evaluation indexes of morphological richness and color brilliance, and the correlation coefficients of the evaluation factors were > 0, indicating that the evaluation factors of morphological richness, color brilliance, and identity emotion were positively correlated.
(3) The correlation coefficient of the evaluation factor of decorative fineness among the 35 visual elements was > 0, indicating that there was a negative correlation between the decorative fineness of visual elements and the identification emotion; however, the significance p-value was >0.05, indicating that the influence of decorative fineness on the identification emotion was not significant. The linear regression results are also consistent with the correlation analysis results.
4. Discussion
In this study, the visual behavior characteristics of different visual elements in arcade buildings and streetscapes were compared with eye-tracking experiments, which confirmed that there were significant differences in the eye-movement behavior for different visual elements, and the correlation between the specific evaluation factors for the visual elements and specific dimensions of place identity was analyzed in combination with the SD method. The existing research on the dimension of place identity is mainly carried out from the psychological perspective of individuals and human geography, and there is less focus on the influence of objective visual elements on the emotion of place identity [21], which provides empirical evidence for the correlation between arcade architecture and streetscape visual elements and place identity theory.
In addition, considering the increasing influence of public participation on the formulation of government urban planning policies [22], this study also provides a way for tourists to participate in environmental quality monitoring and improvement through eye-tracking data acquisition and questionnaire surveys. The existing visual environment can undergo a more systematic subjective evaluation, thereby providing support for the visual perception control of existing buildings and streetscapes.
According to the above research, visual elements have a certain correlation with the identity emotion of a place, especially the subjective evaluation of the three visual elements of plaque text, windows, and green plants, which have a certain impact on the identity emotion. In the field of architectural and street quality aesthetics, architectural interfaces and plant visual elements are crucial for street quality evaluation [23], which also provides support for the results of this study. For arcade architecture research, the architectural decoration shape focuses on the decoration around the windows and pillars. Tourists often pay attention to places with rich forms, which also means that, in the eye-tracking experiment, the subjects’ visual behaviors towards the visual elements of the windows and other elements had significant differences. However, the construction of arcade buildings has been influenced by Westernism, and the façade decoration of arcade buildings is mixed with Western architectural elements. This style is contrary to traditional mainstream Chinese decoration [24]. This may explain the perception that the more elaborate the decoration, the more difficult it is to generate identity feelings, although it does not have a significant effect on identity emotions.
There are still some limitations and shortcomings in the study. An important limitation of this study is the use of architectural and streetscape imagery. Indeed, experimental photos cannot completely replace the actual scene; thus, in retrospective interviews, especially in terms of the building façade images, the participants lacked a sense of substitution, and the experimental results may have been influenced by the way the photos were taken. In addition, the differences in the visual perception of the buildings and street styles according to the tourists’ different environmental preferences were not taken into account, and although this study has some significance for exploring the relationship between visual elements and place identity, it is not possible to draw broader research conclusions. In future studies, it will be necessary to expand the comparison between the visual elements in more scenes and the main body of visitor evaluation.
It has been found in previous studies that women are more interested in the overall landscape, while men are more concerned with the parts of the landscape with prominent human architectural features, complex colors, and open space [25]. The eye-tracking experimental data in the field of art viewing show that there is a correlation between the eye-tracking data results and the participants’ interest preferences [26]; thus, the relationship between the tourists’ environmental preferences and visual elements, perception, and identity emotions must also be considered. However, another study also pointed out that in an eye-tracking experiment pertaining to the architecture and landscape of Huizhou’s historic streets in China, traditional elements and landscape facilities are more likely to cause tourists to demonstrate a variety of behaviors. [27]. In this experiment, the main type of image used is building façade images, the position of the visual elements in each image is more uniformly distributed, and the photo size is uniform, so the position of the visual elements is not discussed in this study, but the extension and discussion of the relative position of visual elements and visual center points will be added in subsequent studies.
5. Conclusions
This study used eye-tracking technology and the SD method to evaluate the visual behaviors, subjective evaluations of visual elements, and identity emotions of tourists through images of arcade building facades and street features. The correlation between the visual elements of arcade architecture and place identity from the tourist’s perspective is discussed, and the results show the following.
In the process of viewing the images of arcade buildings and street styles, visitors have significant differences in the five pieces of eye-tracking index data from different visual elements of building facades and street styles, namely the first fixation duration (FFD), total fixation duration (TFD), fixation count (FC), time before the first fixation (TFF), and visit count (VC), among which the visual elements of windows are the most significant, especially compared to doors. Visual elements such as colonnades are clearly different, assuming that Hypothesis 1 holds.
According to the results of the questionnaire data on the tourist evaluation of the influence of arcade architecture and street-style visual elements on place identity, the arcade buildings and street-style visual elements in the port-opening area of Shantou Small Park are correlated with place identity. Moreover, the evaluation factors of five visual elements, namely, plaque text morphological richness, plaque text color brightness, window morphological richness, window color brightness, and plant color brightness, showed a significant weak correlation with the place identity emotion, and in the visual element evaluation factor of arcade architecture and style, there was a negative correlation between decorative fineness and the identification emotion. However, the influence effect was not significant, assuming that Hypothesis 2 is true.
This research has certain limitations in regards to perception of street style, the breadth of evaluation subject samples, and demographic characteristics, so the comparison of differences between evaluation subject characteristics will be added in follow-up research, and the relationship between visual elements and visual centers will be explored.
This research is essential for improving the visual perception evaluation of historic districts, street features, and architectural heritage. Through eye-tracking experiments, the visual elements of building facades and street styles that tourists pay attention to were extracted and combined with subjective perception evaluation to explore the influence of the visual elements of arcade buildings and street styles on the identity and emotion of places. The research results can provide a basis for the protection and utilization of arcade architectural elements. Priorities for the protection of and improvement in architectural heritage can also be refined according to the magnitude of the impact. Visual elements that negatively affect people’s perception can be prioritized for improvement. The phased research results can provide a perceptual analysis method for the visual environment of buildings and streets, a research paradigm for the evaluation of the visual environment of historical streets in other cities, and effective data support for the visual planning, guidance, and placement of historic districts, which will be of great significance and value for improving the visual environment quality of historic districts.
Author Contributions
Conceptualization, H.F. and P.W.; methodology, H.F., P.W. and J.Z.; validation, H.F. and P.W.; investigation, H.F., S.Z. and Y.L.; data curation, H.F. and S.Z.; writing—original draft preparation, H.F.; writing—review and editing, H.F., P.W., S.Z. and J.Z. All images in the article were drawn or taken by the authors. All authors have read and agreed to the published version of the manuscript.
Funding
This research was funded by the Science and Technology Development Fund of the Macao Special Administrative Region, grant number: 0036/2022/A.
Informed Consent Statement
Informed consent was obtained from all subjects involved in the study.
Data Availability Statement
The data used to support the findings of this study are included within the article.
Acknowledgments
The authors would like to thank the Belt and Road Institute of Innovation and Design of City University of Macau for its laboratory equipment and technical support.
Conflicts of Interest
The authors declare no conflict of interest.
References
- Liu, M.; Nijhuis, S. Mapping Landscape Spaces: Methods for Understanding Spatial-Visual Characteristics in Landscape Design. Environ. Impact Assess. Rev. 2020, 82, 106376. [Google Scholar] [CrossRef]
- Kwenye, J.M.; Freimund, W. Domestic Tourists’ Loyalty to a Local Natural Tourist Setting: Examining Predictors from Relational and Transactional Perspectives Using a Zambian Context. Tourism Management Perspectives. Tour. Manag. Perspect. 2016, 20, 161–173. [Google Scholar] [CrossRef]
- Hawkins, H. Cultural Geography I: Mediums. Prog. Hum. Geogr. 2021, 45, 1709–1720. [Google Scholar] [CrossRef]
- Urbanc, M.; Fridl, J.; Planinc, T.R. Landscapes as represented in textbooks and in students’ imagination: Stability, generational gap, image retention and recognisability. Child. Geogr. 2021, 19, 446–461. [Google Scholar] [CrossRef]
- Shi, Y. The Analysis of the First Major Transformation of Architectural Aesthetics in China. In Proceedings of the 2nd International Conference on Literature, Art and Human Development (ICLAHD), Xiamen, China, 17 December 2020; Available online: https://www.atlantis-press.com/article/125949390 (accessed on 17 December 2020).
- Scott, N.; Zhang, R.; Le, D.; Moyle, B. A Review of Eye-Tracking Research in Tourism. Curr. Issues Tour. 2019, 22, 1244–1261. [Google Scholar] [CrossRef]
- Dowd, E.W.; Golomb, J.D. The Binding Problem after an eye movement. Atten. Percept. Psychophys. 2020, 82, 168–180. [Google Scholar] [CrossRef] [PubMed]
- Al Mushayt, N.S.; Dal Cin, F.; Barreiros Proenca, S. New Lens to Reveal the Street Interface. A Morphological-Visual Perception Methodological Contribution for Decoding the Public/Private Edge of Arterial Streets. Sustainability 2021, 13, 11442. [Google Scholar] [CrossRef]
- Li, N.; Zhang, S.; Xia, L.; Wu, Y. Investigating the Visual Behavior Characteristics of Architectural Heritage Using Eye-Tracking. Buildings 2022, 12, 1058. [Google Scholar] [CrossRef]
- Duan, J.; Lan, W.; Shao, R. From “design-oriented” to “control-oriented…” Reflections on the Standardization of Urban Design Technology in China_Duanjin.pdf. Urban Des. 2017, 41, 67–72. (In Chinese) [Google Scholar]
- Chen, C. Some Thoughts on the Preparation and Implementation of Urban Landscape Planning: A Case Study of Urban Landscape Planning in the Central Urban Area of Sinan County, Tongren City. Shanghai Urban Plan. 2021, 4, 125–131. (In Chinese) [Google Scholar]
- Wang, H.; Liu, N.; Chen, J.; Guo, S. The Relationship Between Urban Renewal and the Built Environment: A Systematic Review and Bibliometric Analysis. J. Plan. Lit. 2022, 37, 293–308. [Google Scholar] [CrossRef]
- Blake, B.F. Topophilia: A Study of Environmental Perception, Attitudes and Values. By Yi-Fu Tuan. J. Leis. Res. 1974, 6, 323–325. [Google Scholar] [CrossRef]
- Proshansky, H.H.; Fabian, A.K.; Kaminoff, R. Place-Identity: Physical World Socialization of the Self. J. Environ. Psychol. 1983, 3, 57–83. [Google Scholar] [CrossRef]
- Peng, J.; Strijker, D.; Wu, Q. Place Identity: How Far Have We Come in Exploring Its Meanings? Front. Psychol. 2020, 11, 294. [Google Scholar] [CrossRef] [PubMed]
- Lewicka, M. What Makes Neighborhood Different from Home and City? Effects of Place Scale on Place Attachment. J. Environ. Psychol. 2010, 30, 35–51. [Google Scholar] [CrossRef]
- He, H.; Li, J.; Lin, X.; Yu, Y. Greenway Cyclists’ Visual Perception and Landscape Imagery Assessment. Front. Psychol. 2021, 12, 541469. [Google Scholar] [CrossRef]
- Khaire, P.; Kumar, P. Deep learning and RGB-D based human action, human–human and human–object interaction recognition: A survey. J. Vis. Commun. Image Represent. 2022, 86, 103531. [Google Scholar] [CrossRef]
- Wang, P.; Song, W.; Zhou, J.; Tan, Y.; Wang, H. AI-Based Environmental Color System in Achieving Sustainable Urban Development. Systems 2022, 11, 3. [Google Scholar] [CrossRef]
- Van Loo, E.J.; Caputo, V.; Nayga, R.M.; Seo, H.-S.; Zhang, B.; Verbeke, W. Sustainability Labels on Coffee: Consumer Preferences, Willingness-to-Pay and Visual Attention to Attributes. Ecol. Econ. 2015, 118, 215–225. [Google Scholar] [CrossRef]
- Anton, C.E.; Lawrence, C. Home Is Where the Heart Is: The Effect of Place of Residence on Place Attachment and Community Participation. J. Environ. Psychol. 2014, 40, 451–461. [Google Scholar] [CrossRef]
- Shipley, R.; Utz, S. Making It Count: A Review of the Value and Techniques for Public Consultation. J. Plan. Lit. 2012, 27, 22–42. [Google Scholar] [CrossRef]
- Ye, Y.; Zeng, W.; Shen, Q.; Zhang, X.; Lu, Y. The Visual Quality of Streets: A Human-Centred Continuous Measurement Based on Machine Learning Algorithms and Street View Images. Environ. Plan. B Urban Anal. City Sci. 2019, 46, 1439–1457. [Google Scholar] [CrossRef]
- Tung, K.W. Chikan’s Arcade Buildings: The Hybrid and Civil Architecture of Lingnan. Archit. Cult. 2018, 6, 329–351. [Google Scholar] [CrossRef]
- Wang, P.; Yang, W.; Wang, D.; He, Y. Insights into Public Visual Behaviors through Eye-Tracking Tests: A Study Based on National Park System Pilot Area Landscapes. Land 2021, 10, 497. [Google Scholar] [CrossRef]
- Yi, T.; Chang, M.; Hong, S.; Lee, J.-H. Use of Eye-tracking in Artworks to Understand Information Needs of Visitors. Int. J. Hum.-Comput. Interact. 2021, 37, 220–233. [Google Scholar] [CrossRef]
- Gao, X.; Li, Z.; Sun, X. Relevance between Tourist Behavior and the Spatial Environment in Huizhou Traditional Villages-A Case Study of Pingshan Village, Yi County, China. Sustainability 2023, 15, 5016. [Google Scholar] [CrossRef]


Disclaimer/Publisher’s Note: The statements, opinions and data contained in all publications are solely those of the individual author(s) and contributor(s) and not of MDPI and/or the editor(s). MDPI and/or the editor(s) disclaim responsibility for any injury to people or property resulting from any ideas, methods, instructions or products referred to in the content. |
© 2023 by the authors. Licensee MDPI, Basel, Switzerland. This article is an open access article distributed under the terms and conditions of the Creative Commons Attribution (CC BY) license (https://creativecommons.org/licenses/by/4.0/).