Abstract
The present study shows the mercerization process (NaOH) and its effect on the physicochemical characteristics of rice straw. In total, 12 samples were analyzed, 3 as a comparative basis and 9 that were exposed to different concentrations of NaOH (1%, 2%, and 3%) and times, in hours, of exposure in an alkaline environment (1 h, 2 h, and 3 h). The loss of silica and reduction in lignin and hemicellulose contents identified in the chemical characterization allowed for a visualization of the surface topography and cross-section of the treated samples, making it possible to contrast them with the three untreated samples by comparing their roughness, the appearance of their pores, and the contractions of vascular bundles in their conductive tissue. An analysis of the data showed that the results between some treatments were similar, suggesting a reduction in resources in future research. The mechanical resistance allowed for identifying that the NaOH-1%-1 h treatment obtained a better mechanical resistance in the treated samples. However, NaOH-3%-1 h, with the third lowest resistance, obtained the highest % elongation compared to the other samples. These physicochemical changes with NaOH facilitate the selection of the treatment concerning the fiber–matrix interaction and final performance of the composite material that intends to use rice straw as a reinforcing fiber.
1. Introduction
The environmental crisis caused by the use of fossil fuels, the irrational use of non-renewable natural resources, and the lack of ecological awareness about other inadequate environmental habits [1] worries the different productive sectors (PS), due to the evident climate change that brings with it consequences related to increases in temperature that directly affect survival on Planet Earth [2,3].
Added to the effects caused by meteorological phenomena is the world population projection reported by the United Nations (UN) in 2015, which estimates that, by 2050, Planet Earth will be inhabited by about 9.7 billion people [4], a situation that aggravates global concern due to the demand for products and services that will have to be covered to meet the abundant future needs [5,6].
With the above, the industrial sector (IS) has taken measures to mitigate the emissions of greenhouse gases, following the actions published by the UN about facing the climate crisis [7]. In this way, the IS, through specific scientific research, contributes significantly to reductions in energy expenditure, the use of materials, and the production of the waste inherent to industrialized manufacturing processes [8].
In turn, the IS has implemented environmental practices in compliance with international policies, whose general objectives include a reduction in greenhouse gases [3,9]. Thus, the application of renewable energies, the rational use of water, a reduction in waste, and the implementation of alternative materials allow for a moderate reduction in global warming [10,11,12].
Regarding the application of alternative materials, the IS has contemplated using vegetable fibers (VFS) [13] to substitute the inorganic reinforcements traditionally implemented in the elaboration of composite materials (CMS) with polymeric [14] or cementitious [15] matrices, of which glass fiber, carbon, metallic, and fillers have been characteristic in these CMS due to their mechanical behavior. Regarding the substitution of inorganic fibers, the use of bamboo VFS in cement-stabilized soil mixtures can be mentioned, referring to the construction sector [16,17], and the uses of hemp, kenaf, flax, and sisal VFS in the automotive industry [18,19].
Similarly, the replacement of reinforcements in traditional CMS is due to the recyclability problems presented by their cement-based or petroleum-dependent matrices, in the particular case of conventional polymers, which hinders the separation of their fiber-matrix components, a characteristic that attributes considerable polluting values due to the inability to reuse the materials at the end of the CMS life cycle [20].
In response, scientific research has obtained ecological CMS also called Green Composites (GC), whose differential characteristic is the natural and biodegradable origin of some of their components, both in the matrix and in the reinforcement [21]. However, aware of this particularity, research has shown GCs with matrices based on polymers of natural and biodegradable origin that incorporate natural and organic fibers [22].
In regard to the above, obtaining a GC that does not need to be recycled due to the biodegradable and compostable nature of its components [23] is another ecological particularity of GCs that contributes significantly to sustainability and the circular economy [24]. Figure 1 shows the classification of the VFS commonly used in GC conformations.
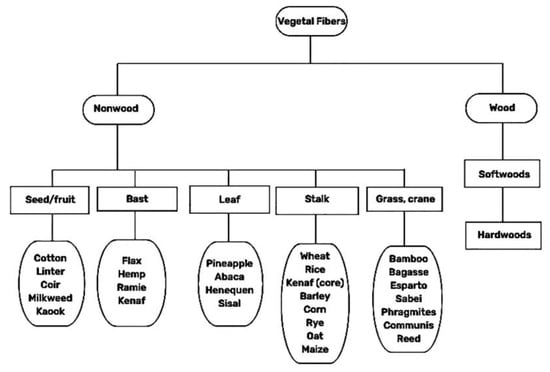
Figure 1.
Classification of fibers used in GC [25].
For this reason, lignocellulosic VFS from plants, especially those belonging to the groups of Gymnosperms and Angiosperms, because they have complex vascular tissue, have become an object of study by the IS, in order to incorporate this type of VFS as a reinforcement element in the manufacture of GCs due to the physical–mechanical characteristics presented by [26]. Thus, this can replace, in percentage, the materials traditionally used in the IS [27].
However, it should be clarified that, due to the natural origin of VFS, which classifies them as a non-standardized material, their physical, chemical, and mechanical properties can change significantly, taking into account variables such as the type of soil where the crop was grown, climate, geographical location, fertilization process, irrigation water characteristics, and planting and harvesting procedures, which are among other factors that can represent important alterations in the morphology of VFS.
Table 1 presents the basic mechanical properties of the VFS commonly used in the IS [28].

Table 1.
Basic mechanical and physical properties of mostly used natural fibers.
1.1. Rice Straw (Oryza sativa)
Angiosperms plants are divided into two subgroups, Dicotyledonous and Monocotyledonous. The latter includes the Gramineae family, which includes cereals such as wheat, sorghum, barley, oats, and rice, among others, whose particularity is conferred by the herbaceous nature of its rapid growth, together with its cylindrical and node-like stems that provide rigidity to maintain an upright position in the face of external forces.
As a special case study of this research, the rice plant (Oryza sativa), whose edible seed is part of the diet of about 50% of the world population, has two types of organs in its morphology, the reproductive organ formed by the flower and the seed, and the vegetative organ, which includes the root, stem, and leaves [29].
As for the stalk, 90, 120, 150, and up to 250 days after sowing, depending on the species, the rice is harvested using mechanical action, with the help of a harvesting machine, which, after recovering the grain, discards the stalk and part of the leaves in the open field, leaving them exposed to the environment, causing them to dry under direct sun and wind [30]. This is the special characteristic that affects the change in its name, going from stalk to rice straw (RSW).
Figure 2 shows the identification of rice seedling organs (Figure 2a), a rice crop in time for harvesting (Figure 2b), the process of grain harvesting using a harvesting machine (Figure 2c), and post-harvest residual rice straw (Figure 2d).
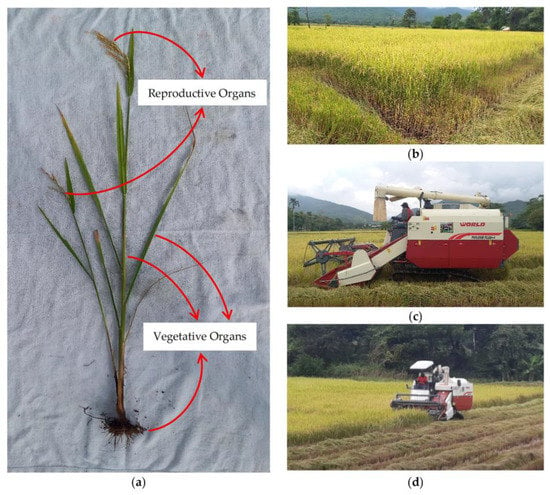
Figure 2.
(a) Rice seedling organs; (b) rice cultivation; (c) harvesting machine; and (d) post-harvest RSW.
According to a report published by the Rice Knowledge Bank, each kilogram of rice grain harvested generates about 0.7 to 1.4 kg of RSW [31], and other studies have indicated that, for each ton of grain harvested, about 1.35 to 1.50 tons of RSW are produced [32]. Data can be used to easily assess the amount, in tons, of residual RSW in each harvest, taking, as a reference, the projection of the cereal crop made by the UN Food and Agriculture Organization (FAO) in its report published in November 2022, which estimates that, for the remainder of 2022 and all of 2023, the world rice production will amount to 512.6 million tons [33].
In this sense, the abundant production of RSW, called agricultural waste by some authors and named as a vegetable resource by others, makes it a material that undoubtedly should be used as a raw material for the elaboration of any type of elements that can replace those currently used in the IS [34,35].
In this way, in addition to giving value to an agricultural resource, we would be generating adequate management with respect to the final disposal of the RSW that currently, due to bad practices or simply because of ignorance, is burned in the open air or accumulated, causing its decomposition, producing and methane, respectively, which are considered to be greenhouse gases [36].
1.2. Mercerization Process
The mercerization process is an alkaline treatment with sodium hydroxide (NaOH) that promotes a change in the structure of the cellulose fibers of plant material by removing lignin (Lg), hemicellulose (Hm), waxes, and impurities [37].
In this way, the plant material exposed to the NaOH solution is chemically altered by breaking the hydroxyl groups existing between its molecules when reacting with the water molecules contained in the fiber, exposing the fibrils present in the epidermis of the VFS, providing roughness in its surface topography (TS) [38].
Thus, the hydrophilic nature of the fiber is transformed into a hydrophobic one, achieving chemical restructuring, which considerably improves the resistance of the treated VFS [18]. The chemical reaction produced between the VFS and NaOH is represented by Equation (1) [18,39,40].
However, knowing the alkaline and aggressive nature of the NaOH treatment, it is advisable to control its concentration in the solution, avoiding the application of high percentages that may cause an opposite effect, generating damages that considerably deteriorate the exposed material, which translates into a decrease in its mechanical resistance [39].
In other words, the concentration of the alkaline solution, the characteristics of the VFS, and the duration and temperature of the process are variables that unquestionably impair the improvement in the physical properties of the VFS, if this is the desired aim of the process [37].
For this reason, the search for references in the state of the art becomes the best consultation tool that allows us to consider the reference points that can be considered when carrying out any type of chemical process aimed at improving the characteristics of VFS in future research.
Figure 3 shows the defibrillation of cellulose bundles and the breakdown of the cell wall structure of a VFS due to its exposure to aggressive treatment.
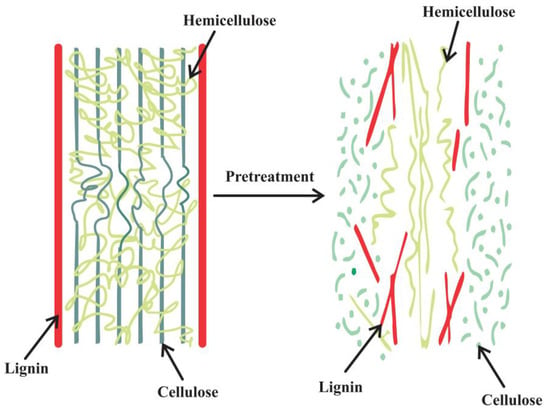
Figure 3.
Aggressive treatment effect on VFS [41].
For this reason, this research result shows the mercerization process carried out on the RSW by exposing it to an alkaline solution of NaOH in distilled water (H2O), at concentrations of 1%, 2%, and 3% by mass. The rice straw samples (RSS) were immersed in each of the three solutions and then removed after 1, 2, and 3 hours (h), respectively, which generated nine different treatments.
The treated RSS (RSS-3t), after being removed from their NaOH treatments, were washed with potable water () with the addition of acetic acid (CH3-COOH), at a concentration of 1% by mass. After being washed, the RSS-3t was dried at room temperature.
With respect to the tests carried out, the RSS-3t was tested for Neutral Detergent Fiber (NDF), Acid Detergent Fiber (ADF), and Cellulose to determine the cellulose content (Cl), Hm, and Lg. The RSS-3t were identified longitudinally and transversely using a Scanning Electron Microscopy (SEM) characterization to obtain the incidence of the alkaline treatment on their TS.
In the same way, and with the same SEM equipment, Energy Dispersive X-ray Spectroscopy (EDS) elemental mapping was performed to obtain the basic chemical characterization of each RSS-3t, in order to support what happened during their exposure in the alkaline environment. A test to determine the tensile strength and elongation of the individual fibers was also carried out to assess the effects of the mercerization process on the mechanical behavior of the RSS-3t.
Accordingly, the main objective of the current research, besides putting into context the process of the mercerization of RSW, from field sampling to the substantiation of the resulting effects, is to explain, in detail, the phenomena that occurred in the RSS-3t after the alkaline treatment. The above provides information that will help to close knowledge gaps regarding the individual and particular process that frames the use of RSW as a reinforcement VFS both in CMS and the correctly named CG.
Therefore, the results described here add to the important contributions to the state of the art of the subject, generated by the curiosity of researchers who see the use of renewable resources as the answer for the development of substitute materials for those traditionally implemented in the IS.
2. Materials and Methods
2.1. Materials
The RSS used in this research report was taken from the cereal crops present in the municipality of Zulia—Departamento Norte de Santander—Colombia, whose geographical location is represented by the coordinates 8°7′23.2″ N, 72°34′29.2″ W, with an altitude of 209 m height above sea level. The topography of the land is flat, the soil texture is sandy loam, the collection time of the RSS was during a transition from rain to drought, the collection time was at 17:00 h, and the ambient temperature at the collection time of the RSS was 33 °C, with a humidity of approximately 52%. Table 2 shows the description of the RSS, together with the amount of mass collected (Msc) in kilograms (kg).

Table 2.
RSS ratio taken in the field.
The difference in the Msc taken in the field was because the samples RSS-1 and RSS-2 were not chemically treated; however, they were evaluated to contrast their results with those of the RSS-3t.
2.2. Chemical Treatments
The chemical treatments to which the RSS-3 were exposed were carried out using 99% NaOH and 98% CH3-COOH. The solutions were prepared in H2O in 3 plastic containers with a capacity of two hundred and twenty liters (220 L), to which the H2O was added until it reached 82% ± 0.5% of their capacity. The acidity (pH) range of the solutions was checked using a digital pH meter model of the Ph-002 Dr meter brand.
2.3. Methods
2.3.1. RSS Preparation
Once the RSS-3 was collected, in order to analyze its materials for the construction, it was transferred to the laboratory facilities of the Servicio Nacional de Aprendizaje-SENA, where most of the research processes were carried out. The RSS-3 were washed with to remove any type of soil or chemical residue characteristics of the cereal crops. The temperature was 26 °C ± 1 °C. Two washes were performed.
Then, air drying was performed, and the ambient temperature at the time of drying was 38.7 °C, with a relative humidity of 44.2%. Five days after the washing and drying, the RSS-3 were packed and weighed in bags containing 2400 g (g) each. Twenty bags were weighed.
Figure 4 shows the processes carried out for the preparation of the RSS-3. These processes began with the field collection (Figure 4a). The RSS-3 were then washed with (Figure 4b). Air drying was performed (Figure 4c). Subsequently, the RSS-3 were weighed and packed in individual 2400 g bags (Figure 4d).
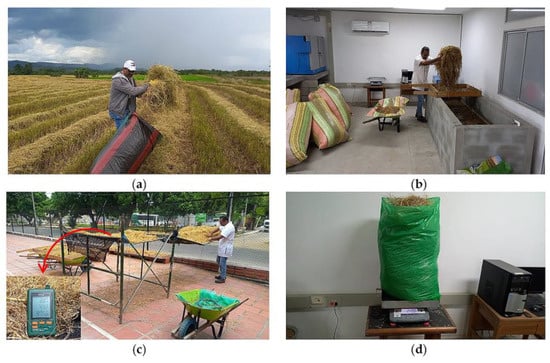
Figure 4.
RSS-3 Preparation. (a) Collection; (b) washing ; (c) air drying; and (d) packing and weighing.
2.3.2. Alkaline Treatment RSS-3
The 20 bags containing 2400 g of the untreated, washed RSS-3 (RSS-3 W/Ut) were labeled with numbers from 1 to 20, in order to identify the numbers of the corresponding bags for each of the NaOH processes. In this sense, the mercerization process of the RSS-3 W/Ut was prepared.
This process was carried out taking as a reference the study carried out by the author Huang G in 2009, who exposed VFS to NaOH concentrations of 2%, 4%, 6%, 8%, and 10%, concluding that the mechanical resistance of the VFS was inversely proportional to the increases in the % of the NaOH, a characteristic clearly identified in Table 1 of his published article [42].
Regarding the exposure times of VFS in NaOH concentrations, the research conducted by the author M.M Kabir et al. in 2013 concluded that a 3 h exposure of VFS in a concentration of 10% NaOH was moderately aggressive and did not cause considerable damage to the VFS, which can be seen in Table 2 of their published article [43].
In the same way, in the present investigation, the concentration corresponding to 2% NaOH was taken as an average reference. However, to achieve results of interest, one percentage point below and one percentage point above the mean were used, and concluded concentrations of 1%, 2%, and 3% NaOH were implemented in this research. In contrast, the times taken for the exposure of the RSS-3 W/Ut to NaOH were 1 h, 2 h, and 3 h, reducing the exposure time reported by the author Kabir [43].
Based on the above, the NaOH concentrations and exposure times to which the RSS-3 W/Ut were subjected were projected. Table 3 identifies the NaOH concentrations, the exposure times in hours (Et) for which the RSS-3 W/Ut were immersed, and the identification given to the RSS-3t. Thus, 9 processes were obtained in which the RSS-3-t was exposed to NaOH.

Table 3.
NaOH concentrations and Et RSS-3-t.
To prepare the NaOH solutions, Equation (2) was used to determine the % by mass for both the solute and the solvent. For the latter, H2O was used, taking the value of 998 g/L, corresponding to its density at 20 °C, since the temperature of the H2O at the time of the process was 22 °C ± 1 °C.
For the NaOH process, 3 water storage containers with a capacity of 220 L were used; however, only 82% ± 0.5 of their capacity was used, corresponding to 180 L of H2O for each container, in order to avoid overflowing after submerging the RSS-3 W/Ut.
Upon replacing the data of the equation with those of the estimated concentrations, we obtain:
Solute: 1820 g (NaOH)
Solvent: 180 L ∗ 998 g = 179,640 g (H2O)
Solution: 179,640 g + 1820 g = 181,460 g
The above corresponds to the calculation performed to determine the 1% mass concentration of the NaOH in the alkaline solution. The same procedure was performed for the 2% and 3% concentrations, with masses of 3680 g and 5570 g of NaOH, respectively.
To avoid settling the NaOH, the dissolution of the mass of the solute was carried out in an external container containing 15 L of H2O taken from the same container that contained the initially prepared 180 L. For the 9 RSS-3-t, an equal number of solutions was prepared separately.
That is, 3 containers with 180 L of H2O, containing 1820 g of NaOH, corresponding to 1% of the mass of the solution, were prepared for the immersion of the RSS-3 W/Ut. This allowed for the controlled extraction to be carried out after the estimated times (1 h, 2 h, and 3 h) for each RSS-3-t.
For each NaOH solution, 4800 g of RSS-3 W/Ut was enlisted to be submerged. However, prior to the immersion process, about 3% of the mass of the RSS-3 W/Ut was removed to determine the moisture content of the RSS-3 W/Ut before starting the treatment. This process was used to check the moisture content of the samples after the treatment and thus verify the loss in mass of each of the RSS-3t. The amount of RSS-3 W/Ut immersed in the dissolution averaged 4660 g.
Once the solutions were individually prepared, the RSS-3 W/Ut were placed inside the containers. As indicated in previous paragraphs, the numbered bags allowed for a specific order of arrangement, so the RSS-3 W/Ut contained in bags 1 and 2 were placed in the 1% NaOH solution, from which they were removed after one hour of exposure time (NaOH 1% for 1 h), as identified in Table 3. Bags 3 and 4 corresponded to 1% NaOH for 2 h and bags 5 and 6 to 1% NaOH for 3 h.
The same process was carried out successively in the numerical order of the bags corresponding to the concentrations of 2% and 3% NaOH. The RSS-3 W/Ut contained in the bags numbered 19 and 20 were not chemically treated to compare them with the others.
2.3.3. CH3-COOH Wash
After removal from the alkaline solution, the RSS-3t were washed twice with with a concentration of 1% CH3-COOH by volume for the RSS-3-t treated with 1% NaOH, and with a concentration of 2% CH3-COOH for the samples treated with 2% and 3% NaOH. The above was performed to facilitate the removal of the NaOH. Equation (2) was used to calculate the CH3-COOH concentrations.
In this order of ideas, the washing process was carried out in a tank with a total volume of 1.5 , of which only 30% of its capacity was used. Next, the pH of the was checked without concentration inside the pool, yielding a range of 7.7. Then, the concentration of the CH3-COOH at 1% was proceeded to be poured, stirring the to improve the solution. Next, the RSS-3t was introduced into the tank and left immersed for 30 min (min), during which time, the RSS-3t was moved every 5 min to improve the removal of the NaOH particles.
After the time elapsed, the pH of the water was checked to know if the washing was stopped or not. The pH reading of the first wash was 4.5. The reason for which a second wash was performed was that it did not approach the pH of the without a concentration. The pH of the second wash yielded range of ±0.5, with respect to the pH of the untreated .
Thus, the number of washes performed on the RSS-3t was determined to guarantee the removal of the NaOH. This process was performed on all the RSS-3t by increasing the CH3-COOH concentration by 2% for the wash corresponding to the RSS-3-t with NaOH concentrations of 2% and 3%.
Figure 5 shows the mercerization process of the RSS-3 W/Ut, starting with the preparation of the solution in an external container (Figure 5a), passing through its immersion in the alkaline environment (Figure 5b), followed by its removal in the estimated time (Figure 5c), giving way to its washing with at different concentrations of CH3-COOH (Figure 5d).
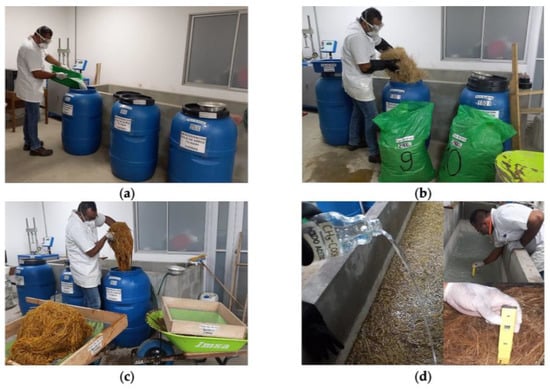
Figure 5.
Mercerization RSS-3 W/Ut. (a) NaOH Preparation; (b) RSS-3 W/Ut immersion; (c) solution removal; and (d) washing with CH3-COOH.
After the washing process of the RSS-3-t, it was air dried, as was performed with the initial washing of the RSS-3, which is shown in Figure 4b,c. As indicated in previous paragraphs, all the RSS-3-t were tested for their moisture contents after the air drying to provide a comparative basis for the mass loss of the RSS-3 W/Ut after each of the treatments.
With the above, the activities carried out in the preparation and NaOH treatment of the RSS are presented. Figure 6 shows the process carried out in the research, a process that begins with the collection of the RSS and continues until the performance of the tests after the alkaline process.
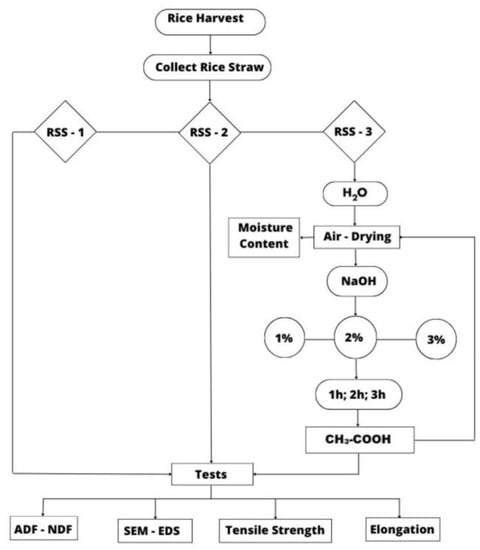
Figure 6.
Activities carried out at the RSS.
2.3.4. ADF, NDF, and Cellulose Test
To identify the influence of the 9 treatments on the Cl, Hm, and Lg contents, the RSS-3t was tested for ADF, NDF, and cellulose. The same test was performed on the RSS-1, RSS-2, and RSS-W/Ut, resulting in 12 samples being analyzed. The ADF, NDF, and Cl content tests were performed under the ISO 16472:2007 [44] and ISO 13906:2009 [45] standards by the analytical chemistry and animal nutrition laboratory of the Colombian Agricultural Research Corporation AGROSAVIA-Bogota, and the Universidad Francisco de Paula Santander Cúcuta-Colombia.
2.3.5. Characterization by SEM and EDS
To understand the effect of the NaOH on the TS of the RSS, transverse and longitudinal observations were carried out using SEM characterization, with approaches ranging from 50 µm, 100 µm, and 500 µm, and 10 µm, 50 µm, 100 µm, and 200 µm, respectively. The Jeol JSM-6010LA was used for this surface characterization. The preconditioning and conditioning of the RSS were performed according to ASTM D1776/D1776M-20 “Standard Practice for Conditioning and Testing of Textiles” [46]. A total of 9 RSS-3-t and 12 RSS, RSS-1, RSS-2, and RSS-3 W/Ut were observed. The RSS-1, RSS-2, and RSS-3 W/Ut were characterized to compare their TS in contrast to RSS-3-t.
At the same time, EDS mapping was performed with the same equipment for an elemental chemical characterization to identify the effects of the alkaline treatment on the chemical composition of the RSS. As in the SEM characterization, the 12 RSS were mapped in the EDS to interpret their data for a comparative analysis. The tests were carried out by the technological services laboratory of the Textile and Leather Manufacturing Servicio Nacional de Aprendizaje SENA-Bogotá.
2.3.6. Mechanical Strength RSS
The mechanical strengths of the 12 RSS were tested by testing the tensile strength and elongation of individual fibers. The test was performed according to NTC-386:2011 [47] and ASTMD-2256/D2256M-10 (2015) [48]. The equipment used was 250N-Tension-Universal Testing Machine Lloyd Instruments EZ20-CRE. It was necessary to reduce the test length from 250 mm to 35 mm due to the nature of the material. Ten fibers were tested for each RSS to average the results. For this reason, the maximum and minimum data for both the tensile strength and elongation were identified. The tests were carried out in the materials quality laboratories of the Textile and Industrial Management Servicio Nacional de Apredizaje SENA-Medellín.
3. Results
3.1. Mass Loss Due to NaOH Treatment Effects
The moisture tests of the RSS-3, before and after the alkaline treatment, generated interesting data, with which it is possible to obtain the mass loss (Ml) of an RSS after it was exposed to the NaOH process. Table 4, Table 5 and Table 6 show the data corresponding to the Ml of the RSS-3 after its exposure to the NaOH process at 1%, 2%, and 3% by mass, respectively. The tables show the number of washes (W) and mass in grams (Ms) of the incoming and outgoing RSS-3 in each alkaline process, together with their moisture content (%H), which made it possible to easily determine the Ml during the process.

Table 4.
Ml RSS-3 NaOH 1%.

Table 5.
Ml RSS-3 NaOH 2%.

Table 6.
Ml RSS-3 NaOH 3%.
Figure 7 shows the consolidation of the data corresponding to the Ml of the RSS-3 at NaOH 1%, NaOH 2%, and NaOH 3%.
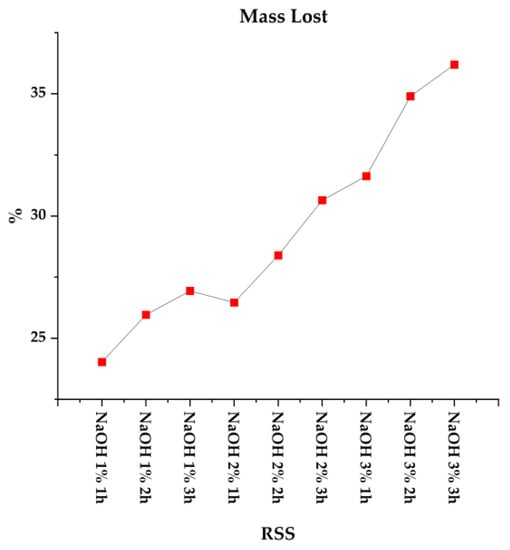
Figure 7.
Ml RSS-3 NaOH 1%, NaOH 2%, and NaOH 3%.
3.2. Lignin, Cellulose, and Hemicellulose Content
With the ADF, NDF, and Cl tests, it was possible to verify the incidence of the NaOH process on the Cl, Hm, and Lg contents in the RSS. This was performed to verify the partial hydrolyzation of Hm and the depolymerization of Lg, which give rise to water-soluble sugars and phenolic compounds [27]. There are characteristics underlying the variation in the Cl, Hm, and Lg contents in each of the RSS-3-t. The data corroborating the impact of the treatment on the RSS was described by S. Vigneshwaran et al. in Table 4 of their published article [14].
Therefore, the importance of knowing the content of these three fundamental polymers in plant tissues is reflected in the mechanical behavior of the VFS, which act as the main reinforcement of the CMS. This is particularity attributed to the fact that the NaOH treatments also reacted with the Lg and Hm components, reconfiguring their % content within the VFS, properties that significantly influence their mechanical resistance. This particularity was reported by M.M Kabir in Table 2 of his article [43].
Table 7 shows the results of the ADF, NDF, and Cl tests. With the help of this table, the influence of NaOH on the RSS-3t can be analyzed with respect to its Lg, Cl, and Hm contents. It was determined that the RSS-3 W/Ut lost 3.22% of Lg with respect to the RSS-1, corroborating the effect of washing with . Similarly, it was interpreted that the NaOH 1% for 2 h process generated results like those obtained with the NaOH 2% for 1 h process, as well as those obtained with the NaOH 1% for 3 h and NaOH 3% for 1 h processes, continuing with NaOH 2% for 3 h and NaOH 3% for 2 h. This is an analysis that serves to reduce the resources used in NaOH treatments of VFS in future research.

Table 7.
Lg, Cl, and Hm contents in RSS.
Equation (4) was used to calculate the % Lg, subtracting the Cl from the ADF. Equation (5) was used to calculate the Hm, subtracting the ADF from the NDF. To determine the Cl content, Equations (6) and (7) were used, where the Lg and Hm were subtracted from the NDF, and the Lg was subtracted from the ADF.
Figure 8 shows the % Lg, Cl, and Hm contents in the RSS.
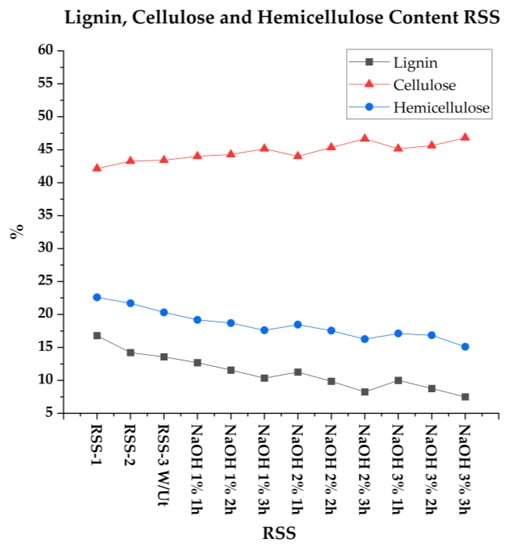
Figure 8.
Lignin, cellulose, and hemicellulose RSS contents.
3.3. Characterization TS RSS by SEM and EDS
By means of EDS mapping, it was possible to determine the effect of the NaOH treatment on the elemental chemical compositions of the RSS-3t. Through the tabulation of the data, it was possible to determine the silica (Si) content, which is represented by the blue color, the oxygen (O) content, which is shown by the reddish color, and the carbon (C) content, which is denoted by the green color (Figure 9a), showing the presence of these elements in the TS of the RSS identified.
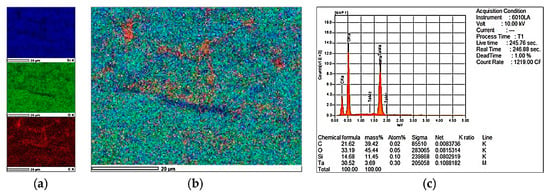
Figure 9.
EDS data. (a) Chemical element colors; (b) mapping; and (c) EDS data consolidation.
Figure 9 refers to the important information provided by the EDS, symbolizing the colors representing the chemical elements in the RSS-1 (Figure 9a) (seen Table 7), the mapping image where the color dispersion is recognized in terms of its chemical contents (Figure 9b), and the table where the data are consolidated (Figure 9c).
Table 8 shows the mass percentages of the Si, O, and C identified with the EDS mapping of the RSS. Comparative relationships can be made with respect to the incidence of the % NaOH and Et on the elemental chemical composition of the RSS-3-t. In this order of ideas, through an analysis of the table, it was determined that only washing the RSS with showed an Si loss of 1.81%. In the same way, it can be indicated that performing the NaOH 1% for 2 h treatment presented similar results to that of the NaOH 2% for 1 h treatment, and the same was the case for the NaOH 3% for 1 h and NaOH 1% for 3 h treatments.

Table 8.
Chemical composition of RSS.
According to the data in the table, the loss of Si is directly proportional to the increase in the NaOH concentration and exposure time of the RSS in the alkaline solution. The loss of Si content in the VFS, in addition to improving its TS, allows for a visualization of the Cl fibers, which is represented in the EDS mapping by the identification of the % O and C. The metal Tantalum (Ta) identified in the EDS corresponds to the container where the evaluated sample was deposited, whose % content added up to 100% of the reported result.
3.3.1. Longitudinal View
Table 8, resulting from the consolidation of the EDS mapping data, shows the difference between the Si, O, and C percentages. Of which, for the case of the RSS-1 and RSS-3 W/Ut, the Si was reduced by 1.82% and the O was increased by 3.72%. There were changes in the chemical composition caused simply by the wash to which the RSS-3 was subjected prior to the treatment with NaOH.
Figure 10 shows the longitudinal detail of the epidermis of the RSS-1 (Figure 10a), RSS-2 (Figure 10b), and RSS-3 W/Ut (Figure 10c), together with their EDS mappings that recognize their Si, O, and C contents. An epidermal appendage denominated single hair (Sh) can be evidenced in the TS (Figure 10a).
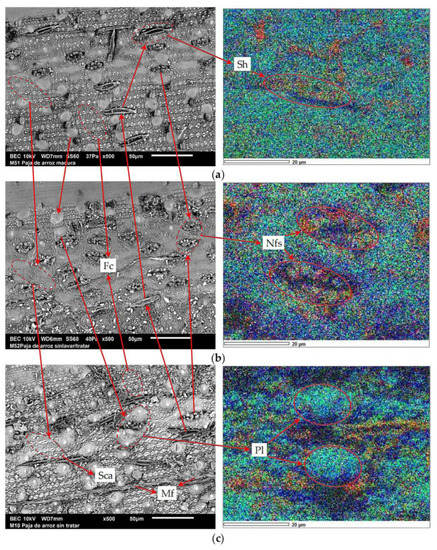
Figure 10.
Longitudinal detail and EDS mapping; (a) RSS-1, Sh; (b) RSS-2, Fc, Nfs; and (c) RSS-3W/Ut, Sca, Mf, and Pl.
Additionally, clearly shown are the epidermal cells or fundamental cells (Fc) and non-functional stomata (Nfs), which receive their name because they do not have the structure of a stomatal apparatus (Figure 10b). At the same time, the areas covered by the Si (Sca) and some exposed microfibrils (Mf) and papillae (Pl) can be visualized, which are also part of the epidermal appendages (Figure 10c).
Figure 11 shows the longitudinal location of the veins (V), allowing for a parallel distribution of the Nfs gramineous characteristic (Figure 11a). The effect of the 1% NaOH alkaline treatment on the RSS-3 is also presented, where the significant detachment of the mineralized bodies or phytoliths (Ph) and the breaking of the Si layer in the Pl, which exposes the Mf in the cellulose cell, are noted.
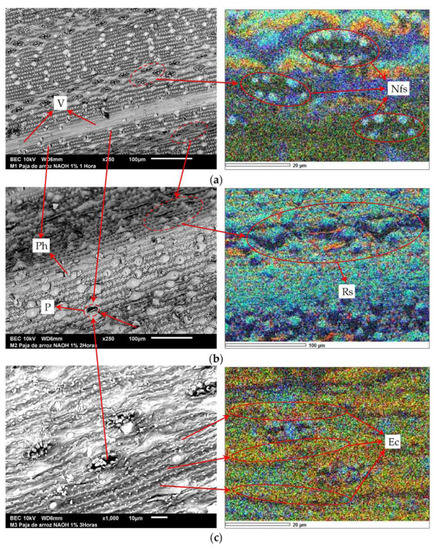
Figure 11.
Longitudinal detail and EDS mapping. (a) NaOH 1% 1 h, V, Nfs; (b) NaOH 1% 2 h, Ph, P, Rs; and (c) NaOH 1% 3 h, Ec.
This is due to the exposure time of the RSS-3 to the alkaline treatment, causing the appearance of pores (P) and directly influencing the surface roughness (Rs) (Figure 11b). Similarly, the loss of Si, Hm, and Lg exposes the elongated cells (Ec) that are part of the epidermal Fc cell structure (Figure 11c). This recognition is facilitated with the help of the ADF, NDF, and cellulose tests, together with the EDS mapping, which identifies the increased concentrations of the O and C major components in the cellulose fibers [36].
Figure 12 shows the incidence of the 2% NaOH process on the TS of the RSS-3t. The Ec becomes more noticeable in the EDS mapping (Figure 10a). The Mf can be easily identified by simply corroborating the O and C contents of the EDS, as well as the differentiation between the Ec and siliceous cells (Sc) (Figure 12b). Hair-like cells (Hc) are shown (Figure 12c). These characteristics in the TS of the RSS-3t are a consequence of the loss in Si and the removal of Lg and Hm, which allow for a clear visualization of the cellulose fibers in the EDS mapping due to their chemical composition [49].
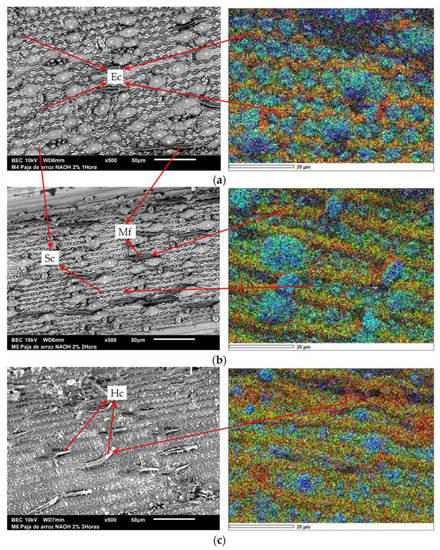
Figure 12.
Longitudinal detail and EDS mapping. (a) NaOH 2% 1 h, Ec; (b) NaOH 2% 2 h, Sc, Mf; and (c) NaOH 2% 3 h, Hc.
Figure 13 shows the considerable effect of the NaOH 3% treatment on the RSS-3, where the silica–suberose cell grouping (Ssg), which is composed of Sc and suberose cells (Sb), can be seen. In turn, a venous rupture (Vr) was provoked (Figure 13a). Similarly, the exposure of the Mf and Ec, which are part of the cellulose cell (Cc) set, is presented (Figure 13b). The significant losses of Si, Hm and Lg allow for the identification of the Mf present in the Sc, as well as the removal of the Si elements that covered the surface of the Nfs, leaving the sub-stomatic chamber (Sbc) visible and giving rise to a higher P (Figure 13c). Special features increase the Rs in the TS by eliminating the amorphous content present in the VFS, allowing for a better adhesion of the reinforcement with its matrix [50].
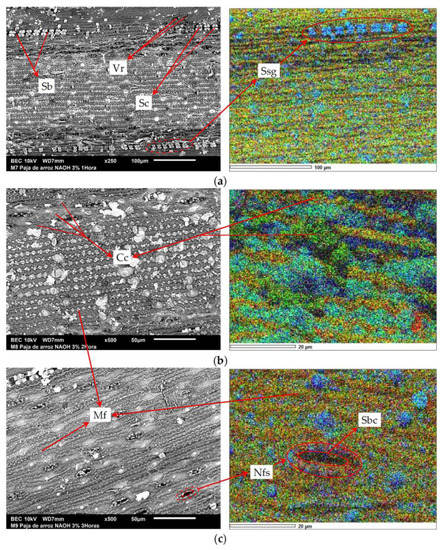
Figure 13.
Longitudinal detail and EDS mapping. (a) NaOH 3% 1 h, Sb, Vr, Sc, Ssg; (b) NaOH 3% 2 h Cc; and (c) NaOH 3% 3 h, Mf, Nfs, Sbc.
3.3.2. Cross-Sectional View
Figure 14 presents the conductive tissue (Ct) of the RSS after a cross-sectional visualization. In this figure, the Ct of the RSS-1 (Figure 14a), RSS-2 (Figure 14b), RSS-3 W/Ut (Figure 14c), and RSS-3t with the NaOH 1% for 1 h (Figure 14d), NaOH 1% for 2 h (Figure 14e), and NaOH 1% for 3 h (Figure 14f) treatments can be noticed. Similarly, the vascular bundles (Vb) represented by the Xylem (Xm) (Figure 14a–d) and phloem (Fm) (Figure 14b–e) can be identified. Additionally, also shown are their inner diameters (Id) and the supporting fibers (Sf) found inside the Vb (Figure 14c–f).
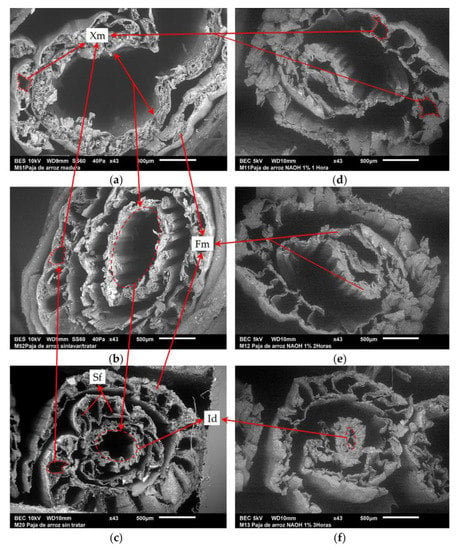
Figure 14.
Cross-sectional view: (a) RSS-1, Xm; (b) RSS-2, Fm; (c) RSS-3 W/Ut, Sf, Id; (d) NaOH 1% 1 h; (e) NaOH 1% 2 h; and (f) NaOH 1% 3 h.
Figure 15 shows the cross-sections of the RSS-3t with the NaOH 2% for 1 h (Figure 15a), NaOH 2% for 2 h (Figure 15b), NaOH 2% for 3 h (Figure 15c), NaOH 3% for 1 h (Figure 15d), NaOH 3% for 2 h (Figure 15e), and NaOH 3% for 3 h treatments (Figure 15f). This figure shows the detachment of the supporting tissue (St) (Figure 15a–c). This characteristic causes a laminar effect due to the reduction in the Vb that conforms the Ct (Figure 15d–f). This is a consequence of the loss in the Lg present in the cell walls, which is responsible for thickening of stems in gramineous [51].
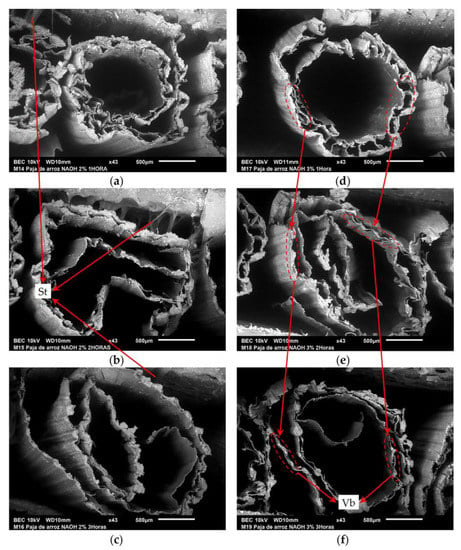
Figure 15.
Cross-sectional view: (a) NaOH 2% 1 h; (b) NaOH 2% 2 h, St; (c) NaOH 2% 3 h; (d) NaOH 3% 1 h; (e) NaOH 3% 2 h; and (f) NaOH 3% 3 h, Vb.
3.4. Tensile Strength and Elongation
In the tensile and elongation test, 10 samples were tested for each of the RSS. The results obtained in the resistance tests were evaluated in Newtons (N) and the elongation data in the % of the length of the sample analyzed. The average (Av) indicated the mean value of the samples tested. The coefficient of variation (%Cv) indicated the measure of the dispersion of the data, which allowed for an analysis of their deviations. The maximum (Max) and minimum (Min) values show the highest and lowest results obtained by the RSS. A similar test was applied by Q. Hussain et al. in their research project, in order to evaluate the use of natural fibers in the reinforcement of concrete beams [11].
Figure 16 shows the tensile and elongation test process. The 10 fibers tested for each RSS are reflected (Figure 16a), the length of the test is presented (Figure 16b), the assembly of the fibers in the inserts is shown (Figure 16c), and the moment of the test is shown (Figure 16d).
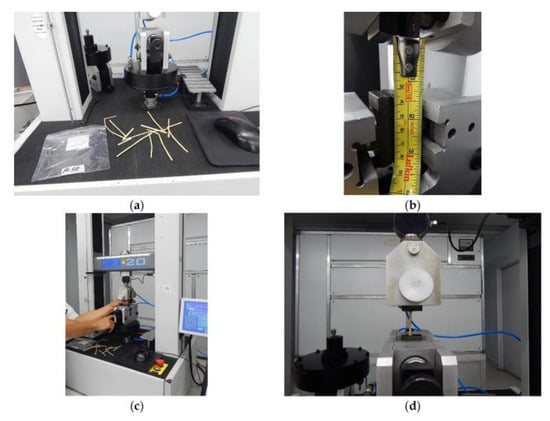
Figure 16.
Tensile and elongation test: (a) identification of specimens; (b) test height; (c) mounting; and (d) testing procedure.
Table 9 shows the results obtained in the tensile strength and elongation tests. These produced data with which it was possible to determine the influence of the alkaline treatment on the mechanical characteristics of the RSS.

Table 9.
Tensile and elongation test for RSS.
Figure 17 shows the data obtained from the tensile and elongation tests, with which the influence of the NaOH on the mechanical strengths of the RSS-3t can be identified. At the same time, comparative analyses were performed with respect to the RSS-1, RSS-2, and RSS-3 W/Ut. In this sense, it was possible to identify that the tensile strength of the RSS-2 was superior to the other RSS. However, its % elongation reported the second lowest value. In contrast, the NaOH 3% for 1 h treatment had the highest elongation % and the third lowest tensile strength.
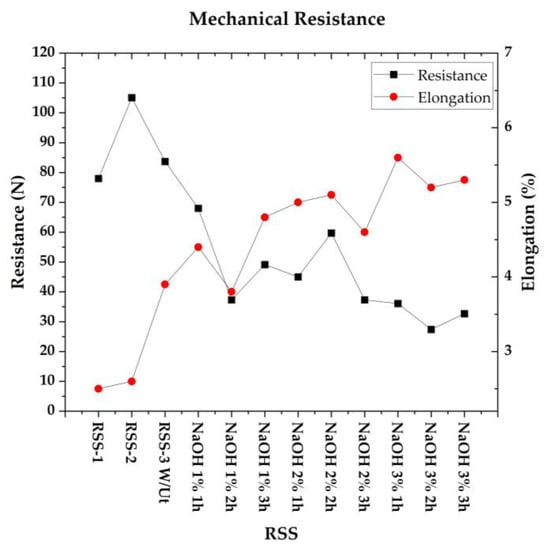
Figure 17.
Tensile and elongation test for RSS.
Figure 18 shows the influence of the losses in the Lg and Hm on the decrease in the tensile strength of the RSS. This is a characteristic that generates a directly proportional relationship, as evidenced by the determination coefficient () that yields the regression line of the Lg and Hm. This progressive weakening of the fibers occurs due to the excessive elimination of the Lg caused by the % NaOH concentration and exposure time of the RSS in the solution, a feature that interferes with the adhesive function between microfibrils, a situation that causes considerable detachments that affect their consolidation [43].
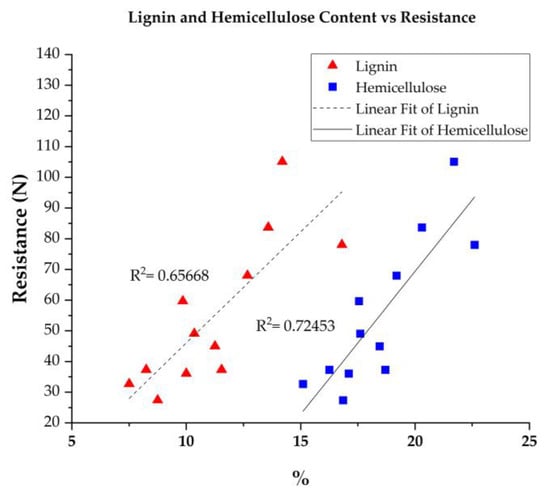
Figure 18.
Influence of Lg and Hm content on the tensile strength of RSS.
In the same way, Figure 19 shows the and regression line that allows for a relation of the consequences generated by the loss of cellulose in the elongation capacity of the RSS. This elimination of the cellulosic compounds present in the VFS negatively influences their elastic capacity, an effect that is caused because of the rupture of the packing of the hydroxyl groups and the hydrogen bonds of the cellulose, due to the diffusion of the chemical reaction generated by the aggressiveness of the alkaline treatment [41,42].
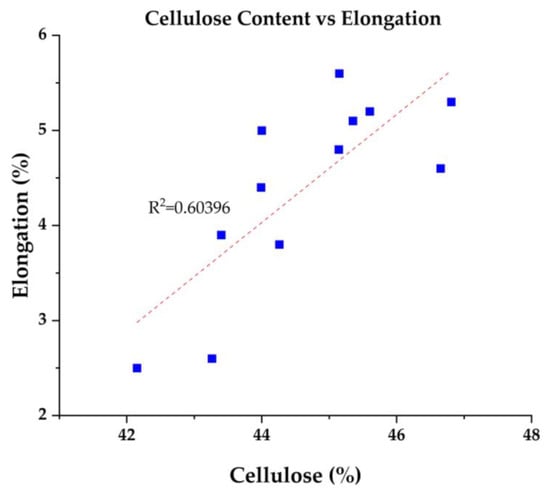
Figure 19.
Influence of cellulose loss on the elongation capacity of RSS.
Consequently, an analysis of the mechanical characteristics of VFS after NaOH treatment marks differential guidelines with respect to choosing them as a reinforcement fiber in CMS. The above considers the service performance that the CMS to be reinforced with VFS must have. That is, the behavior of the fiber under mechanical stresses may be different depending on the interaction and function intended with its matrix. Interactions can generate different behaviors under different stresses, of which joint fiber–matrix rupture, an initial rupture of the matrix, followed by the fiber, and an initial rupture of the fiber, followed by the matrix, comprise the special cases that depend on the CMS performance requirements [52].
4. Discussion
It is important to identify the VFS by searching for local and updated references or by submitting them to relevant tests that indicate their physicochemical and mechanical characteristics, in order to have current data that will serve as a starting point for obtaining the desired results for the conformation of the CMS that require the use of VFS as a reinforcement.
This is due to the natural origin of the RSW, a characteristic that makes its resistance and chemical composition variable, due to factors such as the geographical location where the crop is grown, soil type, climate, planting process, type of fertilization, and even the harvesting method, among others.
Accordingly, the results of the ADF, NDF, and cellulose tests performed on the RSS-1, RSS-2, and RSS-3 W/Ut were very close to those reported in the references [34,46,53]. However, in spite of the climatic variations present in recent decades at the world level, together with the different local practices implemented for the cereal crops, it is not advisable to omit the realization of tests and take data from several years of publication, in order to describe the chemical composition and mechanical resistance of VFS in future research, as performed in the reference [54].
On the other hand, the notorious physicochemical changes in the RSS-3 that were exposed to the NaOH treatments, of which the losses in Si, Lg, and Hm exposed the TS of the RSW, were caused by the NaOH concentrations and exposure times of the RSS-3t in an alkaline environment. The exposure of the longitudinal surface of the RSS-3t allowed for an identification of the bodies present in the epidermis of the samples, facilitating their recognition in a more precise manner. This is an acknowledgement that coincided with that made by the study reported in the reference [55].
Similarly, the % of the NaOH concentration and the exposure time of the RSS-3t in the alkaline environment was directly proportional to the reduction in their physicochemical and mechanical characteristics. For this reason, the NaOH 3% for 2 h treatment presented the lowest value in the mechanical resistance compared to the other RSS. However, the results showed that the samples with lower mechanical strength values had a high % elongation, characteristics that coincide with those reported by the study carried out in reference [42], in which a maximum concentration of NaOH at 10% was used.
Similarly, the losses in the Lg and Hm present in the vegetal cell walls were evident in the reduction of the Id of the RSS, as demonstrated in the cross-sectional views, where a laminar effect was presented by the reduction in the Vb of the Ct. A similar situation was described by the study carried out in [43], in which a variation in the sample diameters due to the losses in the Lg and Hm coating caused by the alkaline treatment was described.
5. Conclusions
From an analysis of Table 4, Table 5 and Table 6, it can be identified that the Ml of the RSS-3t was directly proportional to the increases in the NaOH concentration and its exposure time in the alkaline environment. In the same way, the values of the Ml of the RSS after the treatment with the NaOH are very useful data when estimating the quantities of treated RSS to be used in future research. In this way, resource expenditures for RSS preparation are avoided.
The determination of the Cl, Lg, and Hm contents in each of the RSS-3t is of utmost importance to guarantee the mechanical behavior of the VFS used for restrengthening in a CMS. This is because the restructuring of the % Cl, Lg, and Hm contents in the VFS caused by the NaOH process considerably modifies their mechanical properties.
The removal of the Si layer, as a direct effect of NaOH treatment, leaves the TS of the RSS exposed. Consequently, the losses in the Si, Lg, and Hm allow for a visualization and identification of the Fc found in the epidermis of the VFS. Similarly, the laminar effect presented in the cross-section of the RSS is a direct consequence of the loss in Lg present in the St that forms the stem walls. This particularity improves the mechanical anchorage of the VFS with its matrix at the time of its implementation as a reinforcement material in the elaboration of a CMS.
The main objective of the alkaline process in VFS must be clear. The mechanical characteristics of the CMS to be developed must be known. Accordingly, three particular cases can be chosen: (1) a higher resistance behavior and lower elongation behavior; (2) a higher elongation and lower resistance; and (3) equal resistance and elongation values.
Author Contributions
Research and resources, original draft—writing preparation O.H.-F.; conceptualization and methodology, O.H.-F., A.C.E. and H.V.; supervision, review and editing, A.C.E. and H.V.; formal analysis, A.C.E. and H.V. All authors have read and agreed to the published version of the manuscript.
Funding
This research received no external funding.
Data Availability Statement
Some or all data generated or used during the study are available from the corresponding author by request.
Acknowledgments
The authors would like to thank the Servicio Nacional de Aprendizaje SENA—Centro C.I.E.S—Regional Norte de Santander, especially the laboratory of analysis of materials for construction LABMAC, and Biotechnology and Nanotechnology laboratory—Tecnoparque SENA—Nodo—Cucuta.
Conflicts of Interest
The authors declare no conflict of interest.
Abbreviations
| Abbreviation | |
| ADF | Acid Detergent Fiber |
| Av | Average |
| C | Carbon |
| Cc | Cellulose cell |
| Cl | Cellulose |
| CMS | Composite Materials |
| Ct | Conductive tissue |
| Ec | Elongated cells |
| EDS | Energy Dispersive X-ray Spectroscopy |
| Et | Time in hours |
| FAO | Food and Agriculture Organization |
| Fc | Fundamental cells |
| Fm | Phloem |
| g | Grams |
| GC | Green Composites |
| h | Hours |
| Hc | Hair-like cells |
| Hm | Hemicellulose |
| Id | Inner diameter |
| IS | Industrial Sector |
| Kg | Kilograms |
| l | Liters |
| Lg | Lignin |
| Max | Maximum |
| Mf | Microfibrils |
| Min | Minimum |
| Ml | Mass loss |
| Ms | Mass in grams |
| Msc | Mass collected |
| N | Newton |
| NDF | Neutral Detergent Fiber |
| Nfs | Non-functional stomata |
| O | Oxygen |
| P | Pores |
| pH | Acidity |
| Ph | Phytoliths |
| Pl | Papillae |
| PS | Productive Sectors |
| Rs | Surface roughness |
| RSS | Rice Straw Samples |
| RSS-1 | The sample was taken in the field minutes after cutting by the harvester |
| RSS-2 | The sample was taken in the field 3 days after harvesting |
| RSS-3 | The sample was taken in the field 5 days after harvesting |
| RSS-3 W/Ut | Untreated Washed RSS-3 |
| RSS-3t | Treated Rice Straw Simples RSS-3 |
| RSW | Rice Straw |
| Sb | Suberose cells |
| Sbc | Sub-stomatic chamber |
| Sc | Siliceous cells |
| Sca | Areas covered by Si |
| SEM | Scanning Electron Microscopy |
| Sf | Supporting fibers |
| Sh | Single hair |
| Si | Silica |
| Ssg | Silica–suberose cell grouping |
| Ta | Tantalum |
| TS | Surface topography |
| UN | United Nations |
| V | Veins |
| Vb | Vascular bundles |
| VFS | Vegetable Fibers |
| Vr | Venous rupture |
| W | Washes |
| Xm | Xylem |
| Nomenclature | |
| H2O | Distilled water |
| Determination coefficient | |
| %Cv | Coefficient of variation |
| %H | Moisture content |
| Chemical formulas | |
| CH3-COOH | Acetic acid |
| Potable water | |
| NaOH | Sodium hydroxide |
References
- Benzerara, M.; Guihéneuf, S.; Belouettar, R.; Perrot, A. Combined and synergic effect of algerian natural fibres and biopolymers on the reinforcement of extruded raw earth. Constr. Build. Mater. 2021, 289, 123211. [Google Scholar] [CrossRef]
- United Nations Human Rights, Office of High Commissioner. Available online: https://previous.ohchr.org/Documents/Issues/ClimateChange/materials/KMClimateChange.pdf (accessed on 31 December 2022).
- Ramos Ruiz, G.; del Olloqui Olmo, A. Climate Change Performance of nZEB Buildings. Buildings 2022, 12, 1755. [Google Scholar] [CrossRef]
- Hurtado-Figueroa, O.; Cardenas-Gutierrez, J.; Acevedo-Penaloza, C. Substitution of natural stony material aggregates in conventional 17.5 Mpa non-structural concrete mixtures by means of percentage addition of hospital solid waste. Contemp. Eng. Sci. 2018, 11, 4995–5004. [Google Scholar] [CrossRef]
- Rivera-Gómez, C.; Galán-Marín, C.; López-Cabeza, V.P.; Diz-Mellado, E. Sample key features affecting mechanical, acoustic and thermal properties of a natural-stabilised earthen material. Constr. Build. Mater. 2021, 271, 121569. [Google Scholar] [CrossRef]
- Araya-Letelier, G.; Antico, F.C.; Burbano-Garcia, C.; Cobcha-Riedel, J.; Norambuena-Contreras, J.; Concha, J.; Saavedra, E.I. Experimental evaluation of adobe mixtures reinforced with jute fibers. Constr. Build. Mater. 2021, 276, 122127. [Google Scholar] [CrossRef]
- Poranek, N.; Łaźniewska-Piekarczyk, B.; Czajkowski, A.; Pikoń, K. MSWIBA Formation and Geopolymerisation to Meet the United Nations Sustainable Development Goals (SDGs) and Climate Mitigation. Buildings 2022, 12, 1083. [Google Scholar] [CrossRef]
- AlShuhail, K.; Aldawoud, A.; Syarif, J.; Abdoun, I.A. Enhancing the performance of compressed soil bricks with natural additives: Wood chips and date palm fibers. Constr. Build. Mater. 2021, 295, 123611. [Google Scholar] [CrossRef]
- Tarique, J.; Sapuan, S.M.; Khalina, A.; Sherwani, S.F.K.; Yusuf, J.; Ilyas, R.A. Recent developments in sustainable arrowroot (Maranta arundinacea Linn) starch biopolymers, fibres, biopolymer composites and their potential industrial applications: A review. J. Mater. Res. Technol. 2021, 13, 1191–1219. [Google Scholar] [CrossRef]
- Callejas, I.J.A.; Moussalem, R.; da Aparecida Guarda, E.L.; Cleonice, L.; Carvalho, K.; Roseta, F.; Mendes, L. Bermed earth-sheltered wall for low-income house: Thermal and energy measure to face climate change in tropical region. Appl. Sci. 2021, 11, 420. [Google Scholar] [CrossRef]
- Hussain, Q.; Ruangrassamee, A.; Joyklad, P.; Wijeyewickrema, A.C. Shear Enhancement of RC Beams Using Low-Cost Natural Fiber Rope Reinforced Polymer Composites. Buildings 2022, 12, 602. [Google Scholar] [CrossRef]
- Hurtado-Figueroa, O.; Cardenas-Gutierrez, J.A. Aligerantes de Losas y Entrepisos a Base de Materiales Ecológicos. XIV CIATTI Congreso Internacional de Arquitectura de Tierra, Tradición e Innovación, Ciudad de México, 2017. Cátedra Juan Villanueva 2018, 209–218. Available online: http://www5.uva.es/grupotierra/publicaciones/digital/libro2018mexico/18XIVCIATTI2017.pdf (accessed on 4 February 2023).
- Machaka, M.; Khatib, J.; Baydoun, S.; Elkordi, A.; Assaad, J. The Effect of Adding Phragmites australis Fibers on the Properties of Concrete. Buildings 2022, 12, 278. [Google Scholar] [CrossRef]
- Vigneshwaran, S.; Sundarakannan, R.; John, K.M.; Deepak, R.; Arun, K.; Ajith, S.; Arumugaprabu, V.; Uthayakumar, M. Recent advancement in the natural fiber polymer composites: A comprehensive review. J. Clean. Prod. 2020, 277, 124109. [Google Scholar] [CrossRef]
- Danso, H.; Manu, D. Influence of coconut fibres and lime on the properties of soil-cement mortar. Case Stud. Constr. Mater. 2020, 12, e00316. [Google Scholar] [CrossRef]
- Tiwa, T.; Foba, J.; Teixeira, R.; Ojo, E.; Charles, G.; Kadivar, M.; Savastano, H. Effect of cellulose pulp fibres on the physical, mechanical, and thermal performance of extruded earth-based materials. J. Build. Eng. 2021, 39, 102259. [Google Scholar] [CrossRef]
- Kouta, K.; Saliba, J.; Saiyouri, N. Effect of flax fibers on early age shrinkage and cracking of earth concrete. Constr. Build. Mater. 2020, 254, 119315. [Google Scholar] [CrossRef]
- Prabhu, L.; Krishnaraj, V.; Sathish, S.; Gokulkumar, S.; Karthi, K.; Rajeshkumar, L.; Balaji, D.; Vigneshkumar, N.; Elango, K.S. A review on natural fiber reinforced hybrid composites: Chemical treatments, manufacturing methods and potential applications. Mater. Today Proc. 2021, 45, 8080–8085. [Google Scholar] [CrossRef]
- Jawaid, M.; Abdul Khalil, H.P.S. Cellulosic/synthetic fibre reinforced polymer hybrid composites: A review. Carbohydr. Polym. 2011, 86, 1–18. [Google Scholar] [CrossRef]
- Wang, K.; Guo, F. Towards Sustainable Development through the Perspective of Construction 4.0: Systematic Literature Review and Bibliometric Analysis. Buildings 2022, 12, 1708. [Google Scholar] [CrossRef]
- Tejyan, S.; Baliyan, N.K.; Patel, V.K.; Patnaik, A.; Singh, T. Polymer green composites reinforced with natural fibers: A comparative study. Mater. Today Proc. 2020, 44, 4767–4769. [Google Scholar] [CrossRef]
- Mazzanti, V.; Pariante, R.; Bonanno, A.; Ruiz de Ballesteros, O.; Mollica, F.; Filippone, G. Reinforcing mechanisms of natural fibers in green composites: Role of fibers morphology in a PLA/hemp model system. Compos. Sci. Technol. 2019, 180, 51–59. [Google Scholar] [CrossRef]
- Shrivastava, A.; Dondapati, S. Biodegradable composites based on biopolymers and natural bast fibres: A review. Mater. Today Proc. 2021, 46, 1420–1428. [Google Scholar] [CrossRef]
- Norouzi, M.; Chàfer, M.; Cabeza, L.F.; Jiménez, L.; Boer, D. Circular economy in the building and construction sector: A scientific evolution analysis. J. Build. Eng. 2021, 44, 102704. [Google Scholar] [CrossRef]
- Das, P.P.; Chaudhary, V. Moving towards the era of bio fibre based polymer composites. Clean. Eng. Technol. 2021, 4, 100182. [Google Scholar] [CrossRef]
- Motru, S.; Adithyakrishna, V.H.; Bharath, J.; Guruprasad, R. Development and Evaluation of Mechanical Properties of Biodegradable PLA/Flax Fiber Green Composite Laminates. Mater. Today Proc. 2022, 24, 641–649. [Google Scholar] [CrossRef]
- Ben Sghaier, A.E.O.; Chaabouni, Y.; Msahli, S.; Msahli, S.; Sakli, F. Morphological and crystalline characterization of NaOH and NaOCl treated Agave americana L. fiber. Ind. Crops Prod. 2021, 36, 257–266. [Google Scholar] [CrossRef]
- Abhiram, Y.; Das, A.; Sharma, K.K. Green composites for structural and non-structural applications: A review. Mater. Today Proc. 2021, 44, 2658–2664. [Google Scholar] [CrossRef]
- Global Rice Science Parthership. Rice Almanac. 2013. Available online: https://es.scribd.com/document/357828846/Rice-Almanac-4th-Edition (accessed on 24 October 2022).
- Fondo Nacional del Arroz FEDEARROZ. Contexto Mundial Y Nacional Del Cultivo Del Arroz: 2000–2020. Fed. Nac. Arroceros—Fedearroz 2021, 1–42. Available online: https://fedearroz.s3.amazonaws.com/media/documents/Cartilla_Contexto_Mundial_y_Nacional_del_cultivo_de_arroz_2000-2020_dXUQLuQ.pdf (accessed on 15 December 2022).
- Rice Knowledge Bank. Available online: http://www.knowledgebank.irri.org/step-by-step-production/postharvest/rice-by-products/rice-straw (accessed on 12 November 2022).
- Singh, S.; Patel, M. Effective utilization of rice straw in value-added by-products: A systematic review of state of art and future perspectives. Biomass Bioenergy 2022, 159, 106411. [Google Scholar] [CrossRef]
- Food and Agriculture Organization of the United Nations. Available online: https://www.fao.org/worldfoodsituation/csdb/en/ (accessed on 15 September 2022).
- Jiang, D.; Jiang, D.; Lv, S.; Cui, S.; Sun, S.; Song, X.; He, S.; Zhang, J. Effect of flame-retardant rice straw fibers on properties of fiber cement-based composites at high temperatures. J. Build. Eng. 2021, 44, 102923. [Google Scholar] [CrossRef]
- Bassyouni, M.; Hasan, U.L. The use of rice straw and husk fibers as reinforcements in composites. Biofiber Reinf. Compos. Mater. 2015, 13, 385–422. [Google Scholar] [CrossRef]
- Goodman, B.A. Utilization of waste straw and husks from rice production: A review. J. Bioresour. Bioprod. 2020, 5, 143–162. [Google Scholar] [CrossRef]
- Delgado, A.E.; Aperador, W.; Palacio, O. Tratamiento superficial de la fibra de Retamo Liso: Mercerización. Ingenium Rev. Fac. Ing. 2014, 15, 95–100. [Google Scholar] [CrossRef]
- Mwaikambo, L.Y.; Ansell, M.P. Chemical modification of hemp, sisal, jute, and kapok fibers by alkalization. J. Appl. Polym. Sci. 2002, 84, 2222–2234. [Google Scholar] [CrossRef]
- Senthilkumar, K.; Saba, N.; Chadrasekar, M.; Jawaid, M.; Rajini, M.; Siengchin, S.; Ayrilmis, N.; Mohammad, F.; Al-Lohedan, H. Compressive, dynamic and thermo-mechanical properties of cellulosic pineapple leaf fibre/polyester composites: Influence of alkali treatment on adhesion. Int. J. Adhes. Adhes. 2021, 106, 102823. [Google Scholar] [CrossRef]
- Mohammed, L.; Ansari, M.N.M.; Pua, G.; Jawaid, M.; Islam, M.S. A Review on Natural Fiber Reinforced Polymer Composite and Its Applications. Int. J. Polym. Sci. 2015, 2015, 243947. [Google Scholar] [CrossRef]
- Wang, K.; Chen, J.; Sun, S.N.; Sun, R.C. Steam Explosion. Pretreat. Biomass 2015, 6, 75–104. [Google Scholar] [CrossRef]
- Gu, H. Tensile behaviours of the coir fibre and related composites after NaOH treatment. Mater. Des. 2009, 30, 3931–3934. [Google Scholar] [CrossRef]
- Kabir, M.M.; Wang, H.; Lau, K.T.; Cardona, F. Tensile properties of chemically treated hemp fibres as reinforcement for composites. Compos. Part B Eng. 2013, 53, 362–368. [Google Scholar] [CrossRef]
- Normalización Española. UNE-EN ISO 16472:2007. Available online: https://www.une.org/encuentra-tu-norma/busca-tu-norma/norma?c=N0039022 (accessed on 5 February 2022).
- Normalización Española. UNE-EN ISO 13906:2009. Available online: https://www.une.org/encuentra-tu-norma/busca-tu-norma/norma?c=N0042559 (accessed on 5 February 2022).
- ASTM. D1776/D1776M-20. Available online: https://www.astm.org/d1776_d1776m-20.html (accessed on 15 March 2022).
- ICONTEC. NTC 386:2011. Available online: https://tienda.icontec.org/gp-ensayo-de-las-propiedades-de-tension-de-hilos-mediante-el-metodo-de-monofilamento-ntc386-2011.html (accessed on 15 March 2022).
- ASTM. D2256/D2256M-10(2015). Available online: https://www.astm.org/d2256_d2256m-10r15.html (accessed on 15 March 2022).
- Harane, R.S.; Mehra, N.R.; Tayade, P.B.; Adivarekar, R.V. A facile energy and water-conserving process for cotton dyeing. Int. J. Energy Environ. Eng. 2014, 5, 1–10. [Google Scholar] [CrossRef]
- Fiore, V.; Di Bella, G.; Valenza, A. The effect of alkaline treatment on mechanical properties of kenaf fibers and their epoxy composites. Compos. Part B Eng. 2015, 68, 14–21. [Google Scholar] [CrossRef]
- Huang, Y.; Tan, J.; Xuan, X.; Liu, L.; Xie, M.; Liu, H.; Yu, S.; Zheng, G. Study on untreated and alkali treated rice straw reinforced geopolymer composites. Mater. Chem. Phys. 2020, 262, 124304. [Google Scholar] [CrossRef]
- Parlato, M.C.M.; Cuomo, M.; Porto, S.M.C. Natural fibers reinforcement for earthen building components: Mechanical performances of a low quality sheep wool (Valle del Belice sheep). Constr. Build. Mater. 2022, 326, 126855. [Google Scholar] [CrossRef]
- Xie, X.; Zhou, Z.; Jiang, M.; Xu, X.; Wang, Z.; Hui, D. Cellulosic fibers from rice straw and bamboo used as reinforcement of cement-based composites for remarkably improving mechanical properties. Compos. Part B Eng. 2015, 78, 153–161. [Google Scholar] [CrossRef]
- De Azevedo, A.R.G.; Amin, M.; Hadzima-Nyarko, M.; Agwa, I.; Zeyad, A.; Tayeh, B.; Adesina, A. Possibilities for the application of agro-industrial wastes in cementitious materials: A brief review of the Brazilian perspective. Clean. Mater. 2022, 3, 100040. [Google Scholar] [CrossRef]
- Xie, X.; Gou, G.; Wei, X.; Zhou, Z.; Jiang, M.; Xu, X.; Wang, Z.; Hui, D. Influence of pretreatment of rice straw on hydration of straw fiber filled cement based composites. Constr. Build. Mater. 2016, 113, 449–455. [Google Scholar] [CrossRef]
Disclaimer/Publisher’s Note: The statements, opinions and data contained in all publications are solely those of the individual author(s) and contributor(s) and not of MDPI and/or the editor(s). MDPI and/or the editor(s) disclaim responsibility for any injury to people or property resulting from any ideas, methods, instructions or products referred to in the content. |
© 2023 by the authors. Licensee MDPI, Basel, Switzerland. This article is an open access article distributed under the terms and conditions of the Creative Commons Attribution (CC BY) license (https://creativecommons.org/licenses/by/4.0/).