Abstract
The concept of integrating PV panels into traditional ETICS facades has been developing for several years. Problems concerning the options for passively controlling the temperatures of PV panels with PCM and directing excess moisture out of the wall via diffusion channels have been previously studied theoretically. During this study, real wall-scale experiments were conducted to test the thermal and hygrothermal performance of the wall system in an extreme climatic environment, as well as in a real outdoor environment in Tallinn, Estonia. Finally, a simulation model was calibrated according to the measured data. It was found that in case of test walls with diffusion channels, it was possible to keep the moisture content of PCM mortar under 0.11 m3/m3. Excess water drained out via channels leading to the external environment. Without diffusion channels, the moisture content rose as high as 0.18 m3/m3. Both the experiments and hygrothermal modelling showed that the high moisture content of PCM mortar, caused by water leakage, dropped to 0.08 m3/m3 over 10 solar cycles as moisture escaped via the diffusion channels. PCM mortar with a moisture content of 0.08 m3/m3 endured extreme rain and freeze-thaw cycles without visual damage, and PV panels retained their electrical production capabilities.
1. Introduction
Building-integrated photovoltaics (BIPV) are becoming increasingly widespread to reduce the CO2 emissions of buildings, which account for 36% of emissions [1], and to produce green electricity locally. There is a large demand for visually appealing BIPV systems [2], but unfortunately, the majority of the BIPV systems still depend on fixed-tilt PV module systems [3].
For ventilated-façade-integrated photovoltaic (PV) panels, there are many solutions to choose from. Example procedures are available to clarify how to develop PV systems on ventilated facades [4]. The majority of BIPV facades are constructed as ventilated facade technologies using PV panels as a rain screen cladding system, which adds an additional protection layer against hygrothermal problems. There is some recent research on developing a system to apply PV panels onto existing and new ETICS (external thermal insulation composite system) facades, but there is still a ventilation gap planned between PV and ETICS [5].
The traditional ETICS concept consists of insulation material, glued directly to the structural layer with adhesive mortar and the plaster system, consisting of base coat and finishing plaster, which is applied directly to the insulation layer. This means that there is no air cavity, and the outer layer of the wall system has relatively high resistance to water vapour diffusion.
If PV panels were applied directly on thermal insulation, there could be some undesirable effects, e.g., overheating or moisture condensation. To address the aspect of overheating, there has been some research about using latent heat storage of phase change materials (PCM) for temperature stabilisation of the PV panels, both passively [6] and actively [7]. There have also been studies conducted with double-skin facades with integrated PCM layers and PV glazing [8], but in this case there was an air chamber between the PV and PCM, with the possibility to open and close the ventilation gaps. Combination of PV and PCM has also shown potential in reducing overall energy consumption of buildings in cold climates [9]. Although PCM applications are a relatively new technology in the construction sector, there are some data from indoor applications stating that after a decade, PCM was still working as a passive heat sink, despite showing a significant decrease in the PCM capacity [10].
However, the PCM and PV solution has not been combined with traditional ETICS facade systems before. The application of diffusion gaps in the PCM layer to avoid moisture condensation and accumulation has not been studied in the past.
The concept of an En-ActivETICS facade integrates traditional ETICS facade technology with PV panels. There has been theoretical work conducted towards the development of the facade concept [11,12,13]. Measurements with real test walls regarding the electrical and thermal performance have also been conducted [14], as well as comparisons between different PV-ETICS integration solutions and free standing PV panels. However, the hygrothermal performance of this wall concept has not been studied by experimental methods before.
Earlier studies have proven that applying a thick layer of PCM mortar is effective in avoiding the overheating of PV panels [14]. However, applying a vapour-tight layer on the outermost side of the facade creates a situation in colder climates where moisture is not able to get out of the wall via diffusion in the same way it does in the case of traditional ETICS. This problem was identified and analysed numerically in [15]. A solution utilising diffusion gaps connected to the outside environment between a pair of steel sheets at the lower part of the PV has been proposed and developed [16]. However, the overall hygrothermal performance of this solution has not been studied before, except for the initial drying-out process of PCM mortar just after the application [16].
In the results of several empirical studies, it has been found that one common mechanism for ETICS facades to deteriorate prematurely is water leaks through the cracks [17,18,19]. During the lifespan of ETICS facades, micro-cracks tend to appear after several years. As water seeps into the micro-cracks, they become wider, leading to even more water penetrating the facade plaster, which starts the vicious cycle of degradation. Integrating a dark-coloured PV panel into the light-coloured facade significantly increases the theoretical risk of cracks appearing, due to the number of joint details between different materials. Unfortunately, ETICS systems are known to be not very robust, and minor defects could lead to deterioration [20]. Therefore, if more complexity is added to the ETICS system via the integration of PV, diffusion channels should be recommended as a countermeasure to increase the robustness of the system.
Therefore, it is necessary to thoroughly test this novel facade system, which takes into account the expectation that there will be cracks in the facade and that water will eventually leak into the wall. This is a new approach that has not yet been tried on a wall that combines PV panels, PCM mortar, and an ETICS facade. If a hygrothermally well-performing facade solution can be developed, then this novel En-activETICS facade could have a huge market potential to alleviate the energy crisis. There has been a great demand for BIPV for several years, and there are also many different BIPV solutions on the market, but there are many concerns among architects about the BIPV facade solutions available today, as they are difficult to blend in as a part of the architecture [21]. In contrast to ventilated BIPV solutions, En-ActivETICS would be on the same surface plane as facade plaster and would make it possible to create interesting patterns of PV and facade plaster areas.
It was found in [22] that despite ETICS facades being often preferred for building renovation as being a cost-optimal solution, they tend to have a higher carbon footprint than pre-fabricated timber elements. If PV panels are integrated into otherwise affordable ETICS facades, they could offset some of the carbon footprint and become closer to also being CO2e optimal. Therefore, there could be a large market potential for En-ActivETICS for both new and renovated buildings, but the hygrothermal performance of the novel wall concept must be thoroughly studied first.
The aim of the study was to test the constructability and study the hygrothermal performance of a novel facade system that combines PV panels, PCM mortar and ETICS.
2. Methods
To test the concept of hygrothermal performance, two real-scale test walls were built. One wall was built in a climate chamber to test the system in a controlled and critical environment. The test package consisted of water injection, solar radiation, wind-driven rain (WDR) and freezing tests. Another wall was built into the existing facade of a test building to be studied under real outdoor climate conditions. All measurements were compared with data from calculations in order to calibrate the model.
The cross-section of an En-ActivETICS element (Figure 1b) consists of a structural layer, 160 mm of insulation (EPS or mineral wool), 30 mm thick PCM mortar (cement-based mortar, mixed with PCM granules) and a 2 mm flexible PV (FPV) panel. Thin FPV was chosen because of its relatively light weight and its ability to be glued directly onto the surface of PCM mortar [11]. The 100 W FPV panel [23] used on the wall has monocrystalline silicon wafers in the functional layer, TPT (Tedlar Polyester Tedlar) as the back sheet and flexible transparent plastic as the outermost layer for weather protection. The FPV does not have any frame for structural integrity and therefore needs to be glued to the surface.
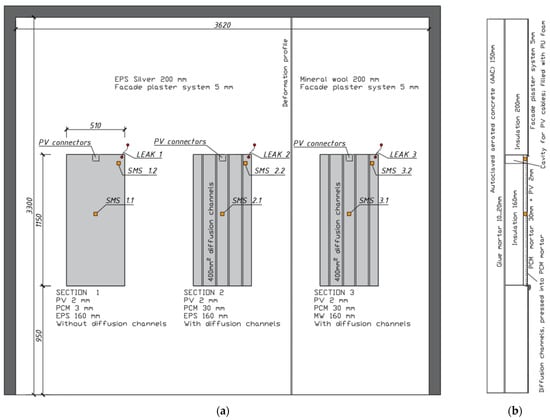
Figure 1.
Layout (a) and cross section (b) of a test wall in the climate chamber. Locations of soil moisture sensors are marked as “SMS” and points where water leaked in are marked as “LEAK”.
Four diffusion channels for each panel were carved into the PCM mortar before hardening. Cable connectors were placed inside a cavity in the insulation layer, on the upper part of the PV and during installation, and the cavity was filled with PU foam. As waterproof MC4 connectors were used to make the connections, no special junction box was needed. The exact building process and detailing of the solution has been described before, in [16].
Between and all around the PV panels, a traditional ETICS with 200 mm of insulation was installed. The load-bearing structure was built from 150 mm of AAC (autoclaved aerated concrete) without internal plaster, to maximise the indoor moisture load corresponding to the worst-case scenario. The reasons for choosing AAC as the critical structural material are high levels of built-in moisture and relatively low water vapour diffusion resistance factor (μ = 7).
2.1. Test Wall in Climate Chamber
The climate chamber can simulate both indoor and outdoor temperature (−25 °C to +70 °C) and relative humidity (RH = 5…98%). In the outdoor chamber, WDR was simulated with additional water sprinkler stands and short-wave thermal radiation was simulated with halogen stands.
A 3.6 m wide and 3.3 m high test wall was built in the climate chamber (Figure 2a) with three different sections: (1) Reference section with PCM mortar without diffusion channels; (2) PCM mortar on expanded polystyrene (EPS) with diffusion channels behind PV; and (3) PCM mortar on mineral wool (MW) insulation with diffusion channels behind PV (Figure 1). EPS and mineral wool areas were separated with PU foam and the facade plaster was separated with a deformation profile on top of the PU foam.
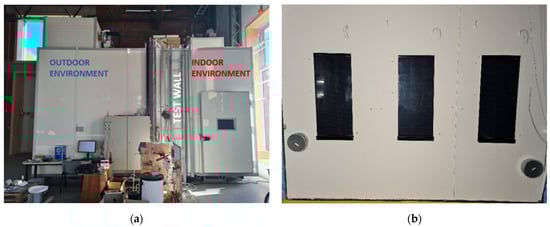
Figure 2.
Climate chamber used for building the test wall (a) and the test wall inside the climate chamber (b).
2.2. Test Wall under Real Outdoor Climate Conditions
Besides the mock-up developed for investigations under a critical and controlled environment (climate chamber), it was decided to build another test wall to enable tests on the actual facade under real outdoor climate conditions in Tallinn, Estonia. Tallinn (59.44° N, 24.75° E) is located in a humid continental climate with warm to hot (and often humid) summers and freezing cold (Dfb according to the Koppen–Geiger climate classification system) [24]. The facade faces directly south (180° azimuth) and is located on the first storey, therefore not receiving the most extreme WDR loads (Figure 3). The wall itself was exactly the same as the one built in the climate chamber as section no. 2—PCM mortar on EPS with diffusion channels (Figure 1a), in order for the results to be comparable. The analysed period of measurements was from June to August 2022.
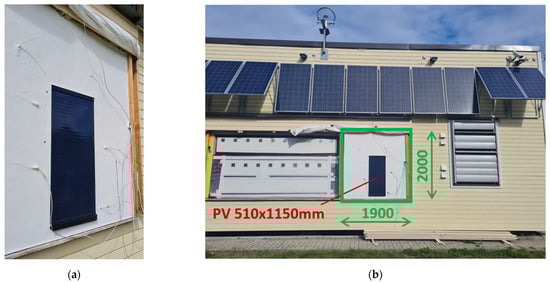
Figure 3.
Test wall in Tallinn under real climate conditions (a) and overview of the test house (b). Pyranometer, used for measuring radiation, is visible above the roof line of test house.
2.3. Sensors Used for Measurement
Temperature, relative humidity (RH), volumetric moisture content and heat flux were measured inside the test walls (climate chamber and real facade) and on the surface. Solar radiation on the wall, wind velocity, outside air temperature and RH were also measured. Two or three alternative sensors were used to measure each parameter independently to optimise for data availability, cost efficiency and reliability of the measured data. To measure the temperature inside the walls, the following temperature sensors were used: Onset Hobo TMC15-HD with data logger UX120-006M and Littelfuse KS103J2 NTC thermistor with data logger Grant Squirrel SQ2020 1F8. RH and temperature were measured with an Onset Hobo UX100-023; a Rotronic Hygroclip HC2-C05 with A/D converter Siemens SM331 6ES7331 and a Sensirion SHT35 & tailor-made logger based on Arduino Mega.
Moreover, volumetric moisture content inside the PCM mortar was measured with EC-5 soil moisture sensors [25]. The sensors were calibrated specifically for measuring this PCM mortar, as the result of several small-scale experiments and formulas for calculating volumetric moisture content with temperature corrections [16].
2.4. Injecting Water into the Wall
As the climate chamber test is an accelerated version of real-life processes, real cracks were unlikely to develop during the test. Moreover, the overall facade plaster area was much smaller, and the construction process was carried out in a favourable environment. But it was still necessary to imitate water leakages through the cracks in the system as they tend to appear on real ETICS facades.
To imitate the critical leakages, water hoses were installed into the wall. It is most likely that the cracks on a real facade would appear on the corners, where PV panels and facade plaster are joined together. Therefore, the ends of the water hoses were installed to the upper corners, behind the PV panel and into the PCM mortar layer. Tubes were designed to make it possible to inject water into the wall using a common medical syringe (Figure 4b). PCM mortar moisture content was measured in the area immediately exposed to the increased moisture content caused by the leakage (Figure 4a). Another sensor was further away. During the drying-out phase and WDR experiments, the injection tube ends were sealed with vapour-tight tape.

Figure 4.
Water tubes for injecting water into the wall were installed before the application of PCM mortar (a); after finishing the facade system, water was injected behind the PV panel with a syringe (b); from sections with diffusion channels, water dripped out between bottom steel sheets (c).
The amount of water chosen to inject into the wall was chosen to be on the extreme side. It has been found out experimentally that through a 0.4 × 4 mm crack in the cement fibre board, it is possible for 18 mL/min of water to enter the wall when rain is forced into the wall with 150 Pa of air pressure difference and 12 mL/min in the case of no air pressure difference [26]. It takes into account the WDR entering directly into the crack, and also the water flowing down the surface of the facade and entering the crack on the way [26].
The water was injected into all three wall sections simultaneously, with quantities of 40 mL for one 5-min session. All three injection pipes were filled with 10 mL of water, as pipe volume was limited. After a minute, water was absorbed by the wall and the tube was filled again. One injection session consisted of 4 injections, 10 mL each, for each test wall section. 40 mL of water represents heavy rain for approximately 3 min through a typical 0.4 × 4 mm crack [26]. The next injection session was conducted after the moisture content sensor readings had been stabilised. The total amount of water injected into all of the wall sections was 220 mL over a period of 5 days.
2.5. Radiation Cycles with Solar Simulators
To simulate solar radiation in the climate chamber, three radiation modules were built, each containing eight tungsten halogen light bulbs, approximately 230 W each (see Figure 5). Halogen lights were fixed on the aluminium sheet to help to distribute the radiation more evenly on the wall surface and to remove excess heat from the bulbs. The distance to the wall was appropriately selected to achieve a radiation intensity of 500 W/m2, which corresponds to the peak solar radiation on a vertical surface during the summer in Estonia. The regularity of the radiation intensity was measured with a pyranometer at different points inside the illuminated area. In total, an area of 1.2 m height and 2.5 m width was illuminated with radiation of 500 W/m2 with a deviation of less than 10%. For 3 modules, 24 halogen bulbs were used with a total nominal power of 5520 W.
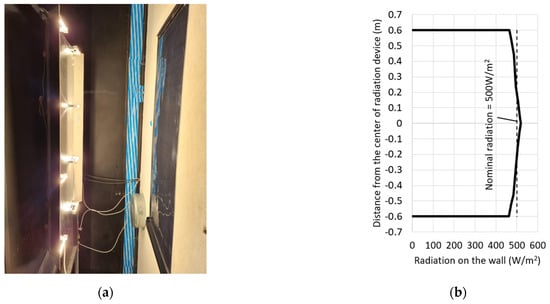
Figure 5.
Solar radiation emulator, made of 8 Tungsten halogen lamps and an aluminum sheet (a). Three of these radiation stands were used, one for each wall section tested. Radiation intensity graph (b) for the radiation device at distance of 60 cm (right). Zipp Zonen CMP11 Pyranometer was used to calibrate the radiation devices.
Tungsten halogen bulbs were chosen as the radiation source because they give out high light intensity with relatively low cost and have near-sunlight spectral distribution [27]. Compared to sunlight, halogen radiation is a little weaker in the ultraviolet and stronger in the infrared range [28]. As the electrical output of PV panels was not the focus of the study, it can be stated that the thermal performances obtained under artificial and real environmental conditions were similar.
In total, 10 solar radiation cycles were performed to test the drying out of the leaked-in moisture. As an example, climate chamber temperature and RH for 2 of the cycles are shown in Figure 6. The temperature of the climate chamber was set to +20 °C, but the ventilator speed was limited to keep the air flow between the wall and the solar radiators within reasonable limits. There was stable vertical air flow at the wall of approximately 1.0 m/s.

Figure 6.
Temperature and RH inside the climate chamber during drying-out experiments. The increase in air temperature was due to the solar radiation simulators used to test the facade during 7 h cycles.
During the irradiation period, the air temperature close to the wall was measured at 29 °C, which simulates the air temperature on hot summer days in the Nordic climate. After approximately 7 h of stable radiation, the halogens were turned off and air in the chamber was mechanically cooled down to 20 °C, over approximately 1.5 h. Then it was kept stable during the following night for 17 h. Air flow was kept at the same level of 1.0 m/s during the whole experiment.
2.6. Wind-Driven Rain Experiment in Climate Chamber
For generating WDR load on the facade surface, water sprinkler stands were used. A method for calibrating exactly the same stands has been previously defined by Kotkas [29]. Three identical sprinkler stands were used, with 18 sprinklers in total. Each sprinkler was calibrated to spray water at 0.4 L/min. The distance between sprinklers and the wall was 55 cm and the amount of water reaching the wall was approximately 1.0 L/(min·m2).
The character of WDR-freeze cycles is described in Figure 7. The wall was sprinkled for 1 min and then there was a 9-min break for the water to absorb into the facade plaster. This cycle was repeated 36 times, resulting in 6 h of WDR. The external air temperature was stabilised at a level of 5 °C; however, as the tap water being used was warmer than 5 °C, it caused some temperature fluctuations in the climate chamber. During the experiment, the indoor climate was kept at +21 °C and 55% RH. External RH was not controlled, but rain cycles did raise it around 94% on average at +5 °C.

Figure 7.
Characters of one WDR-freeze cycle. 6 h of WDR is followed by 10 h of extreme cold and 8 h of melting. This 24 h cycle was repeated 10 times.
After the 6 h rain period, a period of extreme cooling down to −20 °C followed (Figure 7). Cooling down the chamber was conducted as quickly as technically possible just after the sprinkler tubes were emptied. It resulted in a thin layer of ice emerging on the facade surface (Figure 8). After 10 h, the chamber was heated up to 5 °C. After 24 h, a rain period started again. This cycle was carried out 10 times.

Figure 8.
Sprinklers for imitating WDR in climate chamber (a). Frozen facade after rain period (b,c).
2.7. Hygrothermal Simulations
All the results from the climate chamber experiments and test building experiments were compared to results from hygrothermal modelling. Delphin 6 software was used to develop a model of an En-ActivETICS wall. Delphin 6 uses the finite volume method to simulate the heat and moisture flow inside construction materials. Mathematical equations used in hygrothermal simulations are given in detail in [30,31]. More information about Delphin 6 software and about numerical validation can be found in [32].
For modelling the WDR and freeze-thaw cycles, two different approaches were used: the ‘Kirchhoff potential for liquid flux calculation’ and the ‘equilibrium ice model’. The ‘equilibrium ice model’ takes into account the phase change effect of water, when the liquid water content inside the PCM mortar and facade plaster freezes. The ‘Kirchhoff potential for liquid flux calculation’ uses a function generated from the Kl function to model the liquid water transport potential. Therefore, when a wet material freezes, calculations with Kirchoff potential do not account for additional energy that is absorbed by the freezing of the water inside material pores, which leads to underestimation of the time needed for the freezing and melting processes. On the other hand, this effect is taken into account when the ‘equilibrium ice model’ is used to conduct calculations. Both calculation methods take into account the phase change effect of PCM itself, as this effect is written as a u(T) function into the material file.
Material properties used in the modelling are given in Table 1. For autoclaved aerated concrete (AAC), adhesive mortar, EPS and mineral wool, materials from the Delphin database were used, with some minor changes according to local material manufacturers’ data sheets. The hygrothermal properties of the particular facade plaster system used in the experiment were previously measured at the Tallinn University of Technology [33]. Properties of the PCM composite mortar (made from PCM granules and cement filling) were measured both at Tallinn University of Technology and Lodz University of Technology [16].

Table 1.
Material properties used in hygrothermal modelling.
Figure 9 shows a horizontal cross section of the 2D calculation model. The PV panel is modelled not as a material layer, but as a vapour-tight boundary condition. Diffusion channels behind the PV panel are modelled as 20 mm wide sections of boundary condition with equivalent vapour diffusion thickness Sd = 0.5 m, which considers the physical length of the channel as well as the micro-convection effect inside the channel.

Figure 9.
Two-dimensional calculation model in Delphin 6. Horizontal cross-section representing the wall section with diffusion channels. Numbers in the figure reference to the modelled materials, shown in the table left from the main figure. In case of calculation without the diffusion channels, corresponding boundary condition (blue) was replaced by PV panel boundary condition (purple).
Boundary conditions used for indoor and outdoor climates are also described in Figure 8. During all experiments, the indoor and outdoor temperature and RH were measured with sensors. Solar radiation was measured with a pyranometer (total radiation for wall surface in the case of the climate chamber and only diffuse radiation for the real facade, because the wall was behind scaffolding coverings). Before WDR experiments, the amount of water reaching the facade surface in one minute was measured according to guidelines by [29] and the data were used as a boundary condition in the calculation model.
Preliminary model validation, mainly concerning the PCM mortar moisture content, has been conducted previously and is described in detail in [16]. All the experiments described in the current study were simulated, using measured indoor and outdoor conditions as boundary condition inputs, to further validate the outputs of the calculation model.
3. Results
3.1. Impact of Diffusion Channels to Work as Drainage Channels
Despite injecting equal amounts of water into the PCM mortar layer for each wall section (Figure 4), it turned out to be impossible to increase the moisture content of PCM mortar above 0.11 m3/m3 in the example with diffusion channels (Figure 10). The reason for this was that, after the second injection, water was starting to drip out from the PCM mortar between two steel sheets that were installed below the PCM mortar (Figure 4c). The first drops of water were visible below the PV panels after approximately 40 mL of water had been injected in the EPS example and 60 mL in the mineral wool example.

Figure 10.
Moisture content of PCM mortar during water leakage simulation into the wall by injection.
In the case of the wall section without diffusion channels, all the water stayed inside the wall, and it was possible to increase the moisture content of the PCM mortar, short-term and locally, up to 0.195 m3/m3, but over the long term, it stabilised around the 0.16 m3/m3 level, as localised high moisture content spread around the leak source. However, even after 2 weeks, the moisture content registered by the soil moisture sensor in centre of the wall without diffusion channels did not change significantly, signifying that most of the 220 mL of water was absorbed locally into the PCM mortar and it takes time for the moisture levels to stabilise.
In the case of the two specimens with diffusion channels, most of the water injected into the wall found its way out via the channels. Therefore, they do act as a drainage channels as well. However, based on just two leakage tube locations, it cannot be stated that it is always 100% guaranteed that water will find its way to the diffusion channel after penetrating into the wall.
3.2. Drying out of PCM Mortar with Controlled Radiation Cycles in Climate Chamber
Twenty-four hours after the water injection experiment, a controlled solar radiation experiment (Figure 5) was started in the climate chamber.
It can be seen from Figure 11 that the drying out of moisture in PCM mortar without the diffusion channels was significantly slower. This is also backed up by the calculation model results. The worst-case scenario (without diffusion channels, and high initial moisture content from the water leakage) showed very small changes of dampness, and the high moisture level even short-circuited the soil moisture sensor used. Overall, the modelled results show that 10 cycles do not reduce the moisture level below 0.148 m3/m3.
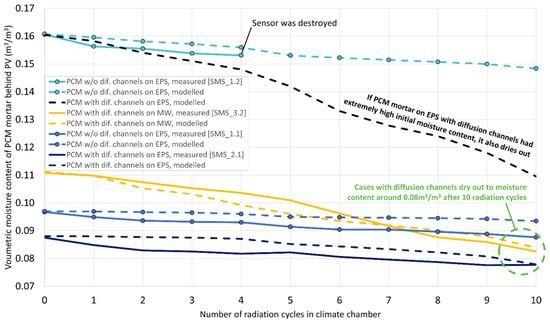
Figure 11.
Drying out process of PCM mortar with solar radiation cycles in climate chamber. Measured moisture content is compared to modelled moisture contents of the PCM mortar with and without (w/o) diffusion channels behind vapour-tight PV panel.
Besides modelling the measured cases, one hypothetical and more extreme case was modelled and analysed. This simulated the possibility that larger quantities of water could be injected into the wall section with diffusion channels and that the water would not drain out of the wall through the diffusion channels. Results (Figure 11, dashed black line) show that diffusion channels help the excess moisture to dry out during the summer period faster than without diffusion channels.
Overall, diffusion channels with a cross section of 400 mm2 spaced at every 130 mm do add additional moisture safety against water accumulation, and if a certain amount of water is still absorbed by the PCM mortar, it dries out much more easily during the summer period than without diffusion channels. Therefore, it can be assured that the moisture content will not build up over subsequent years.
Without diffusion channels, in cases where multiple PV panels are applied on the facade side-by-side, the situation becomes worse as the ratio between PV perimeter length and PV area becomes smaller. If diffusion channels are used, hygrothermal performance does not deteriorate if multiple PV panels are applied side-by-side as long as the height of the PV panel (and the height of the diffusion channel) does not change.
3.3. Initial Moisture Content and Drying out of PCM Mortar on Test Building Facade
Besides the climate chamber test, one test wall was built on the southern facade of the test facility and tested under real outdoor climate conditions (see Figure 3). AAC masonry was built in late April and insulation was applied within early May 2022. PCM mortar was applied in the middle of May and the facade was left to dry out under white scaffolding coverings, protected from direct sunlight and rain. Two weeks of drying out time has been proven to be enough, according to previous research [16]. During the dry-out period, the real walls tended to dry out faster than model predicts (Figure 12). This could be related to some inaccuracies in the liquid water conductivity function of the novel PCM mortar material. However, in the hygroscopic region, which is more relevant during the service life for the facade, the modelling accuracy is higher. After the dry-out period, a PV panel was glued to the PCM mortar, and facade plaster was applied to the rest of the test facade.

Figure 12.
Drying out of PCM mortar under real conditions on southern facade in Tallinn, Estonia during summer. Locations of soil moisture sensors are highlighted on the photos before and after application of PCM mortar with diffusion channels. Comparison with calculation model results is shown with dashed lines.
It can be seen from Figure 12 that despite the warm and sunny summer months of June and July, after covering the PCM mortar with the PV panel, the volumetric moisture content decreases slowly for one month. It can be seen that the drying process of PCM mortar, after covering with PV, is faster in the immediate region of the diffusion channel (corner point), than between two channels (middle point).
There is an unexpected increase in moisture content after application of the PV panel on the corner sensor (solid light blue line in Figure 12), which is significantly higher than the modelled moisture content representing the same measuring spot (dashed blue line). This could be explained by the non-homogeneous moisture load from the PV panel glue and by the micro-convection processes inside the diffusion channels. As there was warm weather after the application of the PV panel, moisture from glue mortar could have been travelling upwards via the diffusion channel with warm air. Because of its complexity, micro-convection inside the diffusion channels was not modelled.
3.4. Solar Radiation Experiment in Climate Chamber and Test Building
Solar radiation cycles in the case of the real wall were imitated in the climate chamber, but in a more controlled manner. In the climate chamber, there was constant irradiation for 7 h. Therefore, it made the hygrothermal performance of the wall easier to model. Overall, the temperatures of the PV panel, PCM mortar and facade plaster in the climate chamber and under real conditions during some warmer days were relatively similar (Figure 13). However, because of the controlled environment, the examples in the climate chamber are much more stable and give a higher correlation when compared to modelled results. It should be noted that peak temperatures are dependent on wind velocity—in the climate chamber this was a constant 1.0 m/s, but under real-world conditions, it varied.

Figure 13.
Temperature dynamics of energy activated facade, measured under real conditions on 30 June 2022 (a) and in climate chamber under simulated conditions (b).
There are noticeable differences between the modelled and measured temperatures in Figure 13. Although the maximum values are similar, there are differences in the heating up and cooling down speeds, especially under real climate conditions, which had much more unstable outside boundary conditions. However, if the results from the climate chamber are compared with those from the calculation model, it is visible that the real PCM mortar is heating up and cooling down slower than the modelled material. This could be most likely because of some inaccuracies of modelling heat capacity of relatively wet PCM mortar, but also because of some inhomogeneity in the mixture of PCM granules and mortar. Some differences could also be due to limitation of the Delphin model, being able to only use one average latent heat (u(T)) function for both the solidifying and melting processes, despite these processes being slightly different in the case of real material.
Differences in the facade plaster system temperatures are less significant, and, in the case of real wall, they are probably caused by some inaccuracies in modelling the wind effect and calculating the heat conduction of the surface. Differences in PV temperatures are probably a combination of differences in PCM mortar temperatures and inaccurate boundary conditions.
However, considering the prolonged nature of hygrothermal processes behind PV panels, the moisture content outputs are not so dependent on short-term inaccuracies of thermal modelling. Having a calculation model slightly underestimating the PCM effect could compensate the potential PCM capacity decrease over time [10].
3.5. Extreme Wind-Driven Rain and Freeze-Thaw Cycles in Climate Chamber
As expected, the temperature of the facade plaster changed much faster during cooling cycles than the temperature of the PCM mortar (Figure 14). It appeared that, during freezing cycles, there was a difference whether the ‘Kirchhoff potential for liquid flux calculation’ or the ‘equilibrium ice model’ was used in Delphin. The ice model does take into account the phase change effect when liquid water content inside the PCM mortar and facade plaster freezes. Using the ice model gives better correlation with measured results in the case of PCM mortar. However, as there is very little liquid water inside facade plaster, plaster temperatures are more accurate with the Kirchoff model.

Figure 14.
Facade plaster and PCM mortar temperatures measured in experiments and modelled with two different methods.
It should be noted that the difference between measured facade plaster temperatures and modelled ones during the WDR phase is caused by the fact that the tap water used in the experiment was slightly warmer than the air temperature (5 °C) in the chamber.
Besides temperature, the moisture content of the PCM mortar was measured with a soil moisture sensor during the WDR-freeze experiment. Overall, the moisture content of PCM mortar does not change significantly after 10 WDR-freezing cycles. At the beginning of the experiment, it was 0.078 m3/m3 for EPS and 0.075 m3/m3 for MW. After 10 cycles, volumetric moisture content was 0.076 m3/m3 for EPS and 0.080 m3/m3 for MW. Both test walls had diffusion channels.
Near-constant volumetric moisture content of PCM mortar during WDR-freeze cycles was also supported by modelled data. The main reason is that there were no cracks in the test facade and rainwater did not leak inside. Indoor excess moisture was not able to increase the moisture content of the PCM mortar significantly because there were also diffusion channels that decreased the moisture content of the PCM mortar at the same time.
After the experiment, the facade was observed for cracks visually from a distance of 30 cm with light intensity of 13,000 lux perpendicular to the wall. No visible cracks appeared after 10 extreme WDR and freezing cycles. Also, none of the PV panels were damaged during the experiment and they were able to produce the same amount of electricity.
4. Discussion
Overall, the facade system survived the series of tests without showing any signs of deterioration. The method for measuring liquid moisture content with specifically calibrated soil moisture sensors proved to be appropriate. Although, only one sensor survived all the experiments in the harsh, humid environment, so the correlation with modelled results could have deviations.
High WDR loads did not increase the moisture content behind the PV panel. This signifies that in the case of a relatively small surface area of the wall, under correct application conditions, and with good workmanship, the probability of cracks appearing is relatively low. Without cracks, the energy-activated ETICS is watertight even under extreme WDR loads. There is much further work to be done to find out what would be the maximum size of the PV ETICS facade elements before cracks start to appear under different climate conditions.
Earlier studies [17,18,19] have proven that, sooner or later, cracks do appear and water penetrates the facade surface. Therefore, liquid water was injected directly into the wall to imitate leakages. It was the only way to significantly increase the PCM mortar’s moisture content. This study showed that water injected into the wall with diffusion channels managed to escape through the double sheet steel joint below the PV panel. However, this might not be the case for every leakage location, as there were only two places where leaks were simulated. This is another topic where further studies are needed.
The study showed relatively good correlation between the experimental results and the calculated results from the Delphin 6 model. An accurate model makes it possible to conduct calculations for different climate conditions and with various loads and to therefore identify which climates are suitable for En-ActivETICS facades. Thorough hygrothermal calculations should be conducted in the future to assess the performance of the façade in other climates with the calculation model. More test facades should be built to different climate zones and to different buildings (for example, upper corners of the facades of high-rise buildings) to compare the calculated performance with actual performance. Critical climate zones for building the system could be selected via hygrothermal modelling.
Drainage channels with a cross section of 400 mm2 spaced at every 130 mm are highly recommended for every climate, as the risk of cracks appearing near the joints is high. Regardless of location, craftmanship errors and misapplication of construction technology can happen. If cracks have appeared, water leakage would increase the moisture content of PCM mortar behind the vapour-tight PV as it was simulated in the experiments. Results from drying-out experiments with solar radiation show that even if cracks do appear, the diffusion channels work as a secondary layer of protection.
Moreover, if diffusion channels are used, it makes it possible to apply multiple PV panels side-by-side, as excess moisture exits the wall through channels, not just through the surrounding facade plaster. This will make it possible to apply more PV panels on the facade and would lead to higher electricity production.
One limitation of the study was the relatively short time it took to perform the experiments. The extreme climate experiments were conducted during tens of climate cycles, but the results are not entirely extendable for the lifetime of the real facade system. The aging effect of the materials did not have an influence on the results because of the relatively short amount of time.
Despite the relative success of the experiments described in this study, the technology is still in development. Much more research should be conducted before manufacturing on the industrial scale can be started. Long-term hygrothermal studies should be conducted in real environments in different climate zones in the future. Possibilities to make the construction process of the wall system more effective via pre-fabrication should also be studied. Moreover, the economic aspects and carbon footprint of the system should be analyzed.
5. Conclusions
Creating a facade solution having a vapour-tight barrier as the outermost layer of the facade could result in high levels of moisture content inside the wall, especially if rainwater leaks inside the wall. This study proved that adding an extra layer of safety to the wall with diffusion channels helps the moisture to dry out much faster. Moreover, it was proven with water injection tests that diffusion channels also work as drainage channels. It is also significant that when vertical channels are used, applying PV panels side by side does not inhibit moisture performance as the PCM does not need to dry out only through the facade plaster. It makes the facade solution much more efficient, as there would be fewer PV–facade plaster joints to build on site for each PV panel installed. Overall, the diffusion channels are recommended to ensure the hygrothermal performance of the facade system.
This research resulted in a calibrated Delphin 6 model. Modelled results were calculated for each of the experiments to check the validation accuracy. A validated calculation model makes it possible to conduct long-term hygrothermal performance analyses for different climates in the future.
Overall, the En-ActivETICS facade system seems to be resistant to harsh wind-driven rain and freeze-thaw cycles. No cracks or physical deterioration appeared after 10 accelerated cycles. Facade plaster and PV panels were still fixed well on the thermal insulation and PCM mortar, and there was no immediate sign of frost damage. However, the overall durability still needs to be studied on the test wall under real climate conditions for several years. Before industrial application, several test facades with real building dimensions should also be tested in different climate zones.
It was found that in the case of test walls with diffusion channels, it was not possible experimentally to increase the moisture content of the PCM mortar higher than 0.11 m3/m3. Excess water drained out via the channels. Without diffusion channels, the moisture content in PCM mortar increased slightly because of the combined effects of indoor moisture load as well as injected water. Moisture content reached as high as 0.18 m3/m3. Both experiments and hygrothermal modelling showed that high moisture content (caused by water leakage) in walls with diffusion channels dried out to 0.08 m3/m3 in 10 days of high solar radiation, while it would take at least twice as much without the channels. Therefore, this facade system should be recommended to develop further only if diffusion channels are required.
Author Contributions
Conceptualization, S.I.; Methodology, M.T., S.I. and P.K.; Software, P.K. and M.P.; Validation, M.T.; Investigation, M.T.; Resources, P.K. and M.P.; Data curation, M.T.; Writing—original draft, M.T.; Writing—review & editing, S.I., T.K. and D.H.; Visualization, M.T.; Supervision, T.K.; Project administration, T.K. All authors have read and agreed to the published version of the manuscript.
Funding
This research was funded by the project En-ActivETICS in a framework of M-ERA.NET by ETAG (grant No. 3-4/MOBERA1719029), NCBiR (grant No. M-ERA.NET2/2018/2/2019) & SAS (grant No. M-ERA.NET 2/2018/786/En- ActivETICS), by the Estonian Centre of Excellence ZEBE (grant TK146), by personal research funding (grant PRG483), and by the European Commission through the LIFE IP project BuildEST (Reference: LIFE20 IPC/EE/000010).
Data Availability Statement
Detailed research data is available on demand, by contacting the corresponding author via e-mail.
Conflicts of Interest
The authors declare no conflict of interest. The funders had no role in the design of the study; in the collection, analyses, or interpretation of data; in the writing of the manuscript; or in the decision to publish the results.
References
- Economidou, M.; Todeschi, V.; Bertoldi, P.; D’Agostino, D.; Zangheri, P.; Castellazzi, L. Review of 50 years of EU energy efficiency policies for buildings. Energy Build. 2020, 225, 110322. [Google Scholar] [CrossRef]
- Basher, M.K.; Nur-E-Alam, M.; Rahman, M.M.; Alameh, K.; Hinckley, S. Aesthetically Appealing Building Integrated Photovoltaic Systems for Net-Zero Energy Buildings. Current Status, Challenges, and Future Developments—A Review. Buildings 2023, 13, 863. [Google Scholar] [CrossRef]
- Maghrabie, H.M.; Abdelkareem, M.A.; Al-Alami, A.H.; Ramadan, M.; Mushtaha, E.; Wilberforce, T.; Olabi, A.G. State-of-the-art technologies for building-integrated photovoltaic systems. Buildings 2021, 11, 383. [Google Scholar] [CrossRef]
- SUPSI. Standardization, Performance Risks and Identification of Related Gaps for a Performance-Based Qualification in BIPV; SUPSI: Manno, Switzerland, 2019. [Google Scholar]
- City of Tomorrow Probing for PV Façade Systems Made of Lightweight Plastic Modules with Reversible Fittings for New and Old Buildings (PV-FAS_Light + Easy). Available online: https://nachhaltigwirtschaften.at/en/sdz/projects/pv-fas-light-easy.php (accessed on 15 March 2023).
- Hasan, A.; McCormack, S.J.; Huang, M.J.; Sarwar, J.; Norton, B. Increased photovoltaic performance through temperature regulation by phase change materials: Materials comparison in different climates. Sol. Energy 2015, 115, 264–276. [Google Scholar] [CrossRef]
- González-Peña, D.; Alonso-deMiguel, I.; Díez-Mediavilla, M.; Alonso-Tristán, C. Experimental analysis of a novel PV/T panel with PCM and heat pipes. Sustainability 2020, 12, 1710. [Google Scholar] [CrossRef]
- Vasileva, I.L.; Nemova, D.V.; Vatin, N.I.; Fediuk, R.S.; Karelina, M.I. Climate-Adaptive Façades with an Air Chamber. Buildings 2022, 12, 366. [Google Scholar] [CrossRef]
- Tao, M.; Zhenpeng, L.; Jiaxin, Z. Photovoltaic panel integrated with phase change materials (PV-PCM): Technology overview and materials selection. Renew. Sustain. Energy Rev. 2019, 116, 109406. [Google Scholar] [CrossRef]
- Obergfell, T.; Gölz, S.; Haussmann, T.; Gschwander, S.; Wagner, A. Influence of User Behaviour on the Functioning and Performance of Passive Phase-Change Material Systems after More Than a Decade of Operation. Buildings 2022, 12, 1797. [Google Scholar] [CrossRef]
- Ilomets, S.; Heim, D.; Chodak, I.; Czarny, D.; Kalamees, T. A method to develop energy activated ETICS. E3S Web Conf. 2020, 172, 21006. [Google Scholar] [CrossRef]
- Heim, D.; Wieprzkowicz, A.; Knera, D.; Ilomets, S.; Kalamees, T.; Špitalský, Z. Towards improving the durability and overall performance of pv-etics by application of a pcm layer. Appl. Sci. 2021, 11, 4667. [Google Scholar] [CrossRef]
- Talvik, M.; Ilomets, S.; Kalamees, T.; Klõšeiko, P.; Heim, D.; Wieprzkowicz, A.; Knera, D. Thermal performance of ETICS, energy activated with PCM and PV. J. Phys. Conf. Ser. 2021, 2069, 012116. [Google Scholar] [CrossRef]
- Wieprzkowicz, A.; Heim, D.; Knera, D. Coupled Model of Heat and Power Flow in Unventilated PV/PCM Wall-Validation in a Component Scale. Appl. Sci. 2022, 12, 7764. [Google Scholar] [CrossRef]
- Talvik, M. Hygrothermal Performance of PCM and PV Covered ETICS. Masters’ Thesis, Tallinn University of Technology, Tallinn, Estonia, 2021. [Google Scholar]
- Talvik, M.; Ilomets, S.; Klõšeiko, P.; Kalamees, T.; Heim, D. Construction process and measuring initial dryout of PCM mortar in Energy Activated ETICS Façade. In Proceedings of the 2022 Buildings XV Conference, Clearwater, FL, USA, 5–8 December 2022. [Google Scholar]
- Sulakatko, V. Modelling Construction Process Impact Factors on Degradation of Thin Rendered Facades. Ph.D. Thesis, Tallinn University of Technology, Tallinn, Estonia, 2019. [Google Scholar]
- Samuelson, I.; Mjörnell, K.; Jansson, A. Moisture damage in rendered, undrained, well insulated stud walls. In Third International Symposium on Tunnel Safety, Danish Society of Engineers; IDA: Copenhagen, Denmark, 2008; pp. 1253–1260. [Google Scholar]
- Liisma, E.; Sepri, R.; Raado, L.M.; Lill, I.; Witt, E.D.Q.; Sulakatko, V.; Põldaru, M. Defect analysis of renovated facade walls with ETICS solutions in cold climate conditions. In Proceedings of the CESB 2016-Central Europe towards Sustainable Building, Prague, Czech Republic, 22–24 June 2016; pp. 174–181. [Google Scholar]
- Kvande, T.; Bakken, N.; Bergheim, E.; Thue, J.V. Durability of ETICS with rendering in Norway-Experimental and field investigations. Buildings 2018, 8, 93. [Google Scholar] [CrossRef]
- Haghighi, Z.; Dehnavi, M.A.; Konstantinou, T.; van den Dobbelsteen, A.; Klein, T. Architectural photovoltaic applications: Lessons learnt and perceptions from architects. Buildings 2021, 11, 62. [Google Scholar] [CrossRef]
- Kertsmik, K.; Kuusk, K.; Lylykangas, K.; Kalamees, T. Energy & Buildings Evaluation of renovation strategies: Cost-optimal, CO2 e optimal, or total energy optimal? Energy Build. 2023, 287, 112995. [Google Scholar] [CrossRef]
- Solarfam 100W TPT Flexible Solar Panel-Technical Details. Available online: https://www.solarfam.nl/100w-shingle-tpt-flexible-solar-panel-solarfam.html (accessed on 15 March 2023).
- Kottek, M.; Grieser, J.; Beck, C.; Rudolf, B.; Rubel, F. World map of the Köppen-Geiger climate classification updated. Meteorol. Zeitschrift 2006, 15, 259–263. [Google Scholar] [CrossRef] [PubMed]
- METER Group. I.U. EC-5 Manual; METER Group: Pullman, WA, USA, 2021. [Google Scholar]
- Olsson, L. Rain intrusion rates at façade details—A summary of results from four laboratory studies. Energy Procedia 2017, 132, 387–392. [Google Scholar] [CrossRef]
- Esen, V.; Sağlam, Ş.; Oral, B. Light sources of solar simulators for photovoltaic devices: A review. Renew. Sustain. Energy Rev. 2017, 77, 1240–1250. [Google Scholar] [CrossRef]
- Tawfik, M.; Tonnellier, X.; Sansom, C. Light source selection for a solar simulator for thermal applications: A review. Renew. Sustain. Energy Rev. 2018, 90, 802–813. [Google Scholar] [CrossRef]
- Kotkas, J. Comparative Anaalysis of Wind Driven Rain Models for Hygrothermal Modelling in Estonian Climate and Development of Laboratory Test Setup. Department of Civil Engineering. Master’s Thesis, Tallinn University of Technology, Tallinn, Estonia, 2015. [Google Scholar]
- Grunewald, J. Diffusiver und konvektiver Stoff-und Energie-transport in kapillarporösen Baustoffen. Ph.D. Thesis, TU Dresden, Dresden, Germany, 1996; 220p. [Google Scholar]
- Nicolai, A. Modeling and Numerical Simulation of Salt Transport and Phase Transitions in Unsaturated Porous Building Materials. Ph.D. Thesis, Syracuse University, Syracuse, NY, USA, 2008; 251p. [Google Scholar] [CrossRef]
- Bauklimatik-Dresden Delphin Documentation. Available online: https://bauklimatik-dresden.de/delphin/documentation.php?aLa=en (accessed on 15 March 2023).
- Volkova, K.; Põldaru, M.; Ilomets, S.; Kalamees, T.; Talvik, M.; Heim, D. The effect of temperature, humidity and mechanical properties on crack formation on external thin plasters of ETICS. In Proceedings of the International Building Physics Conference, Copenhagen, Denmark, 25–27 August 2021. [Google Scholar]
- Rubitherm Rubitherm PCM RT Series. Diverse Organic PCM. Available online: https://www.rubitherm.eu/index.php/produktkategorie/organische-pcm-rt (accessed on 2 March 2023).
Disclaimer/Publisher’s Note: The statements, opinions and data contained in all publications are solely those of the individual author(s) and contributor(s) and not of MDPI and/or the editor(s). MDPI and/or the editor(s) disclaim responsibility for any injury to people or property resulting from any ideas, methods, instructions or products referred to in the content. |
© 2023 by the authors. Licensee MDPI, Basel, Switzerland. This article is an open access article distributed under the terms and conditions of the Creative Commons Attribution (CC BY) license (https://creativecommons.org/licenses/by/4.0/).