Abstract
This paper investigates the damaged area of a reinforced concrete beam under rectangular explosive contact explosion, through full-scale beam tests and numerical simulation. The calculation equation of beam surface load distribution based on equivalent impulse is established, with a consideration of the effect of the length and height of rectangular explosive on the load distribution, and the calculation equation of beam damage area is further proposed. Through changing the mass of the rectangular TNT explosive (1~6 kg) and the shape of the 1 kg rectangular explosive, 5 cases of the test were carried out on a full-scale reinforced concrete beam. The damaged area of the beam is divided into three parts: blasting crater, damage span of the front face, and damage span of the bottom face. The RHT (Riedel–Hiermaier–Thoma) material model is used to simulate concrete for numerical simulation. Curve fitting was performed based on the numerical simulation results. With the prediction of the load distribution on the beam surface, the size of the surface crushing area and the span of the damaged area are calculated; the section resistance function of the beam is introduced to calculate the depth of the blasting crater; and the correlation curve between the damaged span of the front face, the depth of the blasting crater, and the mass of the block TNT is established. The local damage to the beam under the contact explosion load can be evaluated more accurately when the mass of the rectangular TNT is 1~6 kg.
1. Introduction
The irregular occurrences of terrorism and accidental explosions in recent years have become a threat to the safety of various existing structures. Reinforced concrete structures are widely used for civil and military architectures, which might be targets for a terrorist bombing attack. The damage to reinforced concrete members under the explosion load has been extensively investigated [1]. Damage assessment of RC beams has been an active research field for many years due to RC beams being the primary connection and the force transmission in building structures.
Many experimental studies on the blast response of reinforced concrete beam members have been performed because reinforced concrete beams are the main force transmitting elements in buildings. Tests are typically scaled-down, using small-size reinforced concrete beam members for the explosion damage test [2,3,4,5,6]; only a few tests use the original-size members for the explosion test because of the large cost of the original-size beam test and high requirements of the test site. Li et al. [2] and Lin et al. [3] used 1:6 downscaled reinforced concrete beam members for explosion tests to explore the differences in reinforced concrete damage at different explosion locations, explosive equivalents, and explosion distances. Yao et al. [5] conducted blast tests and numerical simulations for three downscaled sizes of reinforced concrete beams to examine the differences in the response of different-size members under close blast and proposed a scaling model that considers size effects. The mechanical property index represented by nominal strength decreases with the increase of structure size due to the evident size effect of the concrete structure, and the test results of the shrinkage test can only be indirectly applied to the original-size member. Zhang at al. [7] investigated the similarity law during the process of explosive penetration into concrete. However, using full-scale model tests is more convincing. Gomes et al. [8] carried out full-scaled concrete model tests to investigate a high-performance blast energy-absorbing system for building structures and it was found that there was a significant difference between near-field and far-field explosions in the tests.
Blast loads can be classified as far-field, near-field, and contact blast loads according to the scaled distance. Tests and related calculations for far-field explosions are mature, while the blast load acting on members in the near-field explosion case varies. Wang et al. [9] investigated the dynamic response scaling of a unidirectional square concrete slab under proximity blast loading and proposed two empirical equations to correct the results when scaled from the model to the prototype. Severe local damage will occur in addition to the overall deformation when the concrete structure is subjected to a near-field explosion. However, contact explosion is a special case of near-field explosion, with limitations in related aspects, and many aspects of its damage conditions and the blast resistance response of reinforced concrete beams still require further investigation. Liu [10] conducted numerical simulations on geopolymer-based ultra-high-performance concrete slabs under contact explosion to explore the contribution of the variables of internal fibers, slab thickness, and TNT equivalence on the local damage and energy evolution of slabs subjected to contact blasts. Han et al. [11] carried out close blast and contact blast tests on different concrete slabs to study the blast resistance of hybrid-RC structures, and found that there was little difference in the size of the local damage in the hybrid-RC slab and the SRC slab under the contact blast. The prediction formula for the top face diameter D and blasting depth L of the hybrid-RC slab was obtained through dimensionless analysis.
Numerical methods, along with destruction predictions, have also been applied to the blast resistance response of reinforced concrete because of the high cost of tests. Kyei and Braimah [12] analyzed the destruction of reinforced concrete columns under blast conditions through the numerical simulation of hoop spacing. Li et al. [13] proposed a numerical model that considers both the behavior of the rate-dependent shear and the effect of damage on the basis of the traditional fiber beam element. Gholipour et al. [14] used the finite element simulation software LS-DYNA to explore the residual bearing capacity and damage state of simply supported beams of reinforced concrete under the combination of short-range explosion and variable rate impact load and proposed a damage index based on the residual shear and bending bearing capacity of reinforced concrete beams. Yan et al. [15] further simulated the crack expansion, bottom spalling, and spalling of lateral concrete in reinforced concrete beams during blast destruction by building a finite element model. Material parameters such as air and explosives are widely used in the simulation, while different material models are selected when simulating concrete materials. CSC (Continuous Surface Cap) [10], HJC (Johnson–Holmquist Concrete) [16], K&C (Karagozian and Case Concrete) [17], and the RHT model are widely used in the simulation of reinforced concrete explosion damage. The RHT material model [18] was first proposed in 1999 and applied well to the response of concrete under explosive loads [19,20,21].
In the existing explosion tests of reinforced concrete beams, most of them focus on far-field and near-field explosions, and there is relatively little experimental research on contact explosions. Due to the severe local damage caused by contact explosion to reinforced concrete beams, their damage response and analysis methods are different from those of far-field and near-field explosions. Moreover, due to limitations in experimental conditions and costs, most of the reinforced concrete beams and other components used in experimental studies are small-sized components. There are relatively few explosion tests of large-sized components used in actual buildings, and the size effect of concrete in explosive structures cannot be ignored. Large-scale reinforced concrete beams with a span of 6.6 m were selected in this study to examine the contact explosion of different mass values of block TNT explosives experimentally. Experimental and numerical simulations were conducted to investigate the local damage response of beams under contact explosion. The effect of explosive amount on damage parameters, such as beam damage mode and damage area, is analyzed with the deformation and failure characteristics of beam members. Combined with numerical simulation, of the concrete and steel grade, stand-off distance effects of beam damage are analyzed, and a reasonable calculation equation of damage is provided on the basis of the calculation method of equivalent impulse.
2. Test Overview and Results Analysis
2.1. RC Beam Model
The reinforced concrete beam structure is selected from a typical protective fortification as the prototype for making original-size specimens. HRB400 is the abbreviation of hot-rolled ribbed reinforcement with a standard yield strength of 400 MPa; the diameter of longitudinal reinforcement is 22, 20, 14, and 12 mm, and diameter of the stirrup is 8 mm. Concrete strength grade is C30, and compressive strength of this concrete grade is a minimum of 30 MPa. The size and reinforcement structure of reinforced concrete beams is shown in Figure 1. Height and width of supports at both ends of the beam member are 500 and 380 mm. As shown in Figure 1, the actual reinforcement of the beam in the manufacturing process is consistent with the design drawing.

Figure 1.
RC beam size and reinforcement.
The cast in situ method is commonly used in projects and was adopted in this work for the fabrication of reinforced concrete beams. The wooden formwork was supported after the reinforcement binding was completed. Figure 2 illustrates the actual situation of reinforcement binding during the fabrication of beams. The cement grade of the test piece was P.O42.5. The aggregate size of the ready-mixed concrete was 5–31.5 mm. Concrete pressure test blocks were made and compressive strength tests were conducted under the same curing conditions while pouring reinforced concrete beam members. The compressive strength of the concrete reached 35 MPa, thereby meeting the strength requirements. The support of the reinforced concrete beam specimen extended into the support platform with a height of 1.1 m (blasting surface of the beam back was about 1.3 m from the ground) to realize the fixed support of the end of the beam. The overall layout is shown in Figure 3.
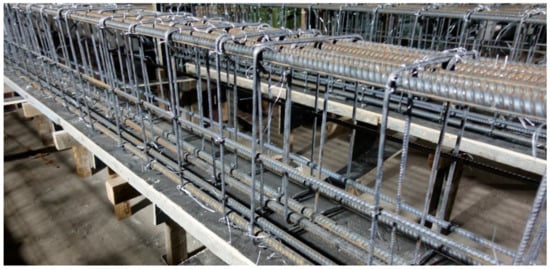
Figure 2.
Reinforcement binding.
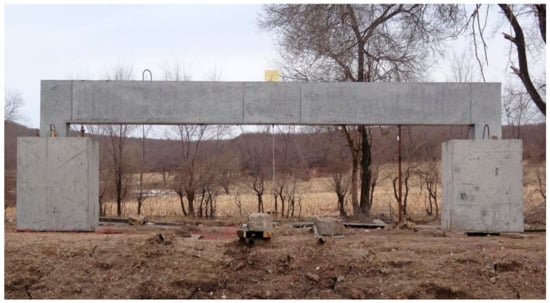
Figure 3.
Layout of beam specimen after construction.
2.2. Test Conditions
Explosives were placed in the middle of the beam span to realize the central contact explosion in the test. Relevant studies have shown that the damage index of the beam will reduce when explosives gradually move from the middle of the span to the end [1]. Only the mid-span contact explosion with maximum damage to the beam is considered in this study. Explosives are stacked using standard TNT explosive blocks. The mass and density of a single standard TNT explosive block with dimensions of 100 mm (long) × 50 mm (wide) × 25 mm (height) are 200 g and 1.6 g/cm3, respectively. TNT with a mass of 1, 2, 3, 4, and 6 kg was selected for the damaged test. The dimension of TNT is shown in Figure 4a. TNT is placed on the surface of the beam and in direct contact with the concrete, as shown in Figure 4b.
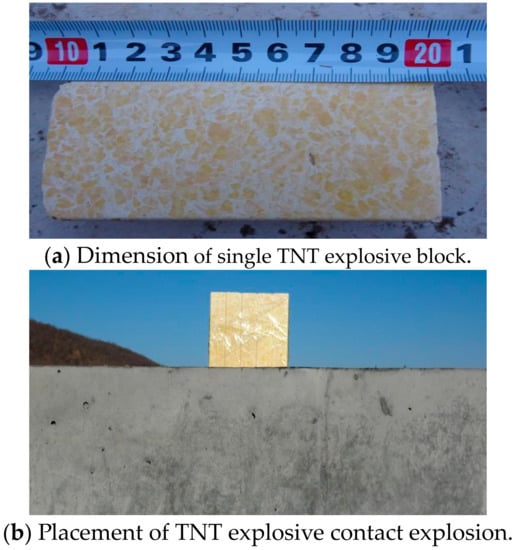
Figure 4.
Dimension and placement of TNT.
2.3. Analysis of Test Results
Figure 5 shows the failure states of the reinforced concrete beam side under TNT explosive contact explosions of 1, 2, 3, 4, and 6 kg. The pictures shown are taken after cleaning the broken concrete in the concrete damage area.
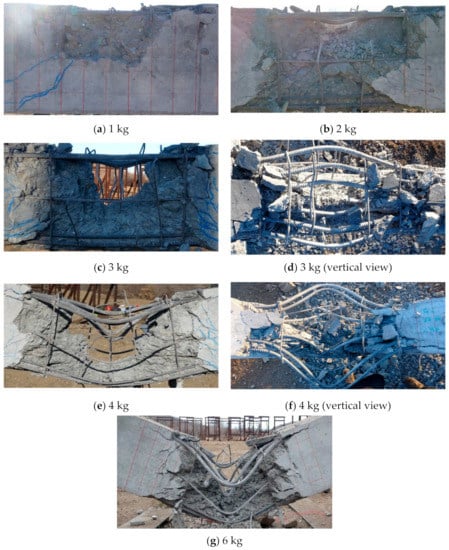
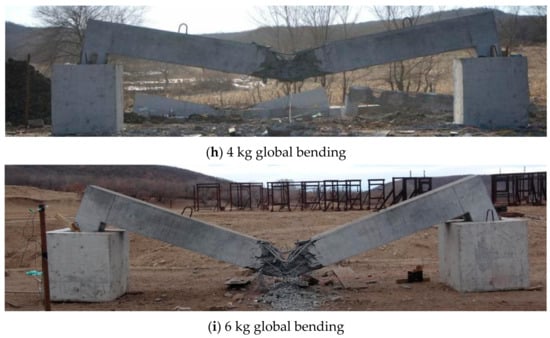
Figure 5.
Damage to reinforced concrete under the different mass values of TNT.
Damage parameters of reinforced concrete beams under the different mass values of TNT are listed in Table 1.

Table 1.
Damage data of reinforced concrete beams under the different mass values of explosives.
The test results in Figure 5 demonstrate that the reinforced concrete beam is bent and deformed under the action of the explosion shock wave; its blasting face is crushed, and the back blasting face is spalled. Because the compressive stress waves in the reinforced concrete beams propagate to the back of the beam, a strong tensile wave is formed, which causes the spallation and cracking of the concrete [22]. Meanwhile, the side of the beam is also subjected to stress waves and collapses occur. The concrete damage only occurs at the junction between the back and the side of the beam when the mass of TNT is 2 kg. The back is intact, and the back spall is small. The beam exhibits evident mid-span displacement and large overall bending deformation, although the beam damage is mainly caused by local punching shear failure when the mass of the TNT explosive reaches 4 kg. The large mid-span displacement of the single member of the beam is caused by the absence of fixed constraints at both ends. The concrete fragments in the partially damaged area of the reinforced concrete beam were cleaned, resulting in a larger area of damage in the locally captured figures. The length of the damaged area of the reinforced concrete beam during the 6 kg TNT explosion is similar to that of the 4 kg TNT. However, compared to the global bending, it can be observed that the overall mid-span displacement at 6 kg is significantly greater than 4 kg. Liu [23] found that the failure zone of the reinforced concrete beams increases with the increase of charge mass. Improving the quality of explosives under contact explosion will not only increase the damage area, but also lead to severe mid-span displacement. When the beam undergoes significant bending deformation and penetration failure, the increase in the damage area slows down. As shown in Figure 6, damage areas of the front face, back face, and blast crater increase with the increase in the mass of TNT. Spalling is absent at the back of the beam when the mass of TNT is 1 kg; hence, a blast crater is absent and only the concrete protective layer is damaged. The length of spall damage at the back face increases rapidly and exceeds the damage at the front with the increase in the mass of TNT. The depth of the blast crater of the concrete beam reaches 80% of the beam height when the mass of TNT reaches 4 kg, thereby indicating that penetration failure occurs. The back spall length and explosion crater depth of the beam increase significantly under 3 and 4 kg TNT tests. Damage to the beam intensified in the test because the beam support was not fixed and restrained, and the beam was bent downward.
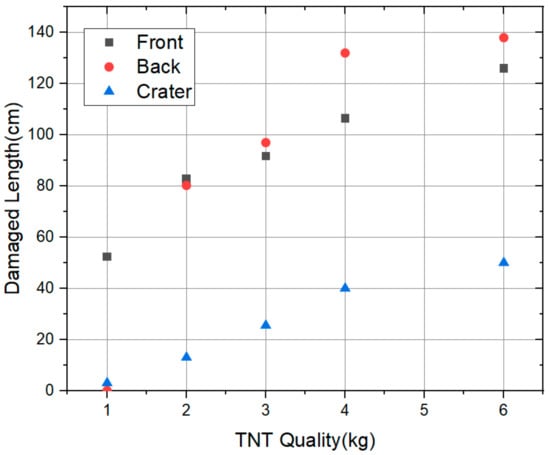
Figure 6.
Variation of failure zone length with the mass of TNT.
3. Numerical Simulation
3.1. Finite Element Model
A finite element beam model with the same size and structure is established according to the beams used in the test. A series of numerical simulation analyses of the beam under explosion load is carried out using the finite element software LS-DYNA. The numerical simulation model of contact explosion of the reinforced concrete beam includes air domain, block TNT explosive, and the reinforced concrete beam. The explosive with single point initiation mode is placed in the middle of the beam, and the area of air is larger than the damaged area of the concrete beam because of the decreased mass of TNT and the rationality verification of air domain. Damage beyond the air domain is absent in the numerical simulation. A small air domain can improve the numerical simulation speed, and the non-reflective boundary is set at the boundary of the air domain. The numerical model is shown in Figure 7a.
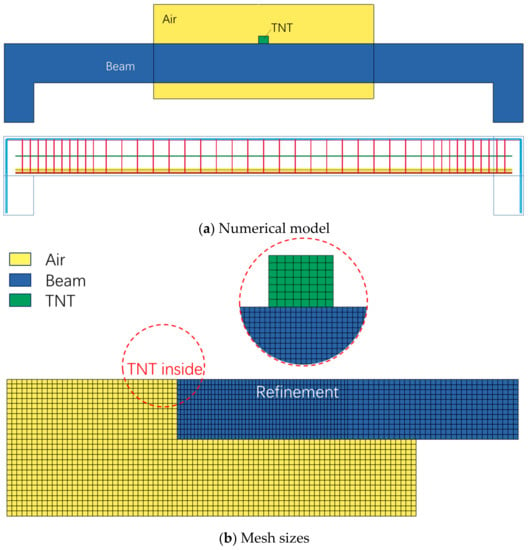
Figure 7.
Numerical model and mesh sizes.
The reinforced concrete beam adopts the separated modeling method, in which the solid164 element with a grid size of 15 mm × 15 mm × 15 mm is selected for concrete, air, and explosive and a beam element with a grid size of 15 mm is chosen for reinforcement. The grid of the beam was encrypted to better simulate concrete damage and cracks, as shown in Figure 7b. The interaction between reinforcement and concrete is controlled by coupling keywords, while the relative slip between concrete and reinforcement is ignored. Different types of reinforcement adopt the way of the common node to simulate the actual connection mode.
3.2. Material Model and Parameters
The explosive type used was TNT, and the mat was selected as well as the _ HIGH_ EXPLOSIVE_ Burn [24] material model and the * EOS_ JWL equation of state. The JWL model provides the detonation pressure p of TNT.
where is the density of detonation gas and the density of initial explosive ratio of ; E is the specific internal energy of high explosive; and A, B, R1, R2, and ω are fitting coefficients. Specific parameter values are presented in Table 2

Table 2.
Material parameters.
*MAT_NULL [24] was used as the material model of air. The equation of state is the ideal gas equation of state * EOS_ LINEAR_ PERMULATION. Material parameters are listed in Table 2.
The *MAT_PLASTIC_KINEMATIC [24] plastic follow-up hardening constitutive model was utilized for reinforcement. Material parameters are provided in Table 2.
Concrete adopted the RHT material model [18], and the damage yield surface of the RHT model is expressed using the maximum and residual strength surfaces as follows,
where D is the damage function. The material is at the maximum strength surface when d = 0 and at the residual strength surface when d = 1. The maximum strength surface of the RHT model considers the strain rate and Lode angle effects, which can be expressed as
where is the uniaxial dimensionless compressive strength of concrete, is the dimensionless uniaxial tensile strength, and A and N are strength surface parameters of concrete materials. The strain rate function is determined as follows,
where and are strain rate parameters, and are the strain rate and the reference strain rate, respectively, (). The Lode angle effect adopts the Willam and Warnke model, which can be expressed as
where and are the second and third invariants of deviatoric stress, respectively, and is the angle of deviatoric stress. The function represents the ratio of tensile meridian strength to compressive meridian strength and is expressed using following linear function:
The residual strength surface of concrete material in the RHT model is expressed as
where B and M are material parameters. The damage function D is a function of plastic strain increment that can be expressed as
The model comprehensively considers the pressure correlation, compression damage, and strain rate effect of the concrete material failure surface, and takes into account the difference between tension and compression strain rate effect. The model positively affects the numerical simulation of concrete dynamic response. The relevant material parameters are listed in Table 3.

Table 3.
Material parameters of concrete material RHT.
Euler elements were used to simulate air and TNT, and Lagrange elements were used to simulate concrete and steel. The interaction between the two elements is considered using the Arbitrary Lagrange Euler (ALE) method, which can simulate the interaction between detonation products and the beam. CONSTRUCTED_ LAGRANGE_ IN_ SOLID was used to define the fluid solid coupling of multiple material materials, which is widely used in numerical simulation studies for simulating explosions [25].
3.3. Results and Analysis of Numerical Simulation
Figure 8 shows the numerical simulation under the condition of 4 kg, where the red area represents the damage area and cracks built into the RHT model. When calculating for 20,000 μs, the damage area basically does not change, so the calculation end time of the numerical simulation is 20,000 μs.
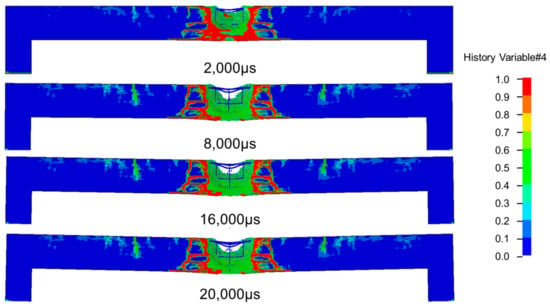
Figure 8.
Variation of failure zone length with the mass of TNT.
The comparison between numerical simulation and the test results of reinforced concrete beams under different mass values of TNT is shown in Figure 9.
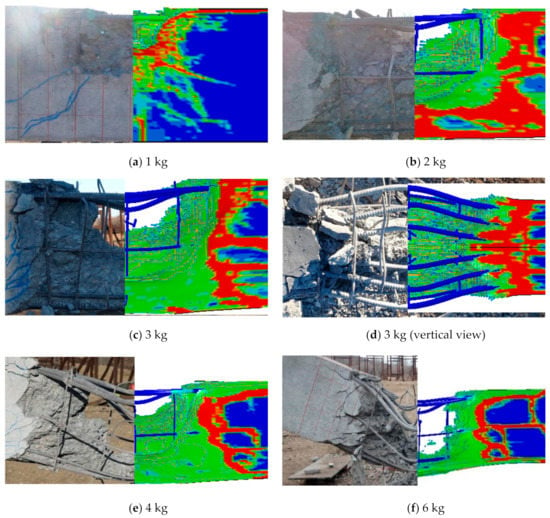
Figure 9.
Comparison between numerical simulation and experiment.
The numerical simulation can properly simulate the size of the blasting crater and side spalling failure and the expansion of reinforcement deformation of the numerical simulation is also consistent with that of the test when the mass of TNT is 1–3 kg. However, the inclination of the beam is significant; due to its gravity, the tensile failure of the back increases, and the deformation of the reinforcement also increases when the mass of TNT is greater than or equal to 4 kg because the base is not fixed and restrained during the test. The beam is fixedly supported at both ends in the numerical simulation to imitate actual constraints in the building, thereby resulting in minimal inclination and reinforcement deformation, although the concrete damage area is consistent. The damage to the beam during the explosion will increase during the numerical simulation test; hence, cleaning up a loose concrete crater after the explosion test is impossible.
Only the length of the failure zone of the front and back faces is compared with the test given that accurately measuring the blast crater in the numerical simulation is difficult (Table 4). The numerical simulation results are clearly consistent with the experimental results, and the error is controlled by 5% when the mass of TNT is 1–3 kg. The damaged span error of the back blasting surface is large, and the error reaches 11.36% when the mass of TNT is 4 and 6 kg. The local concrete loss is significant after the increase of TNT charge, the overall bending angle is large, and the tensile failure of the back intensifies because the beam is not fixed and restrained during the test. However, the numerical simulation and test error of the span of the damaged area under other working conditions are less than 10%. The error of the length of the failure zone of the blasting face is small and that of the length of the back blasting face is large, although it can be controlled within 10% in the numerical simulation. Hence, the numerical simulation can appropriately simulate the concrete damage to the beam under an explosion load of 1~6 kg TNT.

Table 4.
Comparison of simulation and test data.
3.4. Damage Curve Fitting
The TNT mass was increased to 10 kg and 12 kg for simulation, based on the experimental results. Scaled distance is commonly used to describe the similarity law of explosions; the damage of the beam does not take into account the impact of explosion height under contact explosion. Therefore, it is assumed that there is a nonlinear relationship between the damage length of the beam and the mass of the explosive.
The length of the failure zone of the front face can be expressed as follows,
where is the length of the failure zone of the front face, is the coefficient, is the mass of explosive, and is a constant.
The curve is fitted to obtain a prediction formula for the length of the failure zone of the front face, based on the numerical simulation results. The curve is shown in Figure 10, and the fitting equation is shown in Equation (10).
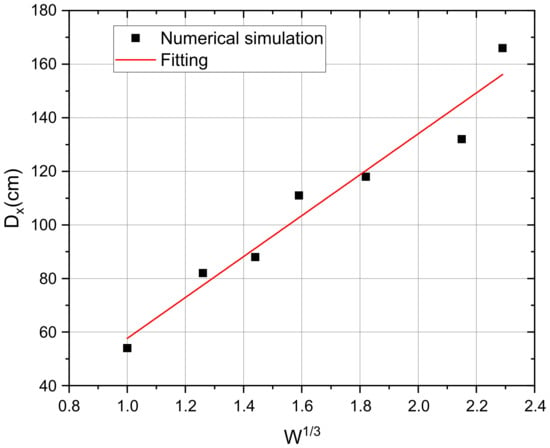
Figure 10.
Length of failure zone of front face fitting curve.
The mid-span displacement of the beam can be expressed as follows,
where is the mid-span displacement of the beam, is the coefficient, is the mass of explosive, and is a constant.
The curve is fitted to obtain a prediction formula for the mid-span displacement of the beam, based on the numerical simulation results. The curve is shown in Figure 11, and the fitting equation is shown in Equation (12).
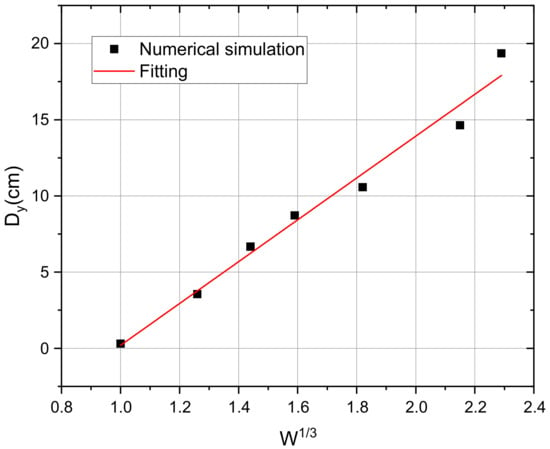
Figure 11.
Mid-span displacement of beam fitting curve.
3.5. Effects of Concrete and Steel Grade
The concrete strength of reference beam (30 MPa) was varied to 40, 50, 60, and 70 MPa and the steel strength of reference beam (400 MPa) was varied to 300, 500, and 600 MPa. Then, the impact of the strength of concrete and steel on the beam damage was investigated. Table 5 summarizes the material parameters of different strength concretes in numerical simulation. The parameters of the steel are only modified for tensile strength and compressive strength. The simulation results of the beam under different concrete and steel strengths are shown in Figure 12. The depth of the crater and the length of the front damage zone are shown in Figure 13.

Table 5.
Parameters of different concrete grades.
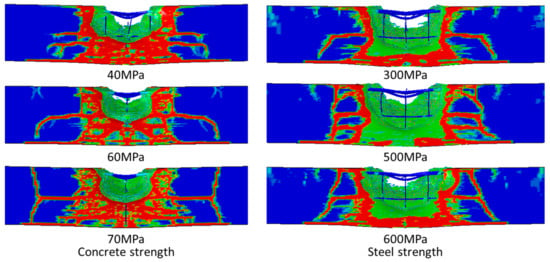
Figure 12.
Simulation results of different strength grades.
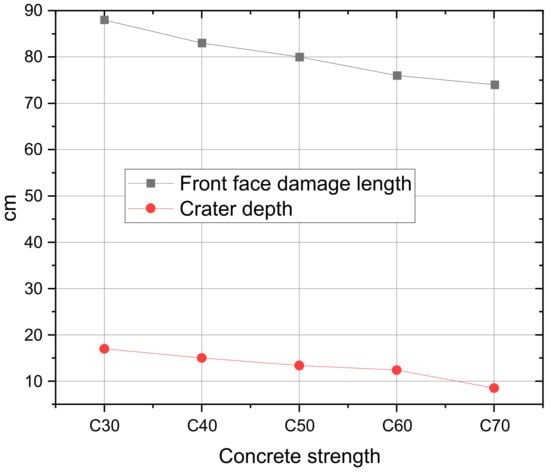
Figure 13.
Damage parameters.
Improving the strength of concrete can significantly improve the explosion resistance of beams. Under the 3 kg TNT contact explosion case, as the strength of concrete increases, the depth of local explosion crater and the length of damaged zone significantly decrease. Numerical simulations have found that when the strength of concrete is increased, the length of the damage to the front face decreases rapidly, while the depth of the crater decreases slowly. However, when the strength of concrete further increases to 70 MPa, the crater decreases significantly, while the damage length on the front face decreases slowly. Numerical simulations were also conducted by changing the strength of the steel bars, and the results showed that increasing the strength of the steel bars can reduce crater depth but has no significant reduction effect on side collapse and crack generation.
3.6. Effects of Explosive Stand-off Distance
The explosive contacted the surface of the reinforced concrete beam in the tests, while for near-field explosions the stand-off distance had a significant impact on the load acting on the surface of the reinforced concrete beam. The stand-off distance is the vertical distance from the center of the explosive to the surface of the beam. In numerical simulation, the TNT mass is maintained at 3 kg, the stand-off distance is changed, and the corresponding proportional distance is calculated. The different stand-off distance cases are shown in Table 6 and the simulation results are shown in Figure 14. According to the numerical simulation results, it can be found that the damage to the beam decreases rapidly with the increase of stand-off distance. The crater is significantly reduced compared to contact explosion when the stand-off distance is 10 cm; there is no obvious crater, and the side collapse decreases and cracks increase, when the stand-off distance is 20 cm; only the concrete protective layer on the beam surface is damaged when the stand-off distance is 30 cm and the scaled distance is 0.208 m·kg−1/3; only the concrete on the front side of the beam showed slight damage and there were no obvious cracks on the side when the stand-off distance increased to 50 cm. The degree of damage to the beam caused by TNT contact explosions of the same mass increases sharply compared to near-field explosions. The damage to the beam will be significantly reduced when the scaled distance is 0.208 m·kg−1/3.

Table 6.
Stand-off distance cases.
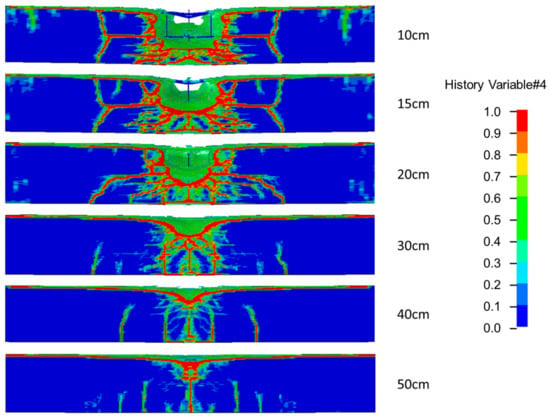
Figure 14.
Simulation results of different stand-off distances.
4. Discussion
4.1. Beam Surface Load
The majority of crushing and spall actions of concrete are often based on the concrete slab. The surface action load is equivalent to the slab to calculate the load distribution in the span direction due to the large difference in size in the span and width direction of beam members, and the typically significant damage in the width direction. Figure 15 presents the calculation model of the surface impulse of rectangular explosives under contact explosion. Assuming that the explosive detonates instantaneously, the square charge comes into contact with the concrete surface, the detonation products impact the concrete at a high speed, nearly circular crushing area craters are observed on the upper surface, and the surface impulse effect is calculated on the upper surface of the beam.
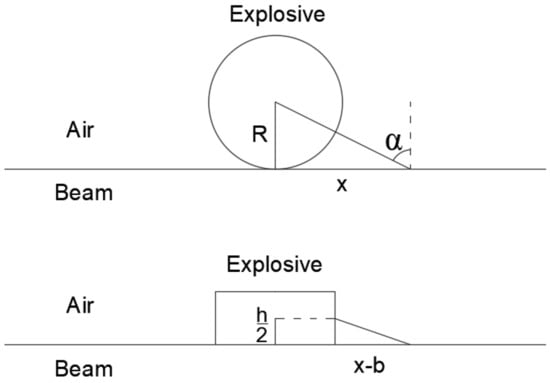
Figure 15.
Calculation model of contact explosion load.
The impulse load is expressed as follows [26],
where is the explosive mass, is the angle between the connecting line from one point on the beam surface to the charging center point and the surface normal, is the average detonation pressure, is the explosive density, and is the detonation heat.
The calculation equation regards the surface action load as circular and evenly distributed when calculating the surface impulse in the case of contact explosion [27]. Notably, the load acting on the beam is distributed differently in various size directions because of the different lengths and widths of square explosives. The modified calculation equation is expressed as follows,
where is the height of the explosive and is half of the length of the explosive. The impulse within the width of the explosive is assumed to be evenly distributed, and the impulse outside the width of the explosive is calculated according to the impulse equation. The 3 kg TNT test is used as an example in this study to compare the differences between the two equations. The relevant parameters are listed in Table 7.

Table 7.
Test related parameters.
The load on the beam surface is simplified as a triangular load with a short rising edge on the surface, and only the positive pressure on the explosion contact surface is considered. The peak load was set as and the load duration as . The load duration was about 0.1 ms. according to the pressure sensor measurement in the test. The load distribution obtained from the load calculation equation is shown in Figure 16.
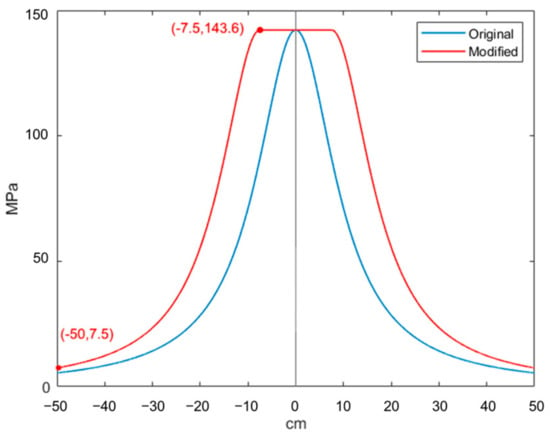
Figure 16.
Peak load distribution on beam surface.
4.2. Analysis of Concrete Failure Effect of the Beam
The initial crushing damage range of concrete acting on the surface can be simply inferred according to the compressive strength of concrete. Tensile and compressive strength values increase with the increase of strain rate, the peak strain in tension remains unchanged, the peak strain of compression decreases with the increase of strain rate, and the maximum volumetric strain increases with the increase in strain rate due to the strain rate effect of concrete. Therefore, the strain rate effect caused by compression in the vertical direction reduces the damage in this direction, and the depth of the failure area measured in the test is smaller than that in the beam span direction. The traditional method of dividing the damage area often equates the beam with the plate, which is divided into the crushing area close to the explosion source at the front and the spalling damaged area of the tensile wave reflected on the back. Damage on both sides of the beam width direction is significant in the actual test process. The side spalling area is introduced to refine the concrete loss of the beam, as shown in Figure 17.
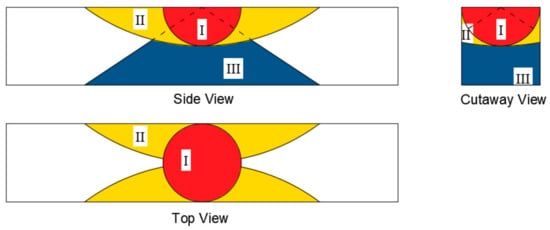
Figure 17.
Damage range division.
Area I is the crushing failure region of concrete directly affected by contact explosion load, and Area II is the concrete loss on the blasting face and side of the beam. The load transmitted from Area I continues to act, and results in large deformation and tension of the upper reinforcement, outward movement of the concrete, and outward spalling of the side concrete. Area III is a small region of concrete spalling at the bottom and side caused by the reflected tensile wave.
The range of Area I can be approximated as a hemisphere with a radius of r and obtained from the calculation equation of the surface peak load, where is the compressive strength of concrete. On the one hand, Area II is affected by the explosion load. The small displacement constraint and the susceptibility of concrete to displacement to the outside results in spalling due to the small thickness of concrete in the width direction, low volumetric compression strain rate, and the outward expansion of reinforcement with concrete. On the other hand, elastic–plastic deformation and slippage of the steel bar with concrete during outward expansion result in cracks in the concrete protective layer and the reduction of the strength of the protective layer. The protective layer clearly falls off in the section of steel bar slippage and outward expansion deformation. In addition, some differences exist between the spall failure of the beam on the side and typical spall failure of the tensile wave.
In Area III, when the mass of TNT is large, the whole beam is punching through and damaged and the back spall area is nonexistent in the area of the concrete bottom layer spall. The side spall is more significant than the back spall, and only the concrete protective layer on the back spalls when the mass of TNT is small.
According to the relationship between stress , strain, and bond stress of reinforcement as proposed by [28], the relationship is as follows,
where is the yield strain of reinforcement, is the yield stress of reinforcement, is the elastic modulus of reinforcement, and is the hardening rate of reinforcement. The bond stress is integrated with the reinforcement stress; the bond stress of the reinforcement before and after yielding is set as and , respectively; and the length and slip are denoted as and , respectively. The equation can be expressed as follows,
The above equation shows that the slip is related to the elastic modulus and diameter of the reinforcement. A large elastic modulus of the reinforcement corresponds to a weak slip effect. A smaller diameter of the steel bar indicates a small slip effect and linear correlation. The actual reinforcement of the beam demonstrated that the diameter of the longitudinal reinforcement on the four edges of the beam is the maximum, and the sliding phenomenon is evident. The failure length of the surrounding concrete protective layer is large, the diameter of the longitudinal reinforcement in the middle of the beam is small, and the slip phenomenon is unclear. Meanwhile, waist reinforcement can play the role of a transition buffer, and the damage to the surrounding concrete protective layer is small. Displacement and spalling are easily produced after the crushing area because the concrete in the span direction of the surface layer is difficult to displace under the pressure load; the damage is small, and resistance in the width direction is small.
4.3. Calculation of Damage to the Beam
The test results showed that the length of the damaged area of the beam increases nonlinearly with the increase in the mass of explosive. The vertical damage intensifies and the increase of damage degree in the span direction is unclear with the increase in the local crushing area of concrete. The damaged area of the blasting face of the beam is equivalent to the circular crushing area and the concrete spalling area expanding around, as shown in Figure 18.

Figure 18.
Division of damage area of front face.
On this basis, the calculation equation of the maximum damage area length L of the beam on the blasting face can be obtained. The change of explosive mass and length will change , which is equivalent to the change of explosive length, while the angle remains unchanged. L can be expressed as follows.
The size of the explosive considered in the calculation equation fails to calculate the actual size of the damaged area reasonably when the height is large or small. Determining its height according to the mass of the explosive is necessary to measure the size of the damaged area. Figure 19 shows that the calculation accuracy of using a small explosive height is high when the explosive mass is small, while that of increasing the explosive height value is ideal when the explosive mass is large. The load on the beam surface is small and the damage area span of the blasting face is smaller than that of the test because the direct contact surface between the spherical charge and the beam is small.
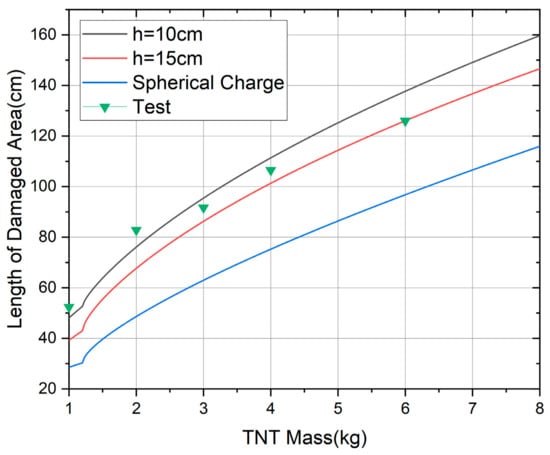
Figure 19.
The damage to the blast face varies with the mass of TNT.
A certain threshold exists for the size of the damaged area on the blasting face of the beam. Spalling at the edge line of the concrete protective layer is absent when the mass of the explosive is small. The increase in damage in the span direction is very small when the mass of the explosive is large because of the penetration failure of the beam. Therefore, the calculation equation of the length of the damaged area is only applicable under the contact explosion load.
Morishita et al. [29] proposed a calculation equation for the contact explosion of a concrete slab. Limits of crater, crater and spall, and perforation show the following relationships.
Limit of crater:
Limit of crater and spall:
Limit of perforation:
where is the thickness of the plate, is the mass of the explosive, and the unit is cm/g1/3. The equation is conservative in calculating the explosion crater, spall, and penetration of the beam, and appropriately increasing the right coefficient is consistent with the test results of this study when the height of the beam is equivalent to the thickness of the plate.
Limit of crater:
Limit of crater and spall:
Limit of perforation:
The above equations are curve fitted, and the mass of the TNT coordinate unit is changed to the unit kg to obtain the relationship between the beam height and the explosive mass in the case of spall and penetration under beam contact explosion, as shown in Figure 20.
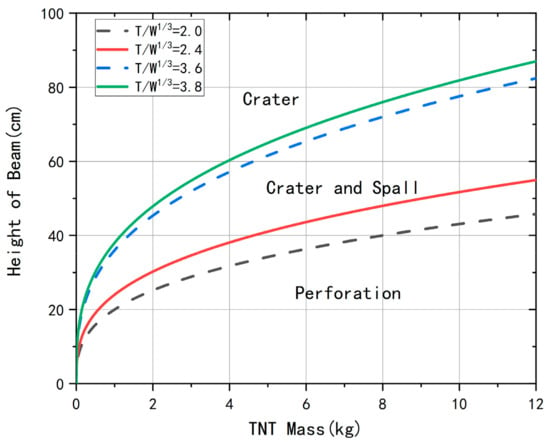
Figure 20.
Critical curve of beam penetration spalling.
The limited mass of explosive of the modified curve for spalling and penetration decreases when the height of the beam is constant. On the one hand, the junction between the back blasting surface and the side can easily spall due to the spalling of the side of the beam. On the other hand, the bending of the beam is more evident than that of the plate in the test and can easily result in penetration when the corner between the crushing area and the support is large.
4.4. Resistance Function of Beam
The calculation equation for the height of compression zone , effective height , and bending moment of the rectangular section of the reinforced concrete beam are expressed as follows,
where is the distance from the tensile action point of the reinforcement to the edge of the section, set to 65 mm; and are the height and width of the beam section, respectively; is the cross-sectional area of the reinforcement; and is the equivalent coefficient (unit: 1/m). The calculated bending moment of the undamaged beam is 423 kN·m.
Damage to the beam is predicted considering the load distribution, and resistance of the beam section is calculated as follows.
The equivalent single degree-of-freedom system under explosion load is expressed as follows,
where is the mass load transformation coefficient at 0.33; is the mass of the single degree-of-freedom system; , , and are the width, height, and length of the beam, respectively; and the value of is 2500 kg/m3. The dead weight of the test beam is 2900 kg after calculation. is the change of displacement of the single degree-of-freedom system with time, and is the external load on the single degree-of-freedom system.
Known data are substituted into the single degree-of-freedom system as follows,
The resistance function and the equivalent single degree-of-freedom equation clearly demonstrated that the effective section height of the beam is only half of the width, and that the relative width increases and the section resistance significantly decreases under the action of side load. The radius of the initial crater must simply be subtracted from the effective section height of the beam to minimize the decrease of resistance when acting in the vertical direction. Therefore, the concrete damage to the beam in the side direction is greater than that in the vertical direction.
4.5. Calculation of Blasting Crater of the Beam
The damage evaluation curve of the reinforced concrete beam under the contact explosion load is established according to the impulse load distribution and resistance function of the beam. The ultimate resistance of the beam is assumed to be greater than the local force of the explosion load, and the damage will not continue at the center of the beam in the vertical direction. The explosion crater of the beam is small and exerts a minimal impact on the damage calculation of the beam when the explosive mass is less than 1 kg. Assuming that the explosive mass at the starting point of the explosion crater is , the value after fitting is 0.75 kg,
Thus, the relationship between the explosive mass and the explosion crater in the center of the beam under contact explosion is established. Assuming that the explosive height remains unchanged, the image is shown in Figure 21.
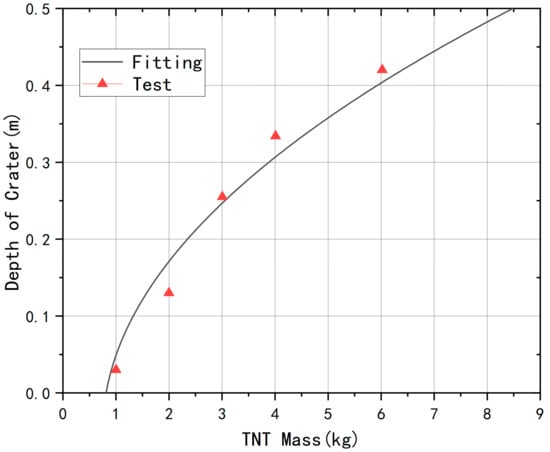
Figure 21.
Curve between explosive mass and blasting crater depth.
The crater of explosion crater depth is ideal when the mass of TNT is 1–6 kg. The error is large when the mass of TNT is 2 kg because the occurrence of the mid-span displacement of the beam increases the local loss of the beam and the large value of the explosion crater during measurement in the actual test process after the mass of TNT increases from 2 kg to 3 kg. This process is ignored in the fitting curve. The explosion crater depth increases nonlinearly with the increase in the mass of TNT, and the increase in explosion crater depth gradually slows down. In addition, the height of explosives in the fitting curve remains unchanged. The small or large mass of explosives may be inconsistent with the actual situation, and the height must be adjusted, although the overall change trend remains unchanged.
5. Conclusions
The reinforced concrete beam is dominated by local failure and supplemented by overall deformation under the contact explosion load. On this basis, the original-size beam test, numerical simulation, and theoretical equation fitting calculation are carried out.
The result on the contact explosion damage area of reinforced concrete under a mass of 1–6 kg TNT showed that the damage in the width direction is greater than that in the span direction. The damage length of the concrete protective layer is at its maximum at the interface boundary of the beam due to the bond slip between reinforcement and concrete.
The length of spall damage at the back face increases rapidly and exceeds the damage at the front with the increase in the mass of TNT. Improving the quality of explosives under contact explosion will not only increase the damage area, but also lead to severe mid-span displacement. When the beam undergoes significant bending deformation and penetration failure, the increase in the damage area slows down.
The numerical simulation of different working conditions can properly simulate the length of the damaged area of the blast face with an error of less than 10%. Hence, the numerical model can be applied to the block TNT contact explosion damage model of the original-size beam. According to the numerical simulation results, curve fitting was performed on the length of failure zone of the front face and the mid-span displacement of the beam, and the damage parameters were all proportional to .
Numerical simulation was conducted to study the effects of stand-off distance and material strength on the damage to beams under explosion. Improving the strength of concrete can significantly improve the explosion resistance of beams, and effectively reducing blast holes requires a significant increase in concrete strength. While increasing the strength of the steel bars can reduce crater depth, it has no significant reduction effect on side collapse and crack generation. The degree of damage to the beam caused by TNT contact explosions of the same mass increases sharply compared to near-field explosions. The damage to the beam will be significantly reduced when the scaled distance is 0.208 m·kg−1/3.
The curve between the mass of block explosive and the depth of blasting crater M-R and the damage span curve of the blasting face is further fitted by calculating the load distribution and the resistance function of the beam section. The fitting results are close to the test results, and the damage to reinforced concrete beams under explosive load can be reasonably evaluated at a certain explosive quality range.
Author Contributions
Writing—methodology, L.Z.; investigation, L.Z. and Y.H.; writing–review and editing, X.J. and H.Y.; test technical support, Q.W. and C.Y. All authors have read and agreed to the published version of the manuscript.
Funding
This research received no external funding.
Data Availability Statement
Data is contained within the article. The data presented in this study are available in insert article.
Conflicts of Interest
The authors declare no conflict of interest.
References
- Senthil, K.; Gupta, I.; Rupali, S.; Pelecanos, L. A review on the performance of reinforced concrete structures under blast loading. J. Struct. Eng. Appl. Mech. 2020, 3, 216–228. [Google Scholar] [CrossRef]
- Li, Z.; Liu, Y.; Yan, J.B.; Yu, W.L.; Huang, F.L. Experimental investigation of p-section concrete beams under contact explosion and close-in explosion conditions. Def. Technol. 2018, 14, 540–549. [Google Scholar] [CrossRef]
- Lin, S.C.; Li, D.; Yang, B. Experimental study and numerical simulation on damage assessment of reinforced concrete beams. Int. J. Impact Eng. 2019, 132, 103323. [Google Scholar] [CrossRef]
- Nagata, M.; Beppu, M.; Ichino, H.; Matsuzawa, R. A fundamental investigation of reinforced concrete beams subjected to close-in explosion. Int. J. Prot. Struct. 2018, 9, 174–198. [Google Scholar] [CrossRef]
- Yao, S.J.; Zhang, D.; Lu, F.Y.; Wang, W.; Chen, X.G. Damage features and dynamic response of RC beams under blast. Eng. Fail. Anal. 2016, 62, 103–111. [Google Scholar] [CrossRef]
- Nassr, A.A.; Razaqpur, A.G.; Campidelli, M. Effect of initial blast response on RC beams failure modes. Nucl. Eng. Des. 2017, 320, 437–451. [Google Scholar] [CrossRef]
- Zhang, Y.; Zhang, X.; Zhao, W.; Hu, F. Similarity Law Study of Shaped Charges Penetrating a Concrete Target. Buildings 2022, 12, 2268. [Google Scholar] [CrossRef]
- Gomes, G.d.J.; Lúcio, V.J.d.G.; Cismaşiu, C.; Mingote, J.L. Experimental Validation and Numerical Analysis of a High-Performance Blast Energy-Absorbing System for Building Structures. Buildings 2023, 13, 601. [Google Scholar] [CrossRef]
- Wang, J.; Yuan, W.; Feng, R.; Guo, J.; Dang, X. Dynamic performances of ultra-high-performance fiber-reinforced concrete–strengthened concrete columns subjected to blast impacts. Adv. Struct. Eng. 2020, 23, 3009–3023. [Google Scholar] [CrossRef]
- Liu, C.; Liu, J.; Wei, J.; Xu, S.; Su, Y. Parametric Study on Contact Explosion Resistance of Steel Wire Mesh Reinforced Geopolymer Based Ultra-High Performance Concrete Slabs Using Calibrated Continuous Surface Cap Model. Buildings 2022, 12, 2010. [Google Scholar] [CrossRef]
- Han, Z.; Qu, W.; Zhu, P. Research on Hybrid FRP–Steel-Reinforced Concrete Slabs under Blast Load. Buildings 2023, 13, 1058. [Google Scholar] [CrossRef]
- Kyei, C.; Braimah, A. Effects of transverse reinforcement spacing on the response of reinforced concrete columns subjected to blast loading. Eng. Struct. 2017, 142, 148–164. [Google Scholar] [CrossRef]
- Li, Z.; Zhong, B.; Shi, Y. An effective model for analysis of reinforced concrete members and structures under blast loading. Adv. Struct. Eng. 2016, 19, 1815–1831. [Google Scholar] [CrossRef]
- Gholipour, G.; Zhang, C.; Mousavi, A.A. Loading rate effects on the responses of simply supported RC beams subjected to the combination of impact and blast loads. Eng. Struct. 2019, 201, 109837. [Google Scholar] [CrossRef]
- Yan, B.; Liu, F.; Song, D.; Jiang, Z. Numerical study on damage mechanism of RC beams under close-in blast loading. Eng. Fail. Anal. 2015, 51, 9–19. [Google Scholar] [CrossRef]
- Xu, G.; Qiu, Y.; Xing, H.; Li, X.; Gong, C. Experimental and Numerical Investigation of Internal Explosion in an Earth-Covered Magazine. Buildings 2022, 12, 1872. [Google Scholar] [CrossRef]
- Yin, H.; Ouyang, Y. Experimental and Numerical Study on Steel Fiber Concrete under Blast Loading. Buildings 2022, 12, 2119. [Google Scholar] [CrossRef]
- Riedel, W.; Thoma, K.; Hiermaier, S.; Schmolinske, E. Penetration of reinforced concrete by BETA-B-500 numerical analysis using a new macroscopic concrete model for hydrocodes. In Proceedings of the 9th International Symposium on the Effects of Munitions with Structures, Berlin-Strausberg, Germany, 3–7 May 1999; Volume 315. [Google Scholar]
- Mejía, N.; Peralta, R.; Tapia, R.; Durán, R.; Sarango, A. Damage assessment of RC columns under the combined effects of contact explosion and axial loads by experimental and numerical investigations. Eng. Struct. 2022, 254, 113776. [Google Scholar] [CrossRef]
- Codina, R.; Ambrosini, D.; de Borbón, F. Experimental and numerical study of a RC member under a close-in blast loading. Eng. Struct. 2016, 127, 145–158. [Google Scholar] [CrossRef]
- Abladey, L.; Braimah, A. Near-field explosion effects on the behaviour of reinforced concrete columns: A numerical investigation. Int. J. Prot. Struct. 2014, 5, 475–499. [Google Scholar] [CrossRef]
- Liu, S.; Zhou, Y.; Zheng, Q.; Zhou, J.; Jin, F.; Fan, H. Blast responses of concrete beams reinforced with steel-GFRP composite bars. In Structures; Elsevier: Amsterdam, The Netherlands, 2019; Volume 22, pp. 200–212. [Google Scholar]
- Liu, Y.; Yan, J.-b.; Huang, F.-l. Behavior of reinforced concrete beams and columns subjected to blast loading. Def. Technol. 2018, 14, 550–559. [Google Scholar] [CrossRef]
- Livermore Software Technology Corporation (LSTC). LS-DYNA Keyword User’s Manual Volume I; Livermore Software Technology Corporation (LSTC): San Francisco, CA, USA, 2014. [Google Scholar]
- Yang, C.; Jia, X.; Huang, Z.; Zhao, L.; Shang, W. Damage of full-scale reinforced concrete beams under contact explosion. Int. J. Impact Eng. 2022, 163, 104180. [Google Scholar] [CrossRef]
- Henrych, J.; Abrahamson, G.R. The dynamics of explosion and its use. J. Appl. Mech. 1980, 47, 218. [Google Scholar] [CrossRef]
- Lazar’ Markovich, K. Foundations of the Theory of Plasticity; North-Holland Publishing Company: Amsterdam, The Netherlands; London, UK, 1971. [Google Scholar]
- Lehman, D.E. Seismic Performance of Well-Confined Concrete Bridge Columns; University of California: Berkeley, CA, USA, 1998. [Google Scholar]
- Morishita, M.; Tanaka, H.; Ando, T.; Hagiya, H. Effects of concrete strength and reinforcing clear distance on the damage of reinforced concrete slabs subjected to contact detonations. Concr. Res. Technol. 2004, 15, 89–98. [Google Scholar] [CrossRef] [PubMed]
Disclaimer/Publisher’s Note: The statements, opinions and data contained in all publications are solely those of the individual author(s) and contributor(s) and not of MDPI and/or the editor(s). MDPI and/or the editor(s) disclaim responsibility for any injury to people or property resulting from any ideas, methods, instructions or products referred to in the content. |
© 2023 by the authors. Licensee MDPI, Basel, Switzerland. This article is an open access article distributed under the terms and conditions of the Creative Commons Attribution (CC BY) license (https://creativecommons.org/licenses/by/4.0/).