Abstract
In this paper, we present the final results from the research project “Urban Abacus of Building Energy Performances (Abaco Urbano Energeticodegli Edifci–AUREE)” aimed at supporting the renovation process and energy efficiency enhancement of urban building stocks. The crux of the AUREE project is a Web–GIS GeoBlog portal with customized semantic dashboards aimed at sharing information on an urban built environment and promoting the participation of local stakeholders in its improvement. As the latest development of this research, a workflow that integrates the AUREE portal with BIM authoring and an open-source IoT platform is implemented and applied to an experimental case study concerning a public building in Carbonia (Italy). The headquarters of the Sotacarbo Sustainable Energy Research Center was selected as the case study. The presented results proved that it was possible to create a valid open system, which was accessible to both specialist and unskilled users, and aimed at guiding, through a progressive knowledge deepening, common end-users toward proper conscious “energy behaviors” as well as public administrations and decision-makers toward sustainable facility management. Later, the proposed open system could also be suitable to be used as an effective tool to support the rising “energy communities”.
1. Introduction
In July 2021, the European Commission, in pursuit of its 2050 decarbonization objectives, adopted a proposal to recast the Energy Efficiency Directive as part of the European Green Deal package. As an intermediate step, it contains legislative proposals to meet the EU objective of at least 55% reduction in greenhouse gas emissions by 2030. In May 2022, within the “REPowerEU plan”, the European Commission proposed increasing the binding of energy efficiency target from 9% to 13% compared to the 2020 reference scenario, aimed at making the European Union independent from third countries fossil fuels [1]. Therefore, the energy system will experience a profound transformation in terms of lower final consumption, induced by growth in efficiency concentrated, in particular, on the public and private building stock. The electrification share of the system will gradually tend to exceed 50% [2]. The acceleration of renewable energies becomes a crucial factor: Their contribution to electricity generation should reach at least 72% by 2030 and cover shares close to 100% of the overall primary energy mix by 2050, in compliance with the other main values of the transition process [2].
To address these challenging goals, it is necessary to promote the integration between systems and technologies according to a multi-scalar and inter-sectoral approach. With the aim of making citizens and businesses protagonists of the energy transformation, developing valid support tools for more efficient energy interventions became urgent to promote self-consumption and energy communities, to increase technologies based on renewable energies (RES), and to adopt systems for the efficient management of buildings.
It has been widely reported in the literature [3] that a lack of shared knowledge between stakeholders is one of the main barriers to energy transition, in particular, in the urban context.
Developing effective support tools to share knowledge about energy efficiency and RES technologies, policies, and measures for the promotion of self-consumption and energy communities based on RES technologies is still a prominent issue on the EU agenda [4]. These types of tools are often based on web interfaces and portals that are open to the public or restricted to a group of actors, and they could be beneficial for supporting first design-planning phases of a decision-making process or, more likely, for sharing and spreading knowledge and awareness for general citizens or specific types of stakeholders [5]. Some types of portals, such as the official Italian portal that shows EPC statistical data at the national and regional level [6], collect and represent information about energy performance and/or energy consumption, aiming at mainly communicating and sharing best practices [7,8]. Some portals require more interaction with users, asking them to complete forms that are sometimes quite complex, but they can also perform basic energy calculations [9] for commercial purposes [10]. With the aim to create a platform for sharing building energy retrofit potential and to also involve companies and investors, some EU projects have developed handy geographical interfaces to make scenarios and comparisons between buildings of the same context [11]. Other tools have been targeted to more technical audiences such as tools for supporting urban solar planning [12] or territorial energy planning [13], or a feasibility assessment of an energy community’s grid configuration [14,15].
Built environment energy transition can not be achieved without also taking advantage of the latest Industry 4.0 technologies (such as Internet Of Things devices, cloud computing, and digital twins) as well as the building information modeling (BIM) methodology and related tools, to effectively monitor and optimize buildings’ energy consumptions. Chen et al. [16] investigated the potential for Construction 4.0, Industry 4.0, and BIM to contribute to sustainable building development towards advancement of smart cities. In this regard, the latest literature contributions have proposed new methodological approaches based on BIM and IoT integration, confirming the key roles that these technologies are playing in the digital transformation of the architecture, engineering, construction and operation (AEC/O) industry. Panteli et al. [17] investigated BIM applications and research trends in different life cycle stages by presenting a comprehensive overview of the state-of-the-art in the field, structured in the pre-, during, and post-construction stages of buildings. Tzortzopoulos et al. [18] proposed a BIM-based protocol intended for supporting social housing owners’ decision making by simulating alternative retrofit options. Di Giuda et al., in 2018, [19] focused, instead, on the concept of the “cognitive building” adopted as an ideal man-building interface to allow real-time adaptation of indoor conditions and to provide services based on users. The work in [20] by Di Giuda, Pellegrini, Schievano et al. provided state-of-the-art research on BIM applications for post-occupancy evaluations (POEs) of existing buildings, by mainly focusing on the use of IoT sensors and machine learning. Desogus et al. proposed a plan for sensor equipment of the “Mandolesi Pavillon”, an iconic building as part of the University of Cagliari campus, in order to monitor indoor thermo-hygrometric conditions and to identify compatible retrofit interventions for improving the building’s energy performance, by also using a BIM model of the case study to store and manage real-time monitored data [21]. Considering the value of building information modeling to support all phases of the retrofit process, Sanna et al. focused on implementing efficient integration between a building energy management system (BEMS) and a building automation and control system (BACS) to monitor the indoor comfort of existing buildings [22,23]. The effectiveness of BIM-based approaches for storing and managing data due to the use of sensors was also proven in a study [24] conducted by Rogage et al. that concerned real-time post-occupancy assessment of residential building performances. Similarly, in the context of the final experimental stage of the PRELuDE3 project [25], Desogus et al. tested the integrated use of BIM and low-cost IoT sensors on a real case study (i.e., the aforementioned “Mandolesi Pavilion”) by also using a common data platform to visualize and manage data related to building indoor conditions (e.g., temperature, luminance, etc.) and energy consumption data [26]. The research contribution of [27] was a newly developed integrated solution based on a BIM platform and Internet of Things (IoT) to create a self-updating BIM model to monitor thermal conditions in real time.
In this context, the Sotacarbo Sustainable Energy Research Center and the University of Cagliari were cooperatively involved in the “Urban Abacus of Building Energy Performances–Abaco Urbano Energetico degli Edifici (AUREE) research project regarding “Technologies, techniques, and materials for energy efficiency and energy saving in the electrical end uses of new and existing buildings”.
The project fits into the framework of tools aimed at creating fundamental knowledge that can be exploited to accelerate the processes of intelligent integration of renewable energy, energy efficiency, and different sustainable solutions.
The concept of the AUREE project is a web–GIS GeoBlog portal with customized interfaces aimed at sharing information on the urban built environment and promoting the participation of local stakeholders in its improvement. The methodological approach is specifically addressed to small and medium urban centers, and is characterized by low availability of basic data on buildings’ energy performances [28,29,30]. The town of Carbonia is selected as a relevant case study.
The portal provides an urban building energy model (UBEM) [31,32,33] based on spatial open data, a typological survey of heritage buildings, and a participative web framework, as extensively described in [29]. The portal consists in a handy tool enabling the collection and sharing of data on the energy performances of heritage buildings in the city of Carbonia The developed methodology consists of an analysis and a representation protocol of the heritage building on a geographical basis, combined with a tool for communication and involvement of local actors [28,29,30].
The portal also includes some other sections that not directly linked to heritage physical characteristics, but are sections that are important to define regulation bonds and technological innovation opportunities: territorial context data section and companies’ section.
This work only focuses on the content and procedures of the public building section; more information on other sections specifically devoted to companies and residential private buildings can be found in other papers that have been previously published [28,29,30].
The aim of this paper is to describe the part of the system that manages the data on public buildings. A protocol based on energy audit procedures and sensor monitoring is proposed. The approach aims to collect, represent, and share the energy-related data on public buildings. A key role is played by energy management interfaces based on the integration of BIM and sensors that are developed and tested in the research on a pilot case study.
Ultimately, it is worth highlighting that, since the AUREE project is still under completion and the geoportal is not yet fully operational, available data are still lacking to assess significant qualitative and quantitative effects, derived from adoption of the proposed platform by users and stakeholders, on the energy performance and management of the involved building stock.
2. Tools and Methods
The latest stages of the AUREE research are aimed at implementing a geoportal section devoted to public buildings, by also developing an experimental workflow to handle and make available real-time monitoring data concerning the indoor air quality of existing public buildings. The latter is centered on the integration between sensors on the platform and the BIM model, and the web–GIS portal. The proposed methodology, thus, leads to the provision of a monitoring and representation protocol for managing public buildings that is addressed to public administrations and stakeholders and is based on the combination of BIM, IoT, GIS, and web technologies (Figure 1).
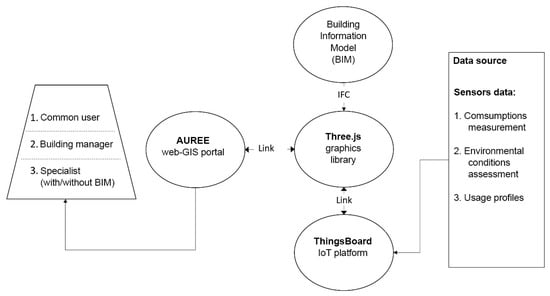
Figure 1.
Workflow of information exchange among the monitoring system, the BIM model, and the web–GIS portal.
2.1. Arrangement of the Information Sets Concerning Public Buildings
The involved information sets are organized according to the following categories:
- General information;
- Building envelope;
- Systems;
- Usage profiles;
- Energy performance (from certificates);
- Actual energy consumption (data acquired from energy suppliers);
- Real-time monitoring;
- Improvement proposals.
More specifically, the “general information” set includes building information regarding position, construction age, main use, historical characterization, planning restrictions, visualization (pictures), and dimensional features (areas, volumes, etc.). Information regarding dimensions, material properties, and thermal performances of vertical and horizontal building components is incorporated in the “building envelope” set. The “systems” set includes detailed information about the technical components and efficiency of the HVAC, electrical, lighting, and renewable energy systems (see Figure 2). Information regarding “usage profiles” of spaces and systems is also considered, as well as energy performance indicators and classes obtained from “Energy Performance Certificates”.
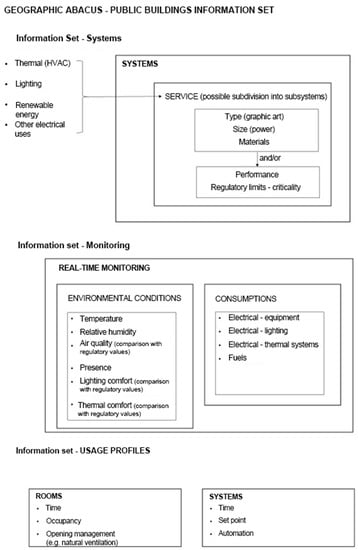
Figure 2.
Information sets for the geographic abacus of public buildings concerning systems, usage profiles, and real-time monitoring.
By way of example, Figure 2 also shows the schematic organization of the information sets related to usage profiles and real-time data monitoring concerning environmental conditions and energy consumptions.
2.2. Building Information Modeling (BIM)
As shown in Figure 1, the proposed methodology provides for the use of building information modeling (BIM) to store and show some specific data deriving from real-time monitoring systems. In this specific case, the methodology workflow is conceived using Autodesk Revit as the BIM authoring software, nevertheless, future integration of this framework could be considered using different BIM authoring tools.
BIM methodology aims at implementing three-dimensional parametric and informative models of buildings which will be the objects of experimentation. Virtual components in BIM models must accurately represent the geometry and information of structural, architectural, and system elements of real buildings. For this purpose, the proposed methodology also provides for a rational selection of informative attributes to be collected (i.e., the information requirements) as parameter values in a BIM model before model implementation, in accordance with the level of information need (LOIN) [34] of BIM components for the project goals.
It is important to emphasize that using the BIM methodology in the framework herein presented is not directed at using the model as a tool for information exchange between the responsible parties, but rather it is simply aimed at easing display and identification of building components. Stated more precisely, since managing BIM-based systems requires specific advanced skills, although BIM models act as digital repositories, building information is also made accessible to unskilled users and stakeholders through a handy Web–GL interface, which is more extensively explained in the next section. Introducing the BIM approach for geometric and information modeling is also directed at encouraging a digitalization process of public building stocks, also in view of the imminent legislative obligations [35] for which, starting from 1 January 2025, the use of the BIM methodology will be mandatory for new public constructions and interventions on existing buildings costing more than or equal to 1 million euros.
2.3. Web Graphics Library
In agreement with the further aim of this work, i.e., to also have the information database accessible to non-technical users and non-BIM practitioners, integration with an open-source Web Graphics Library (WebGL) is introduced into the workflow. Graphics libraries can create 3D visualization scenarios accessible via a web browser. In this specific case, the use of the Java-based graphics library “Three.js” [36], implemented by the Massachusetts Institute of Technology (MIT), was integrated in the proposed framework, as it allows the information of a BIM model to be imported and read through IFC formats [37].
Before exporting a BIM model to IFC standards, proper exportation and visualization filters need to be created to make the model navigable and to allow object selection in the WebGL platform by the browser. Moreover, making appropriate simplifications to a BIM model before importing it into the graphics library is necessary to make its visualization easier and clearer.
Therefore, once a simplified IFC model is imported, the WebGL environment also allows model components to be linked to external links such as real-time monitoring platforms, in accordance with one of main goals of this work.
This workflow section, thus, ensures the important advantage of making an information model accessible to technicians who are not experts in BIM by not entailing any information loss and not requiring any subsequent verification of data quality.
2.4. IoT Sensors and a Platform for Real-Time Data Monitoring and Processing
As anticipated above, the proposed workflow also includes integration of the WebGL-based 3D scene with a platform for real-time monitoring of data. More specifically, in this work, the “ThingsBoard” open-source Internet of Things (IoT) platform was selected to read, analyze, and collect the sensor data; the “ThingsBoard” IoT platform is in line with the digitization policies of Industry 4.0, since it allows users to collect and visualize data from sensors and assets, to control devices through remote procedure calls, to design dynamic and responsive dashboards, etc. [38].
Integration of the proposed workflow with the “ThingsBoard” IoT platform is aimed at simultaneously acquiring data concerning the air concentration of carbon dioxide (CO2) and volatile organic compounds (VOC), the air temperature (T) and relative humidity (RH), as well as the human presence in indoor environments [39]. The implemented methodology envisages that sensor data could be sent to “ThingsBoard” via Wi-Fi or a wired web network and stored through the platform cloud service.
The “ThingsBoard” IoT platform allows the users to manage and integrate any “smart” object, i.e., it is equipped with enabling technologies that interact with the surrounding environment ensuring data exchange in real time. The platform enables the collection, processing, and analysis of data, to produce useful information for supporting decision making and process optimization, from energy efficiency to comfort control and safety.
Regarding the IoT sensors, among the different available technologies, wireless products are widely used, since they make it possible to avoid expensive system modifications imposed by wired solutions. The use of “Z-Wave” radio standards is widespread internationally. “Z-Wave” is a wireless communication protocol for generating a “mesh network” which is made up of devices that are all mutually communicating by using low energy for the information exchange within the network [26,40,41].
IoT sensors are increasingly adopted for building applications to collect data on hygrothermal indoor conditions and air quality, since these devices are characterized by small dimensions and they ensure continuous data monitoring of environmental parameters [26].
2.5. Web–GIS Portal
The AUREE portal is a cloud-based architecture (WEB gis and Geo Blog) that has some user-based graphical interfaces aimed at sharing knowledge about urban heritage buildings, as well as at promoting participation of a more common typology of local stakeholders involved in building renovation and energy retrofitting processes: real estate occupants, local administration decisionmakers, construction company practitioners, or other actors with a more generic interest.
The web portal is structured on some recognizable sections that have common baseline data but show different representations with specific contents and procedures: residential building section, typological section, public building section, companies’ section, and other parts with some relevant thematic geographical layer and documentation [28,29,30].
The portalsection devoted to residential buildings provides spatial representation of the heritage building’s energy performance provided by the easy UBEM methodology [29] and aims to directly involve occupants, public decisionmakers, and companies by defining a shared knowledge framework. The building typology section is a different representation of the same baseline information about residential heritage energy performances grouped by building typologies. This representation provides a dynamic knowledge summary of the envelope and technological systems’ recurrent characteristics of local building typologies but also tries to define the more common real estate use profiles.
The public building section, which is the subject of this paper, is designed to be a supporting tool for public buildings’ facilities management but also to promote the transparency of energy uses and to enhance citizen awareness about energy efficiency and heritage historic qualities and values.
The AUREE architecture (schematically represented in Figure 3) is based on the GeoNode [42] service, an open-source content management system (CMS) for geographic data that mixes the typical CMS capabilities with some native functions such as: catalog of documentation and geodata, layers and maps publication and sharing, spatial layers management and metadata editing, and multi-user functions.
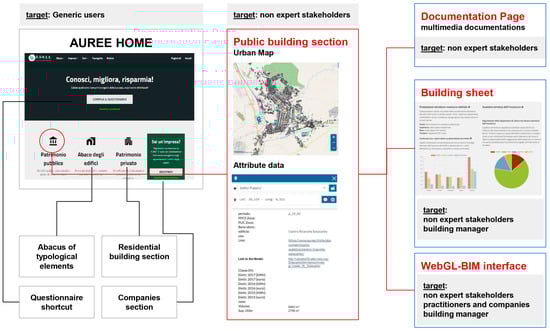
Figure 3.
AUREE web–GIS portal: structure and target users.
The GeoNode environment allows the interoperability of spatial data (Vector, Raster, 3D model, etc.), consistent with the Open Geospatial Consortium (OGC) guideline and INSPIRE standard through the more common sharing protocols (WMS, WFS, WFS–C, etc.). The AUREE portal can share geographic data with the more important institutional Regional and National Spatial Data content manager and, moreover, data can be used on the more common open-source GIS desktop systems (QGIS, gvSig, uDig etc.) as well as on the licensed systems such as ESRI ARCGIS. The portal architecture is based on a cloud server with the Ubuntu 20.04.02 LTS Linux Operative System equipped with Docker tosettle some relevant portal components: PostGIS (spatial database), GeoServer (map server with OGC standard services), pyCSW and Django with Wagtail and Survey modules. GeoNode plug-in-based systems allow users to create some fully customized tools and procedures related to the portal sections:
- Residential building tool which manages the database and UBEM procedure to calculate representative building energy performance data;
- Building typologies tool which supports creating building typologies and representing some summary statistics and graphs from questionnaire-based data;
- Building audit tool which supports home occupants on questionnaire compilation and provides suggestions for real estate renovations;
- Public building management system, which is the focus of this paper;
- Help template tool, which is a simplified management tool for multi-medial contents of the custom interfaces of the portal.
The structure of the AUREE portal is designed to guide the user through a process of deepening knowledge, organized into some progressive levels that define the user experience. The section of the portal focused on public buildings follows the underlying idea of the project by articulating itself into successive levels of deepening knowledge (see Figure 3). After the home page, ideally targeted to a generic and not specifically interested user, by clicking on the link “public buildings” the user can move to a page that constitutes the first level of knowledge aimed at an audience that is non-technical but interested in the subject. This page could serve as a hub to access other subsequent levels of knowledge dedicated to more specific users: page of documentations, building summary sheet, BIM interface.
Currently, the methodology is focused on the following aspects:
- Developing and testing protocols to provide and pre-process baseline data for a building sheet, focusing on integration with the normal activities carried out by public buildings’ management services;
- Developing and testing procedures for loading baseline data into the portal, with special attention to support interfaces aimed at building managers;
- Evaluating the effectiveness of the contents with a selected group of stakeholders.
3. The Case Study
3.1. Carbonia Public Buildings
Carbonia (about 27,000 inhabitants) is a southern Sardinian (Italy) company town, founded by the Fascist regime, starting from 1937, in an area close to the coal mine of Serbariu. Before the discovery of Serbariu’s mine, only sporadic nuclei of rural houses could be found in that area [43,44].
The first urban plan, which was designed for the city by the architect Gustavo Pulitzer-Finali in 1937, included a central spatial layout of neighboring and connecting squares and public buildings near residential areas [43,44]. The square known as “Piazza Roma” should be considered to be the main historical public space of the town, since the most representative public buildings (i.e., the Church of San Ponziano, the Fascist headquarters, the town hall, the post office, the movie theatre, and the recreational club) are located around three of the four sides of its rectangular perimeter.
The public heritage buildings of Carbonia must be distinguished between buildings dating back to the city’s establishment and those introduced by subsequent urban plans. The public heritage buildings dating back to the Carbonia establishment can be classified by building function as follows:
- Buildings for culture and Fascist propaganda;
- Religious architecture;
- School buildings;
- Public services.
The Fascist headquarters (i.e., the so-called “Torre Littoria”), the office workers’ recreational club, and the movie theatre are representative of the historical buildings for culture and fascist propaganda. Although these buildings can be considered to be apparently dissimilar, a few detailed designs and peculiar distribution layouts allow them to be related to Pulitzer-Finali’s architecture [43,44].
The religious architecture, designed instead by the architects Ignazio Guidi and Cesare Valle in continuation of Pulitzer-Finali’s work, can be related to the historicist modern trend which characterized some Italian architecture of the twentieth century [43,44]. The architects Guidi and Valle also had a better opportunity to experiment with a modern and rational language in school buildings design, by recalling the architecture of Gropius [43,44].
The north side of “Piazza Roma” in Carbonia is characterized by the presence of historical buildings for public services such as the town hall, the post and telegraph office, and some public housing (i.e., the so-called “case INA” houses). Moreover, according to the original rational urban plan, other public services (e.g., schools, healthcare services, food shops, hotels for employees and workers, and buildings for recreational activities) were integrated into the urban areas of working-class housing estates [43].
It is worthwhile mentioning that, among the public buildings erected after the Carbonia company-town establishment, there were several schools from nursery to lower secondary level, neighborhood and city sports facilities, libraries, several public houses, and cultural buildings such as the archeological museum “Villa Sulcis” [45].
Since the early 2000s, the company town of Carbonia has been subjected to a relevant urban and architectural regeneration plan, financed by European funds. The plan has involved the functional and environmental restoration of a new strategic urban infrastructure for sustainable mobility and accessibility to the historical center, restoration of the industrial archeology building “la Torneria”, and renovation of one of “the hotels for bachelor workmen” to be reused as a student house [46]. Moreover, the architectural and urban regeneration plan included a redevelopment strategy for the building complex of the abandoned Serbariu mine, which was acquired by the municipality of Carbonia in 1991. The mining site has been recovered and converted to an important cultural and Research Center for clean energy technologies. The Serbariu mining site currently hosts the headquarters of the Italian Center for Coal Culture, as well as the Coal Museum inaugurated in 2006 in the premises of the former lamp factory (i.e., the so-called “Lampisteria”) [47].
However, it should be noted that, after performing an extensive survey of the public buildings of Carbonia, only one building was selected as a pilot case for the application of the whole workflow presented in this paper.
3.2. Focus on the Sotacarbo Headquarters
The Sotacarbo Research Center, built between 1938 and 1939, was originally a materials warehouse serving the Serbariu Mine, owned by A.Ca.I. (an Italian carbon company), which took advantage of the Sulcis coal basin. The building was enlarged in the 1950s with three new bays for additional warehouses in the courtyard.
The building was originally characterized by a main façade in exposed trachyte masonry with a large iron gate leading to a courtyard through a wide corridor. The other building facades were only characterized by trachyte wainscoting.
In 2000, the building structures and finishes appeared considerably deteriorated due to a state of abandonment. Therefore, the building was renovated to make it functional and appropriate to its new use as a research center but also respecting its historic testimonial value of industrial archeology [46].
Currently, the building occupies a rectangular footprint area 54 m long and 50 m wide. All the building structures are arranged around an internal courtyard that measures approximately 29 × 30 m, and inside the courtyard, the two longest sides are connected by a more recent structure (Figure 4).
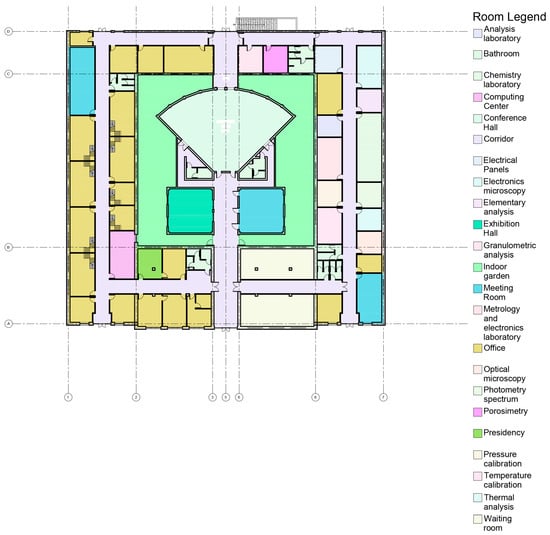
Figure 4.
Sotacarbo Research Center: Ground floor plan with room uses.
The two shortest parallel wings of the building are characterized by sloping roofs, with the height of the eaves being about 6 m, and are also provided with double-pitched skylights protruding on the roof top. The six skylights originally ensured optimal lighting and a natural ventilation system, whereas they have currently lost their natural function, and are now completely closed with a corrugated sheet (Figure 4).
The building structures comprising the Sotacarbo Research Center headquarters can be divided into three blocks based on their use. The first main building block hosts offices; laboratories; and an archive, meeting, and conference rooms (as shown in Figure 4). The offices are double-height rooms, with partially transparent mezzanines. A second block consists of a new building, made of precast reinforced concrete components, designated as a mechanical workshop.
The third and last functional block includes open areas, such as the pilot platform area, which hosts experimental systems and services connected to it, the car parks, as well as access and green areas. The internal courtyard hosts an auditorium (see Figure 4) with capacity for about 100 people and relative services, an exhibition hall, and a meeting room, all surrounded by a small green area. The auditorium, the exhibition hall, and the meeting room are characterized by more recent construction systems as they date back to the aforementioned relevant renovations that occurred in the early 2000s. In particular, the auditorium structure is made of exposed reinforced concrete columns, infilled with exposed brick rubble-filled masonry, with a ventilated roof supported by glulam beams and a corrugated sheet. The exhibition hall and the meeting room are characterized by the same construction systems as the auditorium structure.
Regarding the building envelope, the perimeter north-east and south-west walls, which are sixty centimeters thick, were built with a double layer of irregular trachyte ashlars with mixed earth and lime grout, according to the Sardinian building tradition, and plastered both inside and outside (see Figure 5 and Figure 6). The north-west trachyte wall is fifty centimeters thick and plastered only on the inside. The south-east external wall, dating back to the renovation, is, instead, made of porous bricks and is only thirty centimeters thick. The walls facing the courtyard, again in trachyte, have a thickness of between fifty and fifty-five centimeters. The wall structure characterizing the most recent buildings is, instead, composed of an outer layer, which is twenty centimeters thick with exposed brick masonry and an approximately four centimeters interlaid layer of air, a four-centimeters layer of extruded expanded polystyrene, a further brick masonry stratum which is eight centimeters, and an inner layer of premixed gypsum plaster which is one and a half centimeters.
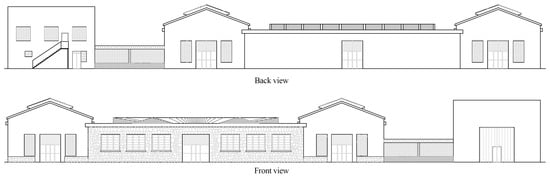
Figure 5.
Sotacarbo Research Center: Front and back views.
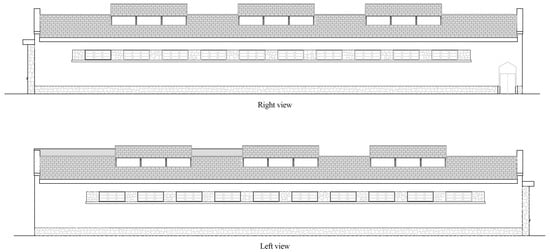
Figure 6.
Sotacarbo Research Center: Right and left views.
Regarding the building’s systems, it is equipped with:
- A lighting system;
- A system for hot water production including three electric water heaters;
- A winter and summer air conditioning system, consisting of two electrical air-water heat pumps placed outside the building, and fan coils as terminal units.
4. Results
4.1. Provision of Carbonia’s Public Buildings Abacus
The public building stock of Carbonia currently counts about 120 public buildings. However, only an abacus of the most relevant public buildings was composed by classifying the heritage buildings based on the relevance of size and use.
The considered list of the most significant public buildings in Carbonia (in Table 1) includes the town hall and other buildings for municipal offices; some cultural buildings such as a theatre, a cinema, and a library; public schools from nursery to lower secondary level; the intermodal center; etc.

Table 1.
Abacus of selected Carbonia public buildings.
The public buildings encompassed in the abacus are georeferenced by identifying them in a Geographic Information System (GIS) environment (see the related map in Figure 7), similar to what was done for the private building stock during the previous stages of the AUREE project [28,29,30]. For each building, an information sheet is arranged, by means of a system of interconnected tables (called “dictionaries”) similar to a relational database.
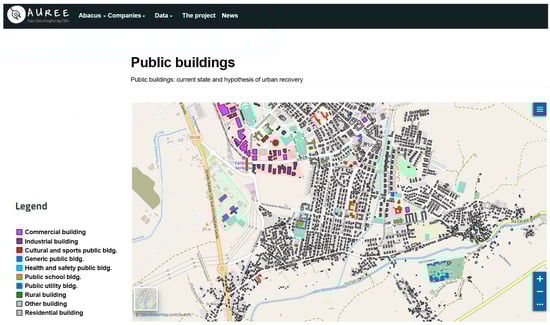
Figure 7.
Carbonia public buildings represented on the AUREE Web–GIS portal.
4.2. AUREE Portal: The Public Buildings Section
As illustrated in the methodology section, the portal is primarily addressed to non-technical users. It aims at presenting the main characteristics of the building stock in order to facilitate the involvement of various local actors in the field of energy retrofitting and renovation of public and private buildings.
The first page is obviously the home page (Figure 8), with the links to the main sections of the portal: residential buildings, typologies, and public buildings. The home page also includes a direct link to a questionnaire that allows simulation of the energy retrofitting potential of a residential unit or building, plus a news section, a link to the section dedicated to local companies, and a repository of other layers and documentation that may be related to the main subject of the portal (technical regulations, local urban planning, etc.).
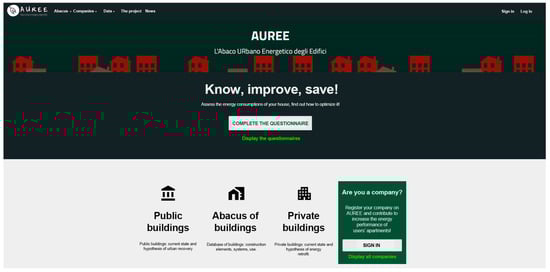
Figure 8.
Home page of the AUREE portal.
Currently, not all sections of the portal are fully operational and freely accessible online, some are still being tested. The section focused on public buildings, which is the subject of this work, is currently being developed in beta version and shows the contents of some buildings that have been analyzed in the context of the research.
The map that constitutes the first level of knowledge is directly accessible from the home link. It mainly contains the map of the urban center with the layer of Carbonia’s public buildings (Figure 7), which collects a summary of the most relevant information. The navigator (Figure 9) allows users to explore the map by activating some spatial themes based on the general characteristics of the building. The attributes data can be grouped into general information, historical series of energy consumption, and other typological energy performance information (Table 2). At present, only information related to the public buildings analyzed in this work have been included in the relative layer map, but procedures and tools are being defined to allow PA building managers to update the geographic database while performing their usual activities. From the map, through some direct links, it is possible to head to the other subsections of the public buildings page.
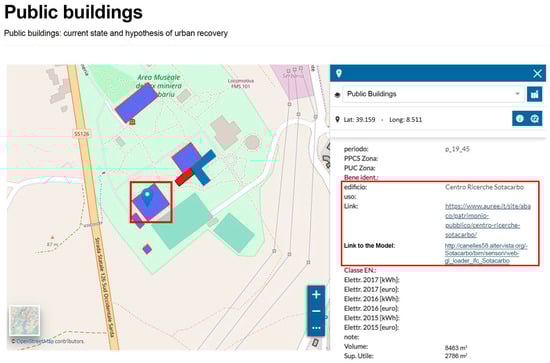
Figure 9.
Public buildings map of the AUREE portal: Information table related to the pilot case study (i.e., the Sotacarbo Research Center headquarters) in the red box.
Table 2.
AUREE: Attribute data for public buildings.
The link in the map allows users to access the environment dedicated to the visualization and interaction with the BIM model and with the sensors, described in detail in this work. This interface goes into more detail on the building’s energy management activities and it could constitute background knowledge for the development of a design activity. Therefore, it constitutes the level of information with the highest technical content in the section of public buildings and it is primarily aimed at the technical managers of the structures. Nevertheless, future research developments are aimed at simplifying the interfaces to facilitate non-technical users as well.
The documentation page (Figure 10) is aimed at an audience that is not necessarily technical, but must have at least an interest in increasing knowledge about the building. From an IT point of view, it is a simple page for collecting and cataloging generic multimedia documentation (text, video, pictures, etc.) focused on a specific building, such as historical information, renovation projects, and other useful links. The documents are labeled with the building’s unique code, and currently, the research work is addressed on a semantic classification framework to support searching for information when data become numerous.
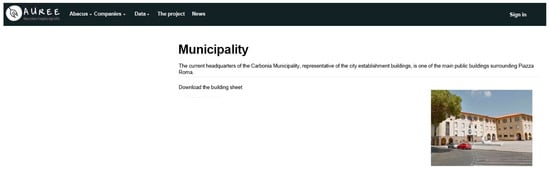
Figure 10.
Sample of a public building documentation page.
The building summary sheets (Figure 11) aim to collect and represent information about the energy performance and retrofit potential of the building in a synthetic way, in order to support the decision-making process of the public administration managers and to promote the participation of local stakeholders. The baseline information can be obtained from some common technical documents easily available in the context of building asset management activities, such as energy diagnosis, Energy Performance Certificates (EPCs), project reports, and documents for verifying legal energy minimum requirements [48]. The EPCs should be easily reached for most public buildings because buildings with an indoor area greater than 200 square meters and buildings that have had systems renovated have to make this information publicly available (D.L. n. 63/2013 [49]). The summary sheet can facilitate the strategic-decision phase of the PA building energy manager by providing a framework for organizing and representing available data and a tool for comparing different retrofit scenarios.
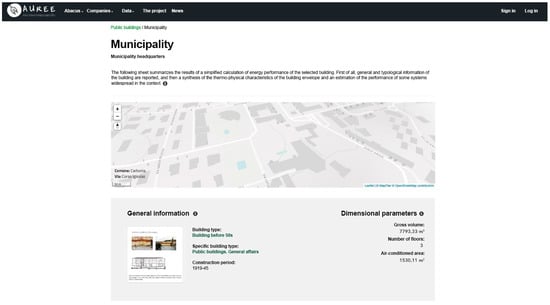
Figure 11.
Sample of a public building summary sheet.
- The other subsections that constitute the levels of higher information depth described in the methodology can be obtained from the attribute section:
- The page of general documentation (Figure 10);
- The building summary sheet, to support the decision-making process and participation, which will be illustrated in another contribution (Figure 11);
- The WebGL 3D environment described in this work, which allows access to the BIM information.
4.3. BIM Authoring
In accordance with the proposed methodology, described in detail in Section 2, the building information modeling methodology is adopted to digitally represent the Sotacarbo Research Center headquarters to properly store, in specific parameters, some significant information concerning the technical features of sensor devices and the controller. In Figure 12, a workflow chart including the main tasks performed during the implementation of the BIM-based model (in Figure 13) of the case study is schematically presented. As far as the main characteristics of the envelope and structures are concerned, it is assumed that the building is characterized by the same construction systems (described in Section 3.2) as the neighboring blocks.

Figure 12.
Implementation of the BIM model: Workflow chart.
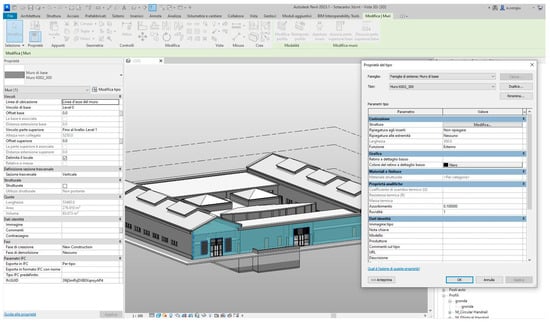
Figure 13.
The BIM model of the Sotacarbo’s headquarters.
The digital construction of the BIM model is primarily aimed at reorganizing and systematizing all information collected during the building knowledge process, by properly assigning relevant information concerning the building real components to their corresponding virtual elements in the model. To this end, the Autodesk Revit software is adopted as the BIM authoring tool, since, currently it has been proven to be the most suitable to be included in the proposed workflow.
Starting from an accurate analysis of the information assets gathered during the building knowledge process, relevant geometric and non-geometric data that need to be parametrically digitalized by the information modeling are selected, in accordance with the level of information need (LOIN) [34] required for the project goals. BIM models should not be considered to be all-encompassing containers for all types of information concerning building assets or projects, but rather as digital databases of graphical and alphanumeric information properly selected and structured for a specific objective. Consistent with the main goals pursued by this work, detailed information concerning the installed IoT sensors is collected by specific parameters assigned to the building rooms, as shown in Figure 14. Moreover, as room entities are not considered to be exported to the IFC-based WebGL scene, a specific set of IFC parameters including some general information concerning the installed IoT sensors is assigned to a generic parametric object, simply represented as a sphere (as shown in Figure 15), designated to be exported as part of the IFC model and to be properly linked to the IoT platform for real-time data monitoring.
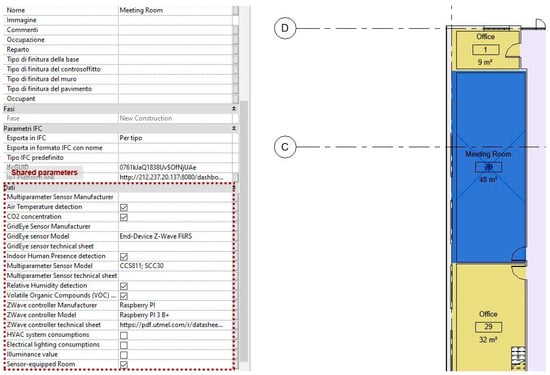
Figure 14.
BIM model: Specific “shared parameters”(in red square) collecting information concerning IoT sensors placed in rooms.
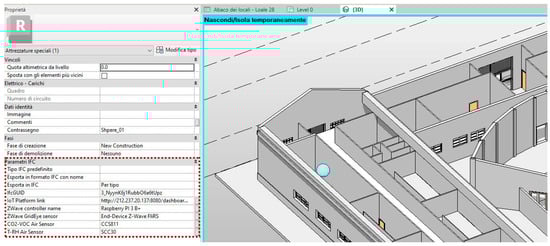
Figure 15.
BIM model: Parametric sphere object and related IFC parameters (in the red box) including the IoT platform link.
By using a visual programming code implemented by Dynamo and executable using the Dynamo player, information tables concerning sensor-equipped rooms can be automatically arranged and exported to external Excel worksheets, made available via the cloud by a specific web link from the web–GL scene.
After decomposition of the building into technical components (leading to the building’s product breakdown structure (PBS) (see Figure 12), then, the digital construction of the building information model (shown in Figure 13) is carried out in two stages:
- A modeling stage, where all components are geometrically modeled based on technical drawings made available by the Sotacarbo company and on survey data;
- A parametrization stage, where all information is assigned to each building component by storing the information in specific parameters.
The choice of the most suitable codification system for BIM virtual objects represents another crucial step in this work to ensure quality in communication and interoperability between all subjects involved in the process. More specifically, the code system herein adopted is created based on the UNI 8290 standard [50] but also enhanced in order to identify each single item in the model.
4.4. WebGL Graphic Libray
As anticipated in the methodological section, game engines based on WebGL (Web Graphics Library) applications are adopted to also make the BIM model accessible to non-technical users and to ease the display of real-time monitoring data.
Among the WebGL applications available in open source, the “three.js” java-based library [36] is chosen to import BIM models via the Industry Foundation Classes (IFC) non-proprietary standard format [37].
Before exporting the BIM model to an adequate IFC format, proper display filters are applied to ease visualization and selection of the building virtual components, which are also linked to the aforementioned “Thingsboard” platform for sensor data monitoring. Programming operations through java language are necessary to further simplify the IFC model visualization and management.
At the end of this WebGL-based process, schematically represented by the flowchart in Figure 16, the web address of the “ThingsBoard” platform is allocated to a specific BIM object (highlighted as a red sphere in Figure 17).
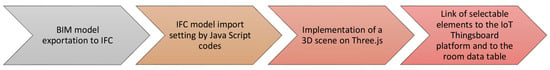
Figure 16.
WebGL 3D scene implementation: Workflow chart.
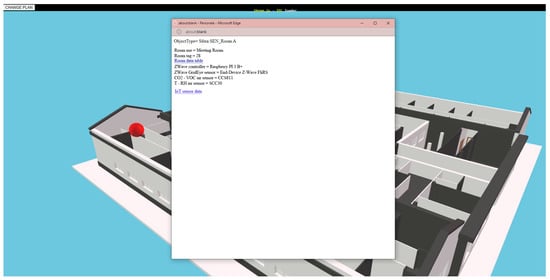
Figure 17.
Three.js scene: Selection of an object linked to an Excel room data table and to the Thingsboard IoT platform to access sensor real-time data.
The WebGL information model is currently available and queryable via a browser, whose web address is provided by the AUREE web–GIS portal (see Figure 3). In this regard, it is worthwhile noting that only the IFC objects linked to the “Thingsboard” IoT platform are made selectable on the “three.js” scene (see Figure 17). As described in the previous section, each sensor-equipped room (even though only one room has been provided with IoT sensors so far) in the IFC model is also connected to the related information table by means of a specific web link (see the Figure 17).
4.5. Real-Time Data Monitoring: The Sensor-Based Infrastructure
The Department of Electrical and Electronic Engineering (DIEE) at the University of Cagliari has created devices, characterized by minimal implementation and management cost (maintenance and energy consumption), that are suitable for environmental parameter monitoring (CO2, VOC, temperature, and relative humidity) and indoor human presence detection (GridEye), constituting a network of wireless sensors managed by a gateway device. The aim is to verify the dynamic and steady-state performance of both the sensor devices and the wireless network with particular reference to the precision and repeatability of the indoor parameter measurements and the level of energy consumption of the system.
Two types of devices have been built:
- A multi-parameter sensor that is capable of simultaneously measuring carbon dioxide concentration (CO2), volatile organic compounds (VOC), air temperature, and relative humidity.
- A sensor for detecting indoor human presence (i.e., the GridEye is an infrared array sensor that can count people passing through a certain opening by acquiring thermal images and temperature gradients [39]).
The prototypes of sensor devices are placed in communication with each other and with a gateway positioned inside the monitored environments to communicate with all the devices in the network. The sensor devices, which also act as network nodes, use mesh technology, particularly the Z-Wave protocol. At the same time, the gateway communicates with the cloud via Wi-FI standard. The data acquired by the sensors are available in the cloud platform, making it possible to calculate, for example, the comfort indexes (see Figure 18).
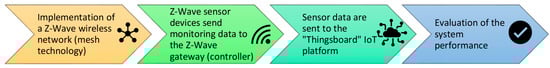
Figure 18.
Implementation and test of the sensor-based infrastructure: Workflow diagram.
Operationally, the implemented sensor network is installed in the Sotacarbo Research Center in the city of Carbonia. The devices are configured to send the measurement data to the Z-Wave controller, which packages the data and sends the data at regular intervals, set by the user when configuring the Controller/Raspberry. The management of the data acquired by the sensor devices is shown and stored by the platform “ThingsBoard” (Figure 19). Each controller sends the data to the platform using the APIs made available by the same platform. The data are then represented graphically through appropriate widgets on the “ThingsBoard” platform.
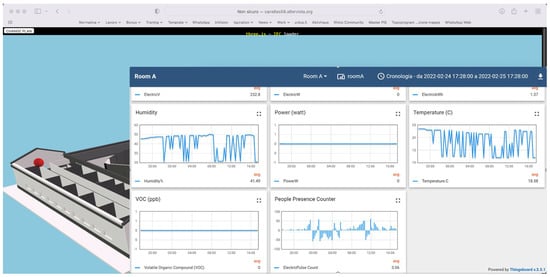
Figure 19.
Access to the “Thingsboard” IoT platform: Real-time data monitoring.
The network of sensors, created in the laboratory, is subjected to appropriate tests to verify the performance of the sensors regarding radio frequency coverage and reliability of the data detected and power consumption.
The evaluation of the system’s performance is carried out in three steps:
- The first step consists of verifying the values read by the sensors locally, i.e., at the microcontroller level, through a serial interface and connecting of the electronic card to a PC to monitor the values.
- The second step concerns aspects related to the reception of data transmitted by the microcontrollers via the Z-wave network.
- The third step concerns checking the communication of the gateway with the “in-cloud” system.
From a scientific point of view, the most significant aspect concerns the reduced power consumption of the wireless sensor and the gateway, thanks to the use of “low power” technologies and the implementation of energy harvesting technologies.
Energy harvesting technologies efficiently capture, accumulate, and manage the ambient energy and supply it in a form that can be used to empower electronic devices.
In this way, it has been possible to extend the energy autonomy of the wireless sensors and to reduce the cost of periodic maintenance linked to battery replacement. In the near future, energy harvesting will allow for the creation of self-powered, low-cost radio sensors that do not require batteries but only require a supercapacitor device for energy storage. This would reduce the environmental impact of the sensors in terms of energy used for their operation and the disposal of particular waste, such as accumulators.
Figure 19 shows how sensor data are accessible in real time by the link from the BIM model to the open-source platform Thingsboard, made available in the WebGL scene.
5. Discussion
In this paper, we show and discuss the last findings of the AUREE project whose latest research is focused on improving the developed UBEM-based methodology to effectively implement the portal section designated for public buildings in Carbonia (Cagliari, Italy). The main purpose of the AUREE Web-Geoportal is to provide a useful open tool to share knowledge about energy performance of residential [28,29,30] and public buildings with the dual purpose of increasing end users’ awarenesses regarding proper energy behavior and supporting public administrations and other decisionmakers in sustainable building management.
Implementation of the public building section, which is the subject of this paper and is currently being developed in beta version, has started with the provision of an urban abacus of the most relevant public buildings in Carbonia, classified by the related construction period and use category. As the first level of knowledge, a queryable 3D map of the public building stock is provided through GeoNode and made available in the AUREE portal. From the map, through some direct links, it is possible to access the documentation pages related to the most relevant public buildings, which is the subject of this work. Documentation pages and related building summary sheets are intended to provide both the common citizens and the facility managers with some general, historical, and technical information about the building features, its systems’ equipment, as well as use and potential retrofit scenarios. It is worthwhile highlighting that implementation of the AUREE section designated for public buildings, which is the subject of this contribution, required a different approach compared to that for residential buildings (the subject of previously published contributions), as the typification of the public building stock and the identification of its archetypes have been deemed needless.
Moreover, the present work shows how it is also possible to deepen the knowledge level of public buildings by integrating the UBEM-based methodology with a BIM-IoT framework aimed at collecting and processing real-time data concerning building occupancy and indoor environmental conditions affecting air quality, by taking advantage of low-cost IoT sensors. This additional part of the framework, which is of primary relevance in this paper, introduces a building link in the map to directly access an open WebGL 3D scene designated for enabling dynamic visualization of the building information model (BIM) and selecting objects linked to the IoT platform, to access data from real-time monitoring. Although this experimental part of the methodological framework has only been tested on a pilot case study (i.e., the Sotacarbo Research Center headquarters), the workflow can be assumed to be replicable and scalable.
The results from this work demonstrate that it is possible to create an open system, with minimum implementation and management costs, which can be intuitively consulted by specialists as well as unskilled users, to display real-time monitoring data, such as data from sensors used to measure the energy consumption of a building, its internal environmental conditions, and usage profiles. The system is fully open, it works with sensor data that are available via cloud and does not need any specific proprietary tool, except the exportation of an IFC model that can be created with any BIM authoring. The present study, therefore, contributes to confirm the key role that building information modeling (BIM) and the latest Industry 4.0 technologies (such as the Internet of Things devices, cloud computing, and digital twins) may have in the energy transition of the built environment, in a sustainable perspective of optimizing buildings’ energy consumptions at an urban scale.
Unfortunately, there are also some limitations of this work:
- Some sections of the presented Web–GIS portal are still lacking, since the AUREE project is still under completion and testing. Moreover, since these procedures can take a long time due to the necessity of spreading the portal and diffusing its use among possible stakeholders, the available data from adopting the portal are still insufficient to detect significant qualitative and quantitative effects on the energy performance and management of the involved building stock.
- The experimental framework section based on the integration of BIM and IoT sensors proved to be methodologically valid, but its field testing only addressed a single room of a single building and only sensors assessing indoor air quality (IAQ) and room occupancy have been tested so far.
From a broader perspective, in the future, the proposed tool could provide a valid open support for controlling and improving the management of rising renewable energy communities [51], consisting of groups of actorswhich jointlypromote collective and citizen-driven energy actions aimed at optimizing the self-production and consumption of renewable energy.
6. Conclusions and Future Work
In the literature, there are many examples of guidelines or quality protocols about heritage building renovations and many of them have focused on energy efficiency enhancement [52]. These guidelines are generally documents that have been developed for a purely technical audience, and often, due to their intrinsic specificity, accessing them is difficulty even among operators in the construction industry and they are almost unknown to non-technical citizens. In order to overcome these barriers, the development and testing of methodologies and supporting tools are becoming increasingly important. Thanks to an increased availability in open-source geographic data, examples of methodologies for supporting urban energy planning are increasingly numerous. Most of these are urban building energy modeling (UBEM) approaches [32] that aim to define buildings’ stock energy needs and to estimate the potential (theoretical, technical, and exploitable) of various efficiency technologies and/or design scenarios. The Urban Energy Abacus of Buildings (AUREE) project, which fits into this context, is aimed at developing and testing a tool to support energy efficiency and the renovation process of heritage buildings based on a portal (Web–GIS and GeoBlog). The proposed tool contains some specific interfaces aimed at sharing knowledge of the building stock and promoting participation of local stakeholders and common end-users (including unskilled citizens). Moreover, an “archetype” simplification approach was adopted in the earliest stages of the AUREE project to explicate some peculiar elements that characterize energy need, and the use of appropriate methods (analytical, statistical, etc.) of a representative sample of residential buildings in Carbonia, in order to create a spatial-based abacus of the heritage building [28]. The latest stages of the AUREE project, instead, have focused on implementation of the public building section of the open Geoportal, which has not required an “archetype-based” approach.
Although the final aim of the AUREE project is to improve operational management and to promote energy efficiency, these procedures can take a long time due to the necessity of spreading the portal and diffusing its use among possible stakeholders. Thus, the main results discussed in this paper mostly concern the functionality of the proposed workflow and its successful implementation in an open portal.
In light of the above, the following concluding remarks about the latest findings of the AUREE project can be made:
- The accomplishment of the Web–GIS portal section reserved for public buildings provides common citizens, public administrations, and technical facility managers with an open urban building energy model (UBEM) by making available general, technical, as well as energy-related information about the most relevant public buildings in Carbonia (Cagliari, Italy).
- The Geoportal section for public buildings supplies a valid open-source digital support to guide, through progressive knowledge deepening, common end-users toward proper conscious “energy behaviors”, as well as public administrations and decision-makers toward a sustainable facility management;
- The experimental integration of the UBEM with an open-source Web Graphics Library interface, for visualizing the BIM model of a pilot case study (i.e., the headquarters of the Sotacarbo Research Centre) and for accessing the open IoT platform to read real-time sensor data, highlights the advantages of introducing such innovative technologies into the Architecture, Engineering and Construction (AEC) sector.
- Unfortunately, only when all portal sections are fully operational for users and stakeholders, and when application of the BIM-IoT integrated protocol is extended to multiple relevant public buildings, will it be possible to detect some beneficial impacts on a more virtuous energy management of building stock.
The AUREE project is still in progress, funded by the 2019–2021 Triennial Plan for the fulfilment of the Agreement between the Ministry for Economic Development and the Italian National Agency for New Technologies, Energy and Sustainable Economic Development (ENEA).
Currently, the general purpose of the research is mainly oriented on improving the methodological procedures implemented and the contents of the AUREE portal on residential and public heritage building topics. Relevant developments related to studies on public heritage buildings that concern an indoor air quality (IAQ) analysis through the implementation of commercial sensors on case-study buildings and the monitoring of IAQ variables. Measurement campaigns in the medium (weekly and seasonal) and long (annual) term will allow acquiring information regarding the profiles of use (medium term) and the influences induced by climate change (long term). The collected data will be processed and made available to allow different end users (ordinary citizens, energy managers, facility management workers, etc.) to verify, with different detail levels, the performance of public buildings. Easier implementation is the goal of optimizing the existing procedure. The basic information models will be more detailed. The model used to represent a building and the sensors will be made networkable, with models developed for the procurement of management of public buildings.
Author Contributions
Conceptualization, G.D., C.F. and S.P.; methodology, G.D., E.C., G.G. and S.P.; methodology application, E.C., G.G. and S.P.; writing—original draft preparation, E.C., C.F., G.G. and S.P.; writing—review and editing, E.C., G.D. and S.P.; visualization, E.C. and S.P.; supervision, G.D. All authors have read and agreed to the published version of the manuscript.
Funding
The Urban Abacus of Building Energy Performances–Abaco Urbano Energetico degli Edifici (AUREE) research project was funded by the 2019–2021 Triennial Plan for the fulfilment of the Agreement between the Italian Ministry for Economic Development and the Italian National Agency for New Technologies, Energy and Sustainable Economic Development (ENEA)–Project 1.5 “Technologies, techniques, and materials for energy efficiency and energy saving in the electrical end uses of new and existing buildings”.
Data Availability Statement
The authors declare that all data supporting reported results are available within the manuscript.
Conflicts of Interest
The authors declare no conflict of interest.
References
- European Commission. Proposal for a Directive of the European Parliament and of the Council Amending Directive (EU) 2018/2001 on the Promotion of the Use of Energy from Renewable Sources, Directive 2010/31/EU on the Energy Performance of Buildings and Directive 2012/27/EU on Energy Efficiency (Text with EEA Relevance); European Commission, European Union: Brussels, Belgium, 2022. [Google Scholar]
- European Council. European Green Deal—Fit for 55. Available online: https://www.consilium.europa.eu/en/policies/green-deal/fit-for-55-the-eu-plan-for-a-green-transition/ (accessed on 13 April 2023).
- Kranzl, L. Entranze Consortium Laying down the Pathways to Nearly Zero Energy Buildings: A Toolkit for Policy Makers. ENTRANZE Consortium. 2014. Available online: https://www.entranze.eu/files/downloads/D6_11/entranze_report_final.pdf (accessed on 13 April 2023).
- European Commission. Digitalising the Energy Sector—EU Action Plan. Available online: https://ec.europa.eu/info/law/better-regulation/have-your-say/initiatives/13141-Digitalising-the-energy-sector-EU-action-plan_en (accessed on 13 April 2023).
- Pili, S. Toward Building Knowledge for Suporting Sustainable Transition of the Building stock. In Proceedings of the 14th International Multidisciplinary Scientific GeoConference Surveying Geology and Mining Ecology Management SGEM 2014—Green Design and Sustainable Architecture, Albena, Bulgaria, 17–26 June 2014; Volume 2, pp. 3–10. [Google Scholar]
- ENEA SIAPE—Sistema Informativo Sugli Attestati di Prestazione Energetica. Available online: https://siape.enea.it/ (accessed on 13 April 2023).
- Repowermap. Available online: http://www.repowermap.org/ (accessed on 13 April 2023).
- OnePlace—The Online Energy Platform. Available online: https://oneplace.fbk.eu/ (accessed on 13 April 2023).
- Energy Technologies Area Lawrence Berkeley National Laboratory Home Energy Saver. Available online: https://homeenergysaver.lbl.gov/consumer/ (accessed on 13 April 2023).
- Greenovation SRL GREENOVATION. Available online: https://www.greenovation.it/ (accessed on 13 April 2023).
- European Commission. CORDIS EU Research Results—HORIZON 2020—An ENErgy Retrofit FUNDing Rating Tool. Available online: https://cordis.europa.eu/project/id/695873 (accessed on 13 April 2023).
- Bologna Solar City. Available online: http://sitmappe.comune.bologna.it/BolognaSolarCity/ (accessed on 13 April 2023).
- HOTMAPS TOOLBOX. Available online: https://www.hotmaps-project.eu/hotmaps-project/ (accessed on 13 April 2023).
- ENEA Smart City Platform. Available online: https://idp.smartcityplatform.enea.it/#/login/BQzSyXy3FNEmAXCSRXj44mJAABY2C0o9 (accessed on 13 April 2023).
- ENEA Recon. Available online: https://recon.smartenergycommunity.enea.it/ (accessed on 13 April 2023).
- Chen, Y.; Huang, D.; Liu, Z.; Osmani, M.; Demian, P. Construction 4.0, Industry 4.0, and Building Information Modeling (BIM) for Sustainable Building Development within the Smart City. Sustainability 2022, 14, 28. [Google Scholar] [CrossRef]
- Panteli, C.; Kylili, A.; Fokaides, P.A. Building Information Modelling Applications in Smart Buildings: From Design to Commissioning and beyond A Critical Review. J. Clean Prod. 2020, 265, 121766. [Google Scholar] [CrossRef]
- Tzortzopoulos, P.; Ma, L.; Soliman Junior, J.; Koskela, L. Evaluating Social Housing Retrofit Options to Support Clients’ Decision Making-SIMPLER BIM Protocol. Sustainability 2019, 11, 2507. [Google Scholar] [CrossRef]
- Di Giuda, G.M.; Quaquero, E.; Villa, V.; Tagliabue, L.C.; Desogus, G.; Sanna, A.; Ciribini, A.L.C. Towards the Cognitive Building: Information Modeling for the Energy Audit. TEMA Technol. Eng. Mater. Archit. 2018, 4, 13–24. [Google Scholar] [CrossRef]
- Di Giuda, G.M.; Pellegrini, L.; Schievano, M.; Locatelli, M.; Paleari, F. BIM and Post-Occupancy Evaluations for Building Management System: Weaknesses and Opportunities. In Digital Transformation of the Design, Construction and Management Processes of the Built Environment; Research for Development; Daniotti, B., Gianinetto, M., Della Torre, S., Eds.; Springer: Cham, Switzerland, 2019; pp. 319–327. [Google Scholar]
- Desogus, G.; Quaquero, E.; Sanna, A.; Gatto, G.; Di Giuda, G.M.; Tagliabue, L.C.; Rinaldi, S.; Luigi, A.; Ciribini, C.; Villa, V. Preliminary Performance Monitoring Plan for Energy Retrofit: A Cognitive Building: The “Mandolesi Pavillon” at the University of Cagliari. In Proceedings of the 2017 AEIT International Annual Conference, Cagliari, Italy, 20–22 September 2017; IEEE: New York, NY, USA, 2017; pp. 1–6. [Google Scholar]
- Sanna, A.; Ciribini, A.L.C.; Di Giuda, G.M.; Gatto, G.; Villa, V.; Quaquero, E.; Tagliabue, L.C.; Desogus, G. Information Modeling for the Monitoring of Existing Buildings’ Indoor Comfort. TEMA Technol. Eng. Mater. Archit. 2019, 5, 42–56. [Google Scholar]
- Sanna, A.; Ciribini, A.L.C.; Di Giuda, G.M.; Gatto, G.; Villa, V.; Quaquero, E.; Tagliabue, L.C.; Desogus, G. La Mappatura Dei Dati Su Consumi Energetici e Condizioni Di Comfort Di Un Edificio Esistente Attraverso La Modellazione Informativa—Datamapping of Existing Buildings’ Energy Consumptions and Indoor Comfort Condtions through Information Modelling. In Proceedings of the Colloqui.AT.e 2018—Edilizia Circolare, Cagliari, Italy, 12–14 September 2018; Cuboni, F., Desogus, G., Quaquero, E., Eds.; Edicom Edizioni: Cagliari, Italy, 2018; pp. 736–745. [Google Scholar]
- Rogage, K.; Clear, A.; Alwan, Z.; Lawrence, T.; Kelly, G. Assessing Building Performance in Residential Buildings Using BIM and Sensor Data. Int. J. Build. Pathol. Adapt. 2020, 38, 176–191. [Google Scholar] [CrossRef]
- SARDEGNA RICERCHE—Progetto PRELuDE. Available online: https://www.sardegnaricerche.it/index.php?xsl=370&s=358945&v=2&c=15067&nc=1&sc (accessed on 13 April 2023).
- Desogus, G.; Quaquero, E.; Rubiu, G.; Gatto, G.; Perra, C. BIM and IoT Sensors Integration: A Framework for Consumption and Indoor Conditions Data Monitoring of Existing Buildings. Sustainability 2021, 13, 4496. [Google Scholar] [CrossRef]
- Valinejadshoubi, M.; Moselhi, O.; Bagchi, A.; Salem, A. Development of an IoT and BIM-Based Automated Alert System for Thermal Comfort Monitoring in Buildings. Sustain. Cities Soc. 2021, 66, 102602. [Google Scholar] [CrossRef]
- Pili, S.; Desogus, G.; Poggi, F.; Frau, C.; Dessì, A. A Geographical Abacus of the Urban Building Heritage Based on Volunteered Geographic Information (VGI). In Proceedings of the Lecture Notes in Computer Science (Including Subseries Lecture Notes in Artificial Intelligence and Lecture Notes in Bioinformatics), Cagliari, Italy, 13–16 September 2021; Springer Science and Business Media, Deutschland GmbH: Berlin/Heidelberg, Germany, 2021; Volume 12958, pp. 163–173. [Google Scholar]
- Pili, S.; Poggi, F.; Frau, C. A Methodological Approach for a Home Occupants Centred Web Tool to Support Buildings Energy Retrofitting Process. In Proceedings of the E3S Web of Conferences—76° Italian National Congress ATI, Rome, Italy, 15–17 September 2021; EDP Sciences: Les Ulis, France, 2021; Volume 312. [Google Scholar]
- Desogus, G.; Pili, S.; Sanna, A.; Dessì, A. La Segmentazione e Caratterizzazione Del Patrimonio Costruito Della Città Di Carbonia per La Realizzazione Di Un Modello Energetico Urbano The Segmentation and Characterization of the Built Heritage of the City of Carbonia for the Realization of an Urban Energy Model. In Proceedings of the Colloqui.AT.e 2022—Memoria e Innovazione, Genova, Italy, 10 September 2022; pp. 825–842. [Google Scholar]
- Reinhart, C.F.; Cerezo Davila, C. Urban Building Energy Modeling—A Review of a Nascent Field. Build Environ. 2016, 97, 196–202. [Google Scholar] [CrossRef]
- Ang, Y.Q.; Berzolla, Z.M.; Reinhart, C.F. From Concept to Application: A Review of Use Cases in Urban Building Energy Modeling. Appl. Energy 2020, 279, 115738. [Google Scholar] [CrossRef]
- Chen, Y.; Hong, T.; Luo, X.; Hooper, B. Development of City Buildings Dataset for Urban Building Energy Modeling. Energy Build. 2019, 183, 252–265. [Google Scholar] [CrossRef]
- International Organization for Standardization (ISO). ISO 19650-1:2019; Organization and Digitization of Information about Buildings and Civil Engineering Works, Including Building Information Modelling (BIM)—Information Management Using Building Information Modelling—Part 1: Concepts and Principles. International Organization for Standardization (ISO): Geneva, Switzerland, 2019. [Google Scholar]
- Ministero delle Infrastrutture e delle Mobilità Sostenibili (MIMS). Modifiche al Decreto Del Ministero Delle Infrastrutture e Dei Trasporti 1° Dicembre 2017, n. 560; Ministero delle Infrastrutture e delle Mobilità Sostenibili (MIMS): Rome, Italy, 2021; pp. 1–4.
- Threejs. Available online: https://threejs.org/ (accessed on 13 April 2023).
- International Organization for Standardization (ISO). ISO 16739-1:2018; Industry Foundation Classes (IFC) for Data Sharing in the Construction and Facility Management Industries—Part 1: Data Schema. International Organization for Standardization (ISO): Geneva, Switzerland, 2018. [Google Scholar]
- ThingsBoard—Open-Source IoT Platform. Available online: https://thingsboard.io/ (accessed on 13 April 2023).
- Perra, C.; Kumar, A.; Losito, M.; Pirino, P.; Moradpour, M.; Gatto, G. Monitoring Indoor People Presence in Buildings Using Low-Cost Infrared Sensor Array in Doorways. Sensors 2021, 21, 4062. [Google Scholar] [CrossRef] [PubMed]
- Yassein, M.B.; Mardini, W.; Khalil, A. Smart Homes Automation Using Z-Wave Protocol. In Proceedings of the 2016 International Conference on Engineering and MIS, ICEMIS 2016, Agadir, Morocco, 22–24 September 2016; Institute of Electrical and Electronics Engineers Inc.: New York, NY, USA, 2016. [Google Scholar]
- Kim, A.; Han, J.; Yu, T.; Kim, D.S. Hybrid Wireless Sensor Network for Building Energy Management Systems Based on the 2.4 GHz and 400 MHz Bands. Inf. Syst. 2015, 48, 320–326. [Google Scholar] [CrossRef]
- GeoNode. Available online: https://geonode.org/ (accessed on 13 April 2023).
- Peghin, G.; Sanna, A. Carbonia Città Del Novecento. Guida All’architettura Moderna Della Città Di Fondazione; Skira Editore: Milano, Italy, 2009. [Google Scholar]
- Sanna, A.; Monni, G. Recovery and Reuse of the Architectural and Urban Heritage of Carbonia, a 20th-Century Company Town. Materials for a Handbook. In Built Heritage: Monitoring Conservation Management; Research for Development; Toniolo, L., Boriani, M., Guidi, G., Eds.; Springer: Cham, Switzerland, 2015; pp. 55–67. [Google Scholar]
- Comune Di Carbonia. Available online: http://www.comune.carbonia.ci.it/urbiportal/Content/it_IT/139.html (accessed on 13 April 2023).
- Peghin, G. Quartieri e Città Del Novecento. Da Pessac a Carbonia, La Tutela Del Patrimonio Urbano Moderno; Architettura; Franco Angeli: Milan, Italy, 2010. [Google Scholar]
- Belisario, M.G. LANDSCAPEFOR—Carbonia: Landscape Machine. Available online: https://www.landscapefor.eu/documents/progetti/contributi/premio-del-paesaggio/ii-edizione/168-edizione-2010-2011/430-carbonia-landscape-machine (accessed on 13 April 2023).
- Ministro dello Sviluppo Economico; Ministro dell’Ambiente e della tutela del Territorio e del Mare, delle I. e dei T.; Ministro della Salute; Ministro della Difesa. Decreto Interministeriale 26 Giugno 2015—Applicazione Delle Metodologie Di Calcolo Delle Prestazioni Energetiche e Definizione Delle Prescrizioni e Dei Requisiti Minimi Degli Edifici; Ministero delle Imprese e del Made in Italy: Rome, Italy, 2015.
- Presidente della Repubblica. DECRETO-LEGGE 4 Giugno 2013, n. 63—Disposizioni Urgenti per Il Recepimento Della Direttiva 2010/31/UE Del Parlamento Europeo e Del Consiglio Del 19 Maggio 2010, Sulla Prestazione Energetica Nell’edilizia per La Definizione Delle Procedure d’infrazione Avviate Dalla Commissione Europea, Nonche’ Altre Disposizioni in Materia Di Coesione Sociale; Gazzetta Ufficiale: Rome, Italy, 2013.
- Ente Italiano di Normazione (UNI). UNI 8290-1:1981; Edilizia Residenziale. Sistema Tecnologico. Classificazione e Terminologia. UNI: Milan, Italy, 1981.
- European Commission Energy Communities. Available online: https://energy.ec.europa.eu/topics/markets-and-consumers/energy-communities_en (accessed on 15 April 2023).
- De Santoli, L. Guidelines on Energy Efficiency of Cultural Heritage. Energy Build. 2015, 86, 534–540. [Google Scholar] [CrossRef]


Disclaimer/Publisher’s Note: The statements, opinions and data contained in all publications are solely those of the individual author(s) and contributor(s) and not of MDPI and/or the editor(s). MDPI and/or the editor(s) disclaim responsibility for any injury to people or property resulting from any ideas, methods, instructions or products referred to in the content. |
© 2023 by the authors. Licensee MDPI, Basel, Switzerland. This article is an open access article distributed under the terms and conditions of the Creative Commons Attribution (CC BY) license (https://creativecommons.org/licenses/by/4.0/).