Abstract
In the context of China’s dual-carbon goals, energy efficiency in public buildings has become a focal point of public concern. As large-scale public transportation buildings, the indoor thermal comfort and the current state of energy consumption of coach stations are increasingly being emphasized. This research used existing coach stations in the Xi’an region as the object; through on-site investigations and field tests of indoor thermal environments in winter and summer seasons, it was found that the coach stations had energy waste and high energy consumption; the enclosure structures had poor thermal performance; and the stations lacked effective energy-saving measures. Energy-saving transformation strategies were proposed from two aspects: enclosure structures and renewable energy utilization. Using DeST-C for energy consumption, the external walls, roofs, insulation materials, and glass materials were simulated, and nine different combinations of energy-saving schemes were simulated using orthogonal experiments. The optimal scheme was selected based on the comprehensive energy-saving rate and economic analysis results, which included using 80 mm XPS external insulation for the external walls, low-e hollow glass for the windows (low transmittance type), and an 80 mm PUR board for the roof insulation. The energy-saving rate of this scheme was 26.84%. The use of rooftop solar photovoltaic power generation and fresh air heat recovery devices can effectively reduce building energy consumption, and the investment payback period is less than 5 years. The research applications have practical significance for improving the indoor environment of existing coach stations and saving energy consumption.
1. Introduction
With the rapid development of the global economy, it is inevitable that there has been overexploitation of natural resources and excessive energy consumption. However, with the introduction of sustainable development goals (SDG), there is a growing emphasis worldwide on reducing various forms of energy consumption and increasing the utilization of renewable energy [1,2,3]. Energy consumption is mainly concentrated in three areas: buildings, transportation, and industry [4,5]. Various types of transportation buildings have been identified as the focus of energy conservation and emission reduction work. These public transportation buildings generally have higher energy consumption levels than ordinary public buildings [6]. The highway transportation industry occupies a dominant position in the transportation system [7]. By 2020, the total mileage of highways in China had reached 5.1981 million kilometers, and the annual passenger traffic of commercial passenger transportation had reached 6.894 billion people, accounting for 71.3% of the total passenger transportation traffic [8]. The continuous development of the highway transportation industry has also led to a continuous increase in the number of coach stations. However, while the number and building area of coach stations continue to increase, the energy consumption of these buildings remains high. Most of coach stations were built earlier and designed based on early energy-saving design specifications [9], with little consideration for building energy conservation, resulting in poor thermal performance of the enclosure structure, poor quality of the indoor thermal environment, and high energy consumption of some coach buildings.
The research on energy consumption of coach stations mainly focuses on establishing evaluation indicators and analyzing the important factors affecting energy consumption, while there is less research on the analysis of indoor thermal environment and the energy-saving strategies of coach station buildings. Fan et al. [10] calculated and ranked 18 factors affecting the energy consumption of coach stations in four aspects: site selection, hardware configuration, building facilities, and layout technology. The study was based on the group decision-making hierarchical analysis method (GAHP) and provided a basis for determining evaluation indicators. Yang [11] conducted a survey of bus stations in five climate zones in China and used five factors that affect energy efficiency to determine seven highway coach station energy efficiency evaluation indicators. The energy efficiency classification of the bus station was determined by scoring the seven indicators. The research on energy consumption of other types of public transportation buildings mainly focuses on the indoor thermal environment and energy consumption status. Huang et al. [12] conducted indoor thermal environment testing and thermal sensation voting surveys at railway stations in cold regions; they found that the thermal comfort evaluation of waiting halls was significantly correlated with passenger’s age and the length of residence in the local area. After analyzing the indoor thermal environment data of airports, Mambo et al. [13] found that energy-saving measures could be implemented by considering different comfort set points while ensuring temperature and humidity control, which not only improved passenger comfort but also reduced energy consumption by 20% to 25%. Alkis et al. [14] analyzed the measured indoor temperatures of three airports and proposed the maximum use of natural light to save lighting energy based on the acceptable temperature range for passengers.
Due to the promotion of the Sustainable Development Goals worldwide, there are higher requirements for the energy efficiency of large public buildings, such as green buildings [15,16]. Not only are energy-saving and environmentally friendly building materials necessary, but also the use of renewable energy sources such as solar and geothermal energy is required to reduce building energy consumption [17,18,19]. Therefore, for the energy-saving renovation of existing coach stations, the thermal performance of the envelope structure can be improved by using high-efficiency insulation materials, and renewable energy technologies such as solar photovoltaic power generation and heat recovery can be utilized. The research found that energy-saving renovation of building envelopes and the use of renewable energy sources are also common ways to achieve energy efficiency in public buildings [20,21,22,23,24]. The envelope structure has a significant impact on the energy consumption of buildings [25]. By using orthogonal experimental design (OED) to optimize the types of envelope structures, such as external walls and roofs, as well as the thickness of insulation layers [26,27], the optimal combination is determined to reduce the operational energy consumption of buildings. Feng et al. [28] established a thermal performance function model for the enclosure structure of residential buildings in cold regions based on energy-saving standards, and they used the Lagrange’s method of multipliers to calculate the optimal insulation thickness for external walls and roofs. Gindi et al. [29] simulated the transformation of building roofs, south-facing facades, and west-facing facades using photovoltaic components and obtained the optimal tilt angles and component types for each direction, effectively reducing energy consumption. Fouad et al. [30] established a regression prediction model for the power of photovoltaic panels, indoor lighting, and indoor temperature with the tilt angle of the photovoltaic system based on experimental data and determined the optimal tilt angle of the photovoltaic shading system in Egypt. Angeliki et al. [31] used Matlab to calculate the electricity generation from applying photovoltaic technology on buildings in six European cities and analyzed the impact of different building orientations on the internal rate of return of building-integrated photovoltaics (BIPV). Lu et al. [32] conducted a study on the advantages and challenges of applying Building Integrated Photovoltaics (BIPV) technology in Singapore. Although BIPV can bring economic benefits and reduce carbon emissions, its high cost and uncertainty in energy conversion efficiency are still issues that must be considered before applying this technology. Faranda et al. [33] have applied photovoltaic power generation to train stations in Italy, achieving the station’s sustainable development goals. They have discussed the feasibility of the plan in terms of specific parameters such as the converter and distributor of photovoltaic generators. Zhang et al. [34] compared the energy-saving effects of using new air heat recovery in public buildings in seven typical cities and found that full heat recovery is the most energy-saving and cost-effective method in cold regions. Heat recovery technology is widely used in high latitude countries such as Germany and Sweden [35,36]. In cold climates, using heat recovery technology can reduce building energy consumption by about 20%. Liu et al. [37] used an optimization design method to determine the optimal shape of the heat recovery device from the perspectives of energy-saving and reducing material costs. The aforementioned studies have explored the application of energy-saving strategies that utilize renewable energy in public buildings. However, renewable energy utilization technology has not been widely applied in China’s coach stations, which presents enormous energy-saving potential. The application of energy-saving retrofit strategies must consider not only their energy-saving effects but also their economic feasibility. Therefore, when analyzing these strategies, it is necessary to calculate the cost of each retrofitting plan as well as the payback period.
As a major urban transportation hub, the coach station has increasingly high requirements for its indoor thermal comfort and thermal performance of the envelope structure. Taking the coach stations in Xi’an as an example, this research collected building information, passenger thermal comfort feedback, and indoor thermal environment testing through field investigations to analyze the existing problems and the potentials of energy saving. Energy-saving renovation strategies were proposed, including the transformation of the building envelope structure such as the external walls, windows, and roof, the use of solar photovoltaic systems for power generation, and the installation of new air supply and heat recovery devices to reduce the building’s operational energy consumption. In addition, the feasibility of these energy-saving strategies is estimated through economic analysis to ensure that they are both energy-efficient and economically viable. The energy-saving renovation strategies can provide reference value for the energy-saving renovation of existing coach stations or the energy-saving design of newly built coach stations in cold regions, with the aim of achieving sustainable development goals for buildings [38].
2. Survey and Analysis on Coach Stations
The following subchapter first conducted on-site visits and research to the automobile passenger transportation stations in the Xi’an area, obtaining basic information and energy consumption status of each station. Secondly, the indoor thermal environment of the buildings was tested and surveyed in both winter and summer seasons, and the results were analyzed to determine the indoor comfort level. Finally, based on the research information, the Xi’an Chengxi Passenger Transportation Station was selected as the benchmark model for modeling and analysis in the DsST-C software.
2.1. Overview of Survey Area
Six first-class coach stations in the Xi’an area were selected for field research to collect basic information about the buildings. The Xi’an area is located in the central part of the Guanzhong Plain in northwest China, with hot and rainy summers and cold and dry winters. According to the architectural thermal design partition, the Xi’an area belongs to the cold region. The meteorological data of Xi’an are shown in Figure 1, with an annual average temperature of 13.0~13.7 °C and an annual precipitation of 522.4~719.5 mm. The highest precipitation occurs from July to October, and the relative humidity is above 70% throughout the year, with about 70% of the time falling within the range of 40~70% of the human body humidity comfort zone. The annual sunshine duration is more than 2000 h, with peak solar radiation of 647.23 W/m2 in August, and the solar radiation is particularly high from May to August.
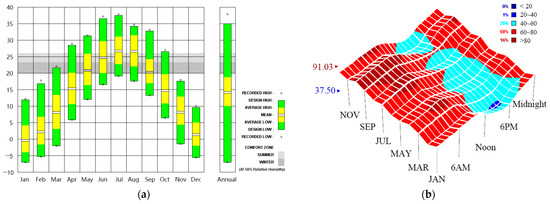
Figure 1.
Annual weather data map of Xi’an. (a) Monthly temperature range in the Xi’an area; (b) Xi’an area’s relative humidity range throughout the year.
2.2. The Current Status of the Buildings and Energy Consumption Situation
The surveyed coach stations in Xi’an area all face the north–south direction. The waiting halls and ticket halls of the complexes are mostly 1–2 stories high and are open for more than 12 h a day with an annual passenger volume over 500,000 people. The selection of heating and cooling equipment varies among each station, but the main energy consumption comes from electricity and water usage, with the majority of the air conditioning systems being fan coil unit and fresh air system. The construction year of the researched coach stations ranged from 1983 to 2013—relatively early construction years in which there was less consideration for energy conservation. The thermal performance of the building envelope structures no longer meets the requirements of current public building energy-saving design standards [39]. Although the envelope structures and air conditioning systems have been renovated in subsequent operation processes, there are still problems with high energy consumption per unit area, poor indoor thermal comfort, and low energy efficiency of the air conditioning and lighting systems. The survey information regarding each coach station is shown in Table 1.

Table 1.
Basic information on coach station buildings.
The annual electricity consumption and comprehensive energy consumption per unit area of coach stations A to F are shown in Figure 2. The energy consumption of the coach station buildings ranges from 23.68 to 89.58 kW·h/(m2·a). The electricity consumption peak mainly occurred in the air conditioning and heating period during the summer months of July and August and the winter months of December and January, when the heating and cooling equipment were operated for longer periods of time, consuming a large amount of electricity and natural gas. During the remaining transition periods, electricity consumption mainly came from the lighting systems and electrical equipment. Station E was jointly built with a large shopping mall and subway station, and no separate energy consumption measurement system was installed, so it was not included in the statistical analysis.
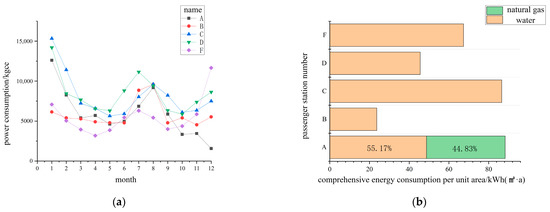
Figure 2.
Energy consumption situation of each coach station: (a) monthly power consumption; (b) energy Intensity.
2.3. Indoor Thermal Environment Overview
The quality of indoor thermal environment will have a significant impact on the physical sensations of waiting passengers. Therefore, crowded waiting halls and ticketing halls were chosen as test locations for thermal environment analysis. The following section analyzes the indoor thermal environment from three aspects: indoor thermal environment testing, evaluation, and questionnaire survey.
2.3.1. Questionnaire Survey Analysis
In the summer, a questionnaire survey was conducted among passengers waiting in the waiting hall to understand the passengers’ intuitive perception about the indoor thermal environment of the waiting hall. A total of 208 questionnaires were distributed. Among the surveyed passengers, passengers aged 20 to 30 accounted for the largest proportion, with a total of 134 male passengers, accounting for 64.42% of the total. Most of the passengers traveled for short distances within the province.
It can be seen in Table 2 and Table 3 that 63.02% of the passengers felt that the waiting area was relatively comfortable; 10.57% of the passengers felt that the indoor environment of the waiting room was relatively cool; and 19.23% of the passengers thought that the waiting room was a bit hot. Largely, the passengers did not feel obviously cold when they first entered the waiting hall from the outside, but after sitting for a long time, they felt slightly cold after a period of heat loss. Additionally, 81.25% of the passengers felt that the humidity in the waiting area was moderate, and 11.05% of the passengers felt a bit damp. Since Xi’an is rainy in summer, the evaporation of rainwater increases the water vapor content in the air, resulting in an increase in the humidity in the waiting hall.
Table 2.
Questionnaire on hot and cold feelings of respondent passengers.
Table 3.
Questionnaire on Air Humidity Feelings of Respondent Passengers.
2.3.2. Indoor Thermal Environment Test
The Xi’an Chengxi coach station was selected for indoor thermal environment testing in both winter and summer seasons. Figure 3 shows the distribution of the measuring points. A total of four measuring points were set up, which were outdoor measuring point A, measuring point B in the ticket office, and measuring points C and D in the waiting area on both sides of the east and west sides. The height of the indoor testing equipment was placed on the resting level of the waiting passengers at 0.8 m above the ground. Outdoors, it was placed away from direct sunlight, 1.5 m above the ground.
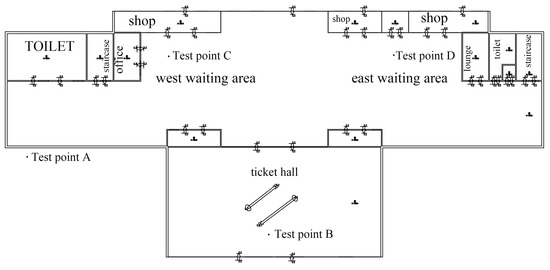
Figure 3.
First floor plan in DeST software.
As shown in Figure 4, during the winter testing period, the average outdoor temperature was 4.4 °C; the lowest temperature in the indoor waiting area was 7.2 °C, while the highest temperature was 13.7 °C; the average temperature was 10.9 °C, and the average temperature in the ticketing area was 10.8 °C. Due to the proximity of the waiting area to the entrance and the station shops and the low energy efficiency of the heating system, the temperature in the waiting area was lower than 16 °C, and the thermal comfort of the human body was low. If their waiting time was longer than half an hour, the passengers felt cold if they sat for a long time. The average relative humidity of the outdoor air was 45.0%; the relative humidity of the indoor ticket lobby was 37.7%; and the average relative humidity of the waiting hall area was 34.6%. The overall relative humidity level was low, resulting in dry indoor air.
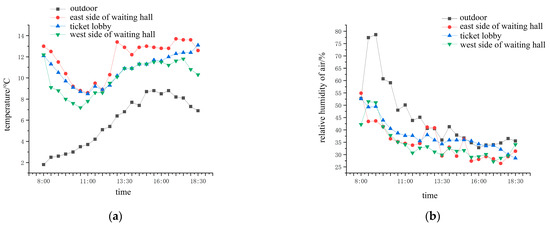
Figure 4.
Variations of indoor and outdoor air temperature and relative humidity in winter sea: (a) Indoor and outdoor temperature (b) relative humidity.
As shown in Figure 5, during the summer testing period, the average outdoor temperature was 32.3 °C, and the average temperatures in the east and west passenger waiting areas and ticketing areas were 28.3 °C, 27 °C, and 27.7 °C. Although the average temperature was within the specified range of 22 °C to 28 °C, the temperature in the waiting hall and ticket lobby was higher than 28 °C due to the increase in the afternoon. Since the waiting area is close to the outside, the outdoor heat can enter through the ticket gate and store passage, and the temperature varies with the outdoor temperature. The average relative humidity of the outdoor air during the summer was 50.4%. The average relative humidity in the ticket hall and waiting rooms on the east and west sides was 60.5%, 63.0%, and 58.4%, respectively. The relative humidity of the air does not fluctuate significantly, remaining within 10%.
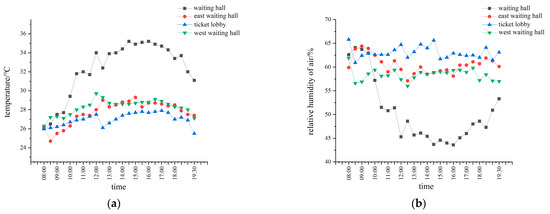
Figure 5.
Variations of indoor and outdoor air temperature and relative humidity in summer season. (a) Indoor and outdoor temperature; (b) relative humidity.
With the changes and fluctuations, the passengers felt slightly hotter during this time. According to the “Indoor Air Quality Standard” (GB/T18883-2022) [40], the standard value of air-conditioned room temperature in summer is 16~24 °C, and that of heating in winter is 22~28 °C. The comparison shows that the indoor temperatures in winter and summer do not meet the requirements.
2.3.3. Indoor Thermal Environment Evaluation
The waiting hall where passengers spend the longest time in a day was selected to analyze the indoor thermal environment, using the International Organization for Standardization ISO7730 as the evaluation standard, with an indoor air velocity of 0.1 m/s. Based on the survey questionnaire results, the thermal resistance of passengers’ winter clothing was taken as 1.5 clo, and the thermal resistance of summer clothing was taken as 0.5 clo. Considering that waiting passengers are in a sedentary state, the metabolic rate of the human body was taken as 1.0 met. According to the indoor thermal environment data obtained from the test, the predicted average thermal sensation index PMV and predicted percent dissatisfied (PPD) were calculated for the same time period.
As shown in Figure 6, the predicted average thermal sensation index PMV value during winter season was between −1.75 and 0.75, with an average value of −1.23; the predicted unsatisfactory percentage PPD value was between 30% and 70%, with an average value of 39.13%. According to the “Evaluation Standards for Indoor Humidity and Heat Environment of Civil Buildings” (GB/T 50785-2012), the indoor environment in winter met the overall evaluation standard of level III, indicating poor thermal comfort, with more than half of the passengers waiting for the bus feeling relatively cold.
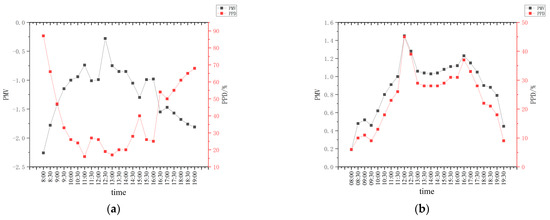
Figure 6.
Thermal comfort change in the waiting hall of Chengxi coach station between winter and summer seasons. (a) winter; (b) summer.
The predicted average thermal sensation index PMV value during summer season was between 0.4 and 1.3, with an average value of 0.90; the predicted unsatisfactory percentage PPD value was between 5% and 35%, with an average value of 23.83%. The indoor PMV value was slightly higher in summer, meeting the overall evaluation standard of level II, indicating that over 75% of passengers felt comfortable. However, during some periods from 1:00 p.m. to 5:00 p.m., the PMV value was high, and the indoor environment was slightly hot.
2.4. Influencing Factors of Energy Consumption and Benchmark Models
The following section combines research findings to analyze the existing problems and energy-saving potential of the Xi’an region’s automobile passenger transport stations. The Xi’an Chengxi Passenger Transport Station is selected as the benchmark model in the DeST-C software to simulate and establish a foundation for various energy-saving renovation schemes.
2.4.1. Influencing Factors of Energy Consumption
Through the analysis of the results from the on-site research and testing mentioned above, it was found that there are the following energy-saving problems in the coach station in Xi’an: the low energy efficiency of the air-conditioning system results in energy waste and high energy consumption and poor thermal insulation performance of the external wall and roof, leading to excessively high or low indoor temperatures. Additionally, no effective energy-saving measures have been taken, and the utilization rate of renewable energy is not enough. For example, the bus station has a large roof area, but solar energy is not fully utilized for power generation, etc.
The factors that affect the energy consumption of coach station buildings mainly include climate zone, construction age, enclosure structure condition, building orientation, cooling and heating equipment, indoor personnel density, etc., while the reconstruction of existing coach station buildings is mostly envelope structure retrofitting [41,42,43,44], adding energy-saving measures [45,46], etc. In response to these problems and with the aim of reducing building energy consumption, combined with the geographical and meteorological environment of Xi’an area, the energy-saving strategy of coach stations was analyzed by taking Xi’an Chengxi Coach Station as an example, including the use of high-efficiency heat insulation materials for the building envelope to reduce heat loss and the use of solar photovoltaic power generation and fresh air heat recovery to reduce building power consumption.
2.4.2. Benchmark Models
A Xi’an Chengxi Coach Station was selected as the benchmark model, and energy consumption simulation software, DeST-C, developed by Tsinghua University, was used to develop the model, as shown in Figure 7. DeST-C is developed based on AutoCAD, and its operation and interface are similar to CAD software, making it very user-friendly. The software simulation results can be exported through Excel spreadsheets and visualized for further analysis.
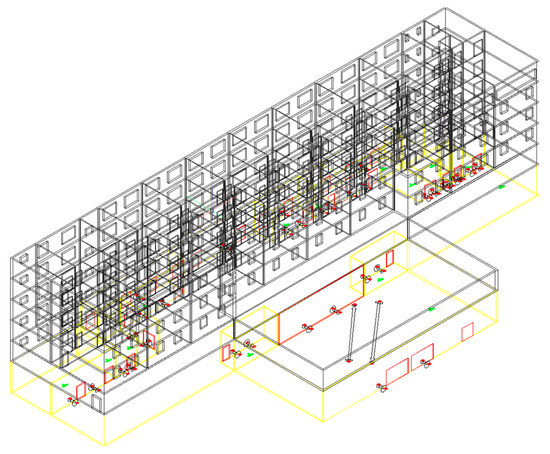
Figure 7.
Three-dimensional building model drawing in DeST software.
Firstly, the actual information of the architecture of the coach station is used to build a model. After the modeling is completed, specific model materials are set based on the parameters of the building enclosure structure, including meteorological parameters, room thermal disturbance, indoor and outdoor ventilation, etc. Then, building energy consumption calculations can be performed, and the calculation results can be exported and viewed in report form. Finally, based on the benchmark model, quantitative analysis of the impact of different building materials or material thicknesses on building energy consumption can be achieved by conducting building energy simulations after adjusting the global settings of the building or replacing local building components with different materials.
The passenger station is located in Lianhu District, Xi’an City, Shaanxi Province. It was built in 2001. The construction area is 9200 square meters, and the building faces south. There are six floors in total; the first floor is the waiting hall and ticket hall area, including lounges, offices, shops and foyers, etc.; the second floor is the pedestrian corridor for passengers leaving the station; the third to sixth floors are hotel rooms and offices. The building envelope parameters are shown in Table 4.
Table 4.
Envelope parameters.
The air conditioning and lighting equipment in the building are turned on during the bus station business hours, that is, from 8:00 to 20:00. The cooling period is set from May to October, and the heating period is set from 15 November to 15 March of the following year. Parameters such as indoor heat disturbance and the temperature settings are shown in Table 5.
Table 5.
Indoor thermal disturbance parameters.
The hourly air conditioning load calculation results for the whole year are shown in Figure 8.
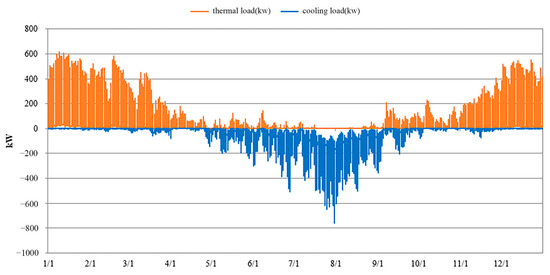
Figure 8.
Annual calculation results of the building’s heating and cooling load.
3. Energy-Saving Renovation of Enclosure Structure
The enclosure structure is an important component of the main body of a building, and the material selection and performance of the enclosure structure directly affect the indoor thermal environment and energy consumption of the building. The following subchapter discusses the energy-saving renovation of the enclosure structure from three aspects, external walls, windows, and roofs, and uses orthogonal experiments and economic evaluation to analyze the optimal energy-saving solution.
3.1. External Wall Insulation Improvement
External wall insulation is the main way to achieve energy-saving for the external wall. Common forms of thermal insulation include the external thermal insulation of external walls and internal thermal insulation of external walls. Considering the renovation of existing buildings, in order to ensure that the indoor space is not reduced, external thermal insulation of the external walls was selected. External wall insulation materials include expanded polystyrene board (EPS), extruded polystyrene board (XPS), rock wool board, polyurethane board, glass wool, etc. Among them, EPS has high compressive strength, good stability, and a low price; XPS has good water resistance and low thermal conductivity and is lightweight; rock wool board has strong fire resistance and low thermal conductivity. Therefore, these three materials were selected as the research objects. The thickness of the insulation board was used as a variable, and the selected range was from 20 to 120 mm.
As shown in Figure 9a, with the increase in the thickness of the insulation board, the annual cumulative total load of the building decreased significantly. Meanwhile, the calculation results show that the building’s annual cumulative heat load was reduced by 10.8%, 10.6%, and 11.5%, respectively, when using EPS board, XPS board, and rock wool board as insulation materials. However, the building’s annual cumulative cooling load increased by 2.13%, 2.11%, and 2.34%, respectively. The annual cumulative heating load of the building decreased, while the annual cumulative cooling load increased. The rate gradually decreased as the thickness of the insulation board increased. This was due to the increase in the thermal insulation effect of the external wall, which led to the slowing down of the accumulated heat loss in the building after the outdoor temperature decreased at night in summer, which is similar to increasing the indoor heat disturbance, resulting in an increase in the cooling load of the building the next day.
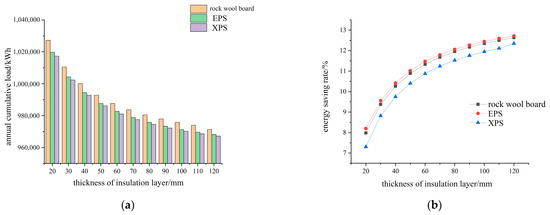
Figure 9.
Influence of different thickness of insulation materials on building energy consumption (1): (a) Changes in energy consumption; (b) changes in energy-saving rate.
According to the results in Figure 9b, it can be seen that the three insulation materials had good energy-saving effects. When the thickness was in the range of 0–90 mm, the annual cumulative total load decreased significantly. The energy-saving rates for three types of insulation materials used were 12.17%, 12.27%, and 11.76%, respectively. When the thickness increased from 90 mm to 120 mm, the energy-saving rates only increased by 0.47%, 0.45%, and 0.59%. After the thickness of the insulation material reached 90 mm, there was limited space for the energy-saving rate to rise, and the material cost continued to increase. Therefore, it is advisable to choose 80 mm-thick EPS board and XPS board and 90 mm-thick rock wool board as the external wall optimization scheme.
3.2. External Window Material
As the weak link of the thermal insulation of the external enclosure structure, external windows have great energy-saving potential. By selecting different glass materials for the outer windows and conducting energy consumption simulations for each type of glass material, the annual cumulative load calculation results for the building are shown in Table 6. Low-e glass can reduce the indoor and outdoor heat exchange while ensuring indoor lighting due to its far-infrared filtering characteristics. Low-e glass costs more but has better energy-saving effects. Low-transmittance, low-e film-coated glass windows had the lowest energy consumption: the energy-saving rate reached 6.40%. The energy-saving rate of high-transparency low-e insulating glass reached 5.82%. Considering the economy of energy-saving optimization, low-transmittance, low-e film-coated glass windows and 6 mm + 12 mm air + 6 mm insulating glass windows were selected as the optimal solutions.
Table 6.
Influence of window type on building load.
3.3. Roof Insulation Improvement
The roof receives the longest and strongest exposure to solar radiation, and it is the main channel for indoor–outdoor heat exchange in the top-level room. Therefore, the thickness of the roof insulation layer should be greater than that of the external wall insulation layer. However, the fire resistance of the insulation material is lower than that required for the external wall. The essence of the roof insulation method is to add or replace a new insulation layer on the basis of the original roof. After investigation, it was found that the roof insulation layer in the Xi’an area did not suffer major damage and still had a certain insulation effect. Therefore, a new insulation layer was chosen to be added above the original roof. XPS board, rock wool board, and rigid polyurethane foam board (PUR) were used as the roof insulation materials. The PUR board had good thermal insulation and waterproof performance and a long service life. The material thickness range was 20~120 mm. The simulation results of each thickness are shown in Figure 10.
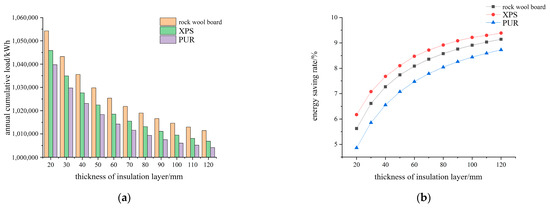
Figure 10.
Influence of different thickness of insulation materials on building energy consumption (2): (a) Changes in energy consumption; (b) changes in energy-saving rate.
As shown in Figure 10a, it can be seen that with the increase in the thickness of the insulation layer, the cumulative total load of the building for the whole year was significantly reduced. According to the results in Figure 9b, when the thickness of the insulation board increased from 0 mm to 80 mm, the energy-saving rates of buildings using PUR board, XPS board, and rock wool board increased by 8.92%, 8.58%, and 8.05%. PUR board had the highest energy-saving rate. After the thickness of the material reached more than 80 mm, the rising curve of the energy-saving rate tended to be flat, and the energy-saving effect was limited, but the cost continued to increase. Thus, the energy-saving effect of the XPS and PUR boards was better than that of the rock wool boards. Therefore, considering the economy and energy-saving effects, 80 mm thick XPS board and 70 mm and 80 mm thick PUR boards are the optimal solutions for the roof.
3.4. Orthogonal Experimental Design
In order to analyze the energy-saving effects under the joint action of different envelope structure optimization schemes, orthogonal experiments were conducted on the external walls, external windows, and roof, as shown in Table 7. Each factor has three levels, and the energy consumption in the single-factor optimization is the lower basis for selection. A total of nine energy-saving optimization schemes are designed, and the energy consumption simulation of each scheme is simulated, as shown in Table 8. It can be seen in the results that the building’s cooling and heating loads of each scheme decreased compared to the benchmark model, and the average annual cumulative load energy-saving rate of different schemes was 25.00%. Among them, scheme 12 has the best energy-saving effect, with an energy-saving rate of 26.84%.
Table 7.
Factor level settings for orthogonal test.
Table 8.
Orthogonal test simulation results.
3.5. Economic Analysis
In order to select a scheme with both economical and energy-saving effects, an economic analysis of the above nine energy-saving schemes was carried out, and the net present value (NPV) and static investment payback period of each scheme were calculated. The formula for calculating the net present value is as follows:
where NPV—net present value, CNY; CI—annual savings, CNY; i—discount rate, %; t—service life, years.
By conducting research, the discount rate was set at 5%. The electricity fee in Xi’an was 0.62 CNY/kW h, and the material prices of the EPS, XPS, PUR, and rock wool insulation boards were 420 CNY/m3, 600 CNY/m3, 680 CNY/m3, and 750 CNY/m3, respectively. The prices of the ordinary insulating glass (12 mm), low-transmittance, low-e glass, and vacuum + low-e coated glass were 80 CNY/m2, 190 CNY/m2, and 240 CNY/m2, respectively. The service life is 15 years, and the annual income is assumed to be consistent.
The net present value and static payback period of each energy-saving scheme were calculated, and Pt is the initial investment amount/annual income. The results of the net present value and static payback period of each scheme are shown in Figure 11 and Table 9. According to the results, it can be concluded that schemes 1, 4, 5, and 7 had large net present values and short static payback periods, and the energy-saving rates among the four schemes ere not much different, so schemes 1, 4, and 7 are all optimal schemes, among which the energy-saving rate of scheme 1 was the highest at 26.84%.
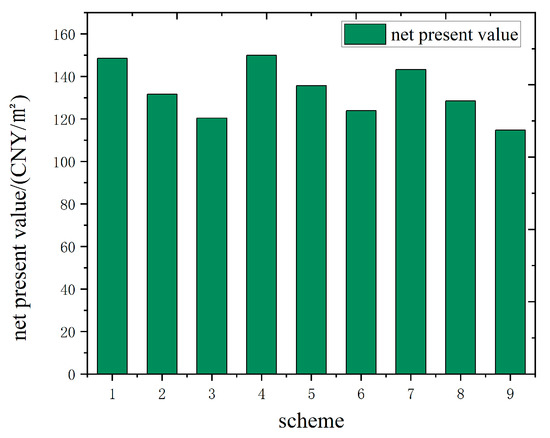
Figure 11.
Net present value of nine energy-saving schemes.
Table 9.
Static payback period of energy-saving scheme.
4. Renewable Energy Utilization
Due to the strict environmental and operational requirements of new energy-saving technologies in practical applications, as well as the high cost of using renewable energy equipment and technology, the utilization of renewable energy in automobile passenger transportation stations has not yet matured, become widespread, or been universally applied. Improving the energy form and increasing the use of clean energy is an important way to improve the energy consumption structure of existing automobile passenger transportation stations. The following subchapter focuses on the study of two aspects: the use of roof solar photovoltaic power generation and new air heat recovery.
4.1. Roof Photovoltaic Energy-Saving Design
According to the survey findings, it was discovered that the roofs of the buildings at the coach stations in Xi’an area have large areas of idle space, aside from the placement of outdoor air conditioning units. The unsheltered rooftop space is the optimal choice for installing solar photovoltaic equipment that the building can support. The annual sunshine duration in Xi’an is 2200~3000 h, and the annual solar radiation is 5016~5852 MJ/(m2·a). The separated photovoltaic roof was selected for the energy-saving design of the existing coach station, and the photovoltaic system was integrated into the public grid for operation. Autodesk Ecotect software was used to simulate the annual solar radiation on the outer surface of the area where the target building is located, and the obtained 3D color map of solar radiation is shown in Figure 12. Based on the distribution of solar radiation shown in the figure, it can be seen that the roof receives the most annual solar radiation per unit area on the outer surface of the building. A polysilicon power generation system with higher power generation efficiency is selected for the photovoltaic system on the roof of the building, and the photoelectric conversion efficiency is 15%.
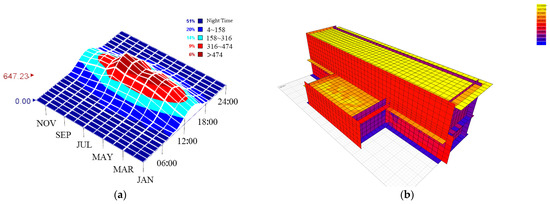
Figure 12.
(a) Total solar radiation range at all times throughout the year in Xi’an region; (b) Three-dimensional annual solar radiation map of building surface.
Using Pvsyst software to simulate and calculate the polysilicon photovoltaic system, set the azimuth of photovoltaic array as 0°, and install it in the due south direction, the optimal installation inclination of photovoltaic panel is 25°; the annual power generation of the photovoltaic system was 169,057 kW·h; and the range of solar light available for photovoltaic modules under different solar elevation angle and solar azimuth angle are shown in Figure 13 and Figure 14. The power generation of photovoltaic systems varies with different regions, temperatures, and installation inclinations. The comparison shows that the peak periods of power generation are concentrated in April, May, June, July, and August, and the power generation in July is the largest. Considering the attenuation of photovoltaic modules, the attenuation rate was set as 2% for the first year; the average attenuation rate from 2nd to 25th year was 0.72%; the total attenuation rate for 25 years was 20%; and the total power generation of photovoltaic system for 25 years was 3,826,130 kW·h. The annual power generation is shown in Table 10.
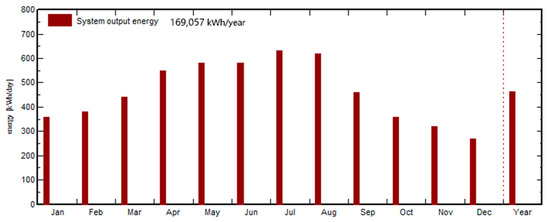
Figure 13.
Monthly power generation of roof photovoltaic system.
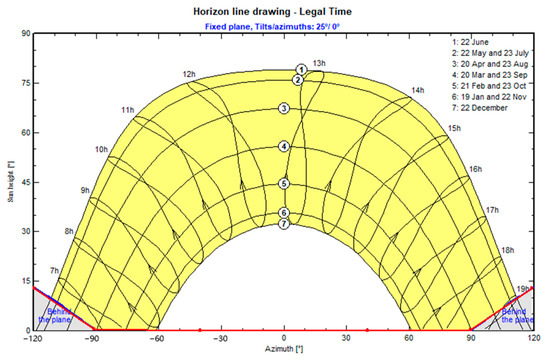
Figure 14.
Range of solar light available for photovoltaic modules.
Table 10.
Annual power generation of photovoltaic system over 25 years.
The net income in the life cycle of the photovoltaic system is the difference between the total power generation income of the photovoltaic system and the total investment cost in 25 years.
The power generation income W in the 25-year life cycle is
The total investment cost Z is
The static payback period T is
where B is the photovoltaic subsidy price of Xi’an, which is 0.1 CNY/kW·h for 5 consecutive years; D is the electricity price of Xi’an; and Q is the annual photovoltaic power generation. Z1 is the initial investment cost of the photovoltaic system; Z2 is the maintenance cost during system operation; and Z3 is other costs, such as inverter maintenance and replacement. The calculation results of the main economic parameters are shown in Table 11. Combining the various costs, the payback period of investment was 5.61 years, and the total power generation income of the photovoltaic system is
W = 169,057 × (0.62 + 0.10) × 5 + 169,057 × 0.62 × 20 = 270.49 million CNY
Table 11.
Main economic parameters of photovoltaic system.
4.2. Fresh Air Heat Recovery
Due to the large number of passengers transported daily at the coach station and the high density of people in the indoor waiting halls and ticket halls, mechanical ventilation is required to ensure fresh air volume for the indoor personnel. According to on-site investigations, it was found that the fresh air load of the coach station building can account for 40% to 70% of the total load. The use of a fresh air heat recovery system can preheat or precool the fresh air in summer and winter, as well as prehumidify or dehumidify it, thus reducing the energy consumption of the air conditioning system when handling fresh air. Both total heat and sensible heat recovery devices were used for the target buildings, and the two types of energy savings were calculated using the annual hourly dynamic calculation method. The year-round outdoor meteorological data for Xi’an were retrieved from the “China Building Thermal Environment Analysis Meteorological Dataset”, including outdoor air temperature and enthalpy, as shown in Figure 15.
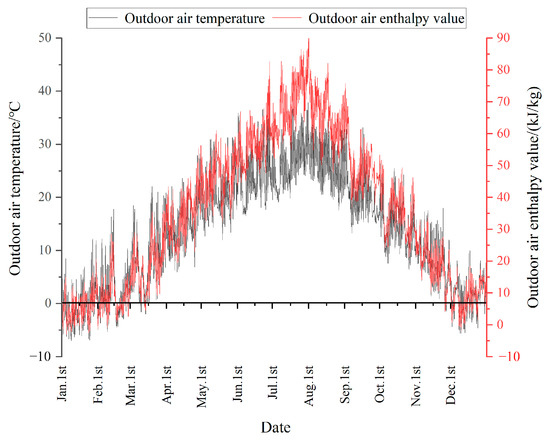
Figure 15.
Annual parameters of outdoor air temperature and outdoor air enthalpy in Xi’an.
Due to the additional fan energy consumption caused by the resistance of the heat recovery module after the fresh air heat recovery system is started, this part of the energy consumption increment should be subtracted from the energy saving. When the net energy saving is greater than 0, the energy saving of the fresh air heat recovery system will be calculated. Using the calculation formula, the conditions when the net energy-saving rate is greater than 0 are shown in Table 12.
Table 12.
Effective energy-saving conditions for fresh air heat recovery system.
The formula for calculating the net energy saving is
where Wt and Ws are the net energy saving of total heat and the sensible heat recovery, kW·h; Wf is the increase in fan energy consumption due to the resistance from the heat recovery module; ht and hs are the opening time of the heat recovery device, h; hn and hw are the enthalpy values of the indoor and outdoor air, KJ/kg; tn and tw are the temperatures of the indoor and outdoor air, °C; ρ is the air density, and the value was 1.29 kg/m3; Cp is the mass specific heat capacity of the air at constant pressure, and the value was 1.005 kJ/(kg·°C); GE and GF are the exhaust air volume and fresh air volume, m3/h; ηt is the heat recovery efficiency of the total heat recovery device, which was 70% according to the standard; ηs is the sensible heat recovery device efficiency, which was 75%; ΔP is the resistance of the heat recovery section, and had a value of 250 Pa; ϕ is the efficiency of the fan and had a value of 0.75; the COP of the air conditioning system had a value of 3.0.
The indoor temperature and humidity parameters were 20 °C, 40% in winter and 25 °C, 50% in summer. According to the calculation formula, the net energy saving in winter and summer is 37,273.77 kW·h and 10,525.15 kW·h, respectively, when using the total heat recovery device. When recycling the device, the net energy saving in winter and summer is 27,697.52 kW·h and 1635.73 kW·h. The economic efficiency of the heat recovery device is judged according to the static investment payback period, and its calculation formula is
where C is the static payback period, a, and I is the initial investment cost of the fresh air heat recovery system. The fresh air full heat recovery module was 11 CNY/(m3/h), and the sensible heat recovery was 8 CNY/(m3/h). W is the annual energy saving, kW·h, and M is the electricity price in Xi’an, which was 0.62 CNY/kW·h.
The calculation result shows that the payback period for using the total heat recovery device was 2.09 years, while the payback period for the sensible heat recovery device was 2.97 years. Xi’an is located in a cold region where the winter time is longer than the summer time. The energy-saving effect of the heat recovery device in winter is significantly better than that in summer. As the total heat recovery device can simultaneously recover both the sensible heat caused by the temperature difference between the indoor and outdoor air and the latent heat caused by the moisture content, its energy-saving effect of the total heat recovery device is better than that of the sensible heat recovery device.
5. Conclusions
Through an on-the-spot investigation and indoor thermal environment tests of a highway bus station in the Xi’an area, the existing problems of the bus station in this area were analyzed. Based on simulation models, the energy-saving potential of the passenger bus station was studied from two aspects of the envelope structure and the utilization of renewable resources, and the following conclusions are drawn.
- (1)
- The coach stations in the Xi’an area were built earlier as a whole; the majority of passenger stations were built before the year 2005; and the thermal performance of the building envelope structure does not meet the requirements of the new energy-saving design standards for public buildings. The annual comprehensive energy consumption is 46.68~89.58 kW·h/(m2·a). The average indoor temperature of the indoor waiting hall area in winter and summer is 10.9 °C and 28.3 °C, both of which do not meet the standards for indoor environmental quality, with a requirement of 22–28 °C during summer and 16–24 °C during winter. The results show that there are energy waste and high energy consumption problems in the coach stations in the Xi’an area; while energy consumption measurements for various systems are lacking, the potential for energy efficiency in buildings is significant.
- (2)
- Through the simulation of different thicknesses of external wall and roof insulation materials and building energy consumption under external window glass materials, it was found that with an increase in the insulation material thickness and the improvement of insulation materials, the energy-saving rate increased significantly, but the upward of the energy-saving rate change curve gradually tended to be flat. DeST-C software was used to calculate the building energy consumption of different material combinations. The energy-saving rate and net present value were combined, and the best enclosure structure combination was selected, that is, the external wall adopting 80 mm XPS external insulation, the external window glass adopting low-e film-coated insulating glass (6 + 9 + 6) (low permeability type), and using 80 mm PUR board for the roof insulation. The energy-saving rate of this scheme is 26.84%.
- (3)
- The solar photovoltaic power generation system can effectively utilize the large-area roof space of the passenger station. Taking Chengxi Coach Stations as an example, the annual power generation is 169,057 kW·h, and the investment payback period is 5.61 years.
- (4)
- Using a heat recovery device to pre-treat fresh air is also an effective measure to reduce energy consumption. The energy-saving effect of using total heat recovery is better than sensible heat recovery; the annual energy savings can reach 47,798.92 kW·h; and its investment payback period is less than 2.97 years.
Author Contributions
X.L.: conceptualization, writing—review and editing, funding acquisition; L.Q.: investigation, writing—original draft preparation, methodology, validation; J.L.: software, data curation, formal analysis; All authors have read and agreed to the published version of the manuscript.
Funding
This research was funded by the Shaanxi Provincial Social Science Fund Project (Grant No. 2022J052).
Institutional Review Board Statement
Not applicable.
Informed Consent Statement
Not applicable.
Data Availability Statement
Some data or models used during the study are available from the corresponding author by request.
Conflicts of Interest
The authors declare no conflict of interest.
References
- Sanchez Rodriguez, R.; Ürge-Vorsatz, D.; Barau, A.S. Sustainable Development Goals and climate change adaptation in cities. Nat. Clim. Chang. 2018, 8, 181–183. [Google Scholar] [CrossRef]
- Pogge, T.; Sengupta, M. The Sustainable Development Goals: A plan for building a better world? J. Glob. Ethics 2015, 11, 56–64. [Google Scholar] [CrossRef]
- Di Foggia, G. Energy efficiency measures in buildings for achieving sustainable development goals. Heliyon 2018, 4, e00953. [Google Scholar] [CrossRef]
- Goubran, S.; Cucuzzella, C. Integrating the sustainable development goals in building projects. J. Sustain. Res. 2019, 1, e190010. [Google Scholar]
- Huo, T.F.; Cai, W.G.; Ren, H.; Feng, W.; Zhu, M.L.; Lang, N.N.; Gao, J.X. China’s building stock estimation and energy intensity analysis. J. Clean. Prod. 2019, 207, 801–813. [Google Scholar] [CrossRef]
- Lin, L.; Liu, X.H.; Zhang, T.; Liu, X.T. Energy consumption index and evaluation method of public traffic buildings in China. Sustain. Cities Soc. 2020, 57, 102132. [Google Scholar] [CrossRef]
- Han, Y.; Long, Z.J.; Wen, J.P.; Sun, Z.; Li, D.; Li, K. Energy Consumption Simulation and Economic Study on the Insulation Layer Thickness of Desert Passenger Station Building. Eng. Adv. 2023, 3, 1–10. [Google Scholar] [CrossRef]
- National Bureau of Statistics of China. China Statistical Yearbook-2021. Available online: http://www.stats.gov.cn/tjsj/ndsj/2021/indexch.htm (accessed on 22 July 2022).
- Zheng, X.J.; Xu, B.X.; You, S.J.; Zhang, H.; Wang, Y.R.; Sun, L.Z. Energy consumption and CO2 emissions of coach stations in China. Energies 2020, 13, 3600. [Google Scholar] [CrossRef]
- Fan, L.; Tian, X.; Wang, S. Study on the Factors of Energy Consumption of Highway Transport Passenger Station. In Proceedings of the 2013 the International Conference on Remote Sensing, Environment and Transportation Engineering (RSETE 2013), Nanjing, China, 26–28 July 2013; Atlantis Press: Amsterdam, The Netherlands, 2013; pp. 224–226. [Google Scholar]
- Yang, T.J. Study on the energy efficiency classification method of highway passenger stations based on climatic divisions. In AIP Conference Proceedings; AIP Publishing LLC: College Park, MD, USA, 2018; Volume 1971. [Google Scholar]
- Huang, M.; Lin, Y.J. Thermal comfort of railway station’s waiting room in severe cold regions of China. Energy Procedia 2017, 134, 749–756. [Google Scholar] [CrossRef]
- Mambo, A.D.; Eftekhari, M.; Steffen, T. Evaluation of indoor environment system performance for airport buildings. Int. J. Sustain. Green Energy 2015, 4, 73–84. [Google Scholar]
- Kotopouleas, A.; Marialena, N. Evaluation of comfort conditions in airport terminal buildings. Build. Environ. 2018, 130, 162–178. [Google Scholar] [CrossRef]
- Sinha, A.; Gupta, R.; Kutnar, A. Sustainable development and green buildings. Drv. Ind. 2013, 64, 45–53. [Google Scholar] [CrossRef]
- Balali, A.; Valipour, A. Identification and selection of building façade’s smart materials according to sustainable development goals. Sustain. Mater. Technol. 2020, 26, e00213. [Google Scholar] [CrossRef]
- Glaser, G. Base sustainable development goals on science. Nature 2012, 491, 35. [Google Scholar] [CrossRef]
- Ragheb, A.; El-Shimy, H.; Ragheb, G. Green architecture: A concept of sustainability. Procedia-Soc. Behav. Sci. 2016, 216, 778–787. [Google Scholar] [CrossRef]
- Wen, B.H.; Musa, S.N.; Onn, C.C.; Ramesh, S.; Liang, L.H.; Wang, W.; Ma, K. The role and contribution of green buildings on sustainable development goals. Build. Environ. 2020, 185, 107091. [Google Scholar] [CrossRef]
- Mora, R.; Girma, B.; Miljana, H. Integrated life-cycle design of building enclosures. Build. Environ. 2011, 46, 1469–1479. [Google Scholar] [CrossRef]
- Zhou, Y. Evaluation of renewable energy utilization efficiency in buildings with exergy analysis. Appl. Therm. Eng. 2018, 137, 430–439. [Google Scholar] [CrossRef]
- Li, D.Y.; Jiang, H.; Lin, L. A review of renewable energy applications in buildings in the hot-summer and warm-winter region of China. Renew. Sustain. Energy Rev. 2016, 57, 327–336. [Google Scholar] [CrossRef]
- Chel, A.; Kaushik, G. Renewable energy technologies for sustainable development of energy efficient building. Alex. Eng. J. 2018, 57, 655–669. [Google Scholar] [CrossRef]
- Tong, Z.N. Building Enclosure Structure Energy Saving Discussion. In Advanced Materials Research; Trans Tech Publications Ltd.: Stafa-Zurich, Switzerland, 2013; Volume 671. [Google Scholar]
- Kheiri, F. A review on optimization methods applied in energy-efficient building geometry and envelope design. Renew. Sustain. Energy Rev. 2018, 92, 897–920. [Google Scholar] [CrossRef]
- Huang, J.N.; Lv, H.L.; Gao, T.; Feng, W.; Chen, Y.X.; Zhou, T. Thermal properties optimization of envelope in energy-saving renovation of existing public buildings. Energy Build. 2014, 75, 504–510. [Google Scholar] [CrossRef]
- Zhu, J.J.; Chew, D.A.S.; Lv, S.N.; Wu, W.W. Optimization method for building envelope design to minimize carbon emissions of building operational energy consumption using orthogonal experimental design (OED). Habitat Int. 2013, 37, 148–154. [Google Scholar] [CrossRef]
- El Gindi, S.; Abdin, A.R.; Hassan, A. Building integrated Photovoltaic Retrofitting in office buildings. Energy Procedia 2017, 115, 239–252. [Google Scholar] [CrossRef]
- Feng, W.; Huang, J.N.; Lv, H.L.; Guo, D.P.; Huang, Z.C. Determination of the economical insulation thickness of building envelopes simultaneously in energy-saving renovation of existing residential buildings. Energy Sources Part A Recovery Util. Environ. Eff. 2019, 41, 665–676. [Google Scholar] [CrossRef]
- Fouad, M.M.; Lamia, A.S.; Mohamed, A.H. Modeling and analysis of Building Attached Photovoltaic Integrated Shading Systems (BAPVIS) aiming for zero energy buildings in hot regions. J. Build. Eng. 2019, 21, 18–27. [Google Scholar] [CrossRef]
- Kylili, A.; Paris, A.F. Investigation of building integrated photovoltaics potential in achieving the zero energy building target. Indoor Built Environ. 2014, 23, 92–106. [Google Scholar] [CrossRef]
- Lu, Y.J.; Chang, R.D.; Shabunko, V.; Amy, T.L.Y. The implementation of building-integrated photovoltaics in Singapore: Drivers versus barriers. Energy 2019, 168, 400–408. [Google Scholar] [CrossRef]
- Faranda, R.; Sonia, L. Energetic sustainable development of railway stations. In Proceedings of the 2007 IEEE Power Engineering Society General Meeting, Tampa, FL, USA, 24–28 June 2007; IEEE: Piscataway, NJ, USA, 2007. [Google Scholar]
- Zhang, W.; Nie, J.Z. Study on the Applicability of Fresh Air Heat Recovery System in Typical Buildings in Different Climatic Regions in China; Architecture Science: Beijing, China, 2022. [Google Scholar]
- Mardiana-Idayu, A.; Riffat, S.B. Review on heat recovery technologies for building applications. Renew. Sustain. Energy Rev. 2012, 16, 1241–1255. [Google Scholar] [CrossRef]
- Cuce, P.M.; Riffat, S. A comprehensive review of heat recovery systems for building applications. Renew. Sustain. Energy Rev. 2015, 47, 665–682. [Google Scholar] [CrossRef]
- Liu, X.P.; Niu, J.L. An optimal design analysis method for heat recovery devices in building applications. Appl. Energy 2014, 129, 364–372. [Google Scholar] [CrossRef]
- Scrucca, F.; Ingrao, C.; Barberio, G.; Matarazzo, A.; Lagioia, G. On the role of sustainable buildings in achieving the 2030 UN sustainable development goals. Environ. Impact Assess. Rev. 2023, 100, 107069. [Google Scholar] [CrossRef]
- GB 50189-2015; Design Standard for Energy Efficiency of Public Buildings. China Architecture & Building Press: Beijing, China, 2015.
- GB/T 18883-2022; Indoor Air Quality Standard. State Environmental Protection Administration: Beijing, China, 2022.
- GB/T 50785-2012; Evaluation Standard for Indoor Thermal Environment in Civil Buildings. China Architecture & Building Press: Beijing, China, 2012.
- Sozer, H. Improving energy efficiency through the design of the building envelope. Build. Environ. 2010, 45, 2581–2593. [Google Scholar] [CrossRef]
- Pacheco, R.; Javier, O.; Germán, M. Energy efficient design of building: A review. Renew. Sustain. Energy Rev. 2012, 16, 3559–3573. [Google Scholar] [CrossRef]
- Huo, H.; Jing, C.J.; Li, K.; Huo, H.B. Synergic relationships between thermophysical properties of wall materials in energy-saving building design. Int. J. Heat Mass Transf. 2015, 90, 246–253. [Google Scholar] [CrossRef]
- Zhu, J.; Li, D. Current situation of energy consumption and energy saving analysis of large public building. Procedia Eng. 2015, 121, 1208–1214. [Google Scholar] [CrossRef]
- Feng, Q. Energy-Saving System Analysis about the Exterior Building Enclosures of Wenyuan Building. In Advanced Materials Research; Trans Tech Publications Ltd.: Stafa-Zurich, Switzerland, 2011; Volume 163. [Google Scholar]
Disclaimer/Publisher’s Note: The statements, opinions and data contained in all publications are solely those of the individual author(s) and contributor(s) and not of MDPI and/or the editor(s). MDPI and/or the editor(s) disclaim responsibility for any injury to people or property resulting from any ideas, methods, instructions or products referred to in the content. |
© 2023 by the authors. Licensee MDPI, Basel, Switzerland. This article is an open access article distributed under the terms and conditions of the Creative Commons Attribution (CC BY) license (https://creativecommons.org/licenses/by/4.0/).