1. Introduction
The mountainous building structure (MBS) on the slope is a kind of structure supported by foundations at different elevations to adapt to the site conditions, resulting in different dynamic responses and seismic damage mechanisms from conventional ones due to the changes in the distribution of lateral stiffness in both the vertical and planar directions. It has been verified in the Wenchuan Earthquake [
1] and the Sikkim Earthquake [
2,
3] that MBS experienced peculiar and more severe seismic damage.
In recent years, the seismic response of MBS has made some progress in research. Surana et al. [
4,
5] conducted extensive field surveys in two test bed cities situated in the Himalayan state of Uttarakhand in India to develop a comprehensive building stock inventory and investigated the seismic fragility using a numerical study, discovering that buildings in hilly regions are significantly more vulnerable to earthquake, and the collapse occurs due to the combined effect of shear failure of short columns and flexural failure of beams and columns in the story just above the uppermost foundation level. Birajdar et al. [
6], Subhash et al. [
7] investigated the seismic response of structures with different configurations. The results suggested that the seismic performance of MBS is poorer than that of the set-back structure, and the torsional effect of MBS is more prominent. Tang et al. [
8] compared the dynamic response of an MBS supported by foundations with two different elevations and two corresponding conventional frame structures from the linear elasticity stage to plasticity and failure stages, and results show that the force, deformation, and plastic hinges of MBS are different from that of conventional structures, and there is an obvious difference along and across the slope direction. Studies have demonstrated that the seismic response of the MBS differs from that of ordinary structures, and the MBS suffers from severe torsional effects under earthquakes.
Meanwhile, there are many studies on the influence of different factors on the structural dynamic response. Literature [
9,
10,
11] investigated the influence of non-structural factors such as soil-structure interaction, nonuniform seismic excitation, and the characteristics of ground motions. In terms of the influence of structural factors, Aggarwal et al. [
12] investigated the effect of one or more open stories in reinforced concrete hilly buildings and discovered that the building with the open story at the uppermost foundation level is the most vulnerable under earthquake excitation. Thakur et al. [
13] carried out a study on the influence of the rooftop telecommunication tower on set back-step back building resting on different ground slopes, finding that the tower position and the slope’s gradient would affect the safety of the tower. Li et al. [
14] proposed three types of steel brace arrangement for frame structures supported by foundations with two different elevations, and results of the quasi-static test indicate that setting V-shaped braces can significantly reduce the damage degree of the upper embedding columns and change the phenomenon of locally severe damage of the split-foundation frame structure. Surana et al. [
15] assessed the damage probability matrices of hill-side RC buildings, and the result showed that the choice of the ground-motion intensity measures and the structural configuration type show quite significant effects on the resulted damage probabilities of different damage states. Besides, Surana et al. [
16] obtained the floor response and proposed and validated the simple floor spectral amplification functions. Jain et al. [
17] investigated the seismic response of acceleration-sensitive non-structural components, and proposed floor displacement-based models to compute the torsional amplification factors.
Research on seismic failure mechanism of structures is necessary for a reasonable seismic design. The numerical simulations [
18,
19] and experimental studies [
20] on the seismic failure mechanism of the MBS have proceeded and found that upper-embedding columns were damaged seriously, and a “half-story mechanism” is likely to occur. However, the research object of these studies is mainly the plan along the slope direction of the MBS, and the pushover analysis method is always adopted. Li et al. [
21] conducted shaking table tests to compare the dynamic response and failure characteristics of a frame structure supported by foundations with two different elevations from those of a corresponding conventional structure, and the results indicated that the column hinge first appears at the end of the upper embedding column, then transfers to the floors under the upper embedding end with the increase in earthquake intensity. Meanwhile, the torsional effect of the former frame structure is remarkable, and the damage of the bottom corner column ends increases significantly. Xu et al. [
22] investigated the seismic performance and improvements of spilt-foundation buildings across the slope direction using pushover analysis with the load mode of the first mode, and the results indicated that the upper-embedding columns were the weakest part of the structure, and the floors under the upper-embedding end were destroyed in succession. The results of these studies all demonstrate the special seismic failure mechanism of the MBS, while most of them focus on the plan along the slope direction and its final damage state, also, the results on structural torsional effect may be inaccurate, so the detailed damage process needs further research and the torsional effect should be analyzed reasonably.
As the damage of the structure changes, the redistribution of the internal force of the members has a certain regularity, which can reflect the damage mechanism of the structure to a certain extent. Most studies aim at the internal force redistribution of continuous beams or single members [
23,
24], which reveals the mechanism of internal force redistribution at the member and interface levels. Also, the influence of differential consolidation settlement of the foundation on the redistribution of internal force of structures is analyzed to provide a reference for the reinforcement [
25]. For the MBS, Ji et al. [
26] studied the base stress distribution by overall finite element models containing soil and structure established using ANSYS, finding that the negative compression zone is greater than the positive one when the overturning load increases. Xu et al. [
19] observed the shear distribution of each ground column in an elastic state, finding the shear force of the upper ground columns is generally larger than that of the lower ground columns. Wu [
27] investigated the distribution of the shear force of columns at the upper embedding story, revealing the significant redistribution of the shear force of columns in this story. Jiang et al. [
28] noticed that the axial beam compression and tension are larger and researched the impact of axial beam tension on joint shear capacity, and the results indicated that the shear capacity of the joint may be lost when tension is experienced. There is not much research on the structural force, and the torsion of the structure is neglected.
Although there are so many studies on the seismic response and failure characteristics of the structure supported by foundations with different elevations, most studies are on two-dimensional models along the slope direction, which ignores the torsional effect. The redistribution of internal force is rarely noticed, and previous studies have focused on the internal force of the upper embedding columns. Studies on force characteristics and damage path of MBS consider torsional effects are scarce. Hence, the present research addresses the behavior of three-dimensional MBS, subjected to earthquake waves. The study includes the force and plastic hinges of three-dimensional MBS. Also, the effect of the stiffness distribution between the upper- and the lower- embedding sides of the upper-embedding story on redistribution of internal force and plastic hinge development is studied to improve the seismic performance of the MBS. The main purpose of the study is to obtain the redistribution of internal force and plastic hinge development of three-dimensional MBS, and the results will be a reference for seismic design and reinforcement of MBSs.
3. Seismic Response Analysis of an Example MBS Model
In this section, an RC-frame MBS supported by foundations with two different elevations is built as the example model. The distribution and redistribution of shear force are obtained, and the distribution and development of plastic hinges are investigated. The failure path and mechanism of the structure will be discussed.
3.1. Analytical Model and Earthquake Waves
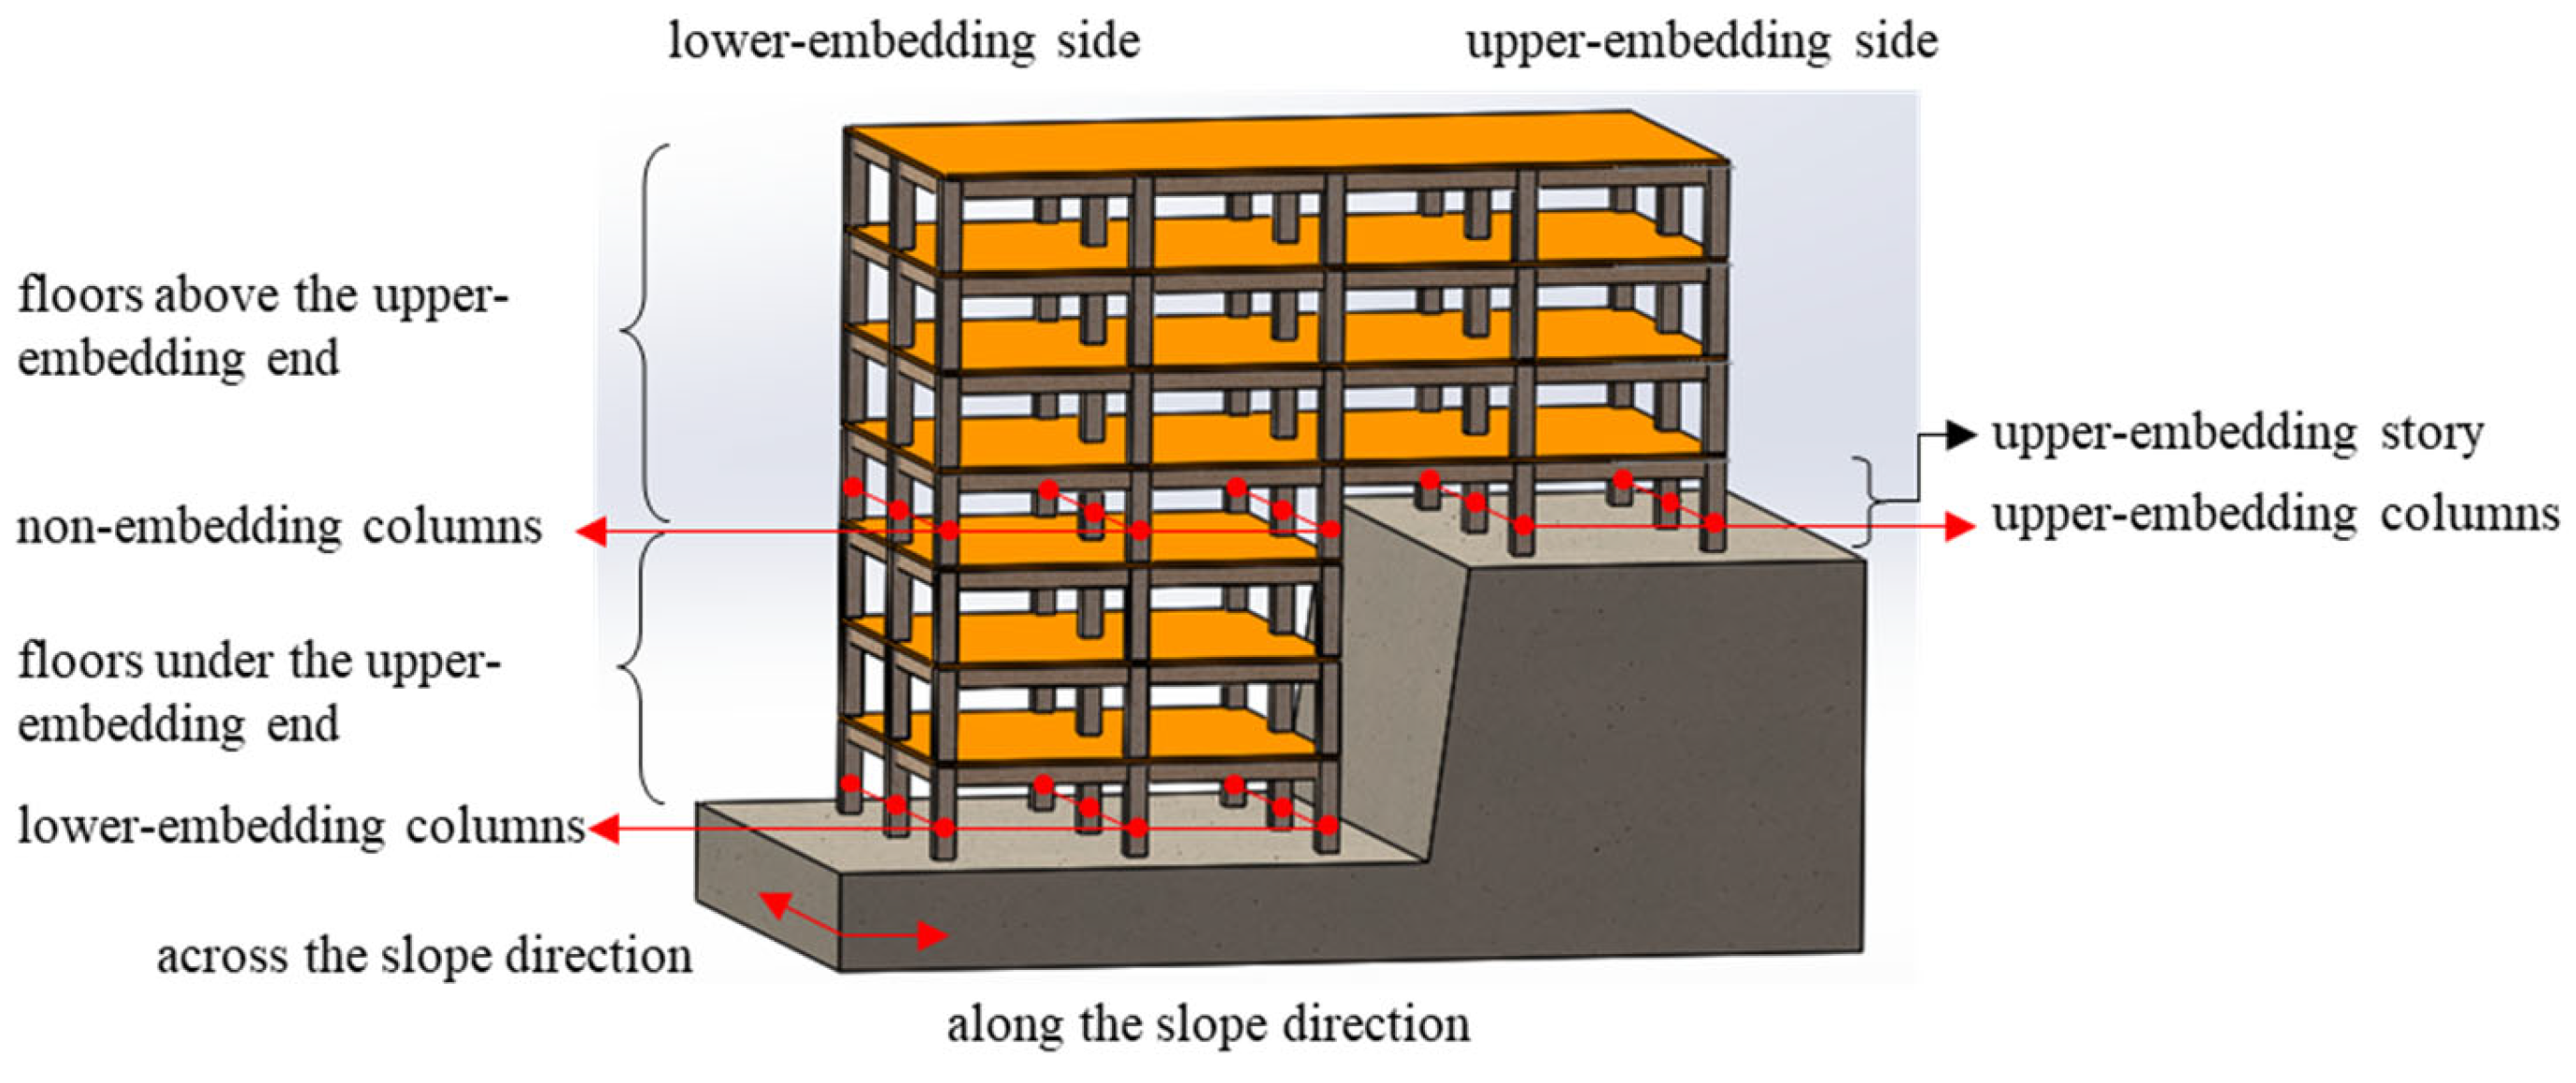
Figure 3 shows an RC-frame MBS with 3 × 2 bays and 6 stories supported by foundations with different elevations, named M0. The
x-axis is along the slope direction, and the
y-axis is across the slope direction.
The floor height is set constant at 3.0 m, and the bay width is 6.0 m in both horizontal directions. The cross sections of columns and beams are respectively 600 mm × 600 mm and 300 mm × 600 mm. The thickness of the floor slab is 140 mm to meet the deflection requirements, and there are no secondary beams. The additional uniform dead load and the uniform live load are respectively set as 1.5 kN/m2 and 2.0 kN/m2 for all floors. The linear dead load of the infilled walls is 9 kN/m on all beams from the 1st floor to the 5th floor, and the linear dead load on the surrounding beams of the top floor is 3 kN/m. HRB400 rebar and C30 concrete are used.
It’s assumed that the basic fortification intensity of the structures is Intensity 8, the site type is Ⅱ, and the predominant period
Tg is 0.35 s according to GB 50011-2010 [
29]. Rebars of upper-embedding columns and columns at the lower-embedding side of the 4th floor are designed by the seismic bearing capacity, and rebars of other columns are determined based on the minimum rebar ratio.
OpenSees was used for the nonlinear analysis of the 3D model using the Concrete02 model for concrete. The strength deterioration model based on effective hysteresis energy dissipation was adopted for the rebar, whose accuracy in modeling has been verified [
30,
31]. The sections of the beam and column are fiber sections. The Nonlinear-Beam-Column Element, a distributed plasticity element based on the finite element flexibility method, is chosen to simulate the beam and column elements. At the top of the upper-embedding columns, the Zero-length element is introduced in series with the beam-column element, and the load-displacement relationship of the shear spring is defined in terms of the Shear Limit Curve and Limit State Material. Axial Limit Curve and Limit State Material are used to define the load-displacement relationship of the axial spring to take account of the bending, shear and axial effects of the member [
32]. Rayleigh damping with a damping ratio of 5% is used in the analysis of time history.
Three groups of natural earthquake waves are selected considering the natural vibration period of the MBS and the site conditions, as shown in
Table 1, where
aPG,x represents the peak acceleration on the
x-axis. In addition, one group of artificial waves was created according to GB 50011-2010. The elastic amplification factor spectra for 5% damping are shown in
Figure 4. The used
aPG,x of the natural and artificial waves are 0.07 g, 0.2 g, 0.4 g, 0.51 g and 0.62 g are applied to the structure to represent the frequent earthquake, moderate earthquake, rare earthquake of Intensity 8, rare earthquake of Intensity 8.5 and rare earthquake of Intensity 9, respectively.
3.2. Internal Force and Its Redistribution
The internal force of the structure at the moment of maximum base shear is selected to analyze the distribution and redistribution of base shear, story shear, and elements shear.
3.2.1. Base Shear
The base shear of MBS includes the shear forces of both the upper-embedding and the lower-embedding columns. When the base shear reaches the maximum value, the proportion of the base shear of lower-embedding columns is listed in
Table 2. For
aPG,x = 0.07 g, the proportion of the base shear borne by lower embedding columns is 0.10 and 0.22 in the two directions, this shows that the most of the base shear are borne by upper-embedding columns, which is consistent with the results in literature [
19]. The proportion of the base shear of lower-embedding columns displays a low value of 5% along the slope direction, while that reaches a much higher value of 10%. This suggests that the actual stiffness of the upper-embedding columns and lower-embedding columns are different, despite the same section and number of columns. For lower-embedding columns across the slope direction, their actual stiffness is larger than those along the slope direction. As a consequence, when suffering a strong earthquake with high intensity, the lateral stiffness of upper-embedding columns would be degraded, the distribution of base shear of the MBS could be changed, and lower-embedding columns should bear more base shear. Moreover, the proportions of the base shear of lower-embedding columns in the two directions of the slope tend to increase, where the increment is more prominent along the slope direction, revealing that the stiffness degradation of upper-embedding columns and the transfer of structural damage to the floors under the end of the upper-embedding columns are enhanced. It can be seen that the base shear of the MBS has been significantly redistributed at different embedding ends, and the redistribution degree of base shear is more notable along the slope direction.
3.2.2. Story Shear
The distribution patterns of the story shear of the MBS are very similar under different seismic waves.
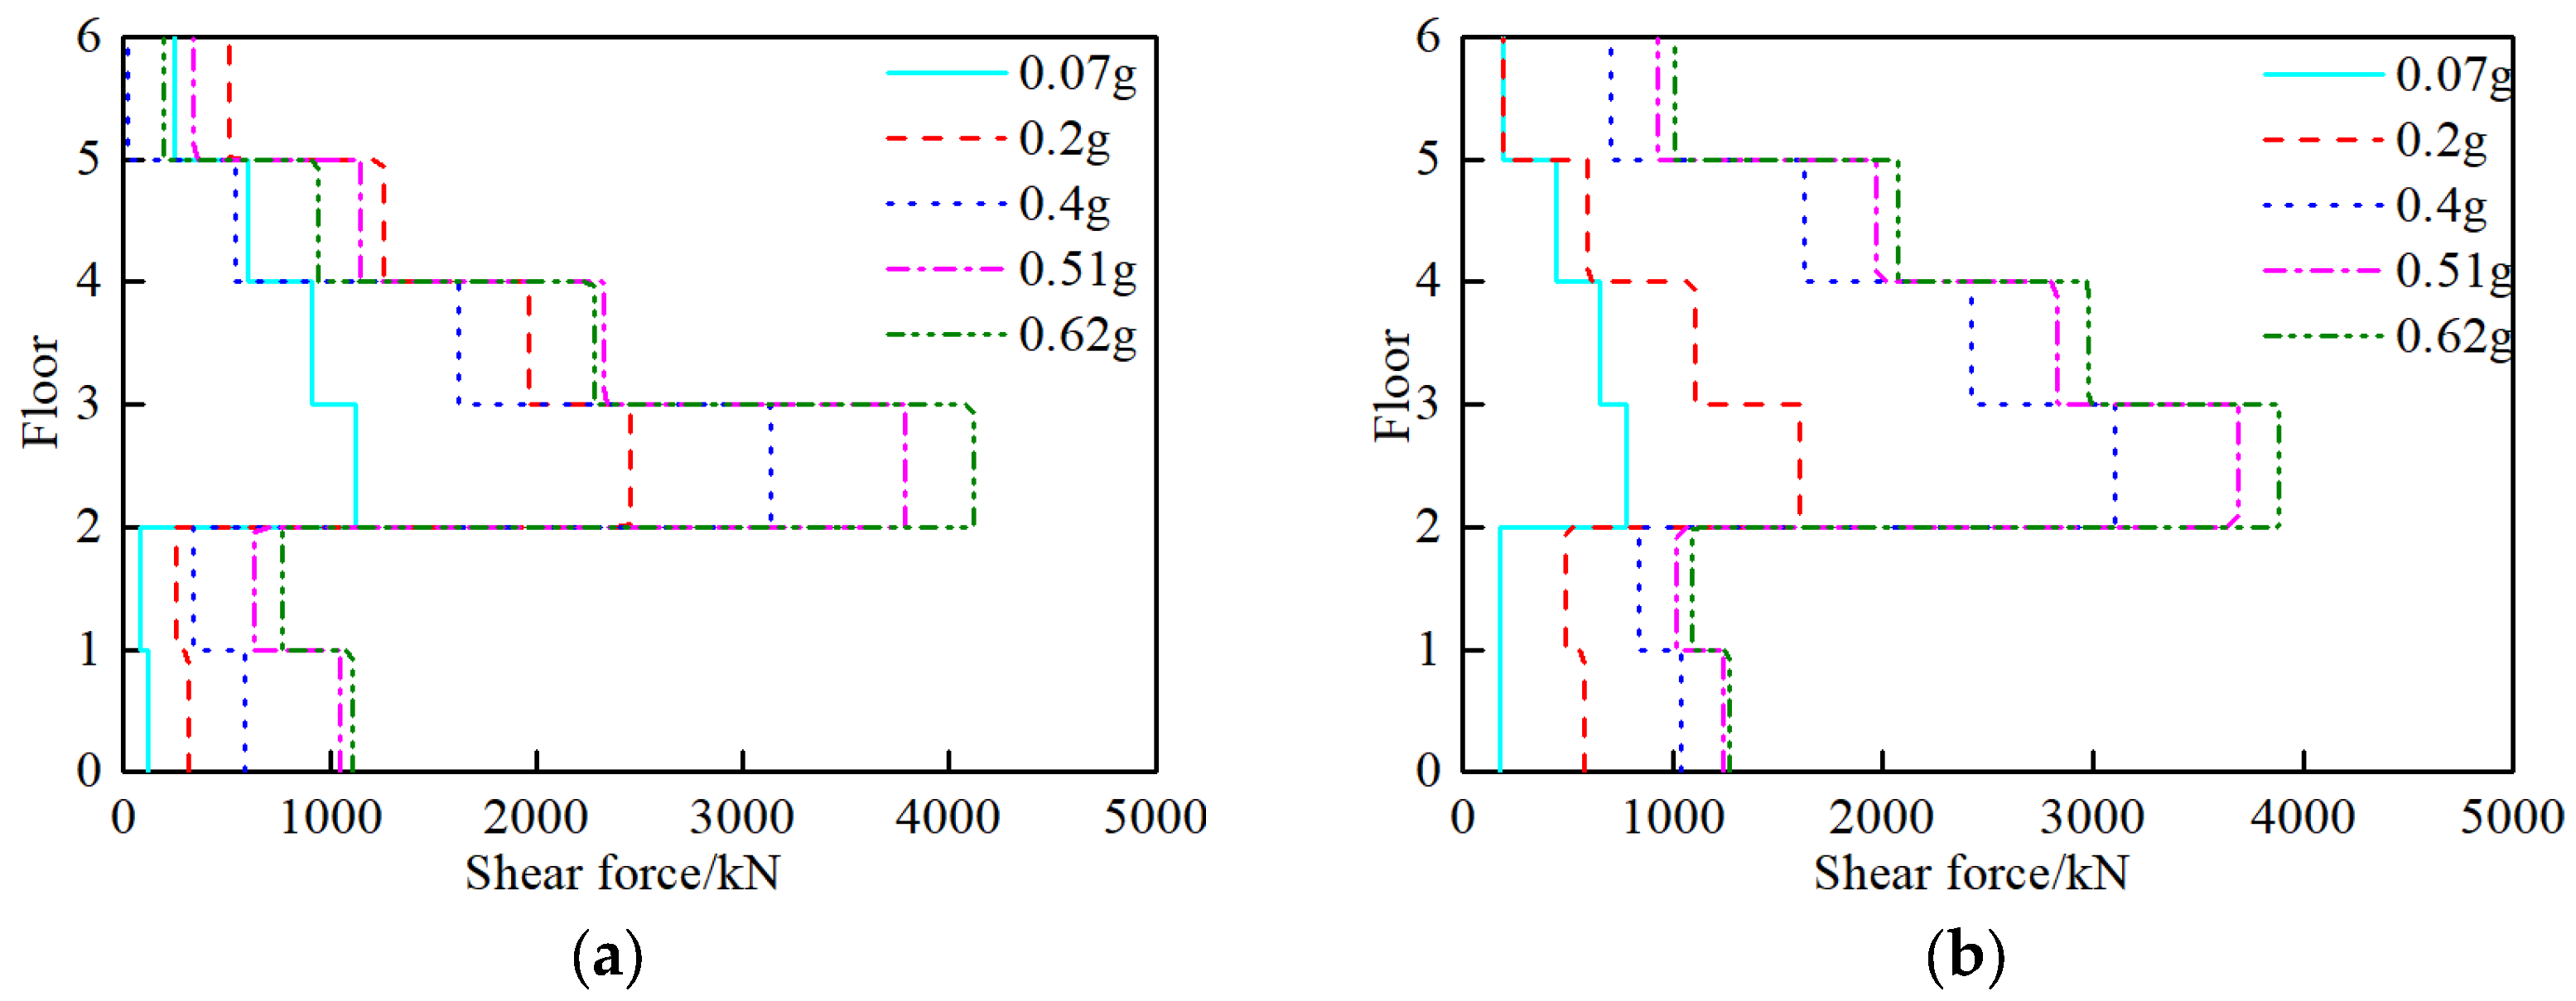
Figure 5 shows the story shear of the MBS suffered by Natural-wave 2 at the time when the base shear reaches its maximum value. This shows that for both directions of the slope, the story shear of the under-part of the upper-embedding end decreases sharply, and part of the story shear has been transferred to the foundation instead of the floors under the upper-embedding end. It has been clarified by previous studies [
3,
8]. With the increase in the earthquake intensity, the story shear of floors under the upper-embedding ends increases generally. For the floors above the upper-embedding ends, the story shear increase in both horizontal directions. When
aPG,x is 0.2 g, the story force is basically proportional to that with 0.07 g of
aPG,x, which shows the MBS is still in an elastic state, or in a slight elastic-plastic state, and its dynamic properties do not change much. Nevertheless, for
aPG,x ≥ 0.4 g, the story shear of partial floors is relatively reduced, especially when
aPG,x reaches 0.62 g. This is related to the stiffness degradation of the MBS, and the maximum story shear and the maximum base shear of floors are not occurring simultaneously.
was used to characterize the amplification of the shear force of the MBS, stories, or the elements under a strong earthquake, where denotes the maximum shear force under an aPG,x of 0.07 g, and V means the maximum shear force.
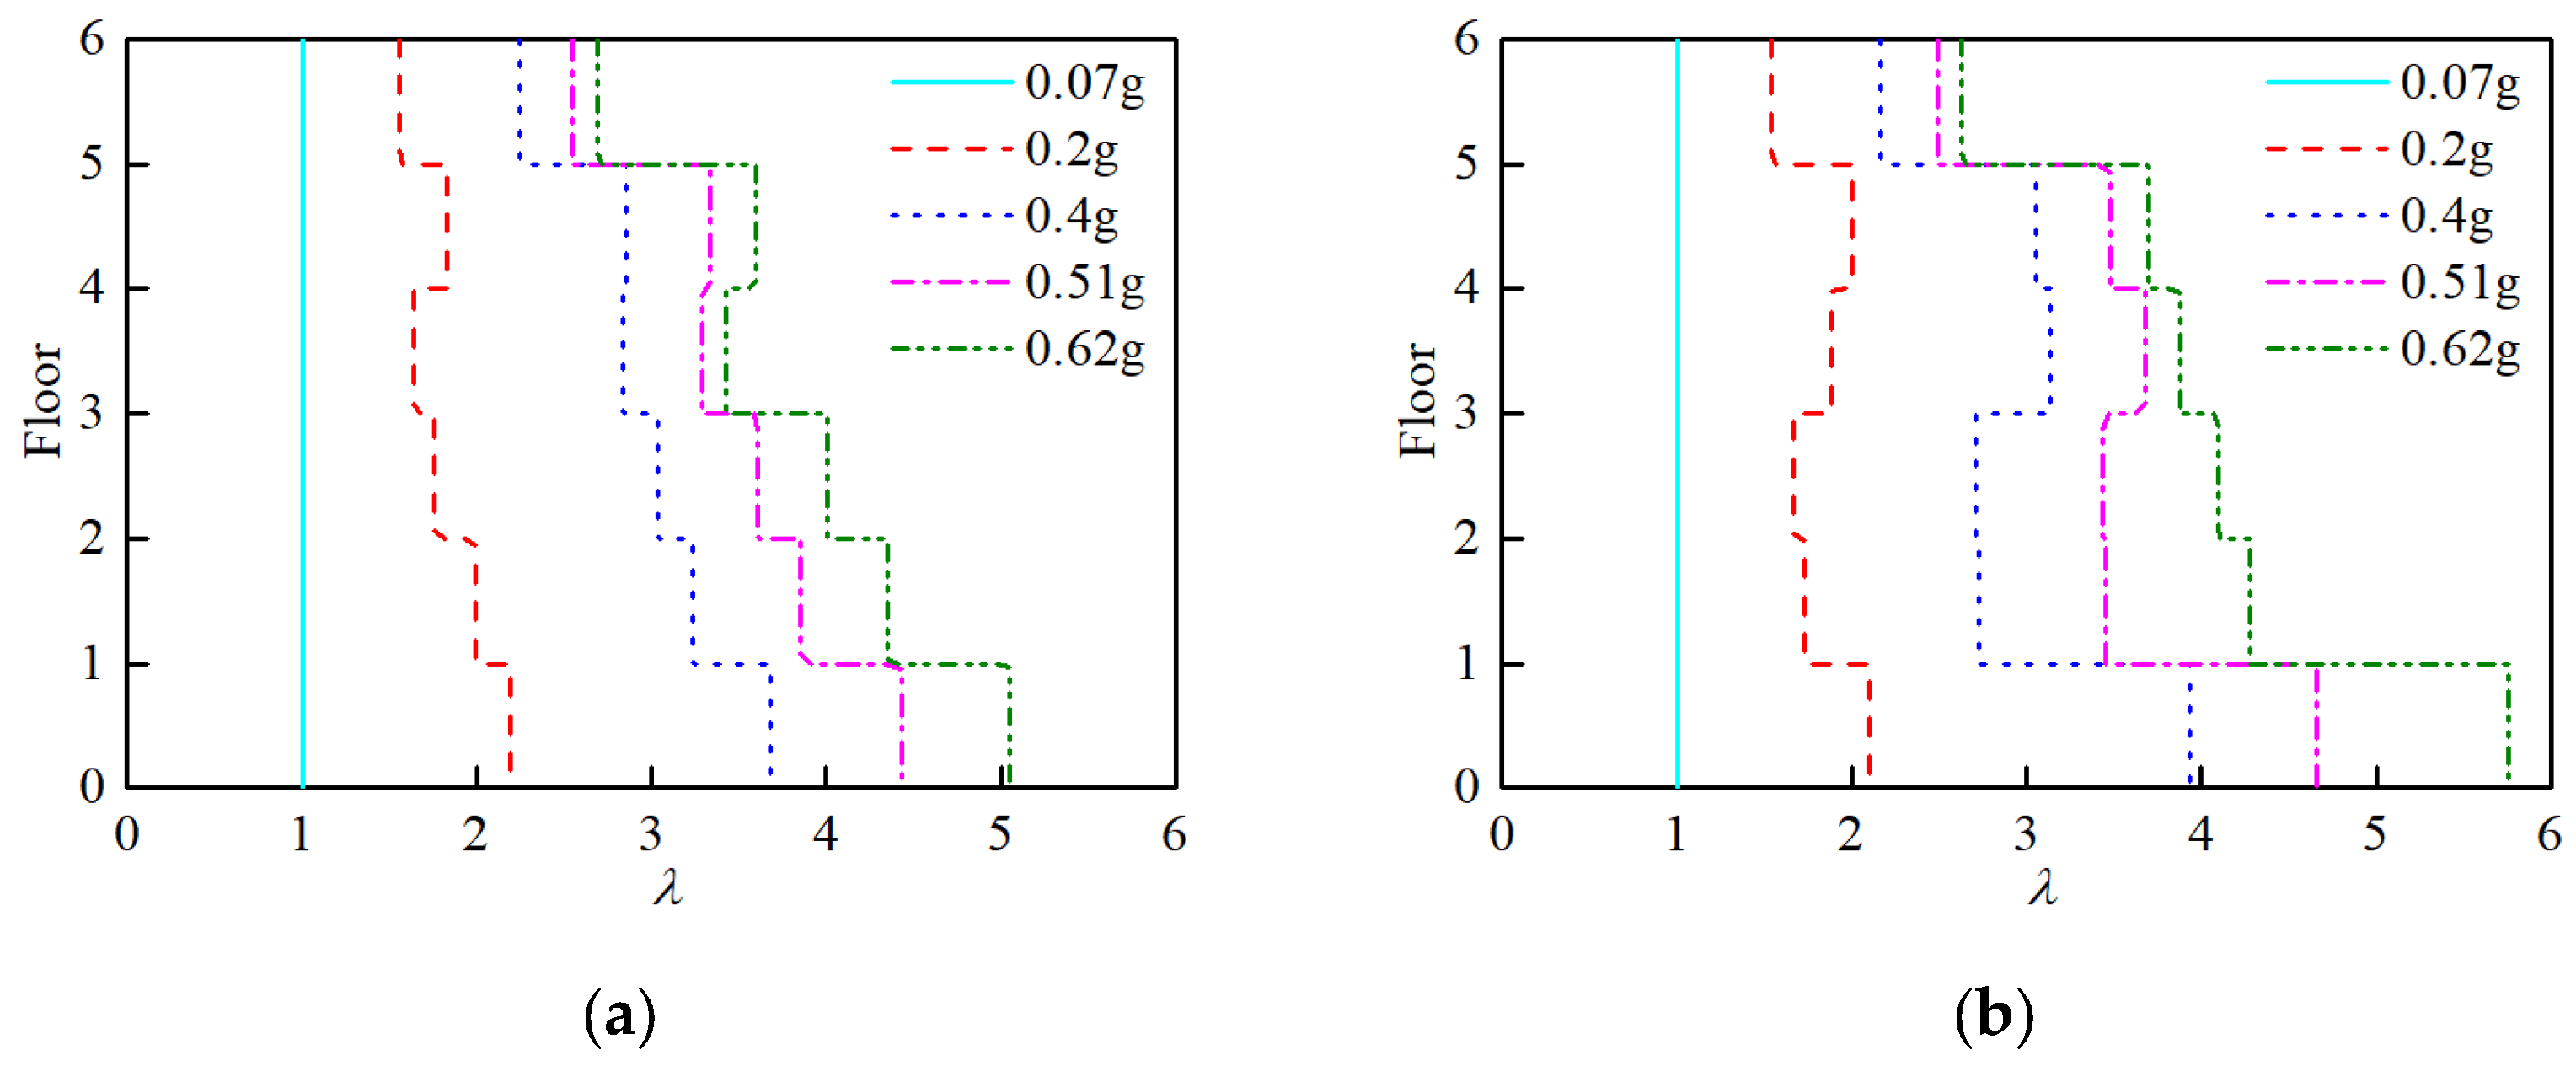
Figure 6 shows the
of the MBS under Natural-wave 2. This clearly shows that the
of the floors above the upper-embedding end varies slightly with the increase in
aPG,x. For instance, the
of each floor is similar ranging from 2.0 to 3.0 when
aPG,x = 0.2 g in both directions of the slope. When
aPG,x ≥ 0.4 g, the
of the floors under the upper-embedding end along the slope direction become obviously larger than those above the upper-embedding end, as shown in
Figure 6a. This indicates that the story shear of the MBS has been redistributed at different floors. In contrast, the changes of
of all the floors across the slope direction (
Figure 6b) are less obvious compared with
Figure 6a, which reveals that more attention should be paid on the redistribution of story shear along the slope direction of an MBS.
3.2.3. Column Shear
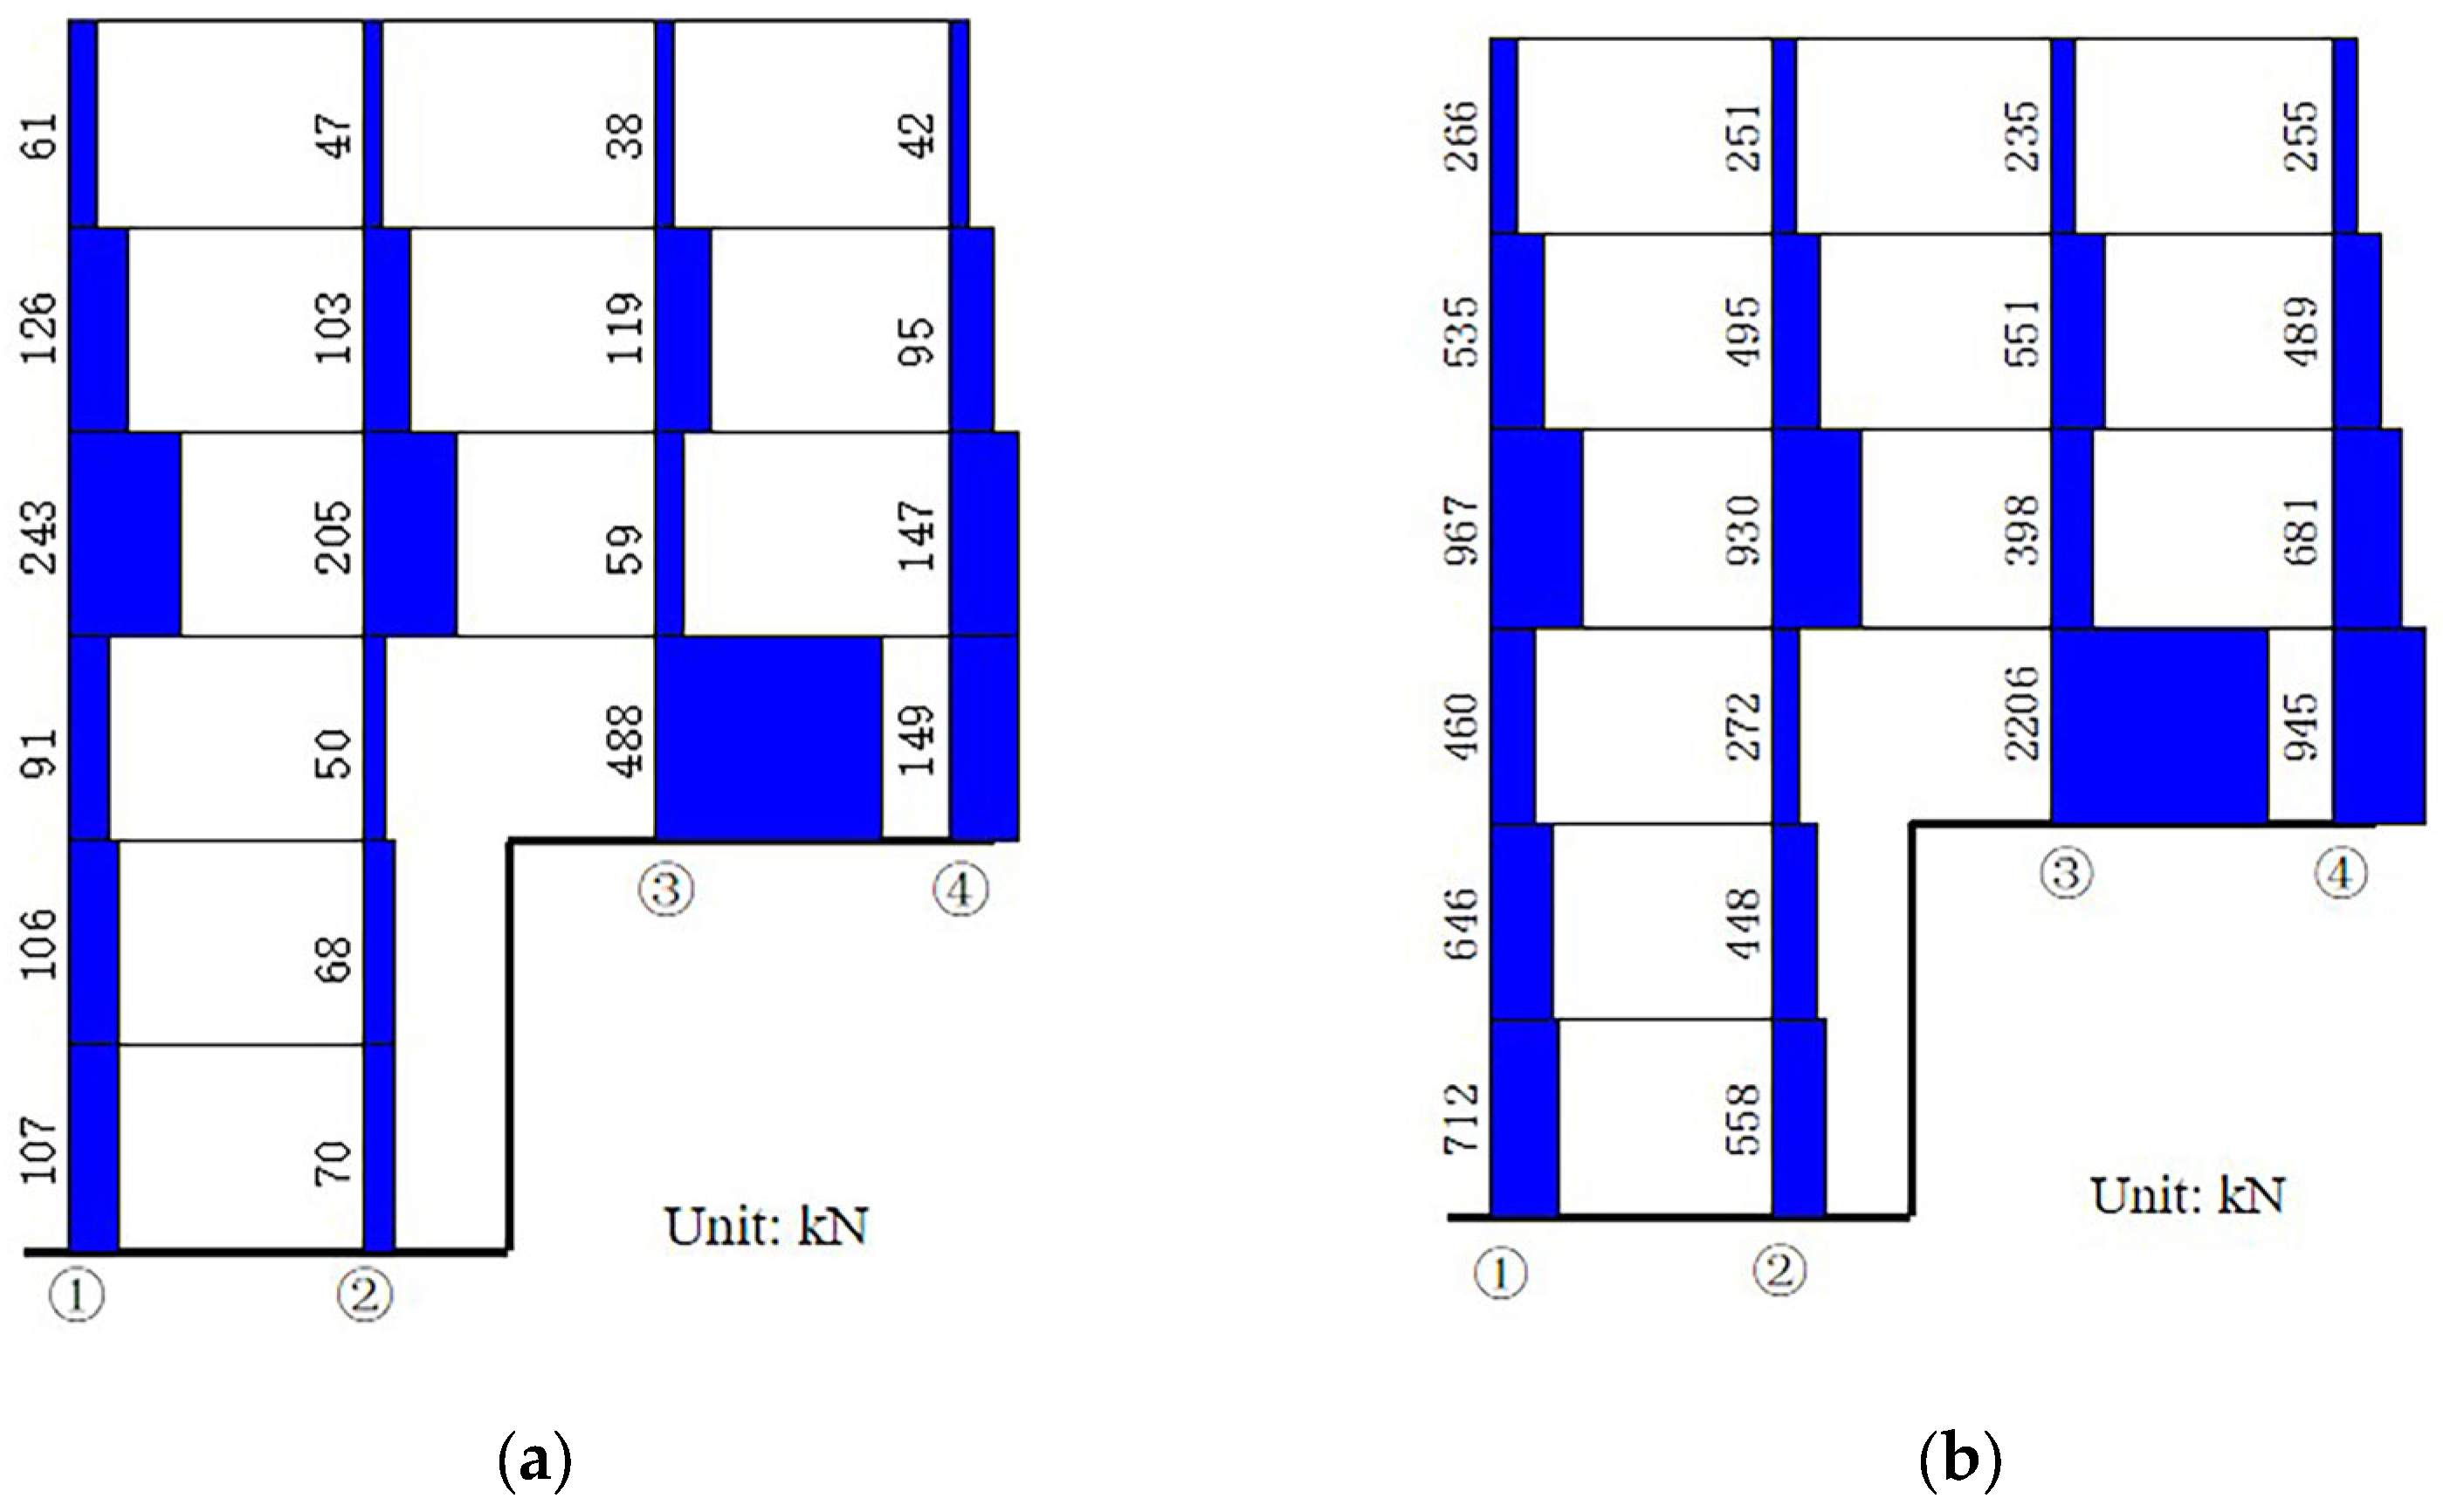
Figure 7 and
Figure 8 show the column shear in the two directions of the slope under the maximum base shear, where the shear force is the sum of the shear of columns at Axis 1, 2, 3, and 4. As can be seen from
Figure 7a,b, most of the story shear of the upper-embedding story has been borne by upper-embedding columns, and the directions of the shear force of columns at Axis 1 or Axis 2 may be opposite to that of upper-embedding columns. Consequently, the relative deformation of the columns at the lower-embedding side and upper embedding-side on the upper-embedding story will be opposite owing to the relationship between force and deformation. Moreover, the rotation and relative deformation of columns at the lower-embedding side are smaller than those of columns at the upper-embedding side. On the adjacent upper floor of the upper-embedding story, the shear forces of the columns at Axis 1 and Axis 2 are greater than those at Axis 3 and Axis 4, which is contrary to the results of the upper-embedding story. Moreover, the shear forces of columns under the upper-embedding ends are relatively small under
aPG,x = 0.07 g, but increase obviously when
aPG,x is 0.62 g, which is consistent with the redistribution of the story shear of floors.
Figure 8a,b show the column shear across the slope direction. For the upper-embedding story, the shear forces of columns at Axis 1 and Axis 2 are lower, and the proportion of the shear force of these columns is increased compared with those along the slope direction. It can be found that the shear force of the columns at Axis 1 and Axis 3 are commonly larger than those at Axis 2 and Axis 4, and the increase in the seismic intensity has not caused obvious changes in the distribution of the shear force of columns.
Figure 9 and
Figure 10 show the
of columns at Axis 1, 2, 3, and 4 in the two directions of the slope. This clearly shows that the redistributing pattern of internal force differs in two different directions. For the column shear along the slope direction, the changes in
of the columns at Axis 1 and Axis 2 are different from those at Axis 3 and Axis 4. For the columns at the lower-embedding side, e.g., Axis 1 and Axis 2, the
of columns on the 3rd floor is larger than that on the 4th floor. In contrast, the
of columns on the 3rd floor at the upper-embedding side is less than that of columns on the 4th floor. Meanwhile, the
of columns on the 3rd floor at the lower-embedding side is greater than that at the upper-embedding side. The results show that the stiffness degradation of columns on the 3rd and 4th floor differs as the columns at the lower-embedding side of the 4th floor lose more stiffness. Moreover,
of columns of the lower-embedding end of the 1st floor is obviously greater than that of the adjacent upper floor. Under a high-intensity earthquake, the redistribution of the internal force occurs, and the upper-embedding columns are seriously damaged with great stiffness reductions, where the non-embedding columns bear more shear and the lower-embedding columns will be loaded with more base shear.
It can be seen that some measures should be considered in the seismic design of the upper-embedding columns to increase the load-bearing capacity to avoid serious damage under earthquakes. The shear bearing capacity of the vertical members of floors under the upper-embedding end can be thus increased to bear the increased shear force.
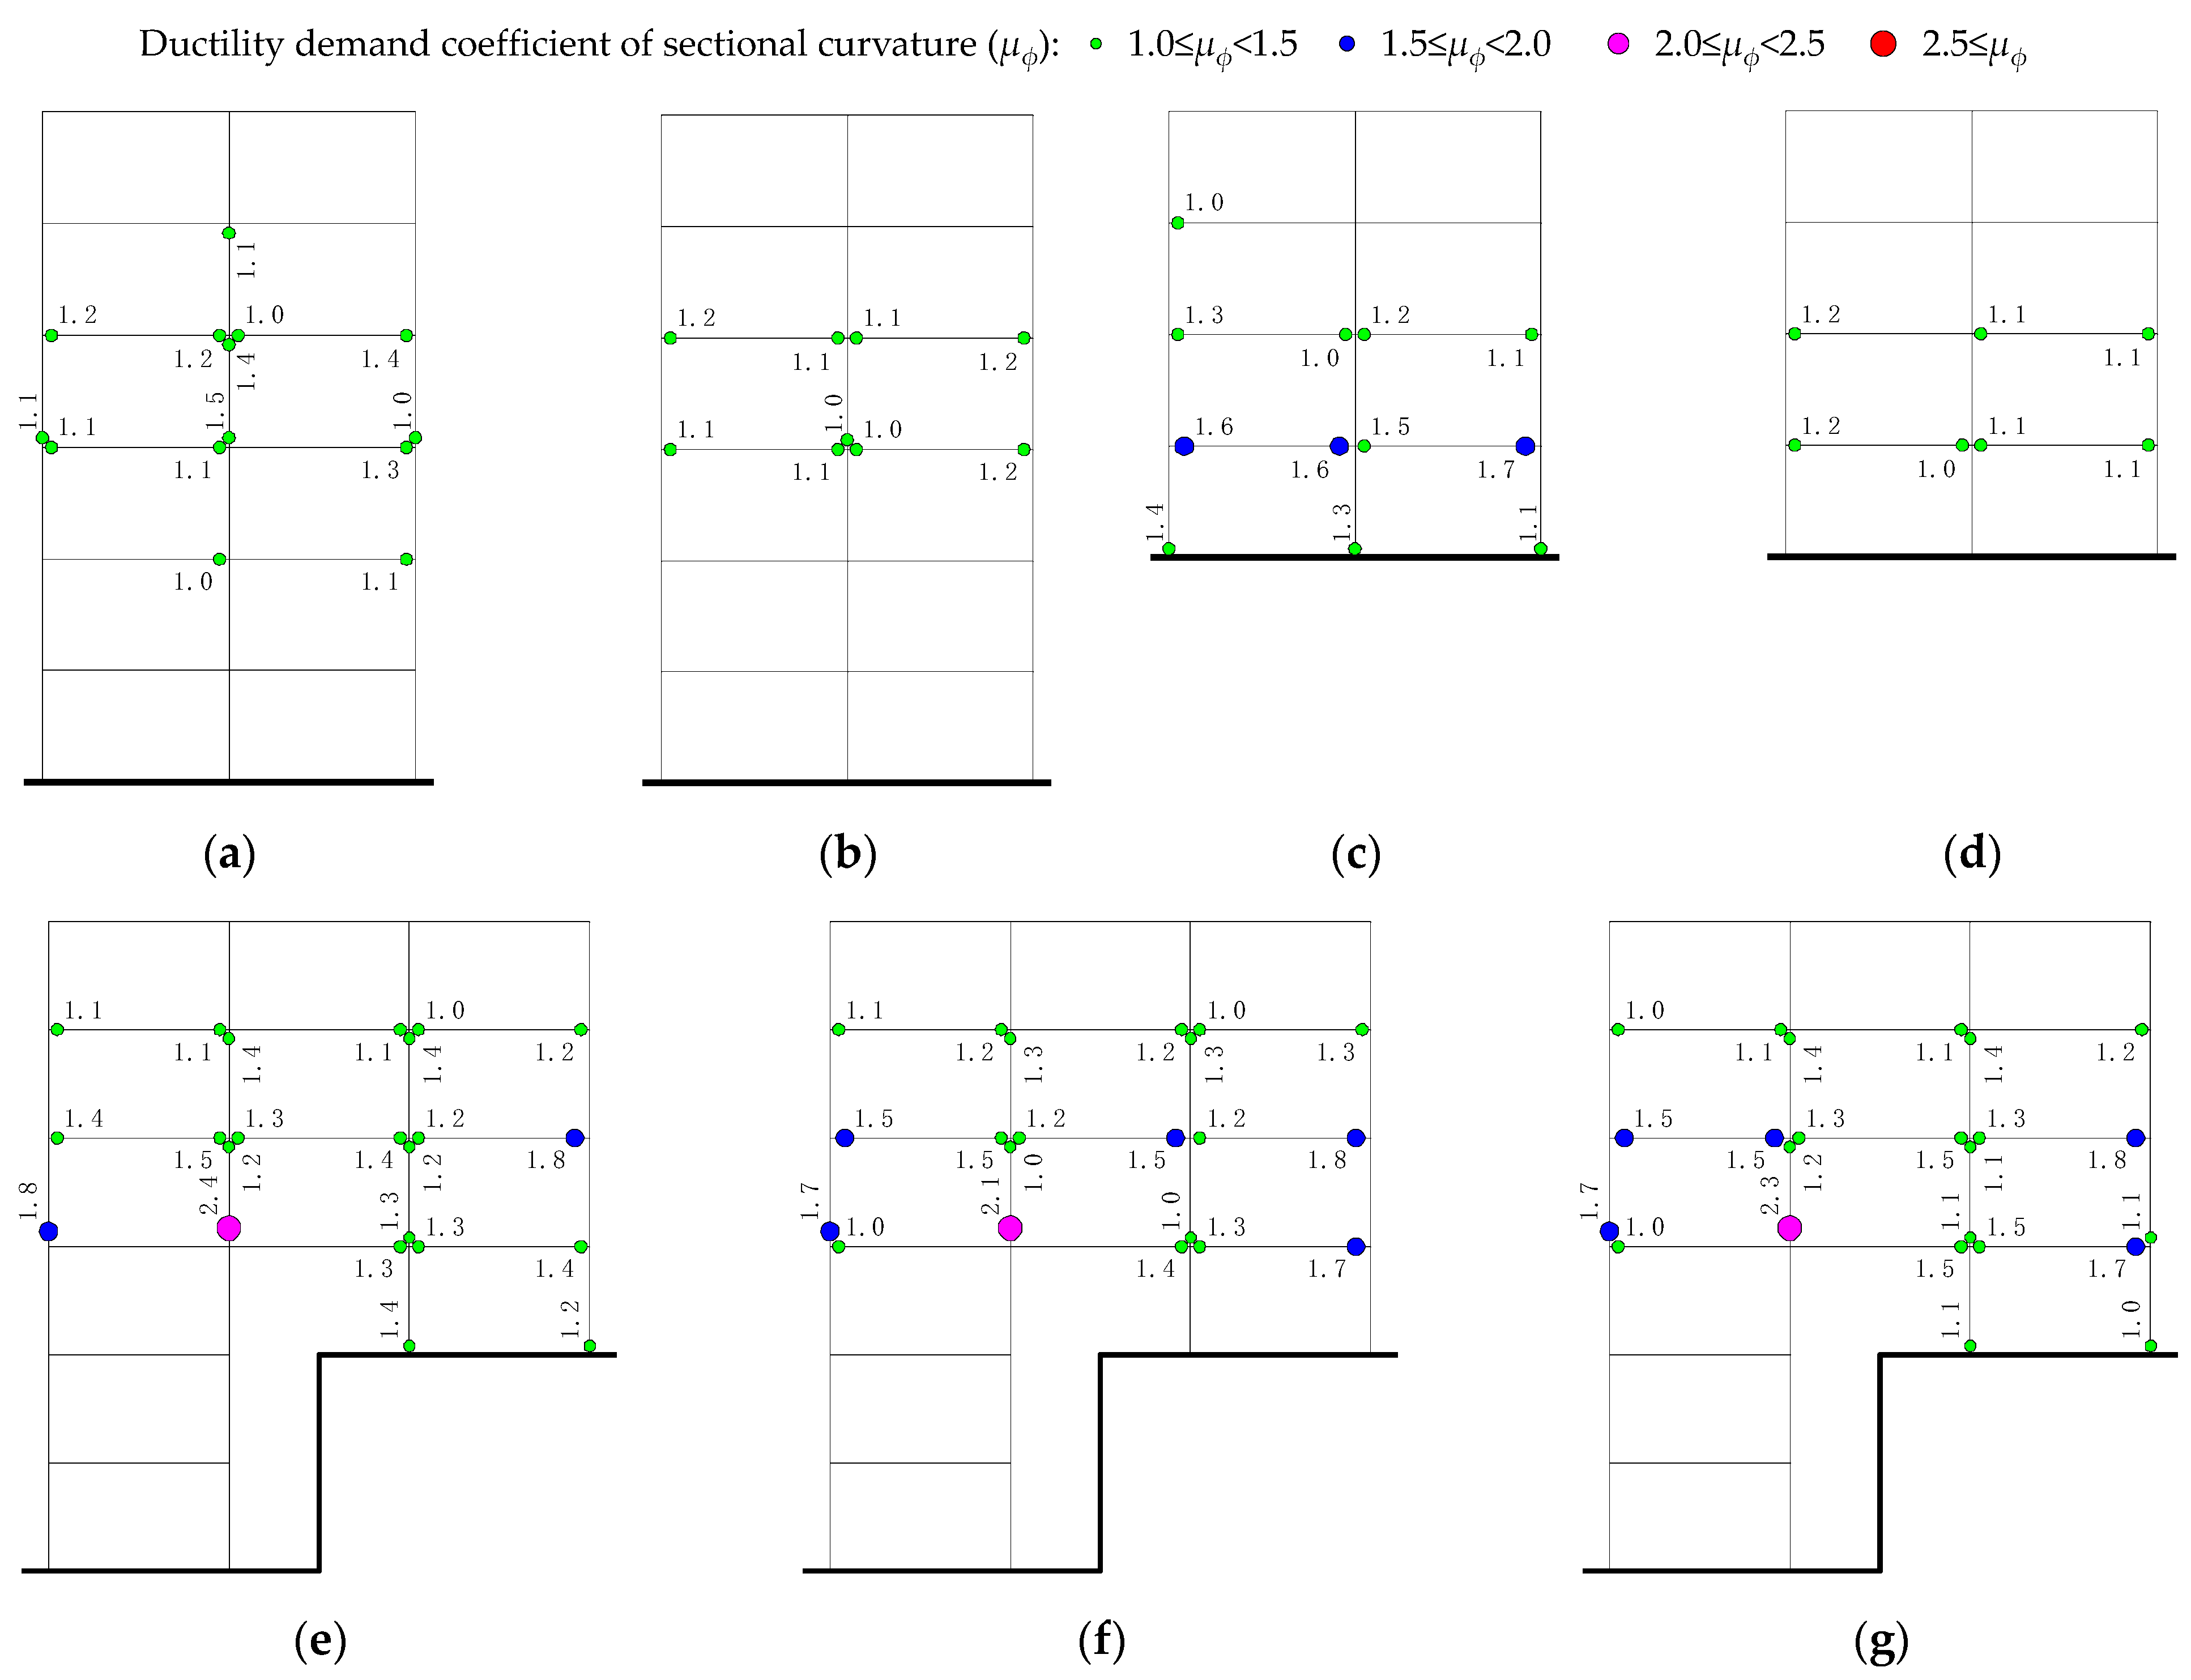
3.3. Distribution and Development of Plastic Hinges
To better interpret the formation of plastic hinges due to bending damage of the elements of MBS, the ductility demand coefficient of sectional curvature
was adopted to indicate the degree of the plastic hinge, as expressed by Equation (1).
where
and
are the maximum curvature and yield curvature of the end of elements, respectively. Plastic hinges could be formed when
≥ 1.
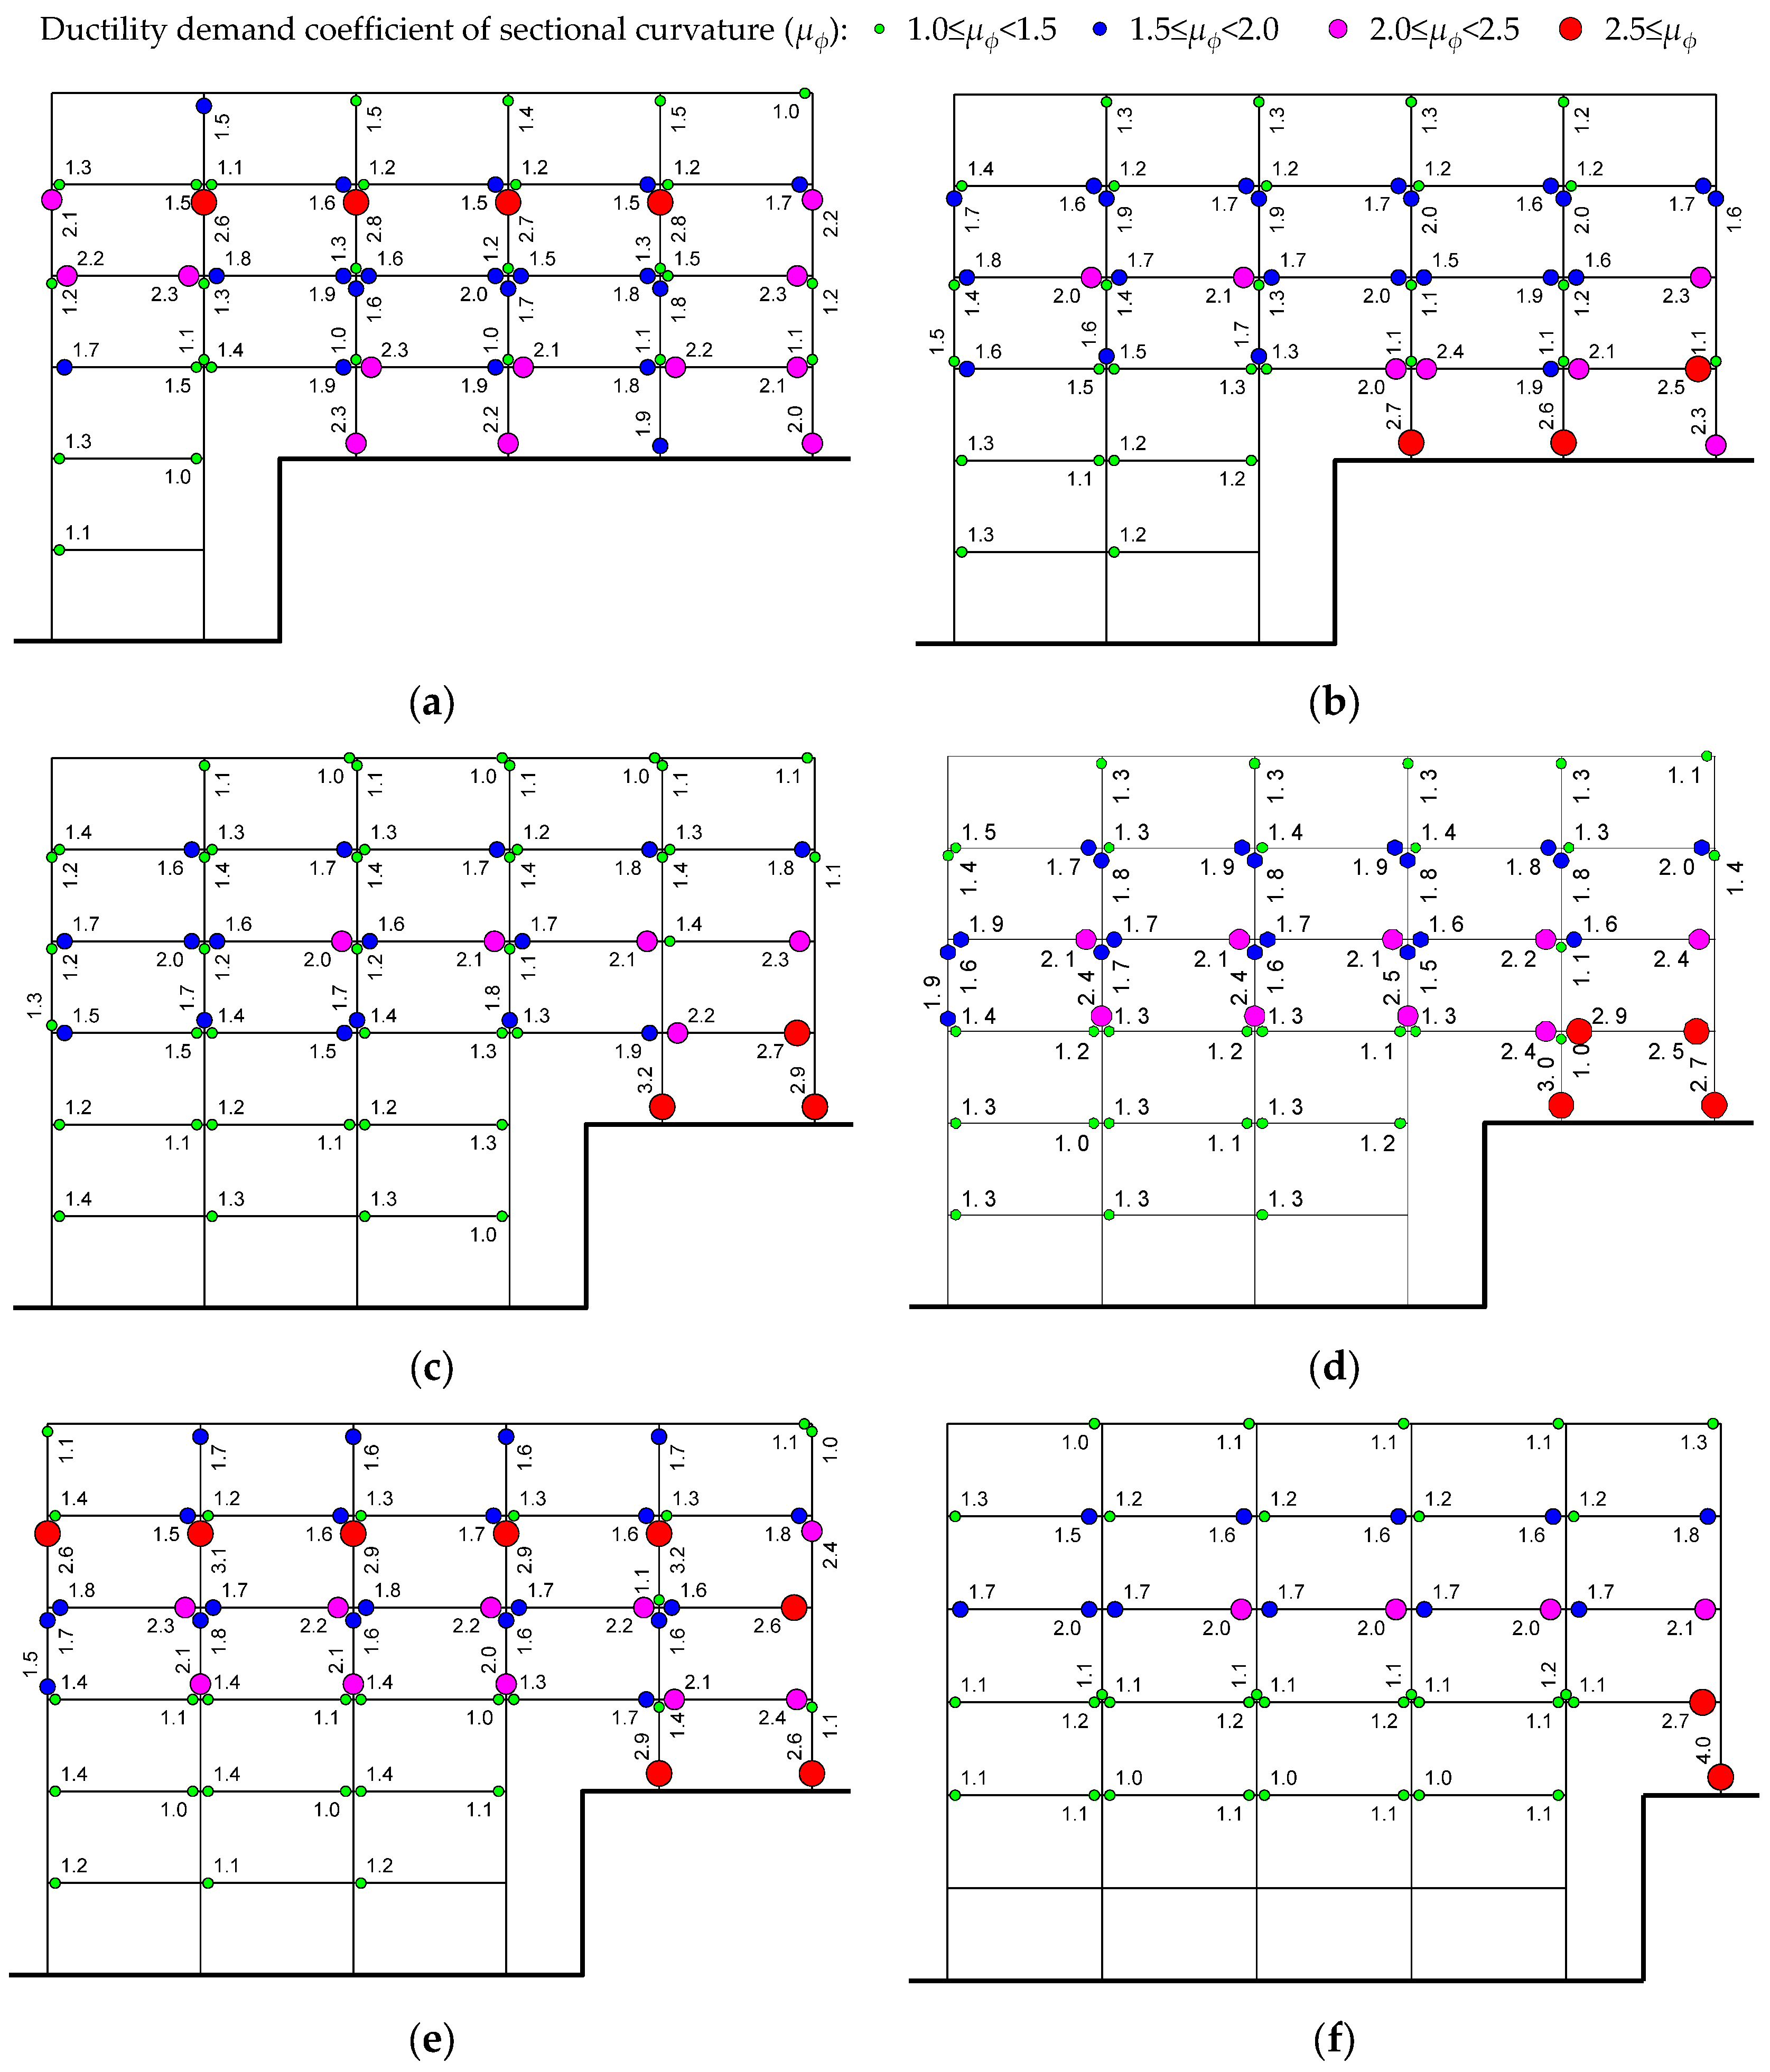
Figure 11 and
Figure 12 show the plastic hinges of the MBS under natural wave 2 with
aPG,x = 0.4 g and 0.62 g, respectively, where
is marked. As can be seen from
Figure 11, for the single-frame across the slope direction, e.g., those single-frames at Axis 1, 2, 3, and 4, the beam hinges mainly form on the 3rd and 4th floors. Moreover, beam hinges can also be found on the 2nd floor in outer frames at the lower-embedding side. Column hinges appear on the 4th and 5th floor of the lower-embedding side single-frame, and the number and degree of column hinges at Axis 1 are larger than those at Axis 2 due to the torsional effect. In addition, column hinges appear at the bottom of upper-embedding columns at Axis 3. For the single-frames along the slope direction, e.g., single-frames at Axis A, B, and C, the beam hinges and column hinges mainly appear at the 3rd to 5th floor, and no plastic hinge can be found at the end of the elements under the upper-embedding end. In the upper-embedding story, column hinges develop at the end of upper-embedding columns, and non-embedding columns are not damaged. On the 4th floor,
at the bottom of the columns at Axis 1 and 2 is obviously greater than the others on this floor.
It can be summarized that column hinges at the end of the embedding column are inclined to be formed at the upper-embedding columns of side single-frame along the slope direction and the upper-embedding columns of the inner single-frame across the slope direction. The distribution of column hinges of the upper-embedding story and the adjacent upper floor are not uniform. The column at the upper-embedding side is hinged in the upper embedding story, while the degree of column hinges at lower embedding side of the adjacent upper floor is greater. The damage of elements under the upper-embedding end is obviously weaker than those above the upper-embedding end. The structural damage is similar to the “half-story mechanism” presented by Xu et al. [
18].
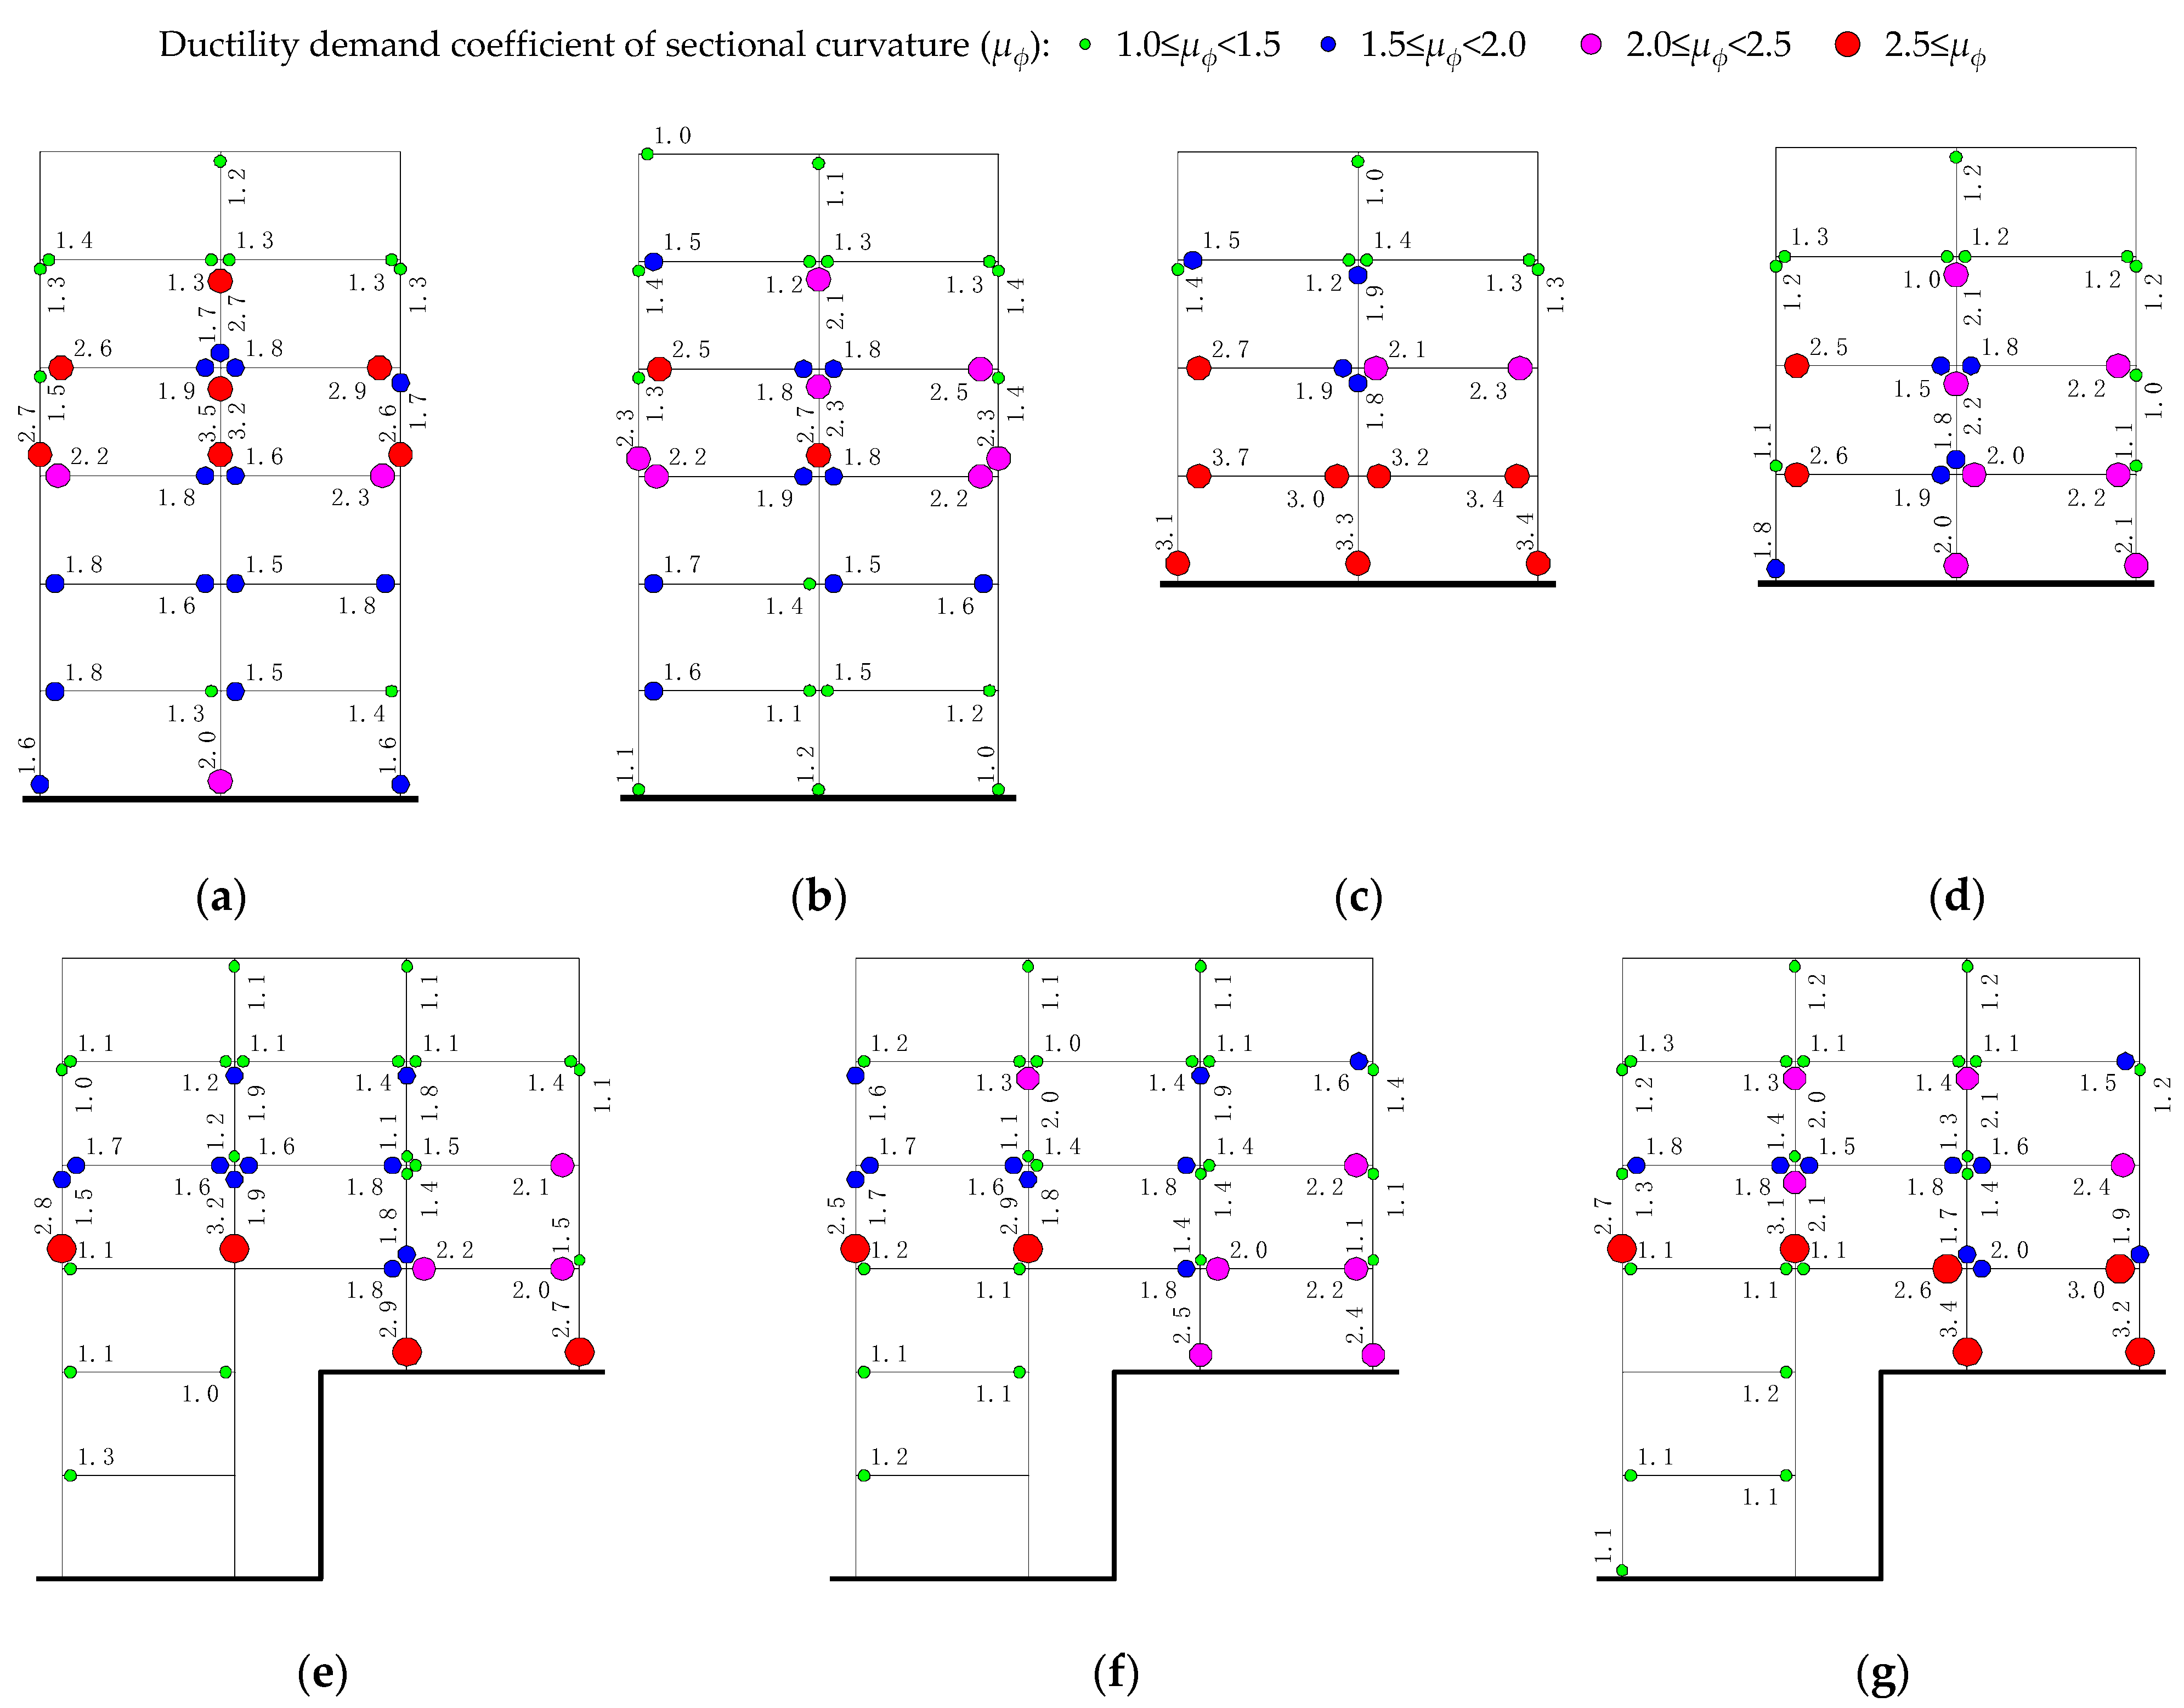
As can be seen from
Figure 12, the number and degree of plastic hinges at the ends of the beam and column increase with the seismic intensity up to 0.62 g. For the single-frames across the slope direction, the degrees of beam hinges on the 3rd and 4th floors are higher than the other beams, and the beams at the floors under the upper-embedding end are hinged. In addition, the plastic hinges appear at the bottom of lower-embedding columns, and the degree of plastic hinges at embedding-columns at Axis 1 and 3 are higher than those of Axis 2 and 4. For the single-frames along the slope direction, the new hinges of beams and columns are mainly found at the elements of floors under the upper-embedding end. While, the number and degree are less than those at the single-frames across the slope direction. Moreover, the non-embedding columns of the upper-embedding story are not damaged. Meanwhile, column hinges at the lower-embedding side of the 4th floor and the upper-embedding side of the 3rd floor are more severe than the other columns.
With the increase in seismic intensity, plastic hinges occur at the end of beams and columns on floors under the upper-embedding end, revealing that the structural damage has transferred from the beams and columns above the upper-embedding end to those under the upper-embedding end. In addition, the elements on the floors above the upper-embedding end suffered severer damage during the earthquake, e.g., the border upper-embedding columns along the slope direction, innermost upper-embedding columns across the slope direction, beams connected with the upper-embedding column, and columns at the lower-embedding side of the adjacent floor above the upper-embedding story.
It can be seen that the damage of the MBS starts from the floors above the upper-embedding end, then proceeds to the floors under the upper-embedding end. Generally, the failure process of the MBS can be summarized as that part of the beams and columns at the floors above the upper-embedding end firstly yield plastic hinges; subsequently, part of the upper-embedding columns become hinged; then, most of the beams and columns at the floors above the upper-embedding end is damaged; finally, the beams and columns at the floors under the upper-embedding end are damaged. The development of plastic hinges is consistent with the damage phenomenon of shaking table test [
21].
Due to the torsional effect, the damage of the border upper-embedding columns along the slope direction and the innermost upper-embedding columns across the slope direction is severer than other upper-embedding columns. The damages of the upper-embedding story and the adjacent upper story are unevenly distributed, and the heavily damaged columns are found in opposite positions. The torsional effect makes the lower-embedding column more prone to hinge across the slope direction.
4. Influence of Stiffness Ratio
4.1. Proposed Nominal Stiffness Ratio
In practical engineering, both the site conditions and the building scheme determine the plane arrangement and the proportion of the plan occupied by the upper- and lower-embedding sides. When the vertical members are uniformly distributed, the proportion of the plan occupied by the upper- and lower- embedding side determines the distribution of stiffness in the upper-embedding story. The stiffness distribution on the upper- and lower- embedding sides of the upper-embedding story will significantly affect the dynamic response of MBS, which should be investigated.
In the upper-embedding story, the stiffness of elements at lower-embedding sides is denoted as
and the stiffness of elements at upper-embedding side is denoted as
. The nominal intra-story stiffness ratio,
, is defined to present the stiffness distribution, and it can be calculated as Equation (2). For MBS, the stiffness of elements at lower-embedding side could be weakened by the deformation of floors under the upper-embedding end, and the degree of weakening depends on the floor number and lateral stiffness of each floor. Assuming that the layout of floors under the upper-embedding end is the same to simplify the analysis, the lateral stiffness of the adjacent lower floor of the upper embedding story is denoted as
, so the nominal below-story stiffness ratio,
, is defined as Equation (3).
4.2. Structure Models
Assuming that the is 0.9, and there are two floors under the upper-embedding end. The is assigned different values to analyze the effect of the increasing nominal intra-story stiffness ratio.
The total number of frame spans at Axis
x and Axis
y are 5 and 2, respectively. The total floor number, load distribution, and design basis are the same as model M0, while the number of the spans at axis
x on floors under the upper-embedding end and the cross-section of beams and columns are changed and shown in
Table 3. The concrete strength grade is C30, except as listed in
Table 3. The nominal intra-story stiffness ratio
, eccentricity ratio
, and structural period are listed in
Table 4, where
e is the stiffness eccentricity and
r is the radius of gyration of the deck. It should be noted that the
varies simultaneously in both horizontal directions, and
along the slope direction inevitably changes.
4.3. The Redistribution of Internal Force
The load cases are the same as the example model M0, and the distribution of base-shear, the average of lower-embedding columns, floors, and columns on different axes under the action of 4 groups of earthquake waves are analyzed in this section.
4.3.1. Base Shear
The average proportion of base shear along the slope direction and across the slope direction borne by lower-embedding columns are listed in
Table 5 and
Table 6.
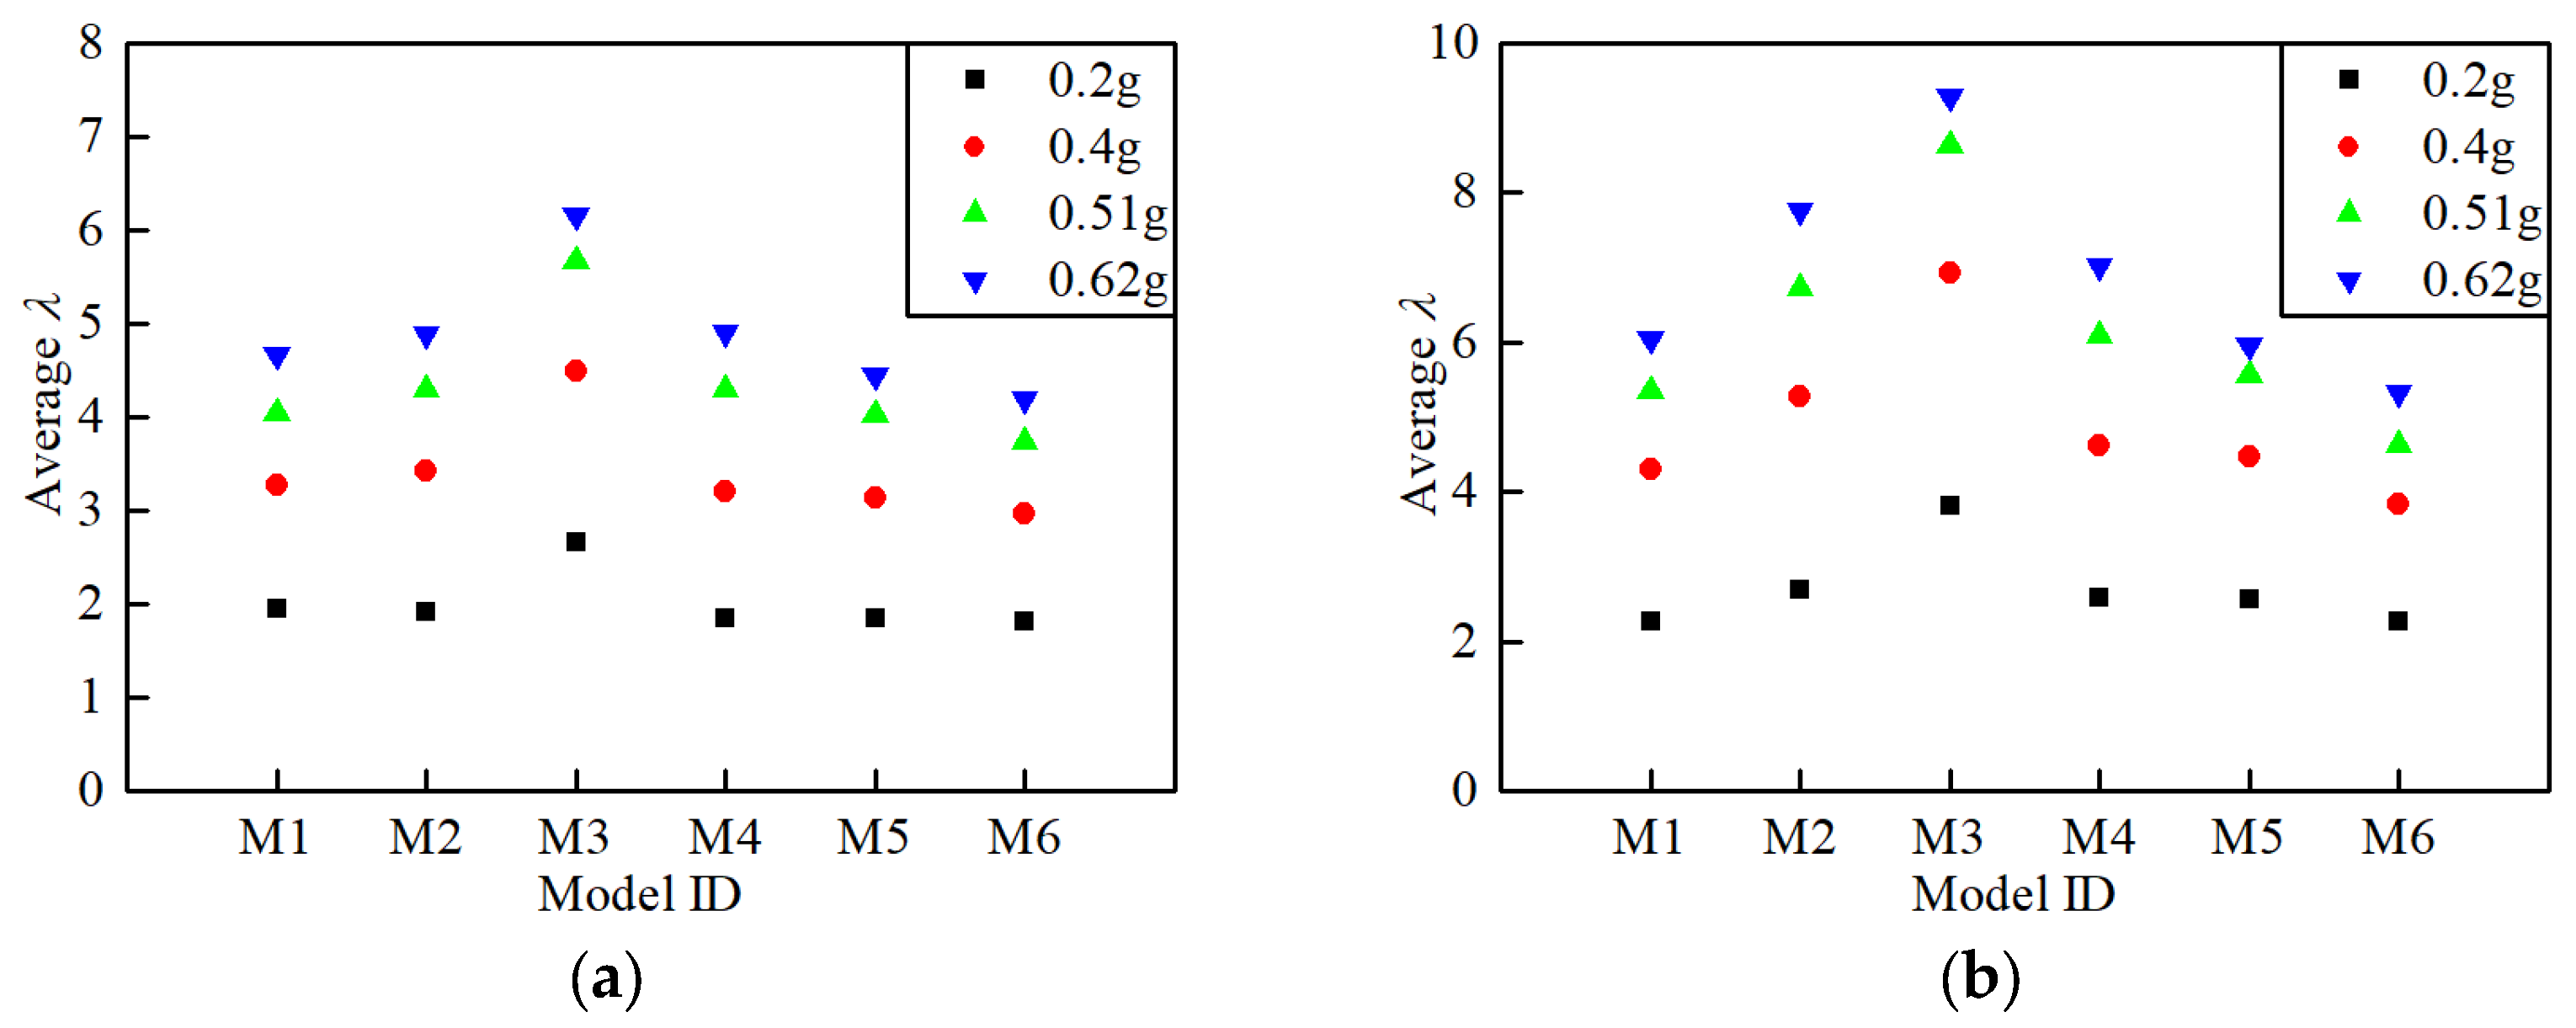
As can be seen from these tables, the proportion of base shear borne by lower-embedding columns tends to increase with the increase in the . In addition, the proportion of the base shear borne by lower-embedding columns of each model tends to increase as the seismic intensity increases, and there is normally a redistribution of base shear borne by different embedding columns.
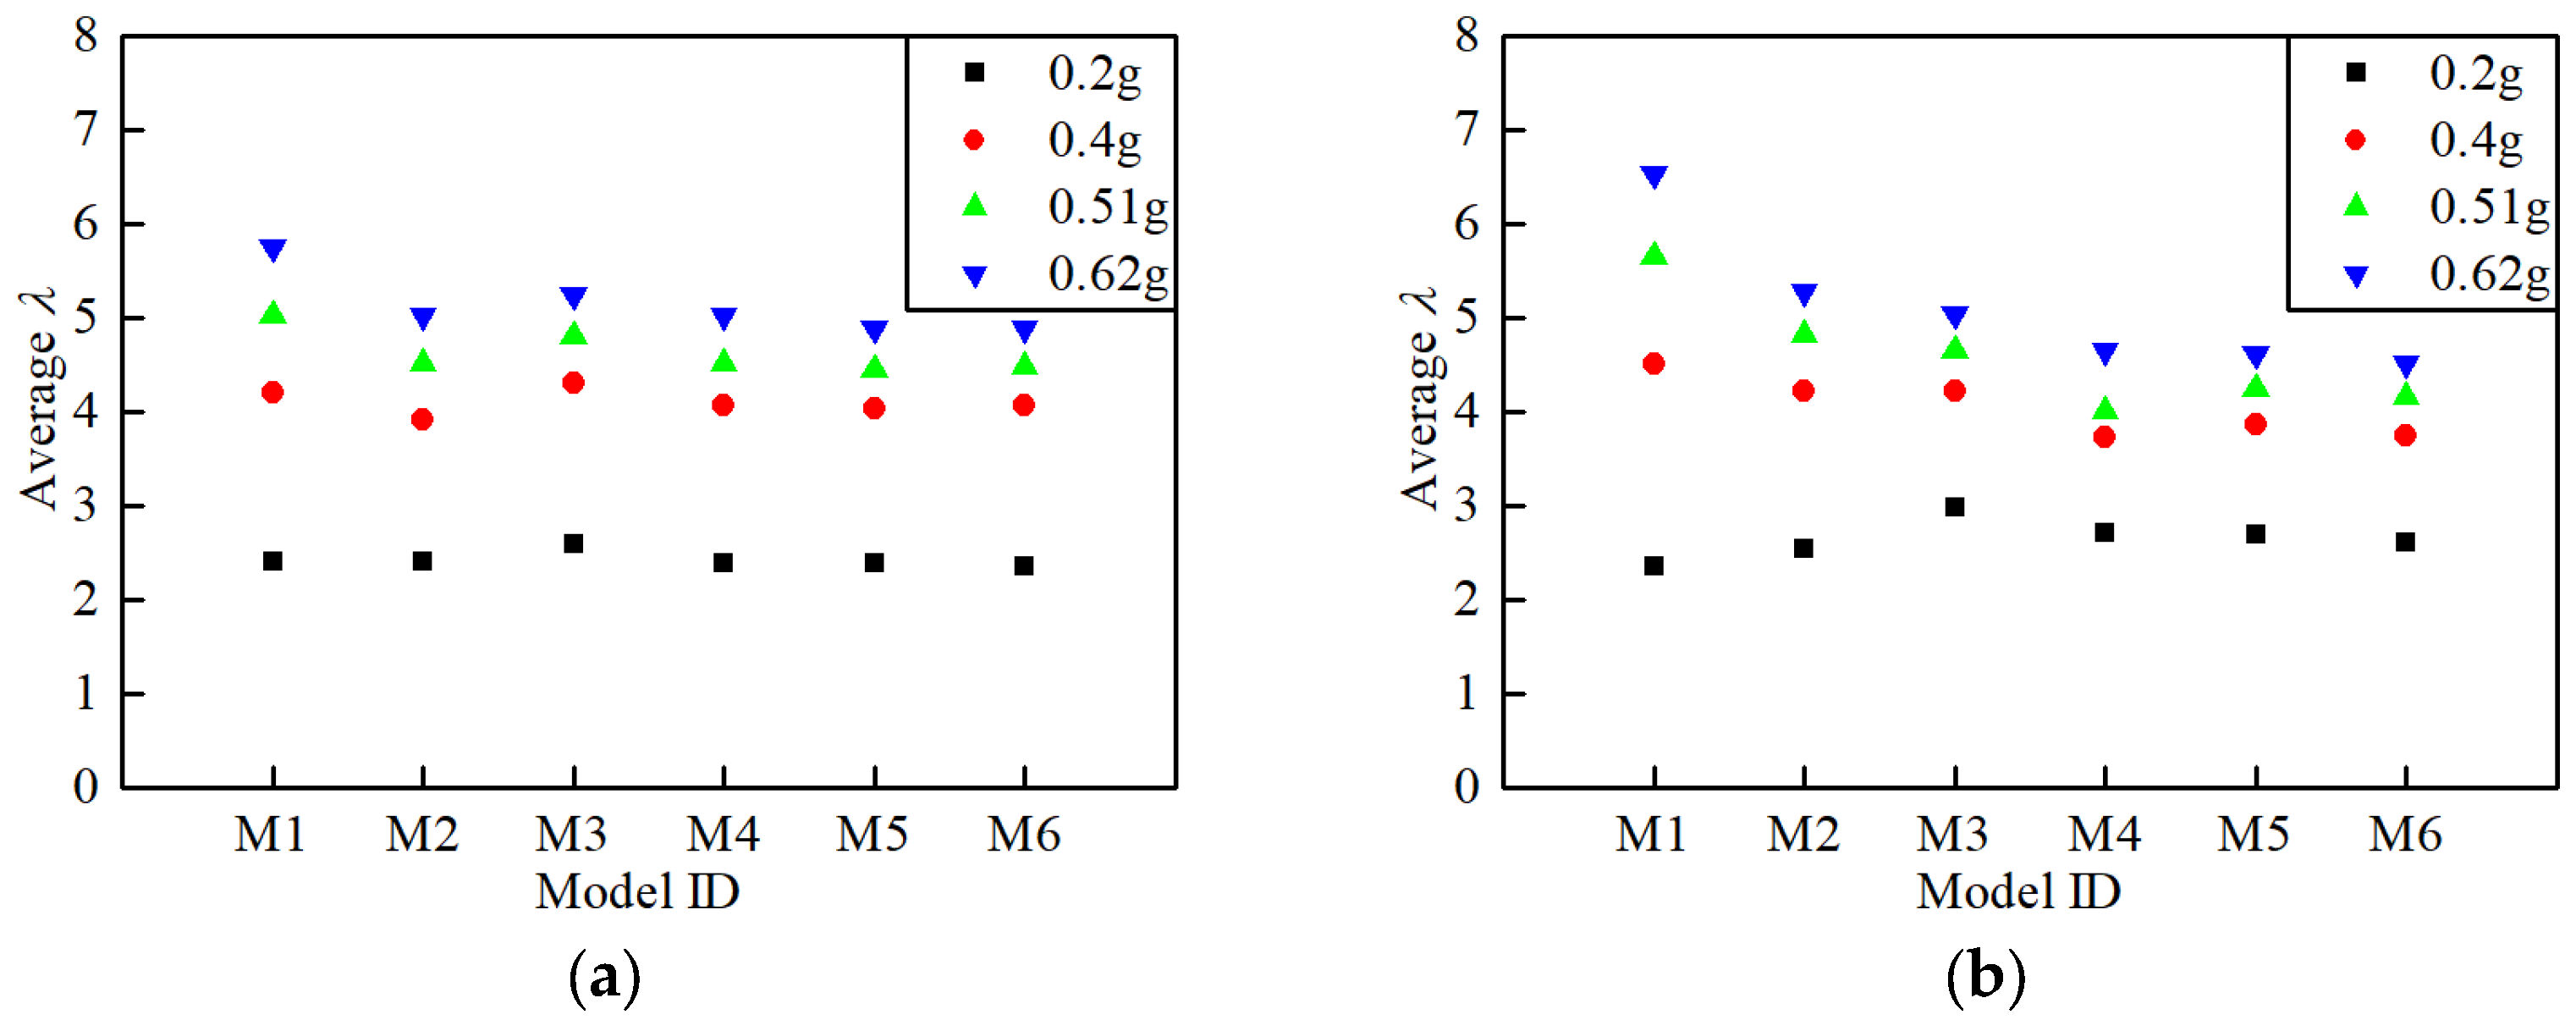
The average
of lower-embedding columns is presented in
Figure 13. It can be seen from
Figure 13 that as the
increases, the average
tends to decrease in both the horizontal directions with the same seismic intensity, indicating that the larger the lateral stiffness of the lower-embedding side members, the less significant the redistribution of base shear in both horizontal directions. Therefore, the less the lateral stiffness of the members at the lower-embedding side, the more necessary it is to consider the effect of this redistribution of base shear at different embedding ends. For a structure with a greater
, the degree of redistribution of the base shear is less obvious.
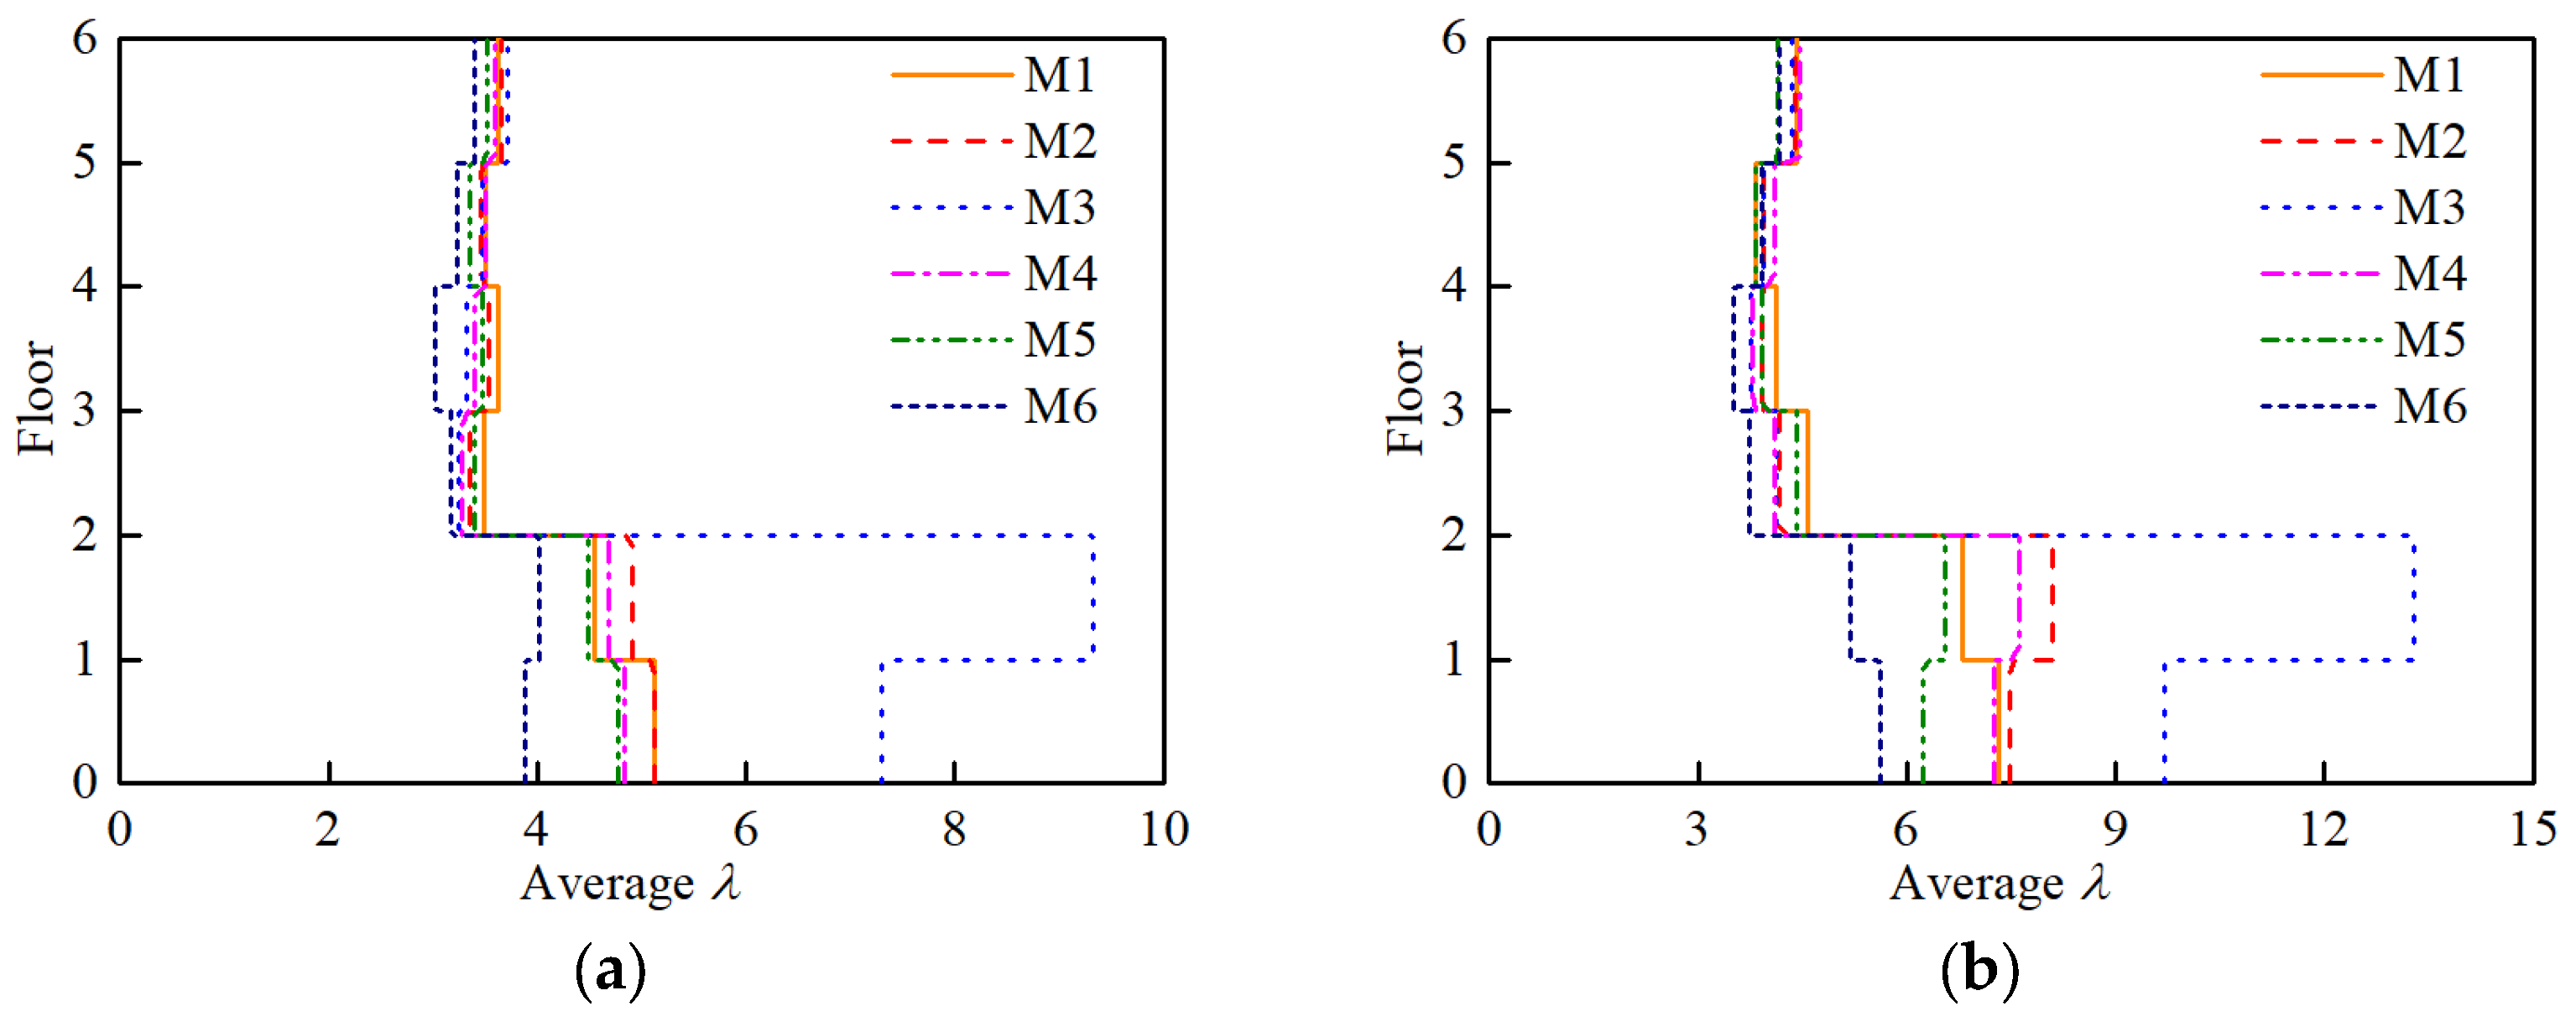
4.3.2. Story Shear
The average
of floors at
aPG,x of 0.4 g and 0.62 g are shown in
Figure 14 and
Figure 15, respectively. It is clear that the average
trends to increase in both horizontal directions as
aPG,x increases. Along the slope direction, for floors above the upper-embedding end, e.g., from the 3rd floor to the 6th floor, the average
is similar and is independent of the stiffness distribution of the upper-embedding story. For floors under the upper-embedding end, e.g., from the 1st floor to the 2nd floor, the average
is significantly different with an increasing-decreasing tendency with the increase in
. This indicates that the
on floors under the upper-embedding end tends to be stable with the increase in the lateral stiffness of elements at the lower-embedding side.
For the story shear across the slope direction, the distribution pattern of average on floors above the upper-embedding end is consistent with that along the slope direction, while the distribution pattern of average on floors under the upper-embedding end is different from that along the slope direction. At floors under the upper-embedding end, the average across the slope direction is obviously less than that along the slope direction with the same seismic intensity, and the average tends to decrease as increases. When increases to a certain extent, of floors under the upper embedding end is close to that of the floors above the upper embedding end.
4.3.3. Column Shear
The average
of columns at different axes from the 1st floor to the 4th floor at
aPG,x of 0.62 g is presented in
Table 7. The maximum average
of the lower-embedding columns is larger than that of the upper-embedding columns. For each model, the maximum average
of the upper-embedding columns along the slope direction is less than that across the slope direction. Meanwhile, the maximum average
of the upper-embedding columns decreases and then increases from model M1 to model M6.
The average
of columns at Axis 1 and Axis 2 on the 1st floor of models are shown in
Figure 16 and
Figure 17, respectively. As can be seen from
Figure 16, the average
of columns along the slope direction at different axes of the 1st floor tends to increase and then decrease with the increase in
at the same seismic intensity, which is consistent with the distribution of the average
of the 1st floor. And the average
of the column at axis 2 is greater than that of the column at axis 1. Meanwhile, the average
of column across the slope direction at different axes of the 1st floor tends to decrease with the increase in
at the same seismic intensity, and the decreasing trend is more obvious at axis 2.
When the stiffness distribution of the upper-embedding story changes, the redistribution of shear force of base, story, and column are different. With the increase in , the of lower embedding-columns tends to decrease significantly along the slope direction, while the of floors under the upper-embedding end and the column on the 1st floor both first increase and then decrease. This is because the base shear is borne by upper- and lower- embedding columns, while the story shear of floors under the upper-embedding end and shear of columns on the 1st floor are mainly related to lower-embedding columns. The shear redistribution at different floors is detrimental to the seismic resistance of the structure, and the most significant degree of shear redistribution at different floors occurs when increases to a certain degree.
4.4. Distribution and Development of Plastic Hinges
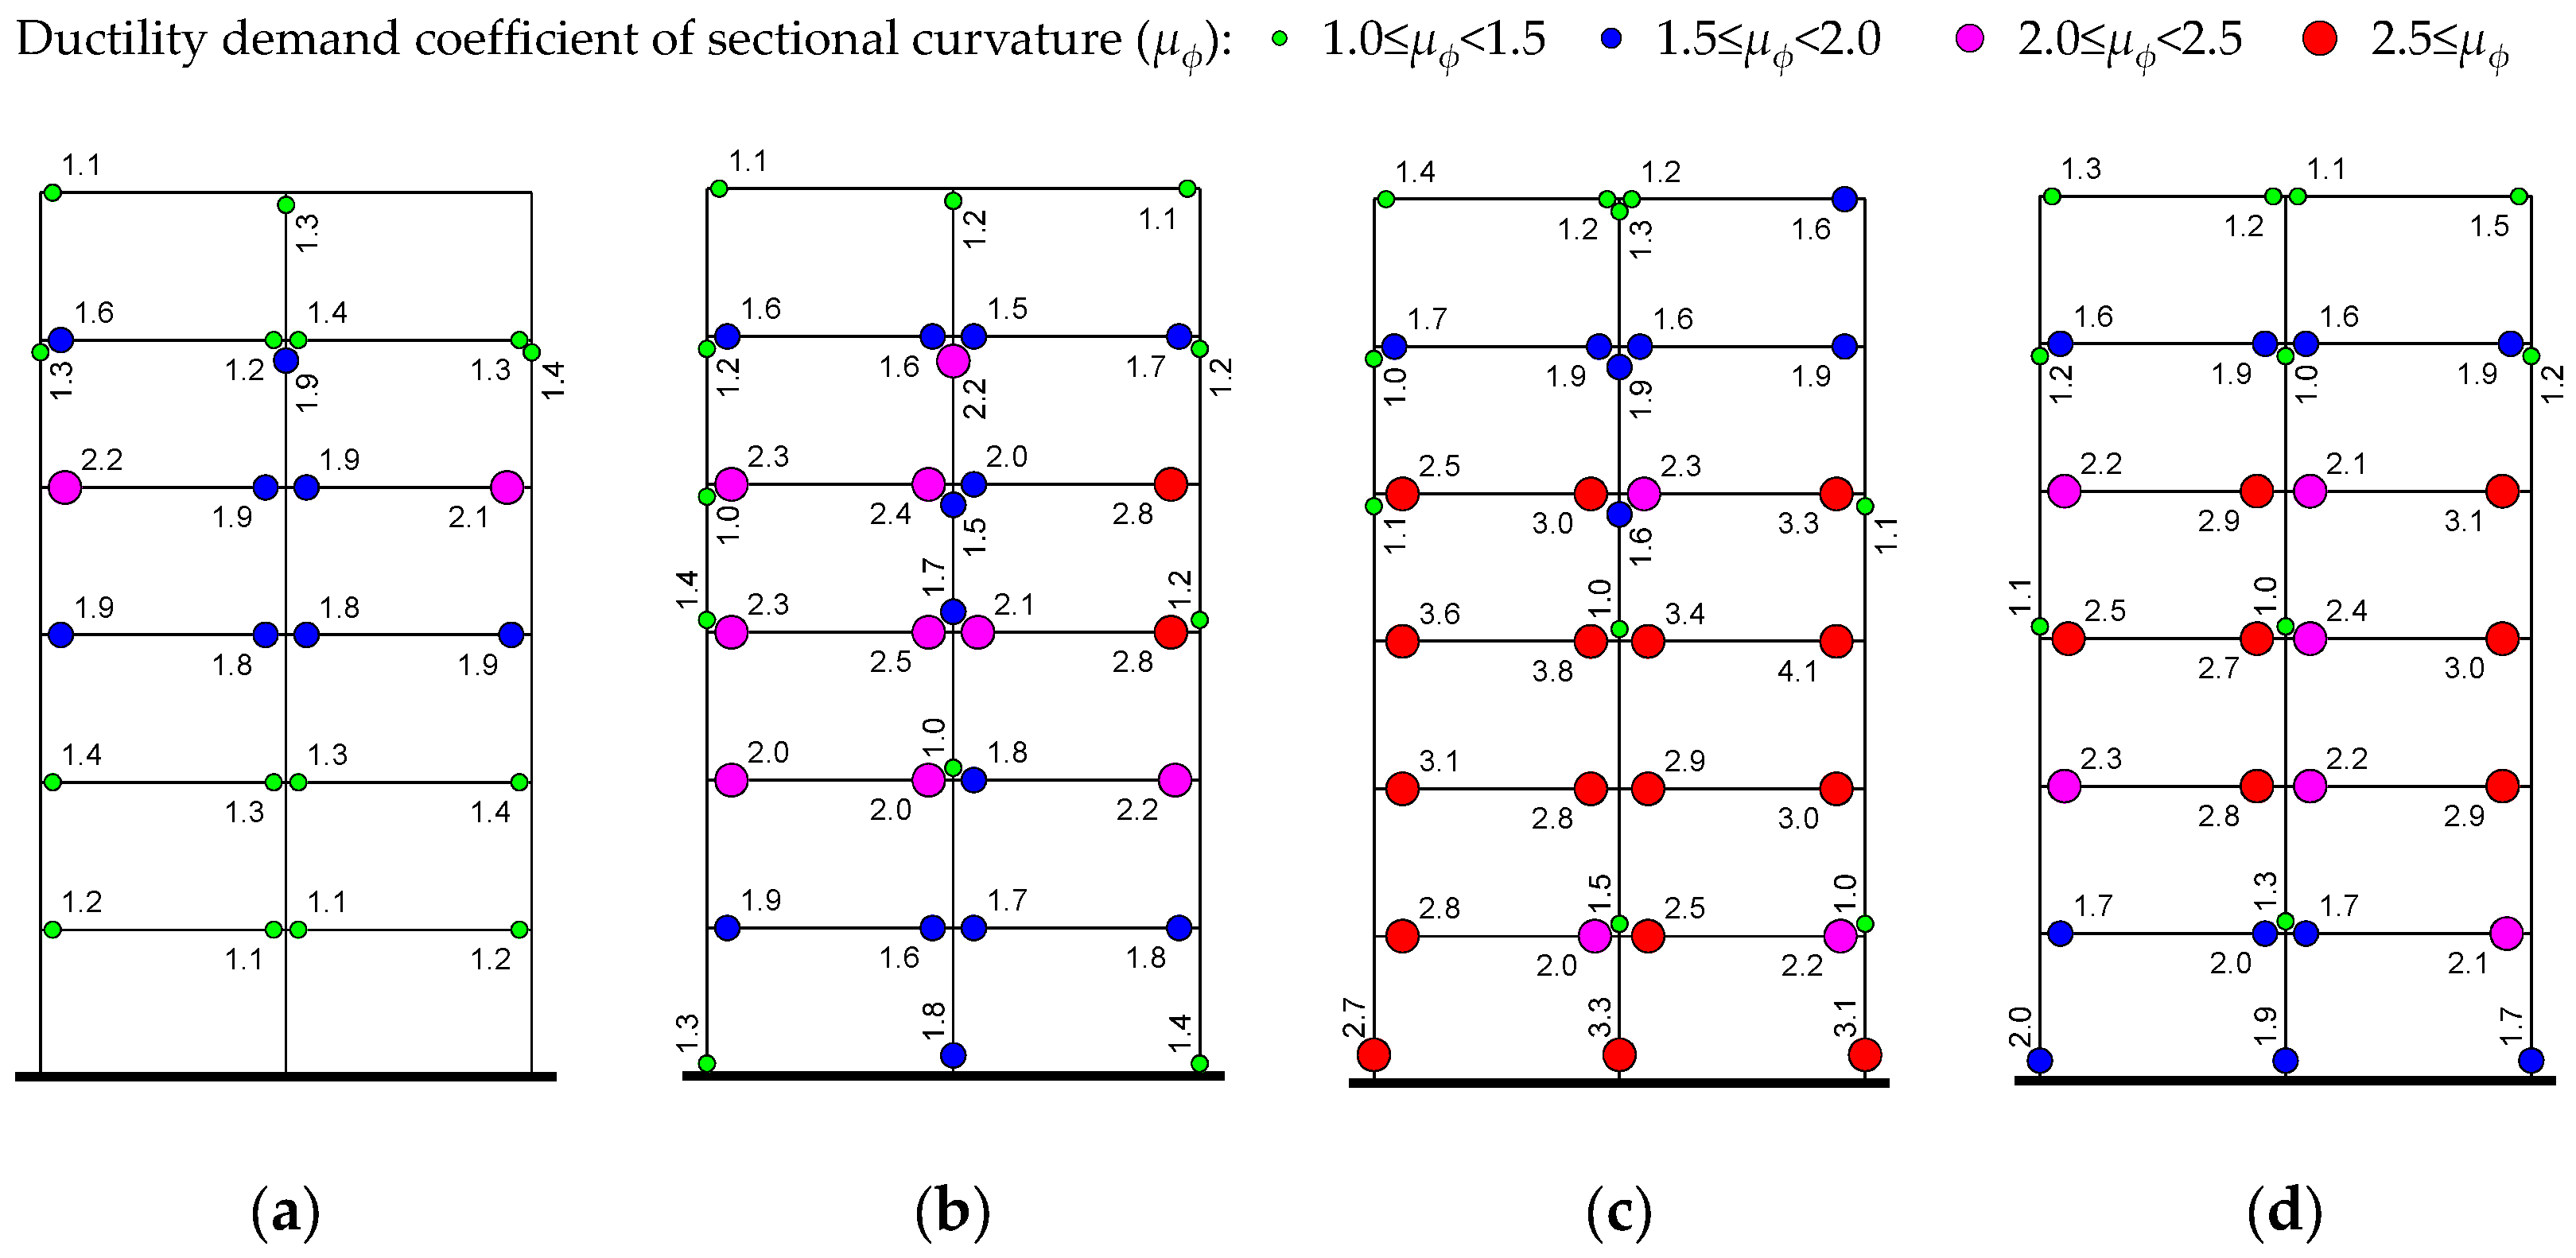
The distribution of the plastic hinge of the single-frame at Axis B under seismic action of the artificial wave with the intensity of 0.62 g is shown in
Figure 18.
For structure models M1, M2, M3, and M6 with different geometric arrangements, the larger the , the more severe the damage to the upper-embedding column. When the is small, the number and degree of plastic hinges at the end of columns on the 4th to 5th floor are relatively large, and the damage of structural members is relatively uniform. However, when the is relatively large, the damage of the upper-embedding column is more severe than that of other members, and the damage is concentrated.
For the structure models M3, M4, and M5 with the same geometric arrangement, the sections of elements in the upper-embedding story and floors under the upper-embedding end are adjusted to obtain different . Meanwhile, the sections of columns at Axis 1, 2, 3, and 4 on the 4th floor in models M4 and M5 are reduced compared with columns at the same positions on the upper-embedding story. The D-value method is used to calculate the lateral stiffness of the members, and the lateral stiffness ratio of non-embedding columns in the upper-embedding story to the corresponding members in the adjacent upper story is defined as the corresponding stiffness ratio , whose values are 0.94, 1.14 and 1.33 for the three structures, respectively. Comparing the plastic hinge of these three structures, it can be seen that increasing the lateral stiffness of floors under the upper-embedding end and non-embedding columns makes increase, while the increases, the degree of plastic hinge of the upper-embedding column weakens, the damage degree of columns adjacent above the non-embedding column increases, and the damage at floors above the upper-embedding end is aggravated. When the stiffness of non-embedding members and floors under the upper-embedding end is enhanced, the damage of the upper-embedding column is mitigated, and the structural damage is transferred to the upper floors, which is contrary to the law of structures with different geometric arrangements. This also indicates that the damage to the upper-embedding column is related to the relative stiffness of non-embedding columns and the corresponding member in the adjacent upper story.
The influence factor of plastic hinge degree is complex. When
increases with increasing elements at the lower-embedding side and reducing elements at the upper-embedding side, damage tends to be formed in the upper-embedding column. When
increases with the increasing lateral stiffness of non-embedding columns and elements on floors under the upper-embedding end, the damage of upper-embedding columns is weakened, and the damage of columns on upper floors is aggravated. When
is relatively large, the damage forms in upper-embedding columns and the connected beams. Therefore, some measures can be taken to improve the drift ductility of the upper-embedding column, such as setting the upper-embedding column as a highly ductile fiber-reinforced concrete column [
33] or a steel column, or reducing the drift ductility requirement, such as weakening the degree of restraint at the bottom to enhance safety.
The plastic hinge across the slope direction varies considerably for structures with different
. The plastic hinge distribution of the single-frame at Axis 1 is shown in
Figure 19. It can be seen that the degree of the plastic hinge of the single-frame is: model M1 < model M2 < model M6 < model M3, which is consistent with the eccentricity ratio
of models. This shows that the damage degree of the frame at the lower-embedding side is significantly influenced by the torsion effect as the greater the torsion effect, the more severe the damage to the frame across the slope direction of the structure.
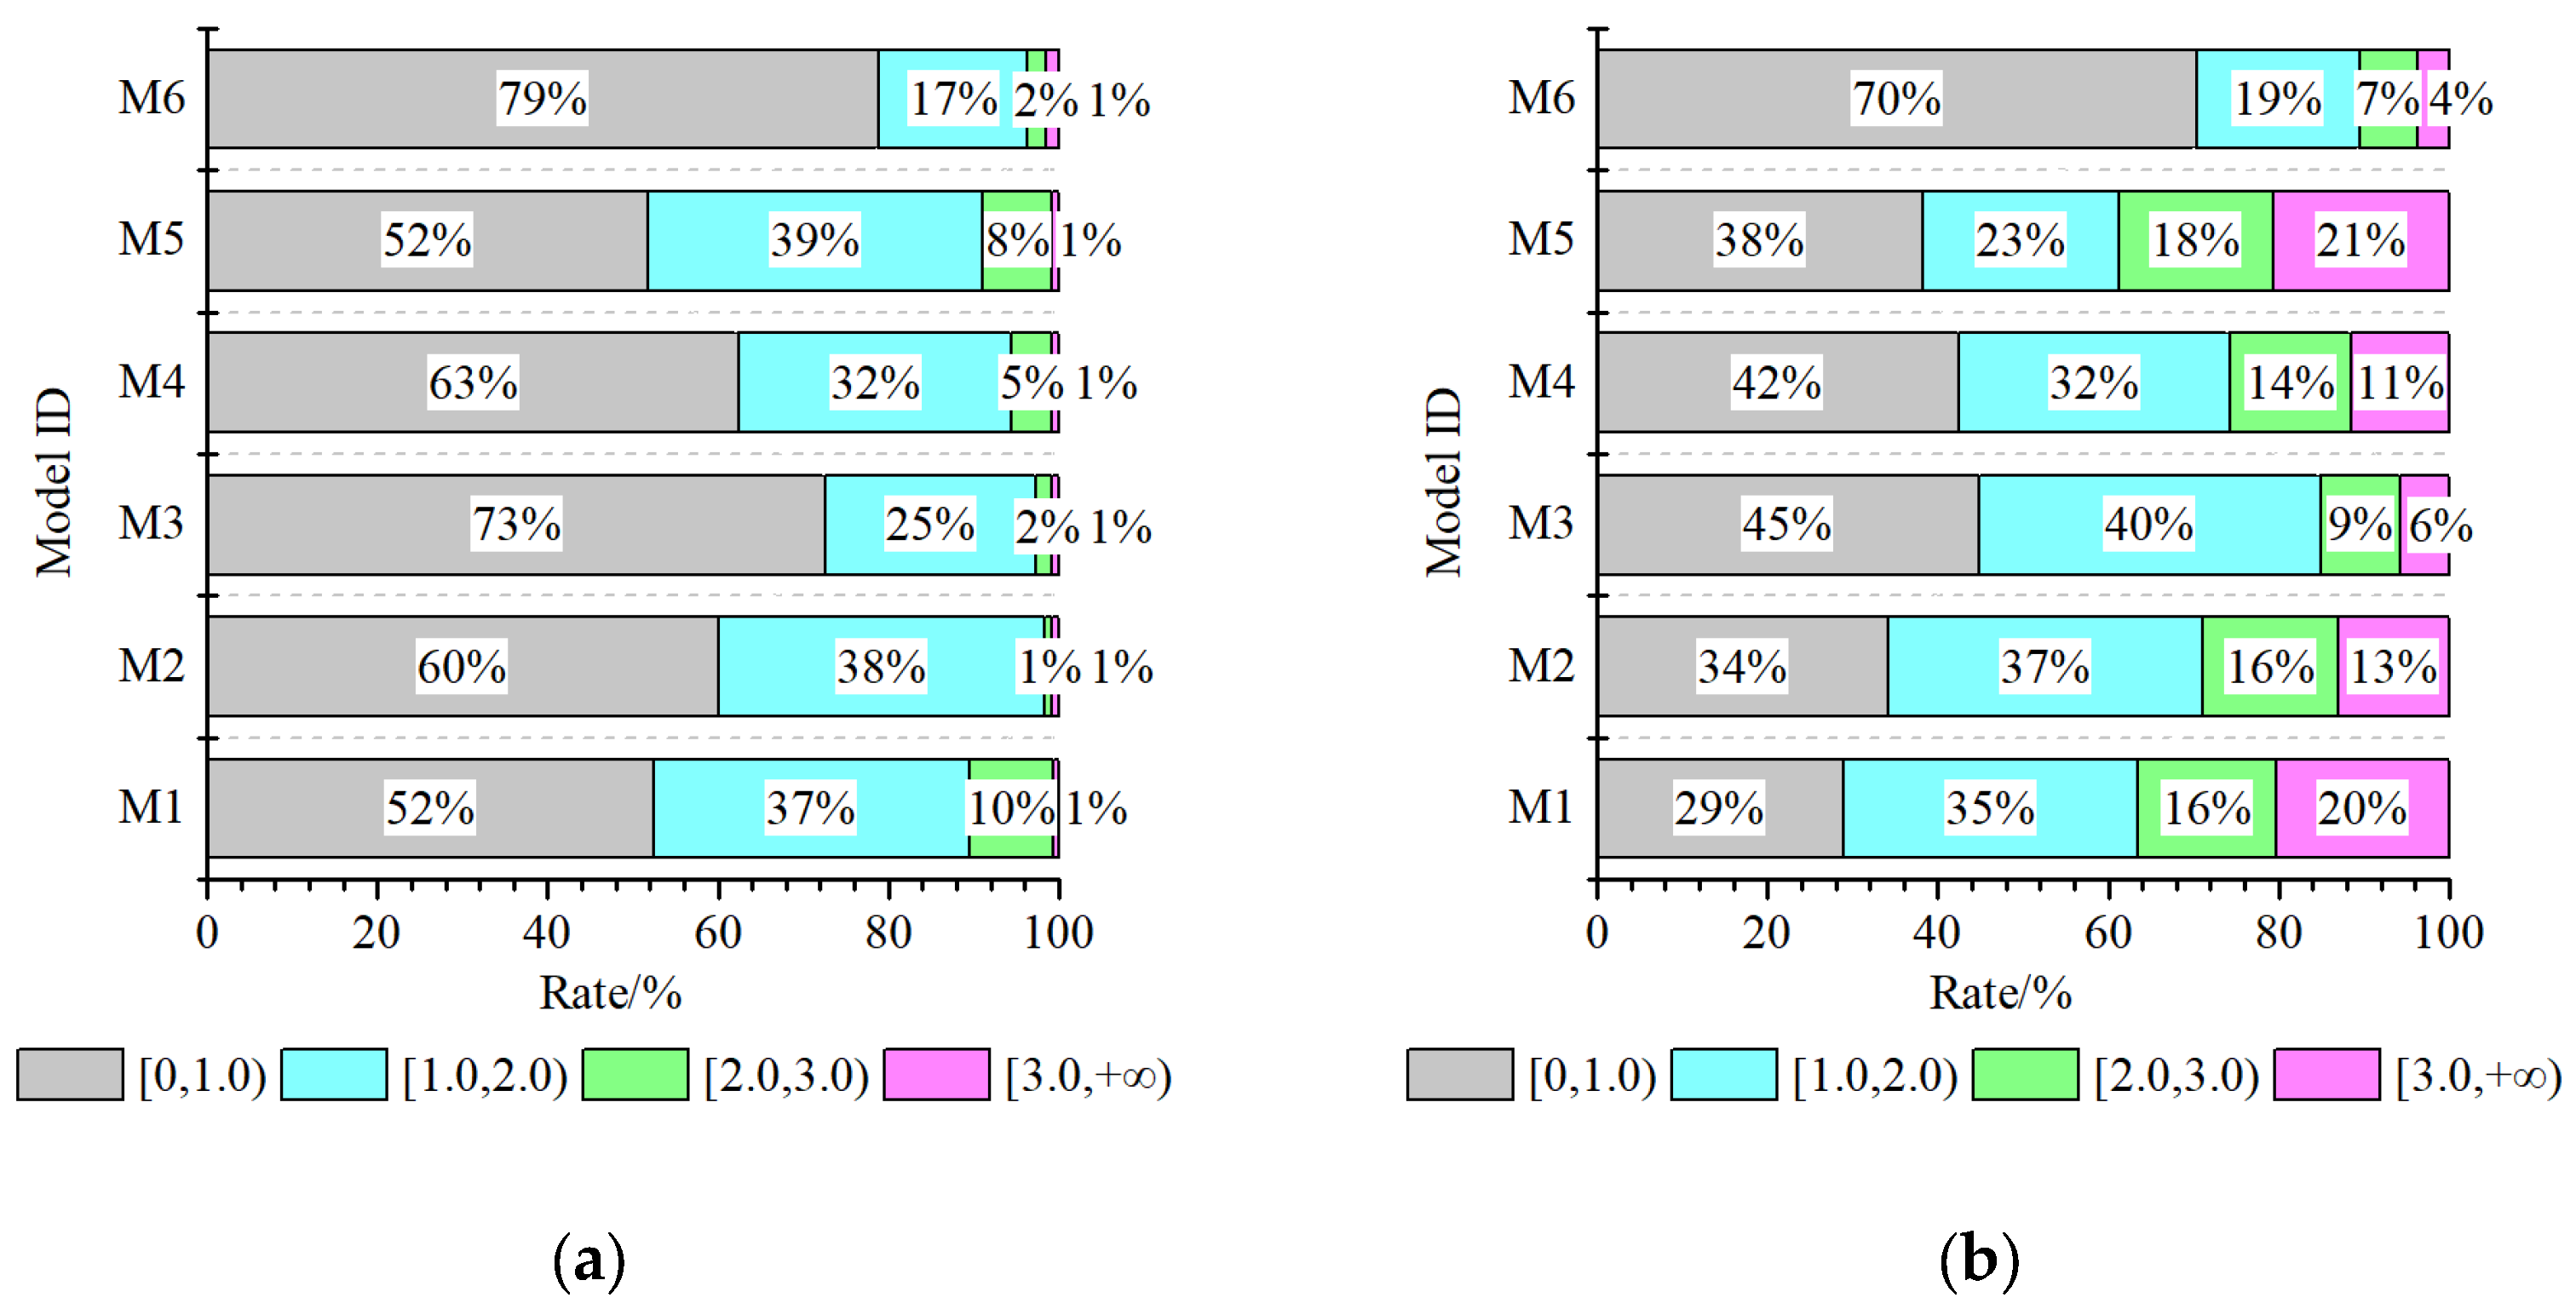
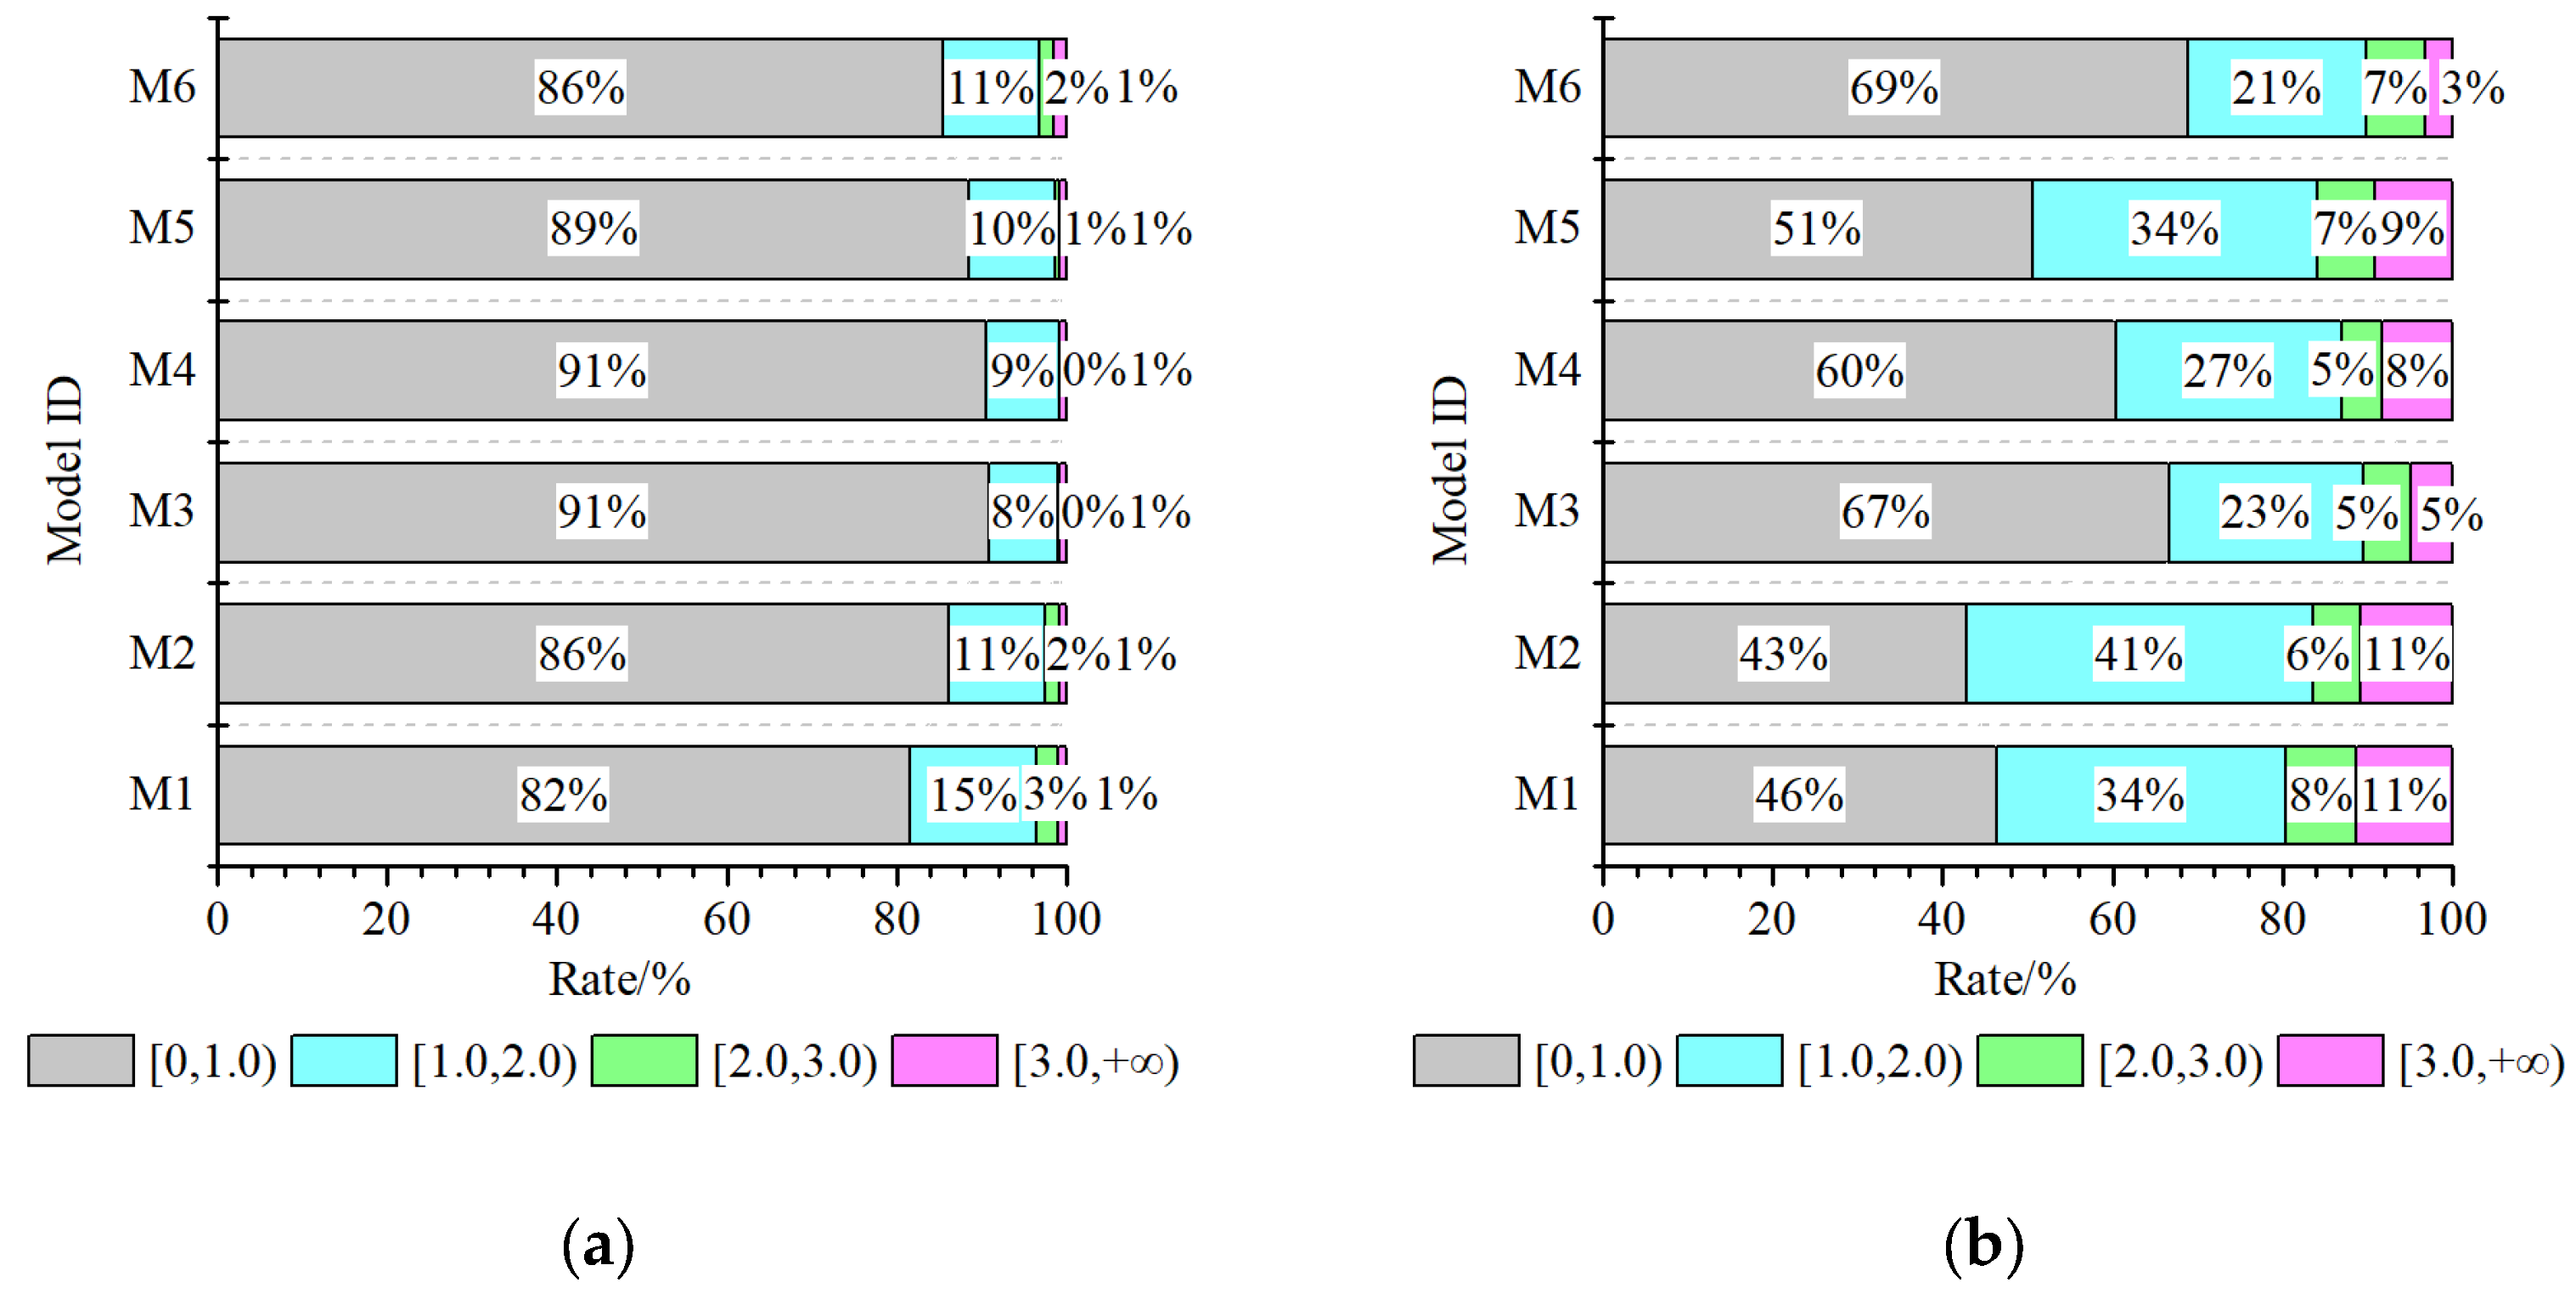
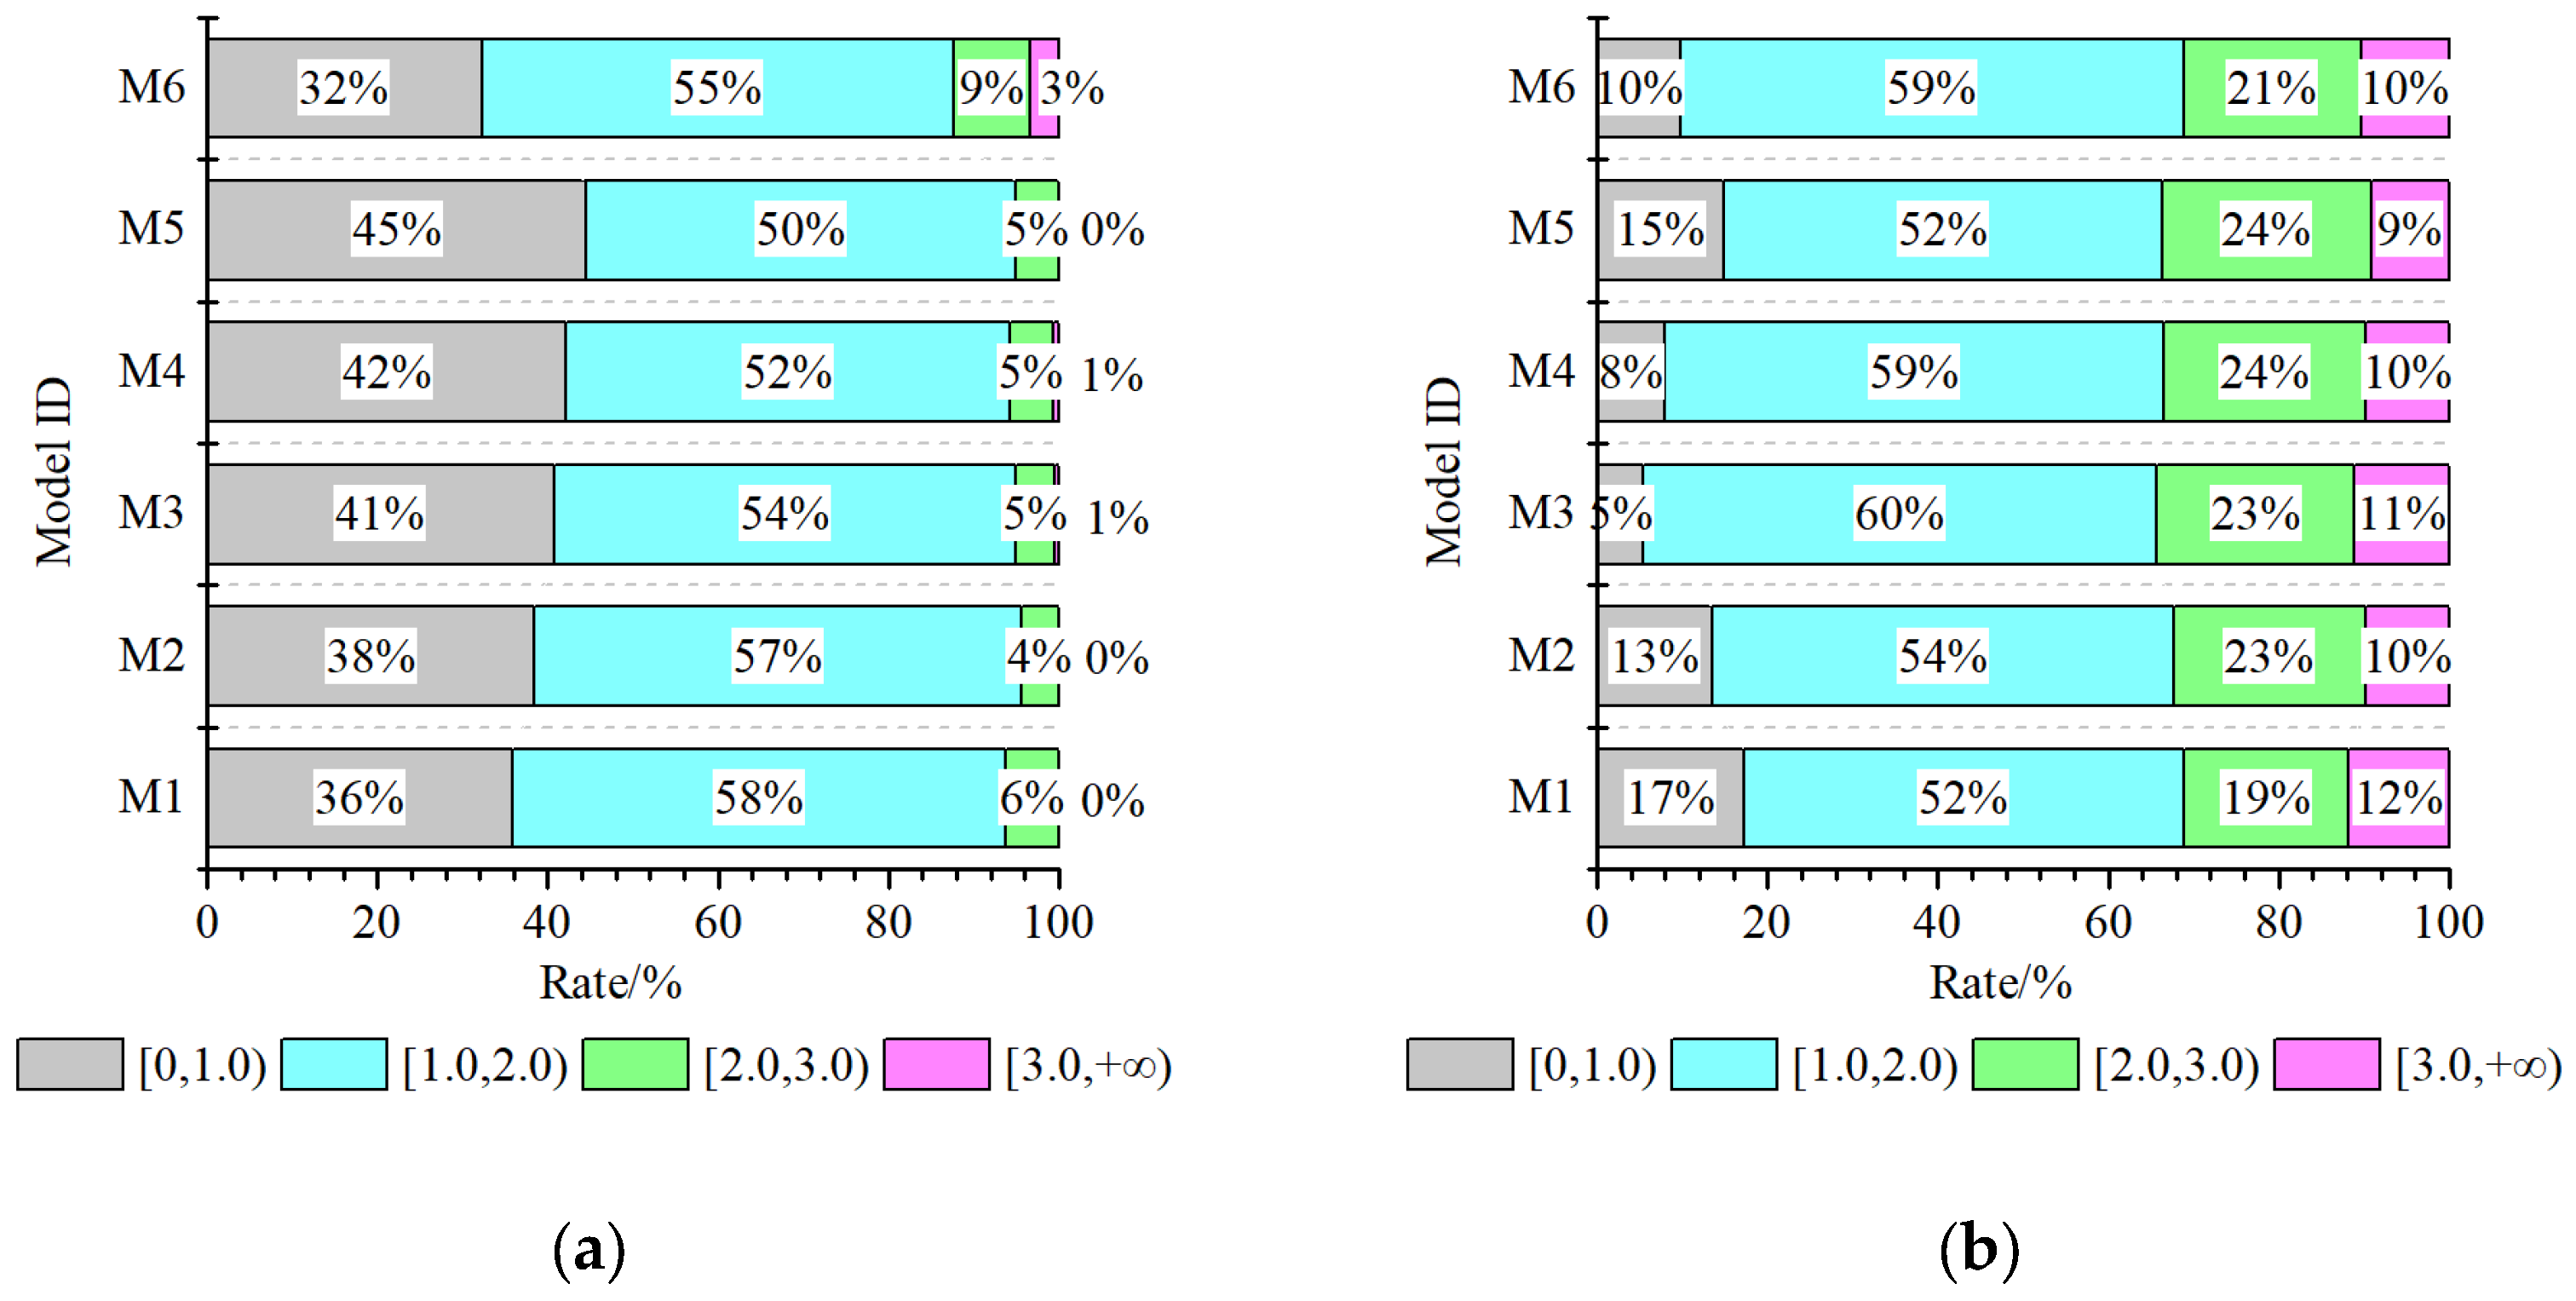
The hinge rates of the beams and columns continue to increase with increasing seismic intensity. The average hinge rates for the model beams and columns at different levels under 0.4 g and 0.62 g seismic action are shown in
Figure 20,
Figure 21 and
Figure 22. For structure models M1, M2, M3 and M6 with different geometric arrangements, as
increases, the average hinge rate along the slope direction of the column decreases significantly, and the rate of
in the range of [3.0, +∞) decreases. However, for structure models M3, M4, and M5 with the same geometric arrangement, the average hinge rate along the slope direction of the column gradually increases with the increasing
, and the rate of
reaches [3.0, +∞) increases, which is consistent with the opposite distribution pattern of the plastic hinge as depicted above. The distribution of hinge rate across the slope direction of the column has a noticeable change with increasing seismic intensity. The relationship between the distribution of column hinge rate across the slope direction and the variation of
and
is not apparent when the seismic intensity is 0.4 g. Under the earthquake intensity of 0.62 g, the variation law of the column hinge rate across the slope direction is similar to that along the slope direction, but the rate of
reaching [3.0, +∞] is smaller than that along the slope direction. For beams, the average hinge rate tends to decrease and then increase with increasing
under the earthquake action of 0.4 g. As the seismic intensity increases to 0.62 g, the pattern of the average hinge rate at the beam end changes, increasing and then decreasing with the increasing
, but the rate of
reaching [3.0, +∞) is closer.
5. Conclusions
The seismic response of the MBS differs from that of ordinary structures, and the former suffers from severe torsional effects. While most previous studies focus on the seismic failure mechanism of the plan along the slope direction and its final damage state, the research on the structural force is simple. In this paper, the time history analysis of three-dimensional MBSs was conducted, considering the torsional effects. The internal force and plastic hinge of the MBSs were concerned, including the redistribution of the shear force of the base, story, and column, and the distribution and development of the plastic hinges. Also, the nominal intra-story stiffness ratio was proposed as a parameter to study its influence on the redistribution of internal forces and the development of plastic hinges. Conclusions can be drawn as follows:
- (a)
The redistribution of the base shear of MBS was evident at different embedding ends, and the redistribution of story shear at different floors also took place. The changes in of the columns at Axis 1 and Axis 2 are different from those at Axis 3 and Axis 4 on the upper-embedding story and the adjacent upper floor, and the of columns on the 1st floor is greater than that of the adjacent upper story. Moreover, the change tend of of the MBS is more prominent along the slope direction.
- (b)
On the damage path of MBS, the damage has been transferred from the floors above the upper-embedding end to the floors under the upper-embedding end, where the elements of the floors above the upper-embedding end were the most heavily damaged. Additionally, the damage in both the upper-embedding story and the adjacent upper story are unevenly distributed, and the heavily-damaged columns are in opposite positions. The torsional effect makes the lower-embedding column more prone to hinge across the slope direction.
- (c)
When is 0.9, and the number of floors under the upper-embedding end is 2, the redistributions of the shear force of the base, story, and column vary with . A larger would result in a weaker redistribution of the base shear in both two horizontal directions. With the increase in , the redistribution of the story shear along the slope direction at the floors under the upper-embedding end tends to be enhanced and then weakened, where the redistribution was the most serious when was 0.4. For single-frames across the slope direction, the redistribution of the story shear at the floors under the upper-embedding end tends to be weakened as increases. The of columns on the 1st floor is consistent with the distribution of the of the 1st floor. Therefore, the redistribution of the internal force of MBS should be considered in practical seismic design.
- (d)
The forming of the plastic hinge of single-frames along the slope direction is related to and . When increases and is constant, the damage tends to concentrate on the upper-embedding columns. When increases with the increase in , the damage of the upper-embedding column is weakened, and the damage of columns on the upper floors is enhanced. The damage degree of single-frames across the slope direction is significantly influenced by the torsional effect.
- (e)
The load-bearing capacity and drift ductility of the upper-embedding columns should be improved to avoid serious damage under earthquakes, and the upper-embedding column could be set as a highly ductile fiber-reinforced concrete column or a steel column. The shear bearing capacity of the vertical members of floors under the upper-embedding end can be increased to bear the increased shear force.
There are also some limitations in this study, such as the number of floors under and above the upper-embedding end, the stiffness ratio of floors under the upper-embedding end to the upper-embedding story is taken as constant values, and the effect of the stiffness ratio of the upper-embedding story to the adjacent upper story is not considered. Further research could be conducted into the influence of these factors.


