Abstract
Construction can be analyzed at industry, firm, project, and activity/task levels. Given that there are differences between the concepts of productivity and uses of productivity data, depending on the level of analysis, there is no single meaning of construction productivity, except of an output/input ratio. Furthermore, there is little knowledge in the extant literature about steel structure productivity, sustainability, and risks. Moreover, through the investigation of the grey literature, i.e., the national or European reports on construction productivity, the indexes given are at aggregate levels. This paper aims to fill this gap and provide a holistic approach to the levels of productivity, sustainability, and the risks involved in the construction process in several steel structure types from similar projects constructed by a company that has operated within the field of steel structures for several decades. From a homogeneous database of 71 steel structure projects constructed in the last decade, several curves are derived concerning productivity per work phase. For this research, productivity is construed as a ratio of output/(cycle time). Through a literature review and interviews with experienced site engineers, a risk registry was compiled by the authors concerning sixteen (16) risks encountered in the construction process. The TOPSIS multi-criteria analysis program is used for the prioritization of risks and the @RISK program for the probabilistic cost analysis of the identified risks.
1. Introduction
The construction sector has often been berated for its low productivity [1]. Remarkably, McKinsey research [2] reveals that about USD 10 trillion is spent on construction-related goods and services every year but the sector’s annual productivity growth has only increased 1% over the past twenty years. Higher productivity could create USD 1.6 trillion of additional value added, meeting half the world’s infrastructure need. Studies that collect and analyze quantitative data regarding productivity are very important for both firms in the construction industry and government policies. Through the investigation of the grey literature, such as European financial reports or OECD reports on construction productivity, the indexes given are at aggregate levels [3,4]. The construction sector is highly fragmented; therefore, studies that investigate each sector’s productivity are of utmost importance in order to investigate labor productivity in conjunction with construction methods and the related risks.
There is little knowledge in the extant literature about steel structure productivity, sustainability, and risks. Although the literature is rich in research concerning general productivity in the construction sector and models for the analysis and estimation of this measure [5,6,7,8,9], there is a paucity of studies referring to steel structure construction productivity as a ratio of output/(cycle time). Furthermore, risk identification is a tedious task that presupposes a rich registry followed by an in-depth analysis in order to estimate the cost of a sustainable solution or the cost of resilience. This study’s contribution, using a large homogeneous database of 71 steel structure projects (Appendix A), aims to fill this gap by providing a holistic approach to productivity at the project level and per work phase, and the associated risks. This objective is accomplished by developing: (i) curves of productivity for different steel structures at the work phase level, (ii) a risk registry through a literature review and interviews with experience engineers in the field, (iii) an analytical hierarchy list of the identified risks using the TOPSIS multi-criteria analysis program, and (iv) cost quantification reports of these risks through their analysis with @RISK.
2. Literature Review
A literature review plays a very important role in research because it helps in collecting and consolidating the existing information of the specific field under investigation and in identifying gaps [10]. Searching of peer-reviewed articles was performed using the Web of Science (WoS) Core Collection and Scopus bibliographic databases, which are the two most widely accepted and well-recognized databases for high quality literature reviews [11]. Furthermore, the authors extended their research into EU, OECD, and national databases to identify non-peer-reviewed “grey literature”, such as government, national, and international reports and guides. The time span was set as 2000–2023.
Our research found that no articles were published dealing with construction productivity issues or the related organizational risks of steel structures. In 2015, Naoum [12] conducted a literature review of productivity in construction sites covering a period of 1970–2014, with a total number of 119 productivity-related articles and reports. Their results give no information regarding the type of projects investigated; their approach is more descriptive since it is focused on the factors affecting productivity on sites without giving any quantifiable indexes.
More recently, Dixit et al. [13] attempted to summarize the evolution of research in construction productivity using a systematic literature review from papers published from 2006 to 2017. Their research analyzed 101 papers. In their study, factors and attributes affecting productivity were presented and seven main areas of development in construction productivity were identified, namely, tools and consumables, coordination, drawing management, material availability, labor skills, training, and rework. Nevertheless, in their research there was no classification in terms of the type of projects investigated and no metrics were given regarding productivity.
Teizer et al. [14] investigated the training methods in order to increase productivity of ironworkers employed in the construction of steel structures. They proposed a remote data sensing and visualization technology in order to capture the sequence of works of workers involved in steel structure construction. They identified productivity and safety issues that workers or trainees might not be aware of in their natural work environment. No data were provided on productivity and their sample included the erection of steel girders.
In 2019 Liew et al. [15] proposed a steel concrete composite system for modular construction of high-rise buildings compared to conventional construction methods to increase productivity and thus decrease labor costs. Their research investigated methods of modular construction and provided a stepwise methodology for high-rise buildings to improve productivity and safety, and reduce cost, manpower, and wastage on site.
The construction industry, including its productivity, is one of the most significant sectors that supports the economic development of a country. Specifically, the construction sector is the engine of growth for a country since it creates a flow of services and goods with other sectors [2,3]. Therefore, every attempt to provide consolidated indexes of productivity is very important since it can help public organizations and companies to accurately estimate time and cost, and to search for methods for the improvement of these metrics. This research attempted to fill the gap in the literature and provide, for the first time, specific indexes of productivity for steel structures of ten different types of projects, with eight phases of construction for each type, and the organization risks related to these projects.
3. Materials and Methods
3.1. Productivity in Steel Structures
Every construction project is made up of a sequence of unique, complex, and interrelated activities aimed at achieving a specific technical purpose within the constraints of cost, time, and the quality specifications required [16].
These activities can be grouped into the following basic phases in steel structures:
Various Steel Tasks include packing, measuring, transporting the materials on site, loading and unloading the materials, and foundation construction.
A registry was developed with 71 projects (Figure 1).

Figure 1.
(a) Airport, (b) roof canopy, (c) pedestrian bridge, (d) bridge railing.
Productivity was recorded for each basic phase (Table 1) for each type of steel structure (Table 2), and finally per employee, according to Equation (1):
where:

Table 1.
Basic phases of steel structures.
Table 2.
Main types of steel structures.
- (kg/h)i.j.: Kilograms per hour of each project for each one of the basic phases of steel structures.
- kgi.j.: Kilograms of each project for each one of the basic phases of steel structures.
- hi.j.: Hours of each project for each one of the basic phases of steel structures.
- i: projects.
- j: the basic phases of steel structures.
Steel Structures are divided into two basic weight categories. These are the beam weight and the sheet metal weight; the sum of these two constitutes the total weight.
3.2. Risk Analysis in Steel Structures
Risk is defined as follows [17]:
ISO 31000 recognizes that everybody operates in an uncertain world. Whenever a goal is established, there is always the possibility that things will not go according to the plan. Each step has a risk element that needs to be addressed and every result is uncertain.
According to ISO 31000, “The risk is the” effect of the uncertainty on the Company’s objectives, “resulting in a negative deviation from what is expected or positive due to the timely and effective action of Risk Management.”
This problem is further enhanced when construction projects are involved. The dynamic environment of construction projects imposes an even greater necessity for the early estimation of any possible risks in order to reassure the successful delivery of the project. The risks associated with steel projects were investigated through interviews with the project managers and superintendents of the 71 steel projects under analysis. Table 3 summarizes the most common risks that were highlighted by the construction experts.
Table 3.
Risk register.
A two-step approach was followed to analyze the identified risks. To do this, @Risk software (version 7.0, Denver, CO, USA) was used for the quantitative analysis of risks and the TOPISIS multicriteria analysis program was used to prioritize risks.
Based on PMI 2000 [18], all risks can be grouped according to their probability of risk occurrence and their consequence. For all the identified risks, a probability of occurrence and the consequence probability in monetary values were set. Furthermore, in order to prioritize these risks, the Entropy-TOPSIS methodology was used, as analytically described below [19,20].
To perform the analysis through the @Risk program, the following steps were followed:
Step 1
For each risk determined in the risk register table, an estimated probability of occurrence and the occurrence consequence in monetary values were defined.
Step 2
The probabilities of occurrence, which usually have a discrete distribution, were defined and a continuous distribution for the consequence was also determined in this step.
Step 3
The outcome of these two distributions, namely, the “consequence” and the “number of risk occurrence”, yields the level of importance of each risk.
Step 4
Using Monte Carlo simulation, a number of simulations were performed (for this research the number of iterations was set to 5000) in order to export probability distributions for the consequences and the number of occurrences.
Further to the analysis, to implement the TOPSIS method, three parameters were used. These were probability (P), severity (S), and vulnerability (V). Vulnerability is described as the intrinsic properties of a system that make it susceptible to a risk source that can lead to an event with a consequence [19,21]. All three parameters are expressed on a scale from 1 to 9; for example, 1 stands for “occurrence probability out of risk very low”, whereas 9 stands for “occurrence probability of risk very high” [20].
Through interviews with the project managers of each of the 71 projects, a risk register (Table 4) encompassing the values (P), (S), (V) was produced.
Table 4.
Risk—risk register table with values P, S, and V.
The entropy method [19,20] was used to apply weights for each value as analytically described below:
First the table is normalized:
The entropy is then calculated:
where j = 1, 2, …, n, and
where m is the number of alternatives.
The weight is then calculated:
where:
- xij: Decision table entries
- rij: Normalized value
- ej: Entropy
- h: Value depending on the number of alternatives
- wj: Weight of each criterion
- m: Number of alternatives
After the weights were attributed to each risk, the TOPSIS method was used to rank the risks (Table 4, last column) by applying the following formulas:
Then multiplication was performed with the weight of each criterion:
Then, the best scenario Vj+ and the worst scenario Vj−, were found from Vij.
Si+ and Si− were then calculated through the mathematical formulas:
So the result of each criterion is equal to:
The percentage of each criterion can then be calculated through the mathematical formula:
Finally, the risks are prioritized in descending order from the highest to the lowest p value, where:
- x_ij: Normalized matrix values
- Vij: Weighted normalized matrix values
- Vi+: Ideally better value than alternatives
- Vi−: Ideally worse value than alternatives
- Si+: Euclidean distance from ideal best value
- Si−: Euclidean distance from ideal worst value
- Pi: Result of each criterion
- Pi(%): Percentage of each criterion
4. Results and Discussion
4.1. Productivity in Steel Structures
Table 5 summarizes the productivity per main task and main project type from the 71 steel structure projects; as noted in Section 3.1, the productivity is given per employee.
Table 5.
Productivity—Summary table of productivity by work phase for each project type.
The following remarks can be made:
- The most productive project type for the Design phase is Hospital, at 990 kg/h, while the least productive project type for the Design phase is Residence—Rooms for Rent, at 257 kg/h.
- For the Cutting Long Beams phase, Airport exhibits the highest productivity, at 425 kg/h, while the least productive project type for the basic Cutting Long Beams phase is Bridge Railing, at 64 kg/h.
- For the Cutting Forming Sheets phase, Mezzanine is the most productive, at 57 kg/h, while the least productive project type is Bridge Railing, at 18 kg/h.
- The most productive project type for the basic Montage (Assembly) phase is Business Center, at 428 kg/h, while the least productive project type is Pedestrian Bridge, at 115 kg/h.
- For the Welding phase, Business Center is the most productive project, at 296 kg/h, while the least productive project type is Footbridge, at 89 kg/h.
- For the basic Paint phase, Mezzanine presents the highest productivity, at 512 kg/h, while the least productive project type for the basic Paint phase is Pedestrian Bridge, at 204 kg/h.
- For the basic Erection phase, Hospital is the most productive project, at 212 kg/h, while the least productive project type is Bridge Railing, at 44 kg/h.
- For the basic Various Steel Tasks phase, Airport is the most productive project, at 1545 kg/h, while the least productive project type is Bridge Railing, at 138 kg/h.
- The average productivity of all types of projects and phases is 378 kg/h.
- Overall, the least productive type of project on average is Pedestrian Bridge, at 173 kg/h.
- Finally, the most productive type of project on average is Airport, at 528 kg/h.
Figure 2 depicts in detail the average productivity per project and work phase.
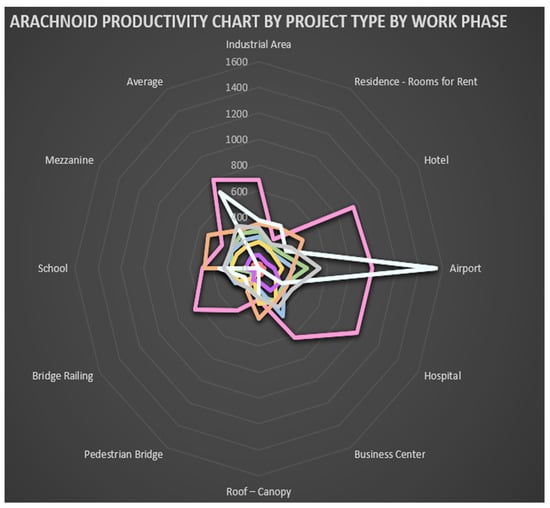
Figure 2.
Productivity—Arachnoid diagram of average productivity by project type by work phase.
Airports are the most productive type of project because they are structures that have a very heavy frame and comprise large repetitive sections.
Pedestrian Bridges have low productivity mainly in the Assembly and Welding phases. This is because these structures do not consist of elongated elements that are welded with plates and then erected with bolts, like classic steel structures. Instead, they comprise several combined elongated elements, and with plates are connected to each other during the Assembly and Welding phase to become a block, which demands more labor.
Bridge Railings have reduced productivity, especially during the Cutting Long Beams and Erection phase. This is mainly because decorative railings usually consist of round CHS hollow sections, which are more laborious to cut. They also include more laborious cuts, due to the particularity of their geometry. Regarding the rest of the main work phases and Erection, their reduced productivity is because they are not standardized tasks and need a different approach each time.
The generally low productivity in Residence—Rooms for Rent is because they have a light frame and require roughly the same hours of work, so the kg/h ratio is reduced.
Industrial Areas and Business Centers generally have slightly increased productivity during the Welding stage. This is because they are made up of heavier cross-sections than residential buildings, but large public works such as Airports and Hospitals have roughly the same frame but have significantly fewer requirements in terms of weld thickness and control requirements.
Finally, by determining the cost/h and having calculated the productivity per work phase and project type, several comparisons could be derived for the “unit cost” per work phase per project type.
4.2. Risk Analysis in Steel Structures
Business risks cannot be accurately predicted with a single value in terms of their consistency and using a probability deterministic model. In such cases, it is appropriate to use the probabilistic model because:
- 1.
- It enables us to define a reasonable range of values regarding both the probability of occurrence of the risks and their consequences [22],
- 2.
- It introduces the concept of interaction of input variables in a computational environment.
The result of the probabilistic method is the calculation of the probability distribution of each examined output variable (e.g., cost of risks, number of occurrences of risks).
Table 6 shows the risk severity level. The monetary values for each risk were determined from the historical data and the experience of the projects’ managers and superintendents of the 71 projects under analysis.
Table 6.
Risk—Risk severity level of each of the risks individually.
Using @Risk software, the following results were extracted, and the diagrams presented better depict this information.
- Exact and Cumulative Distribution Probability Diagram of Total Number of Hazard Occurrences (Repetitions) (Figure 3)
 Figure 3. Risk—risk recurrence probability distribution chart.
- ○
- There is a 22.8% chance that no risk will occur;
- ○
- There is a 37.7% chance that only one risk will appear;
- ○
- There is a 26.4% chance that 2 risks will appear at the same time;
- ○
- There is a 10.2% chance that 3 risks will appear at the same time;
- ○
- There is a 2.5% chance of 4 risks appearing at the same time;
- ○
- There is a 0.4% chance of 5 risks appearing at the same time;
- ○
- The probability of 4 or 5 risks appearing simultaneously (2.5% or 0.4% respectively);
- ○
- The cumulative probability of 4 and 5 risks occurring at the same time is 2.9%;
- ○
- The maximum number of simultaneous risks appearing is 5.
- Diagram of Exact and Cumulative Total Risk Cost Probability Distribution (Figure 4)
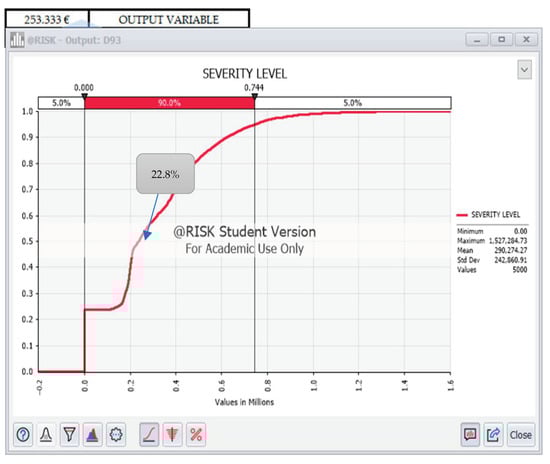 Figure 4. Risk—risk severity level cumulative chart.
- ○
- There is a 22.8% chance that no costs of risks will occur;
- ○
- The maximum cost that can be incurred from the random combination of all the main risks considered is EUR 1,527,284.73;
- ○
- There is a cumulative probability of 95% that the total burden of the business will rise to EUR 744,000 and only a probability of 5% that the cost of the business will range from EUR 744,000 to 1,527,284.73;
- ○
- There is only a 5% cumulative probability that costs of risks will be greater than EUR 786,000 and a 95% probability that costs will be less.
- Total Cost of Risk Tornado Diagram (Figure 5)
 Figure 5. Risk—risk severity level.
From the above diagram, the risks with the highest cost are in descending order are:
- ○
- Significant worker accidents;
- ○
- Inability to collect (agreed) receivables;
- ○
- Increased administration expenses;
- ○
- Competition;
- ○
- Investment failure;
- Tornado Diagram for the Total Number of Risk Occurrences (Figure 6)
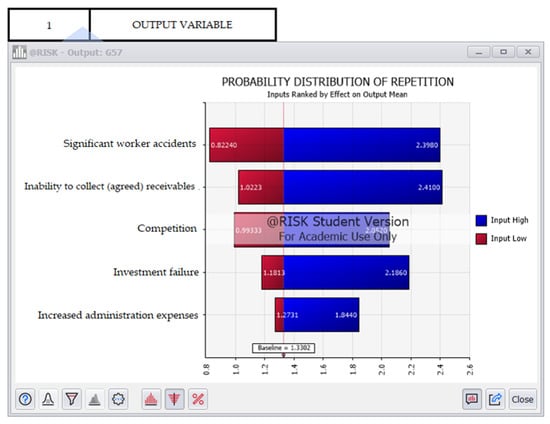 Figure 6. Risk—tornado chart for total risk occurrence number.
The tornado chart above shows the occurrence number of each risk separately, and the risk having the highest probability of occurrence. These risks in descending order are:
- ○
- Significant worker accidents;
- ○
- Inability to collect (agreed) receivables;
- ○
- Competition;
- ○
- Investment failure
- ○
- Increased administration expenses.
The most important risks according to the TOPSIS entropy method are the five risks that were analyzed above. These risks reflect the importance in relation to the weights given by the interviewees, and are presented, in descending order, in Table 7 and Figure 7 and Figure 8.
Table 7.
Most important risks according to the TOPSIS entropy method.

Figure 7.
Risk—entropy method—criteria weights.
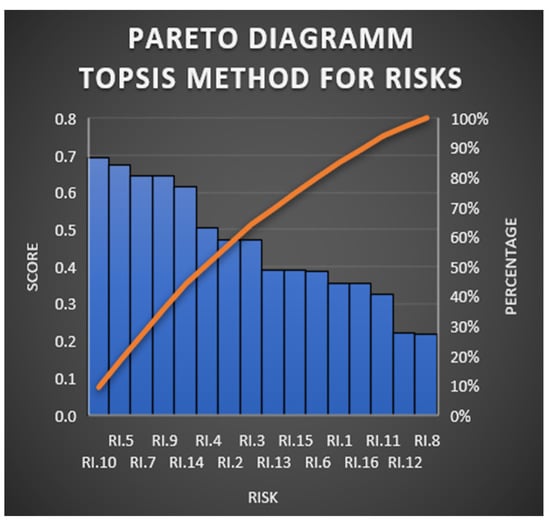
Figure 8.
Risk—Pareto diagram using TOPSIS method for risks.
5. Discussion and Conclusions
5.1. Discussion
As noted by Dixit et al. [13], productivity is commonly defined as a ratio of a volume measure of output to a volume measure of input use. The productivity could be measured at various levels, but three main measures exist: industry or sector level, project level, and activity or process level measurement. Nevertheless, project-based productivity comparisons are preferred because they could help construction entities to discover the area of improvement. Moreover, productivity curves could help construction managers to better estimate construction time and cost by allocating the adequate human resources to the “critical” project activities. This has become particularly imperative in recent years because, according to a McKinsey Report [2], construction productivity reached a deadlock. From the investigation of the extant literature, there is no publication in this sector regarding productivity curves at the project level and per construction phase. The majority of articles approach the productivity level, either by measuring the productivity of a case study or via a hierarchy of the factors of poor productivity, in a descriptive way without giving numbers or providing curves for comparisons. This paper aims to fill this gap by providing a holistic approach to the levels of productivity at the project level and per construction phase in order to help construction companies that undertake steel projects to better estimate their time and costs of construction. Furthermore, this research goes a step further by investigating and quantifying the most common risks that these types of companies encounter during construction. Data were gathered on 71 steel projects constructed in the last decade by the same constructor who has operated in the steel structure sector for several decades. This fact ensured that the data are homogeneous in terms of any exogenous risks of noise (i.e., different approaches of labor costs attribution, etc.). The analysis distinguished eight basic phases of steel structure construction: (i) Design, (ii) Cutting Long Beams, (iii) Cutting Forming Sheets, (iv) Montage (Assembly), (v) Welding, (vi) Paint, (vii) Erection, and (viii) Various Steel Tasks. For each phase, the productivity was recorded per employee in kg/h for fourteen main types of steel structures: (i) Industrial Area, (ii) Residence—Rooms for Rent, (iii) Hotel, (iv) Airport, (v) Hospital, (vi) Warehouse, (vii) Business Center, (viii) Roof—Canopy, (ix) Pedestrian Bridge, (x) Steel House, (xi) Bridge Railing, (xii) School, (xiii) Mezzanine, and (xiv) Various Constructions. It was concluded that Airports are the most productive type of project since they are structures with a very heavy frame and large repetitive sections. At the other extreme are Pedestrian Bridges, which have low productivity, especially during the Assembly and Welding phase, which encompasses laborious tasks. The information given by the calculation of the productivity index per project and per phase of construction could assist contractors to accurately estimate the “unit cost” (cost/kg) per work per phase and per project, and result in more valid and secure comparisons when selecting or prioritizing construction projects.
Furthermore, even when the indexes are valid and the comparisons can be accurately made, there are always several risks that companies have to face in their daily routine. Therefore, this research proceeded a step further by developing a risk registry based on the historical data of the 71 steel structure projects and the experience of the project managers and superintendents of these projects. Sixteen risks were identified, and through their analysis, five risks were characterized as “most important” and were analyzed further in terms of occurrences, severity, and vulnerability: (i) RI.10—investment failure, (ii) RI.5—Inability to collect (agreed) receivables, (iii) RI.5—Significant workers accidents, (iv) RI.9—Competition, and (v) RI.14—Increased administration expenses. Furthermore, probability curves were created for capturing the relevant costs for mitigation.
Although this is the first attempt made in the sector to provide figures for productivity, thus enabling valid and safe comparisons and hierarchizing the associated risks, the sample is country based. Therefore, any comparisons should be made taking into account the country’s conditions of wealth and construction maturity. Future work could include the enhancement of data incorporating more projects and the inclusion of other international projects in the sector.
5.2. Conclusions
To ascertain where the major problem lies, we have to look at construction subsectors. According to a McKinsey Report [2], better planning can boost productivity. To this end, this study offers curves of productivity as a basis for better planning based on past experience.
In general, studies that analyze productivity and risks related to steel structures are non-existent. This is a first attempt to address this gap in the extant literature by presenting, through a large and homogeneous database of 71 steel projects of various types, productivity and risks associated with this kind of structure. Through face-to-face interviews with project managers and superintendents, a homogeneous database was created. The results of the analyses aim to help projects managers and companies in this sector to better estimate their costs and risks associated with their work, and thus result in a better profit margin and more valid and secure comparisons when selecting or prioritizing construction projects.
Productivity is given in terms of unit cost per employee. The analysis revealed that among the fourteen different types of steel projects investigated, Airports is the most productive type, and Pedestrian Bridges rank at the bottom of the list with an average index of productivity of 378 kg/h. Furthermore, the investigation of the risks related to this kind of structure showed that, of the sixteen risks identified, five were classified as “high” risks that should be investigated in terms of their consequences and occurrence. These risks are: (i) significant worker accidents, (ii) inability to collect (agreed) receivables, (iii) competition, (iv) investment failure, and (v) increased administration expenses. Moreover, the TOPSIS entropy method revealed that the same risks are more important and ranked them by taking into account (a) probability, (b) severity, and (c) vulnerability weights. The highest score was for “investment failure” and the lowest was for “increased administration expenses”.
The proposed approach can be enriched in the future by incorporating additional data from other steel projects or international projects in this sector, thereby producing more valid and robust results.
Author Contributions
Conceptualization, D.K.; Methodology, K.P.; Software, K.P.; Validation, K.P. and D.K.; Formal analysis, K.P.; Investigation, D.K.; Resources, D.K.; Data curation, D.K.; Writing—original draft, D.K.; Writing—review & editing, K.P.; Supervision, K.P.; Project administration, K.P. All authors have read and agreed to the published version of the manuscript.
Funding
This research received no external funding.
Data Availability Statement
The data presented in this study are available on request from the corresponding author. The data are not publicly available due to cost sensitive reasons.
Conflicts of Interest
The authors declare no conflict of interest.
Abbreviations
| DSGN | Design |
| CTBM | Cutting Long Beams |
| PLAT | Cutting Forming Sheets |
| ASMB | Montage (Assembly) |
| WELD | Welding |
| PANT | Paint |
| ERCT | Erection |
| VARS | Various Steel Tasks |
Appendix A
Table A1.
The main characteristics of the projects.
Table A1.
The main characteristics of the projects.
| A/A | Types | Area (m2) | Height (m) | Floors | Comments |
|---|---|---|---|---|---|
| 321 | Industrial Area | 747 m2 | 7.00 m | 1 | Steel Building with Panel |
| 1 | Residence—Rooms for Rent | 200 m2 | 9.00 m | 3 | Composite Multistorey Building |
| 2 | Business Center | 960 m2 | 6.00 m | 1 | Steel Building with Panel |
| 3 | Industrial Area | 477 m2 | 5.70 m | - | Steel Building with Panel |
| 4 | Roof-Canopy | 999 m2 | 1.0–9 | - | Various Many Small Steel Structures |
| 5 | Residence—Rooms for Rent | 139 m2 | 2.50 m | 1 | Steel Frame of House |
| 6 | Airport | 5.240 m2 | 5.0–15 | 1 | Various Steel Structures |
| 7 | Residence—Rooms for Rent | 75 m2 | 2.40 m | 1 | House with Metal Steel and Dry Construction |
| 8 | Mezzanine | - | - | - | Steel Mezzanine |
| 9 | Residence—Rooms for Rent | 218 m2 | 4.00 m | 1 | Steel Frame of House |
| 10 | Residence—Rooms for Rent | 60 m2 | 6.00 m | 2 | Steel—Concrete Frame of House |
| 11 | Residence—Rooms for Rent | 280 m2 | 11.50 m | 5 | House with Steel—Concrete Frame and Dry Construction |
| 12 | Industrial Area | 1.395 m2 | 9.90 m | 2 | Steel—Concrete Building with Panel for Overlay |
| 13 | Various Constructions | - | - | - | Various Many Small Steel Structures |
| 14 | Airport | 5.720 m2 | 5.00 m | 1 | Steel—Concrete Frame of Building |
| 15 | Industrial Area | 516 m2 | 7.20 m | 1 | Steel Building with Panel |
| 16 | Industrial Area | 503 m2 | 6.00 m | 1 | Steel Building with Panel |
| 17 | Various Constructions | - | - | - | Various Many Small Steel Structures |
| 18 | Industrial Area | 67 m2 | 5.00 m | 1 | Steel Building with Panel |
| 19 | Airport | 278 m2 | 4.64 m | 1 | Steel—Concrete Frame of Loft |
| 20 | Industrial Area | 1.175 m2 | 7.00 m | 1 | Steel Building with Panel |
| 21 | Industrial Area | 869 m2 | 7.57 m | 1 | Steel Building Addition with Panel |
| 22 | Airport | 1.075 m2 | 15.23 m | - | Steel Building |
| 23 | Residence—Rooms for Rent | 92 m2 | 3.40 m | 1 | Steel Frame of House |
| 24 | Various Constructions | 8 m2 | 8.70 m | 3 | Steel Frame of Elevator |
| 25 | Airport | 3.680 m2 | 2.6–11 | 1 + 2 | Various Steel Structures |
| 26 | Hotel | 1.150 m2 | 11.00 m | 2 | Steel—Concrete Frame of Hotel |
| 27 | Industrial Area | 440 m2 | 5.50 m | 1 | Steel Roof with Panel |
| 28 | Various Constructions | 20 m2 | 1.00 m | 1 | Steel Structure |
| 29 | Residence—Rooms for Rent | 254 m2 | 12.60 m | 3 | Steel—Concrete Frame of Hotel |
| 30 | Various Constructions | 52 m2 | 3.00 m | 1 | Steel Interior Reinforcements of Existing Home |
| 31 | Industrial Area | 1.825 m2 | 1.00 m | 1 | Steel Building with Panel |
| 32 | Roof-Canopy | 200 m2 | - | - | Reconstruction of a Steel Roof with Panel |
| 33 | Hotel | 4.023 m2 | 18.00 m | 3 | Steel Frame of a Composite Hotel |
| 34 | Roof-Canopy | 168 m2 | 1.20 m | 1 | Steel Roof with Panels |
| 35 | Airport | 250 m2 | 4.60 m | 1 | Steel Building |
| 36 | Roof-Canopy | 108 m2 | 5.50 m | 1 | Steel Roof with Panel |
| 37 | Airport | 240 m2 | 4.70 m | 1 | Various Many Small Steel Structures |
| 38 | Various Constructions | - | - | - | Various Many Small Steel Structures |
| 39 | Various Constructions | 330 m2 | 12.00 m | 3 | Steel Reinforcement of an existing building |
| 40 | Pedestrian Bridge | 60 m2 | 1.00 m | - | Steel Open Pedestrian Bridge |
| 41 | Industrial Area | 425 m2 | 5.00 m | 1 | Steel Building with Panel |
| 42 | Industrial Area | 593 m2 | 9.85 m | 2 | Steel frame of Composite Building |
| 43 | Industrial Area | 420 m2 | 4.50 m | 1 | Steel Building with Panel |
| 44 | Industrial Area | 850 m2 | 5.00 m | 1 | Steel Additions with Panel |
| 45 | Hospital | 2.289 m2 | 4.05 m | 1 | Steel frame of Composite Building |
| 46 | Roof-Canopy | 120 m2 | 4.89 m | 1 | Steel Building with Panels |
| 47 | Residence—Rooms for Rent | 303 m2 | 3.00 m | 1 | Steel House with dry construction on an existing conventional |
| 48 | Hotel | 1.164 m2 | 13.25 m | 4 | Steel frame of Composite Building |
| 49 | Residence—Rooms for Rent | 126 m2 | 8.30 m | 2 | Steel Frame of House |
| 50 | Industrial Area | 36 m2 | 9.50 m | 1 | Steel Building with Panel |
| 51 | Roof-Canopy | 165 m2 | 3.80 m | 1 | Steel Roof |
| 52 | Industrial Area | 609 m2 | 18.80 m | 5 | Steel Building with Panel |
| 53 | Various Constructions | 120 m2 | 3.50 m | 1 | Various Small Steel Structures |
| 54 | Various Constructions | 60 m2 | 8.00 m | 2 | Various Small Steel Structures |
| 55 | Industrial Area | 819 m2 | 7.50 m | 2 | Steel Additions with Panel |
| 56 | Industrial Area | 196 m2 | 4.15 m | 1 | Steel Building with Panel |
| 57 | Residence—Rooms for Rent | 110 m2 | 5.84 m | 2 | House with Steel Frame and Dry Construction |
| 58 | Residence—Rooms for Rent | 237 m2 | 3.41 m | 1 | House with Steel Frame and Dry Construction |
| 59 | Industrial Area | 603 m2 | 7.50 m | 1 | Steel Additions with Panel |
| 60 | Bridge Railing | 1.128 m2 | 4.70 m | 1 | Steel Decorative Bridge Railing |
| 61 | Industrial Area | 3.039 m2 | 7.60 m | 2 | Steel Building with Panel |
| 62 | Pedestrian Bridge | 480 m2 | 3.90 m | 1 | Steel Closed Pedestrian Bridge with Panel |
| 63 | Industrial Area | 224 m2 | 4.50 m | 1 | Steel Building with Panel |
| 64 | Industrial Area | 536 m2 | 7.00 m | 2 | Steel Building with Panel |
| 65 | Industrial Area | 719 m2 | 5.60 m | 1 | Steel Additions with Panel |
| 66 | Industrial Area | 136 m2 | 11.92 m | 2 | Steel Building Open for Silo |
| 67 | School | 887 m2 | 7.20 m | 2 | Steel Building with Panels |
| 68 | Mezzanine | 77 m2 | 3.00 m | - | Steel Mezzanine |
| 69 | Industrial Area | 1.432 m2 | 7.28 m | 1 | Steel Additions with Panel |
| 70 | Residence—Rooms for Rent | 43 m2 | 3.00 m | 1 | House with Steel Frame and Dry Construction |
| 71 | Bridge Railing | 840 m2 | 4.00 m | 1 | Steel Decorative Bridge Railing |
References
- Bröchner, J.; Olofsson, T. Construction Productivity Measures for Innovation Projects. J. Constr. Eng. Manag. 2012, 138, 670–677. [Google Scholar] [CrossRef]
- Barbosa, F.; Woetzel, J.; Mischke, J.; Ribeirinho, M.J.; Sridhar, M.; Parsons, M.; Bertram, N.; Brown, S. Reinventing Construction: A Route to Higher Productivity; Mckinsey Global Insititute: New York, NY, USA, 2017; p. 20. [Google Scholar]
- OECD Infrastructure Financing Instruments and Incentives; OECD Secretary-General: Paris, France, 2015; pp. 1–74.
- Foundation for Economic & Industrial Research. The Role of Infratsructure and Construction Industry the Next Day of Greek Economy; Foundation for Economic & Industrial Research: Athens, Greece, 2021; ISBN 9789607536914. [Google Scholar]
- Salem, A. Study of Factors Influencing Productivity of Hauling Equipment in Earthmoving Projects Using Fuzzy Set Theory. Int. J. Innov. Manag. Technol. 2017, 8, 151–154. [Google Scholar] [CrossRef]
- Ibrahim, M.; Moselhi, O. Automated Productivity Assessment of Earthmoving Operations. J. Inf. Technol. Constr. 2014, 19, 169–184. [Google Scholar]
- Panas, A.; Pantouvakis, J.P. On the Use of Learning Curves for the Estimation of Construction Productivity. Int. J. Constr. Manag. 2018, 18, 301–309. [Google Scholar] [CrossRef]
- Yi, W.; Chan, A.P.C. Critical Review of Labor Productivity Research in Construction Journals. J. Manag. Eng. 2013, 30, 214–225. [Google Scholar] [CrossRef]
- Moselhi, O.; Alkass, S.; Golnaraghi, S.; Zangenehmadar, Z. Modeling Construction Labour Productivity Using Evolutionary Polynomial Regression. Int. J. Product. Qual. Manag. 2020, 1, 1–29. [Google Scholar] [CrossRef]
- Darko, A.; Chan, A.P.C.; Adabre, M.A.; Edwards, D.J.; Hosseini, M.R.; Ameyaw, E.E. Artificial Intelligence in the AEC Industry: Scientometric Analysis and Visualization of Research Activities. Autom. Constr. 2020, 112, 103081. [Google Scholar] [CrossRef]
- Shukla, A.K.; Janmaijaya, M.; Abraham, A.; Muhuri, P.K. Engineering Applications of Artificial Intelligence: A Bibliometric Analysis of 30 Years (1988–2018). Eng. Appl. Artif. Intell. 2019, 85, 517–532. [Google Scholar] [CrossRef]
- Naoum, S.G. Factors Influencing Labor Productivity on Construction Sites: A State-of-the-Art Literature Review and a Survey. Int. J. Product. Perform. Manag. 2016, 65, 401–421. [Google Scholar] [CrossRef]
- Dixit, S.; Mandal, S.N.; Thanikal, J.V.; Saurabh, K. Evolution of Studies in Construction Productivity: A Systematic Literature Review (2006–2017). Ain Shams Eng. J. 2019, 10, 555–564. [Google Scholar] [CrossRef]
- Teizer, J.; Cheng, T.; Fang, Y. Location Tracking and Data Visualization Technology to Advance Construction Ironworkers’ Education and Training in Safety and Productivity. Autom. Constr. 2013, 35, 53–68. [Google Scholar] [CrossRef]
- Liew, J.Y.R.; Chua, Y.S.; Dai, Z. Steel Concrete Composite Systems for Modular Construction of High-Rise Buildings. Structures 2019, 21, 135–149. [Google Scholar] [CrossRef]
- Petroutsatou, K. A Proposal of Project Management Practices in Public Institutions through a Comparative Analyses of Critical Path Method and Critical Chain. Int. J. Constr. Manag. 2019, 22, 242–251. [Google Scholar] [CrossRef]
- Purdy, G. ISO 31000: 2009—Setting a New Standard for Risk Management. Risk Anal. 2010, 30, 881–886. [Google Scholar] [CrossRef] [PubMed]
- PMI. A Guide to the Project Management Body of Knowledge (PMBOOK GUIDE), 4th ed.; PMI: Lausanne, Switzerland, 2009; ISBN 9781933890517. [Google Scholar]
- Antoniou, F. Delay Risk Assessment Models for Road Projects. Systems 2021, 9, 70. [Google Scholar] [CrossRef]
- Jozi, S.A.; Shafiee, M.; Moradimajd, N.; Saffarian, S. An Integrated Shannon’s Entropy—TOPSIS Methodology for Environmental Risk Assessment of Helleh Protected Area in Iran. Environ. Monit. Assess. 2012, 184, 6913–6922. [Google Scholar] [CrossRef] [PubMed]
- Ayyub, B.M. Risk Analysis in Engineering and Economics, 2nd ed.; Taylor & Francis: Abingdon, UK, 2014; ISBN 978-750-8400. [Google Scholar]
- Design, L.; Petroutsatou, K.; Vagdatli, T.; Maravas, A. Probabilistic Approach of Pre-Estimating Life-Cycle Costs of Road Tunnels. Struct. Infrastruct. Eng. 2023, 1–16. [Google Scholar] [CrossRef]


Disclaimer/Publisher’s Note: The statements, opinions and data contained in all publications are solely those of the individual author(s) and contributor(s) and not of MDPI and/or the editor(s). MDPI and/or the editor(s) disclaim responsibility for any injury to people or property resulting from any ideas, methods, instructions or products referred to in the content. |
© 2023 by the authors. Licensee MDPI, Basel, Switzerland. This article is an open access article distributed under the terms and conditions of the Creative Commons Attribution (CC BY) license (https://creativecommons.org/licenses/by/4.0/).