Article

Multi-Criteria Decision-Making of Countermeasure Combination for Mitigating the Stack Effect in High-Rise Office Building

School of Environmental Science and Engineering, Tianjin University, Tianjin 300350, China
*
Author to whom correspondence should be addressed.
Buildings 2023, 13(3), 653; https://doi.org/10.3390/buildings13030653
Submission received: 13 January 2023 / Revised: 22 February 2023 / Accepted: 23 February 2023 / Published: 28 February 2023
(This article belongs to the Topic Building Energy and Environment, 2nd Volume)

Abstract

:
Energy loss and performance deterioration caused by the stack effect are emerging issues in high-rise office buildings (HROB). However, a single countermeasure may not completely remove the stack effect problems, so combinations of countermeasures are often considered in building commissioning or retrofit projects to achieve the desired results. Therefore, a comprehensive study on combinations is necessary for the final decision-making. In this study, a multi-criteria decision-making model is proposed, which is utilized to calculate the ranking of countermeasure combinations for the final decision-making index by assigning weights and conducting comprehensive analysis on four criteria: infiltration energy loss, maximum pressure difference, investment cost, and implementation resistance. Based on a two-level Fractional-Factorial design (FFD), the interaction effects between countermeasures were verified, and the regression models of infiltration energy loss and maximum pressure difference were obtained as well. The investment cost and implementation resistance were defined according to the investigation and survey. An Analytic Hierarchy Process (AHP) was applied to establish the weights of each criterion. A weighted Technique for Order Preference by Similarity to an Ideal Solution (TOPSIS) method was applied to establish the decision-making index. Through the case study of a HROB located in northern China, it was concluded that the ideal combination can reduce infiltration and pressure difference by 26.88% and 87.58%, respectively, with low-level investment costs and implementation resistance. The results indicate that the multi-criteria model provides a comprehensive ranking of countermeasure combinations, which can serve as a quantitative basis for the final decision-making. Furthermore, this multi-criteria decision-making approach can be extended to other buildings in other regions.

1. Introduction

The stack effect, also called the thermal pressure effect or buoyancy-driven ventilation effect, is derived from the temperature difference between outdoor and indoor air. The stack effect is a common natural phenomenon existing in high-rise buildings. The magnitude of the stack effect is determined by building height alone, aside from the temperature difference [1]. High-rise office buildings (HROB) are defined as ones whose height is greater than 91 m [2], which is enough to raise a severe stack effect in cold regions. Meanwhile, office buildings often have some common characteristics, including a higher window-wall ratio, a large number of occupants, heavily used elevators and staircases, and a large connected interior area [3]. These characters will only exacerbate the stack effect on freezing days. The negative impacts of the stack effect mainly include localized excessive pressure and substantial air infiltration. Excessive pressure often presents major problems for elevator doors, which may be difficult to open and close [4]. Furthermore, noise from excessive airflow through doors may exist as whistling and whooshing [4]. Heating problems and high energy consumption can occur because of a substantial infiltration or leakage of cold air through openings and across the envelope.
Various countermeasures have been proposed to mitigate the stack effect in HROBs and have been demonstrated in many studies. Kosonen et al. [5] compared the effects of several measures by simulation experiment and found internal air tightness is playing the major role in the control of the stack effect. Lim et al. [1] summarized the countermeasures for the stack effect and classified them into two types, the architectural measures and the mechanical measures, according to the principle. Lee et al. [6] proposed the shaft cooling technology by reducing the temperature difference between the elevator shaft space and the outdoor environment to weaken the driving force of the stack effect. Song et al. [7] improved the shaft cooling technology by using mechanical ventilation to cool elevator shaft space with outdoor air. Xie et al. [8] built a coupled multi-zone and CFD model to simulate the elevator shaft cooling system. They found that the shaft cooling system can help reduce safety problems caused by the stack effect and ensure the normal use of the elevators. In another study, Yu et al. [9,10] created effective operation schemes for the HVAC systems by pressurizing the upper zone of the building to solve the problems related to the stack effect and successfully reduce the noise caused by the stack effect.
However, the stack effect in cold region HROBs is difficult to eliminate with only a single countermeasure [1]. A variety of combinations should be considered. It is relatively simple to evaluate a single countermeasure and just needs comparing technical criteria, while evaluating a combination involving multiple countermeasures is challenging because interaction effects occur when the effect of one factor depends on the value of another factor. Lim et al. [1] confirmed the existence of interactions between countermeasures. Although many countermeasures have been proposed to eliminate the stack effect, very little research has so far concentrated on their combination. Lim et al. [1] took the lead in researching the combined effect of these countermeasures in a building in South Korea; however, they focused on the interactions rather than the practical applicability. There is a gap in the literature, particularly with regard to the practical applicability of countermeasure combinations, where there is a lack of guidance for comprehensive evaluation and final decision-making.
To conduct comprehensive analysis and guide decision-making, one first needs to be able to accurately calculate the main and interaction effects of combinations. The multi-zone airflow network simulation can be used to calculate the airflow of the stack effect in buildings. A multi-zone airflow network model, CONTAMW [11], developed by the U.S. National Institute of Standards and Technology (NIST) has been widely used for the airflow simulation of the stack effect in previous studies [1,6,12,13,14,15,16,17,18]. A validated CONTAMW model can simulate and calculate the effects of individual countermeasures or combinations of countermeasures on building infiltration and pressure distribution. However, it is too complicated to try and apply all possible combinations to find out interactions’ effects. The design of experiments (DOE) is a systematic scientific approach for determining the most effective arrangement of experiments and obtaining the most useful information by result analysis [1]. The purpose of DOE is to find the single factor or combined factors that have a significant effect on the responding variable and detect the interactions between two or more factors. The DOE has been widely adopted in building science research due to its robustness and convenience [19,20,21,22]. The fractional-factorial design (FFD) is an advanced kind of DOE that can obtain enough information from fewer experiments [23].
Moreover, the decision-making process for countermeasure combinations in practical projects requires more information about subjective and objective constraints. Technical criteria can be obtained from FFD, but it is not enough for a comprehensive evaluation. The cost is a suitable objective constraint because a better effect can be achieved with more countermeasures being conducted, while the total cost will be over budget. In the literature [24,25,26], the focus of cost analysis is often on regular measures such as energy source or exterior wall renovation, but few researchers are concerned about the cost of improving the tightness of doors. A subjective term, implementation resistance, is appropriate to the model. The resistance depends on the impact of countermeasure implementation on regular daily operations. Like the cost, the resistance to the countermeasure is scarcely mentioned.
Furthermore, the comprehensive study needs an appropriate multi-criteria evaluation method. The multi-criteria model should possess the capability of determining the appropriate countermeasure combinations and abandoning the bad and unrealistic ones. The technique for ordering preference by similarity to an ideal solution (TOPSIS) is a ranking method based on the proximity of criteria to an ideal strategy [27,28,29,30,31]. This method can evaluate the relative merits of countermeasure combinations under multi-criteria.
The purpose of this study is to develop a multi-criteria decision-making model that is utilized to calculate the ranking of countermeasure combinations for the final decision-making index by assigning weights and conducting comprehensive analysis on four criteria: infiltration energy loss, maximum pressure difference, investment cost, and implementation resistance. Based on a two-level FFD, the interaction effects between countermeasures are verified systematically, and the regression models of the technical criteria are obtained. The investment cost and implementation resistance are defined according to the investigation and survey. An AHP is applied to establish the weights of each criterion. A TOPSIS method is applied to establish the ranking of countermeasure combinations and the decision-making index. The researchers can base their final decision-making on the index and ranking and select the highest-ranked countermeasure as the chosen strategy, or they can provide a quantitative basis for final decision-making when demand changes.

2. Materials and Methods

2.1. The Principle and Coutermeasures of Stack Effect

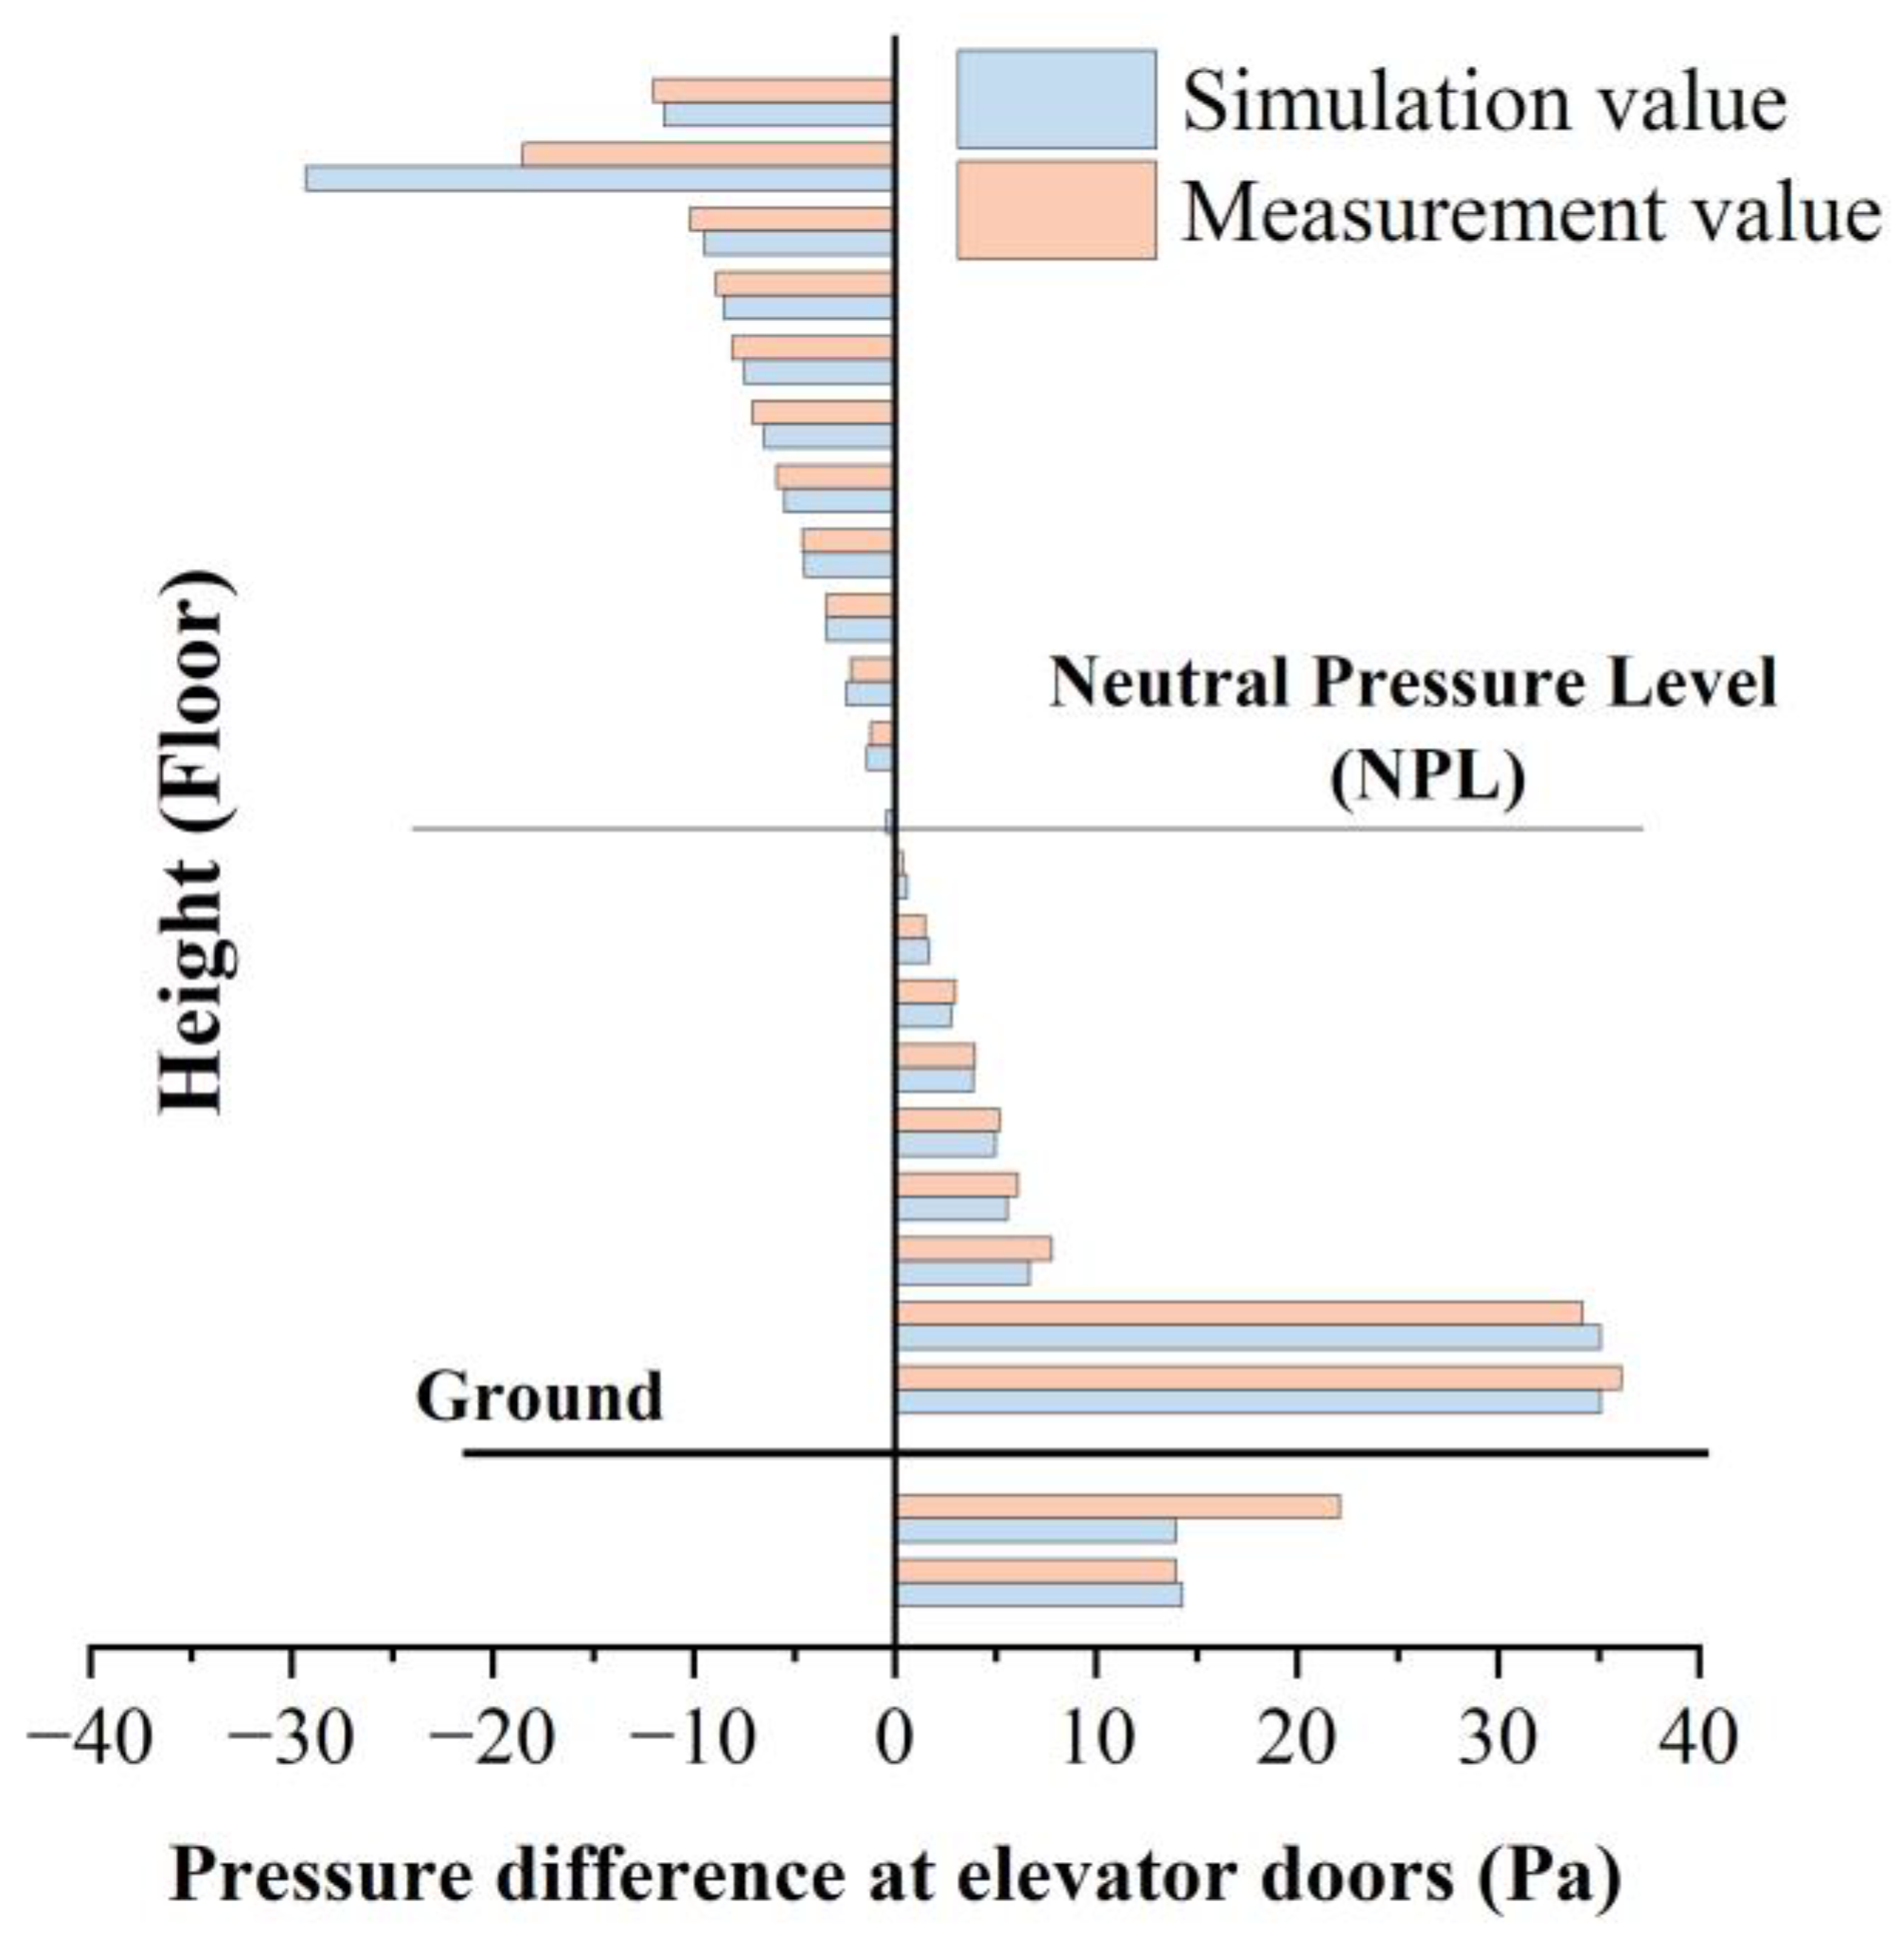
2.1.1. Vertical Pressure Distribution in HROBs

Figure 1 shows the thermal pressure profiles of a HROB during the winter. The intersection of the pressure profiles of the indoor and outdoor is the neutral pressure level (NPL). Neglecting vertical density gradient, the pressure difference caused by the stack effect at a specific vertical location can be expressed as Equation (1) [32]:
Δ P S E = ρ o ( T o T i T i ) g ( H N P L h )
where Δ P S E is the thermal pressure difference caused by the stack effect, Pa; T o and T i are the absolute outdoor and indoor temperatures, K; ρ o is outdoor air density, kg/m3; g is the gravitational constant, m/s2; H N P L and h are the height of the NPL and the height above the reference plane, respectively, m.
From Equation (1), the total magnitude of the stack effect is determined by the building height and the indoor and outdoor temperature difference. The farther away from the NPL, the greater the Δ P S E caused by the stack effect. The Δ P S E on each floor produces inter-zonal airflow, which causes outdoor air infiltration or indoor air leakage.
Wind pressure is another kind of vertical pressure distribution on the outside of HROBs [33,34]. The static pressure formed by wind is usually positive on the windward side and negative on the leeward side and roof. However, the actual distribution of wind static pressure is complex and very variable and depends on wind direction, speed, air density, surface orientation, and surrounding conditions. A wind tunnel test or a Computational Fluid Dynamics (CFD) simulation [35,36,37] is often applied to obtain the actual wind pressure distribution.
The Heating Ventilation Air Conditioning (HVAC) systems also have an impact on the vertical pressure distribution. Figure 2 illustrates the combined pressure distribution of thermal, wind, and HVAC systems. The total pressure difference Δ P T O T A L is expressed as [12]:
Δ P T O T A L = Δ P S E + Δ P W + Δ P H V A C
where Δ P W and Δ P H V A C are the pressure differences caused by the wind and HVAC systems, respectively, Pa.

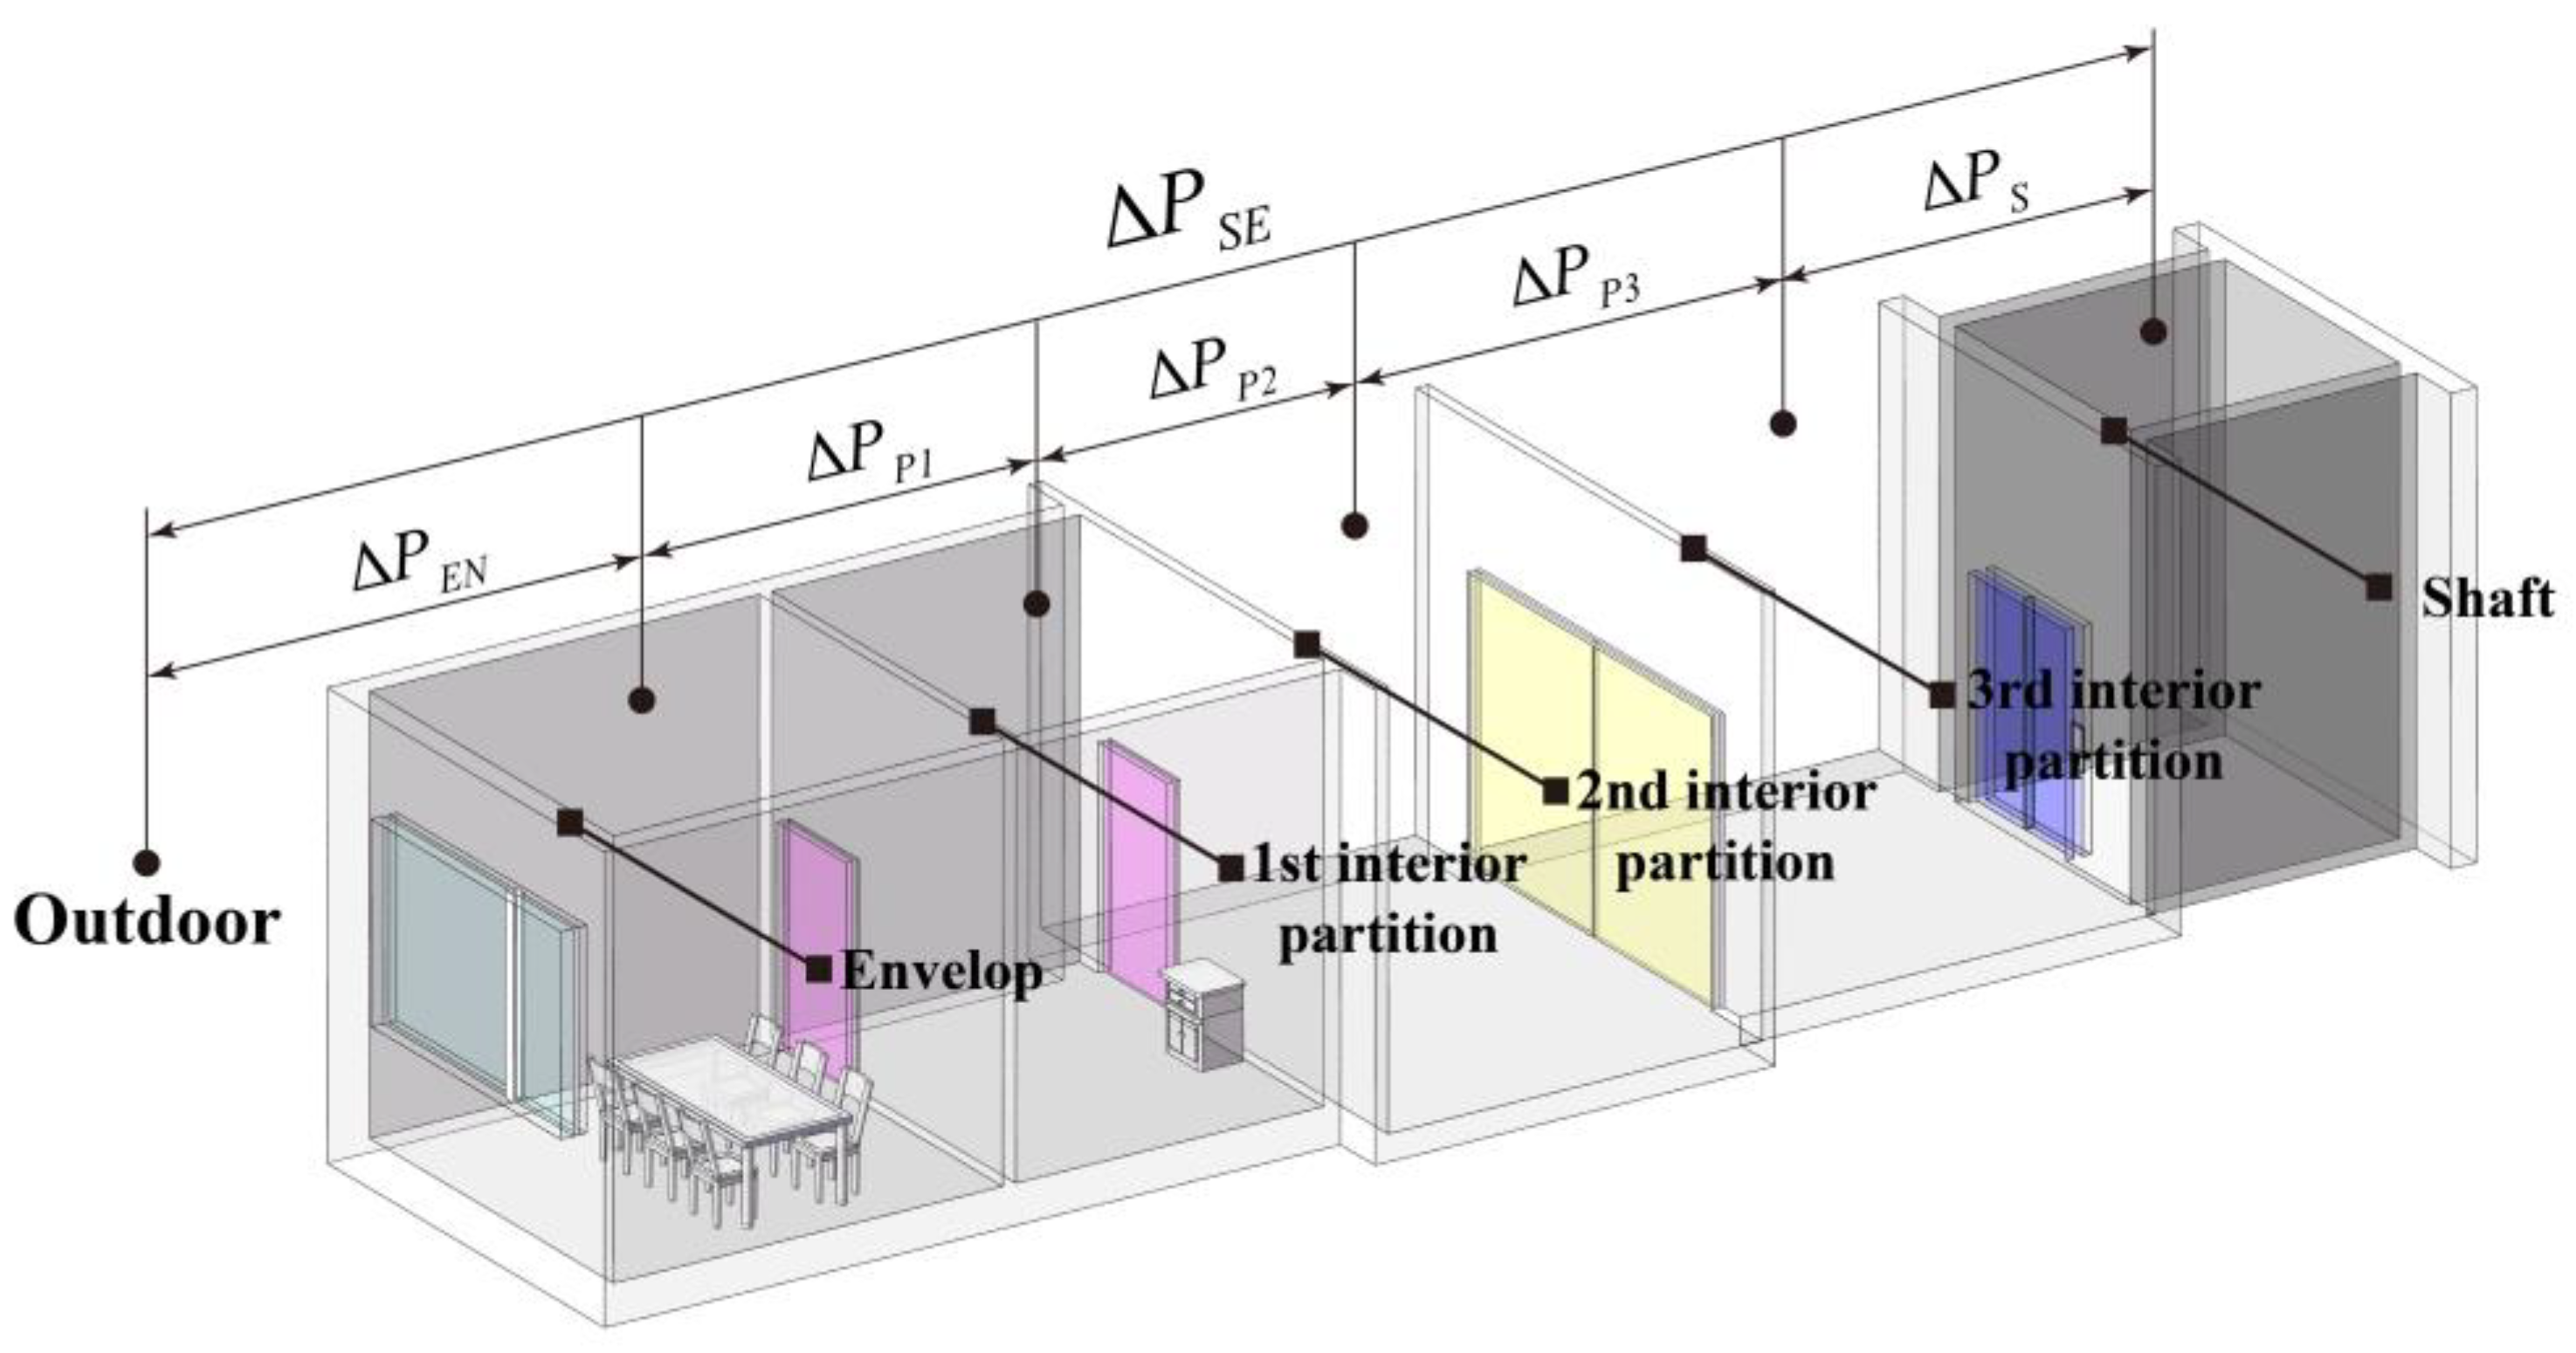
2.1.2. Horizontal Pressure Distribution across Floors

Every interior partition on the same floor has a pressure difference, as shown in Figure 3. The horizontal pressure distribution is determined by the ratio of the leakage areas of the interior partitions. Jae-hun Jo et al. [38] proposed the formula for calculating the thermal pressure coefficient ( γ ) on each floor as Equations (3)–(5):
γ = Δ P E N Δ P S E = Δ P E N Δ P E N + i = 1 n Δ P P i + Δ P S
Δ P E N = γ × Δ P S E
i = 1 n Δ P P i + Δ P S = ( 1 γ ) × Δ P S E
where Δ P E N is the pressure difference at the envelope, Pa; Δ P P i is the pressure difference at the ith interior partition, Pa; Δ P S is the pressure difference at the vertical shaft, Pa; n is the total number of interior partitions.
The γ is a criterion of the tightness of the envelope and can also be used to calculate the air infiltration and leakage. An improved formula [1] of γ is given by Equations (6) and (7), and the pressure differences are replaced by the equivalent leakage area of the envelope and interior partitions.
γ = 1 1 + ( A E . E N / A E . I N ) 2
A E . I N = 1 A E . S 2 + i = 1 n 1 A E . P i 2
where A E . E N is the equivalent leakage area of the envelope, cm2; A E . S is the equivalent leakage area of the vertical shaft, cm2; A E . P i is the equivalent leakage area of the ith interior partitions, cm2; A E . I N is the equivalent leakage area of a series of interior partitions and the vertical shaft, cm2.
The equivalent leakage area of structures is expressed as [8]:
A E = 10 , 000 Q r e f ρ r e f / 2 Δ P r e f C D
where A E is equivalent leakage area, cm2; Q r e f is the airflow rate at Δ P r e f , m3/s; ρ r e f is reference air density, kg/m3; Δ P r e f is reference pressure difference, Pa; C D is discharge coefficient, dimensionless.

2.1.3. Infiltration and Leakage Airflow

Based on the Bernoulli equation, the airflow rate through the large openings in structures that include opened doors and windows can be calculated by Equation (9) [39]. Draughty envelopes are often described by the power law equation [13], i.e., Equation (10). The flow coefficient c in Equation (10) can be converted to an equivalent leakage area AE with Equation (11) [36,40,41].
Q = C D A O P 2 Δ P O P / ρ
Q = c ( Δ P O P ) n
c = C D A E 10 , 000 2 ρ r e f ( Δ P r e f ) 0.5 n
where Q is airflow rate, m3/s; C D is discharge coefficient, dimensionless; A O P is the cross-sectional area for opening, m2; Δ P O P is the pressure difference across opening, Pa; c is flow coefficient, m3/(s·Pan); A E is equivalent leakage area, cm2. ρ is air density, kg/m3; ρ r e f is reference air density, kg/m3; Δ P r e f is reference pressure difference, Pa.

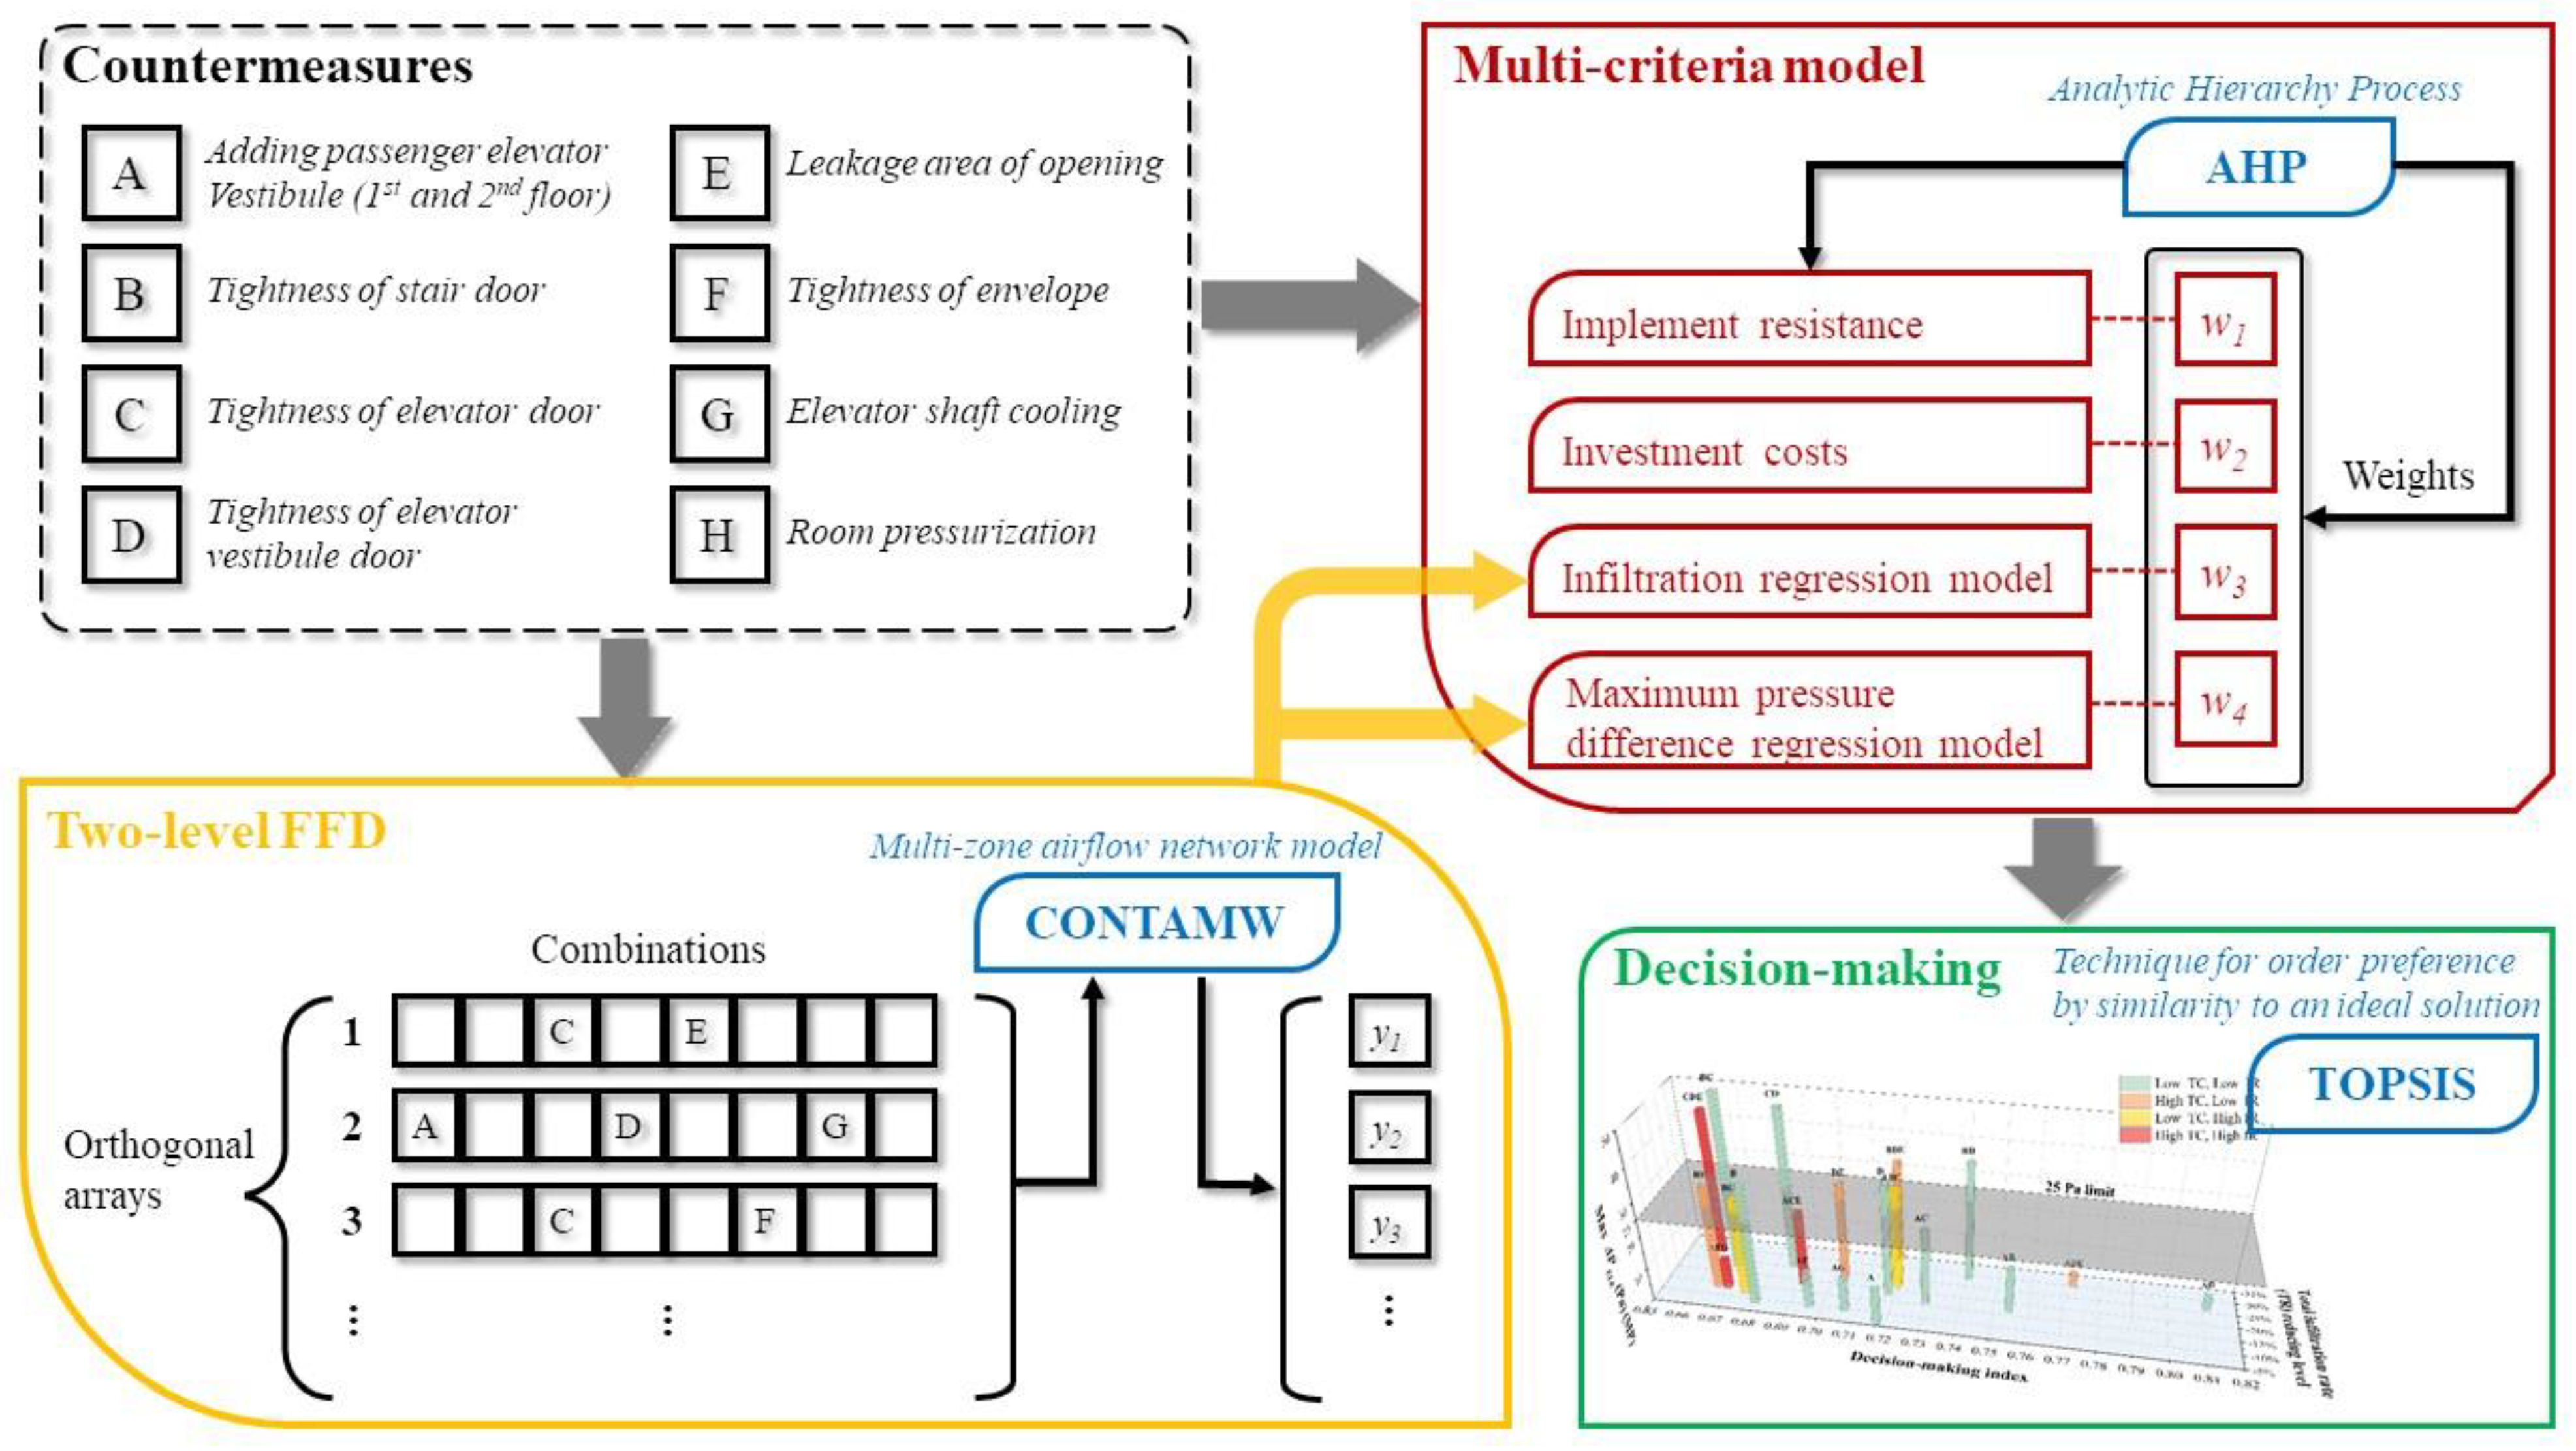
2.1.4. Countermeasures to Mitigate Stack Effect

Different countermeasures have different priorities for eliminating excessive pressure and substantial air infiltration. According to Equation (9), for a specific building structure, a large pressure difference signifies a large airflow. A decrease in opening area contributes to the decrease in airflow rate while the ratio of pressure difference increases, according to Equation (8) and Equation (6), respectively. Thus, the series of equivalent leakage areas as shown in Equations (6) and (7) can be redesigned to improve the tightness of the whole building, reducing air infiltration, or to adjust the ratio of pressure distribution on interior partitions to eliminate excessive pressure. The countermeasures based on this principle can be classified as architectural measures [1].
Improving the tightness level of the envelope is an effective measure because the total air infiltration can be diminished observably and directly, as can the proportions of pressure difference between interior partitions and shafts [5,14,42]. From Equation (3), the proportion of pressure difference on the envelope increases. This measure is more reliable and safer due to the fact that envelope structures are designed to withstand high pressure [1].
Reducing the leakage area of openings in envelope is another measure to reduce the airflow rate across the envelope [18]. The large openings, such as opened entrance doors, exhaust outlets, orifices at the top of shafts, and even broken windows, often cause significant airflows. Reducing leakage area as much as possible is a workable countermeasure. For frequently-used entrance doors, a two-door vestibule installed between the entrance door and the lobby or using revolving doors are also feasible alternatives [43].
Improving the tightness of elevator doors and stair doors aims at diminishing the vertical airflow rate between upper and lower floors. Usually, elevator shafts, and stairwells can be considered the only primary vertical flow paths in a building’s interior. However, improving the tightness can cause an increase in pressure differences at elevator doors on top and bottom floors, and operation failure or noise occurs when the pressure difference exceeds the maximum of 25 Pa [2].
Additional vestibules of elevator doors and stair doors can divide the pressure difference. If this measure cooperates with improving the tightness of elevator doors and stair doors, there will inevitably be interactions.
Furthermore, there is another principle to minimize stack effect with the help of mechanical equipment [1]. Mechanical measures in development include room pressurization and elevator shaft cooling. Room pressurization reduces the pressure difference between the elevator shafts and office area by pressurizing the office area above the NPL [10]. The ΔPSE of each floor below the NPL decreases. The air infiltration and energy consumption increase ineluctably as a large quantity of air needs to be heated and pumped into the buildings. The room pressurization measure using the existing HVAC system should operate temporarily when the stack effect is severe.
The elevator shaft cooling method uses pumps to pump cold outdoor air into the elevator shaft space. As the primary vertical flow path in the building interior, the elevator shaft space has the closest average temperature to the T i expressed in Equation (1). The elevator shaft cooling measure has been shown in the literature [6,8,9] to effectively reduce the magnitude of the stack effect. In existing building retrofit projects, there needs to be plenty of space for the ducts and fans connecting the shaft to the outside.

2.2. Establishment of Multi-Criteria Model

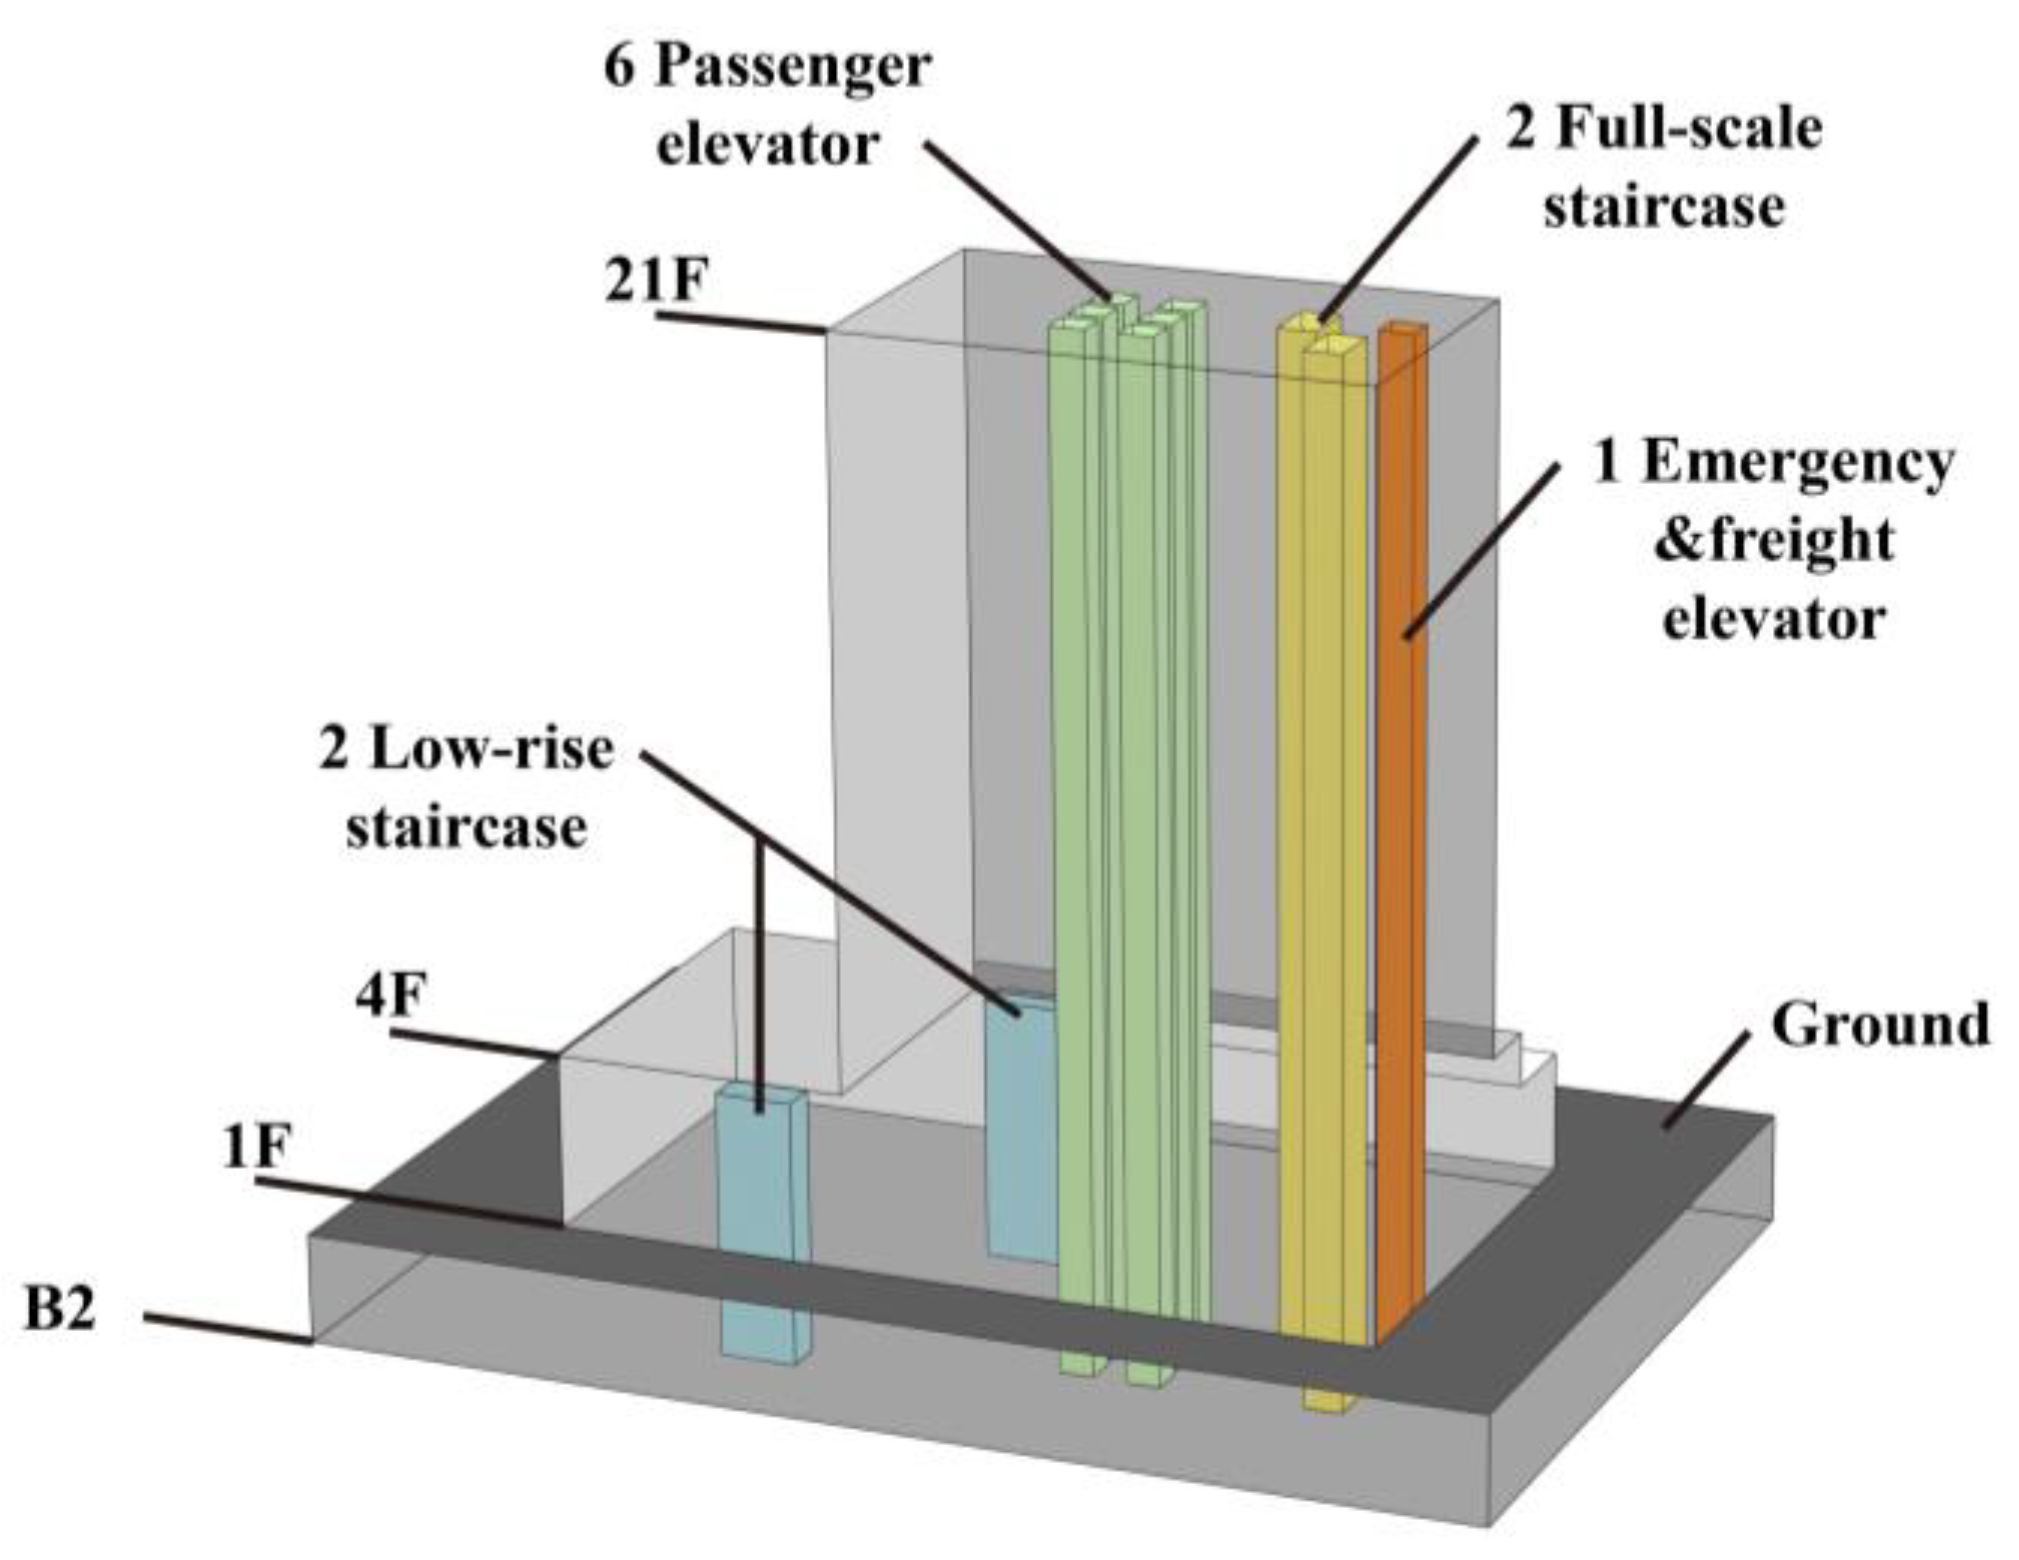
2.2.1. Case HROB Analysis

An office building in Inner Mongolia, China, was used for the case study. The case building has 21 floors above and 2 underground floors. The first and second floors are halls, and the third floor and above are offices. The underground floors are designed as parking garages. Figure 4 shows the vertical air flow path in the building interior. The main flow paths include 6 passenger elevators, 1 emergency and freight elevator, 3 low-rise staircases, and 2 full-scale staircases. The passenger elevators on each floor except first and second share a vestibule with two automatic doors installed on the north and south sides, respectively. The emergency and freight elevators and full-scale stairwells have two-door vestibules. The first floor contains a large lobby that extends to third floor. The entrances have a two-door vestibule with swing doors.
This HROB is located in severe cold region, and the severe stack effect created by huge temperature difference has caused several issues, such as whistling and whooshing from elevator doors on the bottom and top floors, malfunctions of doors opening and closing, and a huge energy loss. Most countermeasures discussed in Section 2.1.4 could be applied either on their own or in combination with each other. Based on the case-building process, the process and methodology of multi-criteria model establishment are elaborated in the following sections. The research outline is shown in Figure 5.

2.2.2. Multi-Zone Airflow Network Simulation

The multi-zone airflow network model CONTAMW describes a building with a network of spaces and conjunction nodes. The spaces present the simplified building interior zones, and the nodes present air flow paths in building structures such as doors and windows. Each space has a specific pressure and temperature, and each node has specific element model and parameters. As a result, the pressure distributions, the pressure difference on building structures, and the leakage dataset can be obtained.
In this study, the design condition was set as the simulation condition. The ambient air temperature was −17 °C, and the indoor temperature was 20 °C. The parameters and simplified settings were obtained from architectural drawings, manuals, and standards. The wind pressure distribution was obtained from a CFD simulation with PHOENICS 2019 software. Furthermore, the effect of HVAC was not available in case building. No vent system or air system operates in winter. The measurements of pressure difference distributions at elevator doors were collected to validate the model, as shown in Figure 6.
As shown in Figure 6, the simulated pressure differences of CONTAMW and actual measured pressure differences are reasonably consistent. The increases in the pressure difference at the 1st, 2nd, and 20th floors are because there are large openings or opened entrance doors on the envelope, which can cause a significant increase in the equivalent leakage area of the envelope. According to Equations (3) and (6), the percentage of the pressure difference on the envelope is therefore decreasing. Since the Δ P S E across the floor is constant, more of the pressure difference is transferred to the elevator doors. Reducing the leakage area of openings in envelopes may be one of workable countermeasures for case building.

2.2.3. Fractional-Factorial Design of Countermeasures

The purpose of Fractional-Factorial design (FFD) is to obtain more accurate multiple regression equations of infiltration and pressure difference. There is no guarantee that the data used for multiple regression contain enough overall information because they are often chosen at random. FFD is designed to select orthogonal array data, guaranteeing that the data have enough overall information for the regression and obtaining a regression equation with a higher level of accuracy.
A two-level FFD was adopted, and the cases were constructed using orthogonal arrays. The two levels contain the low level (−1) and the high level (+1). The low level indicates the building structure parameters remain unchanged, and the high level indicates the parameters have been optimized with countermeasures. Table 1 shows the candidate countermeasures, numbered from A to H for case building. The low level is the initial state, and the high level is the target state of countermeasure. The levels of each measure were determined or calculated from architectural drawings, standards [44], and literature [1,4,33]. In Table 1, A was adding passenger elevator vestibules on first and second floors. B, C, and D were improving tightness of stair doors, elevator doors, and passenger elevator vestibule doors on all floors, respectively. E was reducing the leakage area of openings, including entrance doors, orifices at the top of shafts, and door-holes on 20th floor of roughcast. F was improving tightness of building envelope. G was passenger elevator shaft cooling. H was room pressurization for the office areas above the NPL.
A 2d-p FFD was adopted, where the d was equal to 8 and the p was equal to 2. That indicated only a quarter of all 256 possible combinations were going to be conducted. In this FFD, there is no main effect or two-factor interaction that was aliased with any other main effect or two-factor interaction, but some two-factor interactions were aliased with three-factor interactions. Some interesting three-factor interactions were intentionally designed to avoid being aliased with other important effects; the others, and the four-factor or higher interactions, were negligible according to the sparsity of effects principle [23]. Combinations of countermeasures using orthogonal arrays were created in the MINITAB 18 software [45]. The factors were the countermeasures in Table 1, and the responses indicated the total infiltration flow rate or pressure difference on each target. The 64 combinations were modeled using the CONTAMW simulation to obtain the responding values. The ultimate goal was to develop credible regression models for predicting the total infiltration flow rate and the pressure difference.
The results of the FFD were evaluated by variance analysis (ANOVA). The p-value of F-test, which is used for testing the significance of the main effect and interaction effect, proving that at least one item is significant, can prove that the regression model is valid. The t-value and the p-value of t-test are used for testing the significance of individual regression coefficients. The confidence level in our study is set at 0.05, i.e., regression coefficients with p-value less than 0.05 are considered significant. The coefficient of multiple determination (R2), adjusted R2 (R2adj), prediction R2 (R2pre), and an unbiased estimator of σ (S) are used for evaluating the performance of the regression model. The residual (e) is used for checking the validity of the regression model by estimating whether the observation errors are normally and independently distributed. For further details, please refer to Ref. [23]. The regression models were used to summarize the results of the simulation. A regression model containing interactions is an equation of the form:
y ^ = β ^ 0 + i = 1 d β ^ i x i + i = 1 d 1 j = i + 1 d β ^ i , j x i x j + i = 1 d 2 j = i + 1 d 1 k = j + 1 d β ^ i , j , k x i x j x k
where y ^ is the fitted value of the responding; β ^ s are the least squares estimators of the regression coefficients.

2.2.4. Multi-Criteria Model and Decision-Making

The variables that were calculated as responding y in FFD are the technical criteria. The total infiltration flowrate indicates the energy efficiency potential of the building. The maximum pressure difference at elevator doors indicates the performance improvement capability because most stack effect problems occur at the elevator doors.
The costs indicate the realistic constraints of countermeasures. In this study, the analysis is based on a typical design condition and aims at making comparisons between the performances and investments of countermeasure combinations in principle. Thus, the costs only contain investment costs. The costs were obtained from dealers and experts. The implementation resistance in this study only indicates the attitude towards countermeasures. The implementation resistance was obtained from the judgment matrix of an AHP.
The next step was to obtain the weights of the four criteria: total infiltration flowrate (TF), maximum pressure difference at elevator doors (MP), total costs (TC), and implementation resistance (IR). Since there were few cases for reference, the weights were also obtained from the judgment matrix of another AHP. Eventually, the weights of TF, MP, TC, and IR were set at 0.319, 0.066, 0.420, and 0.195, respectively.
The TOPSIS method can evaluate the relative merits of countermeasure combinations under multi-criteria. The four criteria, TF, MP, TC, and IR, all minimize setup. For a better visible display, the values of each criterion needed to be converted into a maximized setup, using Equation (13):
y ¯ i j = M A X ( y ^ i j ) y ^ i j
where y ^ i j is the jth value of the ith criterion; y ¯ i j is the convert result of y ^ i j ; M A X ( y ^ i j ) is the maximum value of y ^ i j .
For different criteria, the standards are different. It is necessary to normalize the value of each criterion. The normalization formula is shown in Equation (14):
z i j = y ¯ i j j = 1 m y ¯ i j 2
where z i j is the jth normalization value of the ith criterion; m is the total number of strategies.
The criterion weights and the sets of optimum responses and worst responses have been obtained in the above sections. It is worth noting that the sets of responses also need a process of conversion and normalization, as expressed in Equations (15) and (16). Next, the distances between the countermeasure combinations and the optimum and worst responses were calculated using Equation (17).
Z + = ( z 1 + , z 2 + , , z i + , , z n + )
Z = ( z 1 , z 2 , , z i , , z n )
{ D I j + = i = 1 n w i ( z i j z i + ) 2 D I j = i = 1 n w i ( z i j z i ) 2
where n is the total number of criteria; w i is the weight of ith criterion.
The closeness of each countermeasure combination to the ideal solution was calculated using Equation (18). The C T , j is the decision-making index of the jth countermeasure combination. The closer the C T , j is to 1, the higher the evaluation score for the countermeasure combination. The ranking of the indexes is the recommendation ranking of combinations.
C T , j = D I j D I j + D I j +

3. Results

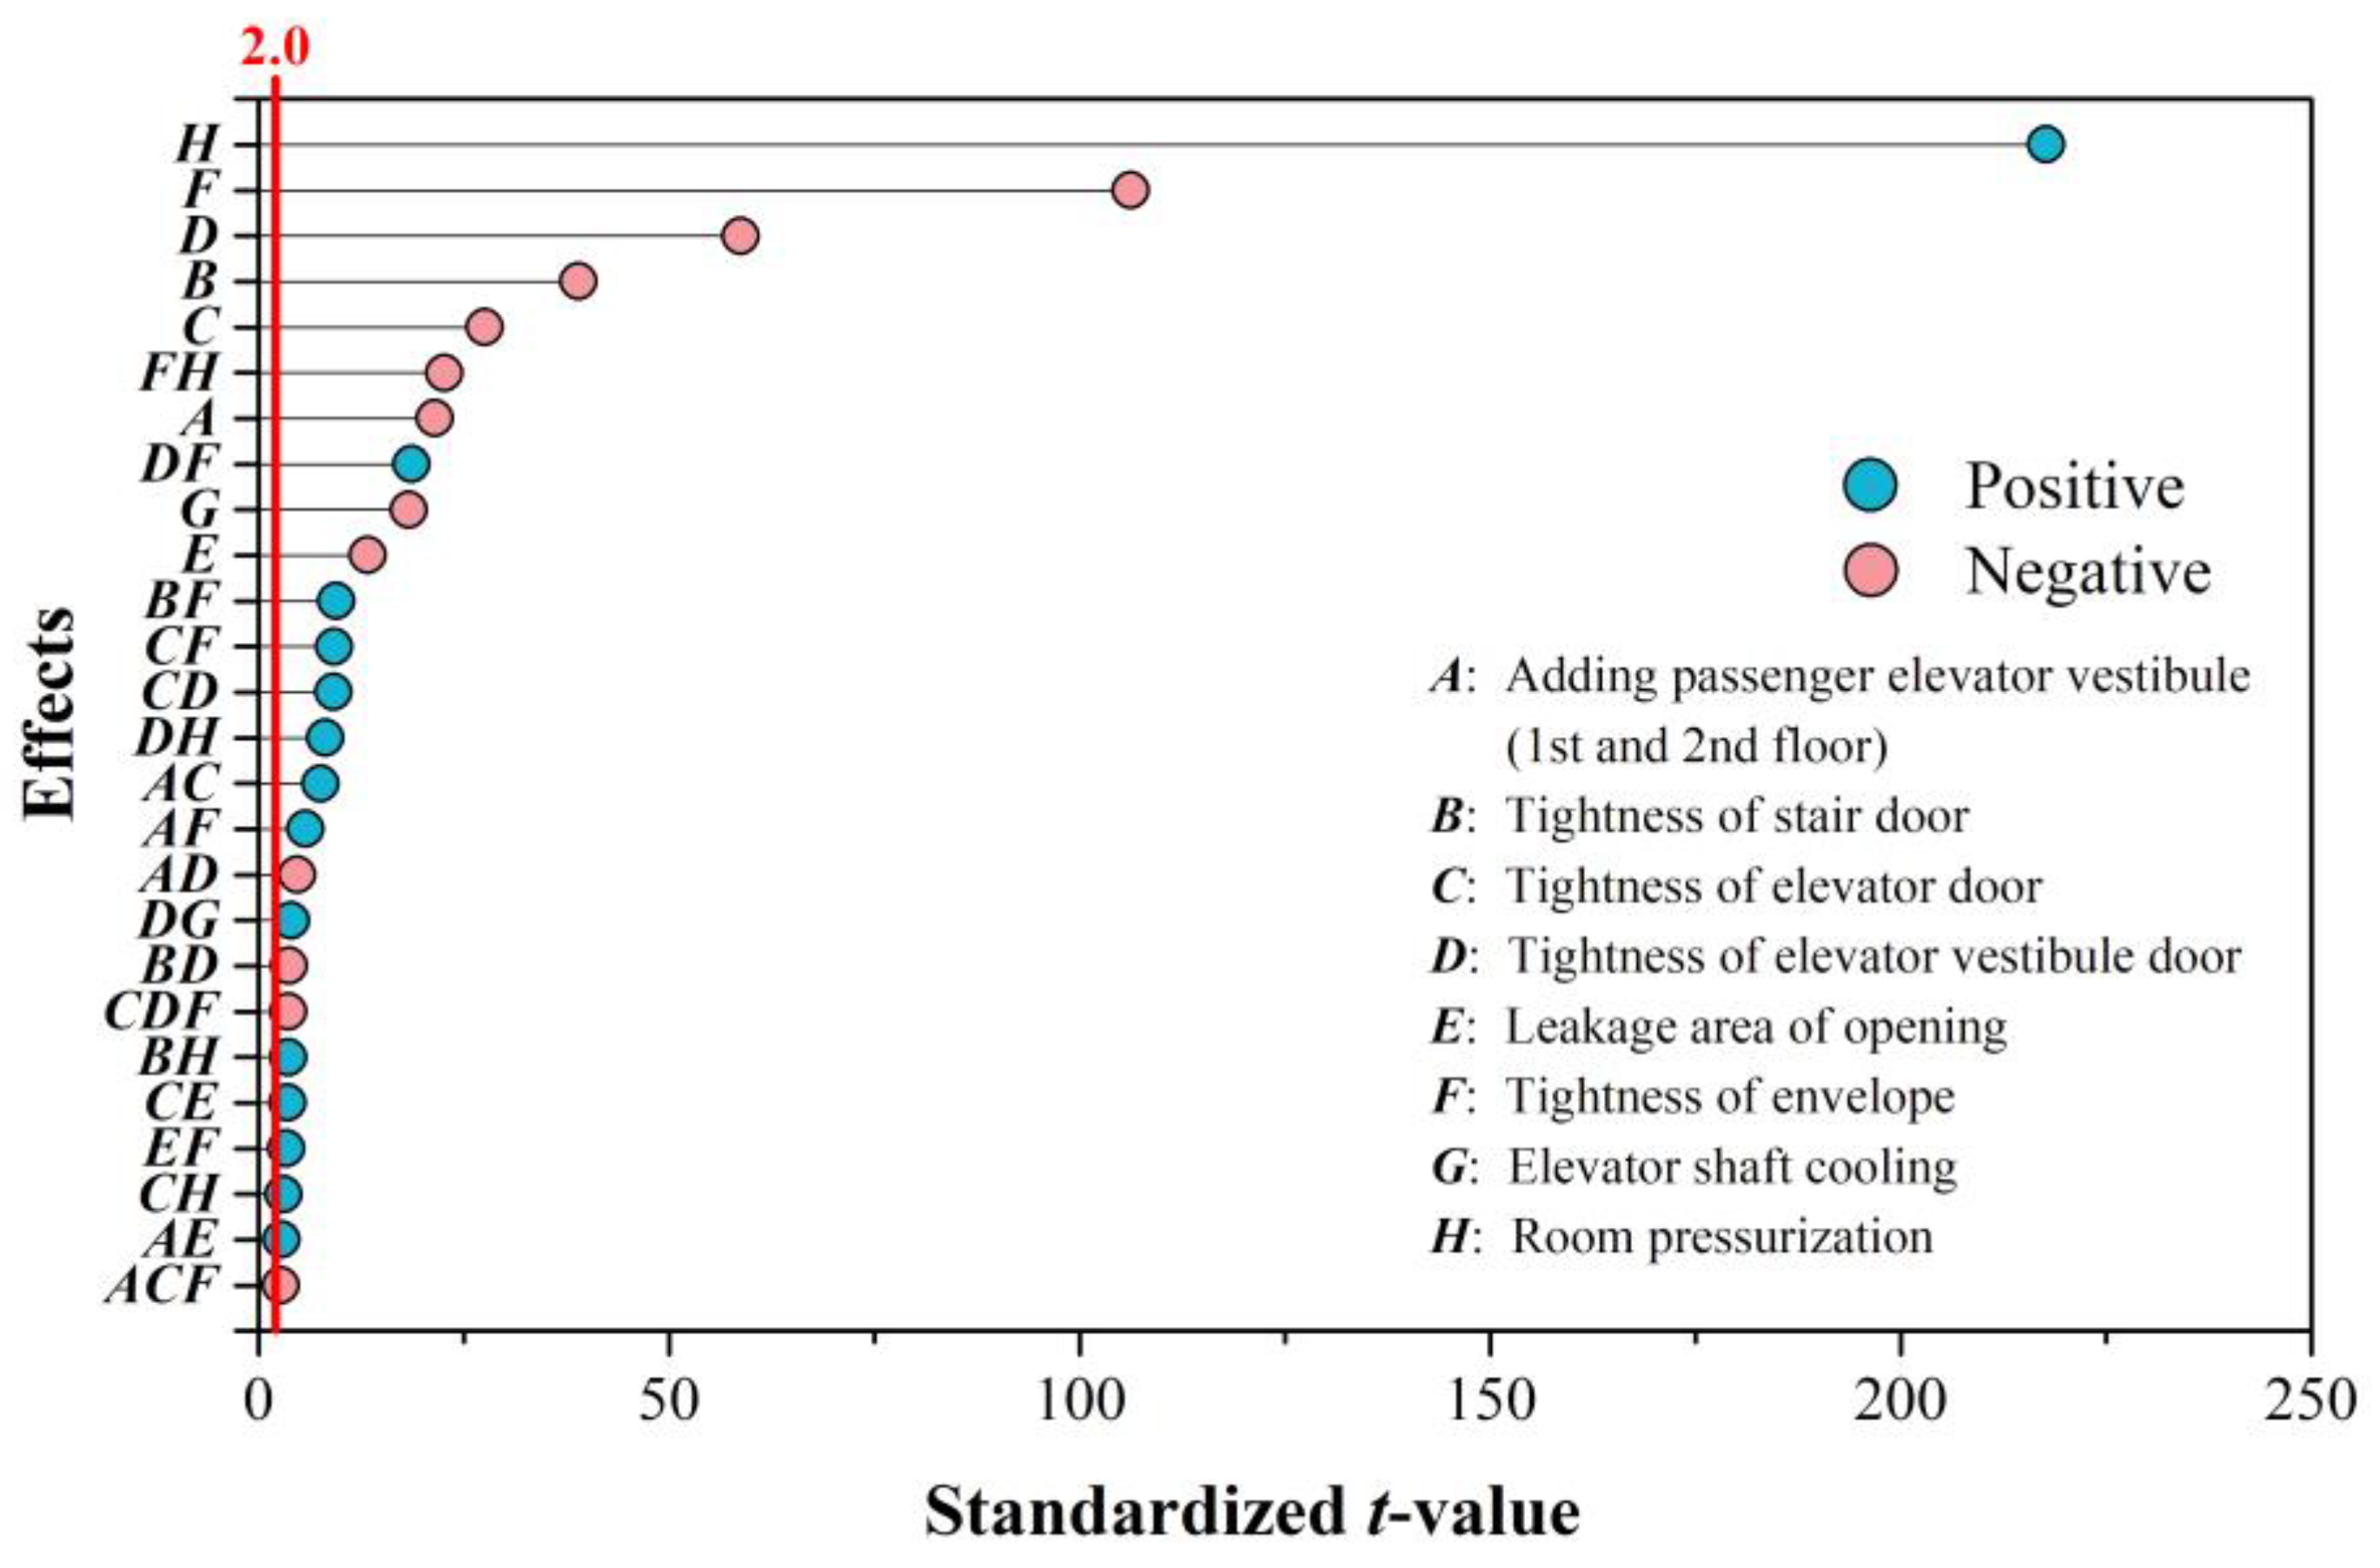
3.1. Interactions between Countermeasures

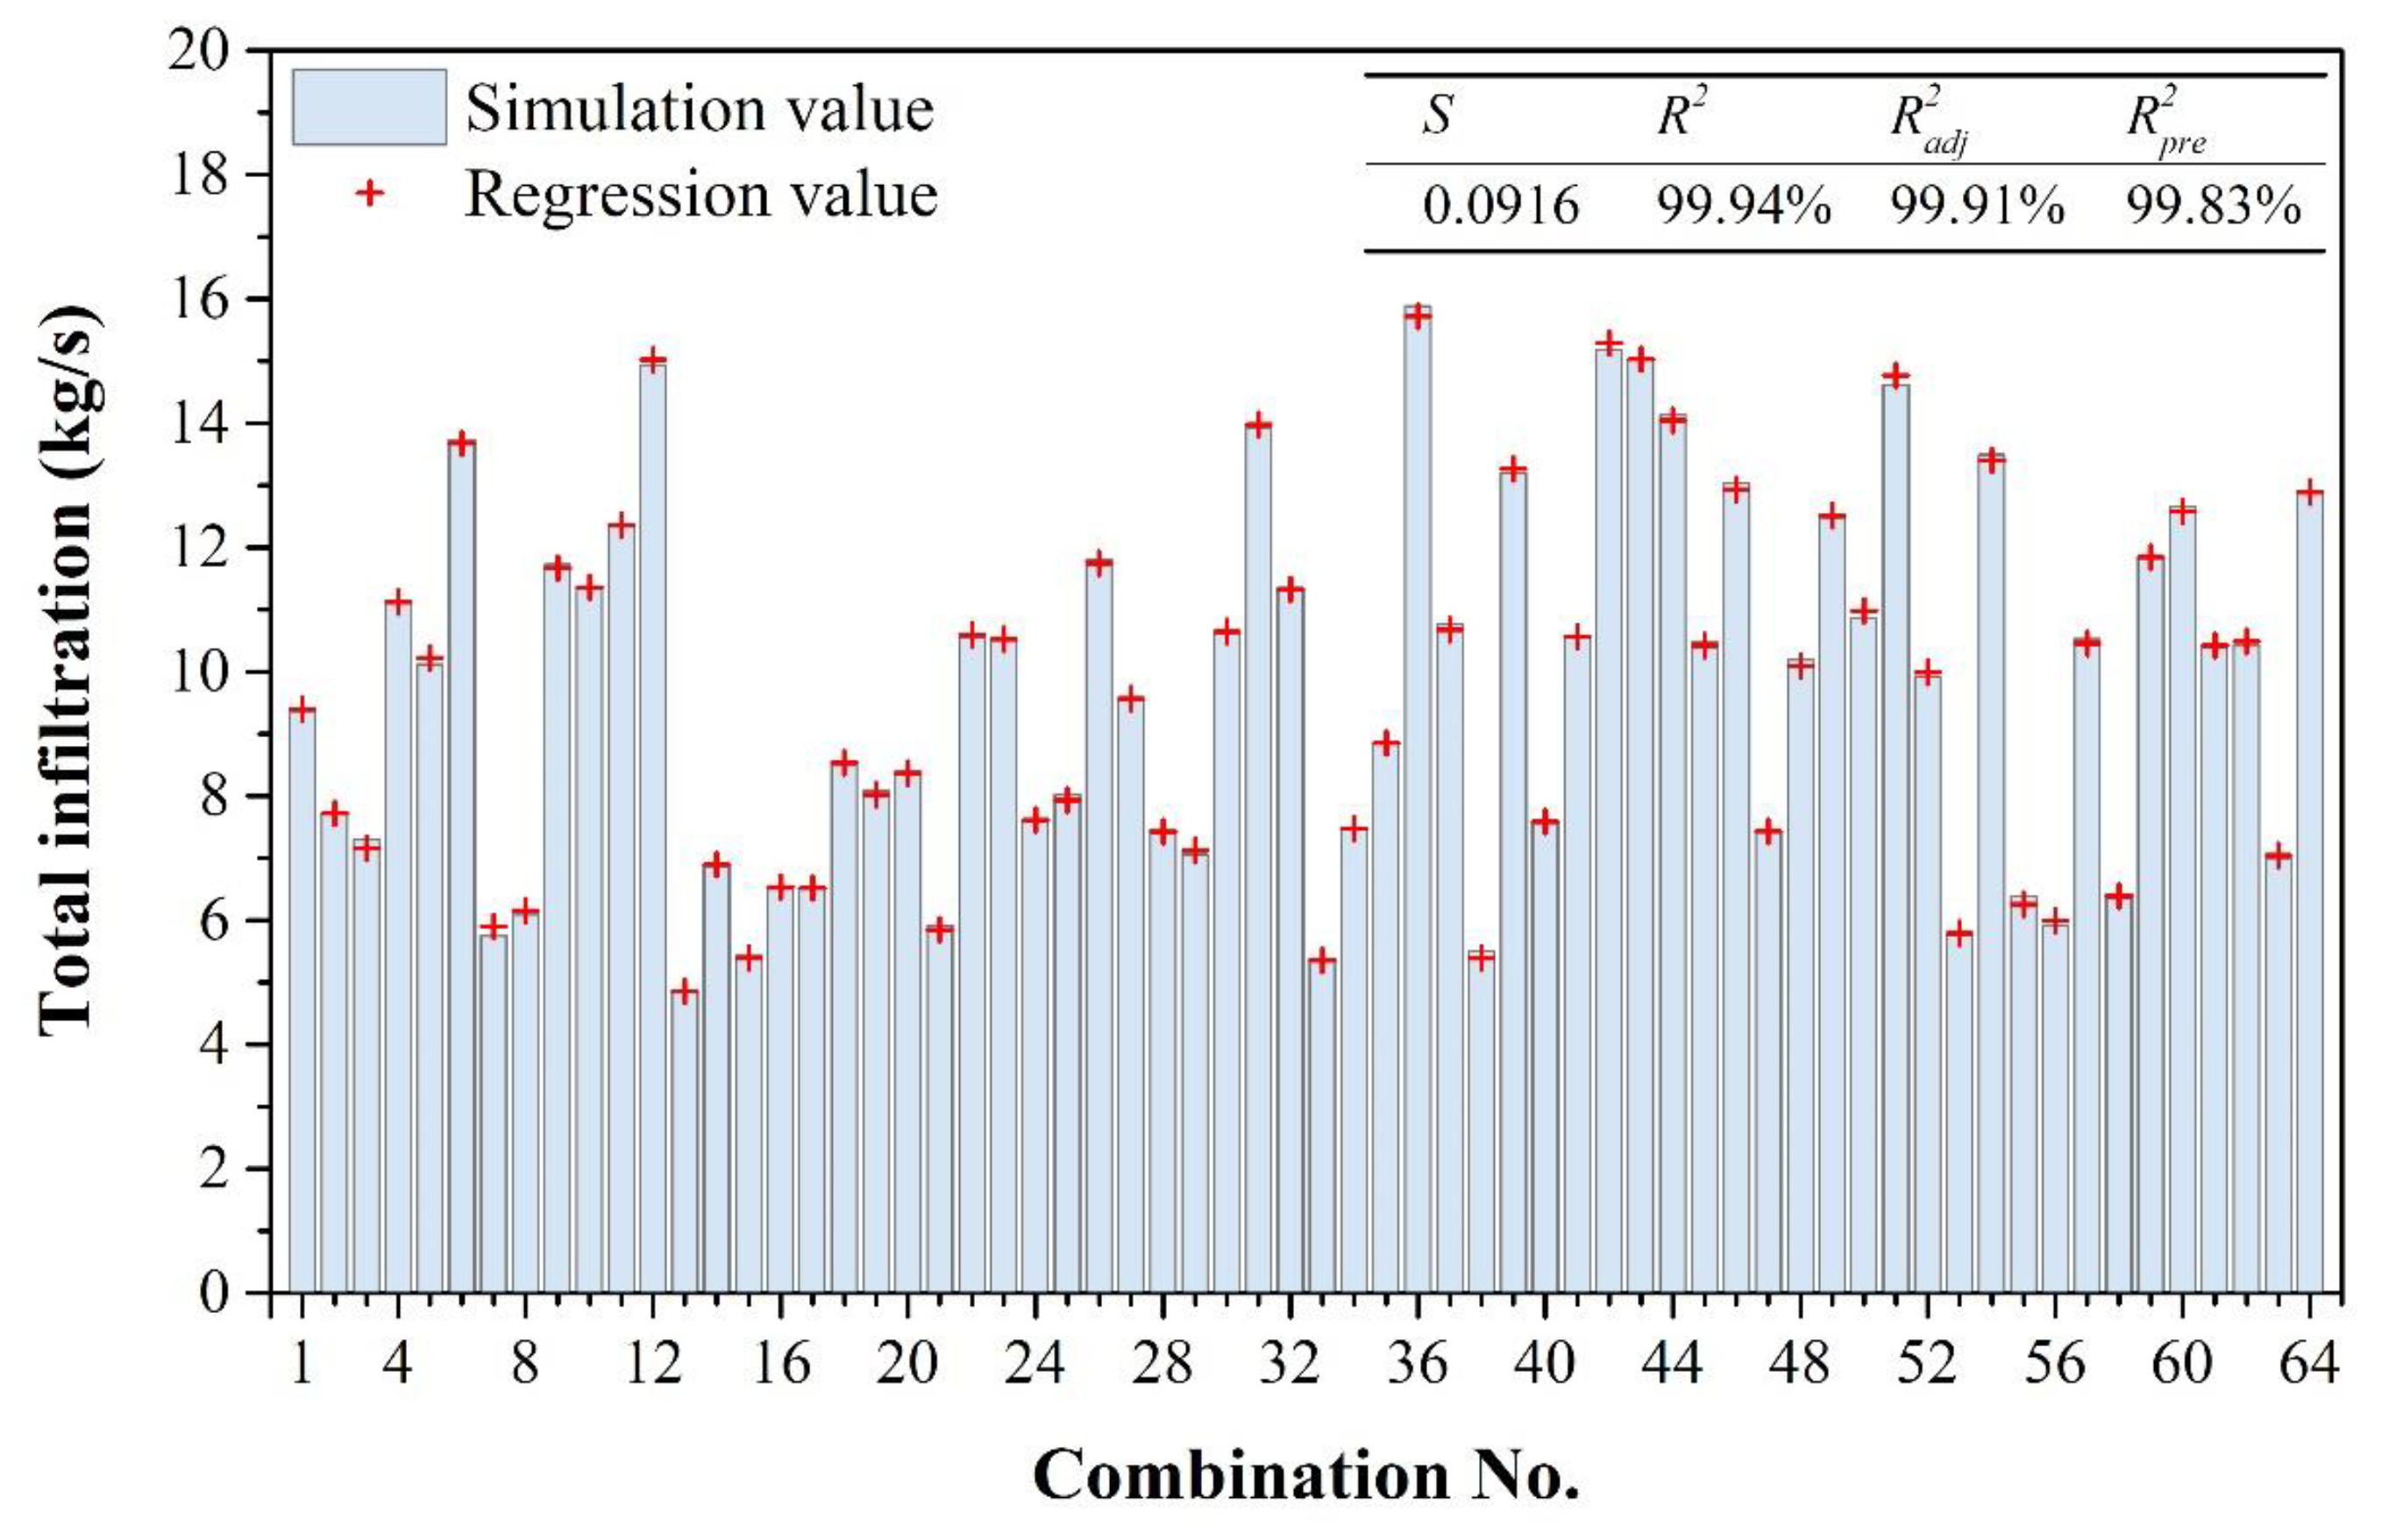
3.1.1. Interactions to the Total Infiltration

Based on the ANOVA results, the significant interactions with the total infiltration were sifted. All significant main effects and interactions are shown in Figure 7. The full ANOVA results are listed in Table A1. For instance, A (italic) presents the main effect of countermeasure A (regular), and AC (italic) presents the interaction effect between countermeasures A (regular) and C (regular). Figure 7 is a Pareto effect plot, where the value of each effect is the absolute value of the t-value of the t-test; the red line represents the critical value of the t-values at the confidence level of 0.05, i.e., the t-value of an effect greater than the critical value (p-value less than 0.05) is considered significant. Limited by space, insignificant effects are not shown in Figure 7. As can be seen from Figure 7, the main effect factors AH were all demonstrated to be significant. Therein, the factors AG have a positive effect, which means that the countermeasures A–G result in a decrease in the total infiltration. While the factor H has a negative effect and the measure H, room pressurization, is detrimental to the infiltration reduction, as discussed in Section 2.1.4, the infiltration increases ineluctably with a large quantity of air pumped into the building interior. In addition, some studies [1] draw the opposite conclusion with their experimental buildings. This inconsistency is likely caused by the difference in building volumes. Buildings with a larger volume usually endure a higher level of total infiltration flowrate, and the amount of reduction achieved using the room pressurization measure can offset the pumping. In this study, the case building has a comparatively small volume, and the existing fresh air system is rated at 3000 (m3/h)/floor. Therefore, the room pressurization measure using the existing HVAC system allows emergency operations to be carried out only in cases where the stack effect is severe.
There are up to 16 two-factor interactions in the regression result. Therein, 12 interactions are positive, and merely four interactions are negative. All the negative effects are also attributable to factor H, room pressurization. Meanwhile, there are 10 positive interactions that have a synergy of synergistic, which means that the combinations contained in these 10 interactions produce advantages in reducing total infiltration. Two three-factor interactions were found to be significant and to have a positive effect.
Furthermore, we noticed that factor F, which improves the tightness of the building envelope, has the highest appearance frequency and produces the most interaction with other factors except G. Countermeasure G, shaft cooling, works on the principle of reducing the temperature difference between interior and exterior to approximately minimize the vertical Δ P S E on each floor. Other measures, including F, work on the principle of changing horizontal pressure distribution and increasing resistance. Theoretically, no significant interaction exists between G and others. Thus, the interaction DG mentioned above presents the interaction effect of ABC actually according to the designed generator DG = ABC in FFD. This kind of alias is inevitable in FFD but has very limited impact on final results. Nevertheless, the analysis of each interaction is necessary to avoid confusion in decision-making.

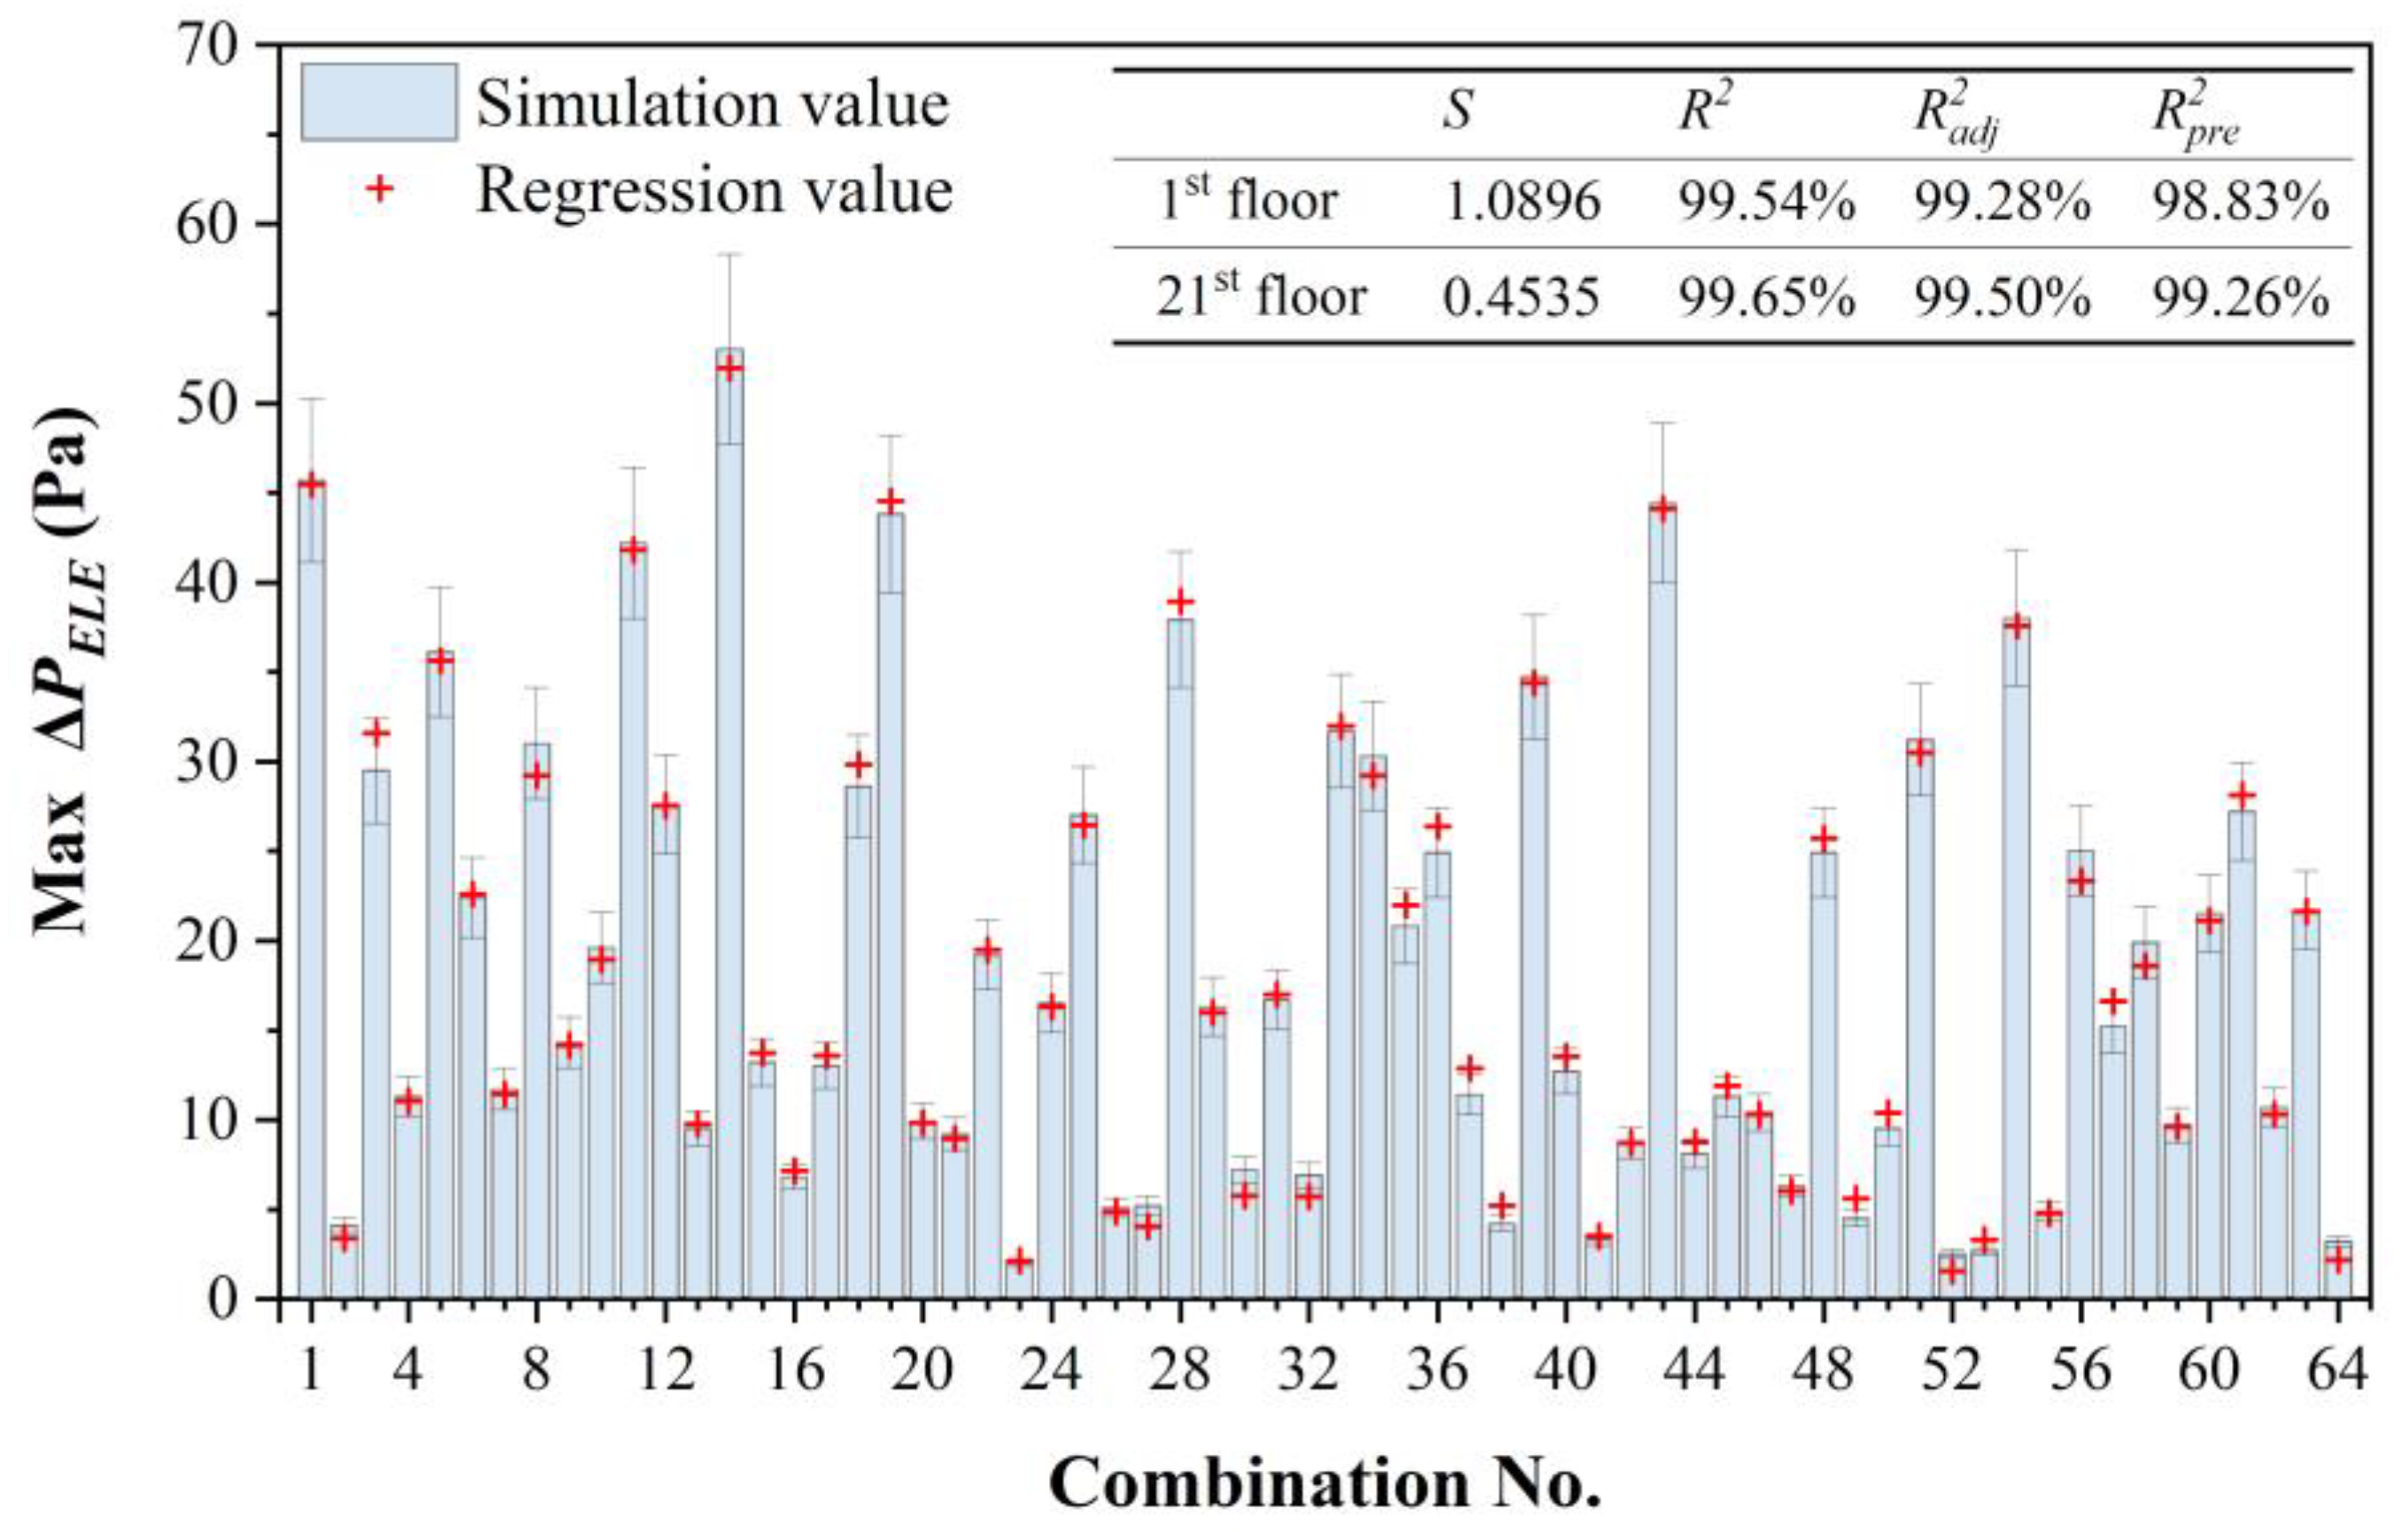
3.1.2. Interactions with the Pressure Difference at Elevator Doors

All significant main effects and interactions of the pressure difference at the first-floor elevator door are as shown in Figure 8. The full ANOVA results are listed in Table A2. For the pressure difference at the first-floor elevator door, the main effect factors were all demonstrated to be significant. The factors B and C have a negative effect. The principle of countermeasure C, improving the tightness of elevator doors, is easy to express according to Equations (10) and (11). The implementation of measure B, improving the tightness of stair doors, causes an indirect impact in that more air is forced to stack in front of elevator doors when the tightness of stair doors is improved because the elevator shafts and stairwells are the only vertical paths in the building interior. There were also 15 two-factor interactions that were demonstrated to be significant. The factors A and F show a higher appearance frequency in positive interactions. The combination of countermeasures B and C would likely be the least rational strategy because the interaction BC is both negative and synergistic.
All significant main effects and interactions of the pressure difference at the 21st floor elevator door are shown in Figure 9. The full ANOVA results are listed in Table A3. The main effect of factor E is unimportant. The countermeasure E, reducing the leakage area of openings, contains a term for reducing the leakage area of entrance doors, which has an effect on the first floor. While compared with the first floor, measure E has no direct impact on the horizontal distribution of pressure difference on the top floor. There were nine two-factor interactions that were demonstrated to be significant. As well as the first floor, the two-factor interactions containing factors B and C are all negative. It needs to be emphasized that the interaction factor DG presents itself instead of ABC. Three-factor interactions were found to be significant and beneficial. Although the three-factor interactions all contain C, the other factors have enough positive effects to offset the negative effect.

3.2. Effect of Countermeasure Combinations

3.2.1. Effect of Countermeasure Combinations on the Total Infiltration

Usually, for discrete variables with two levels, the equation is written as a branch structure. For a better visual display, the regression model was expressed in uncoded units, as Equation (19):
y ^ T F = 9.739 0.245 A 0.446 B 0.315 C 0.672 D 0.152 E 1.216 F 0.209 G + 2.494 H + 0.086 A C 0.054 A D + 0.031 A E + 0.066 A F 0.042 B D + 0.109 B F + 0.041 B H + 0.105 C D + 0.041 C E + 0.105 C F + 0.034 C H + 0.213 D F + 0.045 A B C + 0.093 D H + 0.038 E F 0.259 F H 0.031 A C F 0.042 C D F
where y ^ T F is the regression value of the responding total infiltration flowrate for the entire building, kg/s. A–H are effect factor variables, which have two values of +1 and −1. For instance, in the combination AC, A, and C have a value of +1, and the rest of the main effect factor variables (B, D, E, F, G, and H) have a value of −1. Furthermore, there is AC = (+1) × (+1), AD = (+1) × (−1), and BD = (−1) × (−1).
This regression model has better fit and better predictive reliability. As shown in Figure 10, the regression values are very close to the simulation values of 64 experimental combinations, with a maximum difference of 2.65%. Compared with the sum values of countermeasures, the regression values containing interactions are more accurate. As shown in Figure 11, the regression values have better proximities to simulation values than the sum of measures in the significant combinations, while in the unsignificant combinations, the regression values remain accurate but have no remarkable superiority. Since portions of the interactions have been proven significant in countermeasure combinations, this regression model is more realistic for practical application.
Based on the results of the regression model, all combinations were listed, and the effects on total infiltration were calculated. As shown in Figure 12, the candidate combinations are arranged in order from the highest reducing level to the lowest, and the alias factors are repaired. There are 45 combinations of not exceeding three measures that have a reducing effect on total infiltration. The highest reduction appears to be 45.3% due to the combination of BDF, i.e., improving the tightness of stair doors and passenger elevator vestibule doors, and the building envelope. In addition, the combinations ADF, CDF, and BCF also present a reducing level exceeding 40%. F, improving the tightness of the building envelope, has the highest rank among single-measure combinations and shows the highest appearance frequency in front-rank combinations. Furthermore, BD, AD, CD, BC, D, C, and B also show higher appearance frequencies, indicating the outstanding emphasis of their effects on reducing total infiltration.
In theory, the optimum strategy containing all positive measures has a limit reduction level of 57.7%. Obviously, the limit level is hindered by the increasing antagonistic effect. Meanwhile, the rapid increase in costs indicates that the strategies containing more than three measures are unpractical.

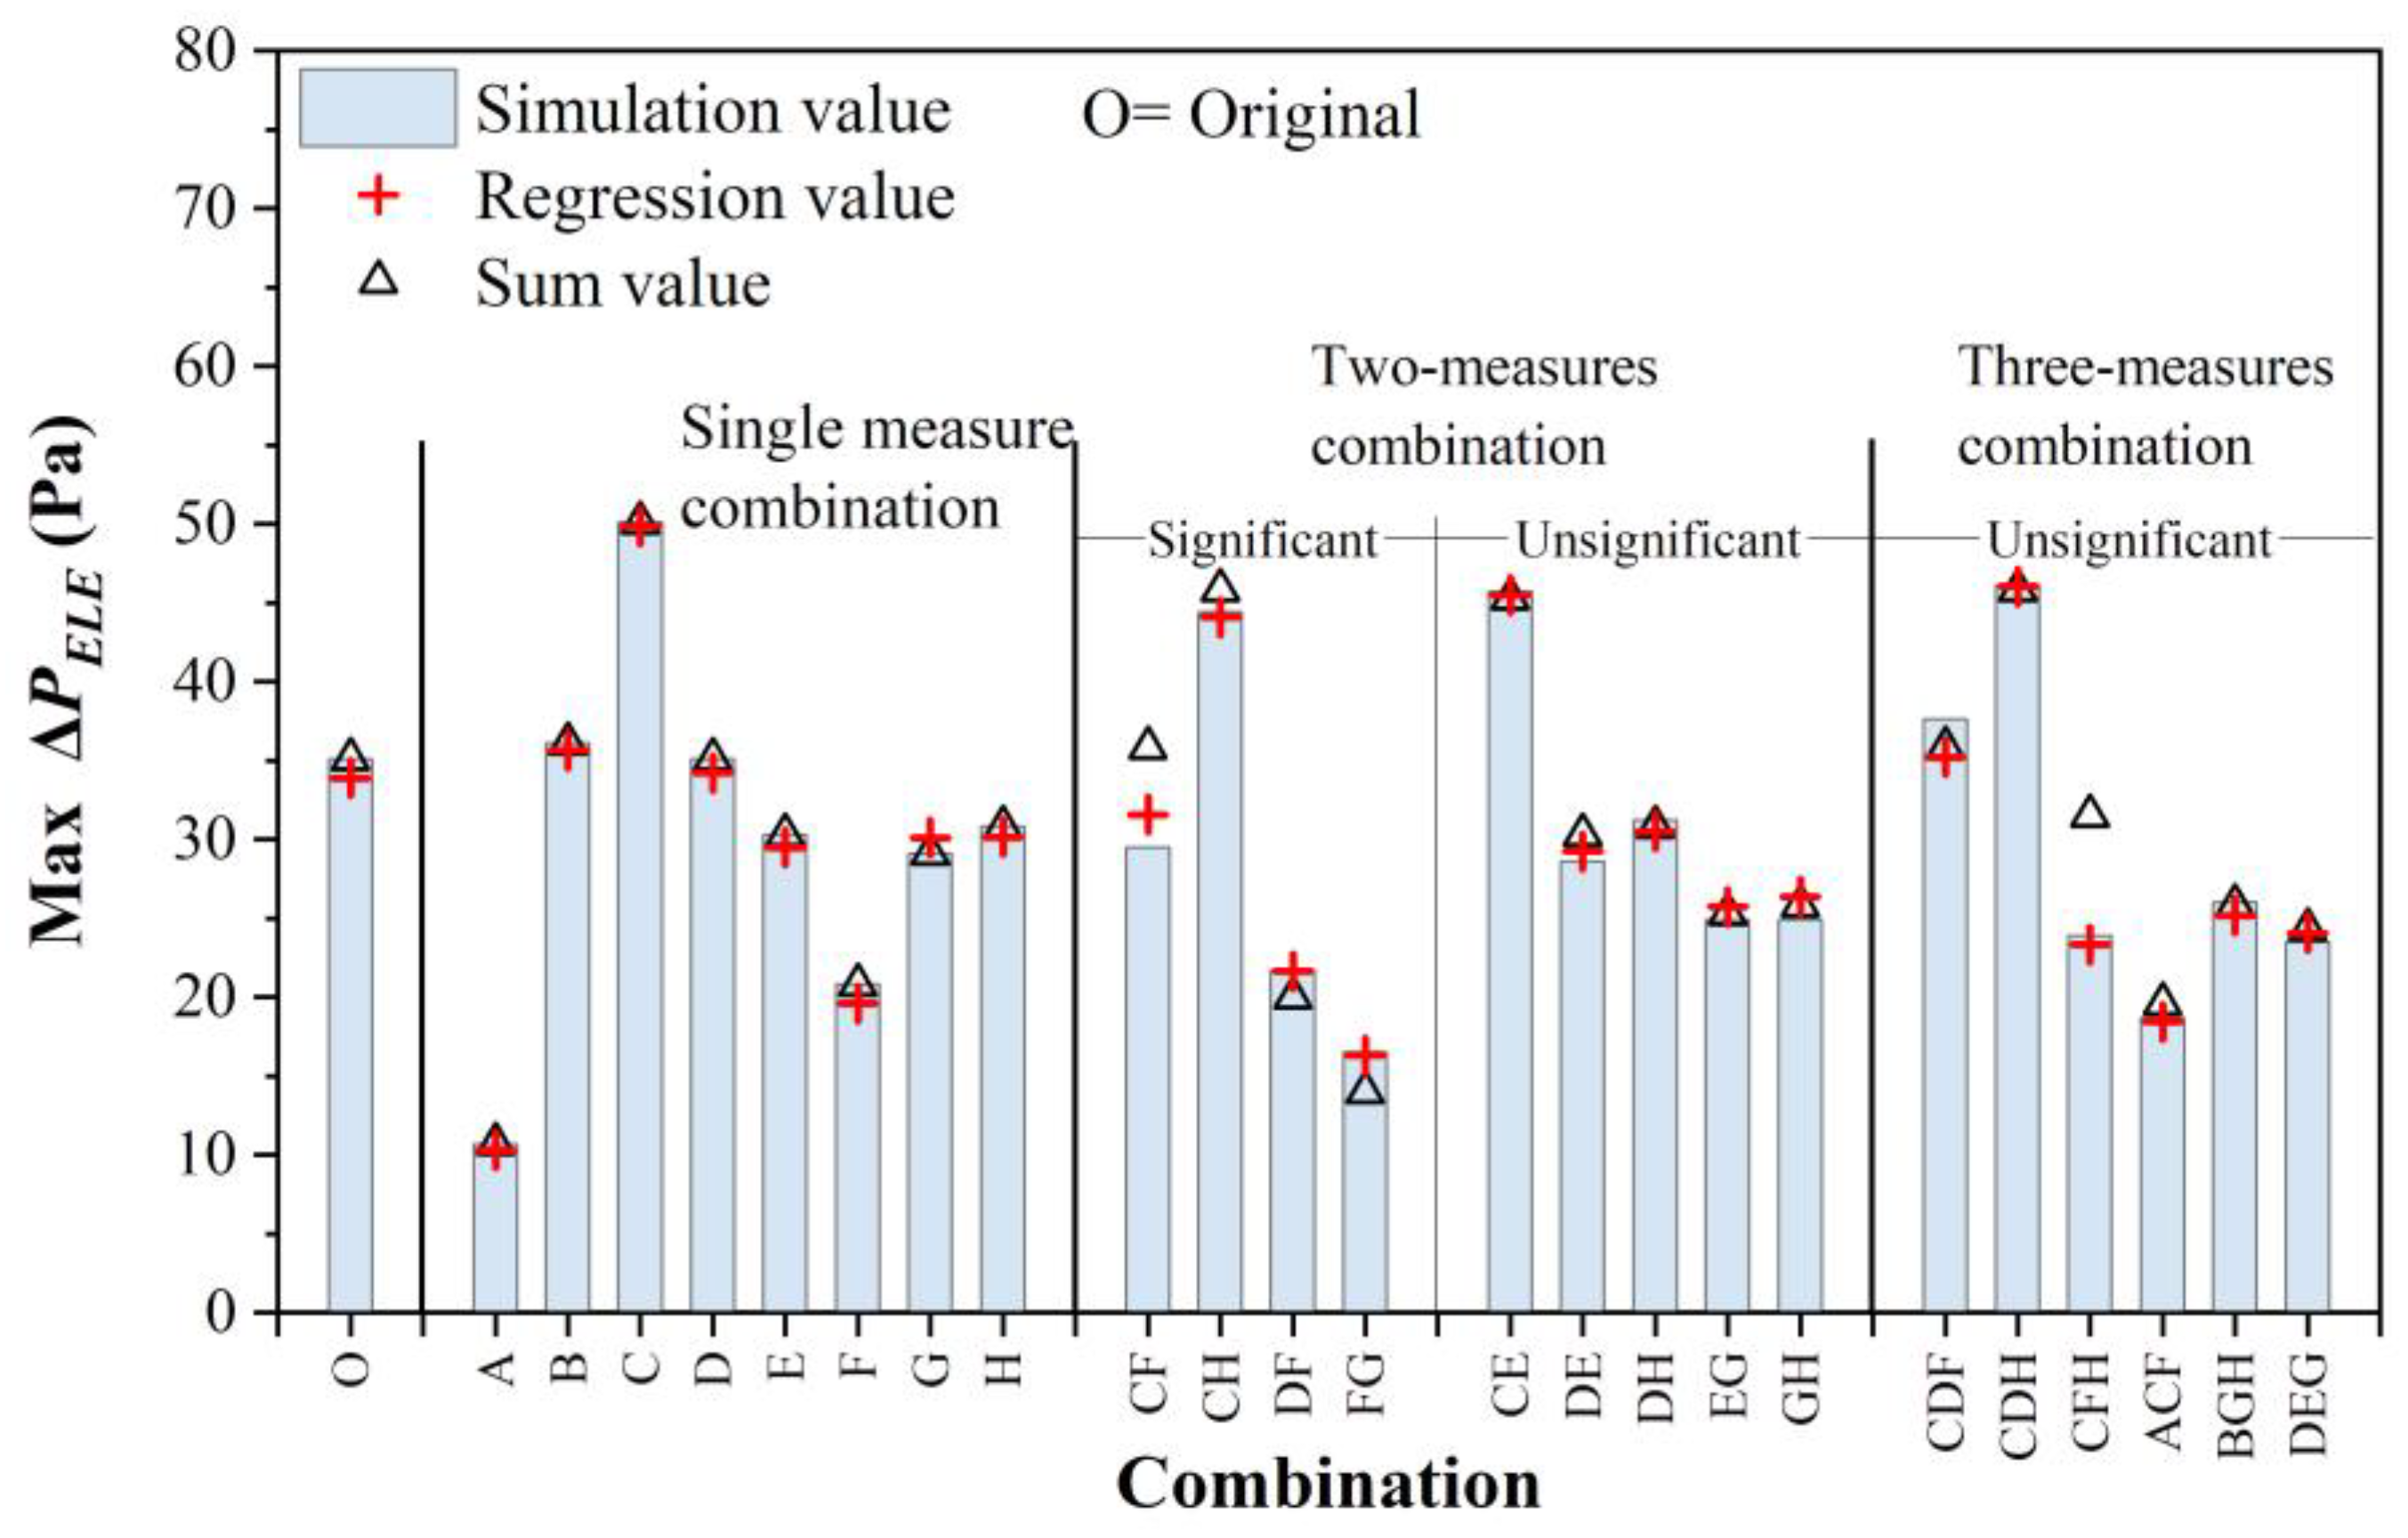
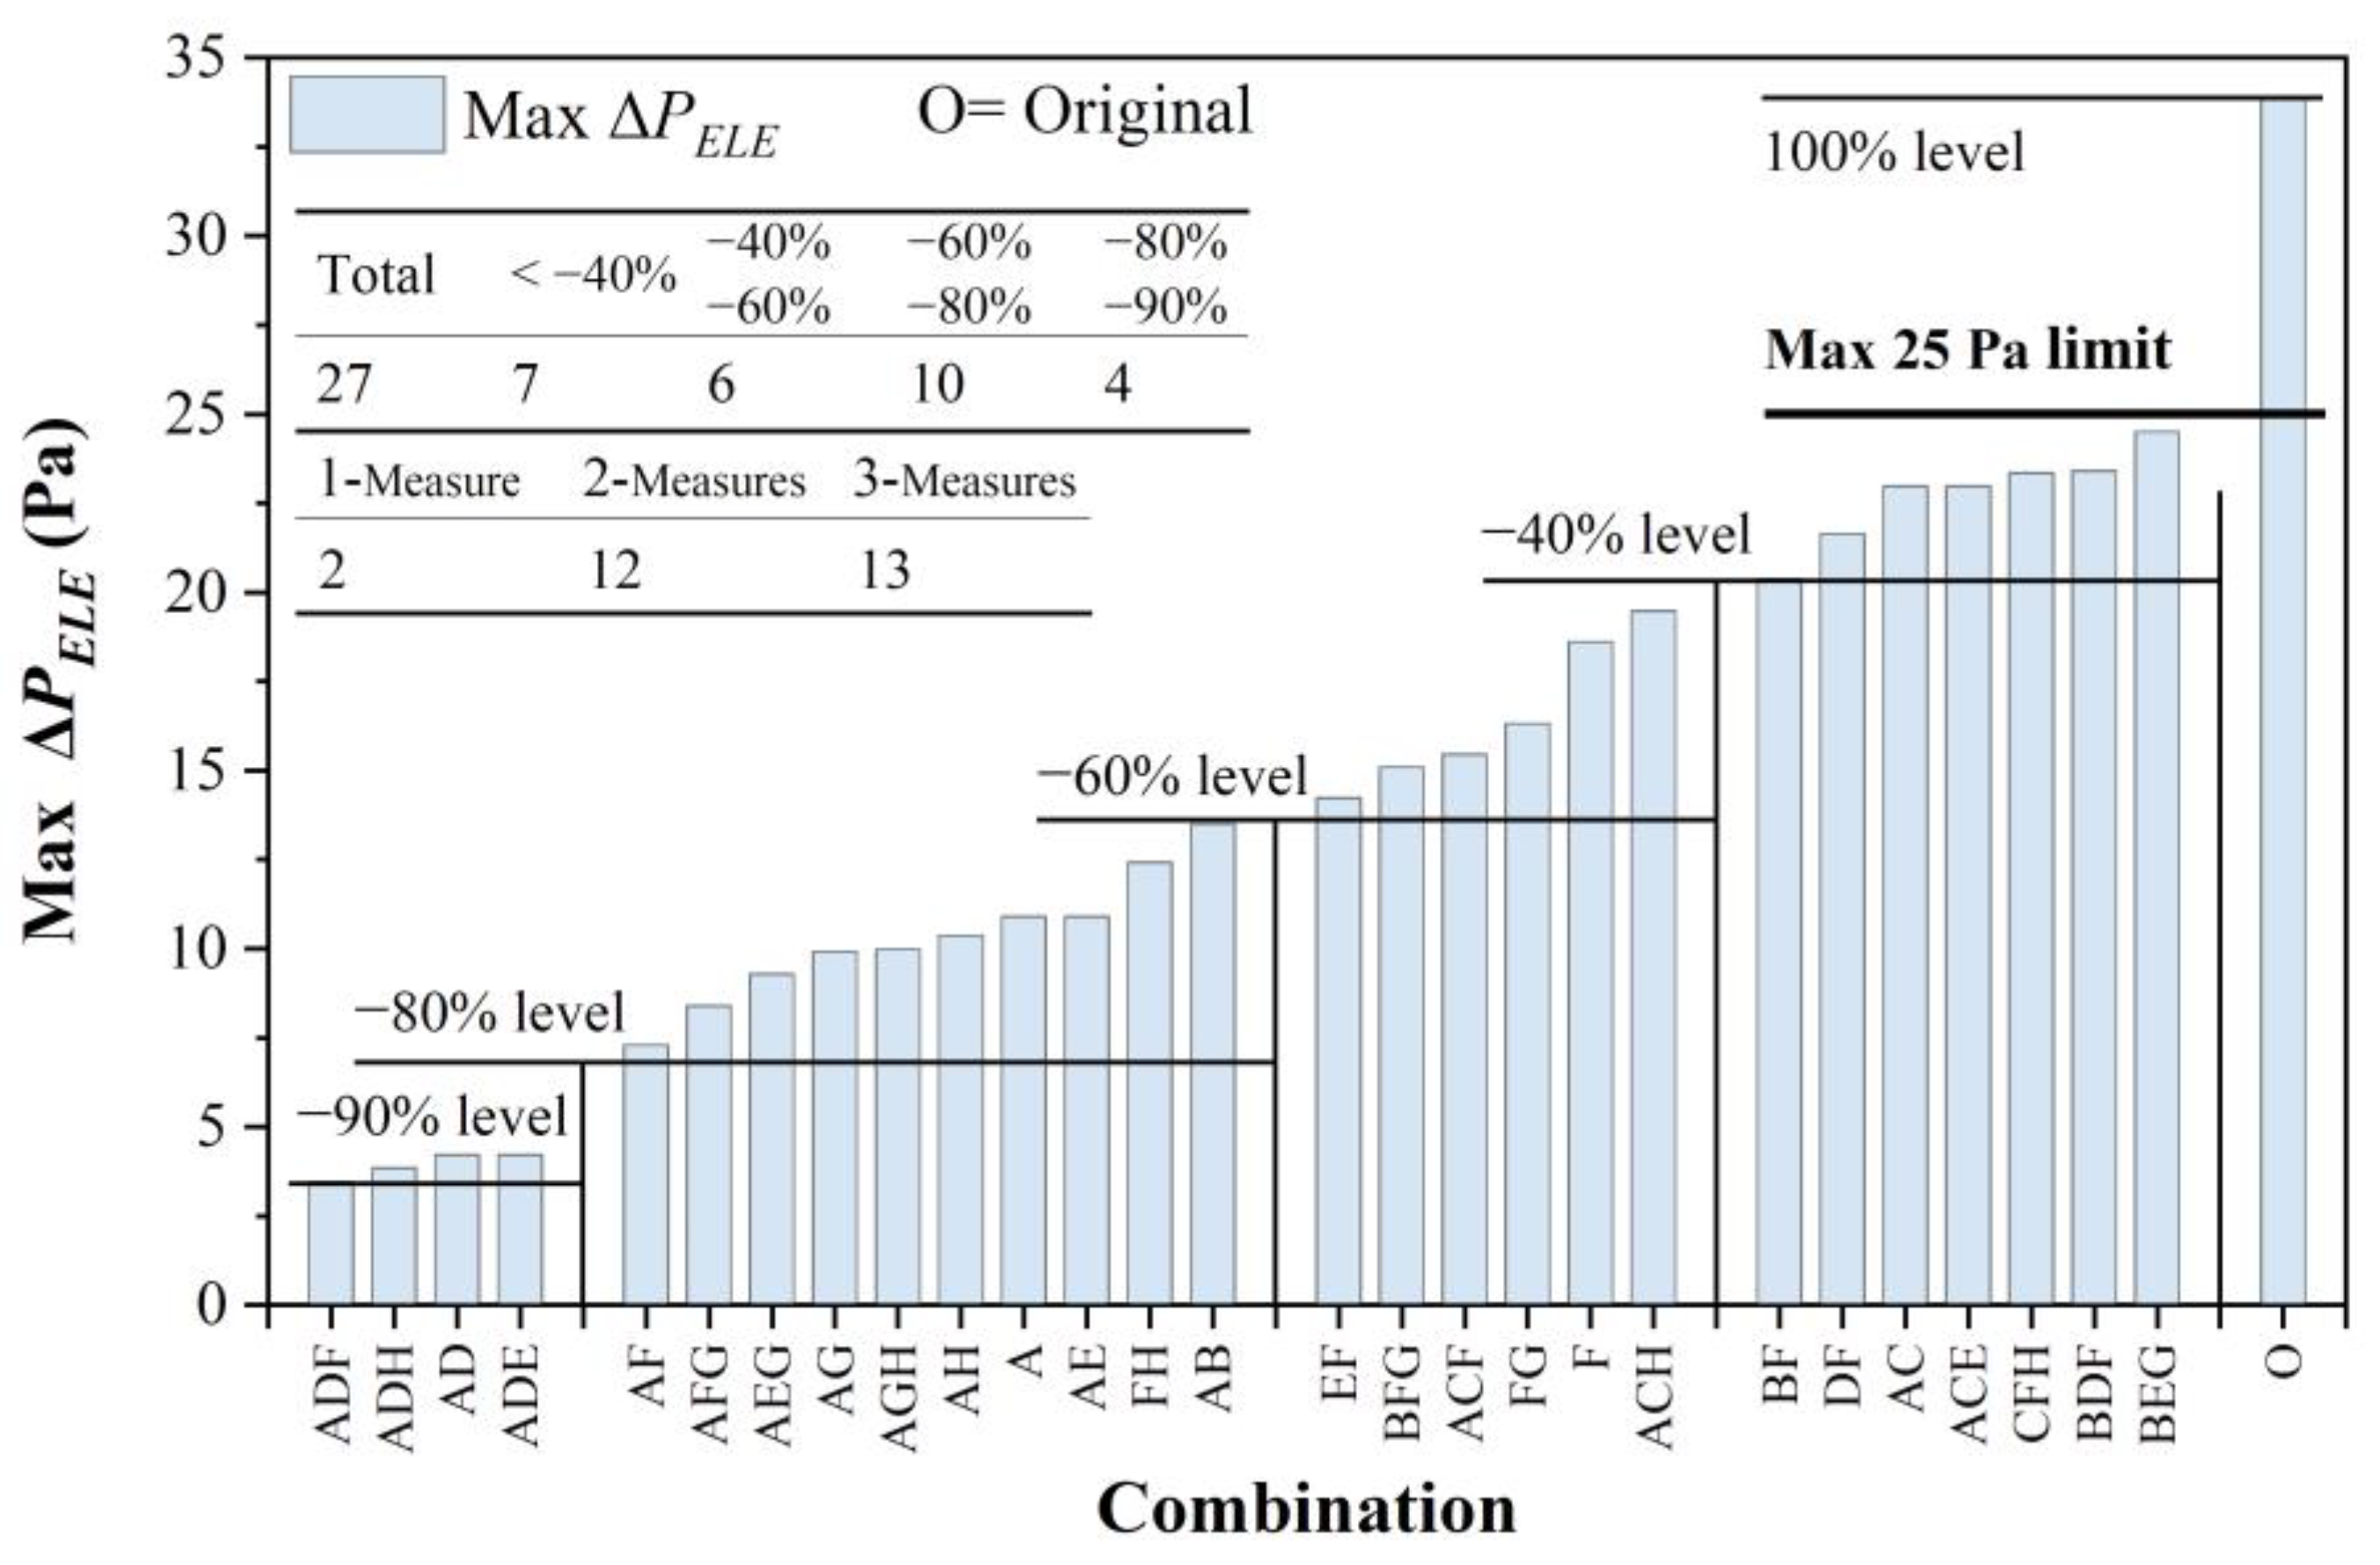
3.2.2. Effect of Countermeasure Combinations on the Maximum Pressure Difference at Elevator Doors

The regression models of the pressure difference at the first and twenty-first floor elevator doors were also expressed in uncoded units as Equations (20) and (21), respectively. The maximum pressure difference at elevator doors, MAX ΔPELE, refers to the larger value between pressure differences at elevator doors on the first and top floors and is expressed as Equation (22).
y ^ M P , f = 18.264 9.070 A + 0.480 B + 5.092 C 1.220 D 1.408 E 4.898 F 1.842 G 2.045 H 1.205 A C 1.717 A D + 0.783 A E + 3.067 A F + 0.848 A G + 0.945 A H + 0.345 B C 0.745 B G 0.348 C D 0.752 C F 0.427 C G 0.511 C H + 0.673 D F + 0.370 F G 0.620 F H
y ^ M P , t = 8.614 0.339 A + 0.517 B + 3.598 C 2.833 D 3.108 F 0.867 G 1.698 H + 0.227 B C 1.005 C D 1.205 C F 0.345 C G 0.708 C H + 1.295 D F + 0.286 D G + 0.555 D H 0.458 F H + 0.417 C D F + 0.202 C D H 0.211 C F H
y ^ M P = M A X ( y ^ M P , f , y ^ M P , t )
where y ^ M P , f and y ^ M P , t are the regression values of the responding pressure difference at the first and twenty-first floor elevator doors, respectively, Pa; y ^ M P is the regression value of the responding MAX ΔPELE, Pa; and A–H are effect factor variables.
As shown in Figure 13, the regression values are in accord with the simulation values of 64 experimental combinations, and most of the difference is within 5%. As with the regression model of total infiltration, the regression values of MAX ΔPELE containing interactions are more accurate than the sum values and have better proximities to simulation values in the significant combinations, as shown in Figure 14.
All combinations were listed, and the effects on MAX ΔPELE were calculated. As shown in Figure 15, the candidate combinations below the 25 Pa limit are also arranged in an order from the highest reducing level to the lowest, and the alias factors are repaired. There are 27 combinations of not exceeding three measures that present the reducing effect on MAX ΔPELE. The highest reduction appears to be 89.8% due to the combination ADF, i.e., adding passenger elevator vestibules on the first and second floors, improving the tightness of elevator vestibule doors, and improving the building envelope. Meanwhile, the combinations ADH, AD, and ADE also present a reducing level exceeding 80%. Since the most MAX ΔPELE take value from the first floor due to the existence of a lobby, several entrances, a large envelope area, and few interior partitions, measure A, adding passenger elevator vestibules on the first and second floors, shows the highest appearance frequency in all front-rank combinations. The measure D, improving the tightness of elevator vestibule doors, is a concomitant variable to the measure A. Furthermore, E, F, G, and H also show higher appearance frequencies.

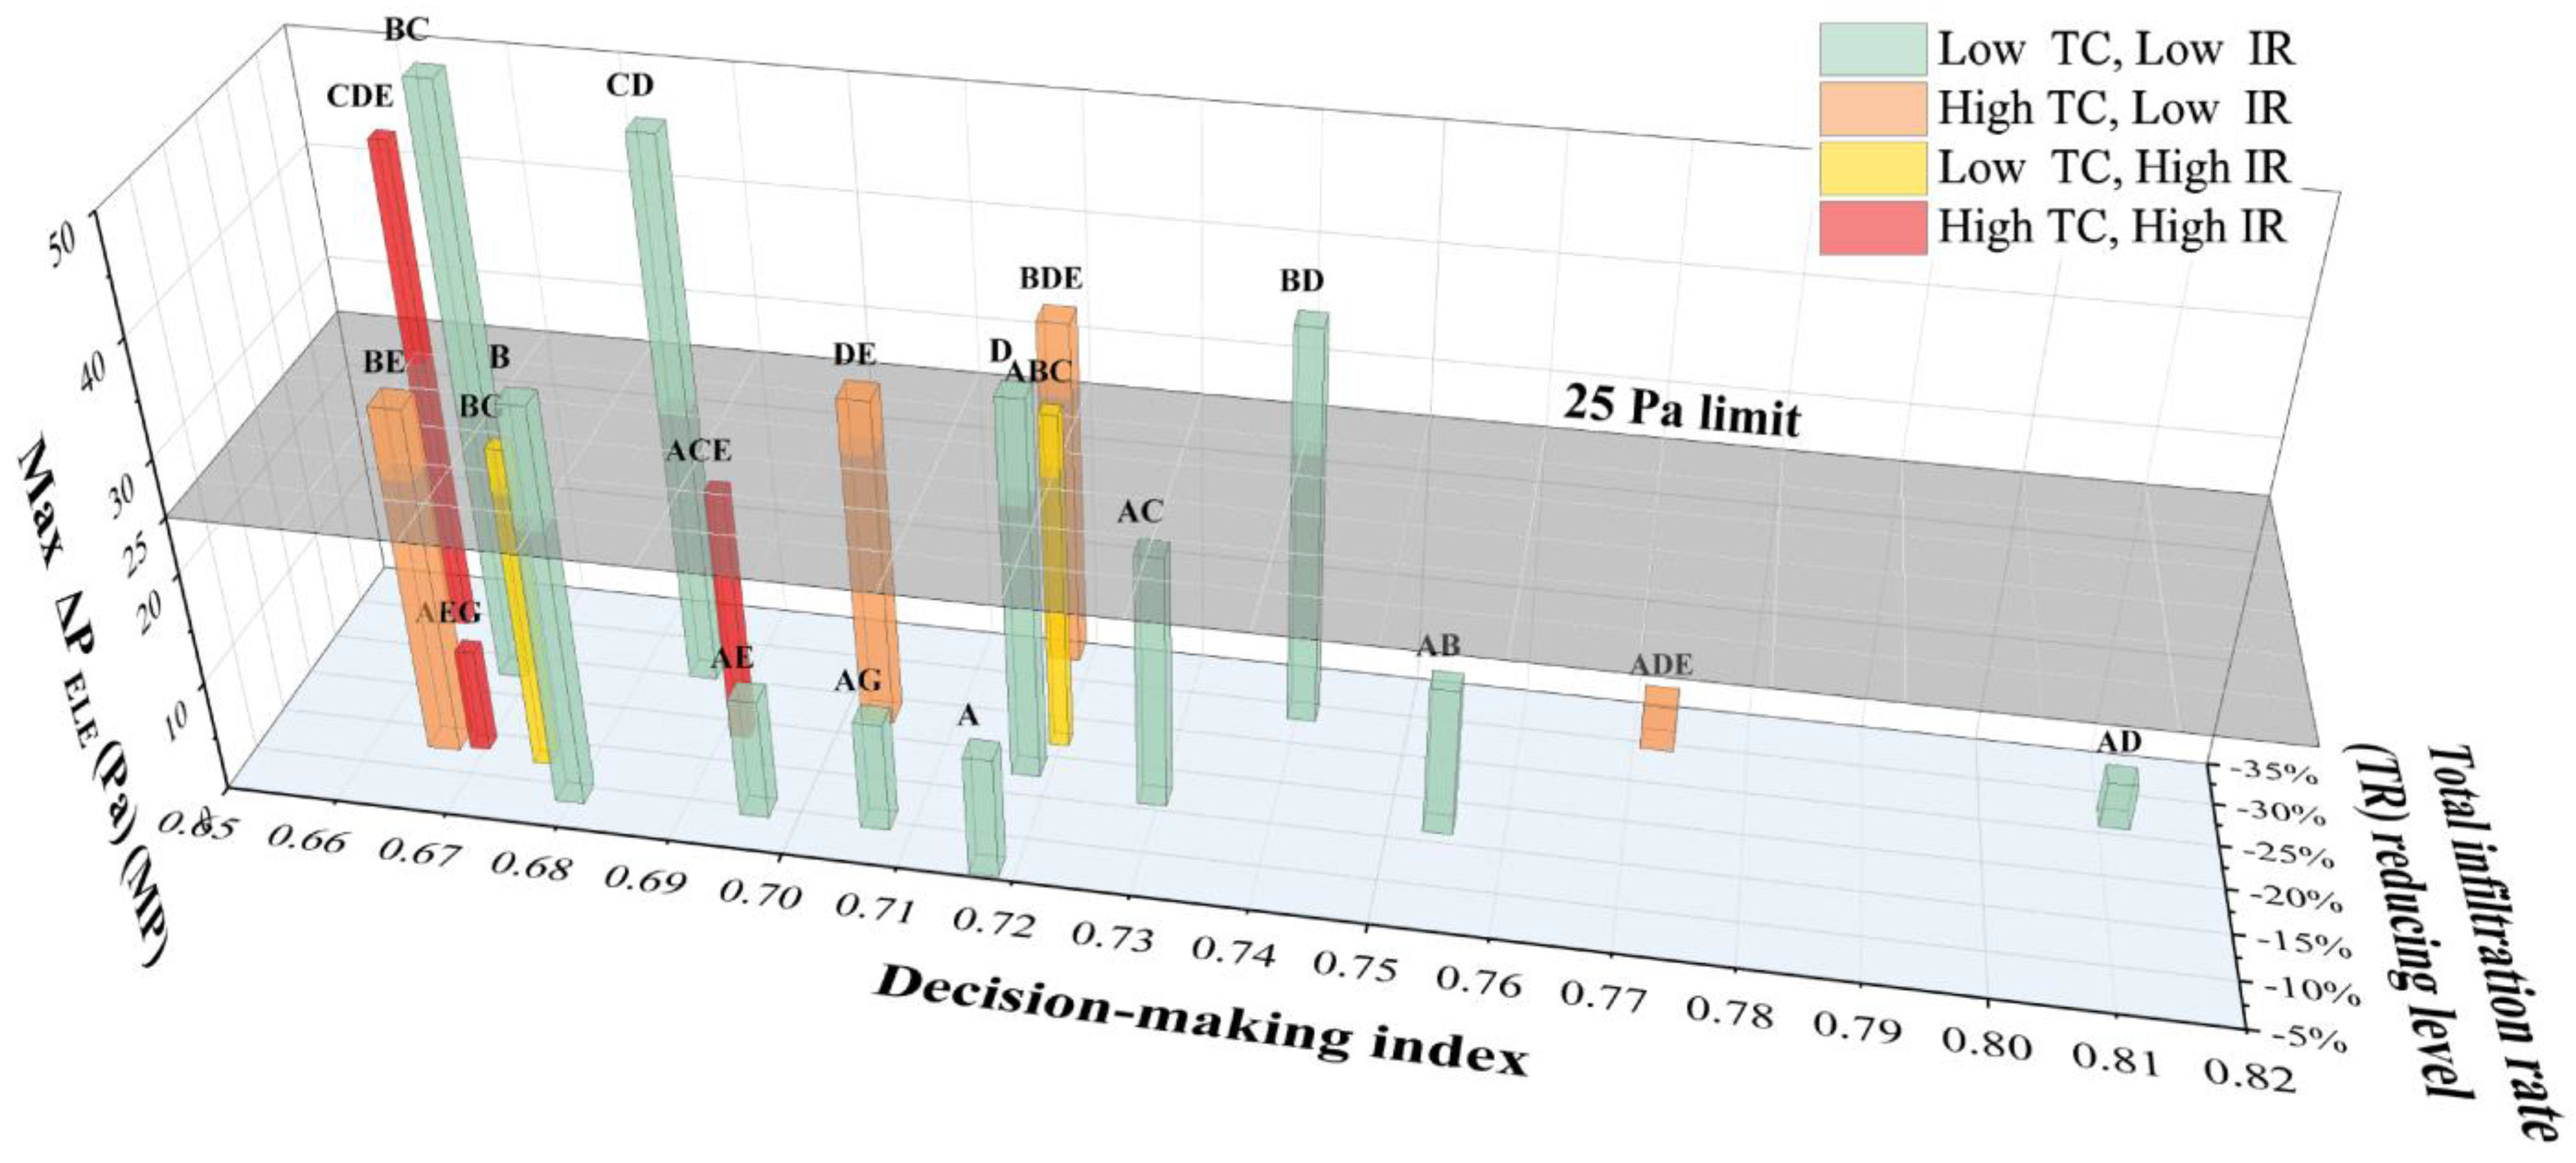
3.3. Decision-Making of Countermeasure Combinations to Stack Effect

The weighted TOPSIS was used to determine the most appropriate countermeasure for the target building. The decision-making indexes of all combinations containing no more than three measures were ranked. The combinations in the top twenty are listed in Table 2.
The indexes in Table 2 indicate a comprehensive evaluation containing TF, MP, TC, and IR. The first ranking is combination AD, i.e., adding passenger elevator vestibules on the first and second floors and improving the tightness of elevator vestibule doors, which also gets good grades in the effect analysis above. The second is combination ADE, a cooperative of AD and measure E, which reduces the leakage area of openings. The third and fourth rankings are AB and BD, which are combinations of measures A, D, and B. B is improving the tightness of stair doors. Obviously, measures A, B, and D are the most appealing in case building. Otherwise, measure F, which improves the tightness of the building envelope and had absolutely outstanding performance in previous analyses, has not even once appeared in this ranking because of its excessive investment and workload. While F is a common measure in renovation and retrofit, it is a feasible measure that takes AD, BD, or other measures as a concomitant of improving the envelope tightness to achieve larger energy savings if needed.
This ranking is not merely a decision-making index. The final strategy needs to be considered in three and four dimensions to correspond to the occupants’ demands and the building’s reality. To facilitate understanding, the sets of criteria for TC and IR were divided into two levels, “low” and “high”, using each median. The index and four criteria were integrated into one figure, Figure 16.
As shown in Figure 13, the decision-making index, the total infiltration flowrate (TF) reducing level, and MAX ΔPELE (MP) are along the x, y, and z-axis, respectively. The levels of TC and IR are distinguished by different colors. The combination AD has the highest index value, a superior performance on reducing infiltration and pressure difference, a low investment cost, and good implementation resistance. If a higher energy savings level is required, the ADE will be promoted, but at the cost of more investment. Another way is to take BD, but the price is the exceeding pressure difference during freezing days. The combinations AB and AC are also good choices, ignoring the mediocre performance of energy savings. All the strategies have their upsides and downsides; this figure can provide theoretical support for the final decision-making.

4. Discussion

The results of this study may vary depending on the building’s characteristics and the occupants’ demands, but the lessons learned from the analysis can be generalized for other cases. The methodology proposed here can be applied to similar retrofit or commissioning projects. The researchers can base their final decision-making on the index and ranking and select the highest-ranked countermeasure as the chosen strategy, or they can provide a quantitative basis for final decision-making when demand changes. There are several key steps worth highlighting in the use of the multi-criteria decision-making model:
(1)
This multi-criteria decision-making approach can be extended to other buildings in other regions because the main methods used in the model, such as FFD and TOPSIS, are basic and generic;
(2)
It is not required to utilize FFD to reduce the number of experiments when fewer countermeasure combinations are available; DOE can be used to obtain more comprehensive results;
(3)
Criteria are not fixed, especially subjective constraints such as investment cost and implementation resistance, and can be adjusted or replaced as necessary;
(4)
Even with a guide for the index and ranking, the final decision-making requires multiple considerations to correspond to the occupants’ demands and the building’s reality.

5. Conclusions

The following conclusions were drawn by analyzing the results of the FFD and the multi-criteria model:
  • Significant interactions between countermeasures are proved to exist and are unneglectable in calculating the effects of combinations. There are forty two-factor and five three-factor significant interactions in total. Interactions produce positive or negative effects and present synergistic or antagonistic relationships between countermeasures. Analyzing interactions exactly can improve the accuracy of the regression model and help avoid confusion in decision-making.
  • The two-level FFD is an effective method to obtain the coefficients of a regression model containing interaction effects. These regression models are very precise for fitting the results of simulation experiments and predicting the effects of candidate combinations. The regression of total infiltration has a maximum difference of 2.65%, and the maximum pressure difference has most of the difference within 5%.
  • The countermeasure combinations are good at mitigating the stack effect. The highest infiltration reduction appears to be 45.3% in this case, due to the combination of improving the tightness of stair doors, elevator vestibule doors, and the envelope. And the highest pressure difference reduction appears to be 89.8% due to the retrofit of the first-floor vestibule, all vestibule doors, and the envelope.
  • The multi-criteria model using the TOPSIS method can give each countermeasure combination a comprehensive index. The model can determine the most appropriate countermeasure combinations and abandon the bad and unrealistic ones. The multilateral comparison of the index with four criteria can provide the theoretical support required for decision-making.
  • The ideal solution to mitigating the stack effect in the case building is the combination of adding passenger elevator vestibules on the lobby floors and improving the tightness of elevator vestibule doors on all floors, which can reduce infiltration and pressure difference by 26.88% and 87.58%, respectively, with low-level investment costs and implementation resistance.
The multi-criteria decision-making is proposed to fill the research gap on the practical applicability of countermeasure combinations and to provide guidance for comprehensive evaluation and final decision-making. The ranking of countermeasure combinations for the final decision-making index is calculated by assigning weights and conducting comprehensive analysis on four criteria: infiltration energy loss, maximum pressure difference, investment cost, and implementation resistance. The researchers can base their final decision-making on the index and ranking and select the highest-ranked countermeasure as the chosen strategy, or they can provide a quantitative basis for final decision-making when demand changes.
This study concentrated on analyzing the performance of the countermeasures. Meanwhile, some behavior measures, such as the elevator zone control and entrance open scheme, likely have the benefit of mitigating the stack effect. Furthermore, analyses of the airtightness of structures and the architectural floor layout with variants of the positioning of vertical shafts can also be further optimized. Finally, the analysis in this study based on the typical design condition is static. A 3D dynamic analysis throughout the whole heating season is certainly more accurate and practical. In further work, a dynamic analysis including more countermeasures should be carried out, and the design of the FFD should be further optimized.

Author Contributions

Conceptualization, Y.L. and N.Z.; methodology, Y.L.; software, Y.H.; validation, Y.L., N.Z. and Y.H.; formal analysis, Y.L.; investigation, Y.L.; resources, N.Z.; data curation, Y.L.; writing—original draft preparation, Y.L.; writing—review and editing, N.Z. and Y.H.; visualization, Y.L.; supervision, N.Z.; project administration, N.Z.; funding acquisition, N.Z. All authors have read and agreed to the published version of the manuscript.

Funding

This research was funded by the Program of National Science and Technology of China during the Thirteenth Five-year Plan, grant number 2016YFC0700707.

Data Availability Statement

Not applicable.

Conflicts of Interest

The authors declare no conflict of interest.

Appendix A

Table A1. The significant main effects and interactions with the total infiltration.
Main EffectInteraction
TermEffectt-Valuep-ValueDirection aTermEffectt-Valuep-ValueDirection aSynergy b
A−0.490−21.400.000PAC0.1727.500.000PS
B−0.891−38.900.000PAD−0.108−4.700.000PA
C−0.631−27.520.000PAE0.0632.730.010PS
D−1.344−58.650.000PAF0.1315.720.000PS
E−0.303−13.230.000PBD−0.084−3.670.001PA
F−2.432−106.150.000PBF0.2179.470.000PS
G−0.419−18.270.000PBH0.0823.580.001NS
H4.988217.690.000NCD0.2099.120.000PS
CE0.0813.530.001PS
CF0.2109.160.000PS
CH0.0692.990.005NS
DF0.42718.610.000PS
DG0.0903.920.000PS
DH0.1868.120.000NS
EF0.0763.330.002PS
FH−0.519−22.640.000NA
ACF−0.062−2.710.010PA
CDF−0.083−3.630.001PA
a P: positive. N: negative. The responding variable’s decreasing direction is the positive direction. b S: synergistic. A: antagonistic.
Table A2. The significant main effects and interactions of the pressure difference at elevator door (1st floor).
Main EffectInteraction
TermEffectt-Valuep-ValueDirection aTermEffectt-Valuep-ValueDirection aSynergy b
A−18.141−66.590.000PAC−2.409−8.840.000PA
B0.9593.520.001NAD−3.434−12.610.000PA
C10.18437.390.000NAE1.5665.750.000PS
D−2.441−8.960.000PAF6.13422.520.000PS
E−2.816−10.340.000PAG1.6976.230.000PS
F−9.797−35.960.000PAH1.8916.940.000PS
G−3.684−13.530.000PBC0.6912.540.015NS
H−4.091−15.020.000PBG−1.491−5.470.000PA
CD−0.697−2.560.014NA
CF−1.503−5.520.000NA
CG−0.853−3.130.003NA
CH−1.022−3.750.001NA
DF1.3474.940.000PS
FG0.7412.720.010PS
FH−1.241−4.550.000PA
a P: positive. N: negative. The responding variable’s decreasing direction is the positive direction. b S: synergistic. A: antagonistic.
Table A3. The significant main effects and interactions of the pressure difference at elevator door (21st floor).
Main EffectInteraction
TermEffectt-Valuep-ValueDirection aTermEffectt-Valuep-ValueDirection aSynergy b
A−0.678−5.980.000PBC0.4534.000.000NS
B1.0349.120.000NCD−2.009−17.720.000NA
C7.19763.480.000NCF−2.409−21.250.000NA
D−5.666−49.970.000PCG−0.691−6.090.000NA
F−6.216−54.820.000PCH−1.416−12.490.000NA
G−1.734−15.300.000PDF2.59122.850.000PS
H−3.397−29.960.000PDG0.5725.040.000PS
DH1.1099.780.000PS
FH−0.916−8.080.000PA
CDF0.8347.360.000PS
CDH0.4033.560.001PS
CFH−0.422−3.720.001PA
a P: positive. N: negative. The responding variable’s decreasing direction is the positive direction. b S: synergistic. A: antagonistic.

References

  1. Lim, H.; Seo, J.; Song, D.; Yoon, S.; Kim, J. Interaction analysis of countermeasures for the stack effect in a high-rise office building. Build. Environ. 2020, 168, 106530. [Google Scholar] [CrossRef]
  2. ASHRAE. 2019 ASHRAE HANDBOOK-Heating, Ventilating, and Air-Conditioning APPLICATIONS, SI ed.; ASHRAE: Atlanta, GA, USA, 2019. [Google Scholar]
  3. Antczak-Jarzabska, R.; Pawlowski, K.; Niedostatkiewicz, M. Improvement of the Chimney Effect in Stack Ventilation. Appl. Sci.-Basel 2021, 11, 9185. [Google Scholar] [CrossRef]
  4. ASHRAE. 2017 ASHRAE Handbook-Fundamentals, SI ed.; ASHRAE: Atlanta, GA, USA, 2017. [Google Scholar]
  5. Kosonen, R.; Jokisalo, J.; Ranta-aho, I.; Koikkalainen, E.-P. Methods to Reduce Stack Effect and Improve Energy Efficiency in a Nordic High Rise Residential Building. In Proceedings of the 10th International Symposium on Heating, Ventilation and Air Conditioning (ISHVAC), Jinan, China, 19–22 October 2017. [Google Scholar]
  6. Lee, J.; Song, D.; Park, D. A study on the development and application of the E/V shaft cooling system to reduce stack effect in high-rise buildings. Build. Environ. 2010, 45, 311–319. [Google Scholar] [CrossRef]
  7. Song, D.; Lim, H.; Lee, J.; Seo, J. Application of the mechanical ventilation in elevator shaft space to mitigate stack effect under operation stage in high-rise buildings. Indoor Built Environ. 2014, 23, 81–91. [Google Scholar] [CrossRef]
  8. Xie, M.; Wang, J.; Zhang, J.; Gao, J.; Pan, C.; Li, C. Field measurement and coupled simulation for the shuttle elevator shaft cooling system in super high-rise buildings. Build. Environ. 2021, 187, 107387. [Google Scholar] [CrossRef]
  9. Yu, J.; Kim, A.; Bae, S.; Cho, D.; Kim, K.H. HVAC Operation Schemes and Commissioning Process Resolving Stack Effect Problem and Adjusting According to Changes in the Environment: A Case Study in High-Rise Building in South Korea. Energies 2021, 14, 2299. [Google Scholar] [CrossRef]
  10. Yu, J.-y.; Song, K.-d.; Cho, D.-w. Resolving Stack Effect Problems in a High-Rise Office Building by Mechanical Pressurization. Sustainability 2017, 9, 1731. [Google Scholar] [CrossRef] [Green Version]
  11. CONTAM Introduction | NIST. Available online: https://www.nist.gov/el/energy-and-environment-division-73200/nist-multizone-modeling/software/contam (accessed on 12 August 2022).
  12. Lee, D.S.; Ji, K.H.; Jing, J.; Jo, J.H. Experimental study on elevator door reopening problems caused by stack induced pressure differences across the elevator door in buildings. Build. Environ. 2022, 221, 109271. [Google Scholar] [CrossRef]
  13. Bak, J.; Yoon, S.; Song, D.; Lim, H.; Kim, Y.S. Weather-driven infiltration and interzonal airflow in a multifamily high-rise building: Dwelling infiltration distribution. Build. Environ. 2020, 181, 107098. [Google Scholar] [CrossRef]
  14. McKeen, P.; Liao, Z.Y. The influence of airtightness on contaminant spread in MURBs in cold climates. Build. Simul. 2022, 15, 249–264. [Google Scholar] [CrossRef]
  15. Man, X.X.; Lu, Y.Y.; Li, G.L.; Wang, Y.L.; Liu, J. A study on the stack effect of a super high-rise residential building in a severe cold region in China. Indoor Built Environ. 2020, 29, 255–269. [Google Scholar] [CrossRef]
  16. Sha, H.; Qi, D. A Review of High-Rise Ventilation for Energy Efficiency and Safety. Sustain. Cities Soc. 2020, 54, 101971. [Google Scholar] [CrossRef]
  17. Yoon, S.; Song, D.; Kim, J.; Lim, H. Stack-driven infiltration and heating load differences by floor in high-rise residential buildings. Build. Environ. 2019, 157, 366–379. [Google Scholar] [CrossRef]
  18. Kim, J.; Yoon, S.; Koo, J.; Bak, J.; Kim, Y.-S. TDC-based horizontal leakage area estimation in multiunit residential buildings: Three correction factors. Build. Environ. 2021, 192, 107630. [Google Scholar] [CrossRef]
  19. Jankovic, A.; Chaudhary, G.; Goia, F. Designing the design of experiments (DOE)-An investigation on the influence of different factorial designs on the characterization of complex systems. Energy Build. 2021, 250, 111298. [Google Scholar] [CrossRef]
  20. Najjar, M.K.; Rosa, A.C.; Hammad, A.W.A.; Vazquez, E.; Evangelista, A.C.J.; Tam, V.W.Y.; Haddad, A. A regression-based framework to examine thermal loads of buildings. J. Cleaner Prod. 2021, 292, 126021. [Google Scholar] [CrossRef]
  21. Sadeghifam, A.N.; Zahraee, S.M.; Meynagh, M.M.; Kiani, I. Combined use of design of experiment and dynamic building simulation in assessment of energy efficiency in tropical residential buildings. Energy Build. 2015, 86, 525–533. [Google Scholar] [CrossRef]
  22. Zhong, G.; Deng, S.; Liu, Q.; Li, W.; Iop. Research on Energy Efficiency Design Optimization of Office Building Based on Doe Orthogonal Test. In Proceedings of the International Conference on Advances in Civil Engineering, Energy Resources and Environment Engineering (ACCESE), Changchun, China, 28–30 May 2019.
  23. Montgomery, D.C. Introduction to Statistical Quality Control, 7th ed.; John Wiley & Sons, Inc.: Hoboken, NJ, USA, 2013. [Google Scholar]
  24. Chidiac, S.E.; Catania, E.J.C.; Morofsky, E.; Foo, S. A screening methodology for implementing cost effective energy retrofit measures in Canadian office buildings. Energy Build. 2011, 43, 614–620. [Google Scholar] [CrossRef]
  25. Liu, Y.; Liu, T.; Ye, S.; Liu, Y. Cost-benefit analysis for Energy Efficiency Retrofit of existing buildings: A case study in China. J. Cleaner Prod. 2018, 177, 493–506. [Google Scholar] [CrossRef]
  26. Wang, X.; Lu, M.; Mao, W.; Ouyang, J.; Zhou, B.; Yang, Y. Improving benefit-cost analysis to overcome financing difficulties in promoting energy-efficient renovation of existing residential buildings in China. Appl. Energy 2015, 141, 119–130. [Google Scholar] [CrossRef]
  27. Ding, Y.; Su, H.; Liu, K.; Wang, Q. Robust commissioning strategy for existing building cooling system based on quantification of load uncertainty. Energy Build. 2020, 225, 110295. [Google Scholar] [CrossRef]
  28. Giurca, I.; Aschilean, I.; Naghiu, G.S.; Badea, G. Selecting the Technical Solutions for Thermal and Energy Rehabilitation and Modernization of Buildings. In Proceedings of the 9th International Conference on Interdisciplinarity in Engineering (INTER-ENG), Univ Tirgu Mure, Fac Engn, Tirgu Mures, Romania, 8–9 October 2015. [Google Scholar]
  29. Mao, Y.H.; Wang, P.; Sun, F.; Zhou, W.H. Green building supplier selection based on advanced entropy-revised G1 combination weighting and TOPSIS. In Proceedings of the 3rd International Conference on Civil Engineering, Architecture and Building Materials (CEABM 2013), Jinan, China, 24–26 May 2013. [Google Scholar]
  30. Wang, E.; Alp, N.; Shi, J.; Wang, C.; Zhang, X.; Chen, H. Multi-criteria building energy performance benchmarking through variable clustering based compromise TOPSIS with objective entropy weighting. Energy 2017, 125, 197–210. [Google Scholar] [CrossRef]
  31. Zhang, J.; Zhao, X.; Liu, C.; Wang, W. Reliability Evolution of Elevators Based on the Rough Set and the Improved TOPSIS Method. Math. Probl. Eng. 2018, 2018, 4784965. [Google Scholar] [CrossRef] [Green Version]
  32. Shi, Y.C.; Li, X.F. Effect of mechanical ventilation on infiltration rate under stack effect in buildings with multilayer windows. Build. Environ. 2020, 170, 106594. [Google Scholar] [CrossRef]
  33. Khoukhi, M.; Yoshino, H.; Liu, J. The effect of the wind speed velocity on the stack pressure in medium-rise buildings in cold region of China. Build. Environ. 2007, 42, 1081–1088. [Google Scholar] [CrossRef]
  34. Ji, J.; Zhu, L.Q.; Ding, L.; Yu, L.X.; Wan, H.X. Numerical Investigation of External Wind Effect on Smoke Characteristics in a Stairwell. Fire Technol. 2020, 56, 1681–1702. [Google Scholar] [CrossRef]
  35. Huang, Y.D.; Xu, N.; Ren, S.Q.; Qian, L.B.; Cui, P.Y. Numerical investigation of the thermal effect on flow and dispersion of rooftop stack emissions with wind tunnel experimental validations. Environ. Sci. Pollut. Res. 2021, 28, 11618–11636. [Google Scholar] [CrossRef] [PubMed]
  36. Michalak, P. Thermal-Airflow Coupling in Hourly Energy Simulation of a Building with Natural Stack Ventilation. Energies 2022, 15, 4175. [Google Scholar] [CrossRef]
  37. Yoon, N.; Piette, M.A.; Han, J.M.; Wu, W.T.; Malkawi, A. Optimization of Window Positions for Wind-Driven Natural Ventilation Performance. Energies 2020, 13, 2464. [Google Scholar] [CrossRef]
  38. Jo, J.-H.; Lim, J.-H.; Song, S.-Y.; Yeo, M.-S.; Kim, K.-W. Characteristics of pressure distribution and solution to the problems caused by stack effect in high-rise residential buildings. Build. Environ. 2007, 42, 263–277. [Google Scholar] [CrossRef]
  39. Bak, J.; Koo, J.; Yoon, S.; Lim, H. Thermal Draft Load Coefficient for Heating Load Differences Caused by Stack-Driven Infiltration by Floor in Multifamily High-Rise Buildings. Energies 2022, 15, 1386. [Google Scholar] [CrossRef]
  40. Filis, V.; Kolarik, J.; Smith, K.M. The impact of wind pressure and stack effect on the performance of room ventilation units with heat recovery. Energy Build. 2021, 234, 110689. [Google Scholar] [CrossRef]
  41. Kravchenko, I.; Kosonen, R.; Jokisalo, J.; Kilpelainen, S. Performance of Modern Passive Stack Ventilation in a Retrofitted Nordic Apartment Building. Buildings 2022, 12, 96. [Google Scholar] [CrossRef]
  42. Carrie, F.R.; Olson, C.; Nelson, G. Building airtightness measurement uncertainty due to steady stack effect. Energy Build. 2021, 237, 110807. [Google Scholar] [CrossRef]
  43. Lee, J.; Go, B.; Hwang, T. Characteristics of Revolving Door Use as a Countermeasure to the Stack Effect in Buildings. J. Asian Archit. Build. Eng. 2017, 16, 417–424. [Google Scholar] [CrossRef] [Green Version]
  44. GB/T. Graduations and Test Methods of Air Permeability, Watertightness, Wind Load Resistance Performance for Building External Windows and Doors (GB/T 7106-2008); Standards Press of China: Beijing, China, 2008. [Google Scholar]
  45. Data Analysis Software|Statistical Software Package|Minitab. Available online: https://www.minitab.com/en-us/products/minitab/ (accessed on 14 June 2022).
Figure 1. Indoor and outdoor absolute pressure profiles by stack effect.
Buildings 13 00653 g001
Figure 2. Combined pressure distribution of thermal, wind, and HVAC systems.
Buildings 13 00653 g002
Figure 3. Horizontal pressure distribution across floor.
Buildings 13 00653 g003
Figure 4. The vertical air flow paths in building interior.
Buildings 13 00653 g004
Figure 5. Research outline.
Buildings 13 00653 g005
Figure 6. Comparison of simulation and measurement of pressure difference distributions at elevator doors.
Buildings 13 00653 g006
Figure 7. The total infiltration: Pareto effect plot.
Buildings 13 00653 g007
Figure 8. The maximum pressure difference at 1st floor elevator doors: Pareto effect plot.
Buildings 13 00653 g008
Figure 9. The maximum pressure difference at 21st floor elevator doors: Pareto effect plot.
Buildings 13 00653 g009
Figure 10. The total infiltration: the contrasts of simulation and regression values.
Buildings 13 00653 g010
Figure 11. The total infiltration: the contrasts of regression and sum values.
Buildings 13 00653 g011
Figure 12. The candidate combinations for reducing total infiltration.
Buildings 13 00653 g012
Figure 13. The maximum pressure difference at elevator doors: the contrast of simulation and regression values.
Buildings 13 00653 g013
Figure 14. The maximum pressure difference at elevator doors: the contrasts of the regression and sum values.
Buildings 13 00653 g014
Figure 15. The candidate combinations for reducing maximum pressure difference at elevator doors.
Buildings 13 00653 g015
Figure 16. The multilateral comparison of decision-making.
Buildings 13 00653 g016
Table 1. The settings of countermeasures.
Factors
(Countermeasures)
Level
Low Level
(−1)
High Level
(+1)
AAdding passenger elevator vestibule
(1st and 2nd floor)
Not applied576 a, b
BTightness of stair door269 a, c128 a, c, d
CTightness of elevator door492 a, c242 a, c
DTightness of elevator vestibule door576 a, c274 a, c
ELeakage area of openingEntrance door
496 a, e
(Swing door)
28 a, e
(Revolving door)
Orifice
10,000 a, c4000 a, c
Door-hole
Not applied380 a, c
FTightness of envelope 8.51 b, f3.4 b, f
GElevator shaft cooling20 °C13 °C d
HRoom pressurization
(above NPL)
0 m3/h
(Not applied)
2000 (m3/h)/floor a, d
(Fresh air system)
a cm2/item@10Pa (EqLA); b cm2/m2@10Pa (EqLA); c ASHRAE [4]; d Khoukhi et al. [33]; e Lim et al. [1]; f GB/T 7106-2008 [44].
Table 2. The decision-making indexes of countermeasure combinations (top twenty).
Top TenEleventh to Twentieth
CombinationIndexRankingCombinationIndexRanking
AD0.8111DE0.70311
ADE 0.7722AE0.69612
AB0.7543ACE 0.69213
BD0.7404CD0.68614
AC0.7305B0.68015
DG0.7206BG0.67616
D0.7187AEG 0.67017
BDE 0.7178BC0.66818
A0.7179BE0.66619
AG0.70710CDE 0.66120
Disclaimer/Publisher’s Note: The statements, opinions and data contained in all publications are solely those of the individual author(s) and contributor(s) and not of MDPI and/or the editor(s). MDPI and/or the editor(s) disclaim responsibility for any injury to people or property resulting from any ideas, methods, instructions or products referred to in the content.

