Abstract
Arid and hot regions, like Saudi Arabia, utilize up to 60% of the country’s energy to regulate buildings’ indoor comfort. Energy efficiency is a long-term sustainability measure that is part of the government’s Vision 2030 strategy. A standard method of improving the thermal performance of buildings is through the use of insulation materials. Considering the cooling loads’ requirement and the Global Warming Potential (GWP), the present research evaluated the effectiveness of insulation materials, including extruded polystyrene, expanded polystyrene, rock wool, and glass wool in the hot, arid climate. For this case study, four similar villas facing the cardinal directions were selected from the residential project at Qassim University. HOBO data loggers were used to collect indoor temperature data. Thermal performance and Life Cycle Assessment (LCA) were conducted in accordance with Saudi Building Code-602 (SBC-602). Simulation outputs based on the four cardinal directions were used for assessing the thermal performance and LCA of the different thicknesses and densities of insulation materials. This was done using IESVE and SimaPro, IMPACR2002+, to assess their cooling load and GWP, respectively. The results suggest the potential for using lower insulation thickness for the northern and western façades without violating the SBC. The results obtained the actual thicknesses of the three insulation materials for achieving indoor temperatures in the four cardinal directions and the selection of materials and their densities along with associated GWP. The outputs of the study have been generalized in the form of a performance-based flowchart as a tool for selecting the type and thickness of thermal and environmental insulation in residential buildings in the Qassim region of Saudi Arabia.
1. Introduction
Globally, the building sector consumes 40% of primary energy for cooling and heating [1], which is consumed primarily by the building envelope (including the wall, windows, roof, and infiltration rate) [2]. Wall insulation plays a vital role in improving energy efficiency and reducing carbon emissions in residential buildings, with increased wall thickness being an acknowledged solution [3,4]. Increased insulation thickness, however, has an adverse impact on the Life Cycle Assessment (LCA) of energy consumption and emissions since it also includes these parameters from the manufacturing processes [5,6]. Hence, the evaluation of insulation materials from the life cycle perspective for region-specific suitability is essential as a sustainability measure. Additionally, it will enhance the overall thermal efficiency of the entire building structure as a wall envelope.
According to Krarti et al., [7], over 65% of the annual energy consumption of a non-insulated villa in a hot, arid climate (e.g., Qassim region) is used for air-conditioning, which accounts for a significant portion of the electricity consumption by Saudi households. With 50% of the building sector’s energy consumption coming from the residential sector, improving its energy efficiency is critical. While previous efforts have focused on the energy efficiency of electrical appliances, these need to be supplemented by the evaluation of potential improvements in thermal performance and the envelope design of residential buildings [8].
Alaidroos and Krarti [9] investigated the impact of building envelopes on the energy performance of residential houses in Saudi Arabia using the EnergyPlus package, reporting energy savings between 22.7% and 39.5% for cities with different climatic conditions (Figure 1). Based on the results, the study found that adding wall thermal mass saves energy in Abha, a city with a mild climate, while the lowest energy savings were found in Jeddah, which has an extremely hot climate. A large temperature difference between daytime and nighttime allows heat to be stored during a day cycle and then released during a night cycle. This energy exchange is why thermal mass is most effective in climates with a high diurnal temperature range. A simulation of the impacts of five sequential building envelope energy retrofits on the cooling load in residential buildings in Qatar pointed to circa 53% reduction in cooling demand, with a moderately short payback period [10].

Figure 1.
Total annual energy consumption, space cooling and space heating for a villa located in five KSA cities [9].
As summarized in Table 1, the impact of the wall envelope on energy consumption and the life cycle cost estimation was the focus of many research projects. Sobhy et al. [11] compared the outer walls of a traditional brickwork residential building with single and double walls (with a cavity) along the western and northern façades. The study found a reduction in cooling/heating energy demand between 5% and 13% as a result of thermal insulation and a conducive climate. Al-Sanea et al. [12] evaluated the thermal resistance capacity of four types of walls (concrete bricks with an insulation layer, double concrete with an insulation layer, clay bricks with an insulation layer, and double clay bricks with an insulation layer) in three different climatic regions of KSA, Riyadh, Jeddah, and Abha. While the wall structure (layering arrangement) did not impact the load transmission, overall cost, or thermal resistance, insulation and environmental conditions greatly impacted thermal resistance. For polystyrene, polyurethane, and rock fiber, the average thermal resistance values for Riyadh were found to be 2.84, 2.05, and 2.40 m2k/watt, respectively. A combination of polystyrene and double walls was found to be the most cost-effective, with quick investment recovery, while the following average thermal resistance values were obtained, polystyrene (1.92 m2k/watt), polyurethane (1.46 m2k/watt), and rock fiber (1.66 m2k/watt).

Table 1.
Relevant past studies on wall envelope design impact on energy consumption and the LCA of wall insulation materials.
Recently, Al-Naghi et al. [13] compared lightweight concrete bricks with conventional concrete bricks using the DesignBuilder platform. Lightweight concrete bricks demonstrated five-fold higher thermal resistance than standard concrete bricks, transferring 82% more heat than standard bricks and saving 58% in energy consumption. Pourghorban et al. [14] found wall insulation to be the most effective way to reduce heat loss from a building’s exterior as well as energy consumption for hot environmental conditions based on a performance evaluation of hollow walls (reflective insulation systems) with 20-cm air separation. The study also evaluated the effectiveness of reflective, mass, suction, and nanosystems of the thermal insulation of buildings, considering materials such as glass wool (GW), rock wool (RW), expanded polystyrene (EPS), and extruded polystyrene (XPS) as part of the mass scheme, which considers the limitations of the wall envelope. RW, GW, EPS, and XPS are the materials of choice for residential thermal insulation [15].
Several studies have investigated the optimal thickness of thermal insulation based on the building’s position and climatic factors [16,17,18,19]. Some studies pertaining to the impact of energy sources on the insulation thicknesses for typical buildings in different climate zones of Turkey found an optimum thickness between 2.0–17 cm [20,21]. Yu et al. [22] investigated typical residential external walls in five Chinese cities, including Shanghai, Changsha, Shaoguan, and Chengdu, and found that the effect of orientation on the optimum insulation cannot be ignored. The optimum thickness ranged between 5.3 cm and 23.6 m in these five cases, with over 79% energy savings. Another study by Ucar and Balo [23] investigated the optimum thicknesses for four climate zones of Turkey and found that the optimum insulation thicknesses varied between 1.06 and 7.64 cm, depending on the city and the heating fuel used. Derradji et al. [24] investigated the insulation thickness of expanded polystyrene in different regions of Algeria and found an optimal range between 1 cm and 2.5 cm, with 0.5 and 1.5 $/m2 energy savings, depending on the type and the percentage of the windows.
The literature also presents certain investigations that have evaluated the impact of insulation position. Al-Sanea and Zedan [34] found 7.8 cm an optimum figure for liquid polystyrene wall insulation for Riyadh and suggested separating the insulation into three layers (2.6 cm each) to save 1.6% cooling and 3.2% heating energy. Ozel [17] studied the effect of insulation location (inside, outside, and middle) and found that the insulation outside gives the smallest fluctuation; however, the location did not affect the optimum insulation thickness. Ahmed et al. [32] studied the effect of orientations on the thermal transmission of external pre-cast hollow walls through experimental measurements on-site for a residential house in Dhahran. Their study found around 25% higher thermal permeability on the northern wall in comparison to the eastern wall with an average thermal resistance of 0.35 K/s. The study concluded that the orientation of the wall does not affect thermal resistance, but the direction and external weather conditions impact thermal permeability. Ozel [35] determined the ideal polystyrene insulation thickness for Elazig, Turkey’s four directions and found that the south was the most energy-efficient direction, requiring a 5.5 cm-thick southern outer wall, while the northern, eastern, and western walls should be 6 cm thick.
Certain studies integrate energy performance with LCA. Stazi et al. [36] used an optimization approach for solar wall systems and found a potential to reduce cumulative energy demand and CO2 emissions by up to 55%, for the production and use phases of LCA, compared to traditional methods. Earlier, Kim [37] used eQuest and SimaPro to examine the differences between glass curtain walls and transparent composite façades over the life cycle. They assessed that 93% of the life cycle energy uses and 89% of equivalent CO2 emissions of glass curtain walls were needed for transparent composite façades, with the potential further improvement that can be made by enhancing energy performance, durability, and recycling materials.
Babaizadeh et al. [38] used TRACI-based BEES, SimaPro, and EnergyPlus to investigate energy consumption and LCA of five window-shading devise configurations of different materials, i.e., aluminum, wood, and polyvinyl chloride, for buildings in the USA. The study found that the horizontal form of shading is more efficient than others in all climatic conditions and recommended a solar shading system for mixed humid and hot-humid climate zones. The benefits of reduced energy consumption outperformed depleted emissions during different life cycle phases. Wood-based materials were highlighted as the most environmentally friendly, followed by aluminum.
Increasing interest in external walls and their continuous development is evidenced through literature reviews and practical and laboratory experiments about external walls of buildings. Using thermal insulators in external walls is an established methodology; however, determining the optimal type of insulation and the optimum thickness in terms of thermal and environmental performance (evaluation life cycle of a substance) is the key challenge.
The lack of research on optimal insulation thickness relevant to Saudi Arabia, as opposed to a large quantum of research globally, is likely due to the low per-unit electricity cost in KSA. However, environmental concerns in the Kingdom’s Vision 2030 (through stated environmental conservation through higher energy costs) demonstrate a focus on research in this domain. Within KSA, there is a void of research for determining the appropriate insulation materials and thickness specifically for the Qassim region. This provides the opportunity to combine thermal performance and LCA-based environmental impact assessment for determining optimum insulation. The research reported in this paper has two primary objectives: i) To evaluate four frequently used insulation materials (with different specifications) and assess the optimal properties of these systems, and ii) To conduct an integrated analysis of energy performance and LCA of the optimal insulation materials specific to the Qassim region in KSA.
2. Methods
2.1. Study Area
The area identified for undertaking the study was faculty housing at Qassim University, consisting of consists of 288 residential villas of similar design, illustrated in Figure 2. The geometric layout of the villas provided an opportunity to investigate various factors affecting their thermal performance. The climate of the Qassim Region is generally hot and dry with wide temperature variations ranging from 46 °C (July) to below freezing during winter (nights) (Figure 3). The significant seasonal temperature variation is accompanied by high intensity of solar radiation due to clear skies and low cloud cover—approximately 1000 watts/m² h (General Authority of Meteorology and Environmental Protection (GAMEP), 2016) which increases the severity of environmental conditions.
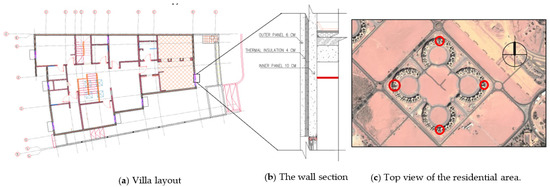
Figure 2.
Location of an experimental study in Qassim University, (a) Villa layout, (b) The wall section, (c) Top view of the residential area.
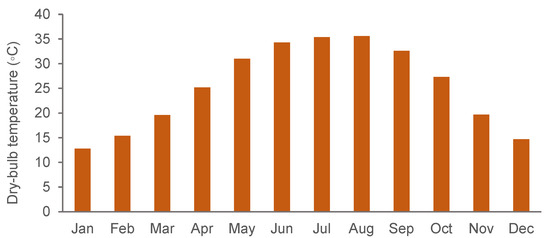
Figure 3.
Average monthly temperatures for Qassim region (Source: GAMEP met. Station, 2016).
The field study was conducted to simulate the thermal performance using IESVE by creating sequential modifications in the building’s (insulation) design to assess thermal performance. The measuring instruments were selected from HOBO. In order to examine the energy consumption for cooling the residential buildings, the air temperature was monitored over 24 h (28 July 2021) in the center of the western room (Figure 2) at a height of 1.5 m. The air conditioners were turned off, while all doors and windows were closed. The simulation models provided an accurate and detailed analysis of the building’s thermal performance, electricity consumption, and microclimate. The boundary conditions of the wall configurations (49.8 m2 wall area for the simulated room), indoor temperature, and outdoor temperature (for the whole year) were calculated in IESVE based on the given characteristics shown in Table 2 and Table 3.
Table 2.
Material properties of building construction.
Table 3.
Energy and LCA parameters for the insulation properties.
2.2. Energy Analysis
The energy analysis simulation model focused on cooling energy loads. As shown in Figure 4, the base model was modeled on the actual house design, with the exterior windows and construction used with their original specifications (Table 2) through the simulation. Prior to undertaking the parametric analysis, the model was calibrated to ensure consistency and accuracy of simulation results using ambient air temperature as the variable of interest. Further, as done by Zhang et al. [39], the Pearson correlation coefficient was used to obtain the correlation between the field data and the simulated results, as a measure of the error between the two datasets.
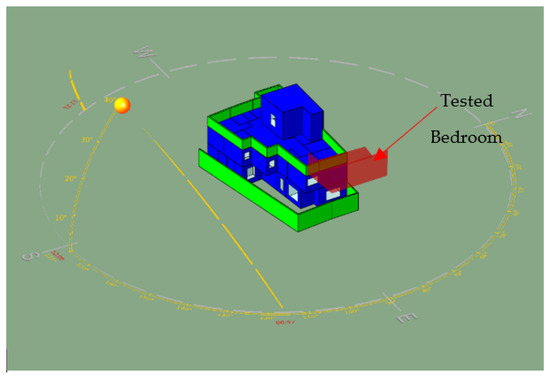
Figure 4.
The Baseline Model built in IESVE.
Figure 5a,b presents the relationship between the simulated indoor air temperature results and the collected field measurement as a line chart and scatter plot, illustrating a positive correlation (R² = 0.81) between them. This substantially validates the robustness of the model used, as well as the selection of the variable of interest to drive the simulation model. While considering the four main orientations, north, east, south, and west, 48 parametric simulations were undertaken to examine the impact of four wall insulation materials (XPS, GW, EPS, and RW with different thicknesses) on the building’s energy performance.
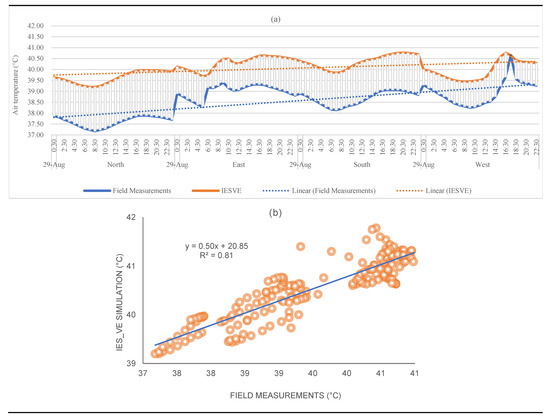
Figure 5.
Filed measurements data (a) for whole day in all orientations, and the scatter plot (b) represents the correlation coefficient between Field data and simulation result.
The minimum U-value specified in SBC-602 for residential buildings (0.342 W/m²K) was applied to all insulation materials to simulate the least cooling load. Thus, in accordance with the code, the cooling load was used as a benchmark to compare and analyze the other scenarios. The impact of orientations of the buildings on the simulation results creates a benchmark for simulation models with other variables of interest.
2.3. Life Cycle Assessment (LCA)
LCA is a tool used to assess the expected effects of a product or process on nature by determining the evaluation system’s limits, whether for the manufacturing stage, the operational stage, the depreciation, the recycling stage, or for all phases according to the study’s system.
There were many LCA standards; in 1994. The Canadian Standards Association released the first global LCA standard. However, Figure 6 shows that the International Standards Organization ISO had the most acknowledged standards, with many series such as follows:
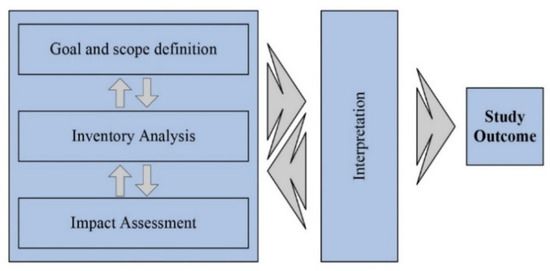
Figure 6.
Life-cycle assessment framework [40,41,42,43].
- ISO 14040: Environmental management, LCA, Principles, and framework [40].
- ISO 14041: Environmental management, LCA, Goal definition, and inventory analysis [41].
- ISO 14042: Environmental management, LCA, Life-cycle impact assessment [42].
- ISO 14043: Environnemental management, LCA, Life-cycle interpretation [43].
2.3.1. Goal and Scope
To determine the environmental impacts of four wall insulation materials, including XPS, GW, EPS, and RW with different thicknesses, The scope of the study highlights the cradle-to-gate phase of the product life cycle (Figure 7), which comprises the production stage. The functional unit is one kilogram per unit, i.e., standardization of the mass for each material in all scenarios. SimaPro licensed software (V.9.1.1.1) performed LCA stage outlines by ISO 14040.
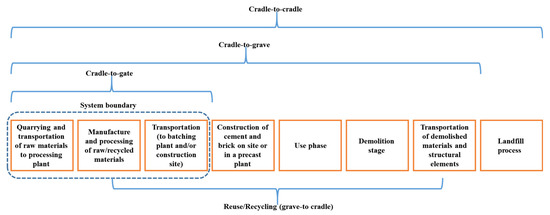
Figure 7.
Process-based LCA method [41,42,43,44].
2.3.2. Life Cycle Inventory (LCI)
Based on the availability of the processes involved, LCI calculations were obtained using Ecoinvent database (a global data source) [45]. The overall parameters for energy and LCA simulation are summarized in Table 3, with scenarios that achieved the SBC-602 requirement highlighted in red.
2.3.3. Life Cycle Impact Assessment (LCIA)
LCIA calculations were performed using EN ISO 14040 and EN ISO 14044 standards. According to IMPACT 2002 + v.2.15, 2.3.3, LCIA results were categorized into midpoint categories, including parameters, types, and characterizations of possible impacts (Figure 8). 75 impact categories are defined by SimaPro under 21 classifications for LCIA. The IMPACT 2002+ has two main categories: midpoint and endpoint methods. This study focused on midpoint, method as shown in (Figure 8), focusing on the Kg CO2 eq environmental impacts results.
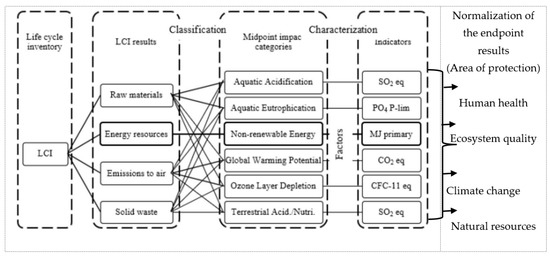
Figure 8.
The framework of midpoint analysis, as one of the Impacts 2002+ methods (derived from [45]).
After the energy analysis, all scenarios within the range of SBC limitations were compared based on carbon dioxide emissions for the selected insulation materials (Table 4), by selecting the governing function as “comparison” using the IMPACT 2002+ methodology and database. The present study highlights options with less thickness that can be adopted with less cooling load and carbon emission.
Table 4.
The highest value of cooling loads for XPS, GW, EPS, and RW insulation materials facing the South.
3. Results and Discussion
3.1. Thermal Simulation
The parametric simulation results of all the materials revealed variations in orientation and application of different thicknesses of the insulation materials, resulting in fluctuation of cooling loads. In practice, the relation between the material insulation thicknesses and thermal capacity (U-Value) is linear. A lower U-value represents a thicker insulation material and an inversely proportional impact on cooling loads. As highlighted in Section 2.2, 0.342 W/m²K is the minimum U-value for a wall in any residential building, Therefore, considering an established benchmark of 151 kWh/m2 and the SBC recommendation of 80 mm of XPS insulation as a reference, Table 4 presents the cooling loads for five different thicknesses of XPS for orientation along the four cardinal directions.
The cooling loads of GW insulation of thicknesses 80, 90, 100, 110, and 120 mm also present similar performance patterns. In this case, SBC recommends GW insulation material thickness of 110 mm (Table 4), wherein the highest cooling load of 150 kWh/m2 was obtained along the southerly orientation.
An analysis of the parametric simulation results of EPS insulation material for the thicknesses of 70, 80, 90, 100, and 110 mm (Table 4) reveals that the highest cooling load of the recommended SBC (EPS 100 mm) is 149 kWh/m². Considering this value, a benchmark value of 90 mm along the north, east, and west orientations results in lower or similar cooling loads. Similarly, RW insulation of thickness 95 mm, the southerly orientation demonstrates the highest cooling load of 151 kWh/m². Table 4 presents similar trends for all insulation materials and validates the lower cooling loads for higher thicknesses of insulation materials.
The simulation results in Table 4 also present the impact of orientation on the cooling loads, as illustrated in Figure 9. EPS 110 mm imposes the lowest cooling loads out of all materials, while XPS 50 mm sets the highest cooling loads compared to the other materials. It can also be interpreted that materials with different thicknesses could be logically allocated to specific orientations to achieve an optimum cooling load. E.g., XPS 70 mm, GW 100 mm, GW 90 mm, EPS 90 mm, EPS 80 mm, RW 85 mm, and RW 75 mm, could all be applied to the north and west orientations, while the recommended SBC thicknesses could be applied to the east and south orientations. The manipulation of different thicknesses and their allocation to a specific orientation façade could significantly reduce cooling loads. Hence, the impact of insulation materials and their thicknesses, in conjunction with building orientation, should be considered to evaluate the cooling load instead of applying the recommended thickness of insulation materials.
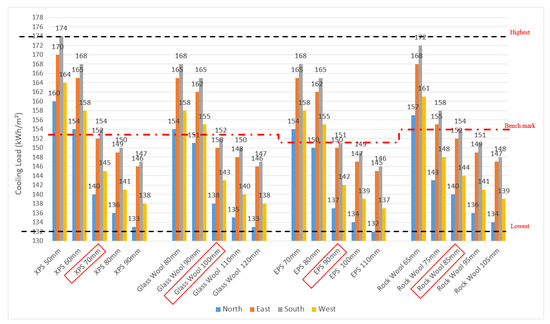
Figure 9.
Impact of orientation on cooling loads for different insulation material thicknesses.
3.2. Life Cycle Assessment
As mentioned in the standard, all scenarios within the range of SBC limitations were compared based on carbon dioxide emissions. Figure 10 shows the results using the midpoint method, considering Kg CO2 eq as the metric for each thermal insulation material. The results of the preliminary analysis of the thermal insulation materials specified in the study showed varying values of emissions and environmental impacts, demonstrating RW as the least emitting material among the four materials investigated.
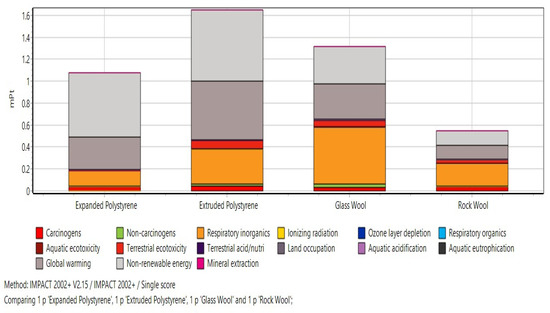
Figure 10.
Midpoint environmental impact results.
The results of the LCA of the thermal insulation materials at the manufacturing stage illustrated that RW had the minimum GWP (Figure 11). The results show the following ranking based on GWP or emission values: XPS was ranked highest (5.28 kg CO2 eq), GW ranked second (3.2 kg CO2 eq), 63% less than XPS, EPS ranked third (2.9 kg CO2 eq), 10% less than GW, while RW was ranked with the least GWP at 1.3 kg CO2 eq, 123% less than GW, with an absolute difference of circa 300% between it and XPS.

Figure 11.
Global warming (Kg CO2 eq emissions).
The reasons for the significant differences in these values are the material composition and manufacturing processes used. For example, XPS presents the highest GWP due to use of the use of harmful gases and their condensation inside the insulation body during its manufacture, as compared to EPS, with fewer emissions than XPS due to the use of water vapor instead of harmful gases in the manufacturing processes, as evidenced from literature.
As seen in Figure 12a, emissions from the manufacture of XPS of 21 kg/m3 to insulate the room of 49.8 m2 wall area with the SBC specified thickness (80 mm) showed the least value of 442 Kg CO2 eq, while it showed the highest value of 1010 of Kg CO2 eq with a density of 48 kg/m3, a variation of 129% over the minimum value. In Figure 12b, the GWP of EPS for the room considered with the SBC specified thickness of 100 mm demonstrated a minimum value of 231.1 Kg CO2 eq at a density of 16 kg/m3, while a density of 35 kg/m3 demonstrated GWP of 505 Kg CO2 eq, a difference of 119%. In Figure 12c, the SBC’s recommended thickness of 110 mm demonstrates the least GWP of 420.7 Kg CO2 eq at a density of 24 kg/m3 and the highest GWP of 1122 Kg CO2 eq for a density of 64 kg/m3. For manufacturers of RW, Figure 12d demonstrates the highest GWP of 738 Kg CO2 eq at a density of 120 kg/m³, while a density of 30 kg/m³ demonstrates the minimum GWP of 185 Kg CO2 eq. Overall, RW demonstrated the lowest GWP out of the four materials considered for the study. Figure 13 illustrates the effect of density on GWP in terms of Kg CO2 eq for each material, which evidences the significance of this parameter in the application of insulation in buildings.
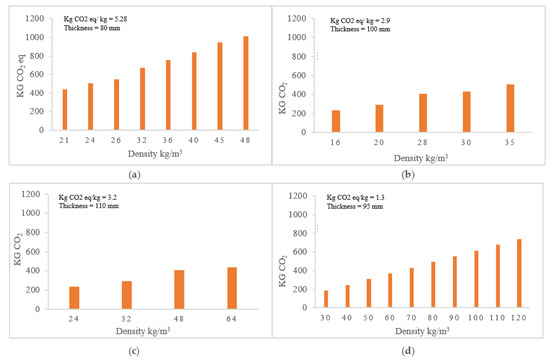
Figure 12.
Global warming potential impact with wall area of 49.8 m2 (kg CO2 eq emissions), (a) manufacturing XPS, (b) manufacturing EPS, (c) manufacture of GW, (d) manufacture of RW.
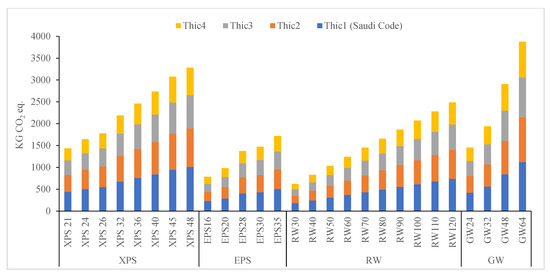
Figure 13.
Comparison of total carbon dioxide KG CO2 eq values.
3.3. Optimization of Thermal and Environmental Analysis Results
The thermal performance analysis of the four orientations according to the requirements of the SBC showed a variation in the cooling loads, with the highest cooling loads along the southward orientation. Considering this as a reference, Figure 14a shows the differences up to 2.0 cm among other orientations. Figure 14b illustrates a combination of different types of insulation and thicknesses of the specified SBC range (dotted line). For instance, the western façade of the minimum insulation thickness (the lowest in the study) achieved the acceptable code limit in RW materials. For the GW, XPS, and EPS, it exceeded the required limit in the SBC code. Hence, the SBC code can be achieved with the minimum thickness of the RW. The north and west orientations could use XPS 70 mm, GW 100 mm, GW 90 mm, EPS 90 mm, EPS 80 mm, RW 85 mm, and RW 75 mm, while the east and south orientations could use the recommended SBC code thicknesses. Manipulating different thicknesses and their allocation to specific orientation can potentially result in significant cooling load reduction. As a consequence, in order to assess the cooling loads imposed by different material thicknesses for different orientations, instead of relying exclusively on a thickness specified by the SBC, it would be best to evaluate the cooling loads imposed by differing thicknesses.
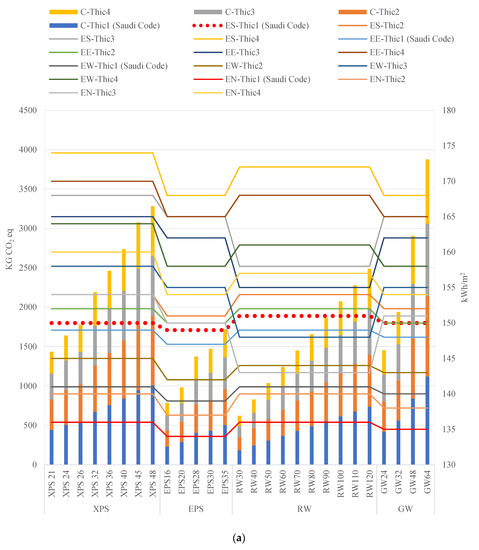
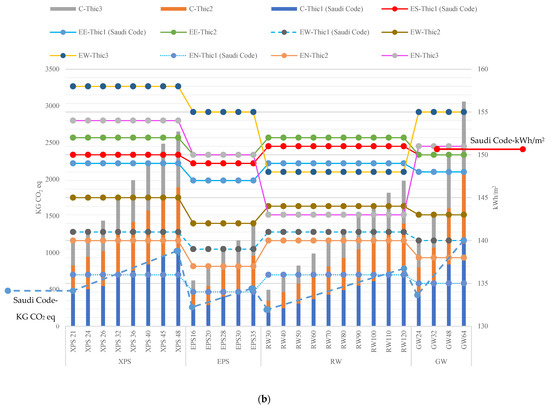
Figure 14.
Optimization chart for all thermal and environmental aspects based on (a) Overall kWh\m2 and kg CO2 eq respectively, (b) Based on SBC.
Further, environmental performance assessment using LCA (cradle-to-grave) of insulation materials also demonstrated a difference in their GWP, and for different thicknesses within the same material. This provides a tool for the material selection of insulation, using these results in conjunction with the cooling loads to optimize the material types and thicknesses for application in a given climatic region and achieving sustainability benefits from energy savings and emissions reduction.
4. Conclusions
The evaluation of the thermal performance and the environmental impact assessment of the insulation materials showed varying values for the types of insulation specified in the study. The thermal performance was affected by the material, its thickness, and the orientation of the building. A comparison with the SBC determined the specific thicknesses along different orientations to achieve requisite cooling loads, as opposed to standardized thicknesses mentioned in SBC. The lowest cooling loads are caused by EPS 110 mm, while the highest cooling loads are caused by XPS 50 mm. Different thickness materials can also be logically oriented to achieve optimal cooling loads. The recommended SBC thicknesses could be applied to the east and south orientations. Alternatively, XPS 70 mm, GW 100 mm, GW 90 mm, EPS 90 mm, EPS 80 mm, RW 85 mm, and RW 75 mm could be applied to the north and west orientations. For the LCA, on the western façade of the minimum insulation thickness, the RW is compliant with SBC. For the GW, XPS, and EPS, it exceeded the required limit in the SBC. XPS 70 mm, GW 100 mm, GW 90 mm, EPS 90 mm, EPS 80 mm, RW 85 mm, and RW 75 mm can be used for the North and West orientations. The East and South orientations could use the recommended SBC thicknesses. Similarly, the material density was analyzed as the primary parameter affecting the GWP of the insulation material. Considering the application of insulation materials as a combination of thermal and environmental performance parameters provides a powerful tool for the customized application of insulation materials in various climatic conditions. Future studies are recommended to monitor the temperature variations inside the wall for different combinations of load-bearing walls and insulation types. It also provides a tool for achieving sustainability benefits through energy savings as well as minimized LCA costs.
Author Contributions
Conceptualization, Y.A., A.A. and A.A.M.A.; methodology, Y.A., A.A. and A.A.M.A.; software, Y.A., A.A. and A.A.M.A.; validation, H.H. and A.A.; formal analysis, Y.A., A.A., A.G. (Amirhosein Ghaffarianhoseini); data curation, Y.A., A.A. and A.A.M.A.; writing—original draft preparation, Y.A., A.A. and A.A.M.A.; writing—review and editing, H.H., A.G. (Amirhosein Ghaffarianhoseini) and A.G. (Ali Ghaffarianhoseini); visualization, Y.A. and A.A.; supervision, A.A., A.G. (Amirhosein Ghaffarianhoseini) and A.G. (Ali Ghaffarianhoseini); project administration, A.A. All authors have read and agreed to the published version of the manuscript.
Funding
The researchers would like to thank the Deanship of Scientific Research, Qassim University for funding the publication of this project.
Data Availability Statement
All the important and shareable data is provided.
Acknowledgments
The authors gratefully acknowledge Qassim University, represented by the Deanship of Scientific Research and Department of Architecture, College of Architecture and Planning for the support for this research.
Conflicts of Interest
The authors declare that they have no known competing financial interest or personal relationships that could have appeared to influence the work reported in this paper.
References
- Kaynakli, O. A review of the economical and optimum thermal insulation thickness for building applications. Renew. Sustain. Energy Rev. 2012, 16, 415–425. [Google Scholar] [CrossRef]
- Azari, R. Integrated energy and environmental life cycle assessment of office building envelopes. Energy Build. 2014, 82, 156–162. [Google Scholar] [CrossRef]
- Dombayci, A.; Atalay, Ö.; Güven Acar, Ş.; Yilmaz Ulu, E.; Kemal Ozturk, H. Thermoeconomic method for determination of optimum insulation thickness of external walls for the houses: Case study for Turkey. Sustain. Energy Technol. Assess. 2017, 22, 1–8. [Google Scholar] [CrossRef]
- Alsaqabi, Y.; Almhafdy, A.A.; Ali, A.A.M. An overview of Wall Envelope Thermal Performance in Arid Climate Buildings. Environ.—Behav. Proc. J. 2020, 5, 159–164. [Google Scholar] [CrossRef]
- Oquendo-Di Cosola, V.; Olivieri, F.; Ruiz-García, L.; Bacenetti, J. An environmental Life Cycle Assessment of Living Wall Systems. J. Environ. Manag. 2020, 254, 109743. [Google Scholar] [CrossRef] [PubMed]
- Llantoy, N.; Chàfer, M.; Cabeza, L.F. A comparative life cycle assessment (LCA) of different insulation materials for buildings in the continental Mediterranean climate. Energy Build. 2020, 225, 110323. [Google Scholar] [CrossRef]
- Krarti, M.; Aldubyan, M.; Williams, E. Residential building stock model for evaluating energy retrofit programs in Saudi Arabia. Energy 2020, 195, 116980. [Google Scholar] [CrossRef]
- Ziapour, B.M.; Rahimi, M.; Yousefi Gendeshmin, M. Thermoeconomic analysis for determining optimal insulation thickness for new composite prefabricated wall block as an external wall member in buildings. J. Build. Eng. 2020, 31, 101354. [Google Scholar] [CrossRef]
- Alaidroos, A.; Krarti, M. Optimal design of residential building envelope systems in the Kingdom of Saudi Arabia. Energy Build. 2015, 86, 104–117. [Google Scholar] [CrossRef]
- Kharseh, M.; Al-Khawaja, M. Retrofitting measures for reducing buildings cooling requirements in cooling-dominated environment: Residential house. Appl. Therm. Eng. 2016, 98, 352–356. [Google Scholar] [CrossRef]
- Sobhy, I.; Brakez, A.; Benhamou, B. Analysis for Thermal Behavior and Energy Savings of a Semi-Detached House with Different Insulation Strategies in a Hot Semi-Arid Climate. J. Green Build. 2017, 12, 78–106. [Google Scholar] [CrossRef]
- Al-Sanea, S.A.; Zedan, M.F.; Al-Mujahid, A.M.; Al-Suhaibani, Z.A. Optimum R-values of building walls under different climatic conditions in the Kingdom of Saudi Arabia. Appl. Therm. Eng. 2016, 96, 92–106. [Google Scholar] [CrossRef]
- Al-Naghi, A.A.A.; Rahman, M.K.; Al-Amoudi, O.S.B.; Al-Dulaijan, S.U. Thermal Performance Evaluation of Walls with AAC Blocks, Insulating Plaster, and Reflective Coating. J. Energy Eng. 2020, 146. [Google Scholar] [CrossRef]
- Pourghorban, A.; Kari, B.M.; Solgi, E. Assessment of reflective insulation systems in wall application in hot-arid climates. Sustain. Cities Soc. 2020, 52, 101734. [Google Scholar] [CrossRef]
- Al-Homoud, M.S. Performance characteristics and practical applications of common building thermal insulation materials. Build. Environ. 2005, 40, 353–366. [Google Scholar] [CrossRef]
- Ozel, M. Determination of optimum insulation thickness based on cooling transmission load for building walls in a hot climate. Energy Convers. Manag. 2013, 66, 106–114. [Google Scholar] [CrossRef]
- Ozel, M. Effect of insulation location on dynamic heat-transfer characteristics of building external walls and optimization of insulation thickness. Energy Build. 2014, 72, 288–295. [Google Scholar] [CrossRef]
- Bektas Ekici, B.; Aytac Gulten, A.; Aksoy, U.T. A study on the optimum insulation thicknesses of various types of external walls with respect to different materials, fuels and climate zones in Turkey. Appl. Energy 2012, 92, 211–217. [Google Scholar] [CrossRef]
- Daouas, N. A study on optimum insulation thickness in walls and energy savings in Tunisian buildings based on analytical calculation of cooling and heating transmission loads. Appl. Energy 2011, 88, 156–164. [Google Scholar] [CrossRef]
- Kaynakli, O. A study on residential heating energy requirement and optimum insulation thickness. Renew. Energy 2008, 33, 1164–1172. [Google Scholar] [CrossRef]
- Bolattürk, A. Optimum insulation thicknesses for building walls with respect to cooling and heating degree-hours in the warmest zone of Turkey. Build. Environ. 2008, 43, 1055–1064. [Google Scholar] [CrossRef]
- Yu, J.; Yang, C.; Tian, L.; Liao, D. A study on optimum insulation thicknesses of external walls in hot summer and cold winter zone of China. Appl. Energy 2009, 86, 2520–2529. [Google Scholar] [CrossRef]
- Ucar, A.; Balo, F. Effect of fuel type on the optimum thickness of selected insulation materials for the four different climatic regions of Turkey. Appl. Energy 2009, 86, 730–736. [Google Scholar] [CrossRef]
- Derradji, L.; Imessad, K.; Amara, M.; Boudali Errebai, F. A study on residential energy requirement and the effect of the glazing on the optimum insulation thickness. Appl. Therm. Eng. 2017, 112, 975–985. [Google Scholar] [CrossRef]
- Alwetaishi, M. Impact of glazing to wall ratio in various climatic regions: A case study. J. King Saud Univ.—Eng. Sci. 2019, 31, 6–18. [Google Scholar] [CrossRef]
- Amiri Rad, E.; Fallahi, E. Optimizing the insulation thickness of external wall by a novel 3E (energy, environmental, economic) method. Constr. Build. Mater. 2019, 205, 196–212. [Google Scholar] [CrossRef]
- Al-Hadhrami, L.M.; Ahmad, A. Assessment of thermal performance of different types of masonry bricks used in Saudi Arabia. Appl. Therm. Eng. 2009, 29, 1123–1130. [Google Scholar] [CrossRef]
- Al-Sanea, S.A.; Zedan, M.F. Optimum insulation thickness for building walls in a hot-dry climate. Int. J. Ambient Energy 2002, 23, 115–126. [Google Scholar] [CrossRef]
- Eddib, F.; Lamrani, M.A. Effect of the thermal insulators on the thermal and energetic performance of the envelope of a house located in Marrakesh. Alex. Eng. J. 2019, 58, 937–944. [Google Scholar] [CrossRef]
- Lawania, K.K.; Biswas, W.K. Achieving environmentally friendly building envelope for Western Australia’s housing sector: A life cycle assessment approach. Int. J. Sustain. Built Environ. 2016, 5, 210–224. [Google Scholar] [CrossRef]
- Baglivo, C.; Congedo, P.M. High performance precast external walls for cold climate by a multi-criteria methodology. Energy 2016, 115, 561–576. [Google Scholar] [CrossRef]
- Ahmad, A.; Maslehuddin, M.; Al-Hadhrami, L.M. In situ measurement of thermal transmittance and thermal resistance of hollow reinforced precast concrete walls. Energy Build. 2014, 84, 132–141. [Google Scholar] [CrossRef]
- O’Hegarty, R.; Reilly, A.; West, R.; Kinnane, O. Thermal investigation of thin precast concrete sandwich panels. J. Build. Eng. 2020, 27, 100937. [Google Scholar] [CrossRef]
- Al-Sanea, S.A.; Zedan, M.F. Improving thermal performance of building walls by optimizing insulation layer distribution and thickness for same thermal mass. Appl. Energy 2011, 88, 3113–3124. [Google Scholar] [CrossRef]
- Ozel, M. Effect of wall orientation on the optimum insulation thickness by using a dynamic method. Appl. Energy 2011, 88, 2429–2435. [Google Scholar] [CrossRef]
- Stazi, F.; Mastrucci, A.; Munafò, P. Life cycle assessment approach for the optimization of sustainable building envelopes: An application on solar wall systems. Build. Environ. 2012, 58, 278–288. [Google Scholar] [CrossRef]
- Kim, K.H. A comparative life cycle assessment of a transparent composite façade system and a glass curtain wall system. Energy Build. 2011, 43, 3436–3445. [Google Scholar] [CrossRef]
- Babaizadeh, H.; Haghighi, N.; Asadi, S.; Broun, R.; Riley, D. Life cycle assessment of exterior window shadings in residential buildings in different climate zones. Build. Environ. 2015, 90, 168–177. [Google Scholar] [CrossRef]
- Zhang, S.; Cheng, Y.; Fang, Z.; Lin, Z. Dynamic control of room air temperature for stratum ventilation based on heat removal efficiency: Method and experimental validations. Build. Environ. 2018, 140, 107–118. [Google Scholar] [CrossRef]
- ISO 14040:2006; Environmental Management—Life Cycle Assessment—Principles and Framework. International Organization for Standardization (ISO): Geneva, Switzerland, 2006. Available online: https://www.iso.org/standard/37456.html (accessed on 4 September 2020).
- ISO 14041:1998; Environmental Management—Life Cycle Assessment—Goal and Scope Definition and Inventory Analysis. International Organization for Standardization (ISO): Geneva, Switzerland, 1998. Available online: https://www.iso.org/standard/23152.html (accessed on 4 September 2020).
- ISO 14042:2000; Environmental Management—Life Cycle Assessment—Life Cycle Impact Assessment. International Organ-ization for Standardization (ISO): Geneva, Switzerland, 2000. Available online: https://www.iso.org/standard/23153.html (accessed on 4 September 2020).
- ISO 14043:2000; Environmental Management—Life Cycle Assessment—Life Cycle Interpretation. International Organization for Standardization (ISO): Geneva, Switzerland, 2000. Available online: https://www.iso.org/standard/23154.html (accessed on 4 September 2020).
- Ecoinvent Centre, “Ecoinvent data v3.2,” Switzerland.: Swiss Centre for Life Cycle Inventories, 2016. Available online: http://www.ecoinvent.org (accessed on 28 March 2022).
- Bulle, C.; Margni, M.; Patouillard, L.; Boulay, A.-M.; Bourgault, G.; De Bruille, V.; Cao, V.; Hauschild, M.; Henderson, A.; Humbert, S.; et al. IMPACT World+: A globally regionalized life cycle impact assessment method. Int. J. Life Cycle Assess. 2019, 24, 1653–1674. [Google Scholar] [CrossRef]


Disclaimer/Publisher’s Note: The statements, opinions and data contained in all publications are solely those of the individual author(s) and contributor(s) and not of MDPI and/or the editor(s). MDPI and/or the editor(s) disclaim responsibility for any injury to people or property resulting from any ideas, methods, instructions or products referred to in the content. |
© 2023 by the authors. Licensee MDPI, Basel, Switzerland. This article is an open access article distributed under the terms and conditions of the Creative Commons Attribution (CC BY) license (https://creativecommons.org/licenses/by/4.0/).