
Object Detection and Distance Measurement Algorithm for Collision Avoidance of Precast Concrete Installation during Crane Lifting Process

 , ,
, , 
Abstract
:Featured Application
Abstract
1. Introduction
2. Background and Related Studies
2.1. Vision-Based Crane Collision Avoidance System
2.2. Sensor-Based Crane Collision Avoidance System
3. Risk Analysis for OSC Projects
3.1. Risk Factors of Implementing the OSC Method
3.2. Analysis of Precast Concrete Lifting Operation
4. Precast Concrete Collision Avoidance in Crane Lifting Process
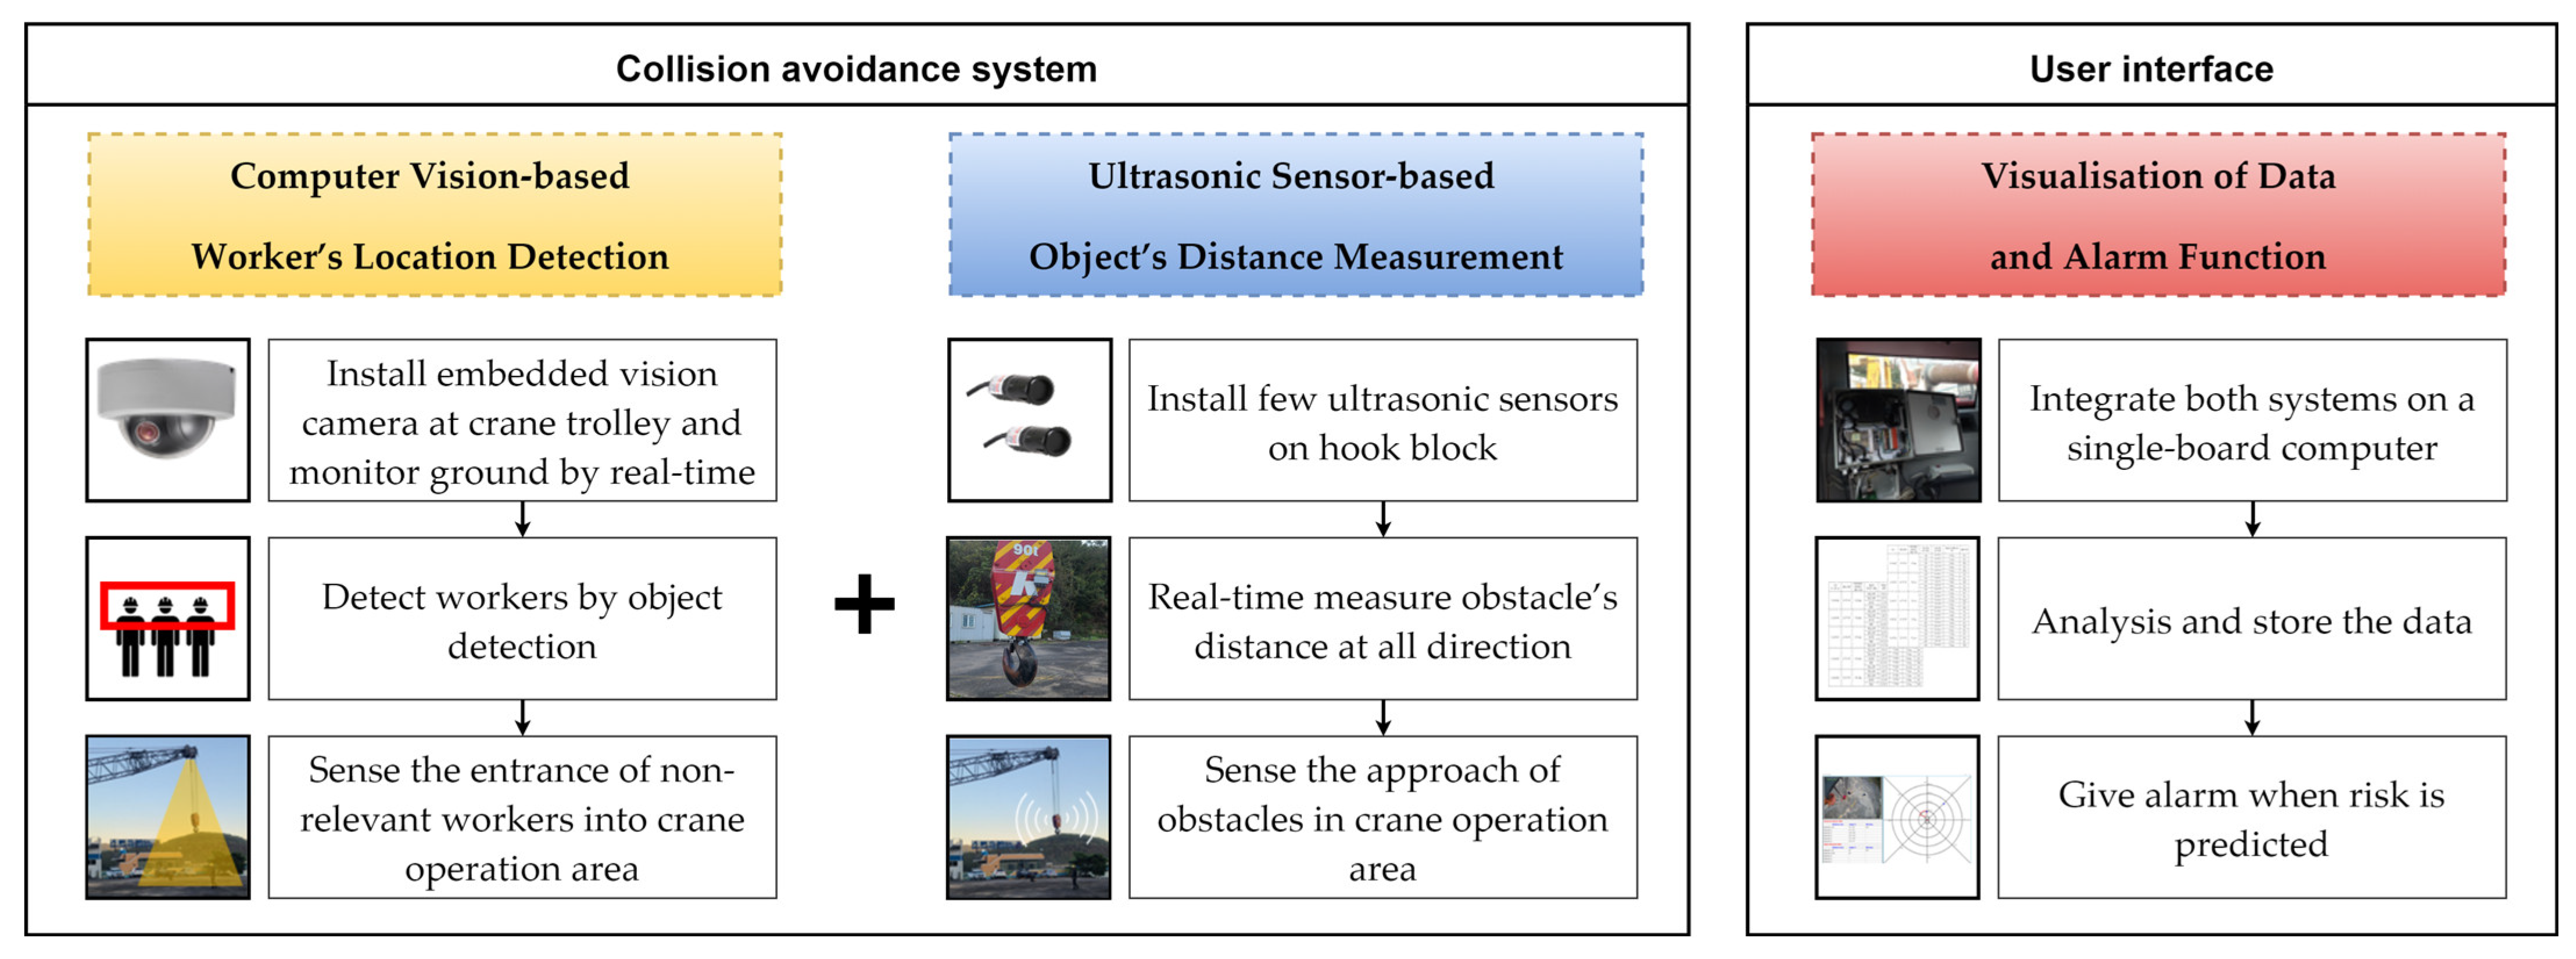
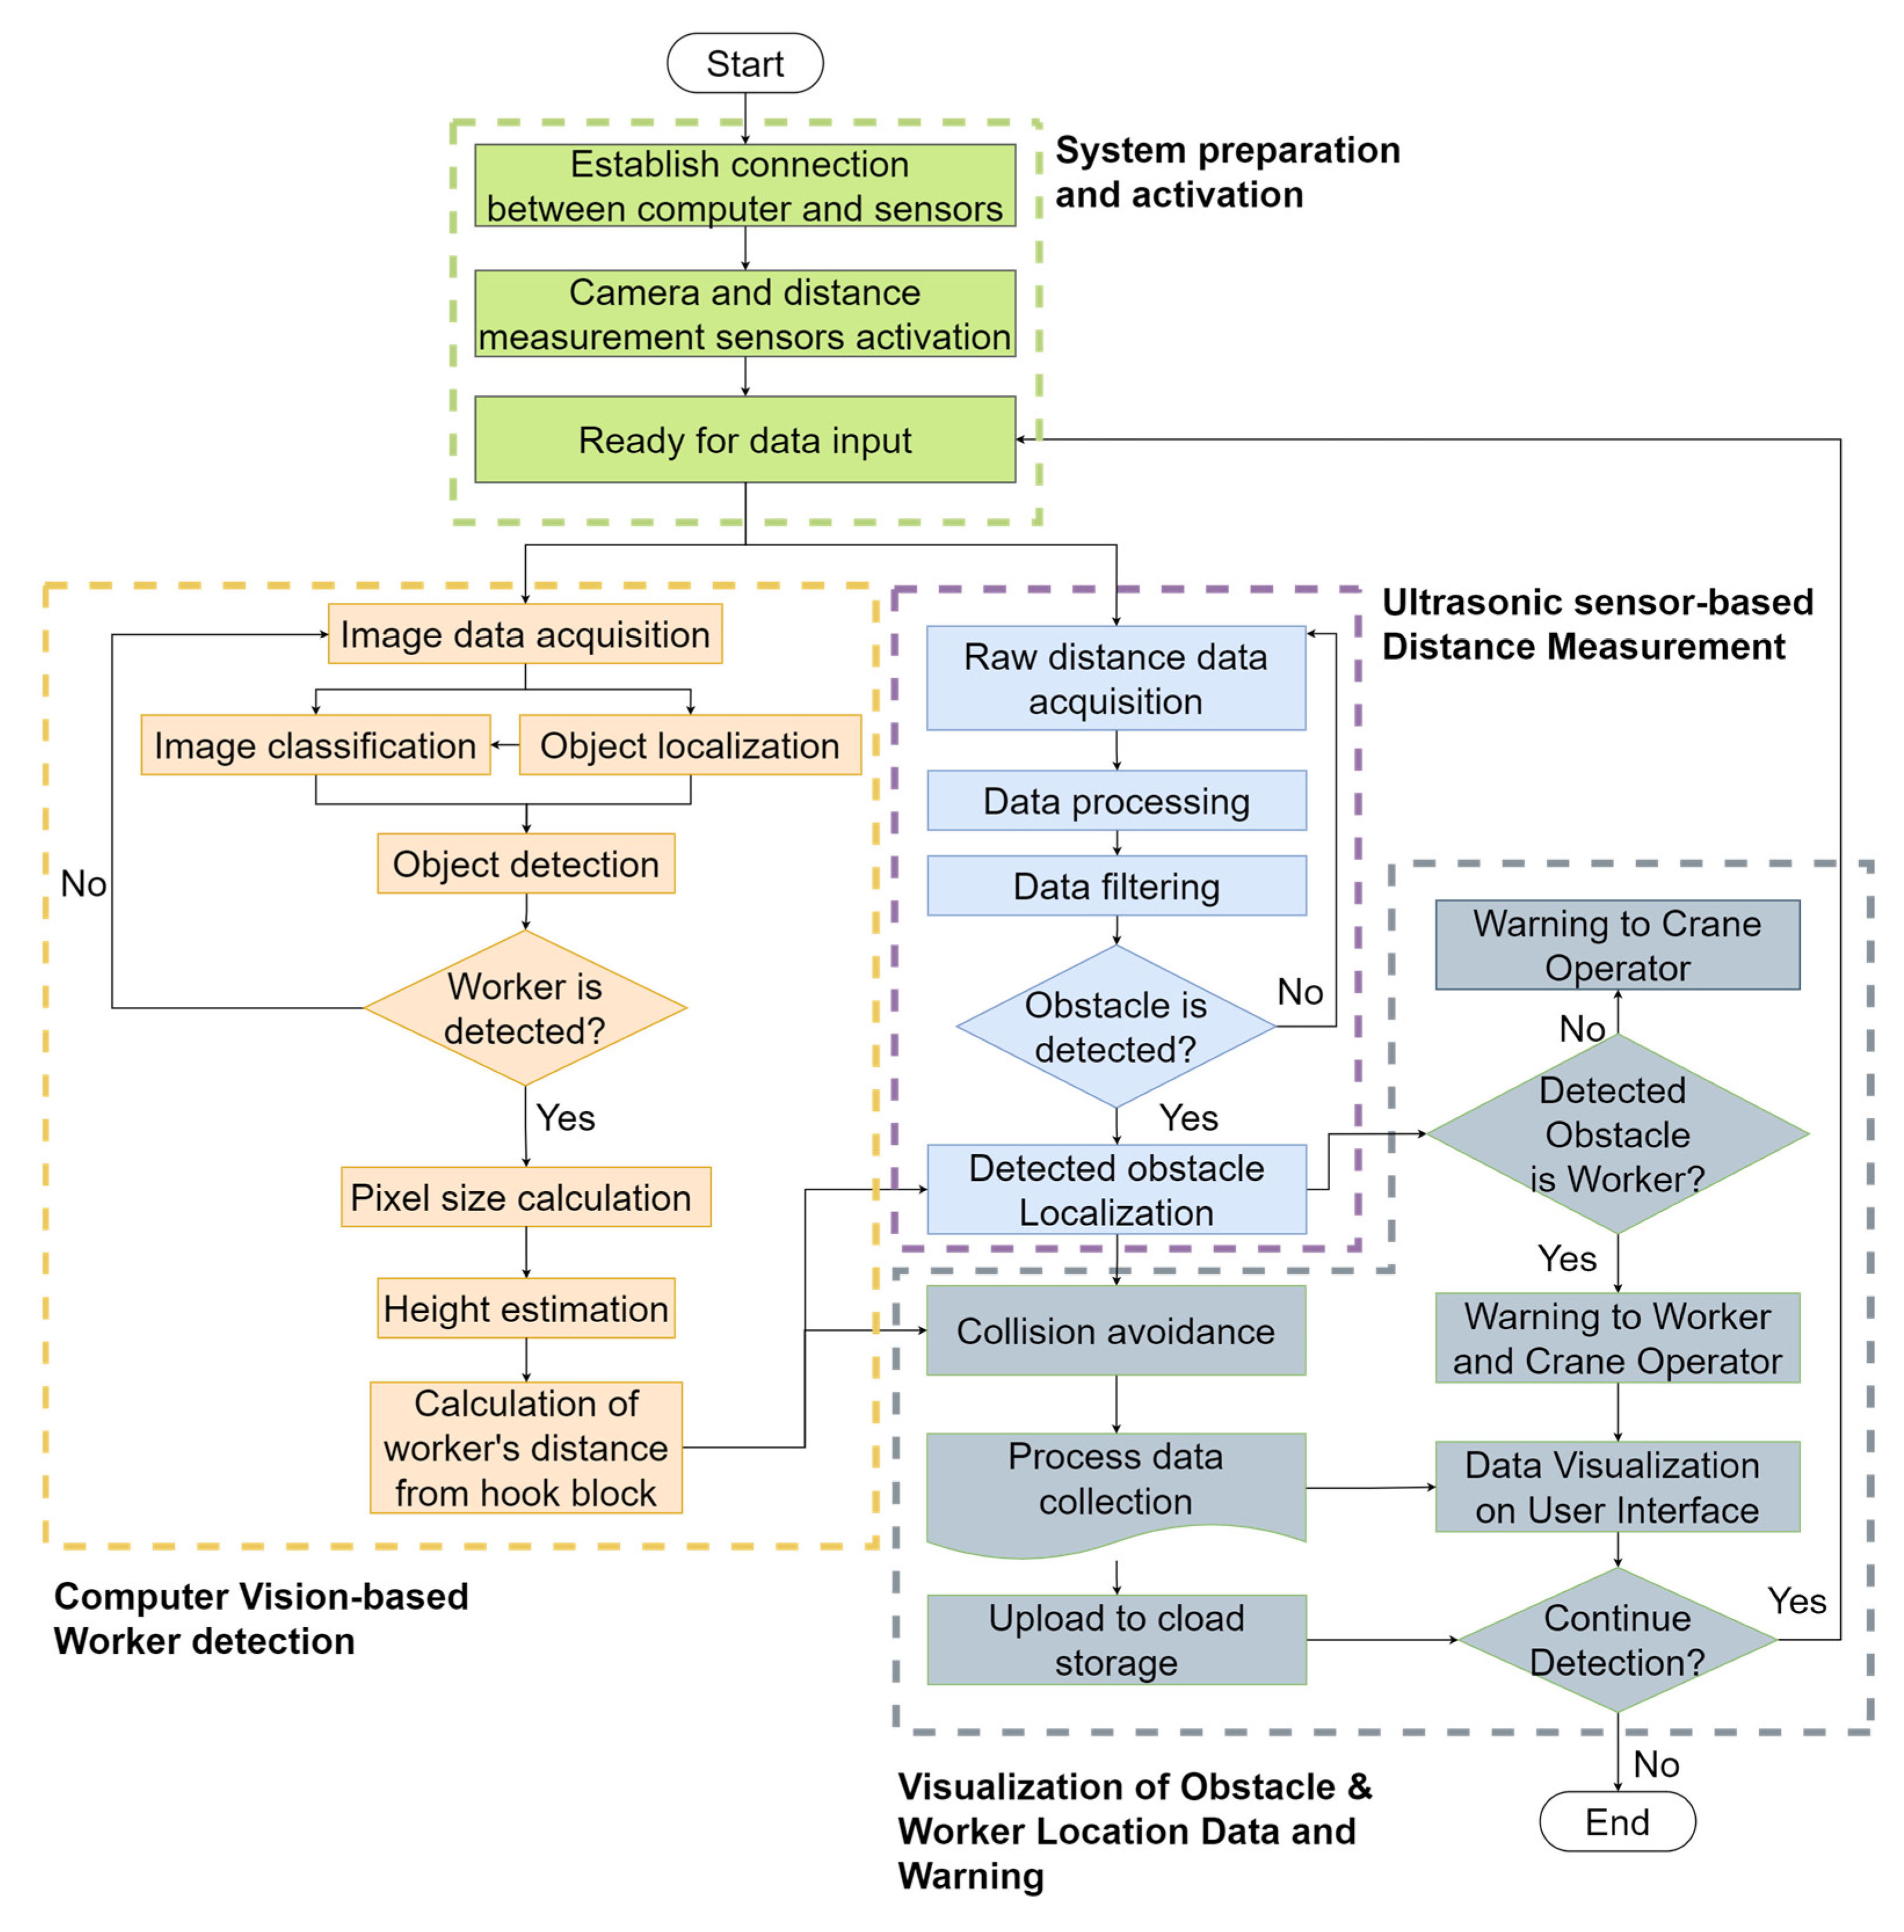
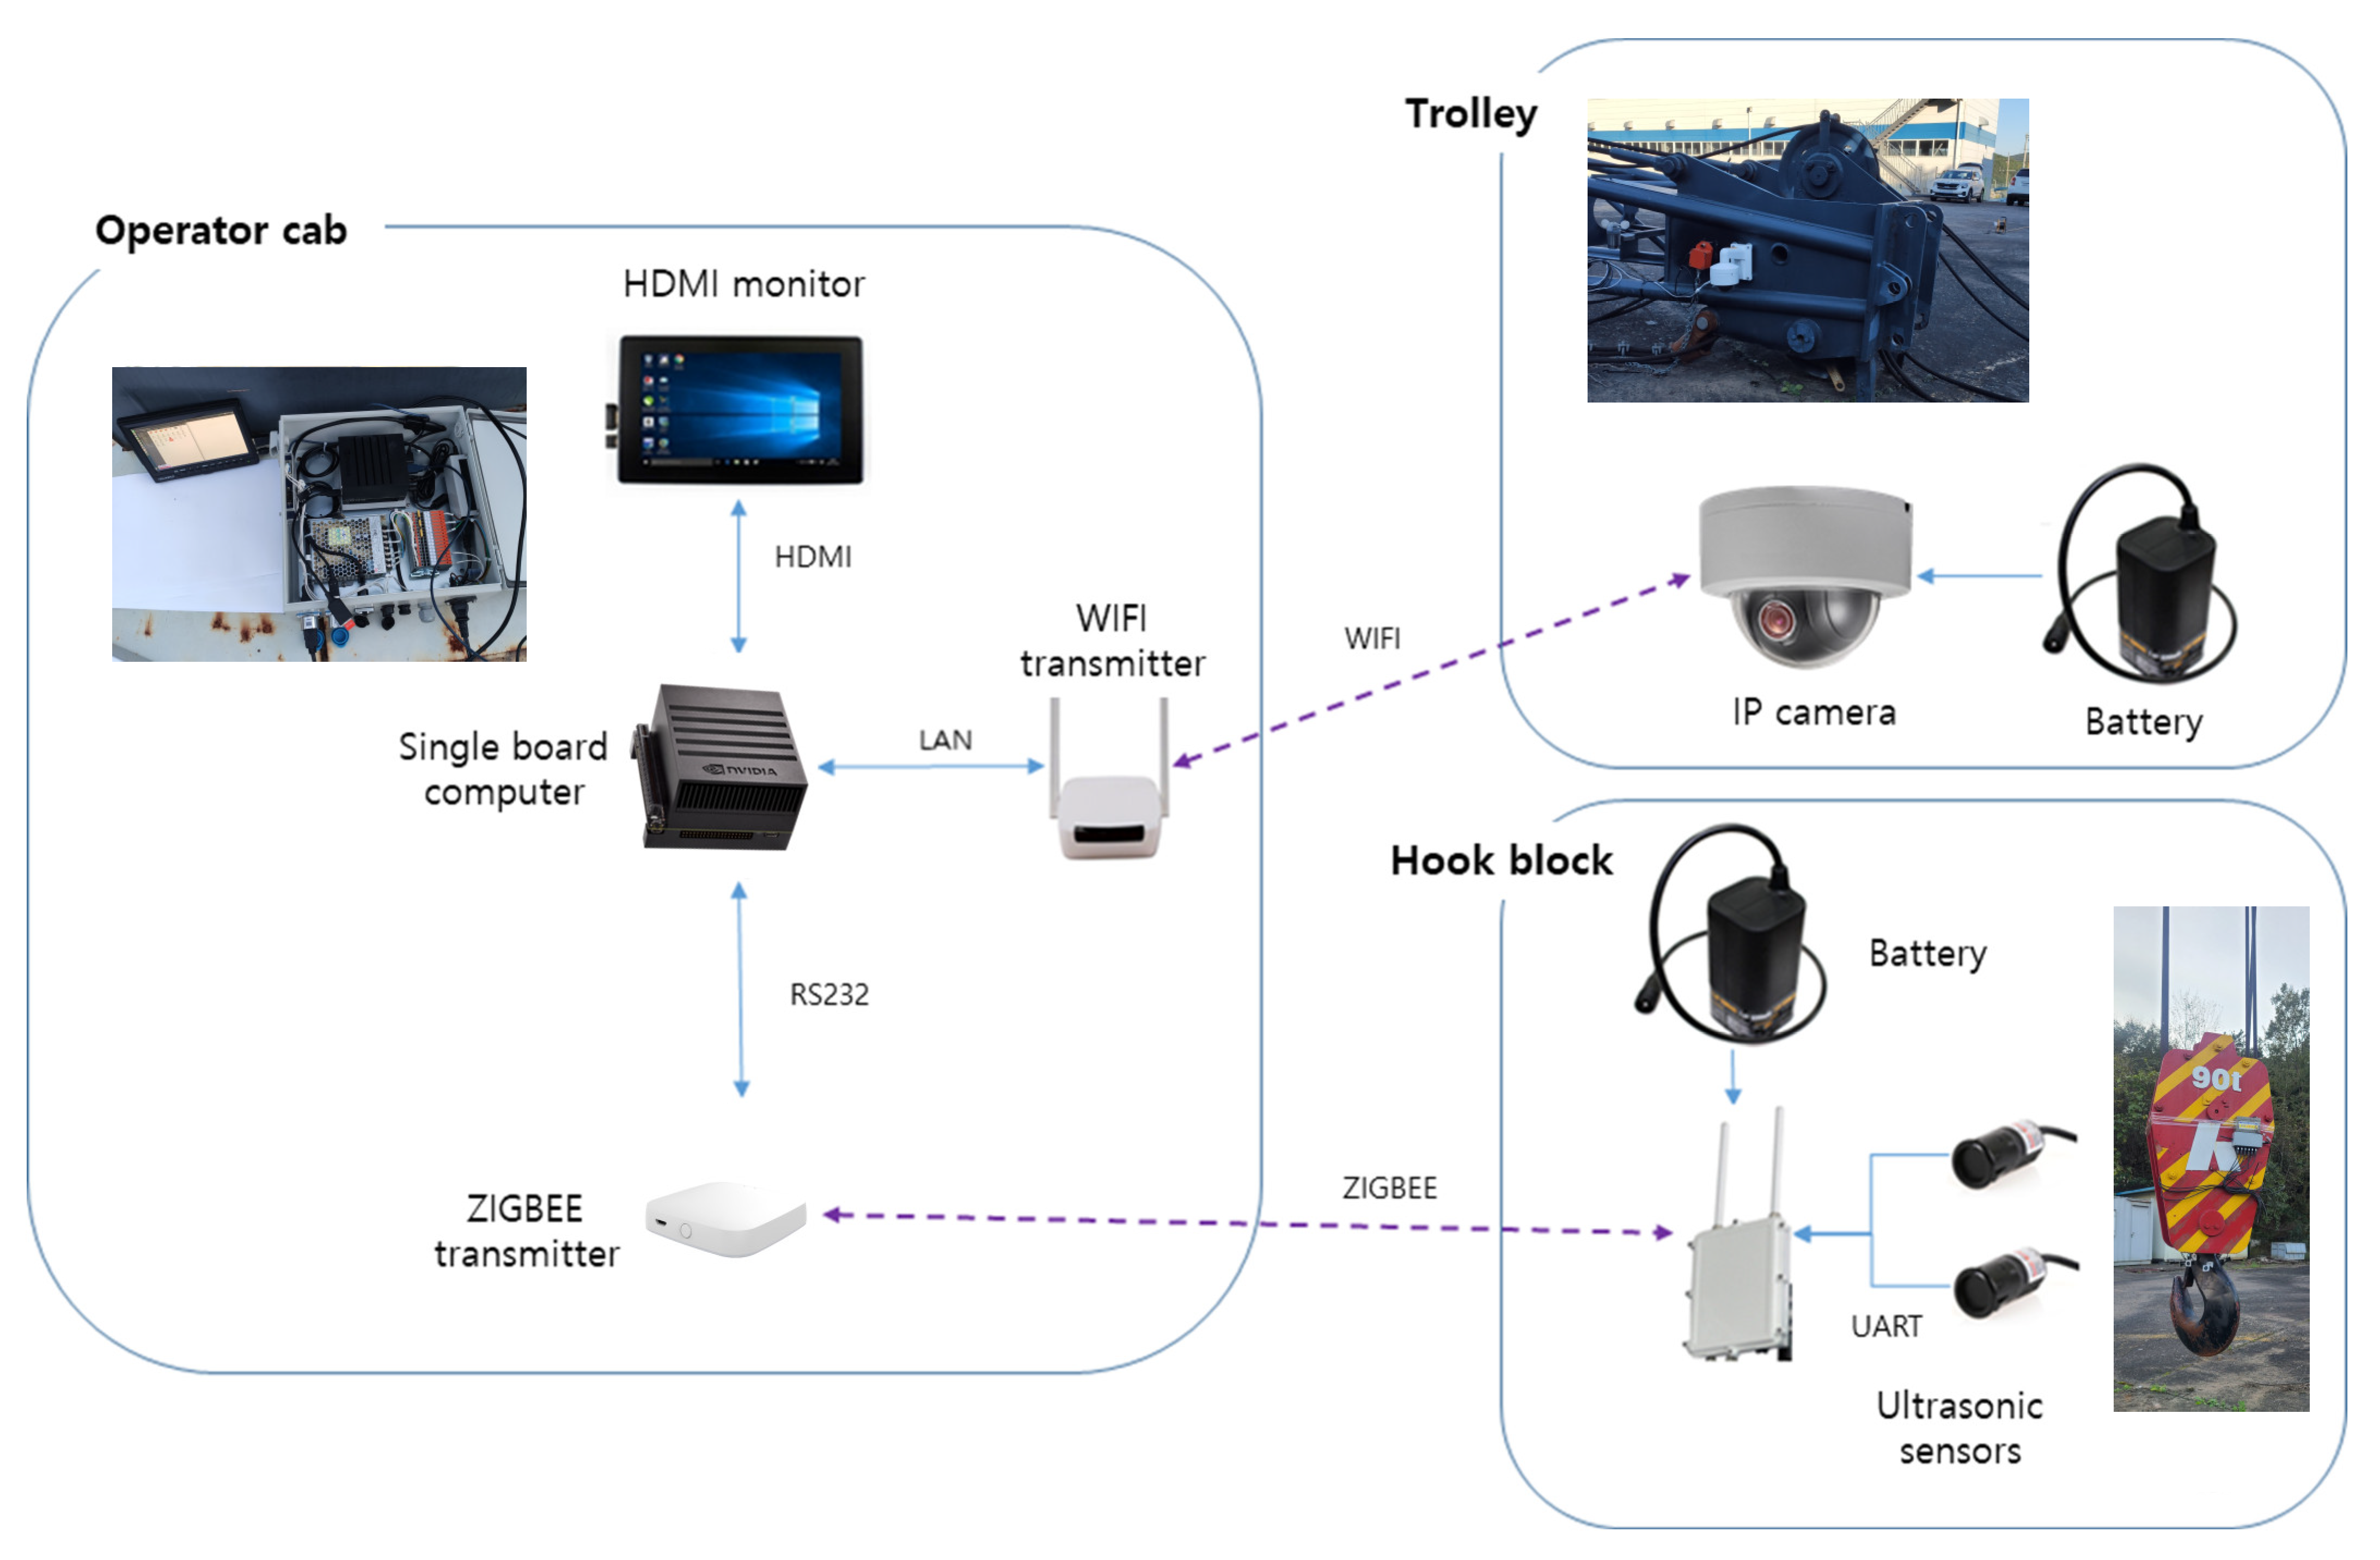
4.1. Overall Architecture of Lifting-Load Collision Avoidance System
4.2. Laboratory Experiment of Prototype Model
4.2.1. Video Image-Based Object Detection
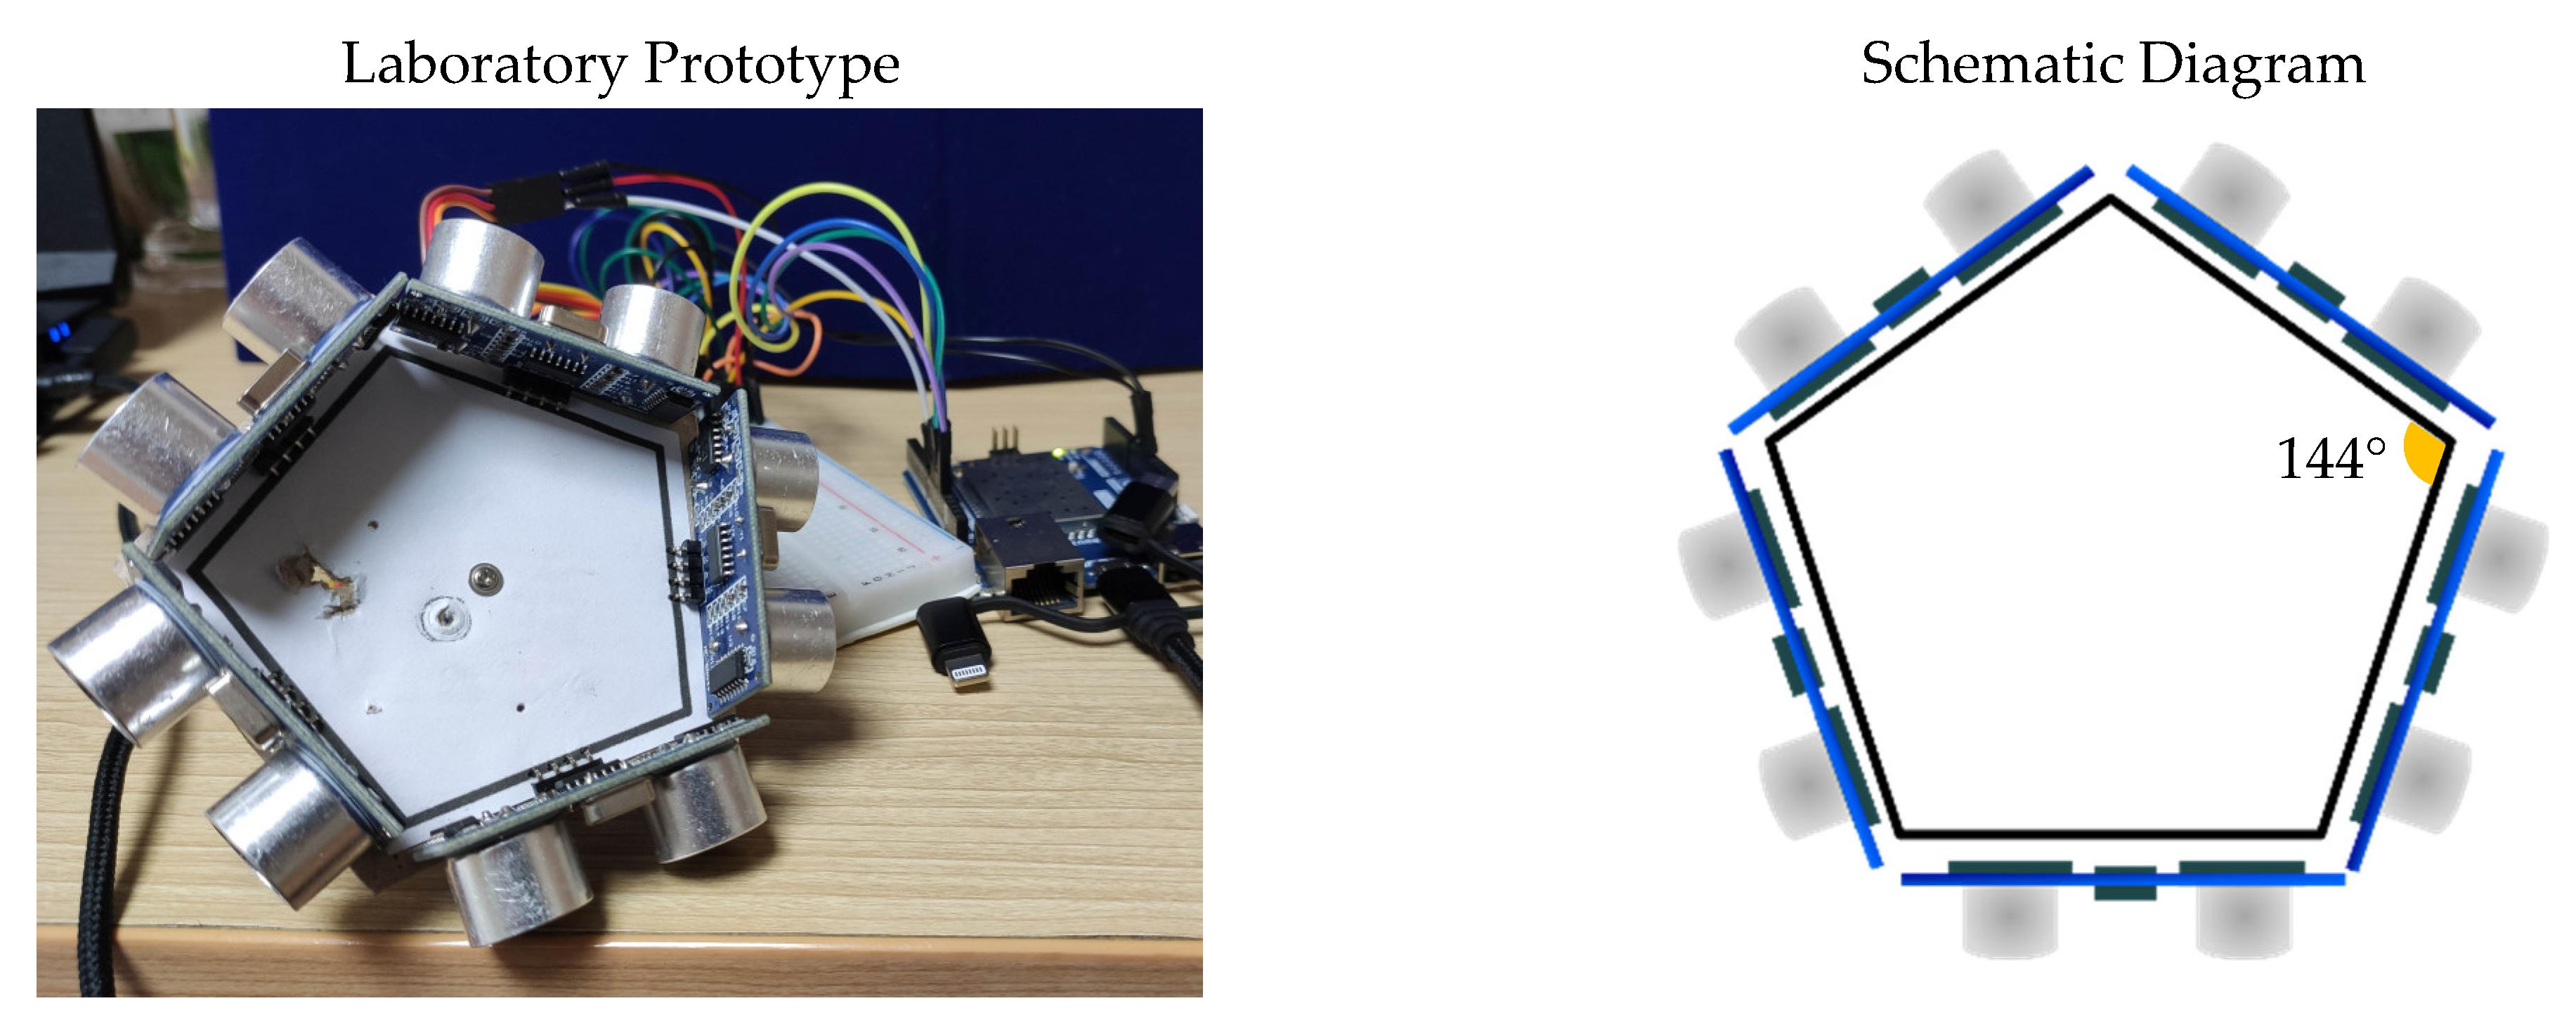
4.2.2. Sensor-Based Distance Measurement
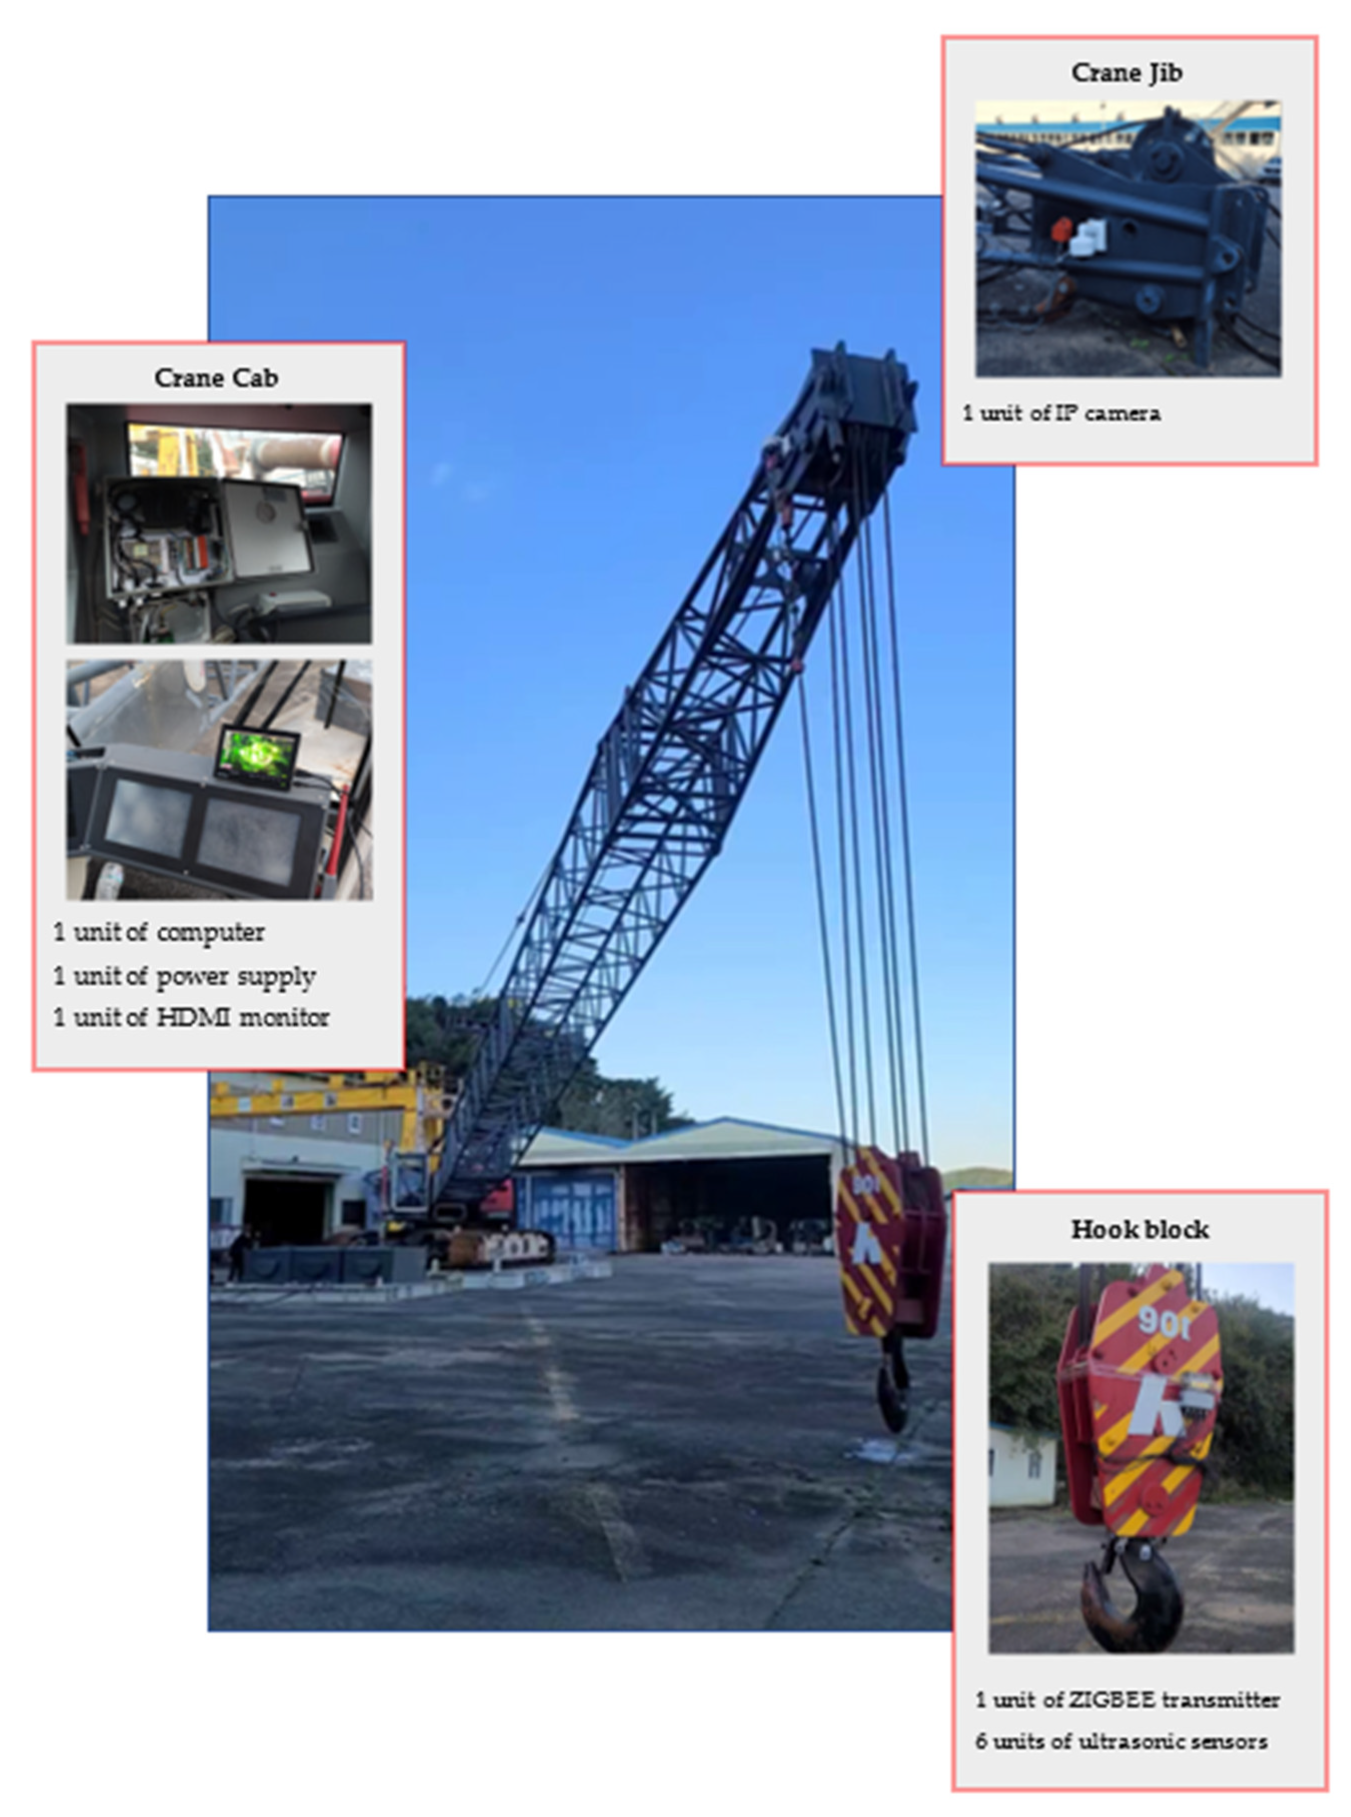
4.3. Field Testing of the Prototype
4.3.1. Data Transmission
4.3.2. Accuracy Evaluation of Distance Measurement System
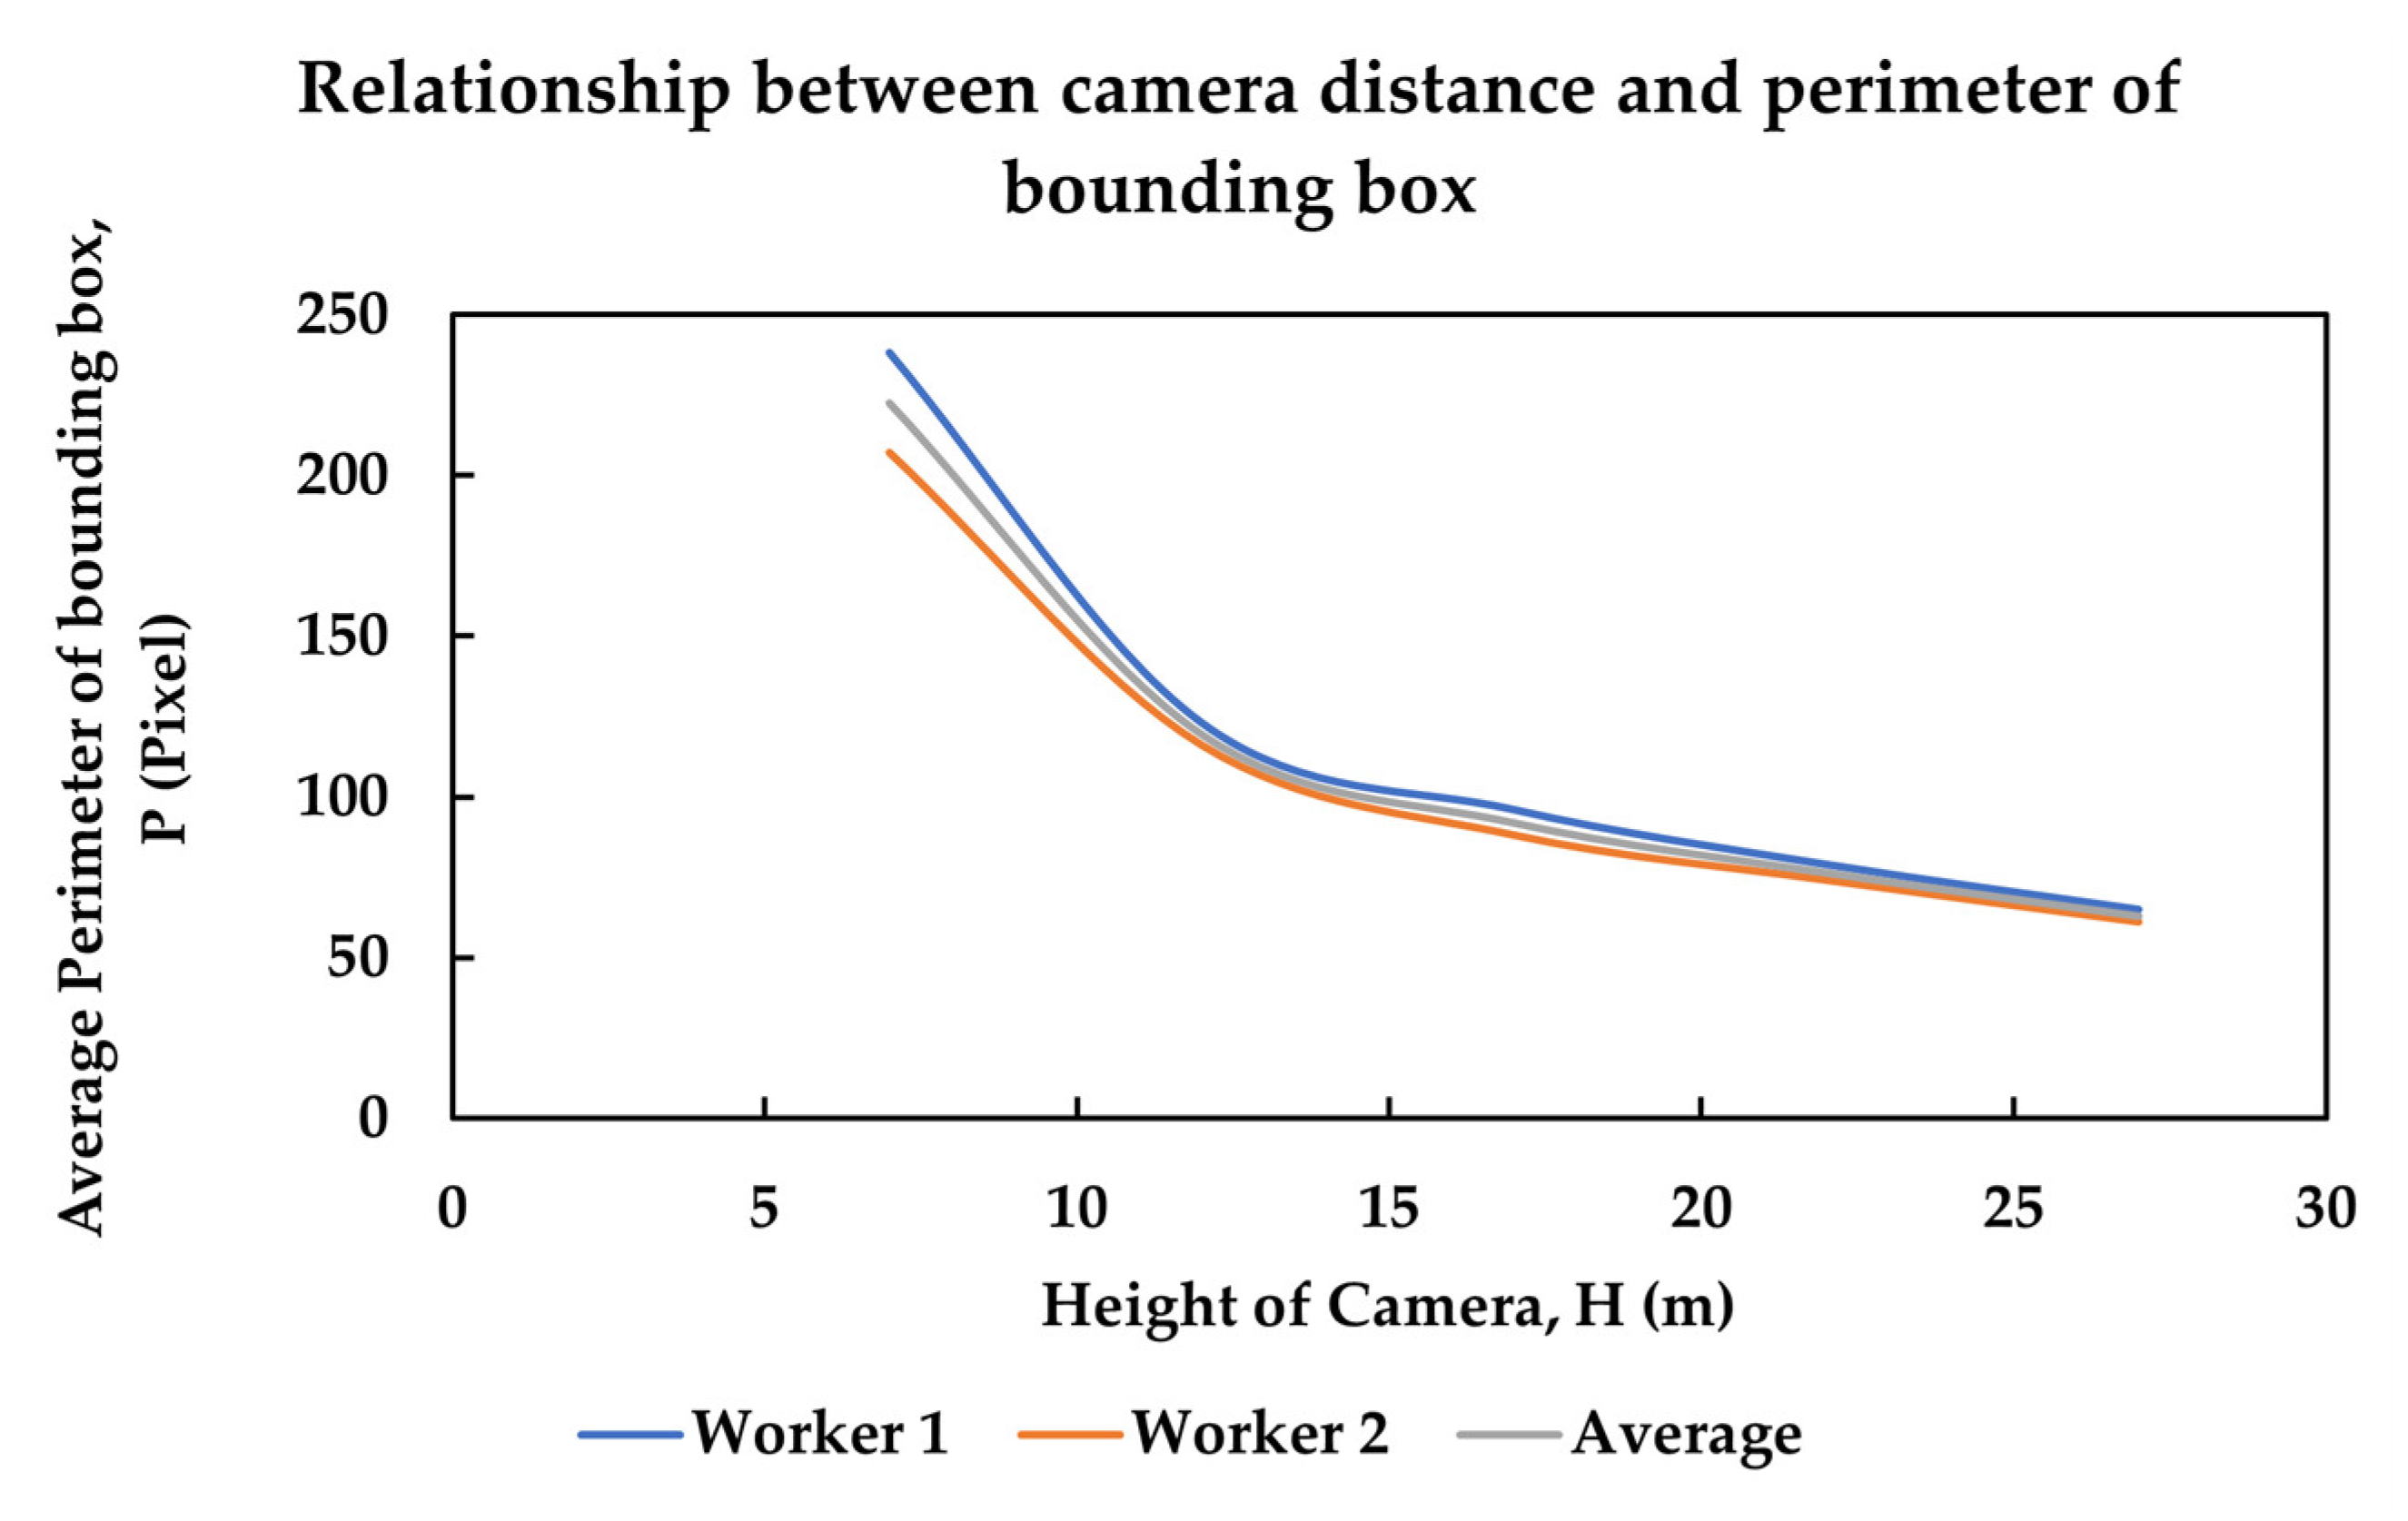
4.3.3. Accuracy Evaluation of Computer Vision System
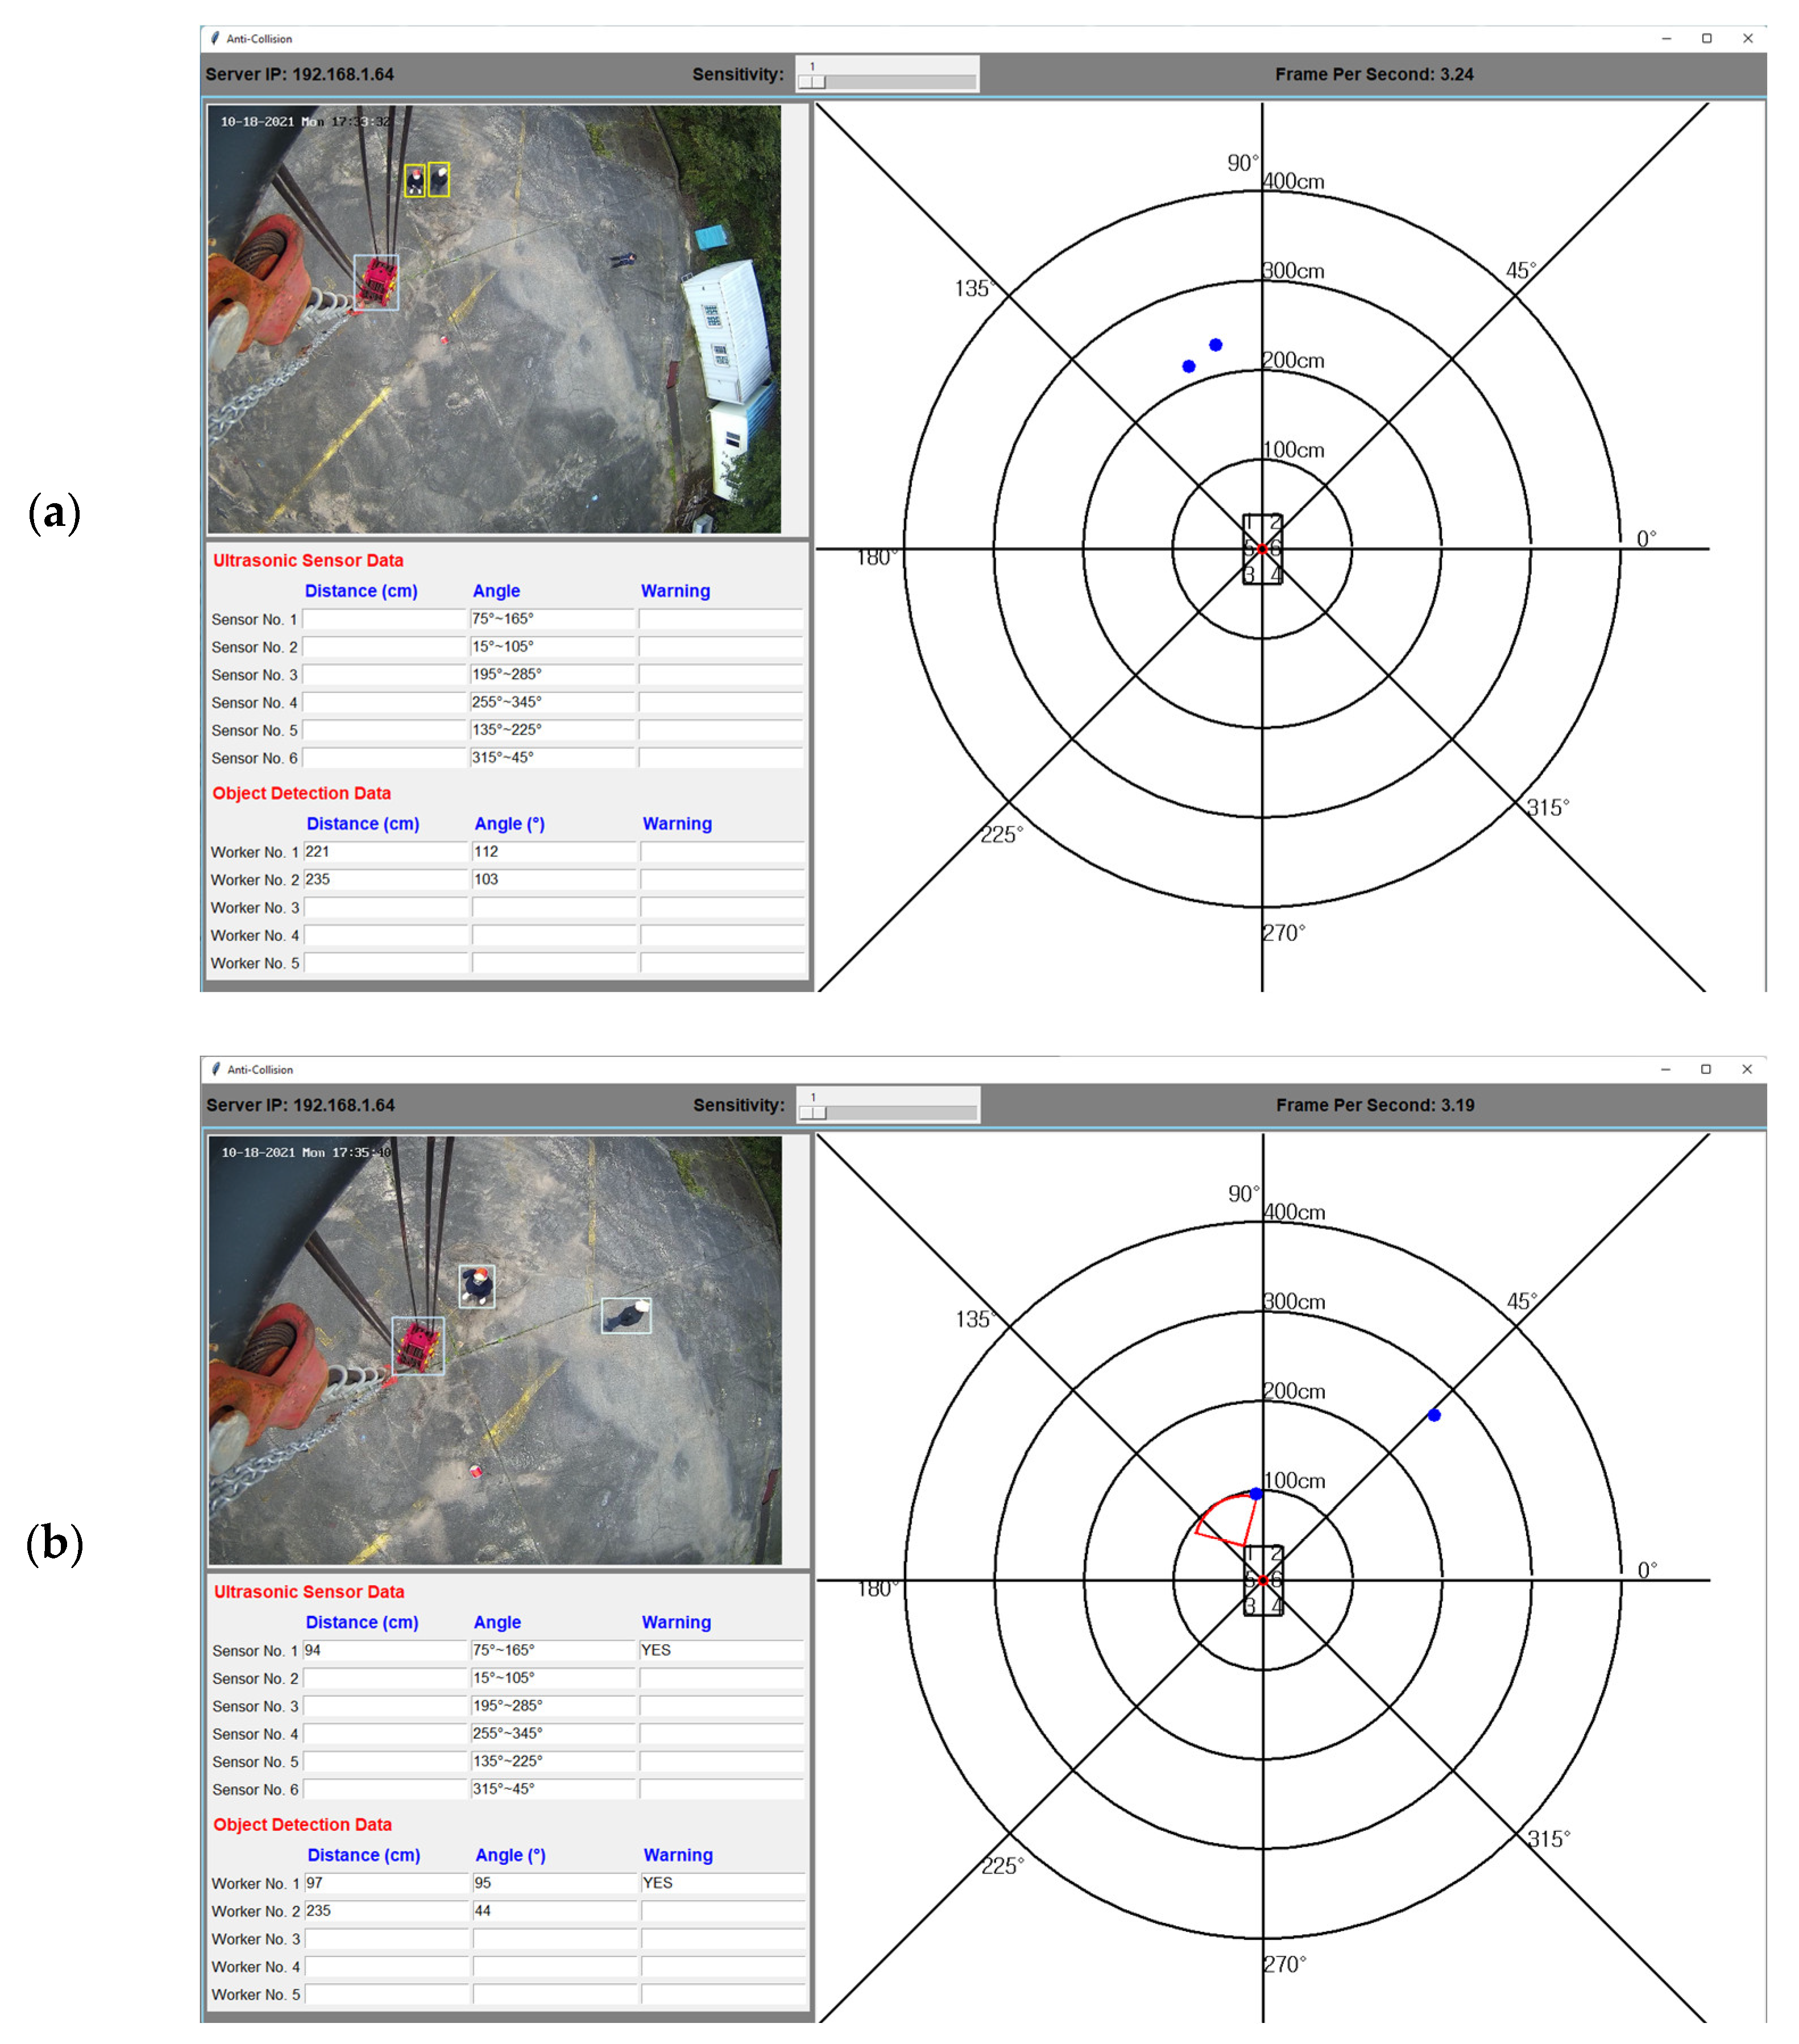
4.3.4. Graphical User Interface (GUI) Development
5. Discussion
5.1. Challenges and the Solutions
5.2. Future Work
6. Conclusions
Author Contributions
Funding
Data Availability Statement
Acknowledgments
Conflicts of Interest
References
- Ministry of Land, Infrastructure and Transport, Republic of Korea. Current Status of Major Statistics for Construction Equipment. Construction Policy Bureau, Seoul; MOLIT: Sejong, Republic of Korea, 2022.
- Ministry of Land, Infrastructure and Transport, Republic of Korea. Final Report on the Development of Innovative Technology for the Apartment Housing Development System Based on Off-Site Construction. Korea Agency for Infrastructure Technology Advancement; MOLIT: Sejong, Republic of Korea, 2020.
- Cao, X.; Li, X.; Zhu, Y.; Zhang, Z. A comparative study of environmental performance between prefabricated and traditional residential buildings in China. J. Clean. Prod. 2015, 109, 131–143. [Google Scholar] [CrossRef]
- Boyd, N.; Khalfan, M.M.; Maqsood, T. Off-Site Construction of Apartment Buildings. J. Archit. Eng. 2013, 19, 51–57. [Google Scholar] [CrossRef]
- Yun, W.; Bae, B.; Kang, T. Comparison of Construction Cost Applied by RC and PC Construction Method for Apartment House and Establishment of OSC Economic Analysis Framework. Korean J. Constr. Eng. Manag. 2022, 23, 20–42. [Google Scholar]
- Jeong, G.; Kim, H.; Lee, H.; Park, M.; Hyun, H. Analysis of safety risk factors of modular construction to identify accident trends. J. Asian Archit. Build. Eng. 2021, 21, 1040–1052. [Google Scholar] [CrossRef]
- Ministry of Employment and Labor, Republic of Korea. Tower Crane Safety Operation Manual. Korea Occupational Safety and Health Agency; MOEL: Sejong, Republic of Korea, 2021.
- Akinosho, T.D.; Oyedele, L.O.; Bilal, M.; Ajayi, A.O.; Delgado, M.D.; Akinade, O.O.; Ahmed, A.A. Deep learning in the construction industry: A review of present status and future innovations. J. Build. Eng. 2020, 32, 101827. [Google Scholar] [CrossRef]
- Kolar, Z.; Chen, H.; Luo, X. Transfer learning and deep convolutional neural networks for safety guardrail detection in 2D images. Autom. Constr. 2018, 89, 58–70. [Google Scholar] [CrossRef]
- Rashid, K.M.; Louis, J. Times-series data augmentation and deep learning for construction equipment activity recognition. Adv. Eng. Inform. 2019, 42, 100944. [Google Scholar] [CrossRef]
- Hernandez, C.; Slaton, T.; Balali, V.; Akhavian, R. A Deep Learning Framework for Construction Equipment Activity Analysis. In Proceedings of the ASCE International Conference on Computing in Civil Engineering 2019, Atlanta, Georgia, 17–19 June 2019; pp. 479–486. [Google Scholar]
- Slaton, T.; Hernandez, C.; Akhavian, R. Construction activity recognition with convolutional recurrent networks. Autom. Constr. 2020, 113, 103138. [Google Scholar] [CrossRef]
- Sherafat, B.; Rashidi, A.; Song, S. A Software-Based Approach for Acoustical Modeling of Construction Job Sites with Multiple Operational Machines. In Proceedings of the Construction Research Congress 2020, Tempe, AZ, USA, 8–10 March 2020; pp. 886–895. [Google Scholar]
- Fang, Q.; Li, H.; Luo, X.; Ding, L.; Luo, H.; Rose, T.M.; An, W. Detecting non-hardhat-use by a deep learning method from far-field surveillance videos. Autom. Constr. 2018, 85, 1–9. [Google Scholar] [CrossRef]
- Wu, J.; Cai, N.; Chen, W.; Wang, H.; Wang, G. Automatic detection of hardhats worn by construction personnel: A deep learning approach and benchmark dataset. Autom. Constr. 2019, 106, 102894. [Google Scholar] [CrossRef]
- Nath, N.D.; Behzadan, A.H.; Paal, S.G. Deep learning for site safety: Real-time detection of personal protective equipment. Autom. Constr. 2020, 112, 103085. [Google Scholar] [CrossRef]
- Zhang, H.; Yan, X.; Li, H. Ergonomic posture recognition using 3D view-invariant features from single ordinary camera. Autom. Constr. 2018, 94, 1–10. [Google Scholar] [CrossRef]
- Yu, Y.; Li, H.; Yang, X.; Kong, L.; Luo, X.; Wong, A.Y. An automatic and non-invasive physical fatigue assessment method for construction workers. Autom. Constr. 2019, 103, 1–12. [Google Scholar] [CrossRef]
- Yang, K.; Ahn, C.R.; Kim, H. Deep learning-based classification of work-related physical load levels in construction. Adv. Eng. Inform. 2020, 45, 101104. [Google Scholar] [CrossRef]
- Luo, H.; Xiong, C.; Fang, W.; Love, P.E.; Zhang, B.; Ouyang, X. Convolutional neural networks: Computer vision-based workforce activity assessment in construction. Autom. Constr. 2018, 94, 282–289. [Google Scholar] [CrossRef]
- Luo, X.; Li, H.; Cao, D.; Dai, F.; Seo, J.; Lee, S. Recognizing Diverse Construction Activities in Site Images via Relevance Networks of Construction-Related Objects Detected by Convolutional Neural Networks. J. Comput. Civ. Eng. 2018, 32, 04018012. [Google Scholar] [CrossRef]
- Yang, J.S.; Huang, M.L.; Chien, W.F.; Tsai, M.H. Application of Machine Vision to Collision Avoidance Control of the Overhead Crane. In Proceedings of the 2015 International Conference on Electrical, Automation and Mechanical Engineering, Phuket, Thailand, 26–27 July 2015; pp. 361–364. [Google Scholar]
- Fang, Y.; Chen, J.; Cho, Y.K.; Kim, K.; Zhang, S.; Perez, E. Vision-based load sway monitoring to improve crane safety in blind lifts. J. Struct. Integr. Maint. 2018, 3, 233–242. [Google Scholar] [CrossRef]
- Price, L.C.; Chen, J.; Park, J.; Cho, Y.K. Multisensor-driven real-time crane monitoring system for blind lift operations: Lessons learned from a case study. Autom. Constr. 2021, 124, 103552. [Google Scholar] [CrossRef]
- Gu, L.; Kou, X.; Jia, J. Distance measurement for tower crane obstacle based on multi-ultrasonic sensors. In Proceedings of the 2012 IEEE International Conference on Automation Science and Engineering, Seoul, Republic of Korea, 20–24 August 2012; pp. 1028–1032. [Google Scholar]
- Xi-Ping, L.; Li-Chen, G.; Jia, J. Anti-collision method of tower crane via ultrasonic multi-sensor fusion. In Proceedings of the International Conference on Automatic Control and Artificial Intelligence (ACAI 2012), Xiamen, China, 3–5 March 2012; pp. 522–525. [Google Scholar]
- Sleiman, J.; Zankoul, E.; Khoury, H.; Hamzeh, F. Sensor-Based Planning Tool for Tower Crane Anti-Collision Monitoring on Construction Sites. In Proceedings of the Construction Research Congress 2016, San Juan, Puerto Rico, 31 May–2 June 2016; pp. 2624–2632. [Google Scholar]
- Zhong, D.; Lv, H.; Han, J.; Wei, Q. A Practical Application Combining Wireless Sensor Networks and Internet of Things: Safety Management System for Tower Crane Groups. Sensors 2014, 14, 13794–13814. [Google Scholar] [CrossRef] [PubMed]
- Lee, G.; Cho, J.; Ham, S.; Lee, T.; Lee, G.; Yun, S.; Yang, H. A BIM- and sensor-based tower crane navigation system for blind lifts. Autom. Constr. 2012, 26, 1–10. [Google Scholar] [CrossRef]
- Kim, M.; Yoon, I.; Kim, N.; Park, M.; Ahn, C.; Jung, M. A Study on Virtual Environment Platform for Autonomous Tower Crane. Korean J. Constr. Eng. Manag. 2022, 3, 3–14. [Google Scholar]
- Rosén, E.; Sander, U. Pedestrian fatality risk as a function of car impact speed. Accid. Anal. Prev. 2009, 41, 536–542. [Google Scholar] [CrossRef] [PubMed]
- Kang, Y.; Siddiqui, S.; Suk, S.J.; Chi, S.; Kim, C. Trends of Fall Accidents in the U.S. Construction Industry. J. Constr. Eng. Manag. 2017, 143, 04017043. [Google Scholar] [CrossRef]
- Ministry of Employment and Labor, Republic of Korea. Status of Industrial Accidents Occurrence at the End of December 2020. Korea Occupational Safety and Health Agency; MOEL: Sejong, Republic of Korea, 2021.


| Application | Reference |
|---|---|
| Construction equipment activity recognition | [9,10,11,12,13] |
| Worker’s protective equipment detection | [14,15,16] |
| Worker’s postural evaluation | [17,18,19] |
| Workforce activity assessment | [20,21] |
| Method | Research | ||
|---|---|---|---|
| [22] | [23] | [24] | |
| AI-based image processing | No | No | No |
| Non-AI-based image processing | Yes | Yes | Yes |
| 3D visualization | No | Yes | Yes |
| Worker detection | No | No | Yes |
| Method | Research | |||||
|---|---|---|---|---|---|---|
| [25] | [26] | [27] | [28] | [29] | [30] | |
| Sensor on hook block | No | Yes | Yes | Yes | No | Yes |
| Sensor on jib/ trolley | Yes | Yes | Yes | Yes | Yes | Yes |
| Crane anti-collision | Yes | Yes | Yes | Yes | Yes | Yes |
| Dynamic object anti-collision | No | Yes | No | No | No | No |
| 3D Visualization | No | No | Yes | No | No | Yes |
| Shape | Dimension 1 | Largest Surface Area (unit2) | Ratio of Largest Dimension to Smallest Dimension | Level of Collision Risk |
|---|---|---|---|---|
 | 4 × 4 × 4 | 16 | 1:1 | low |
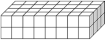 | 8 × 4 × 2 | 32 | 4:1 | medium |
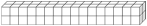 | 16 × 2 × 2 | 32 | 8:1 | high |
 | 8 × 8 × 1 | 64 | 8:1 | high |
| Scenario | Explanation of Scenario | Result |
|---|---|---|
 | Standard operating procedure is followed, and a high-compactness load is lifted. Load is transferred safely in a controlled environment. This scenario is taken as benchmark to compare performances of other scenarios. | Accident can still happen due to carelessness or negligence of workers and external factors. |
 | Standard operating procedure is followed. However, a low-compactness load which is flat or elongated shape is lifted. | Large dimension of load increases the risk of collision. |
 | High wind pressure occurs around the load and causes it to oscillate or swing. | Irregular and unpredictable movement of load increases the risk of collision. |
 | Rotation of mobile crane at high speed when a load is suspended causes the crane working radius to be increased instantaneously. | Centrifugal force and inertia of load increase the risk of collision. |
 | The load is lifted at a point far from the axis of hoist line. In case when the starting point is inside the hoist line axis, the operation radius will be increased instantaneously when the load is lifted. | Instant movement of load increases the risk of collision. |
| Device | Feature | Function |
|---|---|---|
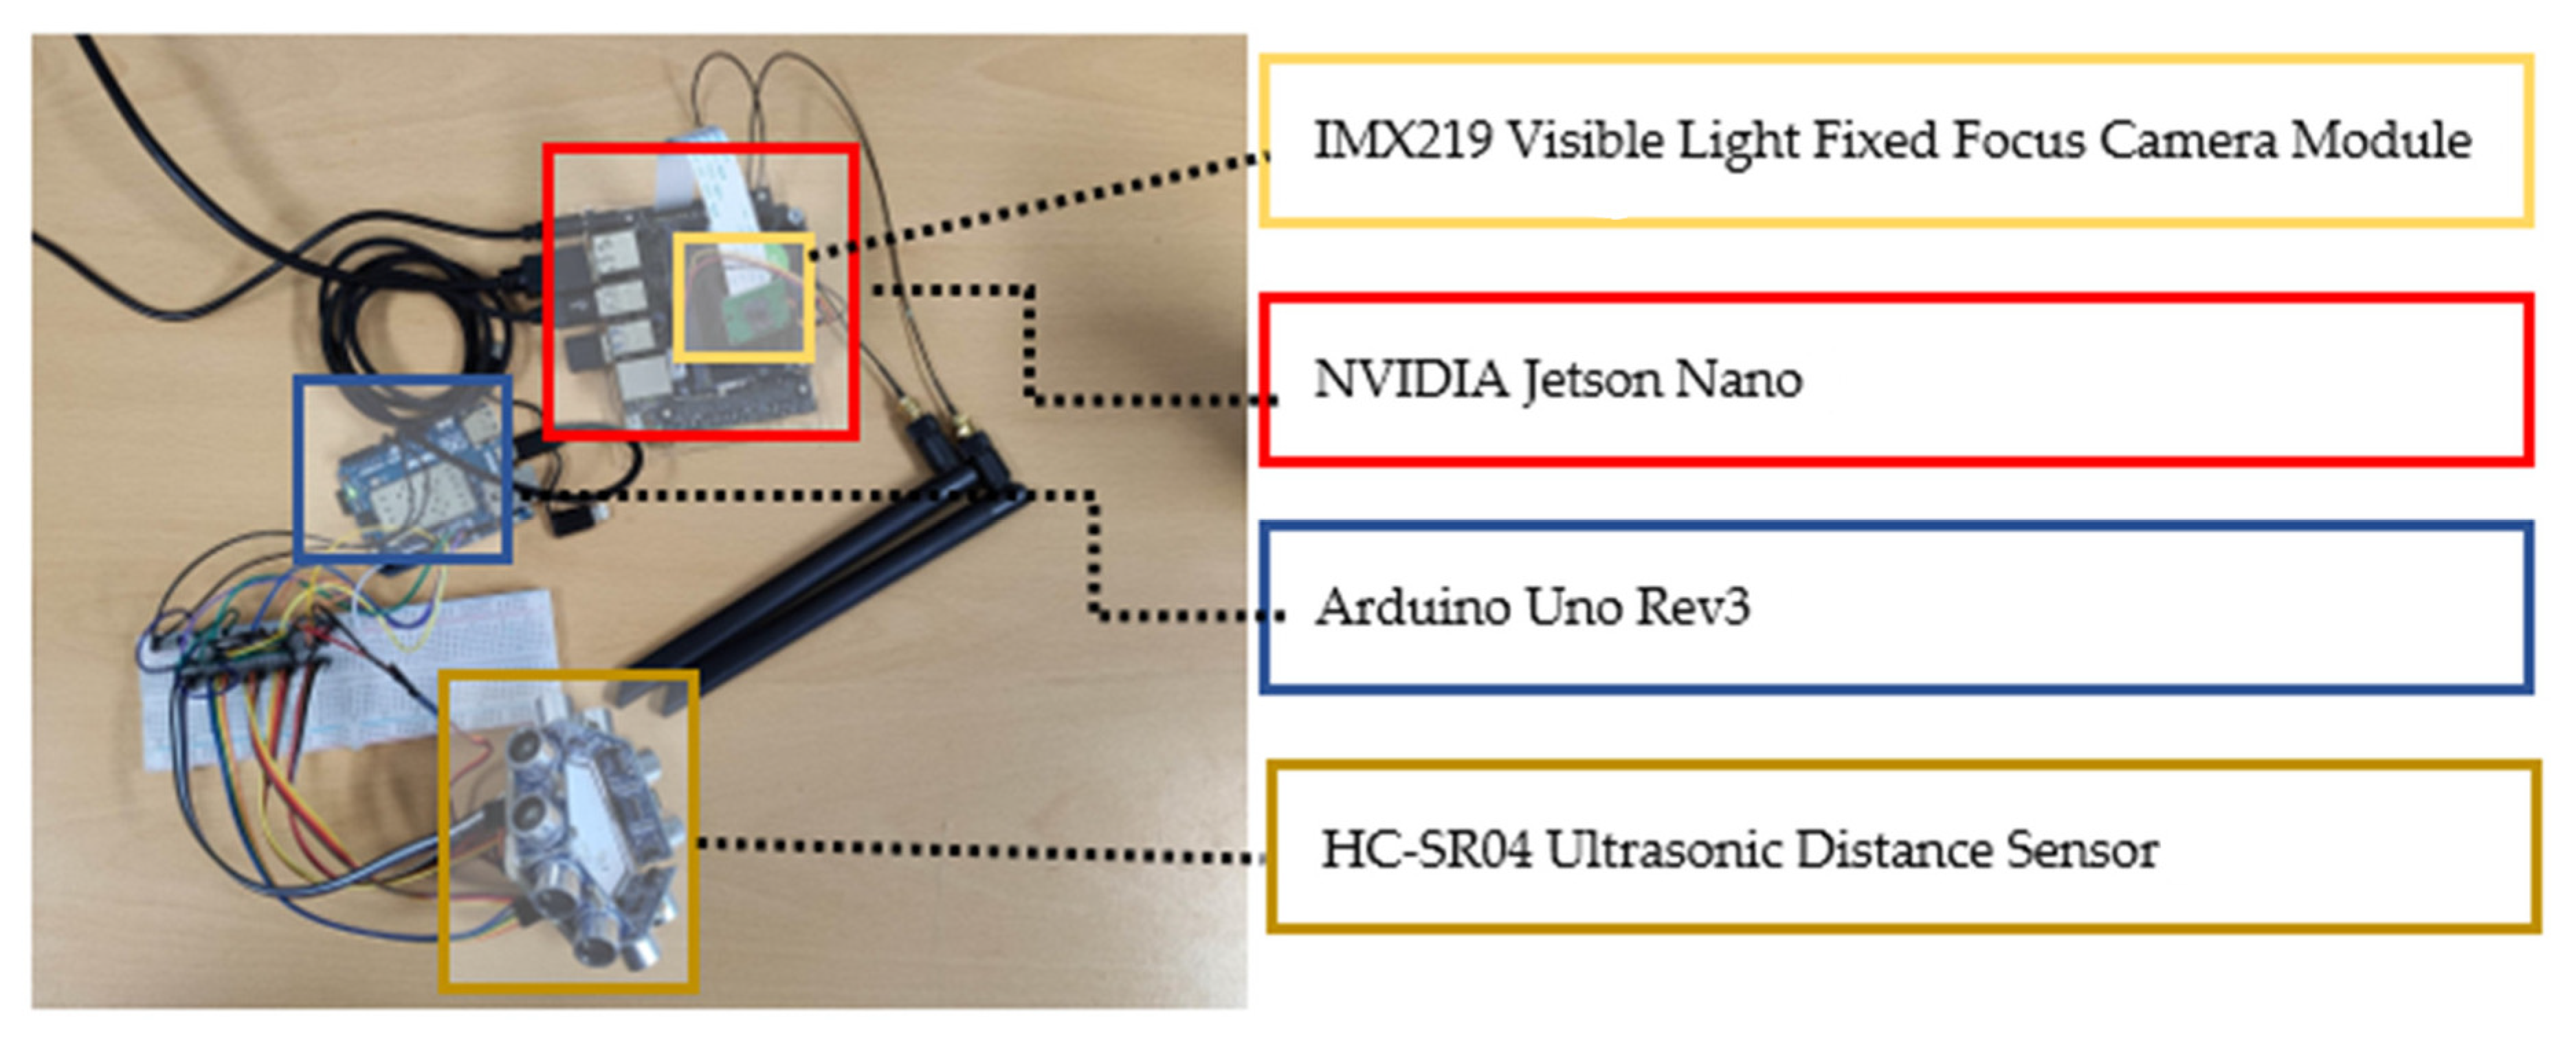
| NVIDIA Jetson Nano | 128-core Maxwell GPU; Quad-core ARM A57 @ 1.43 GHz CPU; 100 mm × 80 mm × 29 mm | Perform computing task and provide interfacing |
| Arduino Uno Rev3 | ATmega328P microcontroller; 16 MHz of clock speed | Read raw data of sensors |
| IMX219 Visible Light Fixed Focus Camera Module | 8 Megapixel IMX219 sensor; 21fps@8MP; 62.2° of horizontal viewing angle | Capture visual information |
| HC-SR04 Ultrasonic Distance Sensor | 2 cm to 400 cm of ranging distance; 15° of effectual measuring angle | Non-contact distance measurement |
| Training Model | |||||
|---|---|---|---|---|---|
| First | Second | Third | Fourth | Fifth | |
| Deep learning algorithm | SSD | SSD | SSD | Faster RCNN | Faster RCNN |
| Feature extractor | MobileNet V2 | Resnet50 V1 | Resnet50 V1 | Resnet50 V1 | Resnet50 V1 |
| Input image size | 640 × 640 | 640 × 640 | 1024 × 1024 | 640 × 640 | 1024 × 1024 |
| Frame per second | 10.63 | 4.85 | 3.03 | 3.20 | 2.64 |
| mAP | 0.749 | 0.707 | 0.791 | 0.751 | 0.831 |
| Device | Feature | Function |
|---|---|---|
| NVIDIA Jetson AGX Xavier | 512-core Volta GPU; 8-core ARM v8.2 64-bit CPU; 105 mm × 105 mm × 65 mm of module size | Performs computing task and provides interfacing |
| Hikvision PTZ IP Dome Camera | 3 Megapixel CMOS sensor; 30fps@3MP; 102° of horizontal viewing angle; 1/2.8 of sensor size; 4× Optical Zoom; water, dust, and vandal resistant | Captures visual information for object and worker detection |
| STMA-503 Ultrasonic Sensor Module | 30 cm to 200 cm of ranging distance; 90° of effectual measuring angle | Non-contact distance measurement and moving object counter |
| HDMI monitor | 7-inch HD display | Displays vision for crane operator |
| ZIGBEE SH-WST24 router with XBEE3 module | Radio frequency 250 Kbps; Serial 1 Mbps; Up to 1200 m of outdoor and 60 m of indoor transmission range | Transmits sensor data wirelessly to computer for processing |
| LRS-100-24 Switching Power Supply | 24 V DC voltage, 4.5 A rated current, 108 W rated power | Supplies electric power to sensors and camera |
| Test | Number of Worker | True Distance (cm) | Index of Sensor | Measured Distance (cm) | Percent Error (%) |
|---|---|---|---|---|---|
| 1 | 1 worker. 1 is detected | 189 | 2 | 193 | 2.07 |
| 2 | 1 worker. 1 is detected | 187 | 4 | 181 | 3.32 |
| 3 | 2 workers. 1 is detected | 185 | 2 | 182 | 1.65 |
| 231 | Not Detected; Over 200 cm | ||||
| 4 | 2 workers. 2 are detected | 180 | 1 | 176 | 2.27 |
| 231 | Not Detected; Over 200 cm | ||||
| Test | Height of Camera (m) | Worker | Actual Adjacent Distance from Hook, DA (cm) | Average Perimeter of Bounding Box, P (Pixel) |
|---|---|---|---|---|
| 1 | 7 | 1 | 241 | 238 |
| 2 | 268 | 207 | ||
| 2 | 12 | 1 | 241 | 123 |
| 2 | 268 | 116 | ||
| 3 | 17 | 1 | 241 | 96 |
| 2 | 268 | 88 | ||
| 4 | 22 | 1 | 241 | 79 |
| 2 | 268 | 74 | ||
| 5 | 27 | 1 | 241 | 65 |
| 2 | 268 | 61 |
| Test | Perimeter of Bounding Box, P (Pixel) | Height of Camera (m) | Estimated Adjacent Distance from Hook, DE (m) | Actual Adjacent Distance from Hook, DA (m) | Percent Error (%) |
|---|---|---|---|---|---|
| 1 | 245 | 6.03 | 2.61 | 2.55 | 2.30 |
| 2 | 122 | 12.84 | 1.81 | 1.80 | 0.55 |
| 3 | 112 | 14.14 | 1.30 | 1.41 | 8.46 |
| 4 | 83 | 19.50 | 10.36 | 8.52 | 11.55 |
| 5 | 62 | 26.75 | 12.31 | 10.83 | 12.02 |
| Criteria | Score | Additional Comment |
|---|---|---|
| Computer vision system | 6 | Helped in tracking the workers; however, choppy video due to low frame rate bring irritating experience and there is still a room for improvement in its accuracy. |
| Multi-ultrasonic sensors system | 6 | Measured distance in all directions was helpful in detecting workers and other obstacles; however, the detectable distance was somewhat too short. |
| Computer vision system + multi-ultrasonic sensors system | 7 | Integrating two techniques together raised the reliability of this collision avoidance system. |
| Overall system | 8 | Wireless architecture eased the installation of devices. Clear GUI made important information obvious and was user-friendly. |
Disclaimer/Publisher’s Note: The statements, opinions and data contained in all publications are solely those of the individual author(s) and contributor(s) and not of MDPI and/or the editor(s). MDPI and/or the editor(s) disclaim responsibility for any injury to people or property resulting from any ideas, methods, instructions or products referred to in the content. |
© 2023 by the authors. Licensee MDPI, Basel, Switzerland. This article is an open access article distributed under the terms and conditions of the Creative Commons Attribution (CC BY) license (https://creativecommons.org/licenses/by/4.0/).
Share and Cite
Yong, Y.P.; Lee, S.J.; Chang, Y.H.; Lee, K.H.; Kwon, S.W.; Cho, C.S.; Chung, S.W. Object Detection and Distance Measurement Algorithm for Collision Avoidance of Precast Concrete Installation during Crane Lifting Process. Buildings 2023, 13, 2551. https://doi.org/10.3390/buildings13102551
Yong YP, Lee SJ, Chang YH, Lee KH, Kwon SW, Cho CS, Chung SW. Object Detection and Distance Measurement Algorithm for Collision Avoidance of Precast Concrete Installation during Crane Lifting Process. Buildings. 2023; 13(10):2551. https://doi.org/10.3390/buildings13102551
Chicago/Turabian StyleYong, Yik Pong, Seo Joon Lee, Young Hee Chang, Kyu Hyup Lee, Soon Wook Kwon, Chung Suk Cho, and Su Wan Chung. 2023. "Object Detection and Distance Measurement Algorithm for Collision Avoidance of Precast Concrete Installation during Crane Lifting Process" Buildings 13, no. 10: 2551. https://doi.org/10.3390/buildings13102551
APA StyleYong, Y. P., Lee, S. J., Chang, Y. H., Lee, K. H., Kwon, S. W., Cho, C. S., & Chung, S. W. (2023). Object Detection and Distance Measurement Algorithm for Collision Avoidance of Precast Concrete Installation during Crane Lifting Process. Buildings, 13(10), 2551. https://doi.org/10.3390/buildings13102551