Abstract
Türkiye is prone to earthquakes due to its location on various tectonic plates, which can lead to a loss of lives and property. Recently, on 6 February 2023, two major earthquakes hit Pazarcık and Elbistan in Türkiye, causing widespread destruction on the East Anatolian Fault (EAF) zone. Even Diyarbakır, a distant province from the epicentre, was severely affected, highlighting the need to evaluate Turkish earthquake codes. As part of this evaluation, a structural analysis was conducted on earthquake-damaged and collapsed buildings in Diyarbakır. The study analysed three buildings with different levels of damage and six collapsed buildings as case studies. The seismic parameters of the earthquakes were compared to the values in the two recent earthquake hazard maps used in Türkiye’s codes, as well as the Eurocode 8 damage limit values obtained from pushover analysis. The results revealed significant differences between the current seismic values of earthquakes and the current peak ground acceleration (PGA) values specified in the Turkish Earthquake Design Regulations. Additionally, the selected buildings showed inadequate structural behaviours, with significant differences between the expected and actual seismic performances with respect to the PGA values as one of the most important earthquake characteristics.
1. Introduction
Situated at the convergence of multiple active tectonic plates and traversing the Alpine-Himalayan seismic belt, Türkiye has been a witness to a series of devastating earthquakes throughout both its historical and instrumental periods. The intricate interplay of tectonic forces from the Arabian and African plates has exacerbated the region’s vulnerability, resulting in substantial human and infrastructural losses. Of paramount significance are Türkiye’s pivotal fault systems—the North Anatolian Fault (NAF) and the East Anatolian Fault (EAF) zones—each bearing the latent potential to unleash highly catastrophic seismic events. This seismic potential has, over time, inflicted profound human casualties and extensive material devastation. The chronicles of past local earthquakes serve as invaluable records, lending predictive insights for potential seismic occurrences and guiding the formulation of seismic design codes. Marking a pivotal juncture, 6 February 2023 etched a distressing chapter in Türkiye’s seismic narrative, bearing witness to two monumental earthquakes that etched their names as indelible signatures within the recent annals of seismic chronicles. Among these impactful events, the Pazarcık Earthquake of 6 February 2023, and its synchronous counterpart, the Elbistan earthquake, take centre stage.
Türkiye has developed and utilised earthquake hazard maps to estimate the potential risk and to inform seismic design codes. The last two earthquake hazard maps, both the previous and current versions, are compared in terms of their seismic parameters. These comparisons reveal differences in the peak ground acceleration values and expected target structural displacement values [1]. The investigation of the effects of earthquakes on engineering structures in earthquake-prone parts of the Earth is a unique tool for determining the effects of the next ground motion [2]. In this case, much research in this area [3,4,5,6,7,8,9,10,11,12,13,14,15] has investigated the damage assessment and sustainability of RC buildings by using fragility curves and proposed a new model to evaluate damages for structures. On the other hand, the seismic response of buildings is also an important topic for earthquake engineering. Determination of the seismic response of structures has been an important issue not only for reinforced concrete structures but also for steel structures. There are many innovative and novel studies in this field [16,17]. Faizah and Amaliah [18] investigated the seismic situations in thirty-four cities in Indonesia by comparing the values of the spectral response parameters (SDS and SD1) according to the 2012 and 2019 Indonesian earthquake codes. Avcil et al. [19] have made comparisons of the target displacements in different seismic zones under the effects of different soil conditions in their work. Wei et al. [20] have proposed an evaluation method for the seismic damage of bridges. They used the maximum and residual drifts as engineering demand parameters (EDPs). In the study by Khanmohammadi et al. [21], the dynamic properties of forty-six reinforced concrete and steel buildings affected by the Sarpol-e Zahab earthquake (Mw 7.3) were determined by ambient vibration tests. Ghasemi et al. [22] investigated the seismic performance of RC systems with cable bracings. The findings of the work indicated that the PGA capacity of the RC building increases as the number of braces rises. Zhou et al. [23] investigated the seismic performance and collapse mechanism of a five-storey reinforced concrete structure along the ground fissure using the pushover analysis method. Mazza [24] has proposed a displacement-damage based design procedure with a computer-aided tool called DAMPERS (Damage Protection of Earthquake Resistant Structures). Harirchian et al. [25] aimed to bridge the gap between rapid visual screening (RVS) and multi-criteria decision-making (MCDM) methods by using the codes from India, Türkiye and the Federal Emergency Management Agency (FEMA) in their study. Eroglu et al. [26] measured the sensitivity of seismic hazard assessments using different declustering techniques. Accordingly, the recently compiled earthquake catalogue of Türkiye was declustered using three declustering algorithms in their study.
This article delves into the analysis of these earthquakes and their effects on the province of Diyarbakır located in south-eastern Türkiye. It compares seismic parameters with recent earthquake hazard maps and evaluates the effectiveness of earthquake codes. Structural analysis of earthquake-damaged buildings reveals the differences between the expected and actual seismic performances. At its core, this case study seeks to analyse the seismic parameters of the Pazarcık and Elbistan earthquakes involving a comparative assessment between these seismic parameters and the data presented in the two recent earthquake hazard maps utilized within the Turkish context. Furthermore, the comparison extends to encompass the Eurocode 8 damage limit values, derived from pushover analysis conducted on a typical reinforced concrete building.
In light of the disparities observed between the seismic characteristics of the earthquakes and the PGA values stipulated in the Turkish Earthquake Design Regulations, a vital evaluation of the efficacy of the existing Turkish earthquake codes is undertaken. Three buildings exhibiting slight, moderate and extensive damages were selected, along with six buildings that collapsed. The seismic parameters are analysed in accordance with both the 2018 and 2007 seismic codes of Türkiye, enabling a comparison to highlight potential advancements or deficiencies in the seismic design criteria.
In this study, the geographical location and seismic parameters of the structures damaged in Diyarbakır province in the Pazarcık and Elbistan earthquakes were determined for the first time, along with an attempt to reveal the effect of structural analysis by comparing the Eurocode and Turkish regulations in terms of limit values. The aim of the study is to compare the measured and predicted PGA values and the target displacements to be obtained based on them. In this way, the effects of the earthquakes on Diyarbakır and whether these effects on the structural analysis are adequately represented will be revealed.
2. Materials and Methods
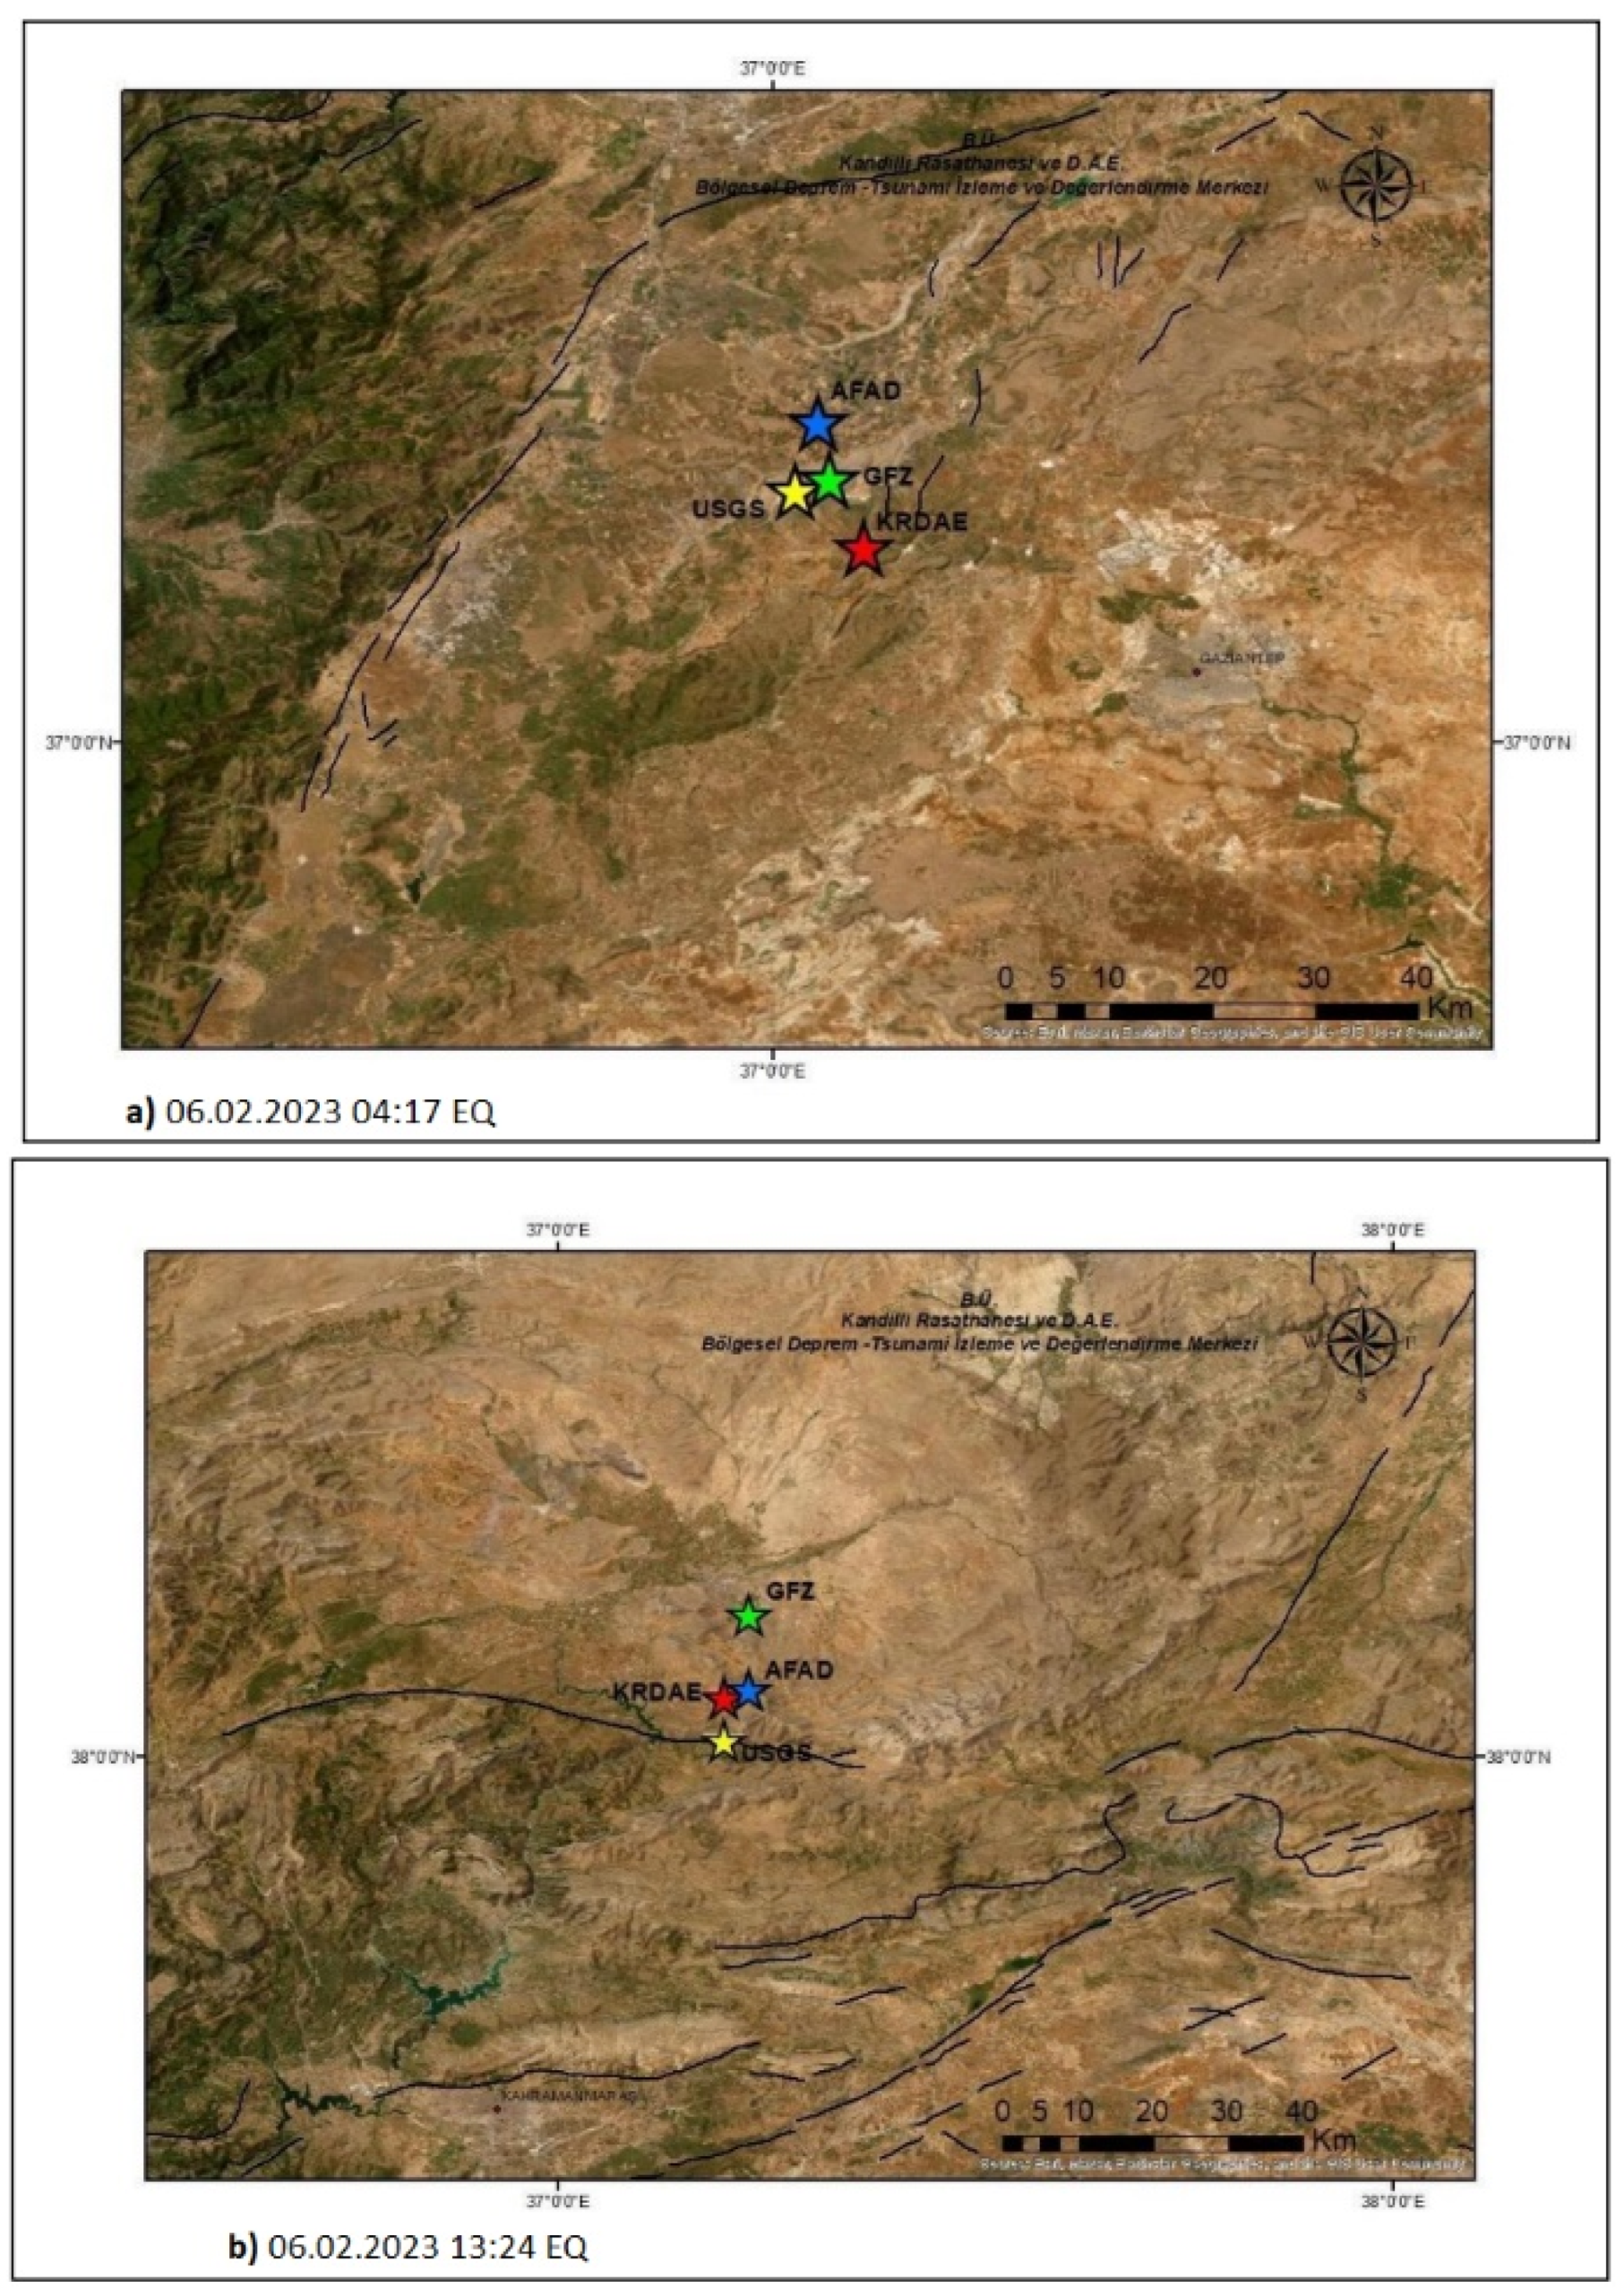
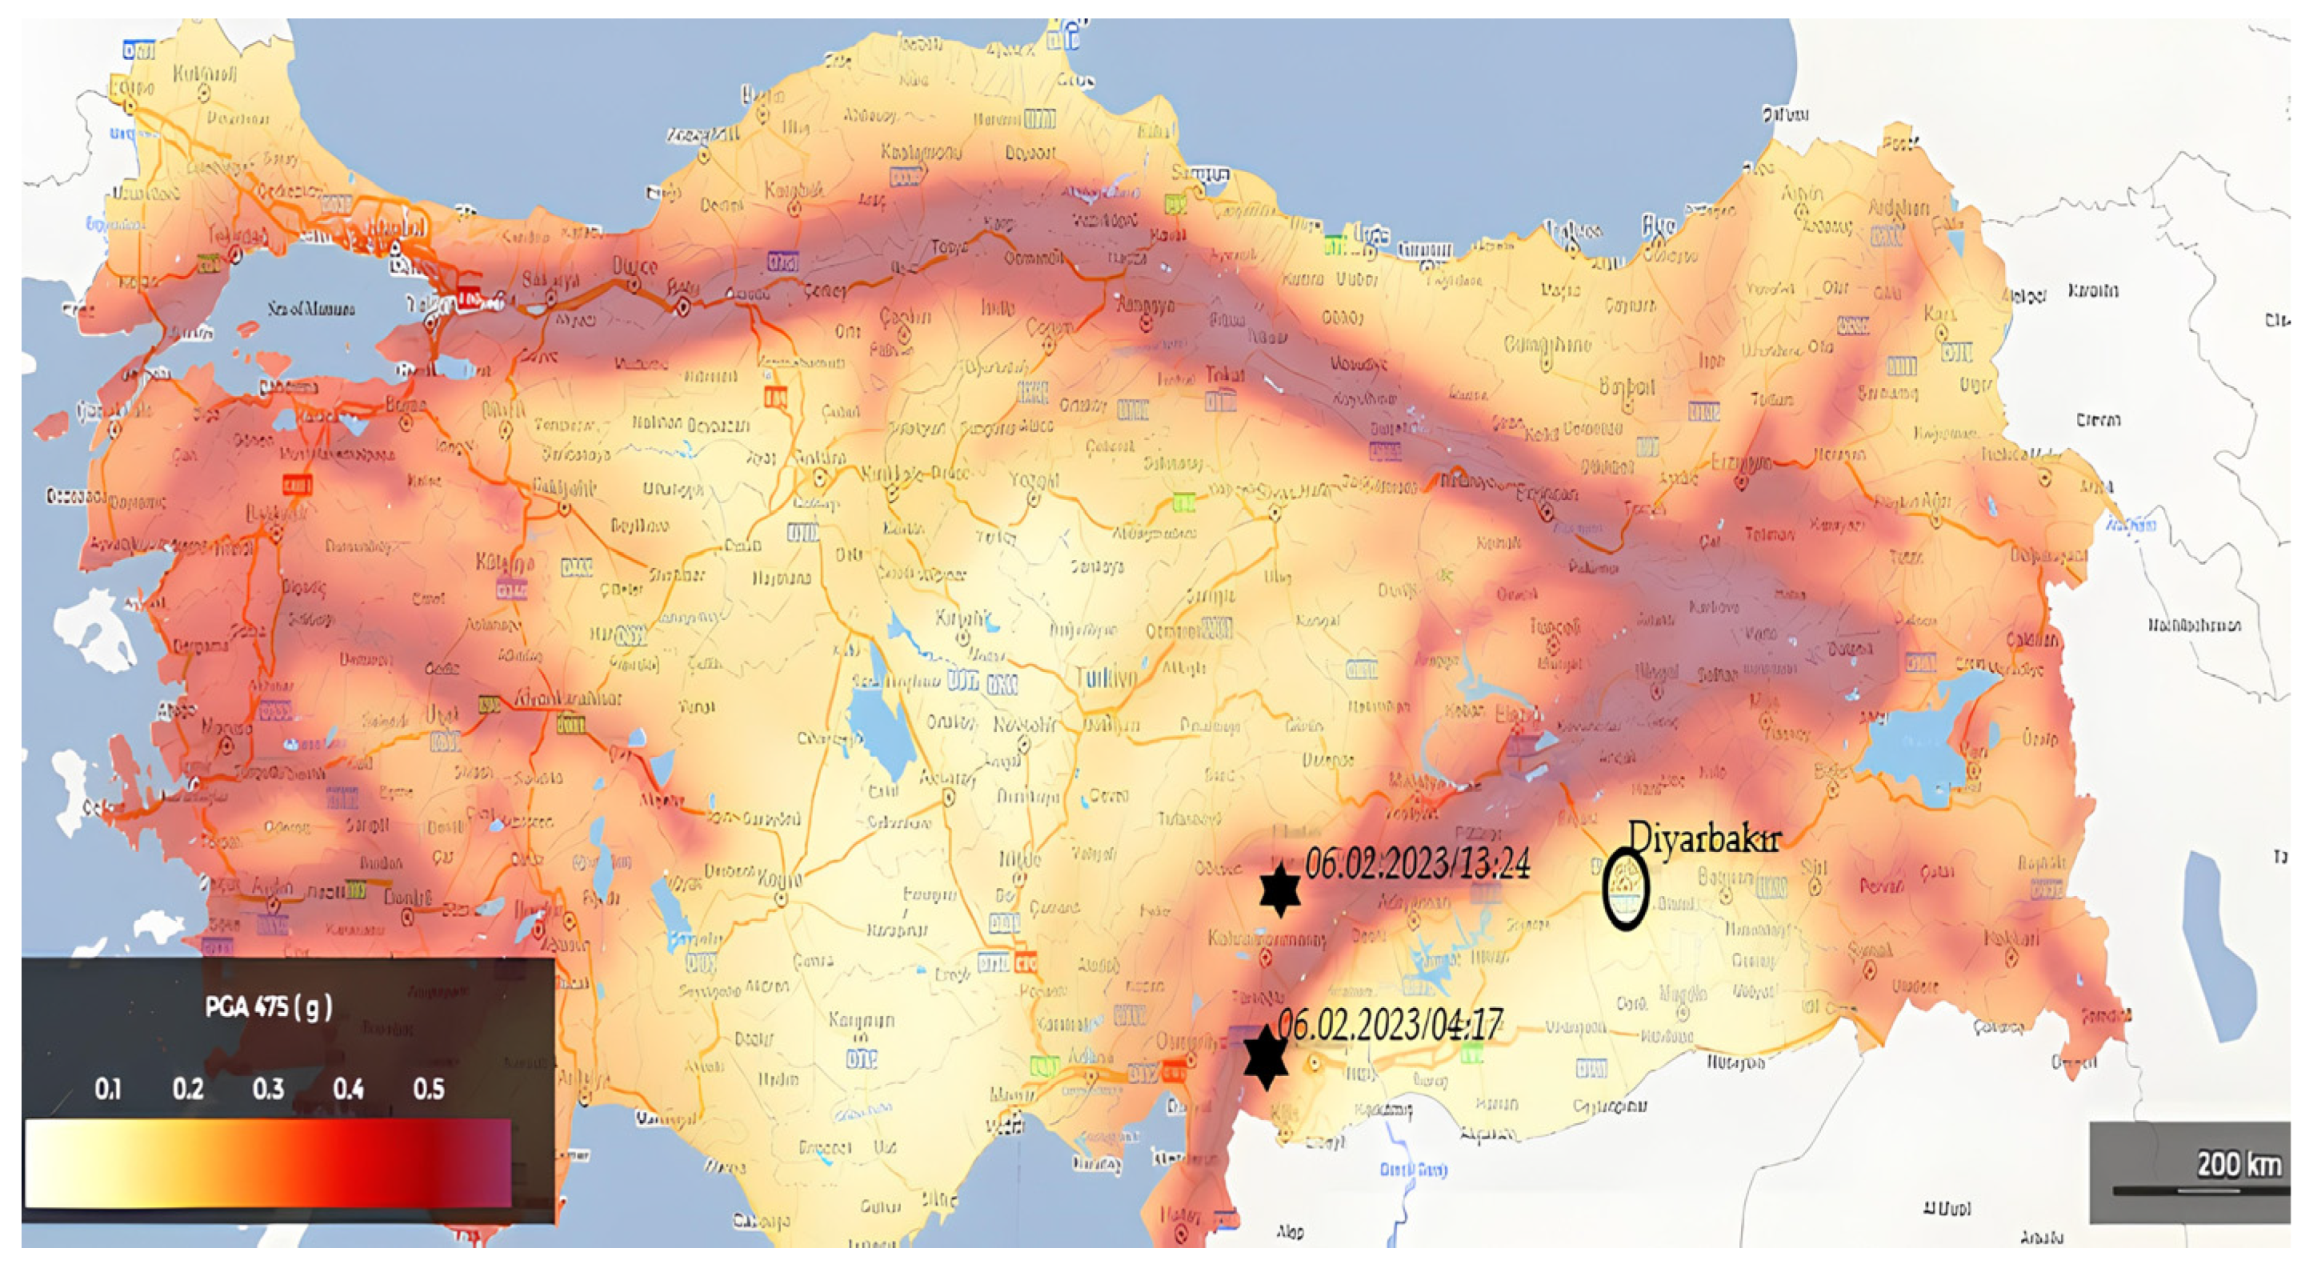
The location data of the earthquakes with respect to the Bogazici University Kandilli Observatory and Earthquake Monitoring Center (KOERI) [27], Geofon Data Center (GFZ) [28], Disaster and Emergency Management Presidency, Republic of Türkiye (AFAD) [29] and United States Geological Survey (USGS) [30] are shown in Figure 1. On the other hand, the current earthquake hazard map of Türkiye and the location of Diyarbakır province’s Türkiye Earthquake Hazard Maps Interactive Web Application (TEHMIWA) [29] is given in Figure 2.

Figure 1.
The location data of the earthquakes: (a) Pazarcık; (b) Elbistan.

Figure 2.
Location data of 6 February 2023 earthquakes on TEHMIWA [29].
The focal depths of the earthquakes were estimated between 5 to 10 km by the seismological centres and classified as shallow-focused earthquakes. The location and magnitude data of these two earthquakes according to the centres are provided in Table 1.

Table 1.
Location and magnitude data of the earthquakes that occurred on 6 February 2023 given by different seismological centres.
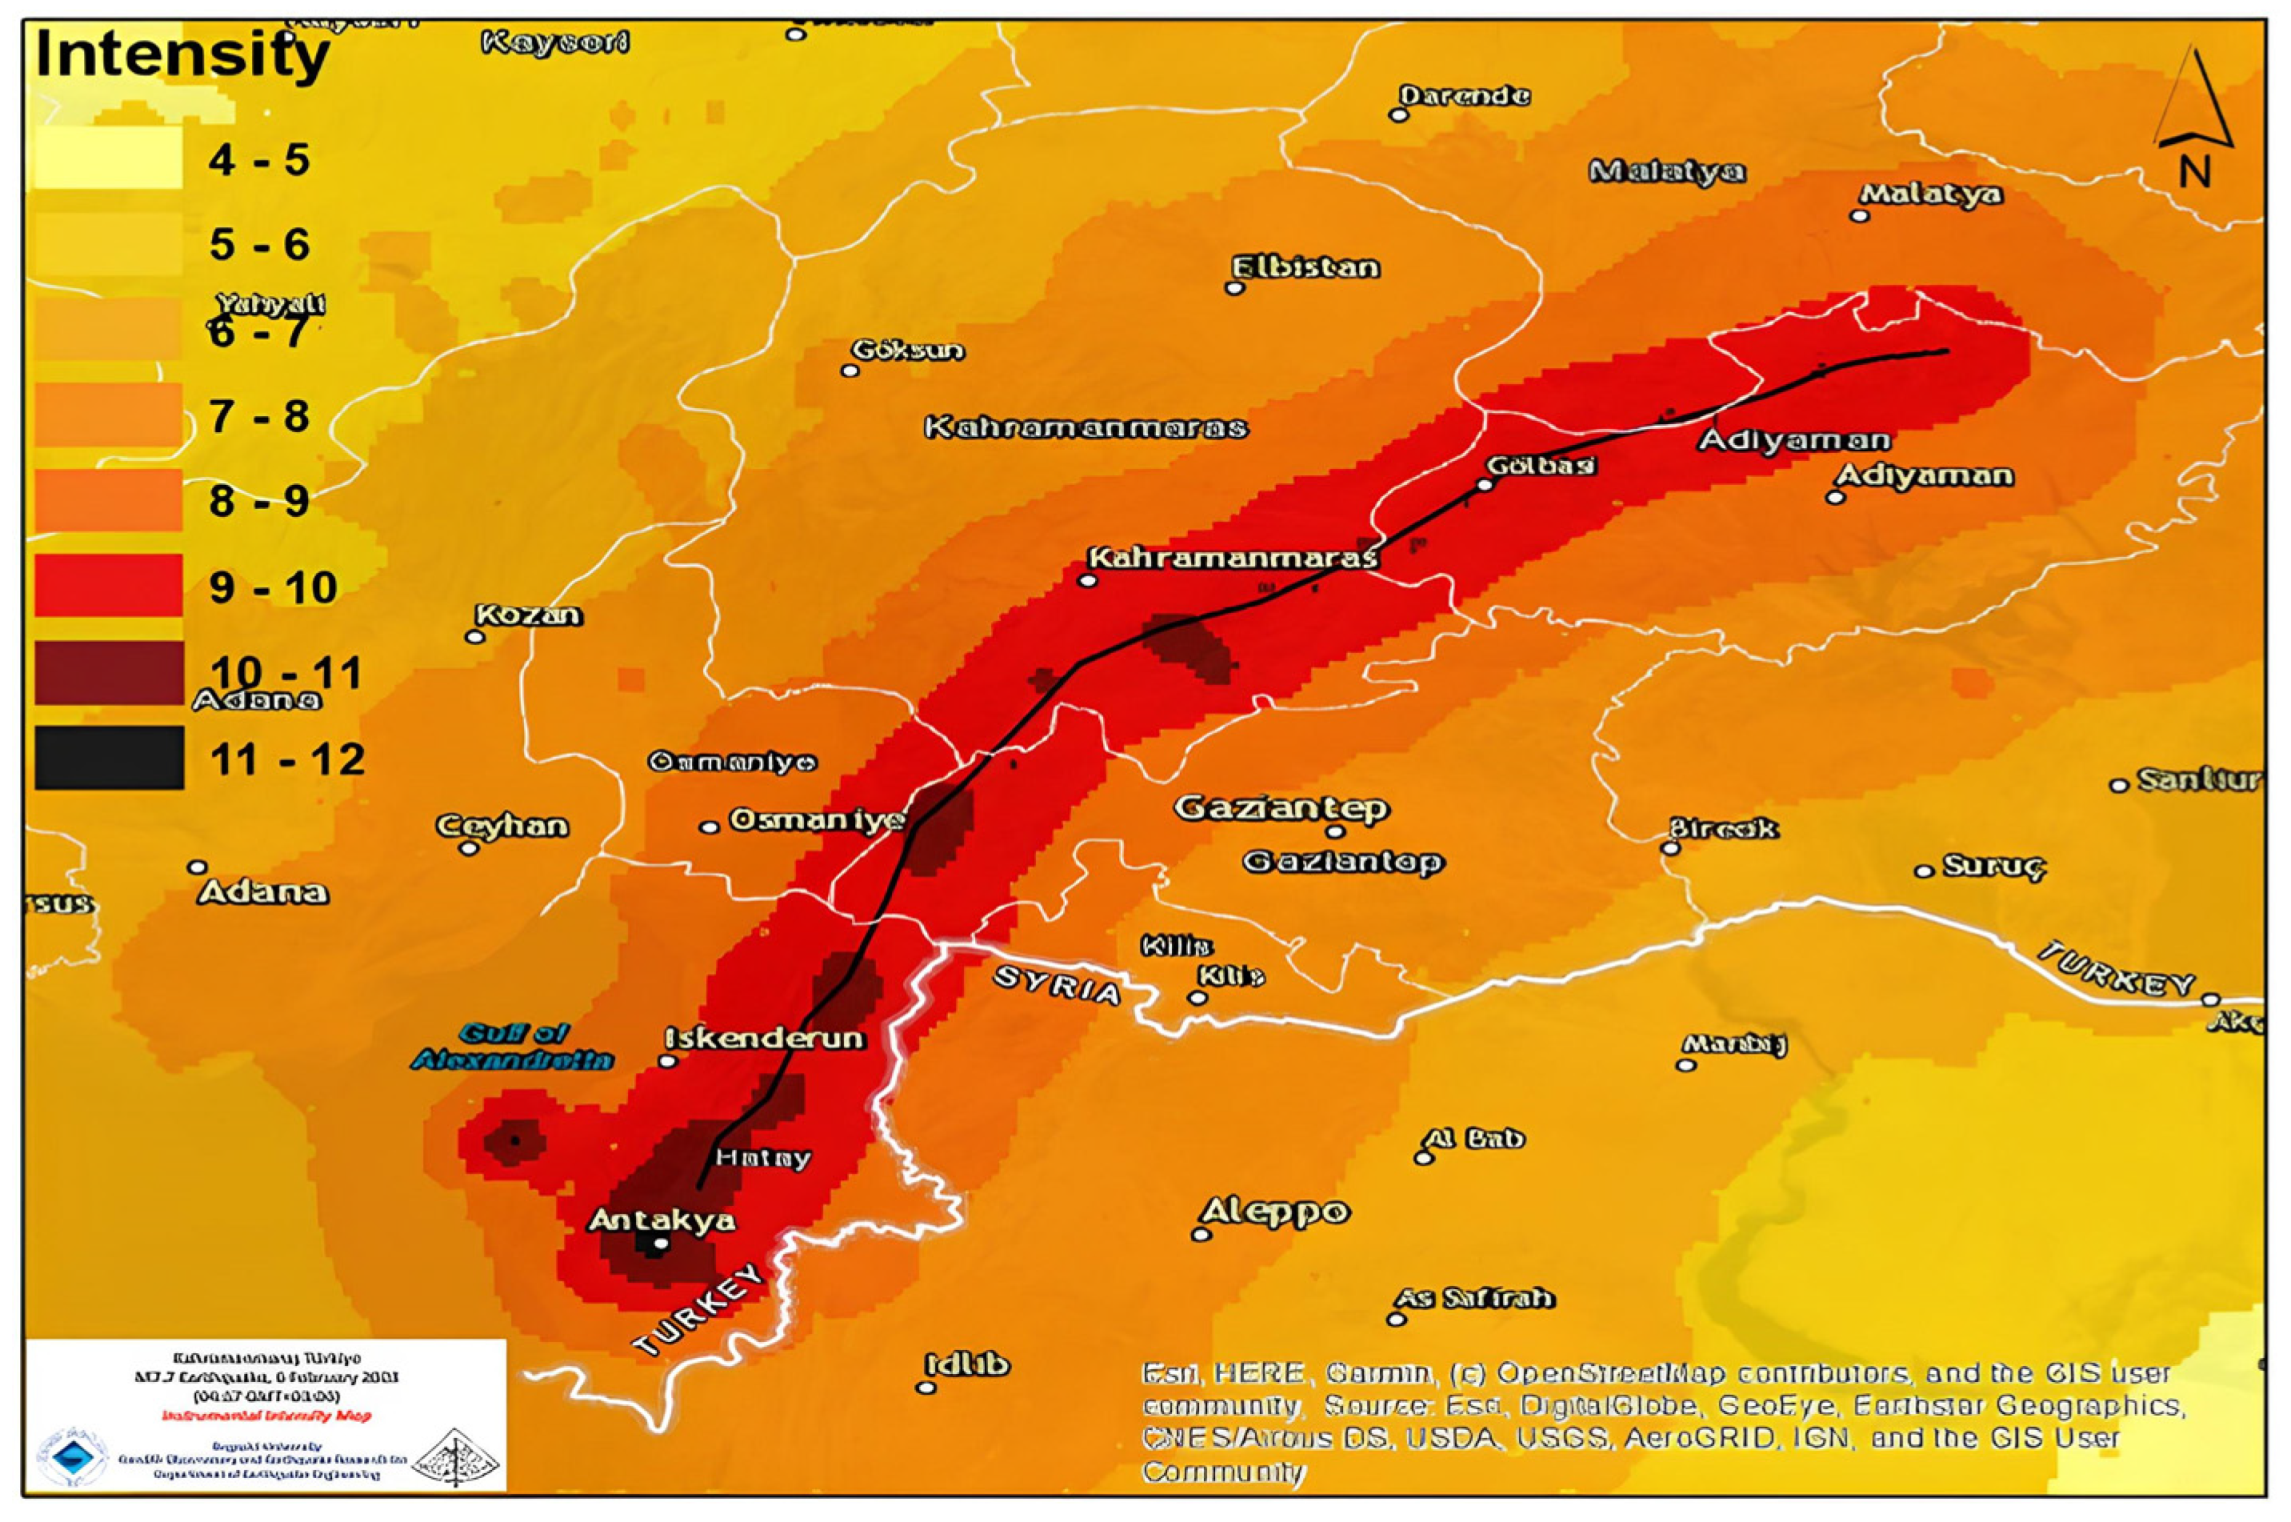
The seismic intensity map projection of the 6 February 2023 04:17 Kahramanmaraş Earthquake is shown in Figure 3. The maximum intensity of 11–12 around the striking rupture fault(s) can be observed. It is noted that for Diyarbakir province, far away from the epicentre, it was about 6–7.

Figure 3.
6 February 2023 04:17 earthquake intensity map [31].
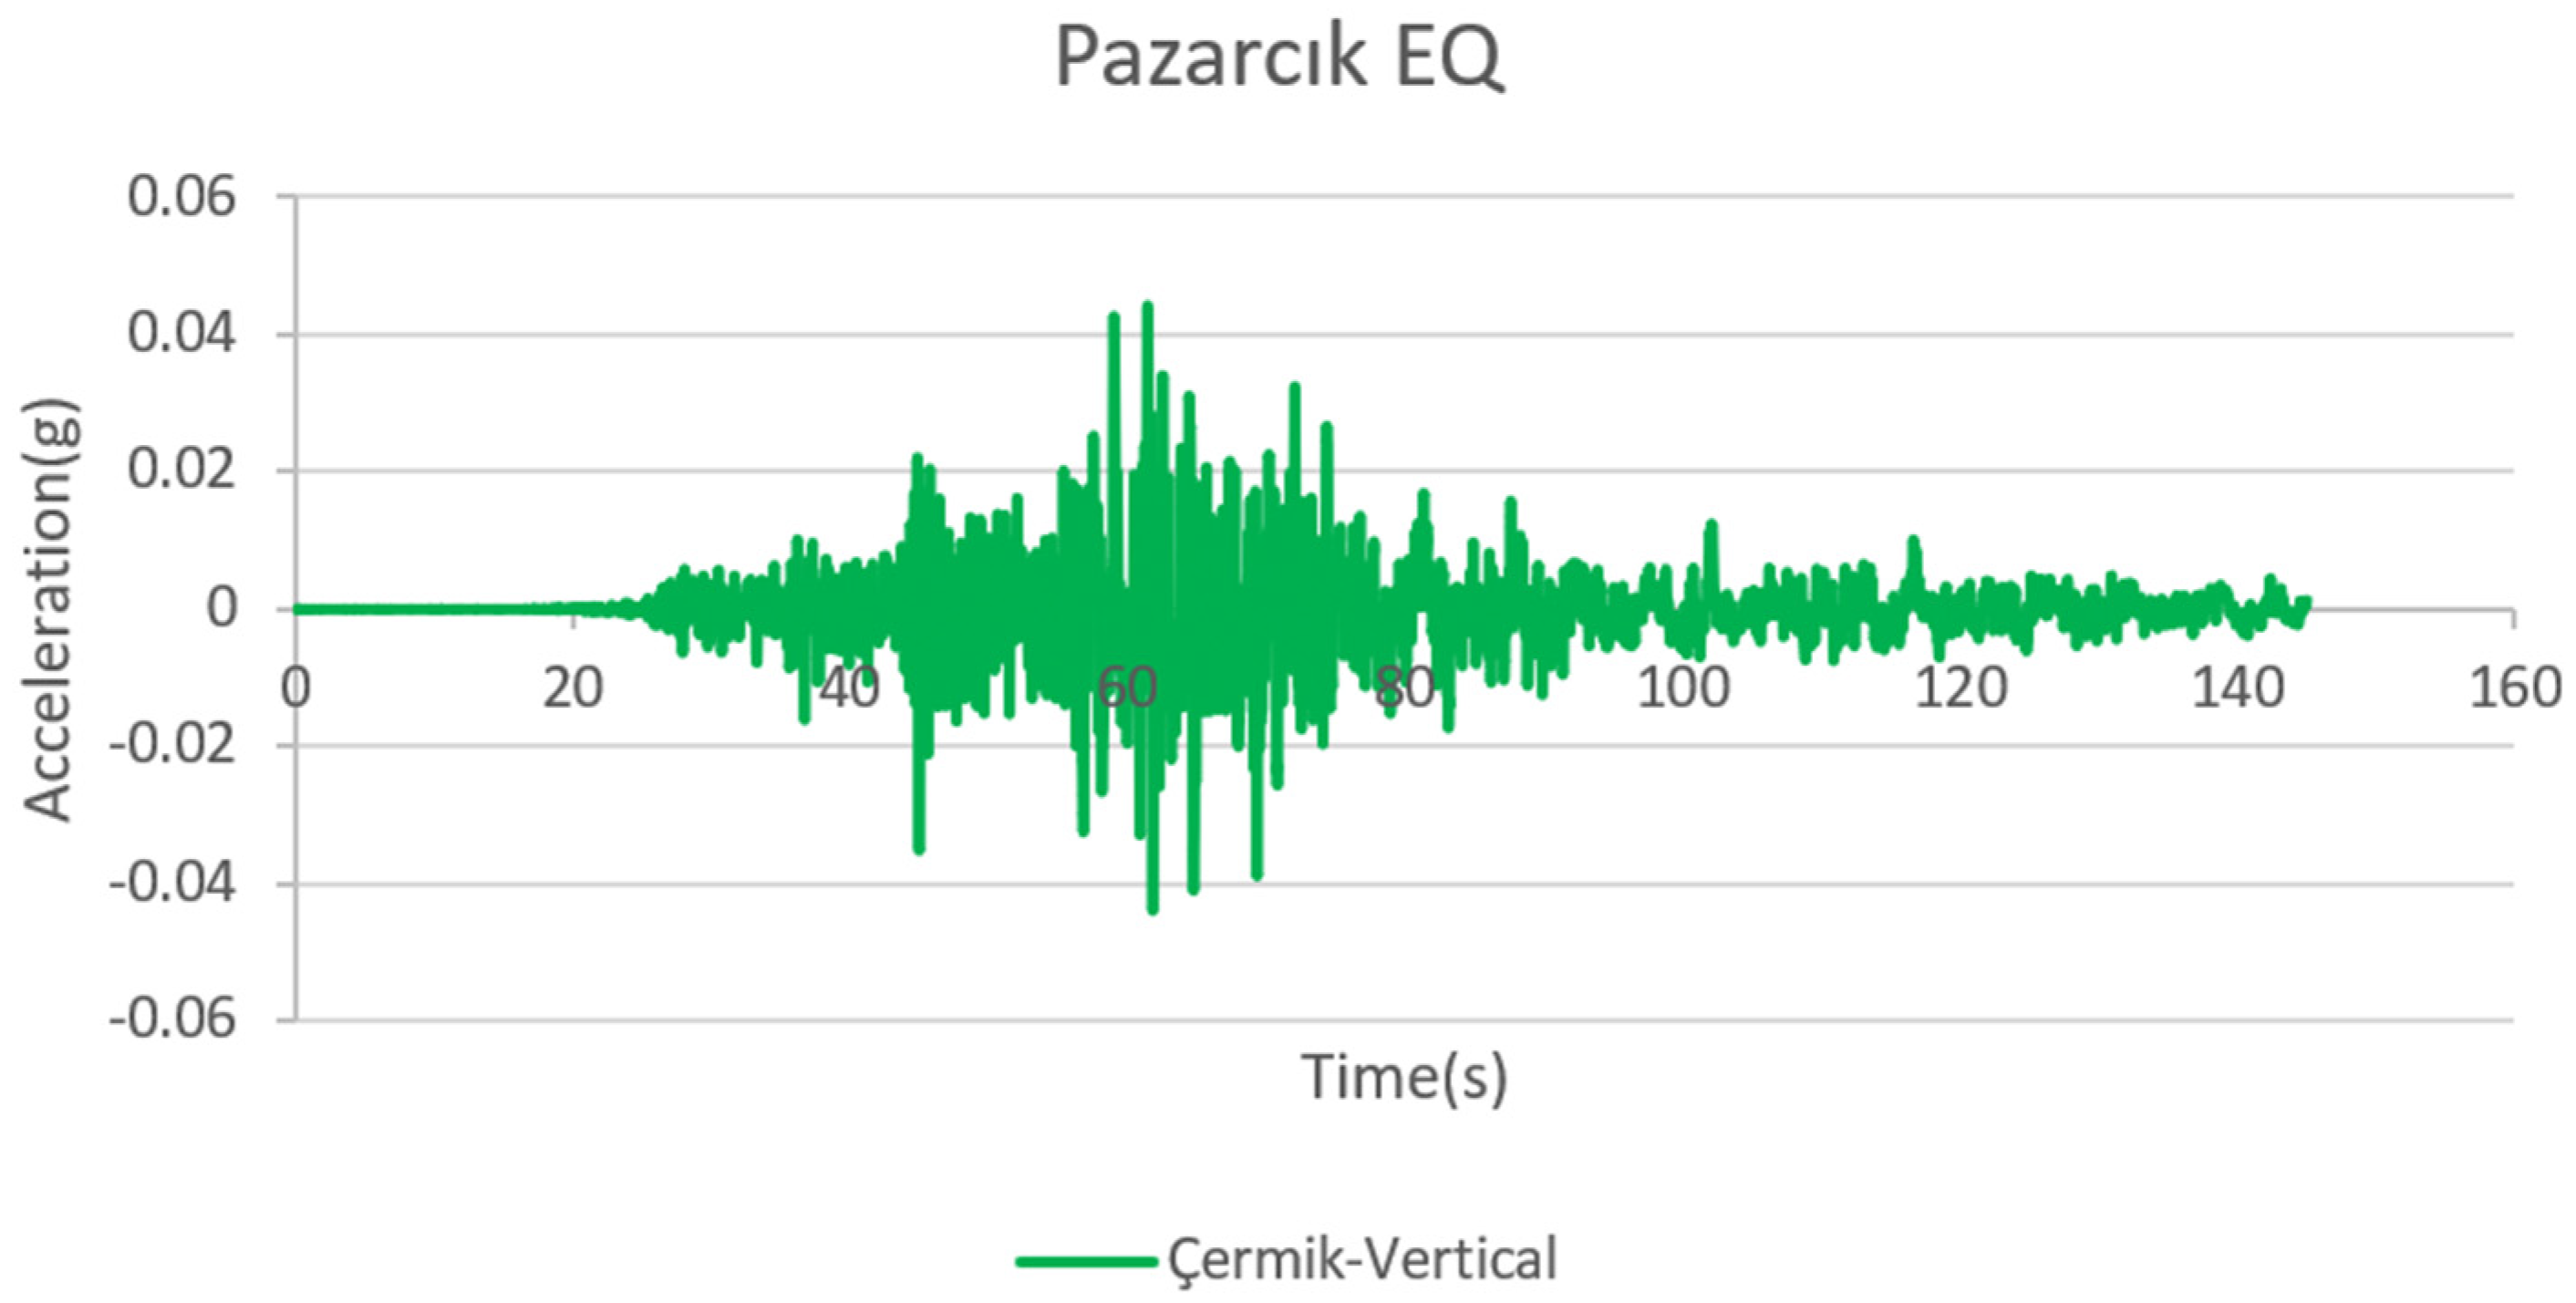
At the Çermik station (coded 2107), which is 234.922 km (Rjb = 92.53) away from the epicentre of the Pazarcık earthquake and the closest station to Diyarbakır, the minimum acceleration of about 0.04 g was recorded in the vertical direction, while the maximum acceleration of 0.11 g was measured in the east–west direction. According to the AFAD data, the peak ground acceleration value during the Pazarcık earthquake was 2.017 g in the east–west direction at the Pazarcık station (coded 4614 (NAR) Rjb = 1.02). Since the maximum intensities are in the E–W direction, the PGV, Arias and Houser intensities are only given in the E–W direction.
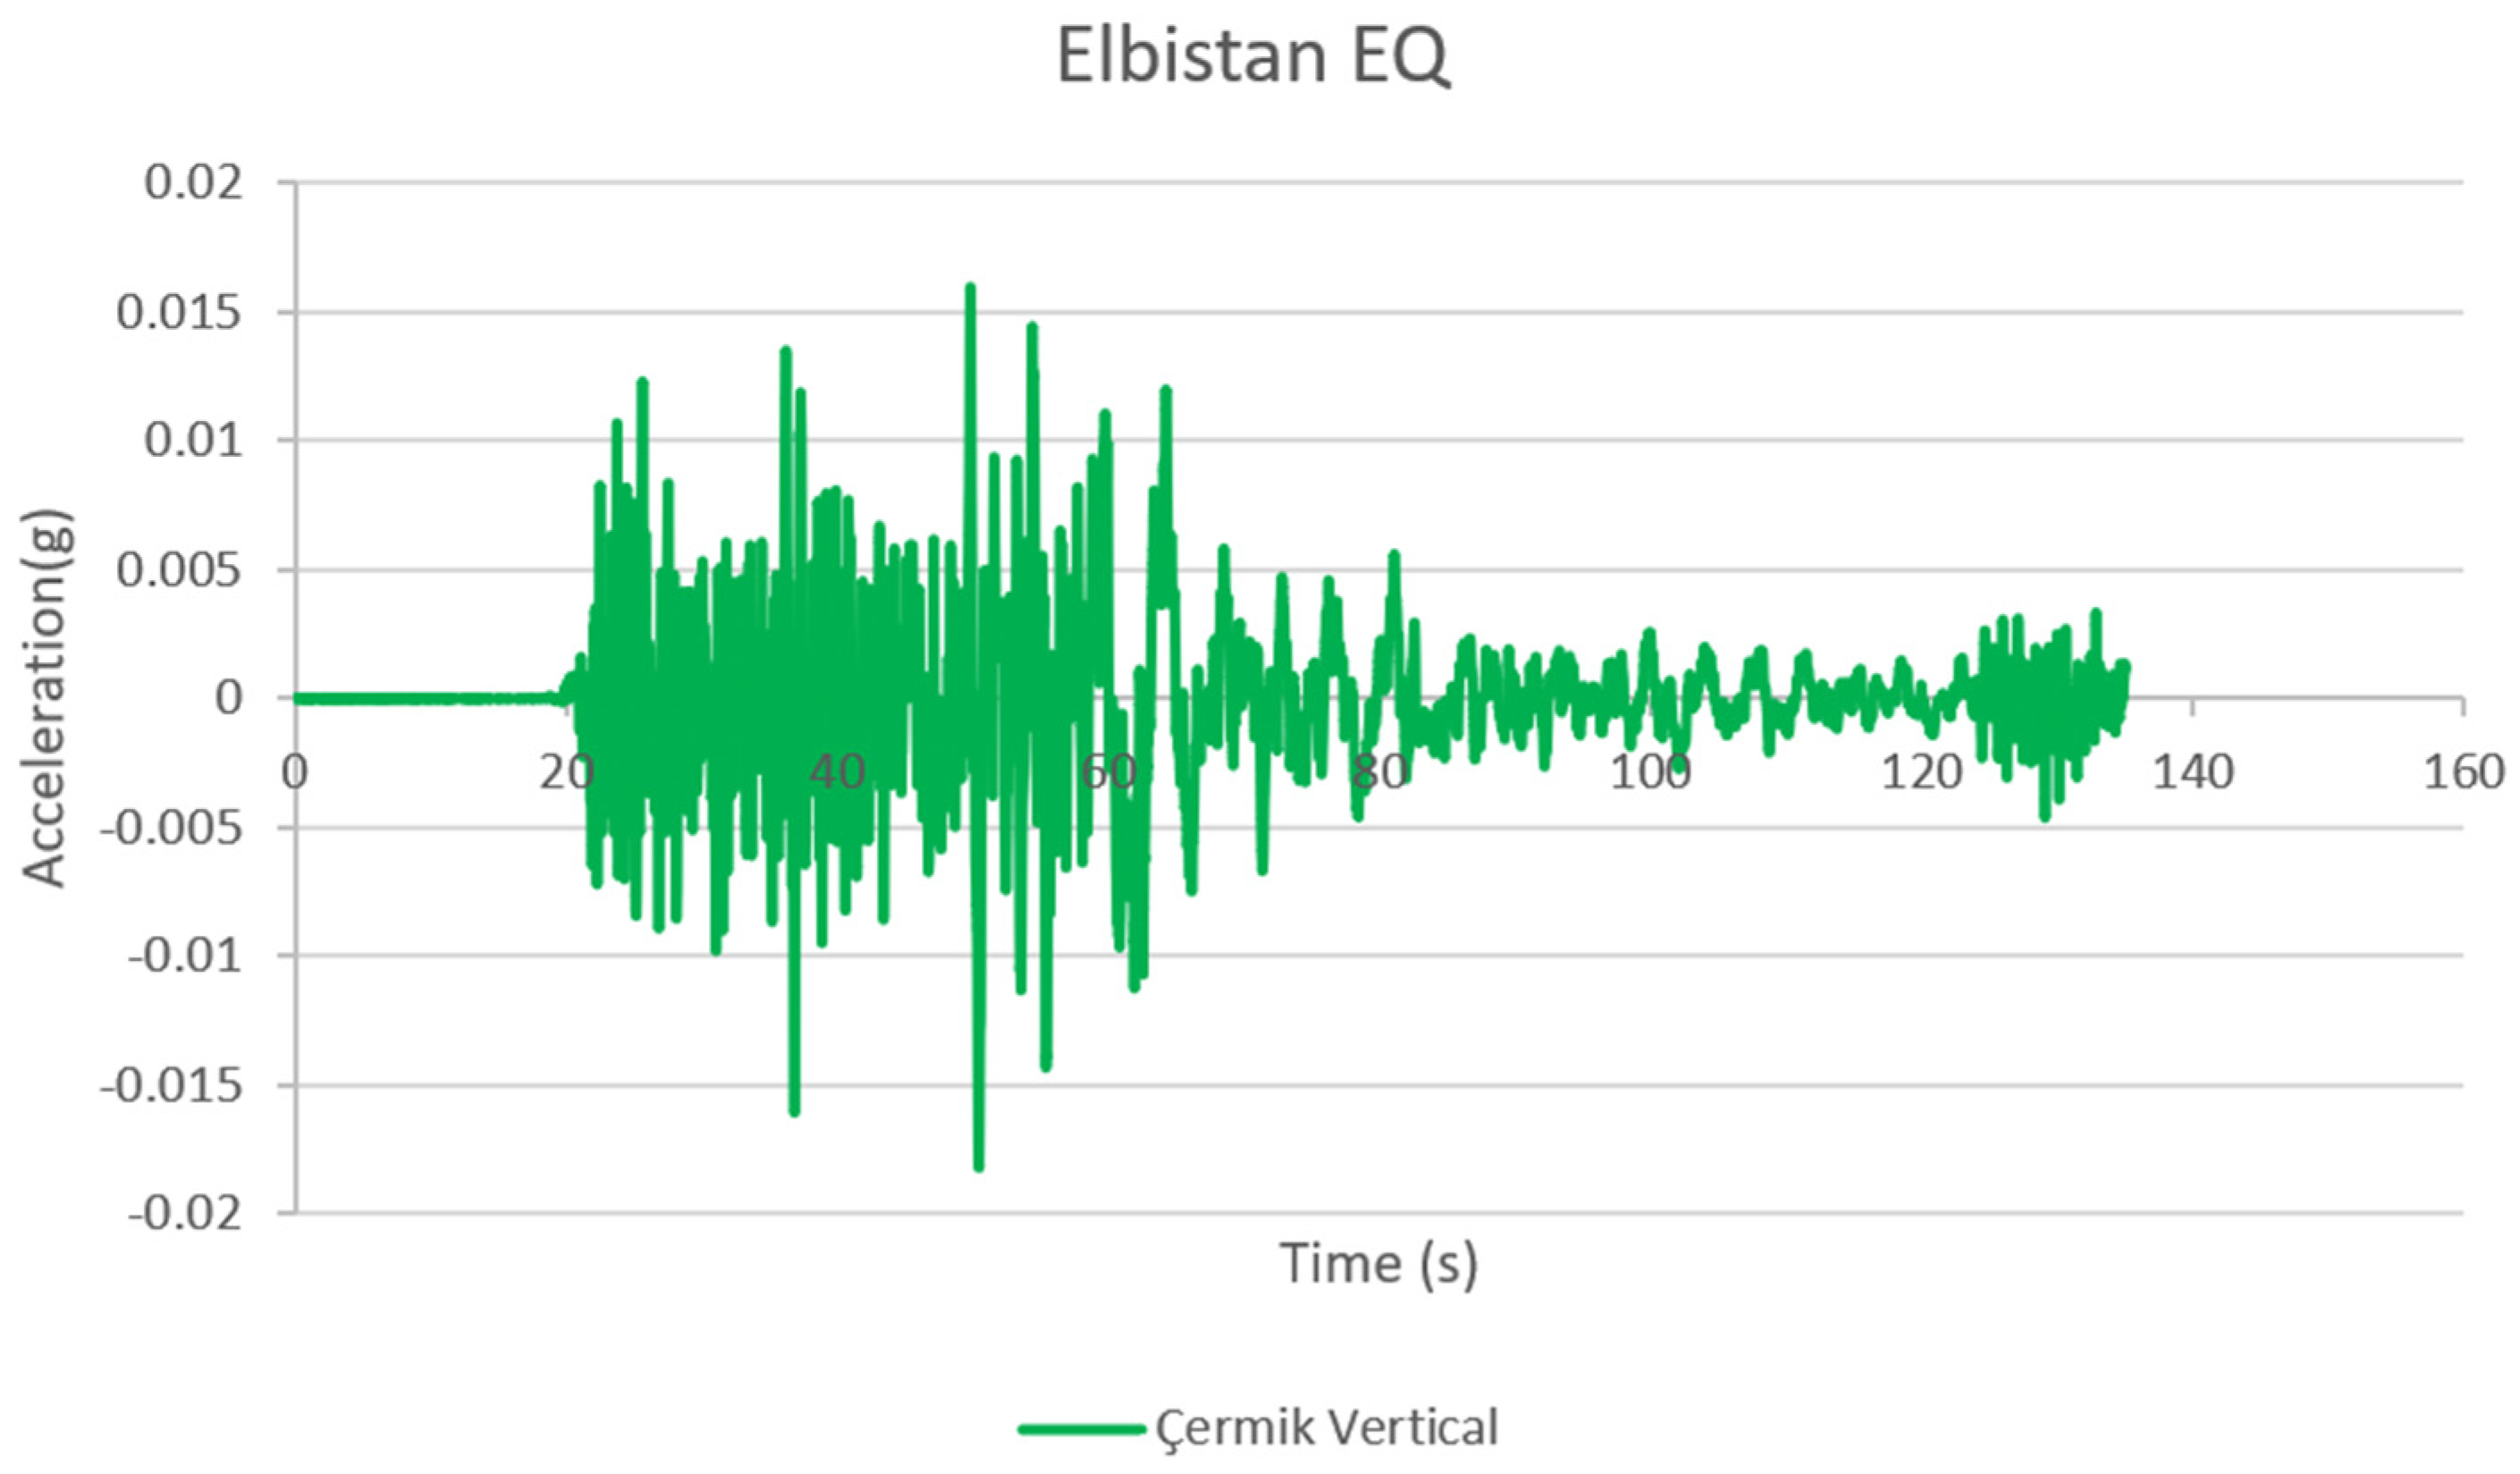
During the Elbistan earthquake, the Göksun station (coded 4612 (Repi = 66.68)) recorded the highest acceleration value of 0.63 g in the north–south direction. Meanwhile, the Çermik station (Repi = 198.48) in Diyarbakır recorded the highest value of 0.047 g in the east–west direction. These values are given in Table 2 and Table 3 for both earthquakes. Figure 4 and Figure 5 show the accelerations and spectra obtained with the data of station 2107 in Diyarbakır province for both the Pazarcık and Elbistan earthquakes. Since the maximum intensities are in the N–S direction, the PGV, Arias and Houser intensities are only given in the N–S direction.
Table 2.
Pazarcık EQ records.
Table 3.
Elbistan EQ records.
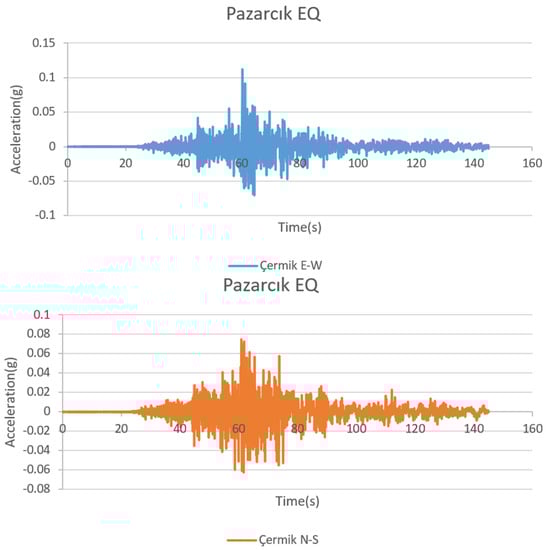

Figure 4.
Acceleration records at the station 2107 in Diyarbakır province (Pazarcık EQ).
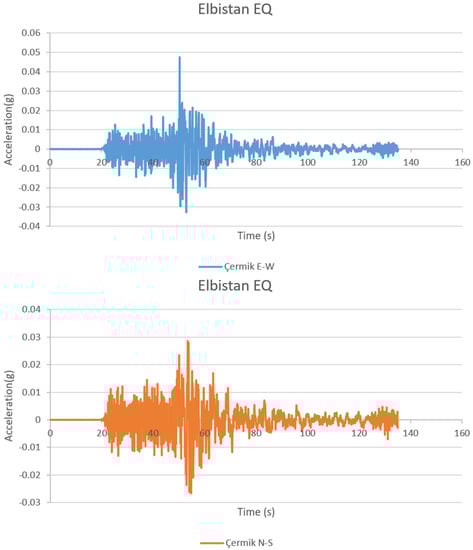
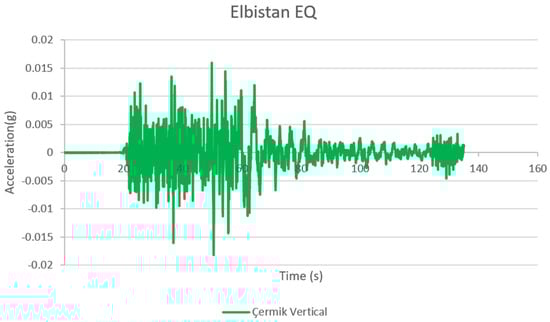
Figure 5.
Acceleration records at the station 2107 in Diyarbakır province (Elbistan EQ).
It is noted that, based on the earthquake intensities and acceleration records taken into consideration for Diyarbakir province, there may be some moderate damage resulting from the relatively long duration of the earthquake. Past earthquakes have demonstrated that numerous factors, including earthquake duration, near-fault and far-fault effects [32] and soil–structure interaction, can significantly impact earthquake damage. However, in the specific case of Diyarbakır, the distance from the earthquake’s epicentre and the relatively lower values of the measured earthquake parameters (such as Arias and Houser intensities and PGA and PGV values) than the obtained values from the EQ epicentre indicate the severity of the structural damage observed. However, because of substandard dwelling construction aspects, the structural damage and loss of lives resulting from these earthquakes extended to unacceptable levels.
2.1. Investigation of the Collapsed Buildings in Diyarbakır
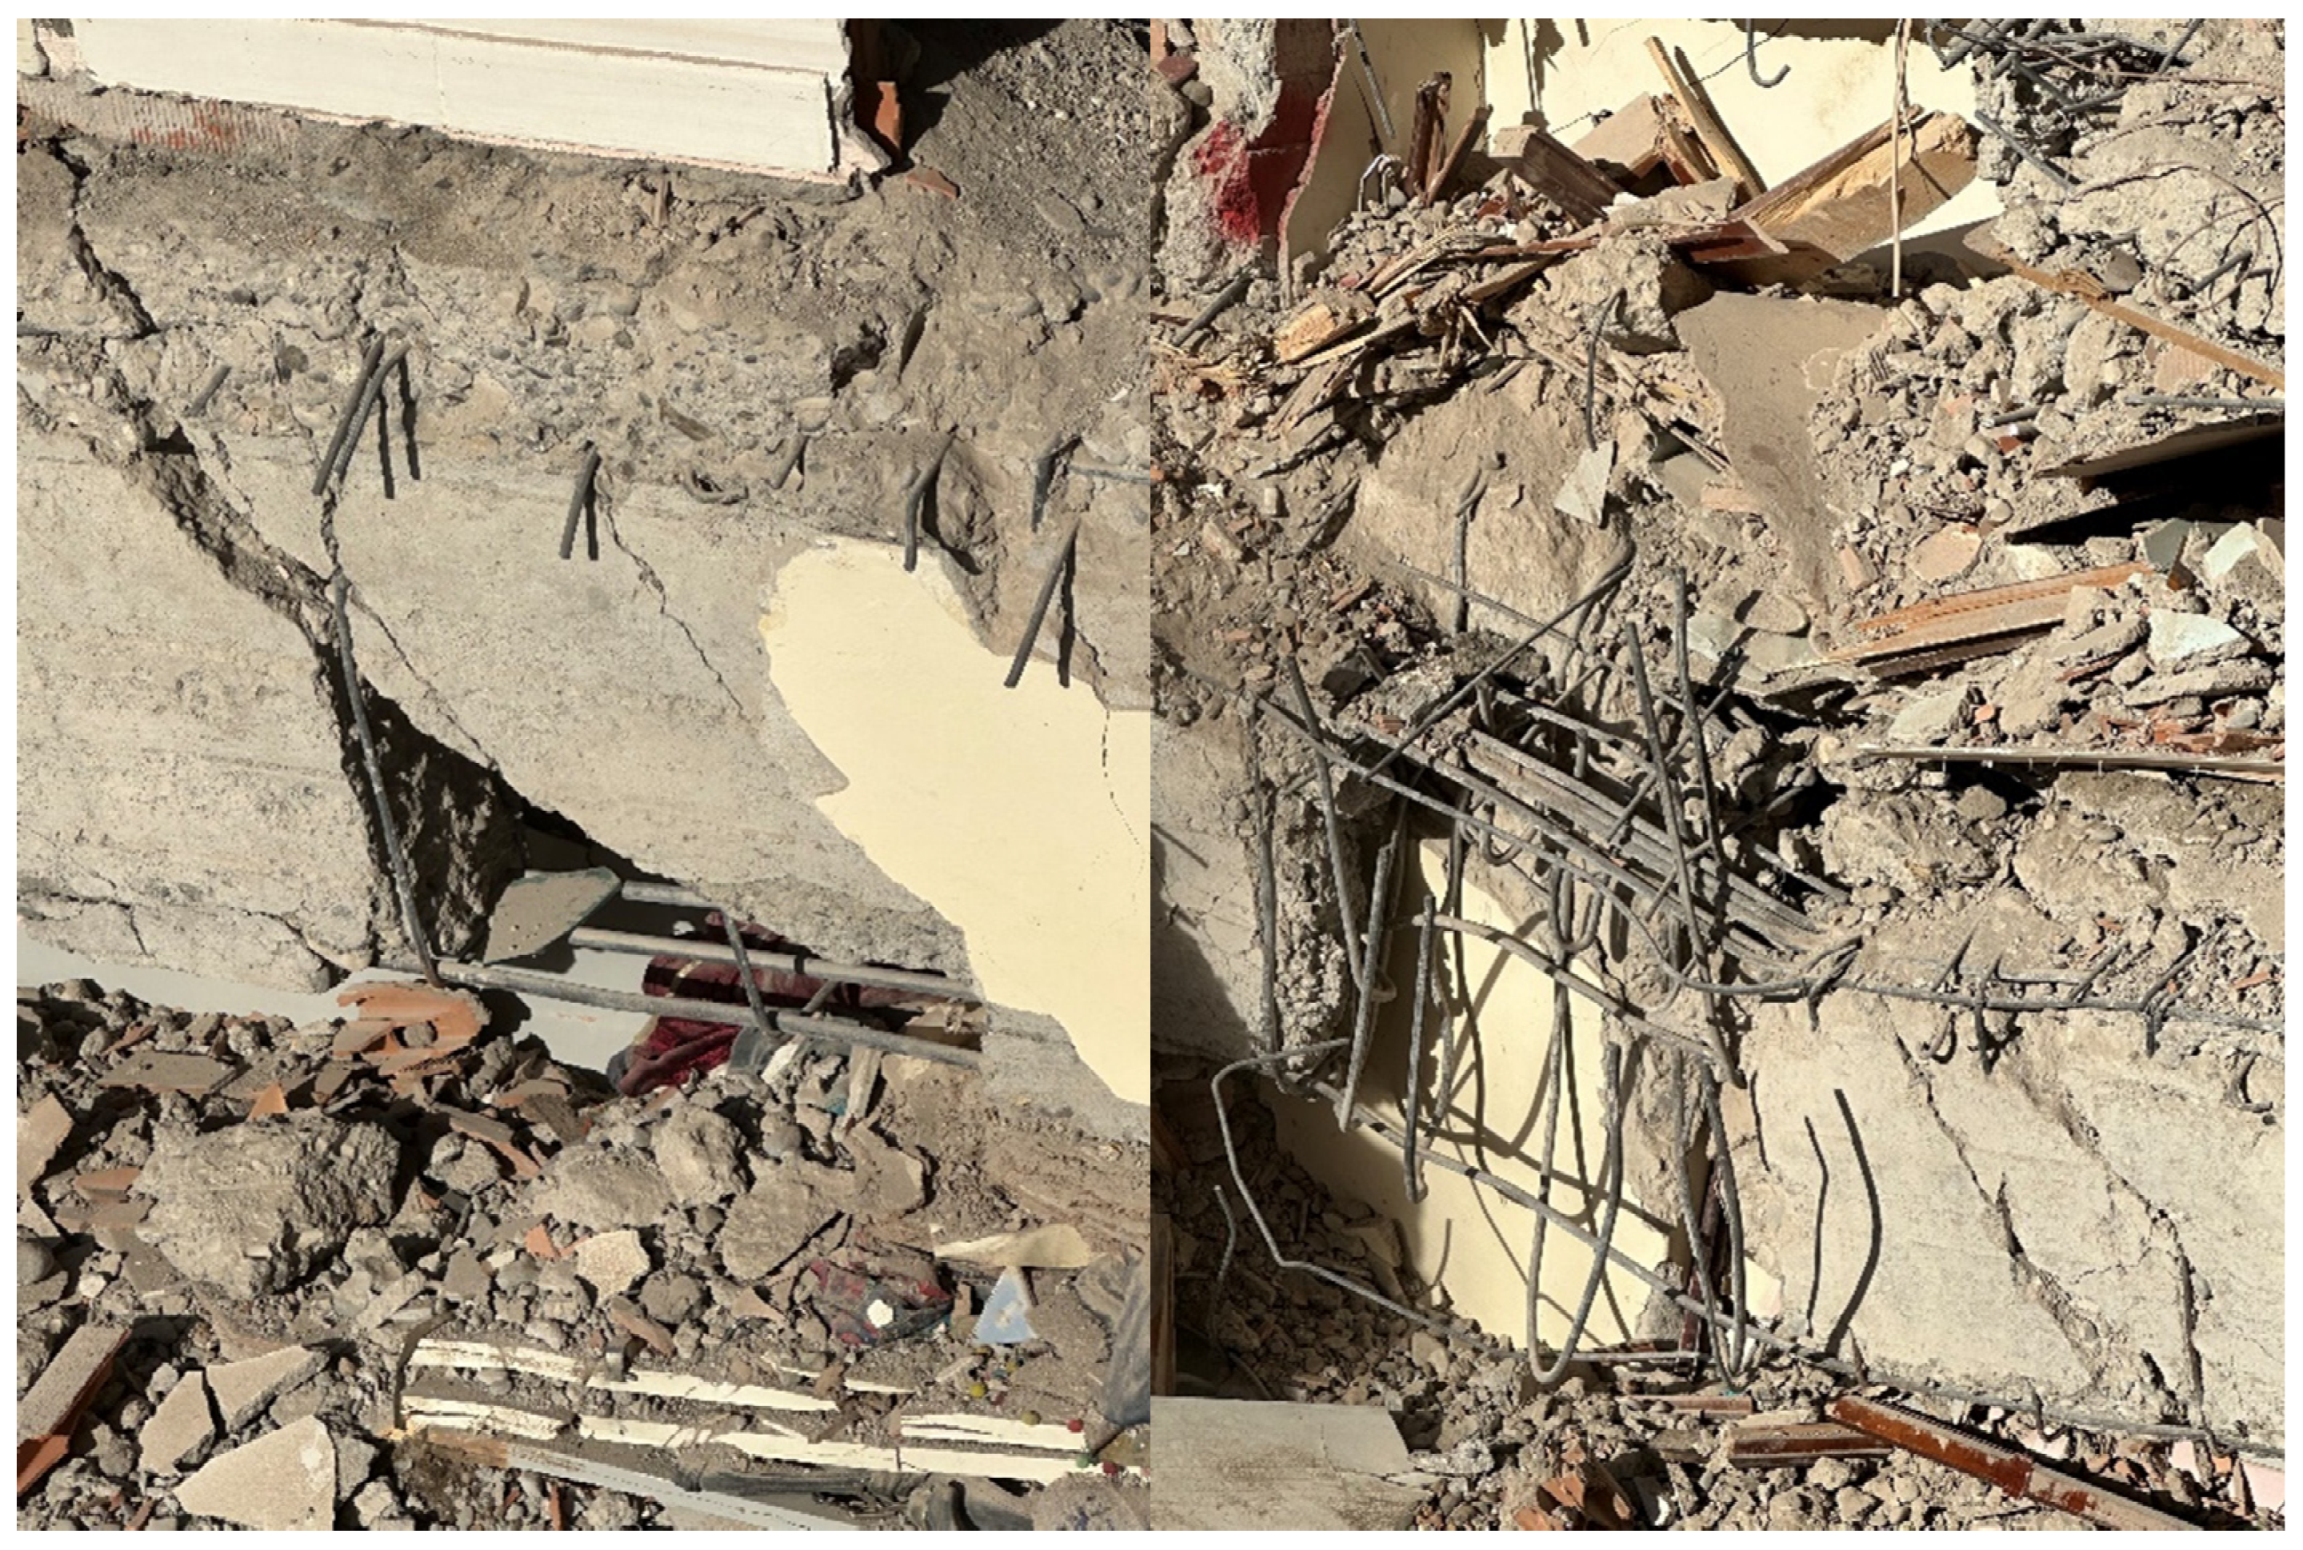
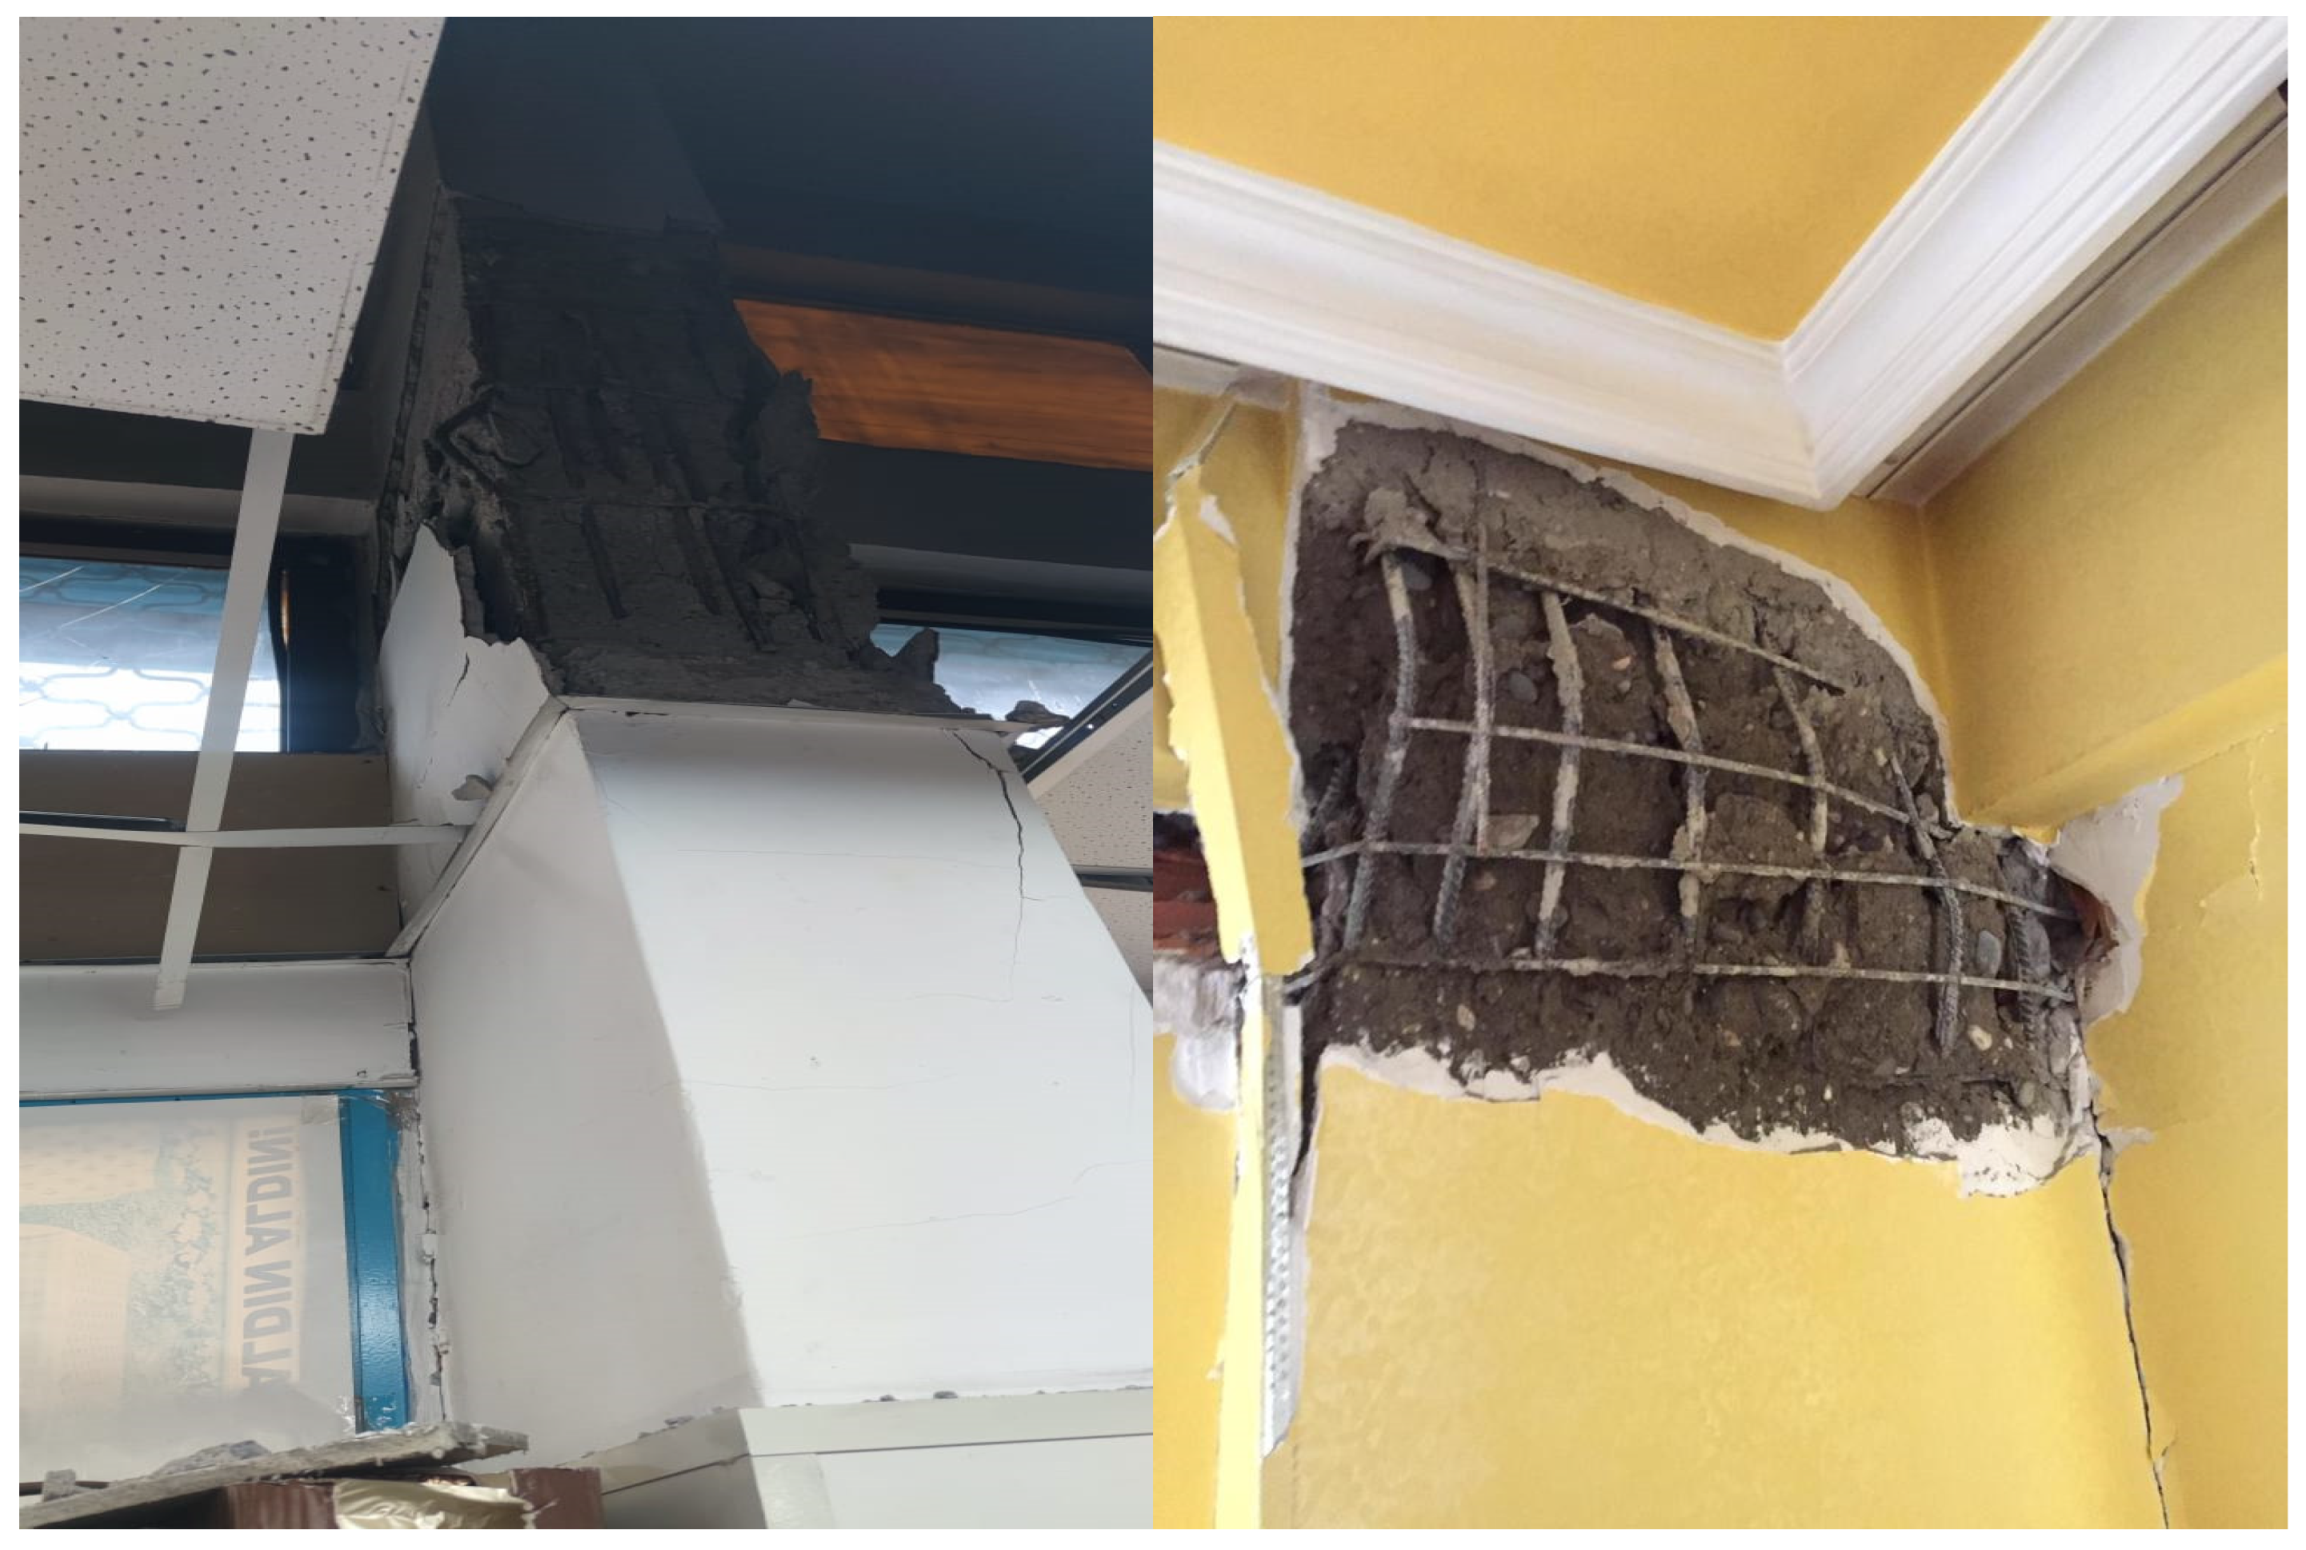
Earthquake amplitudes decrease in parallel with the distance–decay relationship as one moves away from the earthquake focal point, and accordingly, lower values were expected to be observed in Diyarbakır. However, the unexpected disproportionate destruction, damage and loss of lives in response to these low acceleration values raise some questions. In the observations made in the field after the earthquake, the presence of many structural defects, especially low-strength concrete and poor steel reinforcement, are noteworthy. In Diyarbakır province, the locations of a total of 18 buildings, including the building shown in Figure 6, Figure 7 and Figure 8, 5 other collapsed buildings, 9 damaged (slightly, moderately and extensively damaged) buildings and 3 undamaged buildings, were marked with the help of the GPS on-site detection.
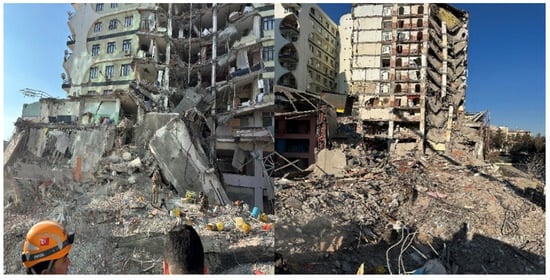
Figure 6.
Collapsed buildings in Diyarbakır.
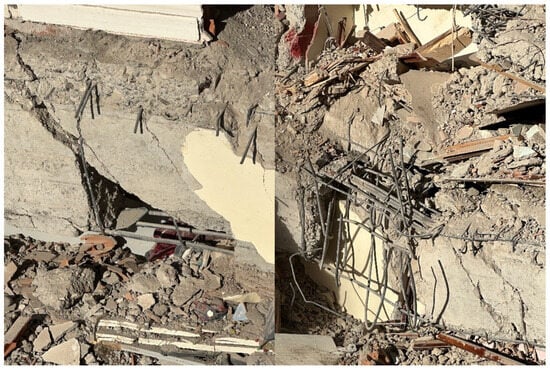
Figure 7.
Shear damage of the beam and inappropriate stirrups.

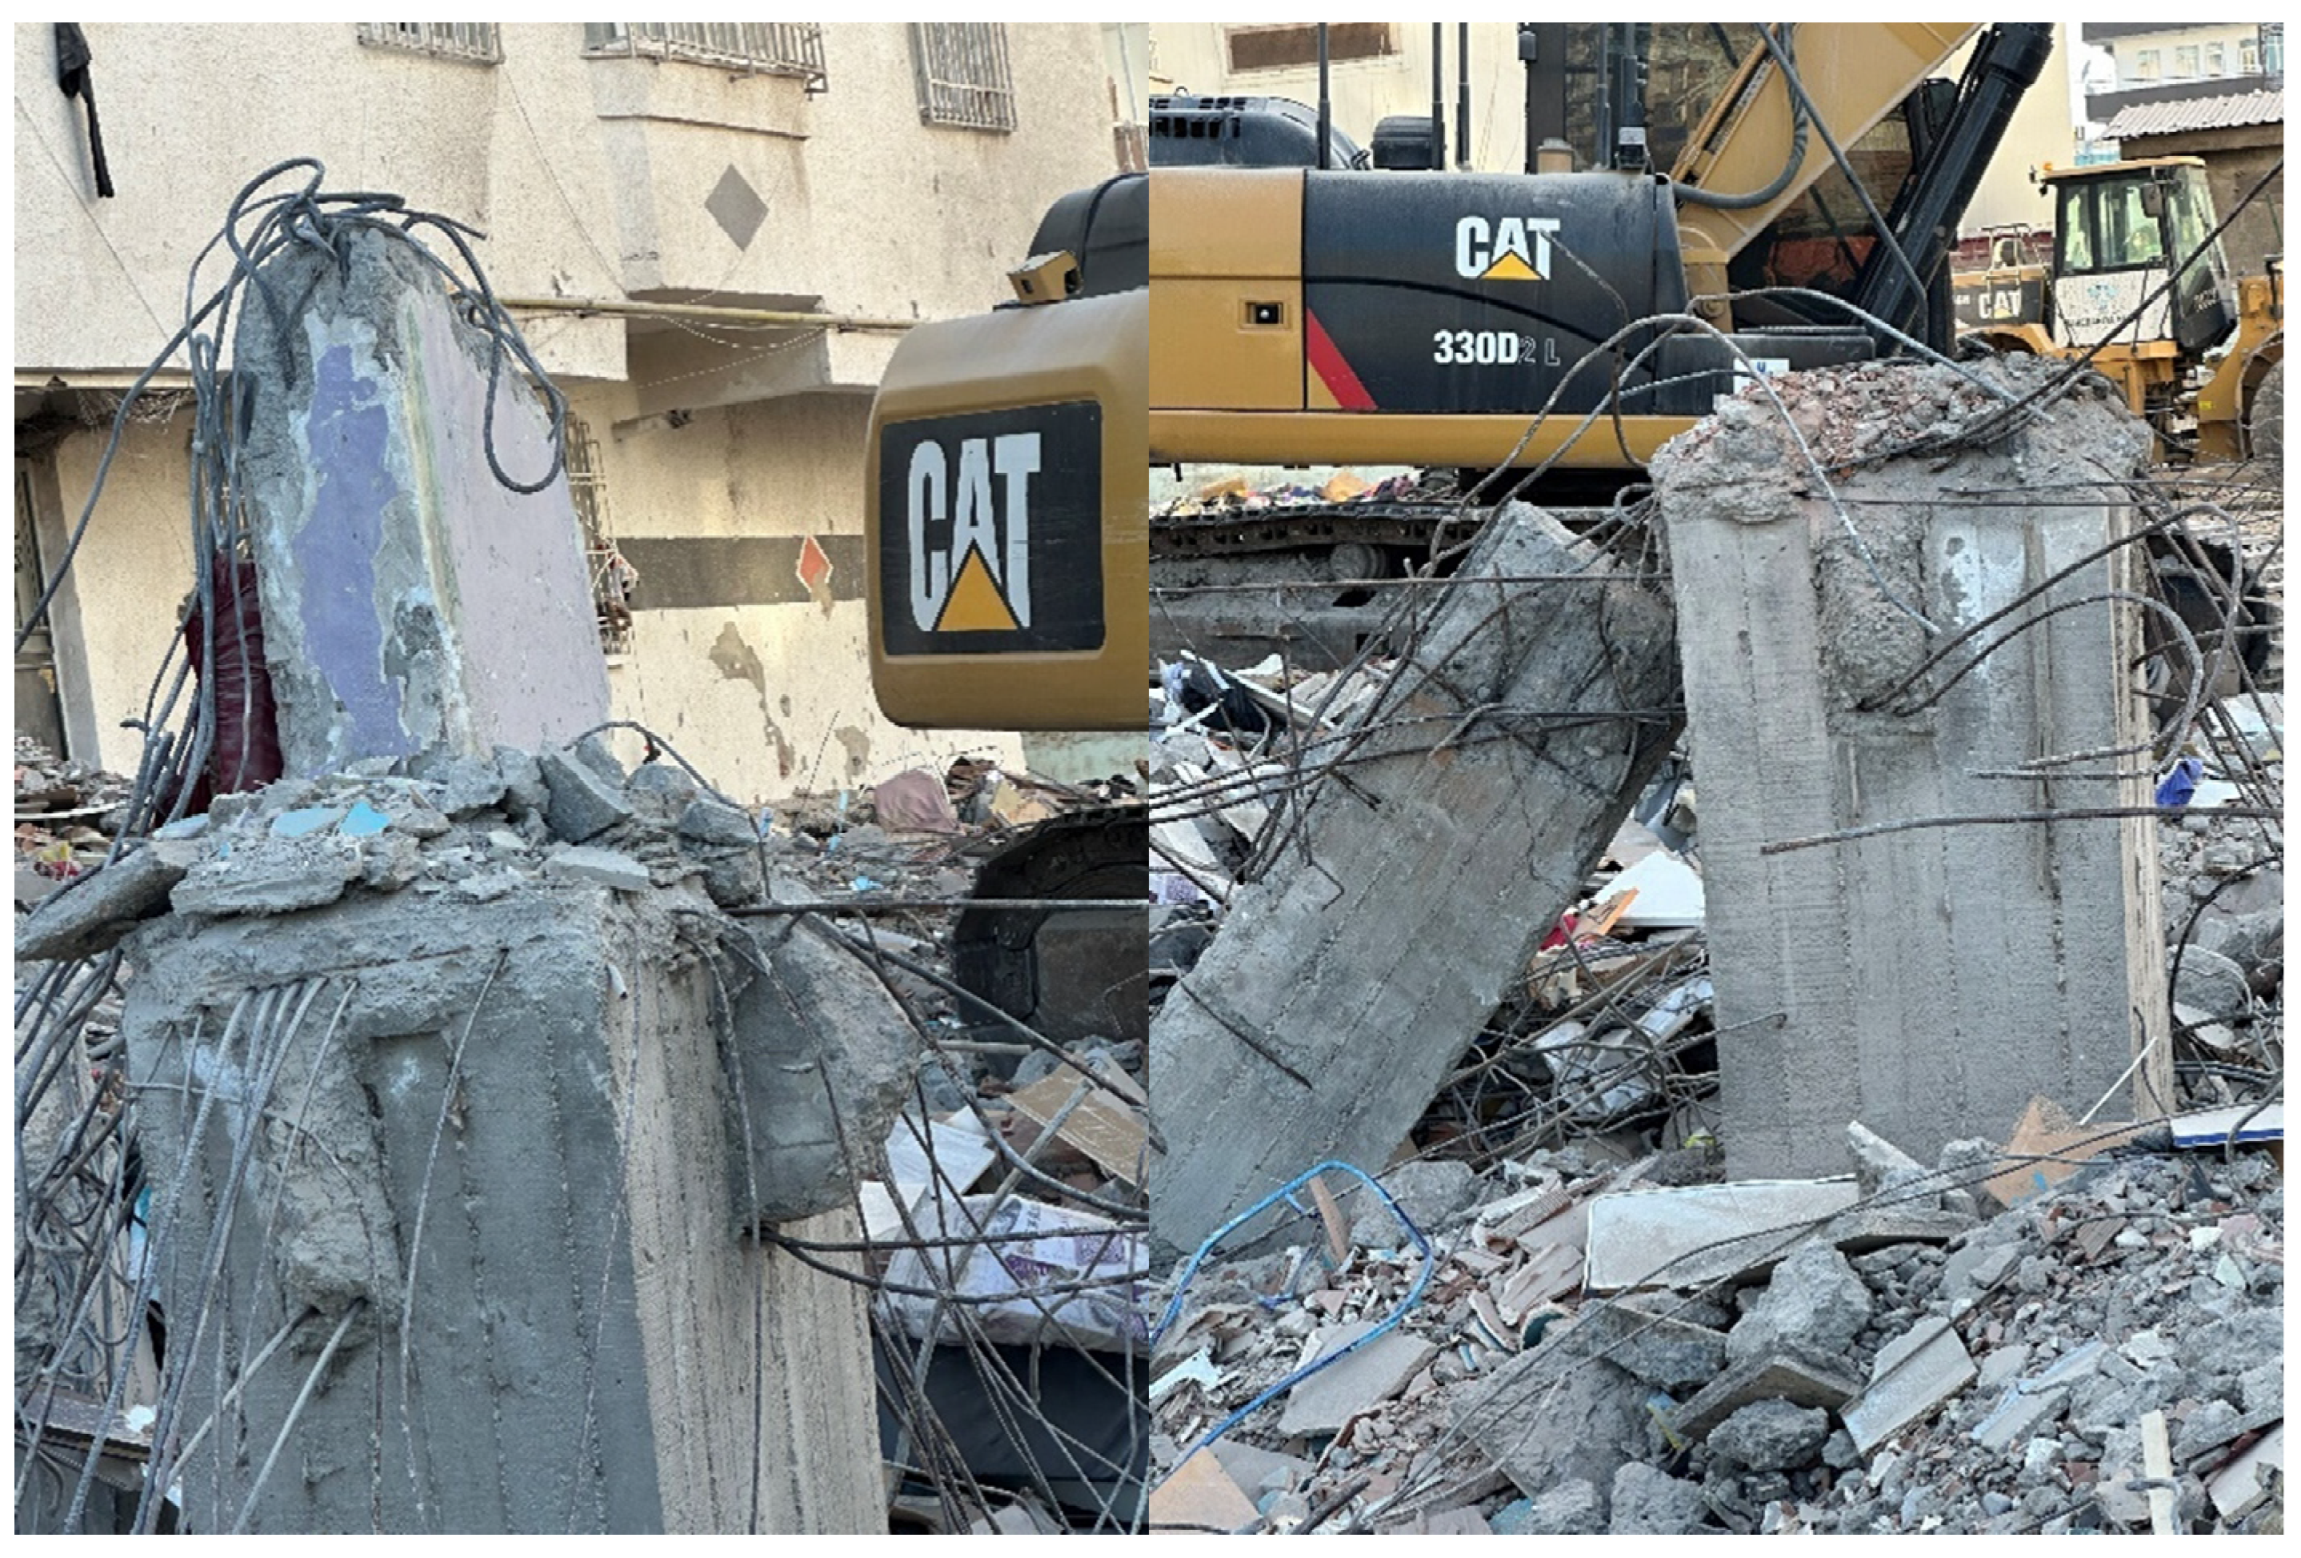
Figure 8.
Retrofitting of the ground floor only and the failure of the old column.
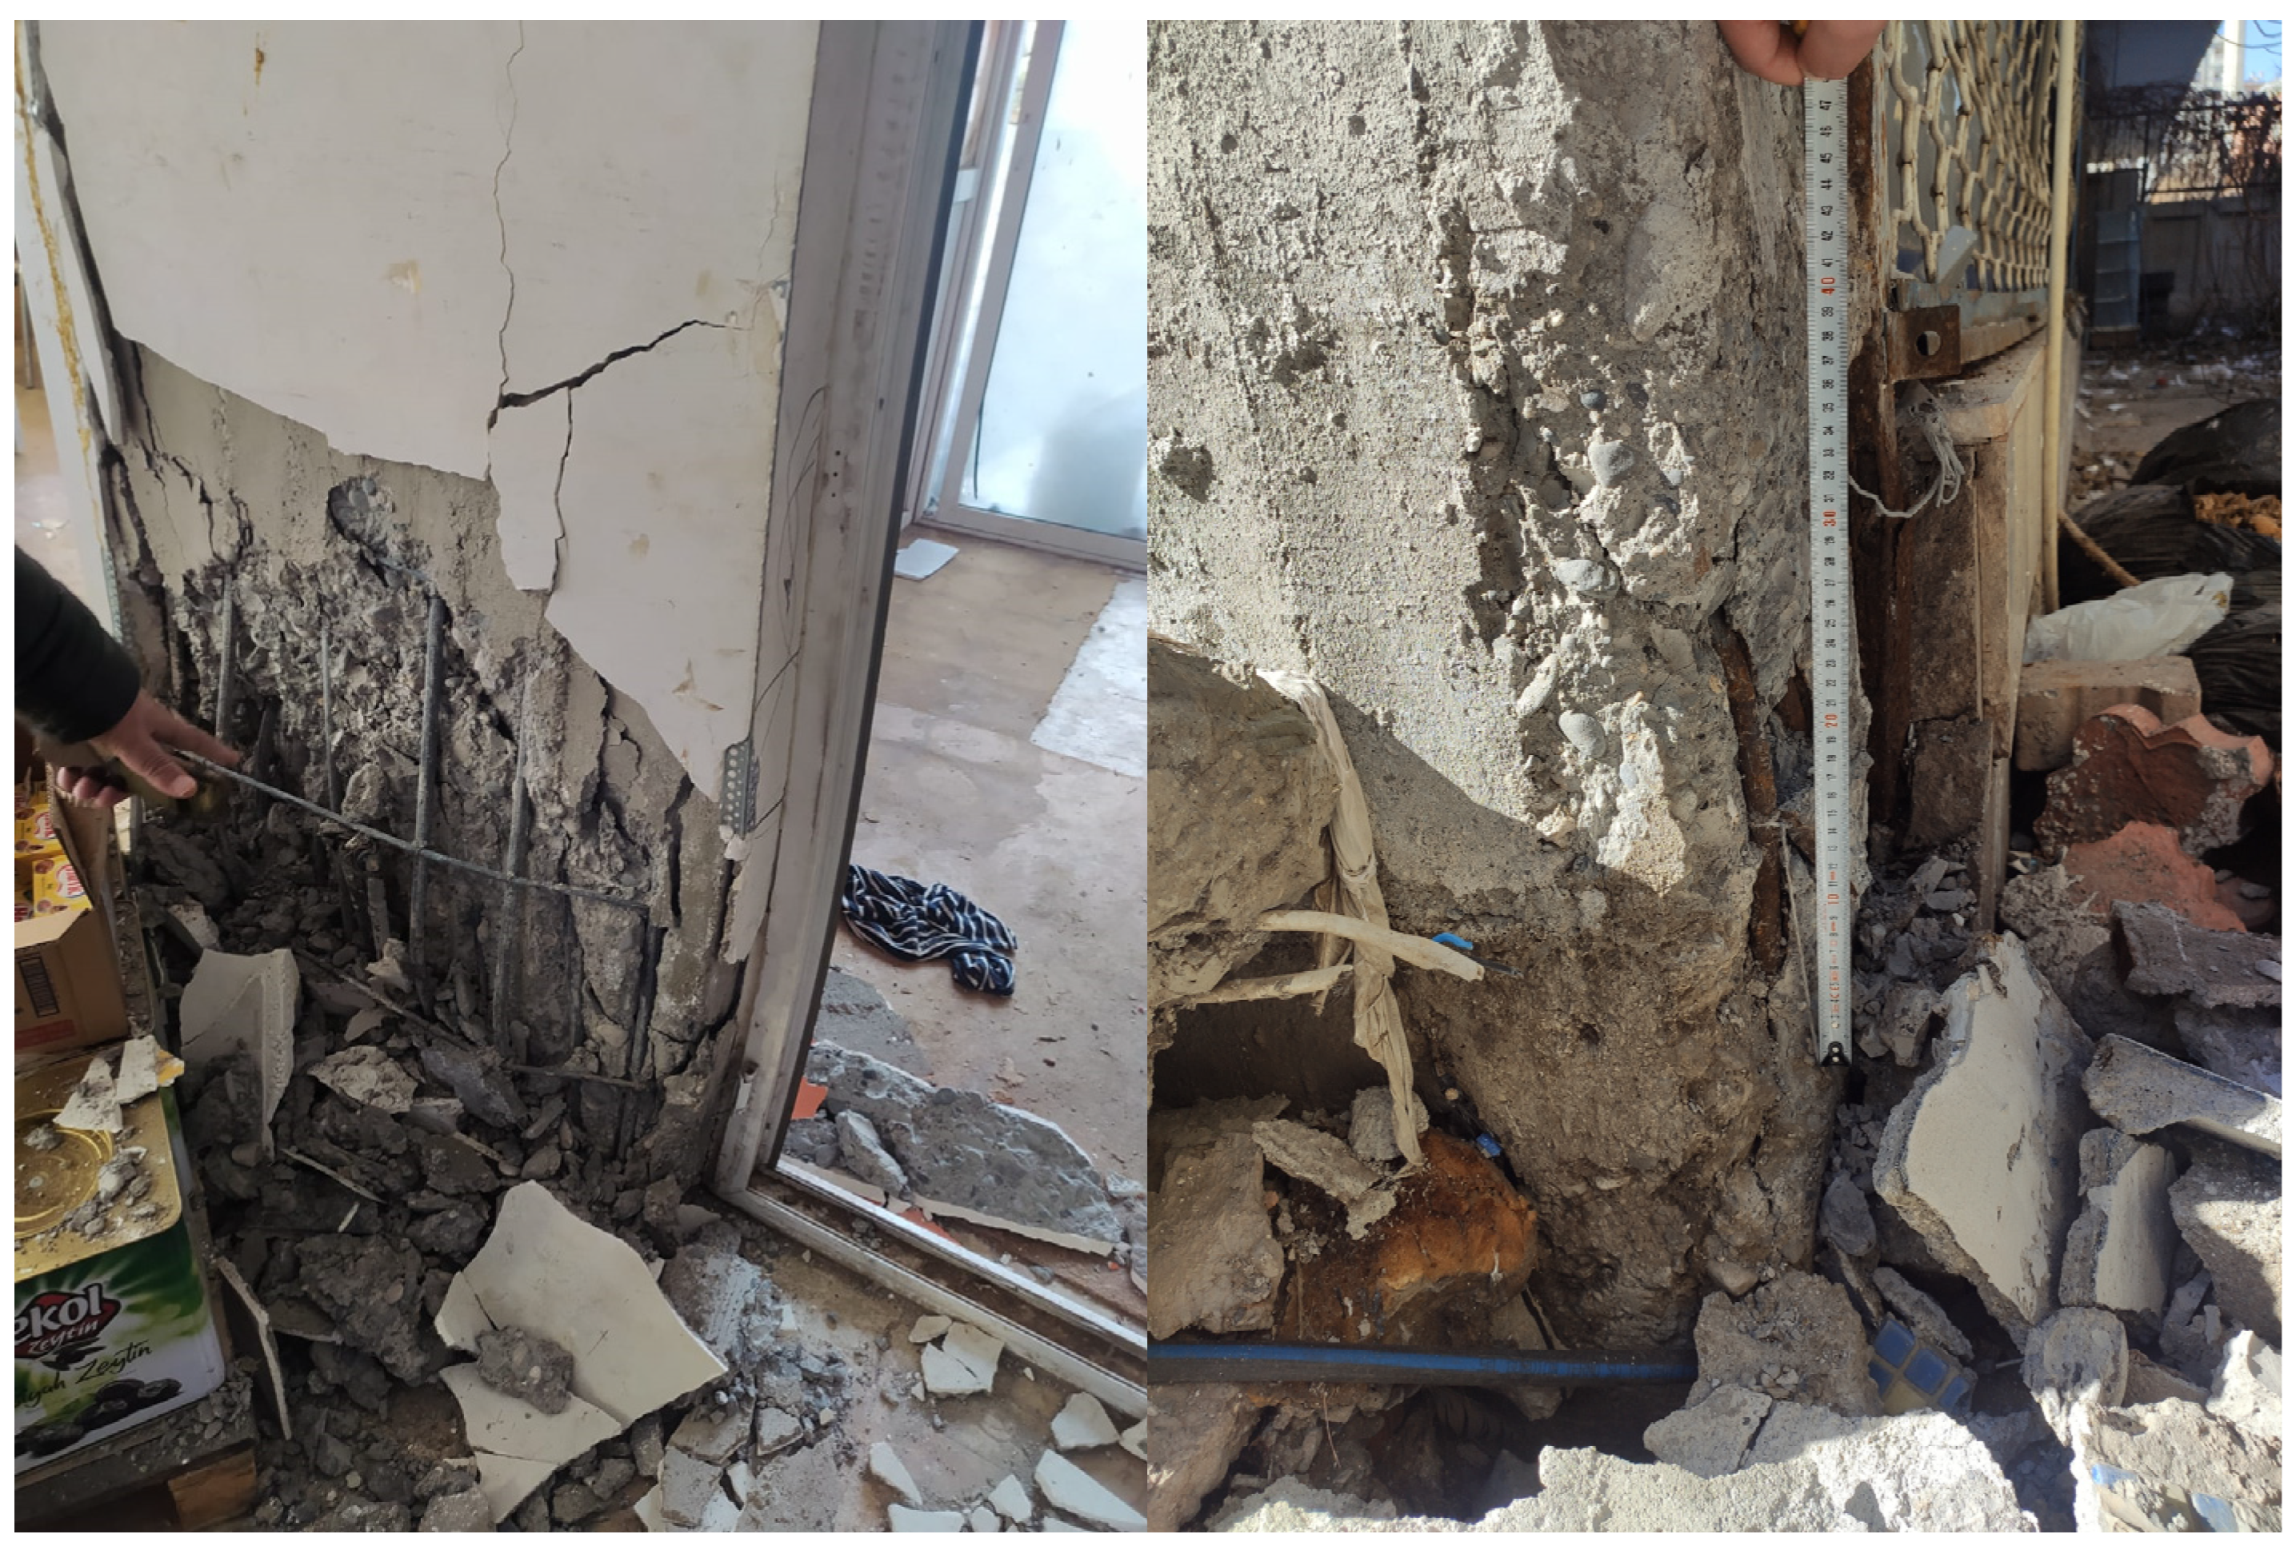
Figure 8 shows the undamaged ground floor columns of the completely collapsed building. The slender column rising after the column with an exceptionally large cross-section might indicate that this building was subjected to an insufficient retrofitting process. Some damage examples of inappropriate shear walls and columns are illustrated in Figure 9 and Figure 10.
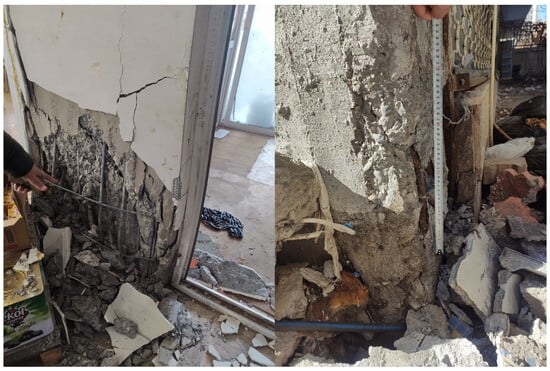
Figure 9.
Extensively damaged columns.

Figure 10.
Damage to the short column and shear wall with poor concrete.
According to the official Provincial Damage Assessment Reports, the numbers of the extensively damaged or collapsed, moderately damaged and slightly damaged buildings were recorded as 8602, 11,209 and 113,223, respectively, with hundreds of casualties [33]. The common cause of the collapse of the mentioned collapsed or extensive damaged structures can be considered according to many constructional defects, especially low concrete strength.
2.2. Structural Analyses
Local seismic parameters were obtained with the help of the Türkiye Earthquake Hazard Map created by TBEC2018 [34] with micro zonation. Previous regulation TSC-2007 [35] considered the local seismic parameters constant due to the regional approach. In order to compare these parameters, a sample reinforced concrete structure was modelled in SeismoStruct v.2023 software in accordance with the current regulations. Using pushover analysis, the damage limit values determined in Eurocode 8 [36] were obtained and compared for different PGA values of the investigated structure.
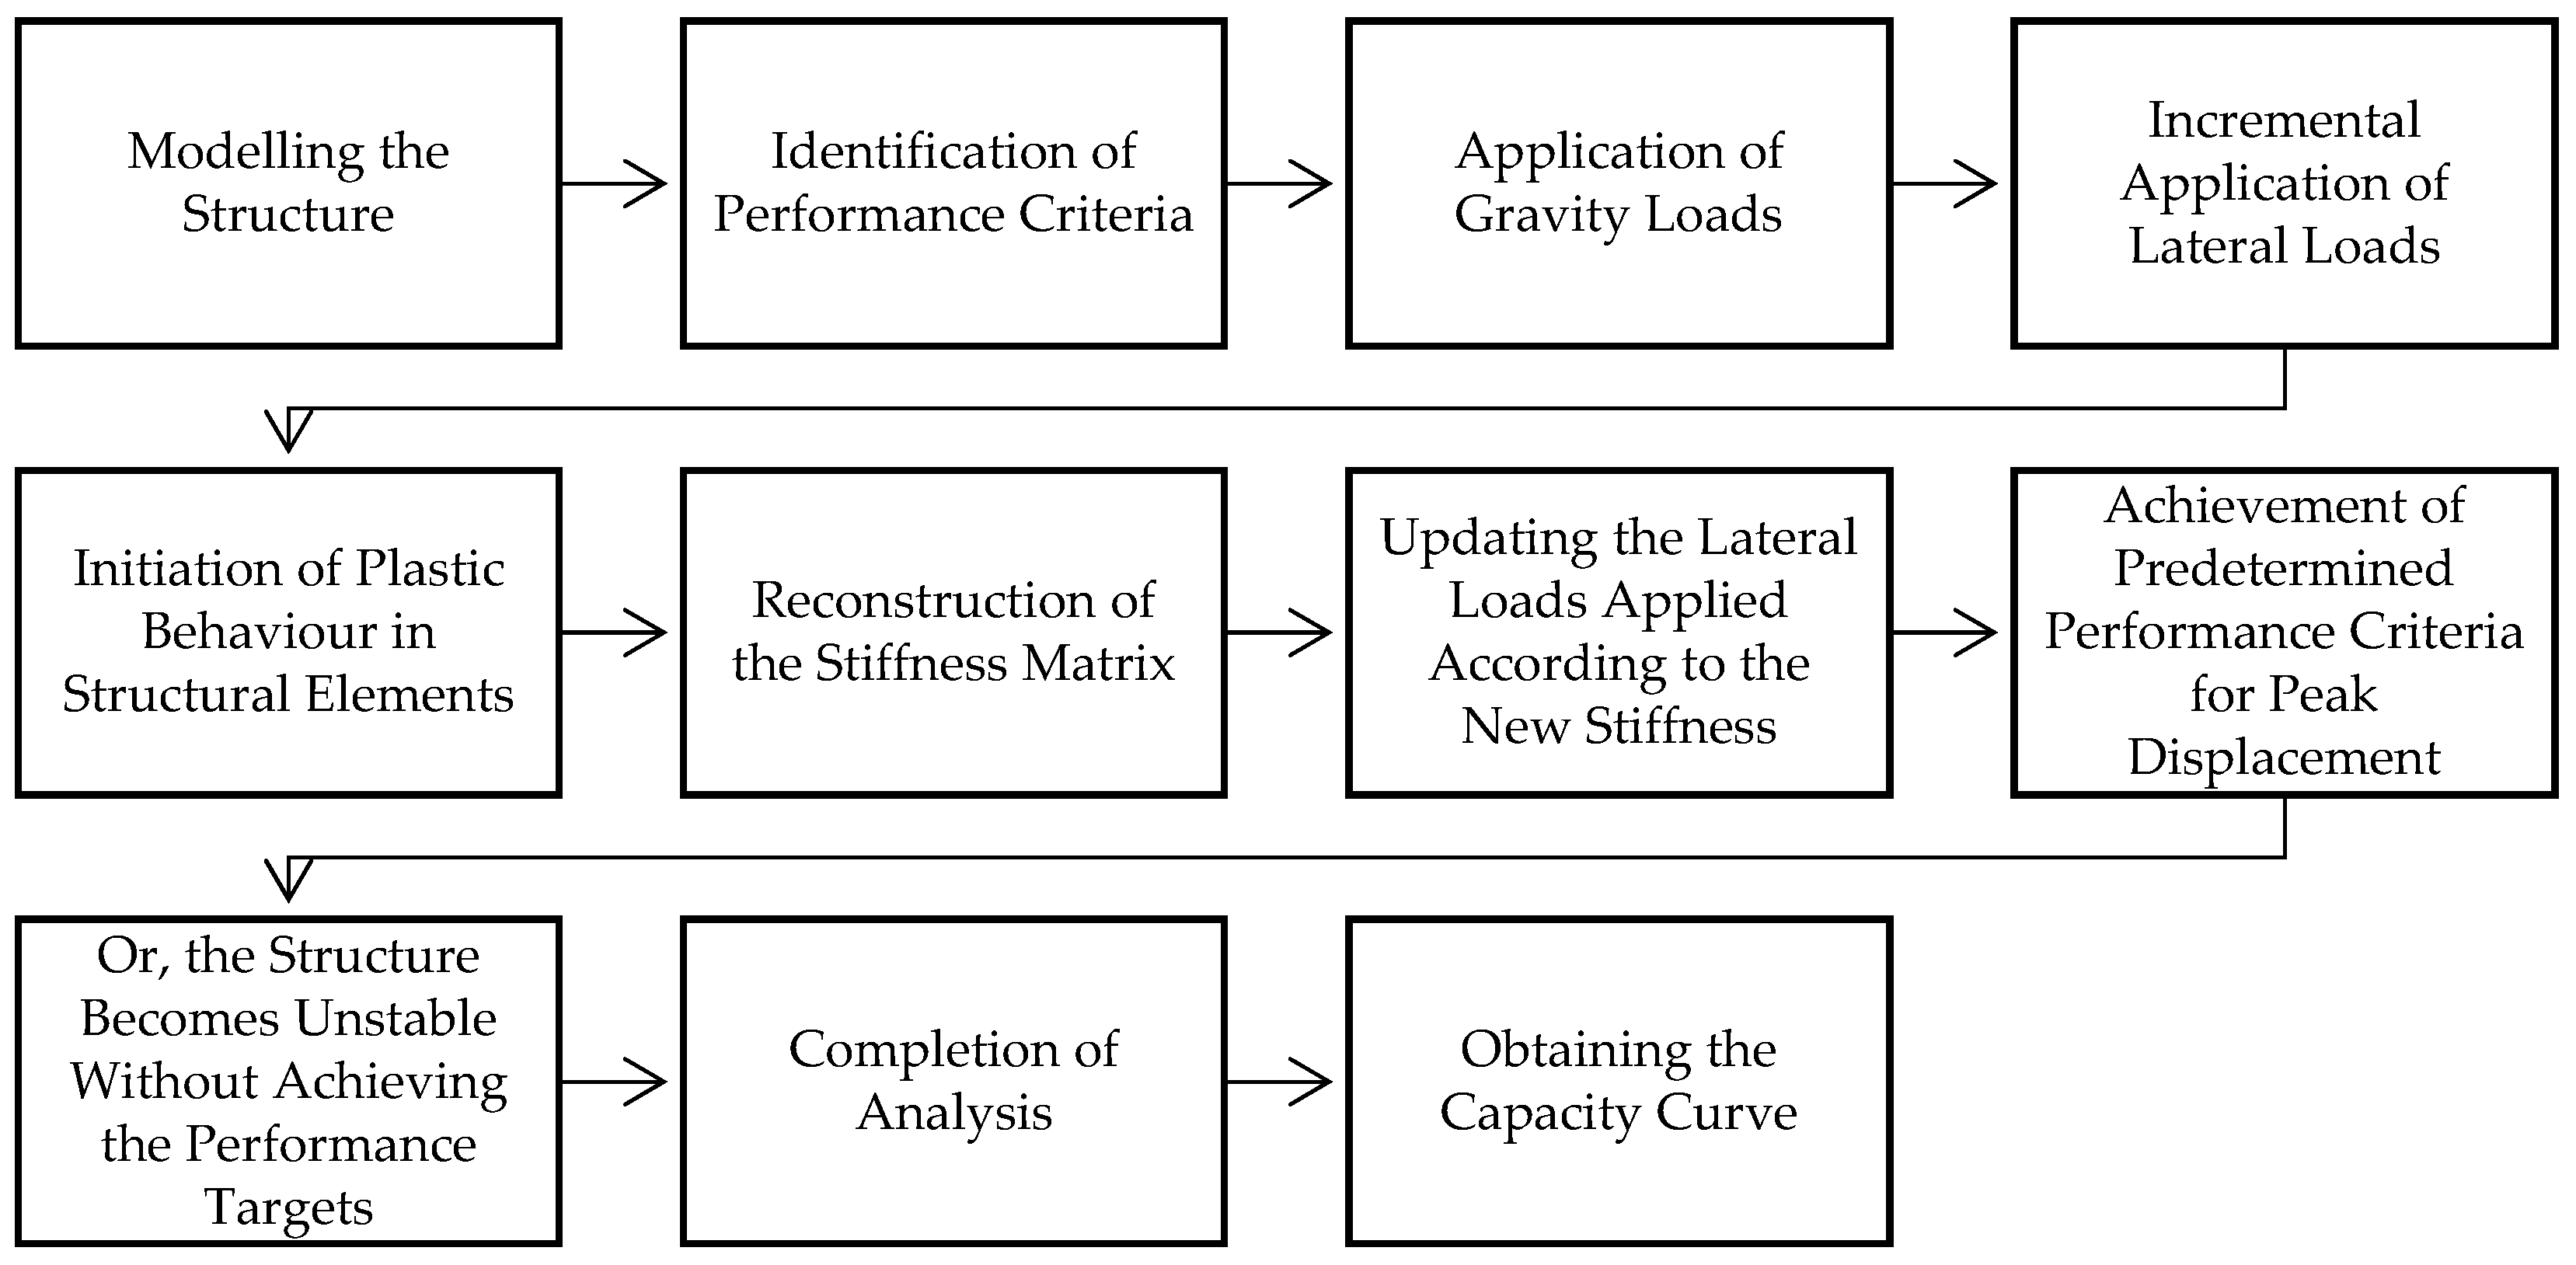
The analysis steps of pushover analysis as a performance-based evaluation method that estimates the structural responses to seismic loads by applying a series of increasing lateral loads are shown in Figure 11. The method is particularly useful in identifying the weak points and failure mechanisms of structures and helps in determining appropriate retrofitting strategies [37,38,39].

Figure 11.
Analysis steps of pushover analysis.
The initial step involves assuming a particular pattern for the lateral load, followed by conducting a static analysis of the structural model under this load pattern in a pushover analysis. A distributed load pattern has been used with a 0.3 m target displacement in this study. The evaluation of the earthquake impact and the devastating effects on buildings can be performed not only by extracting its various peaks and cumulative parameters but also by calculating various types of linear and nonlinear seismic spectra. Furthermore, pushover analysis can be performed for various simplified cases of buildings in an effort to estimate the response that they would exhibit during the earthquake. The calculated parameters can provide some hints about the destructiveness of the earthquake and how the buildings could be designed to be able to resist such earthquakes in the future [40].
In the present study, the seismic parameters of the earthquakes are calculated to provide explanations about the large unexpected structural destructiveness in Diyarbakir. Structural analysis of a reinforced concrete building in Diyarbakır was performed using both the measured and current acceleration values according to the last two earthquake hazard maps. The results of this analysis reveal significant differences between the expected target structural displacement values, highlighting the importance of continuous updates to these maps for accurate seismic risk assessment.
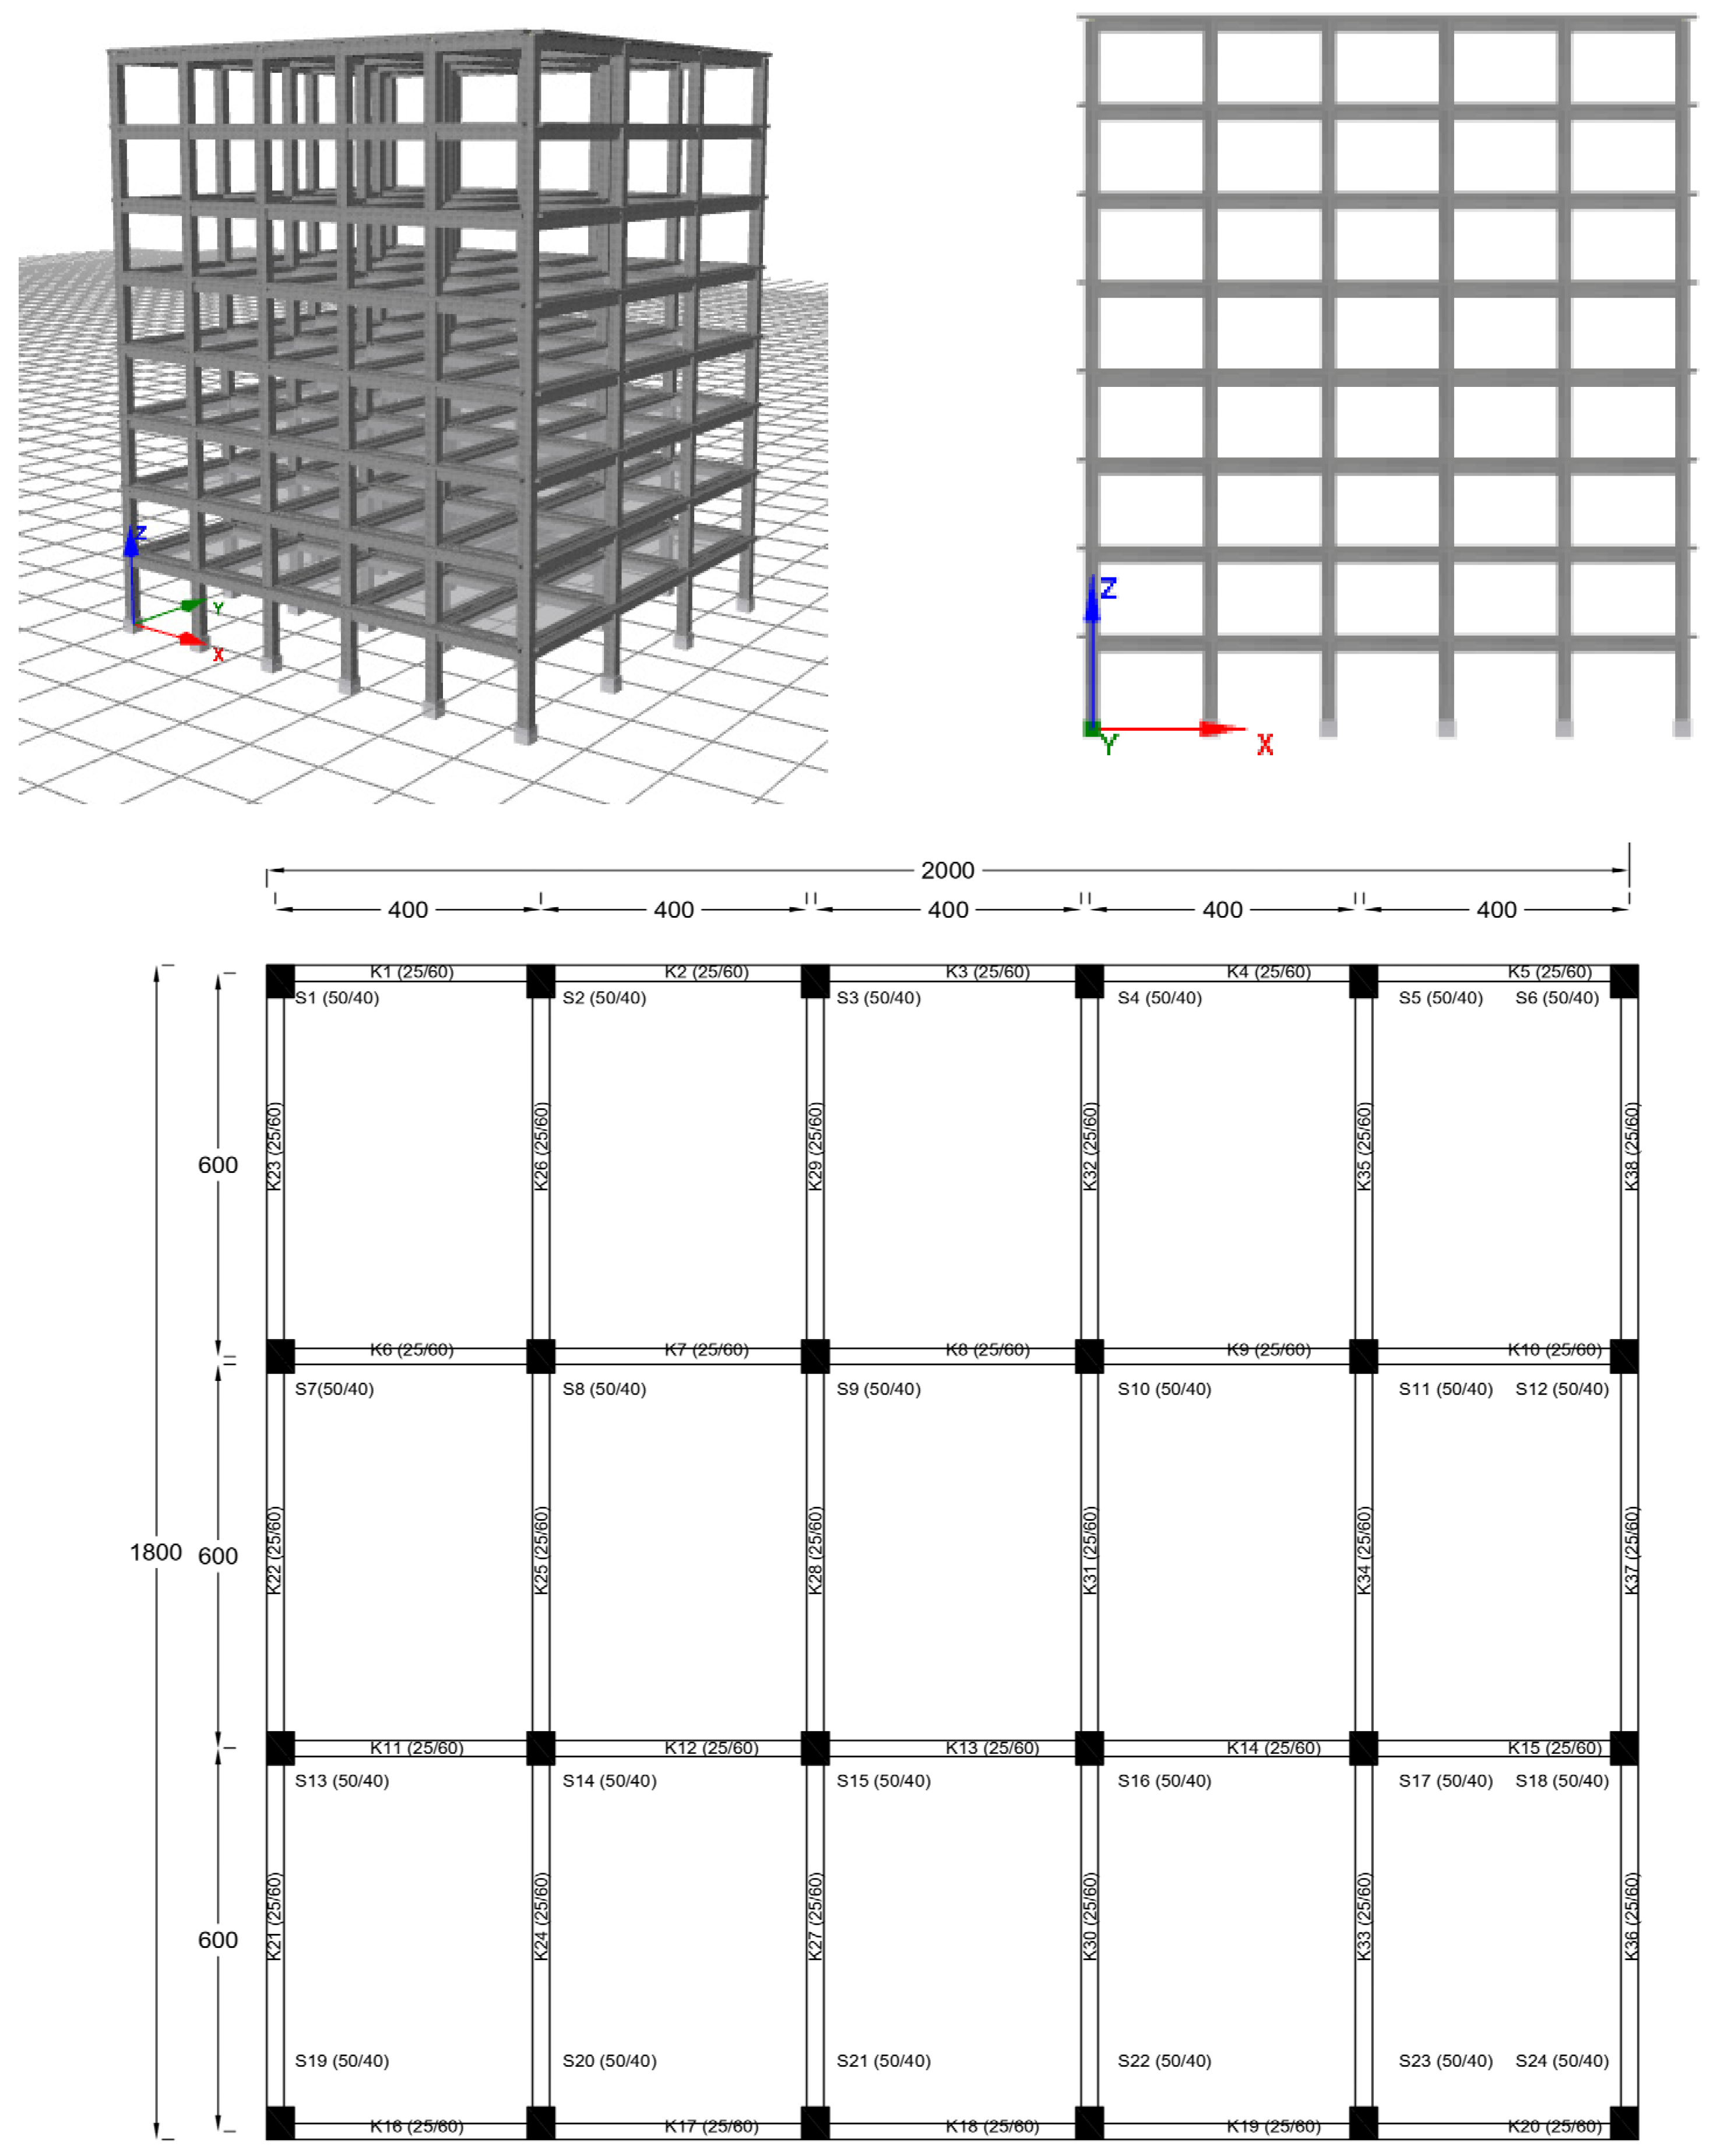
For a comprehensive understanding of the Pazarcık Earthquake’s impact on Diyarbakır, earthquake-damaged and collapsed buildings in the province were analysed. Three buildings, each with minor, moderate, and severe damage, and six buildings that collapsed during the earthquake were selected for this purpose. The sample building’s 2D view, 3D view, and blueprint of the sample RC model can be seen in Figure 12. The numerical specifications of the sample building are given in Table 4. The fundamental period of the structure was 0.8271 s; the maximum base shear was 6557.27 kN; the elastic stiffness K_elas and the effective stiffness K-eff were obtained as 120,492.20 kN/m and 63,600.91 kN/m, respectively.

Figure 12.
2D and 3D views with blueprint of the sample RC model.
Table 4.
Structural specifications of the sample building.
The latest version of the Turkish Building Earthquake Code (TBEC-2018) has introduced three additional levels of ground motion (DD-1, DD-3, DD-4) compared to the previous edition. In the previous code, only the standard earthquake ground motion level with a recurrence period of 475 years and a 10% probability of exceedance in 50 years (DD-2) was considered in TSC-2007. It is important to note that the first two levels (DD-1 and DD-2) of the four earthquake levels correspond to the design earthquakes in ASCE-07 [41]. The current code outlines four different levels of ground motion, which can be found in Table 5.
Table 5.
Earthquake ground motion levels (TBEC-2018).
TEHMIWA is a user-friendly and practical web application designed for use by the Disaster and Emergency Management Agency of Türkiye (AFAD). It enables the calculations of earthquake parameters for any location using various earthquake ground motion levels, local ground conditions, and latitude and longitude data. The application takes into account the probability of exceedance and local ground conditions to obtain the short-period map spectral acceleration coefficient (SS) and the map spectral acceleration coefficient (S1) for the 1 s period. The design spectral acceleration coefficients SDS and SD1 are determined using equations that consider the spectral acceleration coefficients (SS and S1) and local ground coefficients (FS, F1).
SDS = SS × FS
SD1 = S1 × F1
Table 6 and Table 7 provide the local ground effect coefficients for the short period (FS) and 1.0 s (F1), respectively. These coefficients are being used for the first time in the current code, with greater emphasis on the local ground effect.
Table 6.
Local ground effect coefficients for the short-period zone (Fs) (TBEC-2018).
Table 7.
Local ground effect coefficients for a period of 1.0 s (F1) (TBEC-2018).
To allow for accurate comparisons, ZC was selected as the standard soil class based on TBEC-2018. This soil class will remain consistent for all parameters requiring a local soil class, and its characteristics can be found in Table 8.
Table 8.
Local soil class type ZC (TBEC-2018).
The spectral acceleration coefficients are only compared for the DD-2 ground motion level. This is because the previous code only used ground motion levels with a recurrence period of 475 years and a 10% probability of exceedance in 50 years. Table 9 shows the comparison of the spectral acceleration coefficients based on the last two seismic design codes. There were no vertical values in the previous code, so no comparisons were made in that direction.
Table 9.
The comparison of the spectral acceleration coefficients with ground-type ZC.
Damage limits, which represent the point at which a structure can no longer withstand applied loads, play a crucial role in assessing the performance of buildings during earthquakes. In the case of the Pazarcık Earthquake, an evaluation was conducted to determine the damage limits of the selected buildings in Diyarbakır. This assessment provided valuable information regarding the responses of local structures to the seismic activities and the extent of the damage they sustained.
The limit states given in Eurocode 8, which is used worldwide for damage estimation, were also taken into consideration in the study. Detailed descriptions of these limit states are given in Table 10.
Table 10.
Limit states in Eurocode 8 (Part 3) (CEN 2004) [36].
The local seismic parameters of these selected buildings were analysed according to the 2018 Building Earthquake Code of Türkiye. This analysis revealed significant differences between the expected target structural displacement values resulting from the structural analysis.
The seismic values of the Pazarcık and Elbistan earthquakes were compared with the current peak ground acceleration values specified in the current Turkish Earthquake Design Regulation. This comparison demonstrated differences between the measured and proposed peak ground accelerations for some earthquakes.
These data are from TBEC (2018) (Turkish Earthquake Building Code). DD1 is 2% in 50-year ground motion level. A comparison with DD2, i.e., 10% in 50-year ground motion level, is given in Figure 13.
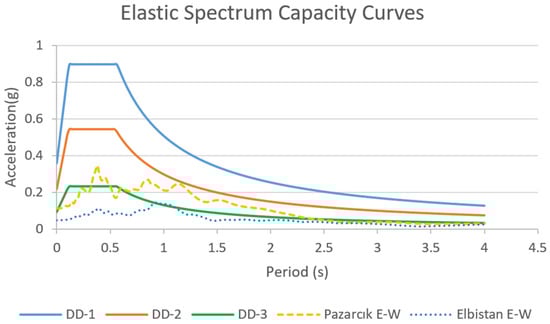
Figure 13.
Comparison of the spectral acceleration and specification elastic spectrum capacity values of the station 2107 in Diyarbakır province.
3. Results
The local seismic parameters of the selected buildings in Diyarbakır, as analysed according to the Türkiye Building Earthquake Code (TBEC2018) and Turkish Seismic Code 2007 (TSC2007), were compared with the Eurocode 8 specifications. This comparison provided insights into the effectiveness of the current design regulations in adequately addressing the seismic risks in the region.
The seismic parameters of the chosen buildings in Diyarbakır were assessed based on the local seismic data and analysed in accordance with TBEC2018 and TSC2007. In order to evaluate the adequacy of the current design regulations in addressing seismic risks, a comprehensive comparison was made with the Eurocode 8 specifications in terms of limit states. This comparative analysis has clarified the compatibility between the local seismic conditions and the prescribed design criteria, highlighting the areas where improvements or adjustments may be required. By analysing the similarities and differences between the two codes, valuable insights have been gained into the effectiveness of the current design codes in ensuring the structural strength of buildings in the face of seismic events in the region.
The seismic performances of various buildings in Diyarbakır were evaluated based on the recorded ground motion parameters. In the analysis, four different damage levels were considered with three buildings each: no damage, slight damage, moderate damage and severe damage. Ground motion parameters including DD1, DD2 and DD3 were compared with the TSC 2007 design code and the PGA (peak ground acceleration) values obtained from the first and second earthquakes. The analysed buildings are marked on the city map as shown in Figure 14.
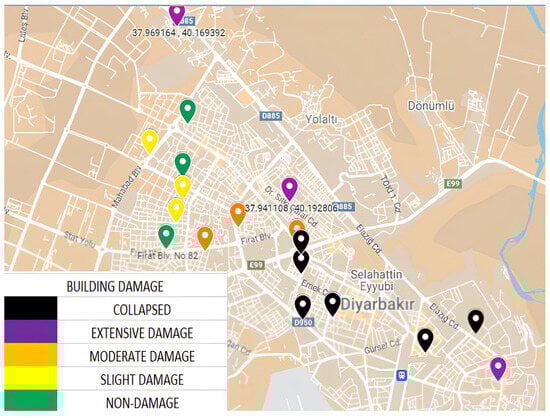
Figure 14.
Map of the damaged buildings and their locations.
Among the analysed buildings, those categorised as undamaged did not show relatively lower PGA values in all three components as expected. It would be expected as the damage level increased from slight damage to extensive damage that the PGA values would generally increase, indicating a higher level of ground shaking and potential structural damage. Instead, an undamaged building may have higher PGA values than a collapsed one, as shown in Table 11 and Table 12.
Table 11.
PGA values of the analysed damaged buildings (g).
Table 12.
PGA values of the analysed collapsed buildings (g).
The seismic performances of each building were assessed against the prescribed design criteria and provided findings on the effectiveness of the existing seismic design codes in addressing the seismic risks in the region. The obtained damage limit values are shown in Table 13 and Table 14.
Table 13.
Eurocode 8 damage limits for the PGA values of TBEC2018.
Table 14.
Eurocode 8 damage limits for the PGA values of TSC2007 and earthquakes.
The data in Table 13 and Table 14 include the results obtained based on pushover analysis of the sample building. The analysed sample building is an eight-storey reinforced concrete building, and the results of the analysis show the maximum allowable (calculated) values for different earthquake levels. The peak ground acceleration (PGA) values calculated for different earthquake levels, and the damage limit values calculated accordingly, can be used for comparisons. Higher damage limit values are expected for DD1, DD2 and DD3, which have a higher earthquake level, respectively. On the other hand, damage limit values calculated according to the TSC 2007 earthquake regulation are also included in the data. According to the TSC 2007 regulation, Diyarbakır province is considered a second-degree earthquake zone, so the PGA values are constant, and therefore the damage limit values are also constant.
Comparing the damage limit values calculated for different earthquake levels given in the TBEC2018 regulation with the damage limit values calculated according to the TSC 2007 regulation can provide an estimate of the damage potential of buildings. It can be expected that locations with higher PGA values may cause more damage, and, accordingly, damage limit values may increase. In the current code, none of the locations analysed in this study have PGA values higher than the old code TSC2007. Therefore, even if the buildings were constructed in accordance with the old code, they could be expected to respond to earthquake loads with minimal damage. Table 15 shows the damage limits according to the pushover analysis for the studied buildings.
Table 15.
TBEC 2018 damage limits for different earthquake levels.
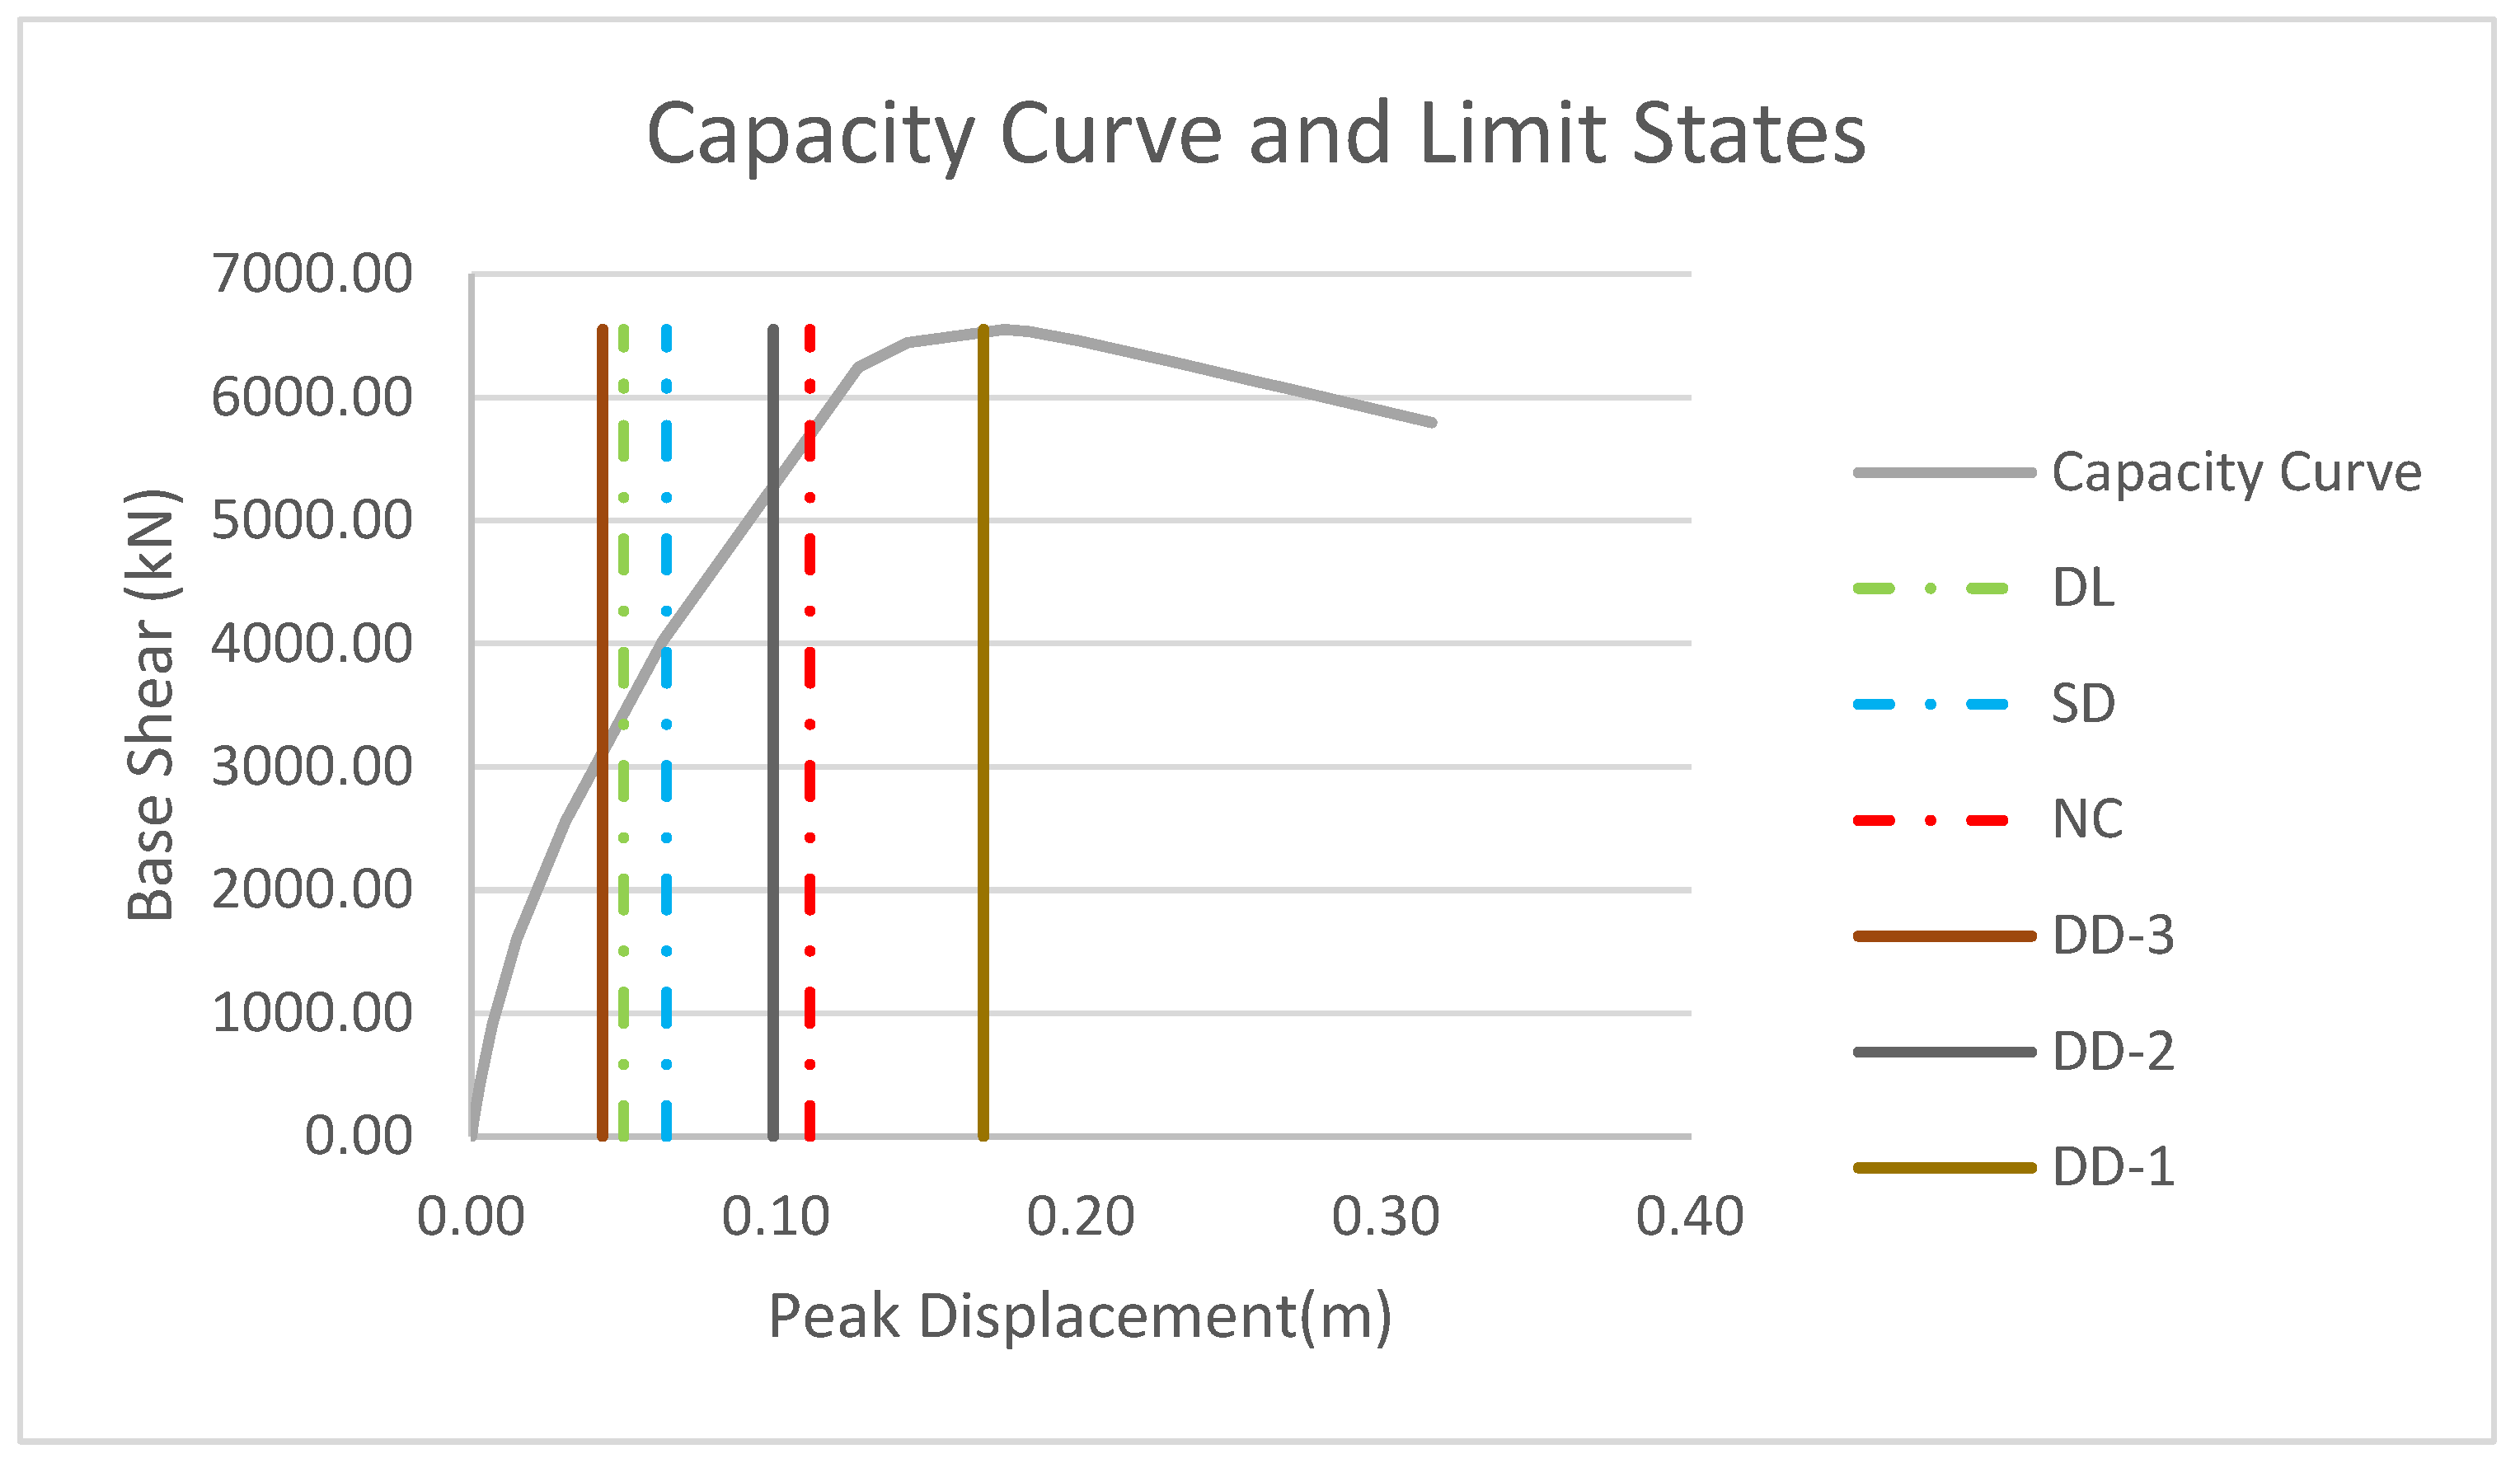
The static pushover curve in Figure 15 shows that the building has acceptable ductility and stiffness if the building was designed according to the current code minimum requirements. However, six buildings with specifications similar to the sample building collapsed during the earthquake.

Figure 15.
Static pushover curve and limit states of TBEC and Eurocode 8.
Figure 15 illustrates that the DL and SD limits of Eurocode 8 fall between TBEC’s DD-2 and DD-3 limit states, with DD-3 being closer than DD-2. The higher limit states, DD-1 and NC, have greater margins than the lower limit states. It can be concluded that the TBEC2018 code is on the safer side.
4. Conclusions
The Pazarcık earthquake was a striking reminder of the seismic risks facing Türkiye. This study focuses on the effects of the devastating earthquake that occurred on 6 February 2023 in Diyarbakır province. It was recorded that six buildings during the earthquake and 17 buildings after the earthquake collapsed; 72 buildings required urgent demolition; 2840 buildings were extensively damaged; 2458 buildings were moderately damaged; and 28,937 buildings were slightly damaged. In the field study conducted in this context, except for the six demolished buildings, three each of extensively damaged, moderately damaged, slightly damaged and undamaged buildings were selected for analysis. For the analyses to be conducted, the current location of each building was visited one by one, and the GPS coordinates were determined on site. Site-specific PGA data were obtained thanks to the earthquake hazard map, which started to be used with the TBEC2018 regulation. Unlike the current regulation, these data were compared with the TSC2007 regulation, which provides fixed PGA values for earthquake zones. In addition to the comparison of the PGA values, the damage limit values were also compared. Eurocode 8 was used for damage limit values. In this context, as a structure that could be found in all selected locations, an eight-storey reinforced concrete building was modelled in SeismoStruct software, and static pushover analysis was performed. The Eurocode 8 limit values were obtained and compared to the Turkish codes to ensure compatibility. It appeared that the 2007 regulation tended to be on the safer side compared to the other regulations in terms of PGA values. In addition, the increases in the PGA values obtained by micro zonation in the current regulation were expected to increase the seismic hazard. It is seen that this may not always be the case because of the local soil conditions and the structural properties that resist earthquake loads.
On the other hand, as shown in Figure 13, it is clearly seen that the spectral values of the earthquake measured in Diyarbakır are far below the design spectra. It is thought-provoking in terms of engineering that this earthquake, which in theory could be expected to have weak effects on a settlement that is so far away, caused such great damage. The outcome from the structural analysis of the selected building has already indicated notable divergences between the projected seismic performance and the actual seismic behaviours. Such discrepancies warrant urgent attention, as they underscore potential inadequacies in the current earthquake design regulations and their implementation.
After evaluating all the data collected in this study, it is concluded that the last two seismic hazard maps and seismic design regulations applied in Türkiye can be considered as successful. However, despite this, significant loss of lives and property still call for further research. A comprehensive analysis of both seismic parameters and structural characteristics is necessary to gain a deeper understanding of the causes of the large-scale losses.
Funding
This research received no external funding.
Data Availability Statement
Most data are included in the manuscript.
Conflicts of Interest
The author declares no conflict of interest.
References
- Işık, E. Comparative investigation of seismic and structural parameters of earthquakes (M ≥ 6) after 1900 in Türkiye. Arab. J. Geosci. 2022, 15, 971. [Google Scholar] [CrossRef]
- Işık, E.; Hadzima-Nyarko, M.; Bilgin, H.; Ademović, N.; Büyüksaraç, A.; Harirchian, E.; Bulajic, B.; Ozmen, H.B.; Aghakouchaki Hosseini, S.E. A comparative study of the effects of earthquakes in different countries on target displacement in mid-rise regular RC structures. Appl. Sci. 2022, 12, 12495. [Google Scholar] [CrossRef]
- Huang, C.; Chen, L.; He, L.; Zhuo, W. Comparative assessment of seismic collapse risk for non-ductile and ductile bridges: A case study in China. Bull. Earthq. Eng. 2021, 19, 6641–6667. [Google Scholar] [CrossRef]
- Yel, N.S.; Arslan, M.H.; Aksoylu, C.; Erkan, İ.H.; Arslan, H.D.; Işık, E. Investigation of the earthquake performance adequacy of low-rise RC structures designed according to the simplified design rules in TBEC-2019. Buildings 2022, 12, 1722. [Google Scholar] [CrossRef]
- Işık, E.; Kutanis, M. Performance based assessment for existing residential buildings in Lake Van basin and seismicity of the region. Earthq. Struct. 2015, 9, 893–910. [Google Scholar] [CrossRef]
- Li, H.; Li, L.; Zhou, G.; Xu, L. Effects of various modeling uncertainty parameters on the seismic response and seismic fragility estimates of the aging highway bridges. Bull. Earthq. Eng. 2020, 18, 6337–6373. [Google Scholar] [CrossRef]
- Ghani, S.; Kumari, S.; Jaiswal, S.; Sawant, V.A. Comparative and parametric study of AI-based models for risk assessment against soil liquefaction for high-intensity earthquakes. Arab. J. Geosci. 2022, 15, 1262. [Google Scholar] [CrossRef]
- Büyüksaraç, A.; Işık, E.; Bektaş, Ö. A comparative evaluation of earthquake code change on seismic parameter and structural analysis; A case of Turkey. Arab. J. Sci. Eng. 2022, 47, 12301–12321. [Google Scholar] [CrossRef]
- Bilgin, H.; Hadzima-Nyarko, M.; Işık, E.; Ozmen, H.B.; Harirchian, E. A comparative study on the seismic provisions of different codes for RC buildings. Struct. Eng. Mech. Int’l J. 2022, 83, 195–206. [Google Scholar]
- Kotoky, N.; Dutta, A.; Deb, S.K. Comparative study on seismic vulnerability of highway bridge with conventional and HyFRC piers. Bull. Earthq. Eng. 2019, 17, 2281–2306. [Google Scholar] [CrossRef]
- Işık, E.; Ademović, N.; Harirchian, E.; Avcil, F.; Büyüksaraç, A.; Hadzima-Nyarko, M.; Akif Bülbül, M.; Işık, M.F.; Antep, B. Determination of natural fundamental period of minarets by using artificial neural network and assess the impact of different materials on their seismic vulnerability. Appl. Sci. 2023, 13, 809. [Google Scholar] [CrossRef]
- Elganzory, A.M.; Novák, B.; Yousry, A.M. Damage assessment and sustainability of RC building in New Cairo City considering probable earthquake scenarios. In Design and Construction of Smart Cities: Toward Sustainable Community; Springer International Publishing: Cham, Switzerland, 2021; pp. 47–55. [Google Scholar]
- Zhang, Y.; Ouyang, X.; Sun, B.; Shi, Y.; Wang, Z. A comparative study on seismic fragility analysis of RC frame structures with consideration of modeling uncertainty under far-field and near-field ground motion excitation. Bull. Earthq. Eng. 2022, 20, 1455–1487. [Google Scholar] [CrossRef]
- Mertol, H.C.; Tunç, G.; Akış, T.; Kantekin, Y.; Aydın, İ.C. Investigation of RC buildings after 6 February 2023, Kahramanmaraş, Türkiye Earthquakes. Buildings 2023, 13, 1789. [Google Scholar] [CrossRef]
- Wang, X.; Feng, G.; He, L.; An, Q.; Xiong, Z.; Lu, H.; Wang, W.; Li, N.; Zhao, Y.; Wang, Y.; et al. Evaluating urban building damage of 2023 Kahramanmaras, Turkey earthquake sequence using SAR change detection. Sensors 2023, 23, 6342. [Google Scholar] [CrossRef] [PubMed]
- Katsimpini, P.S.; Papagiannopoulos, G.A. Effectiveness of the seesaw system as a means of seismic upgrading in older, non-ductile reinforced concrete buildings. Vibration 2023, 6, 102–112. [Google Scholar] [CrossRef]
- Papagiannopoulos, G.A.; Hatzigeorgiou, G.D.; Beskos, D.E. An assessment of seismic hazard and risk in the islands of Cephalonia and Ithaca, Greece. Soil Dyn. Earthq. Eng. 2012, 32, 15–25. [Google Scholar] [CrossRef]
- Faizah, R.; Amaliah, R.R. Comparative study of Indonesian spectra response parameters for buildings according to 2012 and 2019 seismic codes. Int. J. Integr. Eng. 2021, 13, 168–175. [Google Scholar] [CrossRef]
- Avcil, F.; Işık, E.; Büyüksaraç, A. The effect of local soil conditions on structure target displacements in different seismic zones. Gümüşhane Üniv. Fen Bilim. Derg. 2022, 12, 1000–1011. [Google Scholar]
- Wei, B.; Jia, J.; Bai, Y.; Du, X.; Guo, B.; Guo, H. Seismic resilience assessment of bridges considering both maximum and residual displacements. Eng. Struct. 2023, 291, 116420. [Google Scholar] [CrossRef]
- Khanmohammadi, M.; Eshraghi, M.; Behboodi, S.; Mobarake, A.A.; Nafisifard, M. Dynamic characteristics and target displacement of damaged and retrofitted residential buildings using ambient vibration tests following Sarpol-e Zahab (Iran) Earthquake (MW 7.3). J. Earthq. Eng. 2022, 26, 6015–6041. [Google Scholar] [CrossRef]
- Ghasemi, M.; Zhang, C.; Khorshidi, H.; Zhu, L.; Hsiao, P.C. Seismic upgrading of existing RC frames with displacement-restraint cable bracing. Eng. Struct. 2023, 282, 115764. [Google Scholar] [CrossRef]
- Zhou, P.; Xiong, Z.; Chen, X.; Wang, J. Seismic performance of RC frame structure across the earth fissure based on pushover analysis. Structures 2023, 52, 1035–1050. [Google Scholar] [CrossRef]
- Mazza, F. Damage protection of earthquake resistant structures by means of damped braces. Adv. Eng. Softw. 2021, 160, 103043. [Google Scholar] [CrossRef]
- Harirchian, E.; Jadhav, K.; Mohammad, K.; Hosseini, S.E.A.; Lahmer, T. A comparative study of MCDM methods integrated with rapid visual seismic vulnerability assessment of existing RC structures. Appl. Sci. 2020, 10, 6411. [Google Scholar] [CrossRef]
- Eroglu Azak, T.; Kalafat, D.; Şeşetyan, K.; Demircioğlu, M.B. Effects of seismic declustering on seismic hazard assessment: A sensitivity study using the Turkish earthquake catalogue. Bull. Earthq. Eng. 2018, 16, 3339–3366. [Google Scholar] [CrossRef]
- Bogazici University Kandilli Observatory and Earthquake Monitoring Center (KOERI). Regional Earthquake-Tsunami Monitoring Center (RETMC) Earthquake Data Archive. Available online: http://www.koeri.boun.edu.tr/ (accessed on 7 August 2023).
- GEOFON Data Centre. GEOFON Seismic Network. Deutsches GeoForschungsZentrum GFZ. Seismic Network. 1993. Available online: https://geofon.gfz-potsdam.de/doi/network/GE (accessed on 7 August 2023).
- AFAD (Disaster and Emergency Management Presidency, Republic of Türkiye)—For Strong Ground Motion Records. Available online: https://tadas.afad.gov.tr/ (accessed on 7 August 2023).
- USGS. Earthquake Hazards Program. 2023. Available online: https://earthquake.usgs.gov/ (accessed on 7 August 2023).
- Hancılar, U.; Şeşetyan, K.; Çaktı, E.; Yenihayat, E.Ş.N.; Malcığlu, F.S.; Dönmez, K.; Tetik, T.; Süleyman, H. Strong Ground Motion and Building Damage Estimations Preliminary Report; Bogazici University: İstanbul, Turkey, 2023; p. 42. [Google Scholar]
- Güllü, H.; Karabekmez, M. Effect of near-fault and far-fault earthquakes on a historical masonry mosque through 3D dynamic soil-structure interaction. Eng. Struct. 2017, 152, 465–492. [Google Scholar] [CrossRef]
- Bedirhanoğlu, İ. Preliminary Assessment Report for The Kahramanmaraş Pazarcik and Elbistan Earthquakes; Civil Engineering Department, Dicle University: Diyarbakır, Türkiye, 2023. [Google Scholar]
- TBEC. Turkish Seismic Earthquake Code; TBEC: Ikeja, Nigeria, 2018; pp. 1–416. Available online: https://www.resmigazete.gov.tr/eskiler/2018/03/20180318M1-2-1.pdf (accessed on 7 August 2023).
- TSC. Turkish Earthquake Code; TSC: Ikeja, Nigeria, 2007; pp. 1–159. Available online: http://www.okangungor.com.tr/wp-content/uploads/2013/05/2007-Turkish-Earthquake-Code.pdf (accessed on 7 August 2023).
- EN 1998-1:2004; Eurocode 8: Design of Structures for Earthquake Resistance. Part 1: General Rules, Seismic Actions and Rules for Buildings. European Committee for Standardization (CEN): Brussels, Belgium, 2004.
- Chopra, A.K.; Goel, R.K.A. Modal pushover analysis procedure for estimating seismic demands for buildings. Earthq. Eng. Struct. Dyn. 2002, 31, 561–582. [Google Scholar] [CrossRef]
- Oğuz, S. Evaluation of Pushover Analysis Procedures for Frame Structure. Master’s Thesis, Middle East Technical University, Ankara, Türkiye, 2005. [Google Scholar]
- Krawinkler, H.; Seneviratna, G.D.P.K. Pros and cons of a pushover analysis of seismic performance evaluation. Eng. Struct. 1998, 20, 452–464. [Google Scholar] [CrossRef]
- Papazafeiropoulos, G.; Plevris, V. Kahramanmaraş—Gaziantep, Türkiye Mw 7.8 Earthquake on 6 February 2023: Strong ground motion and building response estimations. Buildings 2023, 13, 1194. [Google Scholar] [CrossRef]
- Güler, K.; Celep, Z. On the general requirements for design of earthquake resistant buildings in the Turkish Building Seismic code of 2018. In IOP Conference Series: Materials Science and Engineering; IOP Publishing: İstanbul, Turkey, 2019. [Google Scholar]


Disclaimer/Publisher’s Note: The statements, opinions and data contained in all publications are solely those of the individual author(s) and contributor(s) and not of MDPI and/or the editor(s). MDPI and/or the editor(s) disclaim responsibility for any injury to people or property resulting from any ideas, methods, instructions or products referred to in the content. |
© 2023 by the author. Licensee MDPI, Basel, Switzerland. This article is an open access article distributed under the terms and conditions of the Creative Commons Attribution (CC BY) license (https://creativecommons.org/licenses/by/4.0/).