1. Introduction
In recent years, urban bike-sharing has undergone significant development and has emerged as a prominent sustainable and convenient mode of transportation in cities globally [
1]. The rapid expansion of urban bike-sharing programs has resulted in a substantial increase in the proliferation of bike-sharing stations and users [
2]. This expansion has yielded positive effects, encompassing the reduction of traffic congestion, curbing carbon emissions, fostering healthier lifestyles, and affording urban residents access to affordable and adaptable transportation alternatives [
3]. Nonetheless, concomitant with the widespread adoption of bike-sharing systems, an array of challenges and concerns have surfaced, impinging on their operational efficiency and overall efficacy. These challenges encompass imbalanced bike distribution among stations, the overutilization of popular stations leading to bike shortages, incomplete coverage within specific communities, as well as considerations concerning bike maintenance and parking [
4,
5]. As a nascent manifestation of internet-based transportation, bike-sharing systems are conventionally furnished with positioning devices capable of real-time location recording, thereby furnishing an abundance of invaluable data amenable to analysis [
6]. To surmount these challenges and optimize bike-sharing systems, a multitude of investigations have concentrated on comprehending the behavior and patterns characterizing bike-sharing travel. Within this context, the present study aims to comprehensively investigate the clustering characteristics and patterns of bike-sharing travel within the urban core sub-regions, utilizing an established foundation of existing research. Employing spatial interaction network analysis techniques, this study delves into the travel patterns of bike-sharing during the morning and evening peak hours. The ultimate objective is to provide recommendations for urban transportation planning, bike-sharing operations, and residents’ travel preferences.
The utilization of bike-sharing among urban residents has resulted in diverse levels of spatial interactions spanning various areas within the city, constituting what is termed as spatial interactions [
7]. The scrutiny of this phenomenon is approached by constructing a spatial interaction network encompassing urban zones, grounded in the principles of complex network theory [
8,
9,
10]. The realm of network science has undergone rapid advancements since the 1970s [
11]. As posited by the complex network theory, individuals’ travel behaviors between regions can be harnessed to establish a prototypical two-dimensional weighted spatial network, recognized as the spatial interaction network. In this network framework, regions are represented as nodes, travel activities as edges, and edge weights denote the magnitude of travel between points, abstracting the overarching travel interactions among all regions. Once the network is meticulously constructed, structural network metrics and statistical models can be applied to qualitatively and quantitatively assess the interplay between travel behavior and regions, thereby evaluating the spatial interconnections between these regions. Numerous researchers have harnessed the tenets of complex network theory for relevant inquiries. To illustrate, Beck et al. devised a bicycle network to probe the interrelationship between environmental characteristics and cycling behavior [
12]. Liu et al. evaluated the accessibility of dockless bike-sharing from a network vantage point, proffering decision-making support for urban planners, policymakers, and bike-sharing providers to fine-tune bike-sharing systems [
13]. Hu et al. delved into the travel patterns of bike-sharing by constructing a spatial interaction network and juxtaposed the disparities between weekdays and weekends [
14]. While prior investigations have predominantly centered around comprehensive analyses and examinations of bike-sharing travel patterns, scant research has ventured into the clustering characteristics and systematic attributes of bike-sharing travel regions. To bridge this research lacuna, this study leverages community detection methodologies rooted in complex network theory to scrutinize the clustering attributes of bike-sharing travel regions, subsequently investigating clustering patterns grounded in modularity analysis.
Community structure is an essential and distinctive feature within the realm of complex networks [
15]. Investigating and discerning community structures from a network-oriented perspective facilitates an in-depth comprehension of the clustering patterns inherent in the network. This process, in turn, unveils the intricate interconnections interwoven among distinct sub-regions within urban environments, thereby unraveling the intricate tapestry of travel patterns. Such an investigation holds profound ramifications for the judicious deployment of bike-sharing initiatives, the efficacy of urban transportation management, and the formulation of strategic travel plans for urban inhabitants. Within the intricate fabric of complex network theory, the subject of community detection has enjoyed a longstanding position of prominence [
16]. In the context of urban settings, a multitude of scholars have embarked on probing the spatiotemporal clustering phenomena through the prism of community identification methodologies. For instance, the work of Chen W and Wei C leverages the Infomap algorithm to delineate urban agglomerations and economic regions within city networks [
17,
18]. Fangyu and colleagues advance the field by harnessing an improved BBO algorithm, specifically tailored to unearth community structures inherent in intelligent city network systems [
19]. Similarly, Gao P et al. harness the efficacy of the fast greedy algorithm to partition functional domains within the urban agglomeration of the middle reaches of the Yangtze River [
20]. Parallel to these methodologies, a cadre of classic community detection algorithms, such as the GN algorithm [
21], the Label Propagation Algorithm (LPA) [
22], the Louvain algorithm [
23,
24], and the Walktrap algorithm [
25,
26], stand as cornerstone tools for such research endeavors. Nonetheless, despite these scholarly advancements, the existing landscape of community detection research predominantly gravitates towards urban agglomerations, leaving a perceptible gap in our understanding of community clustering dynamics within the nucleus of cities’ core functional regions. The core areas within urban centers constitute vital components that prominently reflect urban characteristics. Presently, numerous urban planning and transportation studies have designated the urban core regions as focal points of their investigations [
27,
28,
29,
30]. This underlines the pressing need for studies that uncover and elucidate community structures within these essential urban zones.
Furthermore, the classification of urban traffic based on its temporal distribution yields distinct categories: daily traffic (weekday traffic), weekend traffic, and other types of traffic [
31]. Among these categories, weekdays stand out as a prominent temporal segment characterized by an extensive duration, a significant volume of travel, and pronounced travel attributes, thus warranting the highest degree of attention and research scrutiny [
32]. Investigating weekday traffic bears the potential to yield a profound comprehension of urban residents’ habitual travel behaviors and travel patterns. The morning and evening peak hours on weekdays exhibit the most concentrated travel flow within a day. This heightened concentration of travel during peak periods imparts distinct characteristics to travel patterns, rendering them more reflective of actual travel behaviors. Consequently, these patterns hold significant research implications and value. Within this particular traffic category, individuals often confront a myriad of tasks, including work, education, and shopping, resulting in a complex and dynamic interplay of demands and usage patterns within the transportation system [
33]. A substantial body of research has already unveiled the peak travel times [
34], primary travel attributes [
35], and popular travel destinations [
36] associated with weekday traffic. These research findings form pivotal cornerstones for urban transportation planning and management, offering crucial underpinnings to alleviate congestion, enhance transportation efficiency, and ameliorate the overall travel experience of urban inhabitants [
37].
Currently, urban vitality research extensively employs multi-source urban data, yet the analysis units often revolve around blocks or parcels. However, residents’ economic, social, and cultural activities primarily congregate around streets and their proximate areas [
38]. By evaluating the urban vitality of streets, the quality of urban streets can be enhanced, thereby infusing urban areas with vibrancy and livability, fostering organic urban renewal and driving sustainable development [
39]. In this study, streets are adopted as the fundamental analytical units, and the travel OD flow of shared bicycles between streets during morning and evening peaks is extracted and distributed. The Walktrap community detection algorithm is employed to explore street clustering characteristics, and an analysis and summary of clustering patterns are conducted based on modularity changes. Furthermore, a comparative analysis of the differences between the morning and evening peak periods is undertaken. By employing streets as the analytical units, the study aims to reveal the intricate spatial patterns of shared bicycle travel aggregation within streets while identifying correlations between streets and shared bicycle travel. This approach provides recommendations and references for urban transportation planning, shared bicycle operations, and residents’ travel choices [
39,
40].
The remainder of this paper is organized as follows.
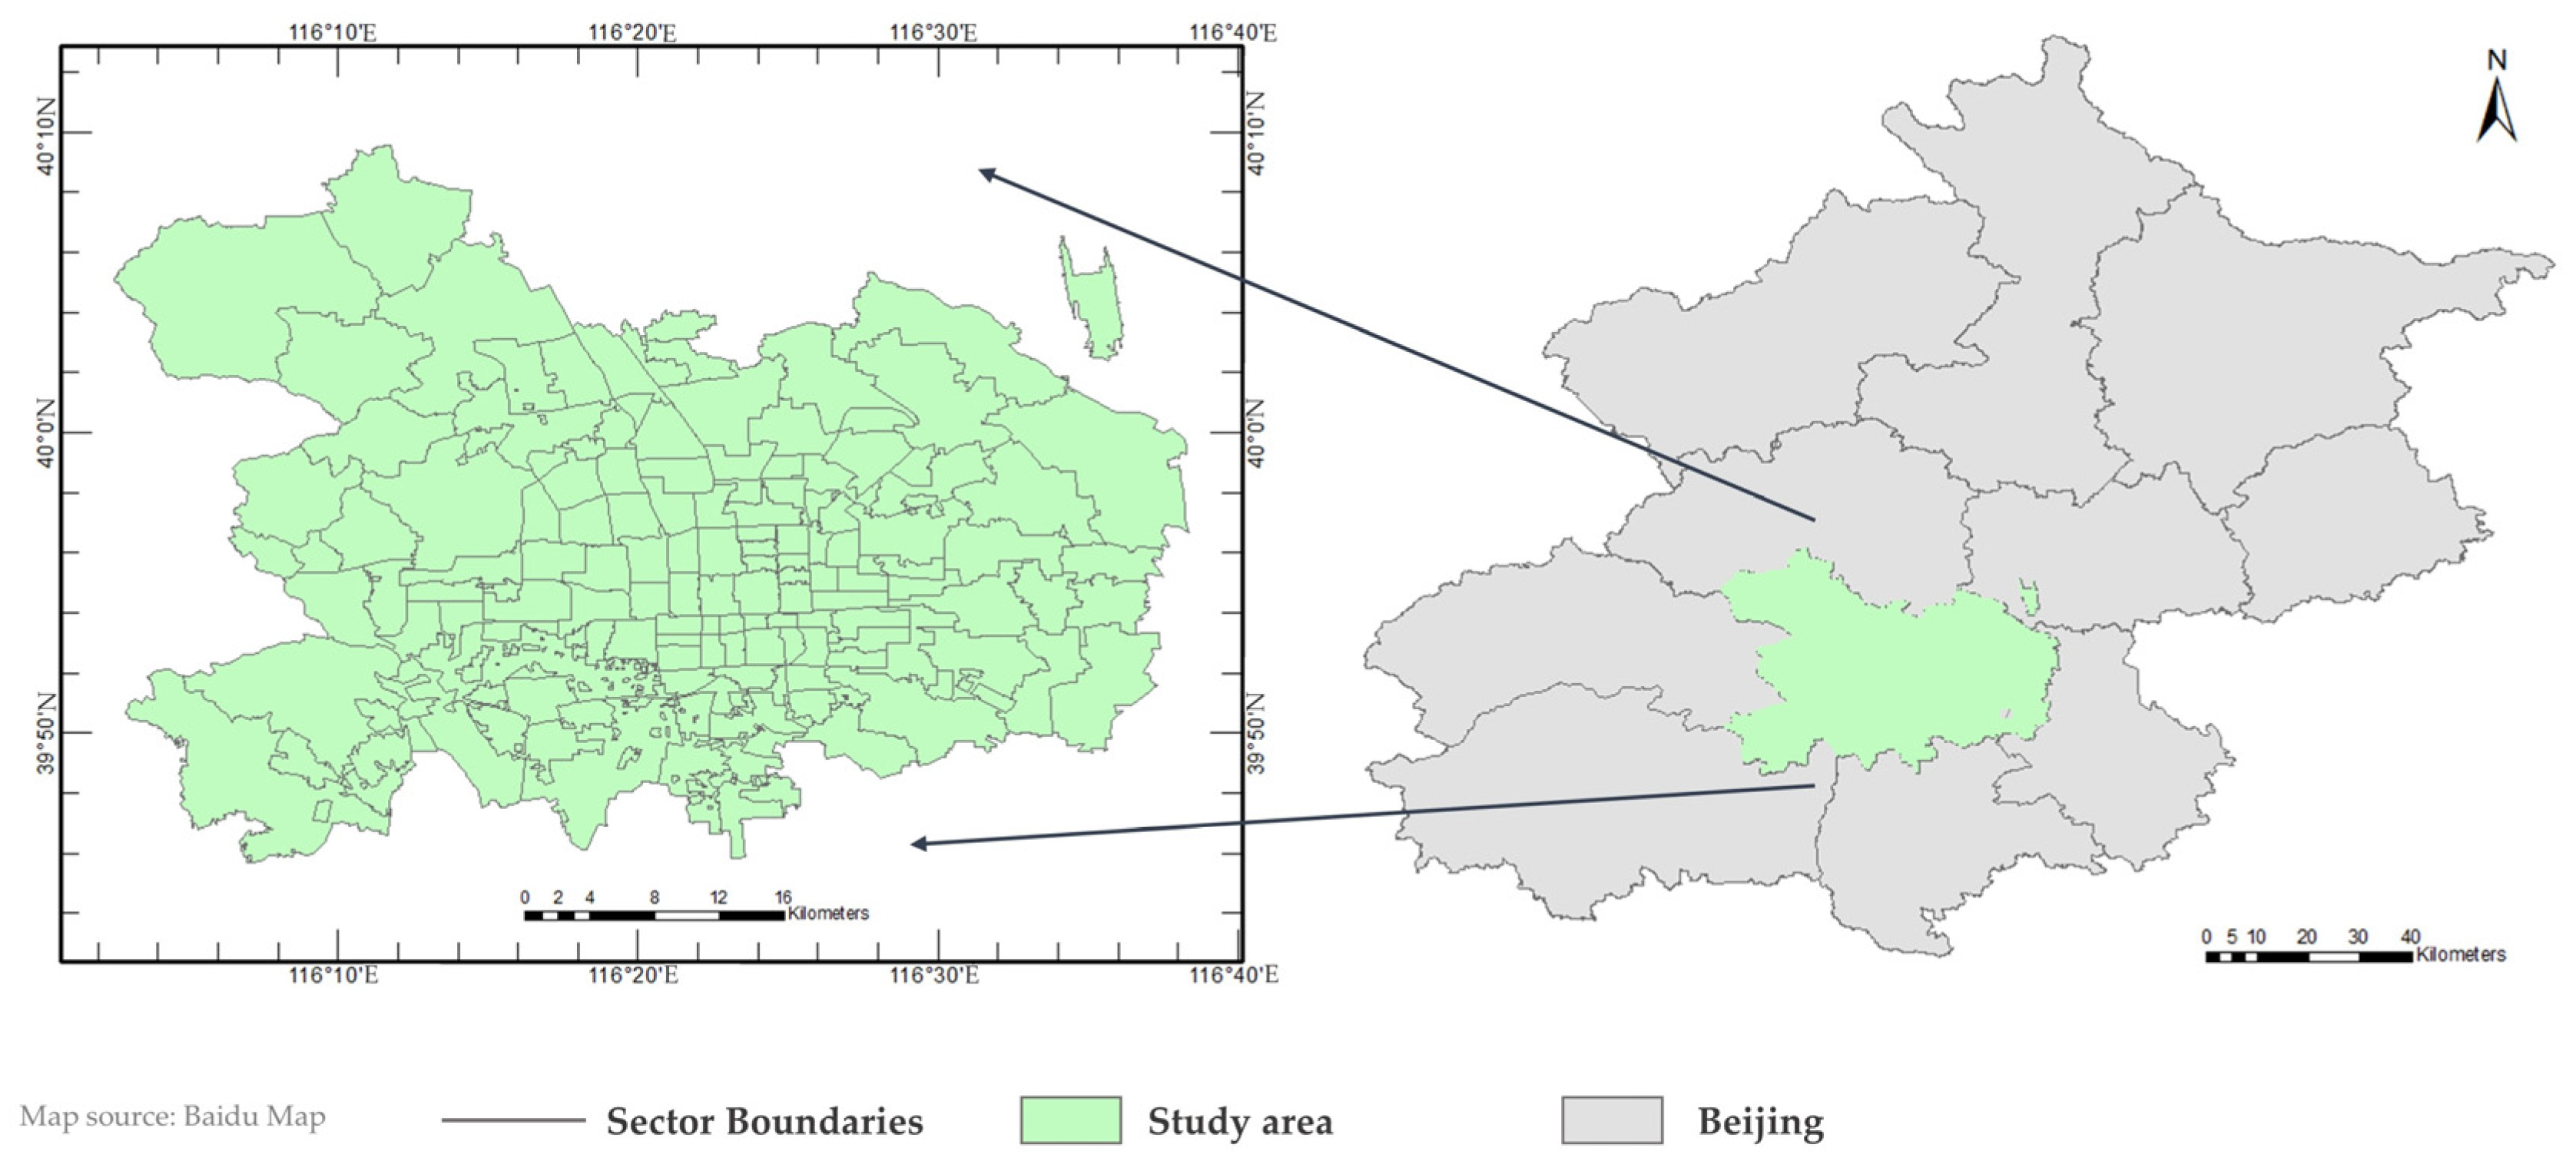
Section 2 describes our study area and data.
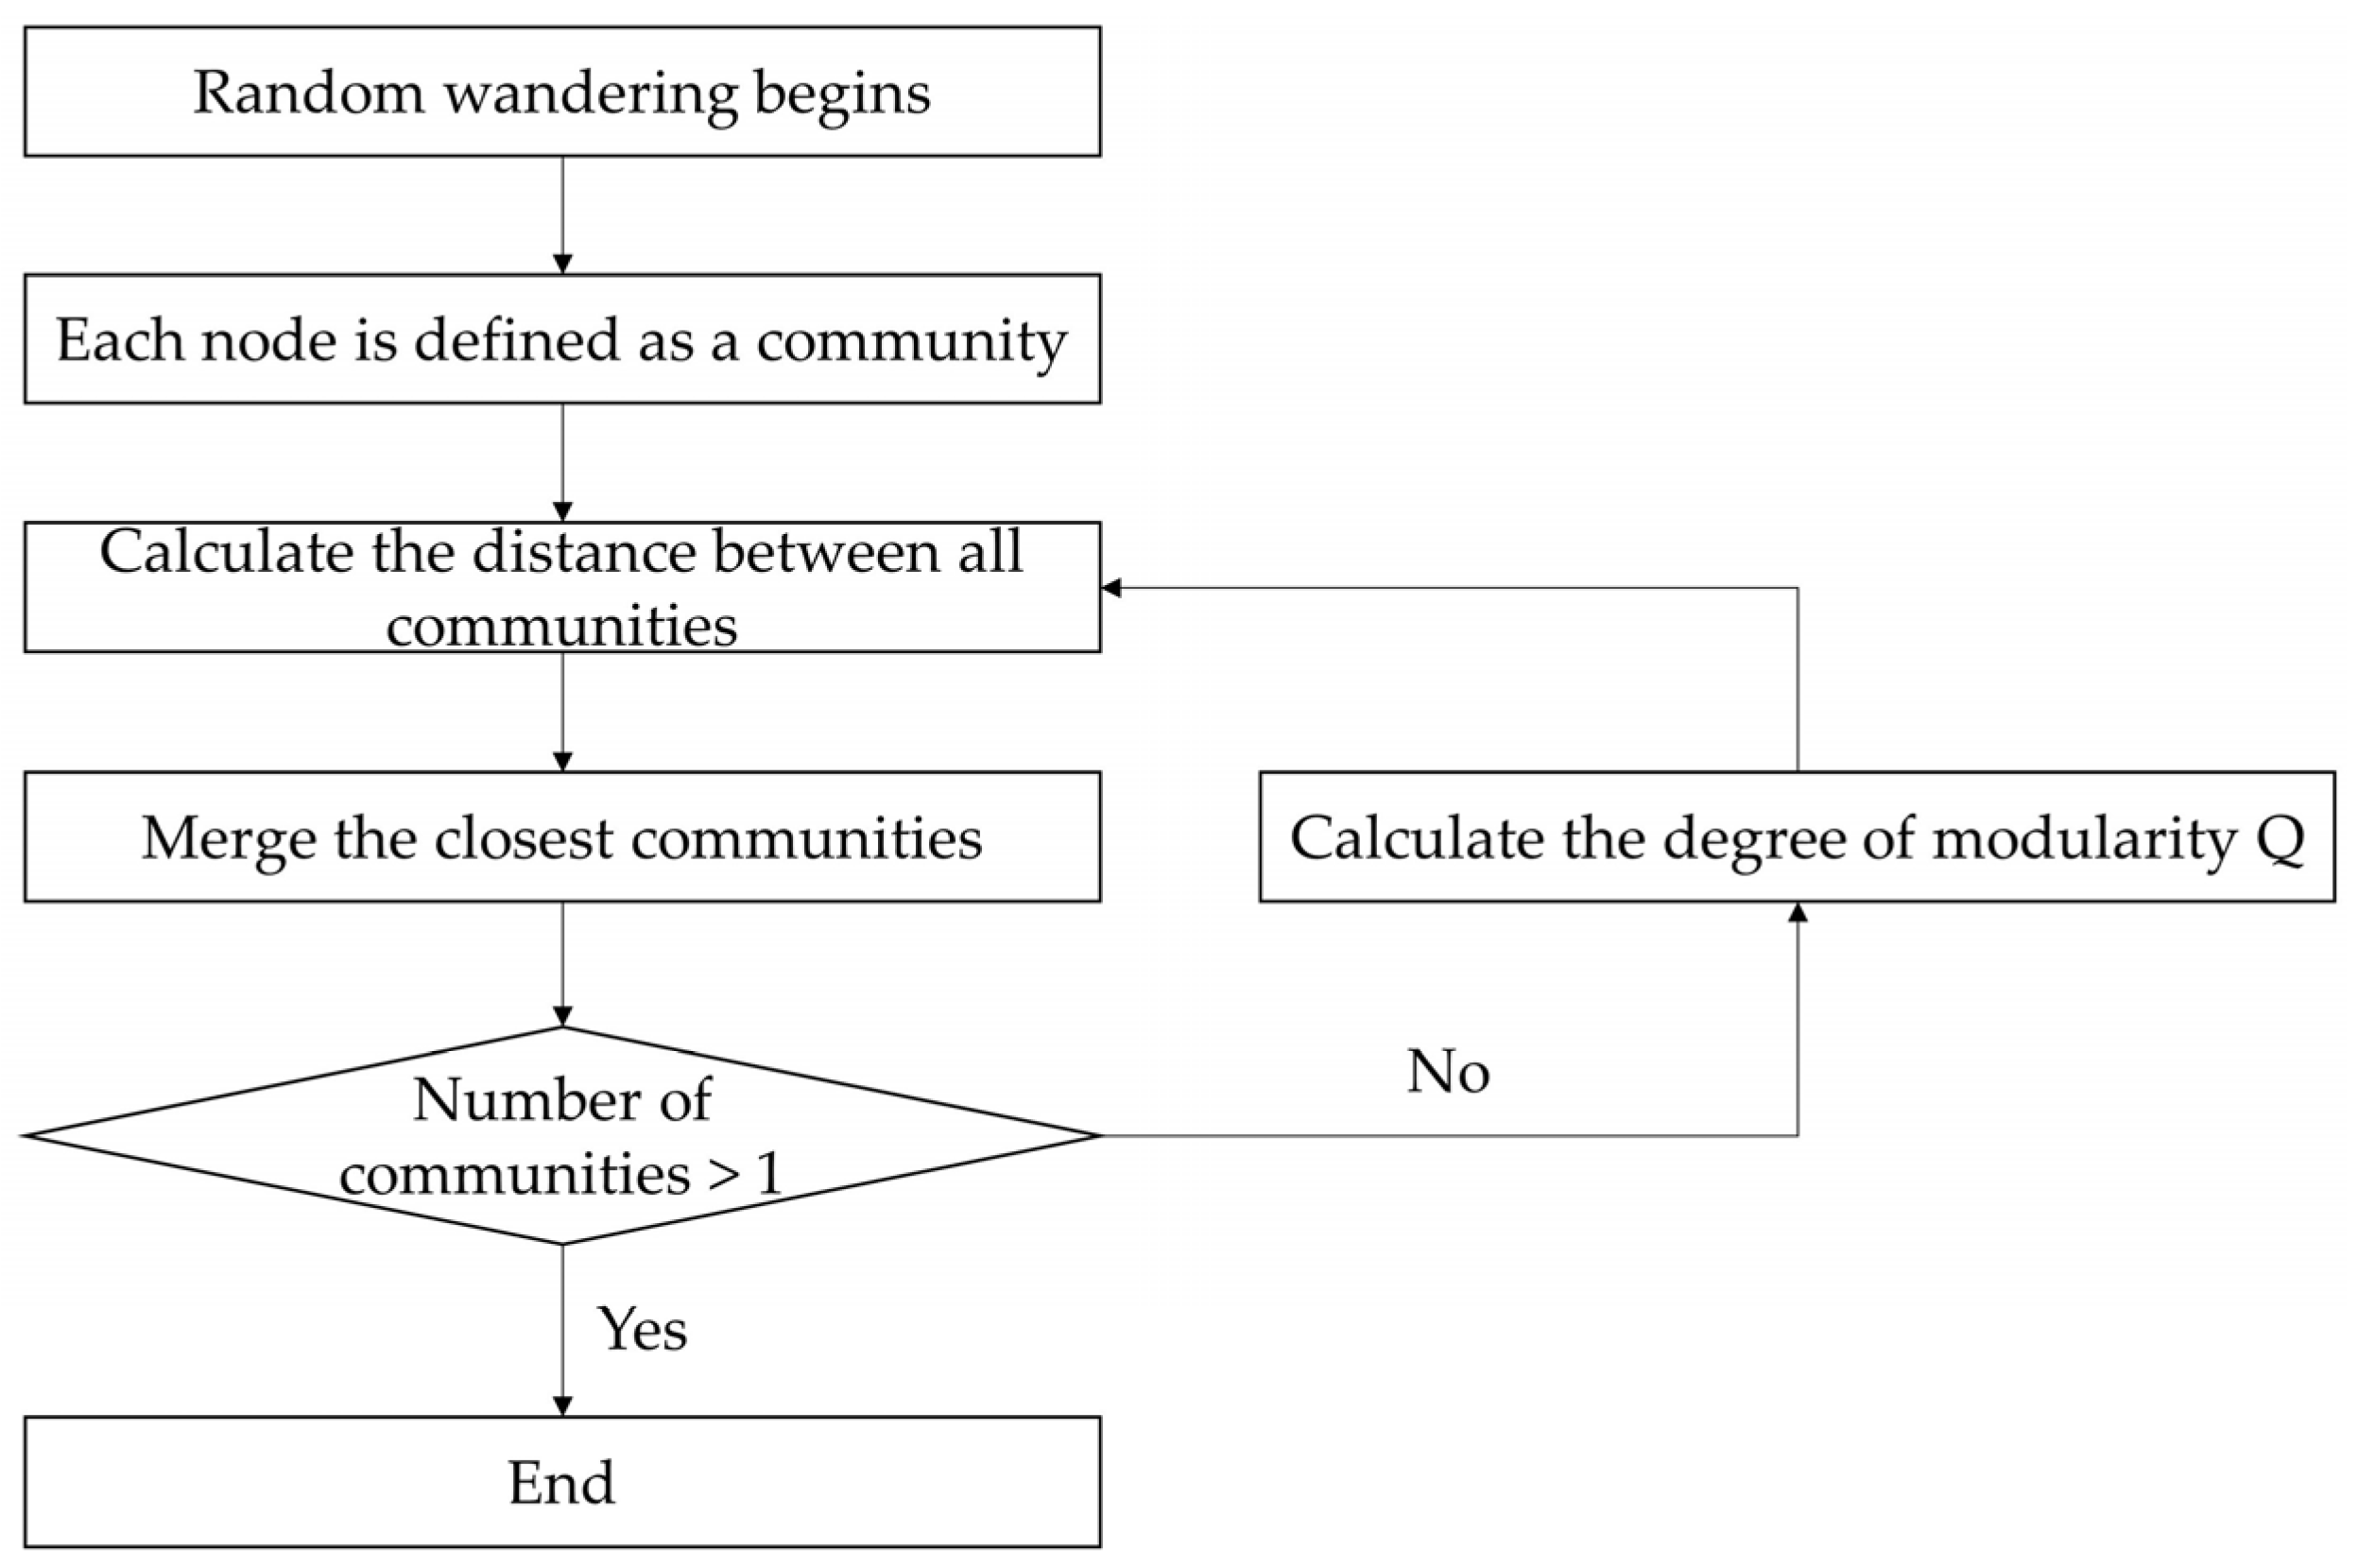
Section 3 introduces the Walktrap community detection algorithm and the steps for modularity analysis.
Section 4 explores the regional clustering characteristics and patterns from the perspective of urban bike-sharing travel during the morning and evening peak hours.
Section 5 discusses the paper’s findings.
Section 6 provides a concise summary of the paper.
4. Results
4.1. Construction and Analysis of Shared Bicycle Spatial Interaction Networks
The shared bicycle network is represented as a directed weighted network, consisting of three fundamental elements: “nodes,” “directed edges,” and “weights of directed edges”. In this study, the “nodes” are represented by streets within the core area of the capital city. The “directed edges” of the network are defined by travel behavior between streets, indicating the direction of bicycle movement. The “weights of directed edges” are determined by the volume of bicycle usage, providing information on the intensity of travel between streets. Firstly, shared bicycle data for departure and arrival times were initially acquired and subsequently converted into SHP format. Following this, the streets where the bicycles were located were determined by spatially intersecting the data with administrative district data. Subsequently, by utilizing unique ID numbers, the shared bicycle data for departure and arrival times were linked, thereby providing the starting and ending street information for each bicycle. Lastly, trips with identical starting and ending points were aggregated, resulting in a collection of travel information organized by street as travel nodes.
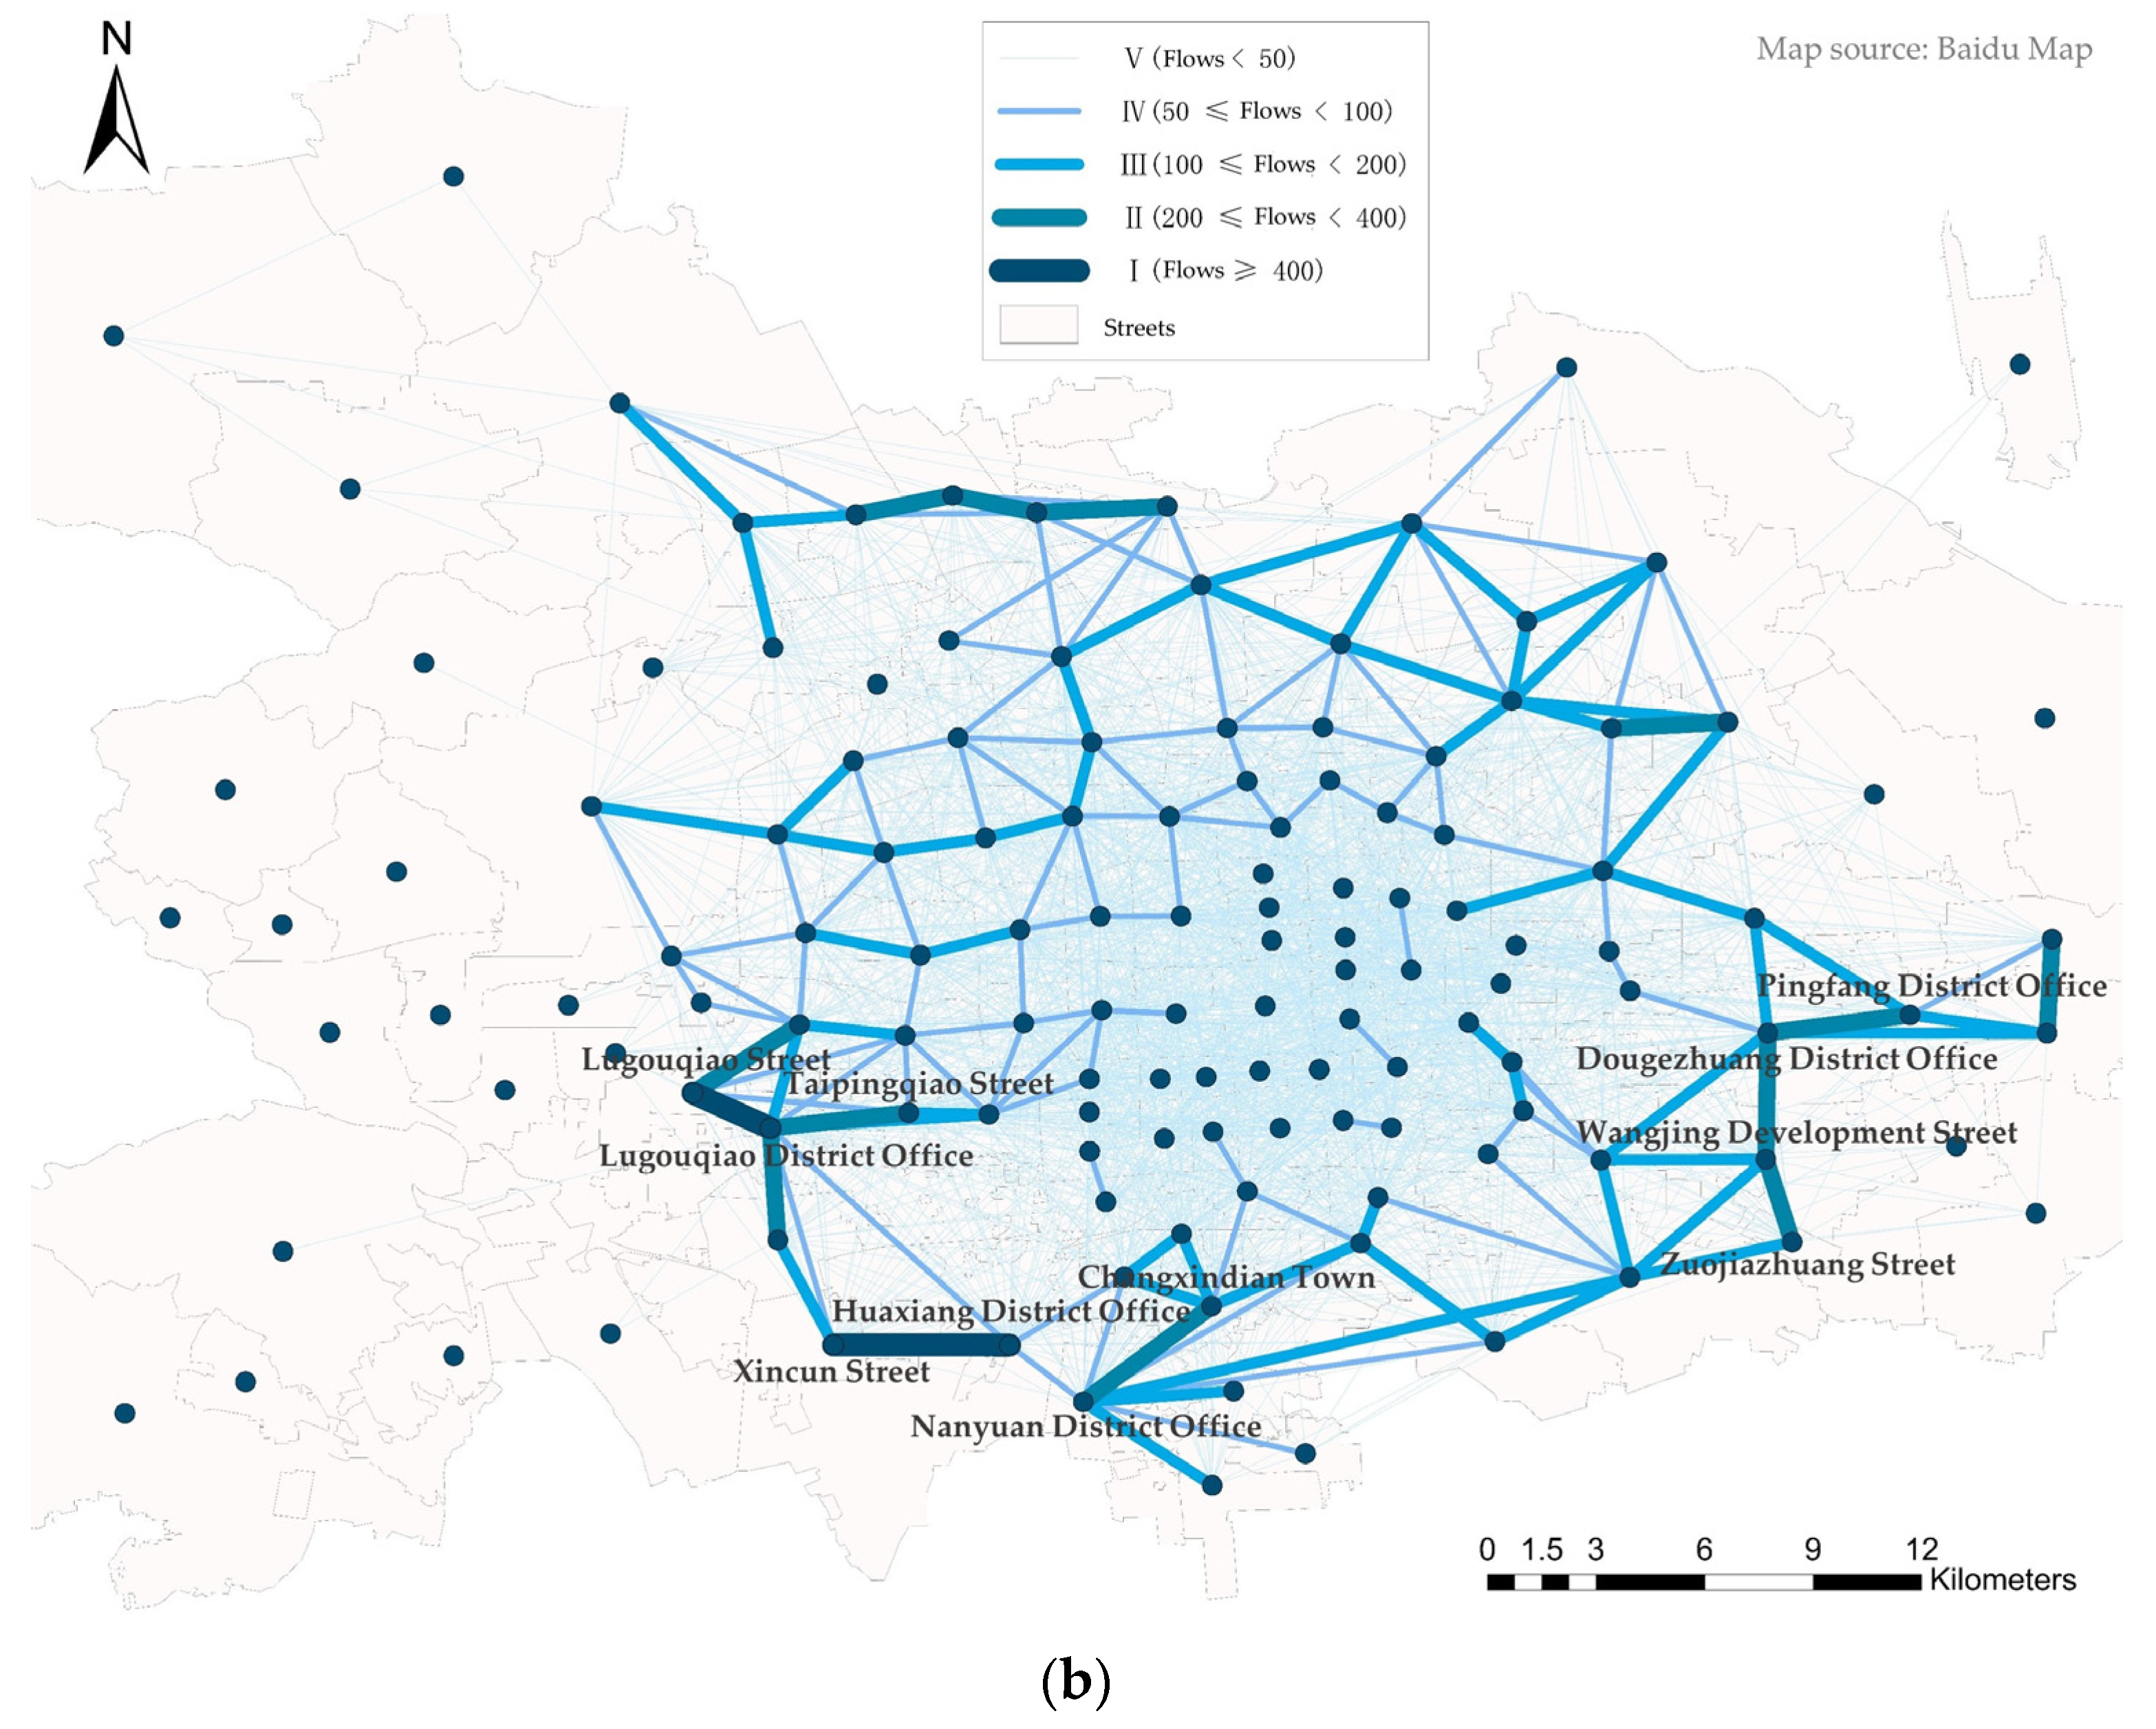
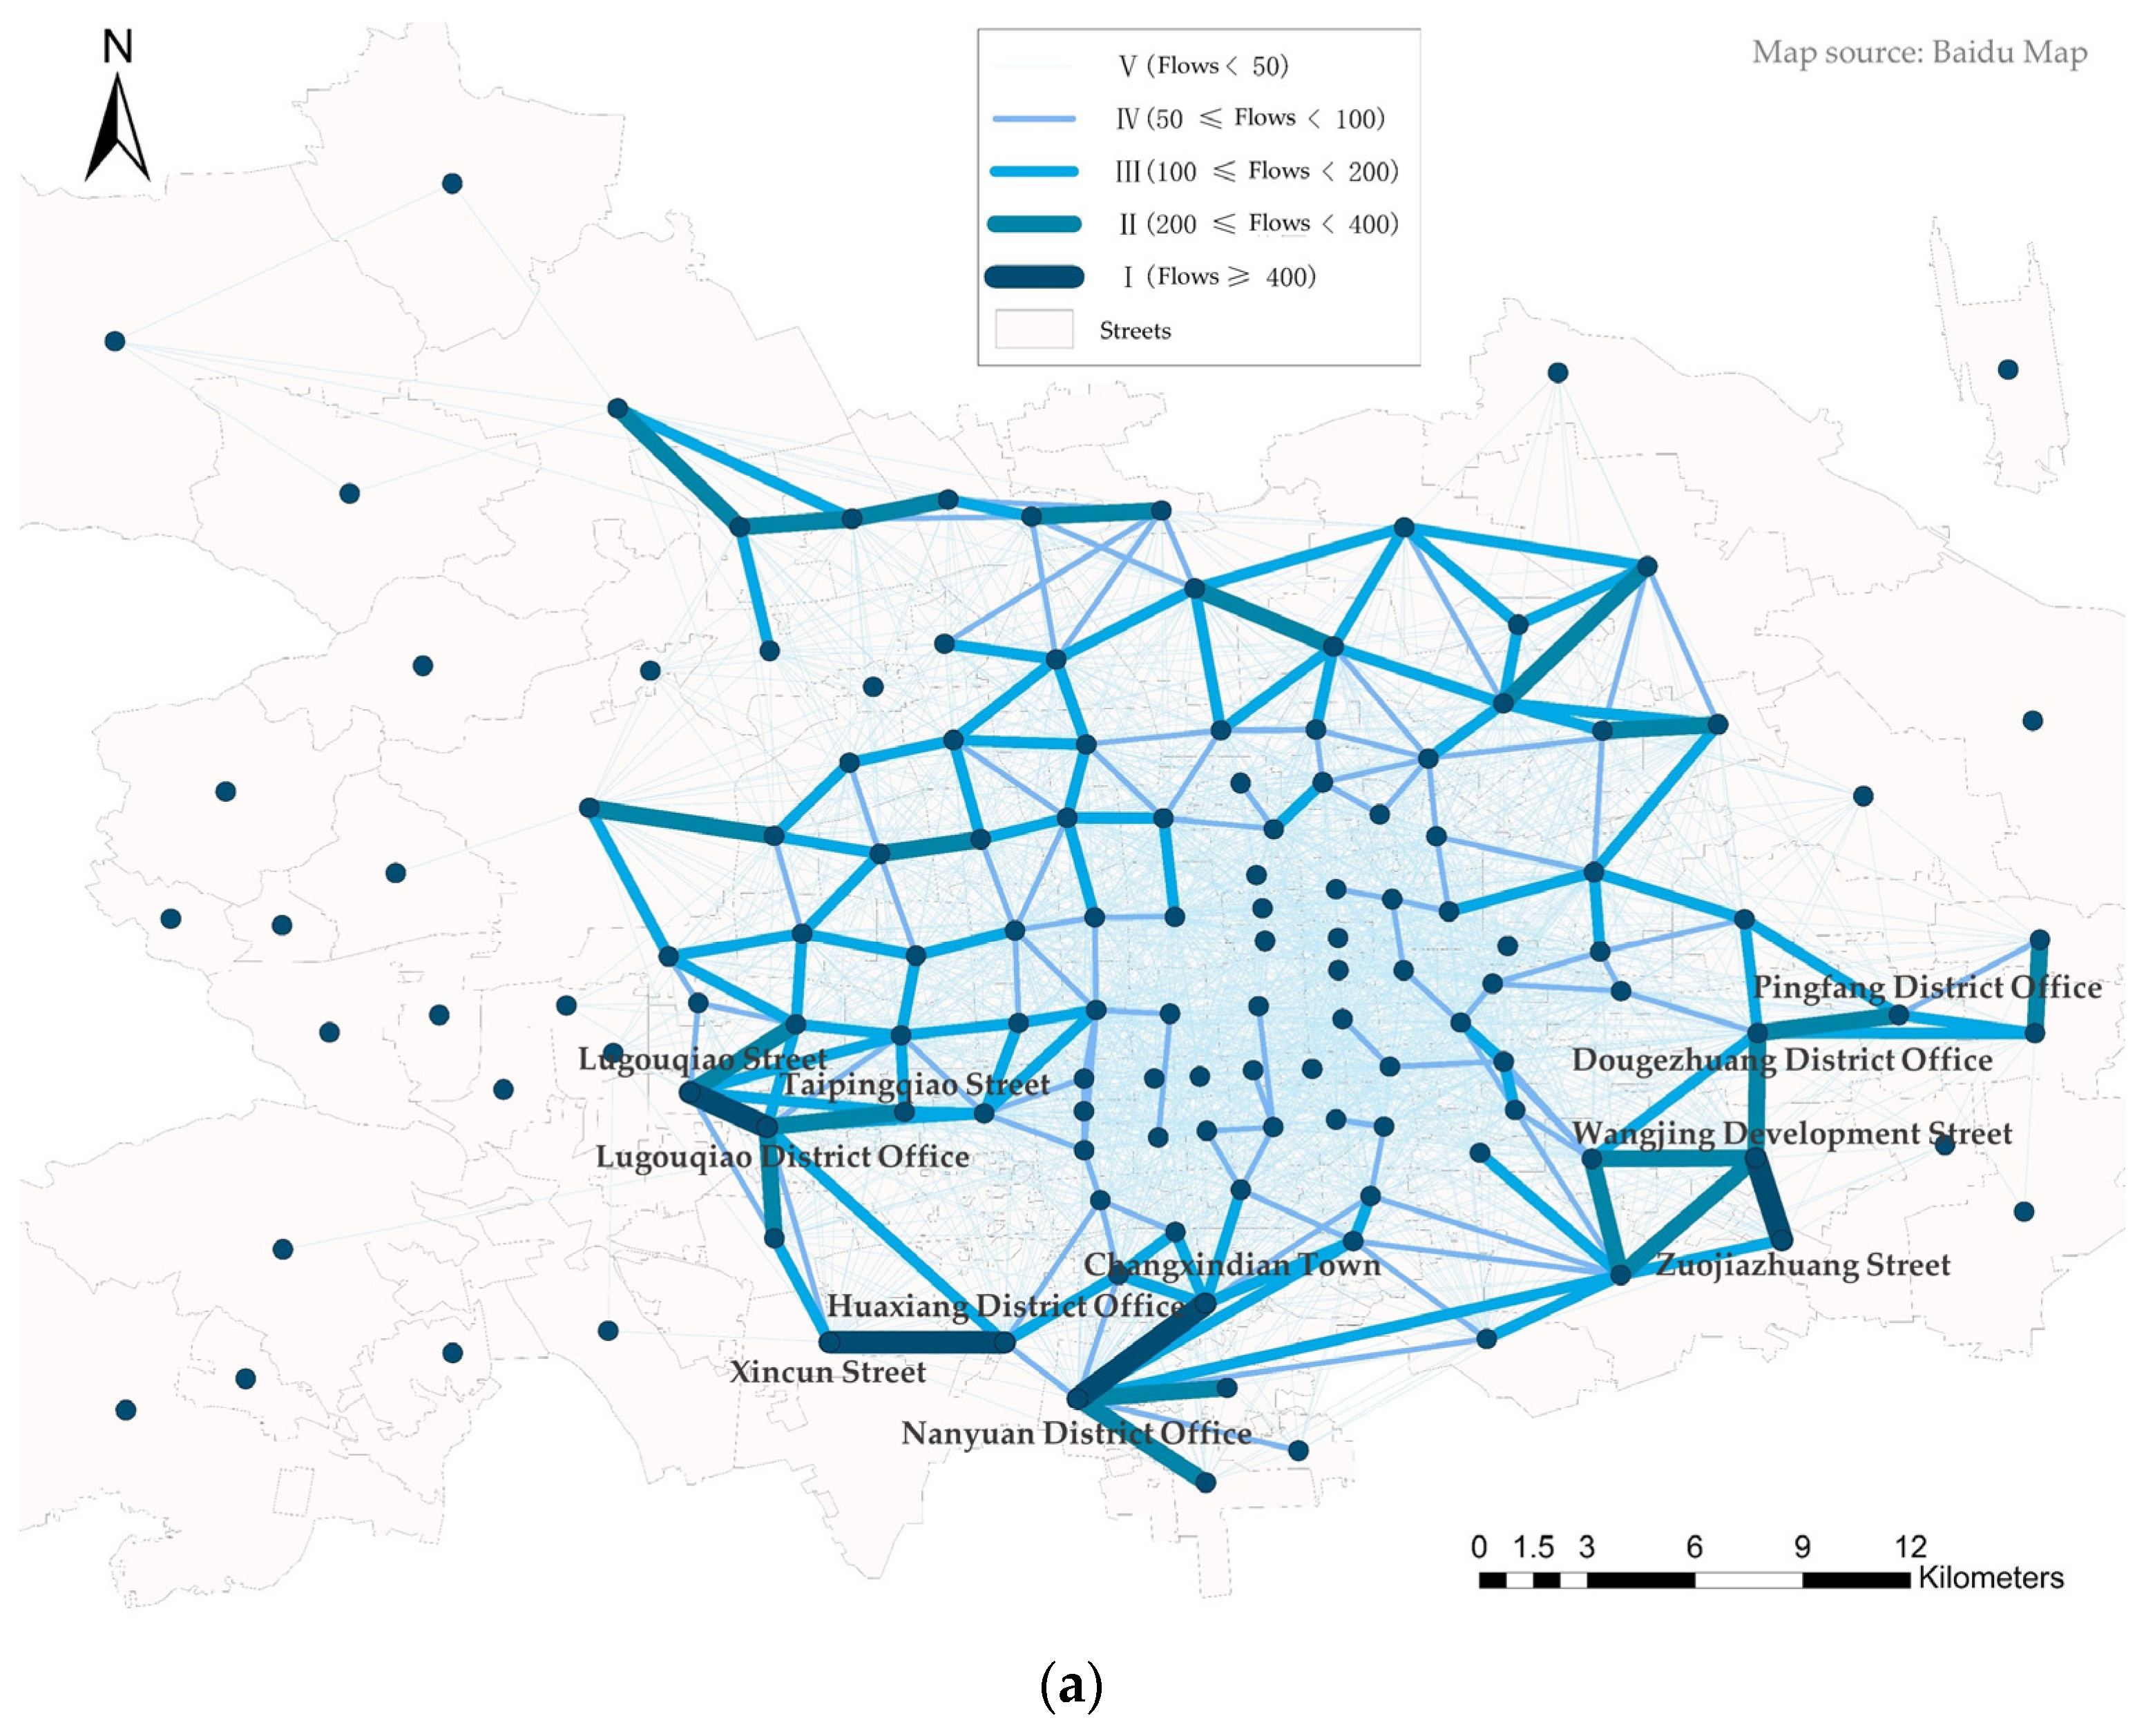
According to the principle of network construction, the shared bicycle travel network is built based on data from two different periods: the morning peak and the evening peak. To construct the spatial interaction network for the core area of the capital, we employed ArcGIS 10.8 software for network visualization (
Figure 4). The network consists of 135 nodes, with each node representing a street block.
Figure 4 illustrates the differences in network structures between the morning peak and the evening peak, where flow strength is represented by the thickness of the edges: the wider the blue lines, the higher the flow strength, while narrower blue lines indicate weaker flow strength. This representation method provides an intuitive depiction of traffic volume, facilitating the analysis of travel characteristics and patterns.
Table 2 provides information on the origin and destination of the top travel activities with high flow volume during the morning and evening peaks.
Based on the information obtained from
Figure 4 and
Table 2, several characteristics of the travel network can be summarized. Firstly, during both morning and evening peak hours, a significant portion of the shared bicycle trips takes place between adjacent street blocks, suggesting that shared bicycles are predominantly utilized for short-distance travel within the study area. Secondly, the flow of trips shows a concentration in specific areas, with notable travel activities observed between certain street blocks. For instance, considerable flow occurs between Huaxiang District Office and Xincun Sub-district Office, as well as between Lugouqiao Sub-district and Lugouqiao District Office, during both morning and evening peak periods. Among these, Huaxiang Street Office is a street known for its concentrated residential areas, while Xincun Street accommodates some enterprises and companies. Lugouqiao Sub-district and Lugouqiao District Office, similarly, are two adjacent streets that, respectively, concentrate residential and office areas. These regions appear to be popular destinations or origins for shared bicycle users, leading to intensified bicycle movements between these locations.
There are noticeable differences in the network structure between the morning and evening peak hours. The morning peak exhibits a higher level of flow concentration, with large-flow trips being more tightly clustered. In contrast, the evening peak shows a relatively lower level of flow concentration, and there are only two locations with significant flow. This analysis indicates that the morning peak trips are characterized by a higher level of purposefulness and concentration. The areas with high-flow edges in the network structure during weekdays are often associated with workplaces, indicating that the majority of trips during weekdays are related to commuting. Therefore, the street blocks with high-flow edges tend to be locations with more businesses or employment units, making them prominent destinations for commuters.
On the other hand, during the evening peak, people’s trip destinations exhibit a higher degree of diversity, leading to a more scattered flow pattern. This suggests that people engage in more leisure activities after work, and their travel destinations are more influenced by personal preferences and varied interests. Furthermore, the distribution of workplaces within the study area appears to be more concentrated, while the distribution of residential areas is relatively more dispersed. This spatial pattern may be a reflection of the urban development and land-use characteristics, where workplaces tend to cluster in specific areas, whereas residential areas are more widely distributed.
4.2. Analysis of Modularity Calculation Results
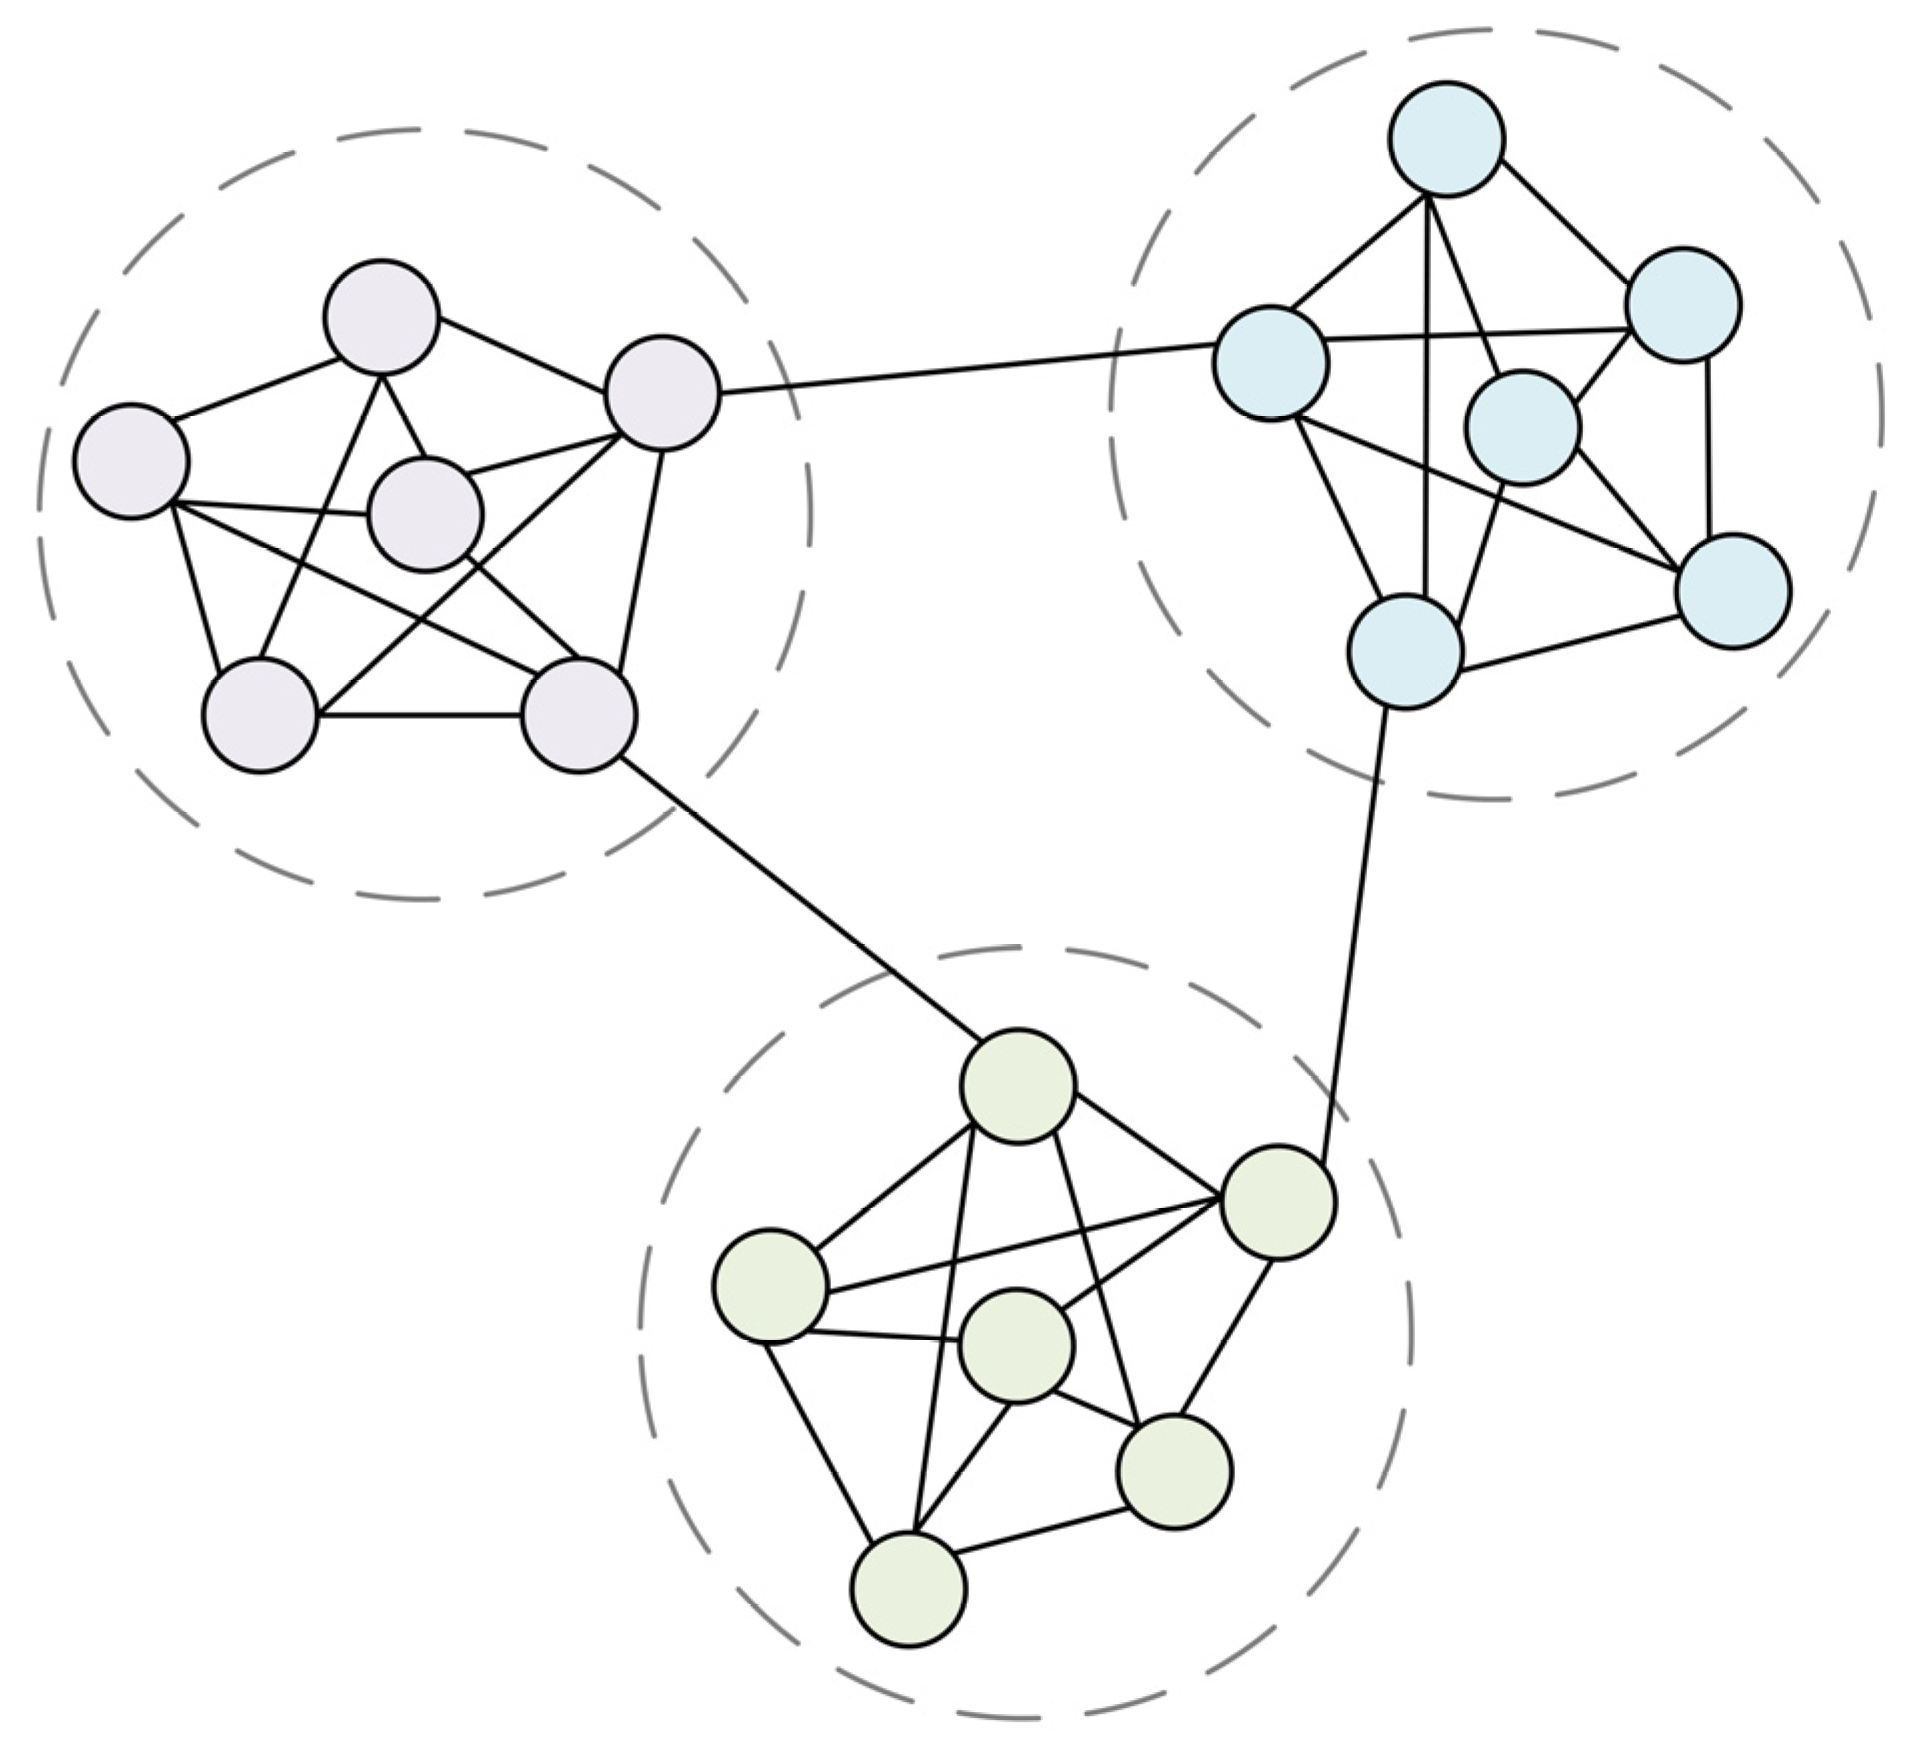
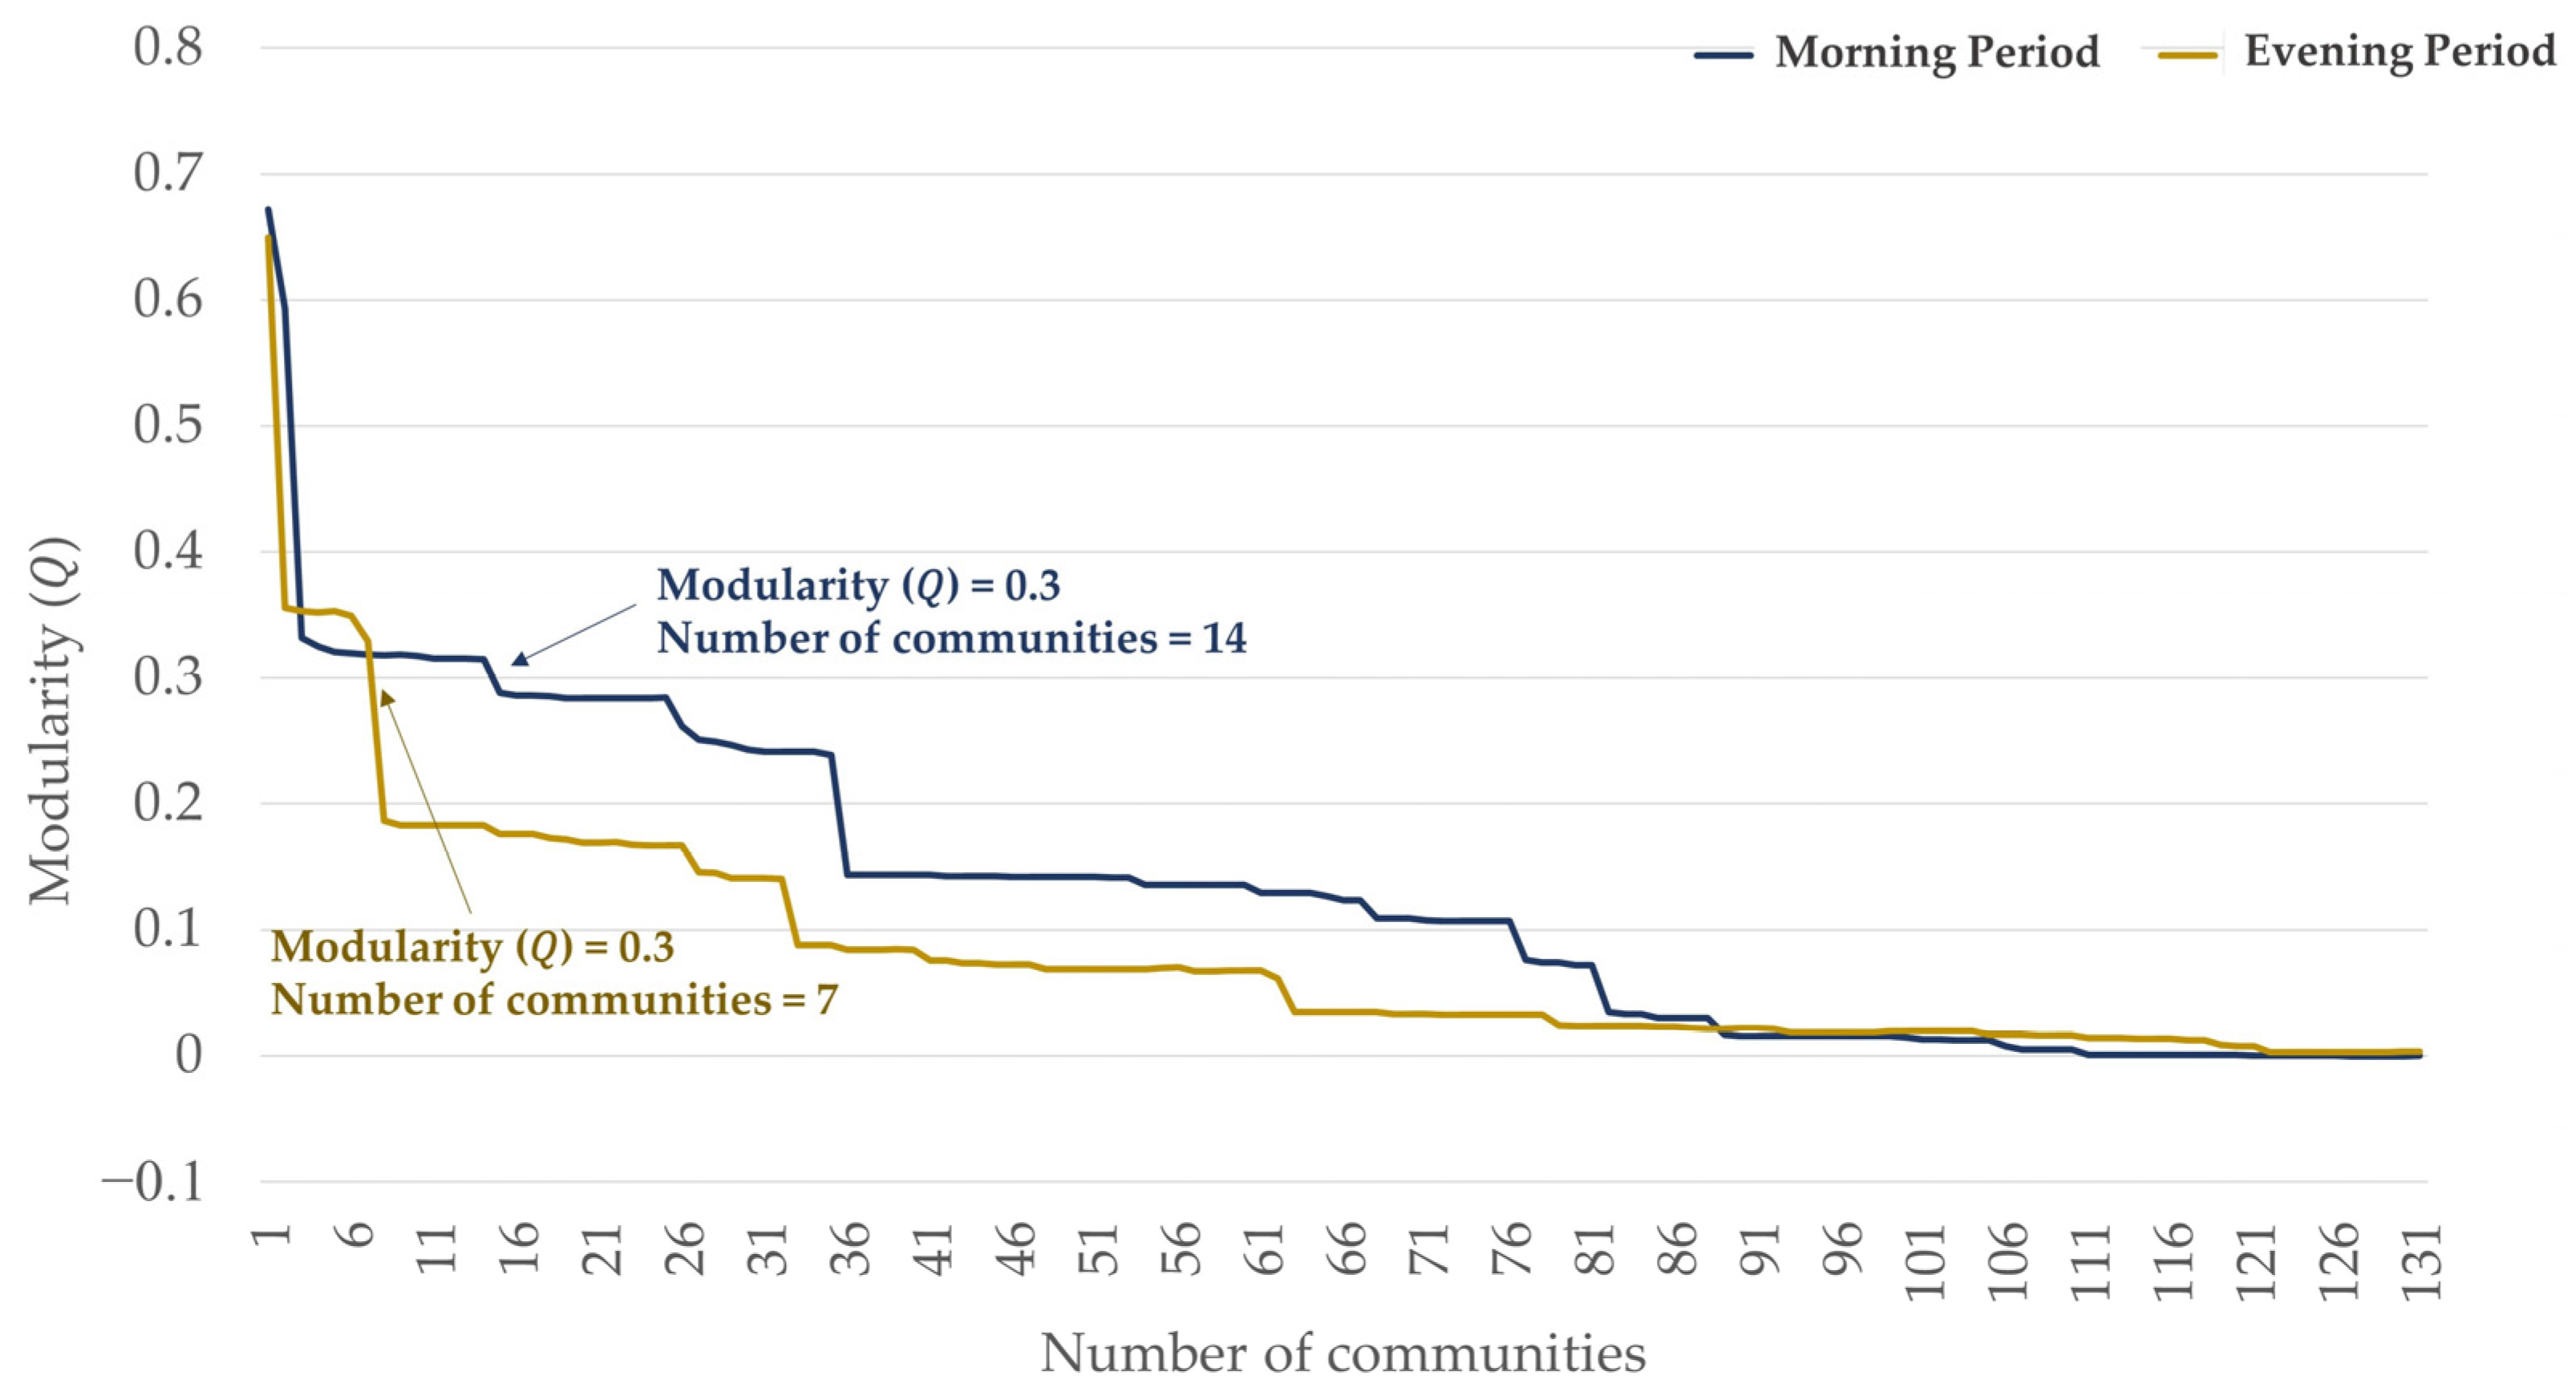
This study investigates the community detection of the spatial interaction network using the Walktrap method based on the concept of random walks. This method effectively groups closely connected nodes into communities, enabling the analysis of inherent relationships between streets. Since modularity can be employed to reflect the quality of the current community detection results, calculating modularity continuously throughout the process of changing the number of communities can intuitively illustrate community aggregation patterns. The evolution of modularity values during the random walk process is computed in this research, as illustrated in
Figure 5. According to the principles of the Walktrap community detection algorithm, the number of communities decreases gradually during the random walk process, eventually resulting in a single community that includes all nodes. The modularity values gradually increase as the number of communities decreases, with the morning period showing a faster increase in modularity compared to the evening period. Specifically, when there are 14 communities, the modularity value for the morning period reaches 0.3, and, when there are 7 communities, the modularity value for the evening period reaches 0.3.
The analysis reveals that the spatial interaction network during the morning period exhibits stronger community structures, indicating a higher level of aggregation between streets. In other words, during the morning period, people tend to travel with more specific purposes between streets within the same community, resulting in a higher volume of intra-community travel and a lower volume of inter-community travel. This finding highlights the significant community structure in the morning period’s spatial interaction network. The Walktrap community detection approach used in this study proves effective in uncovering underlying community structures within the spatial interaction network, shedding light on the characteristics of travel patterns and street connections during different time periods. The results contribute to a better understanding of urban mobility dynamics and can inform targeted urban planning and transportation management strategies.
4.3. Analysis of Community Detection Results
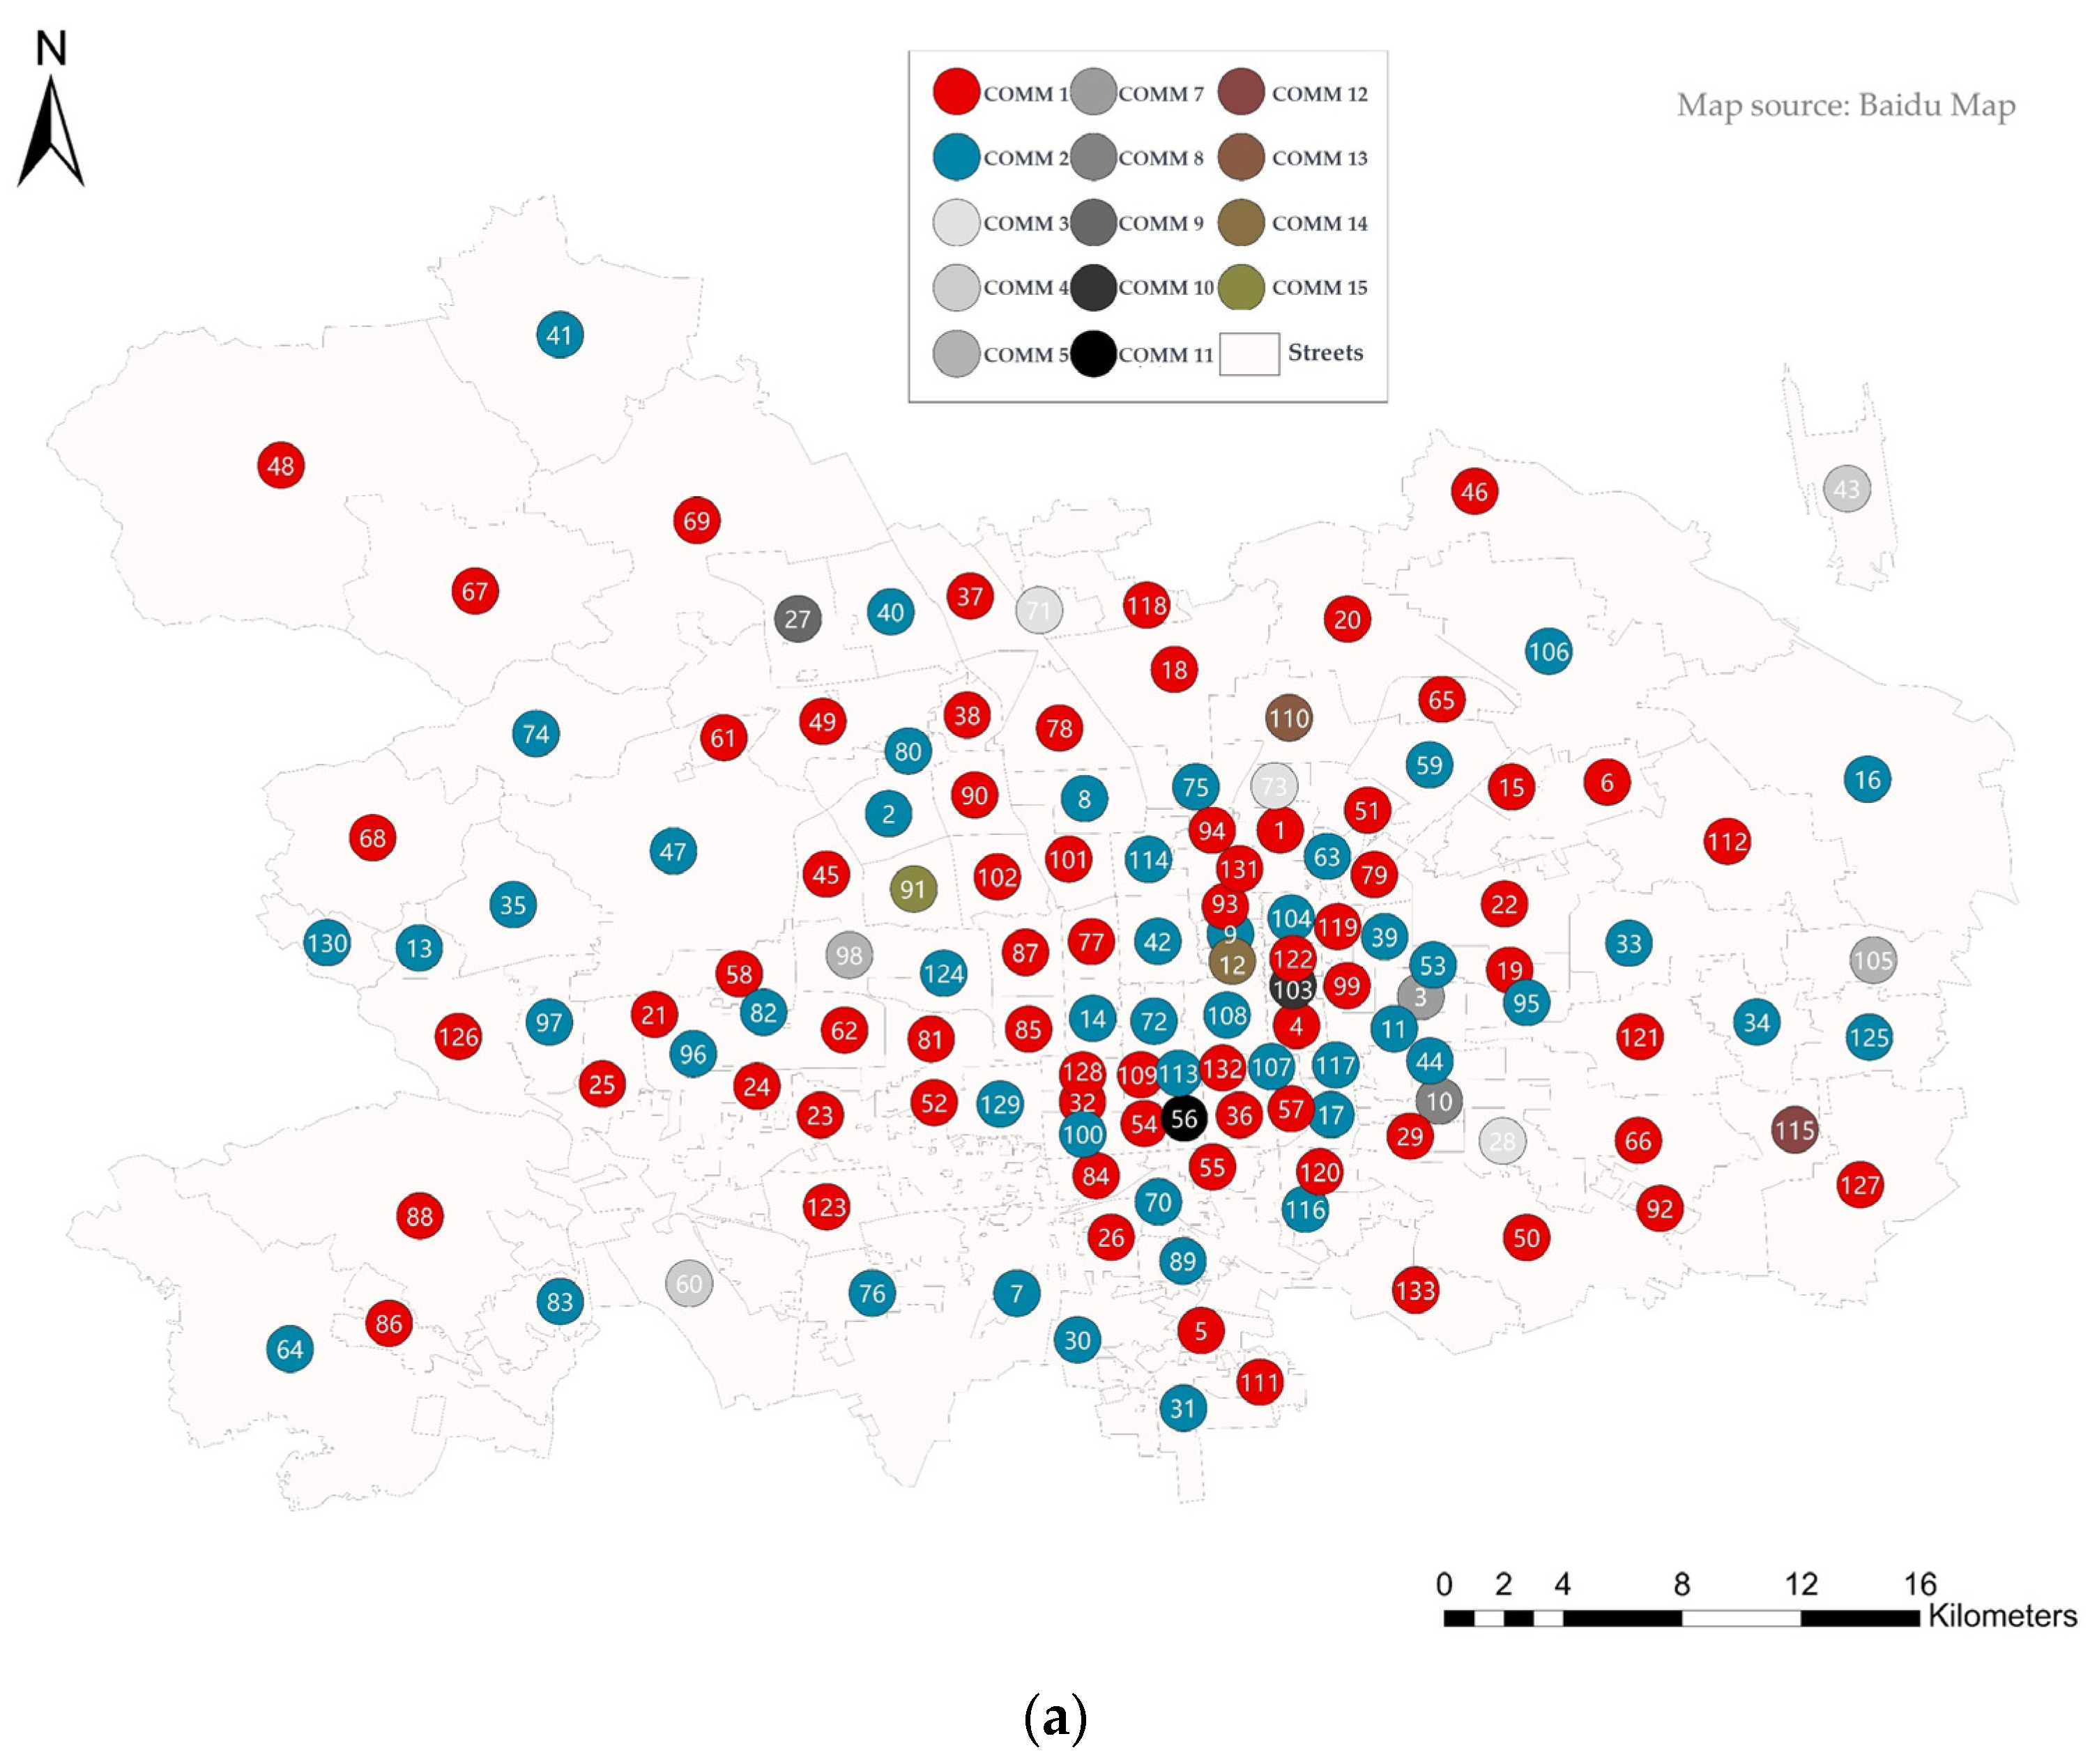
The visualization of the community detection results for 7 and 14 communities is presented in this study.
Table 3 provides information about the number of communities and the corresponding number of streets in each community. The spatial visualization of the results of the community testing is shown in
Figure 6. Within
Figure 6, streets are represented as nodes located at the centers of street clusters, and each node is labeled with a unique street identifier, totaling 135 nodes. Different colors are employed to indicate their respective community affiliations.
Notably, there are significant differences in the community structures between the morning and evening periods. During the morning peak, the spatial interaction network exhibits the formation of two large communities along with multiple small communities (
Figure 6a,b). In contrast, the evening peak reveals the identification of one large community, two medium-sized communities, and several small communities, with the majority of streets belonging to the large community (
Figure 6c).
The results indicate distinct patterns in the spatial distribution of community formations during different time periods. The morning peak shows a more fragmented community structure, with several smaller communities interacting with each other, while the evening peak presents a more integrated community structure, with fewer but larger communities encompassing multiple streets. This finding suggests that travel behaviors and patterns during the morning and evening periods differ significantly, reflecting the varying travel purposes and destinations at different times of the day.
The findings from the community detection analysis reveal characteristics of the spatial interaction network during different time periods. Specifically, during the morning period, the presence of two large communities and several small communities indicates that certain streets have stronger connections and are closely associated with each other. However, the lack of distinct geographical boundaries within these communities suggests that the interactions between streets are not solely determined by their physical proximity. Instead, it is likely influenced by the travel behavior of residents who commute to work areas. The high flow volume between certain street blocks can be attributed to the concentrated movement of commuters between residential and work areas, leading to the formation of cohesive communities.
In contrast, the evening period exhibits a different pattern, with a single large community and a few medium-sized and small communities. Although the communities lack geographical boundaries, there is a higher degree of interconnectivity among the streets compared to the morning period. This suggests that, during the evening, more streets are engaged in reciprocal interactions with each other, leading to a broader range of travel purposes. Leisure and social venues within the study area are characterized by a wide and scattered distribution. The increased diversity in destinations during the evening period indicates that people are engaged in various activities, such as leisure and social engagements, which may result in a more scattered flow of shared bicycle trips.
The longer interaction radius observed in both the morning and evening periods suggests that the influence of certain streets extends over a wider geographical scope. This implies that the spatial interactions between streets are not confined to a limited area but rather encompass larger regions within the study area. The broader scope of interactions has implications for urban planning and transportation management, as it indicates the importance of considering the connectivity between different areas when designing bike-sharing systems and transportation infrastructure.
The Walktrap community detection method proves to be effective in revealing the underlying structure of the spatial interaction network and provides valuable insights into the travel patterns and street connections during different time periods. The observed differences in community detection shed light on the dynamics of urban mobility and the factors influencing travel behavior. The research contributes to a better understanding of urban transportation systems and offers valuable information for optimizing bike-sharing schemes and urban planning strategies.
5. Discussion
Urban streets, when viewed through the lens of bike-sharing, exhibit distinct clustering tendencies and adhere to clustering patterns. By constructing a street-level spatial interaction network from the perspective of bike-sharing, it has been observed that shared bicycles are primarily utilized for short-distance trips within the study area. The flow of trips is concentrated among specific streets, with a higher degree of concentration during the morning peak period compared to the evening peak. This phenomenon may be attributed to the fact that the primary purpose during the morning peak is work commuting, and the streets with concentrated flow are often located near areas with a higher concentration of businesses or employment centers. In contrast, the evening peak exhibits a more diversified set of destinations, as workplaces are more centrally distributed within the urban region while residential areas tend to be more dispersed. Through community detection analysis within the network, it has been revealed that the spatial interaction network exhibits stronger community structure during the morning period, with more dispersed community configurations. Several community clusters interact with each other. Conversely, the evening period demonstrates more cohesive community structures, characterized by fewer but larger communities. Based on the above conclusions, recommendations are provided for urban transportation authorities, bike-sharing companies, and city residents.
For urban transportation authorities: Strengthen traffic flow monitoring and management during morning and evening peak hours: Given the observed differences in community structures during these periods, transportation authorities should focus on monitoring and managing traffic flow, especially in areas with concentrated commuting trips, to allocate traffic resources more efficiently and alleviate congestion. Optimize transportation planning and bike-sharing deployment strategies: Utilizing the outcomes of community detection, transportation authorities can strategically adjust the deployment and planning of bike-sharing services. In contrast to conventional dispatching strategies based solely on the usage volume at distinct locations, our research primarily emphasizes the provision of a universal framework for the analysis and scheduling of bike-sharing trips. This approach offers macro-level guidance for bike-sharing dispatching, which can be applicable to other urban core areas.
For bike-sharing companies: Increase the availability of bikes during morning and evening peak hours: In response to the unique travel patterns observed during these periods, bike-sharing companies can increase bike availability to cater to the commuting demand, thereby improving bike utilization rates. Enhance services in social and leisure areas during evening hours: As the research indicates a diversified travel pattern during evenings, bike-sharing companies can augment bike services, particularly in social and leisure areas, to fulfill the varied travel demands of residents during nighttime.
For city residents: Make informed choices for travel modes: Considering the suitability of bike-sharing for short-distance travel during morning and evening peak hours, city residents can prioritize bike-sharing for short trips to avoid traffic congestion. Explore diverse travel destinations: With a diverse range of travel destinations observed during evening hours, residents can choose travel destinations based on their preferences and needs, enjoying the rich nightlife and recreational activities in the city.
Overall recommendations: By formulating reasonable transportation planning and bike-sharing deployment strategies based on research results, urban transportation authorities can optimize traffic flow and resource utilization. Meanwhile, bike-sharing companies can offer more flexible and customized services according to different time periods and community characteristics, catering to the diverse travel needs of residents. City residents should make informed choices for travel modes and actively participate in and enjoy the diverse transportation and leisure activities in the city.
6. Conclusions
This study adopts streets as the research unit and builds a spatial interaction network for shared bicycles in the core area of the capital city. The research employs a random walk community detection method based on weighted modularity to explore and analyze the community structures within the urban area. Modularity values are utilized to assess the quality of community detection, thereby evaluating the regional community characteristics. The community detection results are further employed for street clustering analysis, facilitating the exploration of travel patterns. The experimental results indicate that the morning period’s spatial interaction network exhibits stronger community structures, consisting of two large communities with higher street aggregation. Residents’ travel during this period is predominantly for commuting purposes, showing a higher level of purposefulness. In contrast, the evening period comprises a single large community, with most streets interacting with each other in pairs, suggesting a broader range of travel purposes for residents compared to the morning period. Both time periods demonstrate characteristics of long interaction radii and wide interaction scopes.
The findings of this study provide decision-making assistance to relevant authorities. During the morning period, shared bicycle operators can strategically deploy bicycles to streets near locations where interactions between streets within the same community are likely to occur. In the evening period, due to the extensive usage of shared bicycles, transportation management departments should focus on regulating their usage to avoid traffic issues caused by overcrowding.
For future work, several research directions are suggested: expanding the representation of urban network nodes by including more representative urban areas, such as urban transportation hubs; exploring various community detection methods and investigating their impacts on community detection results; and enriching the types of travel data to enhance the universality of research on urban population travel patterns. Furthermore, in the theoretical methods section, further research and expansion are needed. More community detection methods can be integrated with evaluation methods to adapt to a wider range of application scenarios.


